Page i ADDIS ABABA INSTITUTE OF TECHNOLOGY (AAiT) SCHOOL OF GRADUATE STUDIES DEPARTMENT OF CHEMICAL ENGINEERING FOOD ENGINEERING STREAM Effect of Processing on Physicochemical and Antinutritional Factors of “Anchote”(Coccinia Abyssinica) and Development of Value Added Biscuit A Thesis Submitted to the School of Graduate Studies of Addis Ababa University, Institute of Technology, in Partial Fulfillment of the Requirements for the Degree of Masters of Science in Chemical Engineering (Food Engineering) By Habtamu Shebabaw Advisor Professor Yogesh Kumar Jha (PhD) Addis Ababa, Ethiopia February, 2013

Welcome message from author
This document is posted to help you gain knowledge. Please leave a comment to let me know what you think about it! Share it to your friends and learn new things together.
Transcript

Page i
ADDIS ABABA INSTITUTE OF TECHNOLOGY (AAiT)
SCHOOL OF GRADUATE STUDIES
DEPARTMENT OF CHEMICAL ENGINEERING
FOOD ENGINEERING STREAM
Effect of Processing on Physicochemical and Antinutritional
Factors of “Anchote”(Coccinia Abyssinica) and Development of
Value Added Biscuit
A Thesis Submitted to the School of Graduate Studies of Addis Ababa
University, Institute of Technology, in Partial Fulfillment of the
Requirements for the Degree of Masters of Science in Chemical
Engineering (Food Engineering)
By
Habtamu Shebabaw
Advisor
Professor Yogesh Kumar Jha (PhD)
Addis Ababa, Ethiopia
February, 2013

Page ii
ADDIS ABABA INSTITUTE OF TECHNOLOGY (AAIT)
SCHOOL OF GRADUATE STUDIES
SCHOOL OF CHEMICAL AND BIO - ENGINEERING
Effect of Processing on Physicochemical and Antinutritional
Factors of “Anchote” and Development of Value Added Biscuit
A Thesis Submitted to the School of Graduate Studies of Addis Ababa
Institute of Technology, in Partial Fulfillment of the Requirements for the
Degree of Master of Science in Chemical Engineering
(Food Engineering Stream)
By:
Habtamu Shebabaw Kassa
Approved by the Examining Board: Signatures
Dr. Ing Berhanu_Assefa (Assoc. Professor) __________________
Chairman, Department’s Graduate Committee
Professor Yogesh Kumar Jha (PhD) __________________
Advisor
Dr. Beteley Tekola(Assit. Proffesor ) _________________
External Examiner
Dr. Eng Shimelis Admassu (Assoc. Professor) __________________
Internal Examiner

Page iii
Acknowledgements
All praises and thanks for ALMIGHTY GOD who is the entire source of all knowledge
and wisdom endowed to mankind.
I would like to express my deepest gratitude and thanks to my advisor, Prof. Dr Yogesh
Kumar Jha for the support and guidance in the manuscript writing as well as for his
encouragement, advice, and concrete support during conducting this thesis work.
I express my heartfelt gratitude to Dr. Eng. Shimelis Admassu (Assoc. Prof.) for his
suggestions, advice and being like a father to me since starting from at the time of
learning; during thesis title selection and for his motivation and support to successfully
finish this thesis paper.
I owe my genuine thanks to Ato Desta Fekadu, who support me in providing
information and materials regarding to my thesis work.
I also extend my profound gratitude to Addis Ababa University Institute of Technology
chemical engineering department for providing facilities and research fund to conduct
this research. I am also very thankful to the technical staffs of chemical engineering
department laboratories, especially, W/ro Azeb Tebebu, W/ro Tiringo Tadesse and Yosan
Teshome for providing all the necessary laboratory facilities needed for my analysis.
I would also thank the quality control and Research Service staffs of Kaliti Food Share
Company, for their valuable support in carrying out the tests as well as their advice and
comments. Also thanks to People at the Ethiopian Health and Nutrition Research Institute
(EHNRI), Jije Laboglass plc for helping in my analysis work
Lastly, I would like to thank my parents and my friends whose love, patience, and
encouragement made my present accomplishment.

Page iv
Table of contents Title Pages
Title page…………………………………...…………………………………………………...…i
Acknowledgements ................................................................................................................ iii
Table of contents ..................................................................................................................... iv
List of Figures…...…………………………………………………...………..…………vi
List of Tables…...……………………………………………………...………………..vii
List of Abbreviations ............................................................................................................... ix
List of Appendices……………………………………………….………………….……ix
Abstract .................................................................................................................................... xi
CHAPTER ONE - INTRODUCTION ................................................................................ 1
1.1 Background ............................................................................................................... 1
1.2 Statement of the problem .......................................................................................... 2
1.3 Objectives .................................................................................................................. 3
1.4 Significance of the study ........................................................................................... 4
CHAPTER TWO - LITERATURE REVIEW .................................................................. 5
2.1 Origin and Distribution of anchote............................................................................ 5
2.2 Ecology and agriculture of anchote ........................................................................... 5
2.3 Importance of anchote ............................................................................................... 7
2.4 Traditional processing of anchote ........................................................................... 10
2.4.1 Traditional ways of serving anchote…………………………………….…….12
2.5 Antinutritional factors ............................................................................................. 13
2.5.1 Antinutritional effects of phytate ...................................................................... 13
2.5.2 Antinutritional effects of tannins ...................................................................... 14
2.5.3 Antinutritional effects of oxalate ...................................................................... 15
2.5.4 Antinutritional effects of cyanide ..................................................................... 16

Page v
2.6 Physicochemical and functional properties ............................................................. 17
2.6.1 Physicochemical properties .............................................................................. 17
2.6.2 Functional properties ........................................................................................ 18
2.7 Processing methods as a means of reducing antinutritional factors ........................ 20
2.7.1 Boiling and roasting.......................................................................................... 20
2.7.2 Fermentation ..................................................................................................... 20
CHAPTER THREE - MATERIALS AND METHODS ................................................... 23
3.1 Materials .................................................................................................................. 23
3.2 Framework of the experiment ................................................................................. 24
3.3 Processing methods ................................................................................................. 25
3.3.1 Flour preparation from raw, boiled, roasted and fermented anchote tubers ..... 25
3.3.2 Blend formulation ............................................................................................. 28
3.3.3 Processing method of biscuit made from anchote-wheat composite flour ....... 29
3.4 Analysis methods .................................................................................................... 30
3.4.1 Proximate and mineral analysis ........................................................................ 30
3.4.2 Physicochemical properties analysis ................................................................ 35
3.4.3 Functional properties analysis .......................................................................... 36
3.4.4 Antinutritional factor analysis .......................................................................... 38
3.4.5 Sensory value analysis ...................................................................................... 41
3.5 Experimental design and statistical analysis of data ............................................... 41
3.6 Techno-economic feasibility analysis………………………...…………………..41
CHAPTER FOUR - RESULTS AND DISCUSSIONS ................................................ 43
4.1 Proximate and mineral composition of anchote flour ............................................. 43
4.2 Antinutritional factors of anchote flour ................................................................... 52
4.2.1 Phytate .............................................................................................................. 52

Page vi
4.2.2 Tannin ............................................................................................................... 53
4.2.3 Oxalate .............................................................................................................. 54
4.2.4 Cyanide ............................................................................................................. 55
4.3 Physicochemical properties of anchote flour .......................................................... 56
4.4 Functional properties of anchote flour .................................................................... 59
4.5 Proximate and mineral compositions of anchote- wheat based biscuit ................... 65
4.6 Sensory qualities of anchote-wheat biscuit ............................................................. 67
CHAPTER FIVE - SUGGESTED TECHNOLOGY FOR BISCUIT PRODUCTION …… 70
5.1 Biscuit-making procedure ....................................................................................... 70
5.2Material and energy balance .................................................................................... 71
5.2.1 Material balance to prepare anchote flour ........................................................ 71
5.2.2 Material balance for anchote-wheat biscuit preparation ................................... 72
5.2.3 Energy balance during biscuit baking process ................................................. 75
5.3 Economic analysis of the study ....................................................................... 77
5.4 Equipment layout of biscuit producing plant .......................................................... 86
CHAPTER SIX - CONCLUSIONS AND RECOMMENDATIONS ........................... 87
6.1 Conclusions ............................................................................................................. 87
6.2 Recommendations ................................................................................................... 88
REFERENCE ........................................................................................................................ 90
APPENDICES ....................................................................................................................... 99

Page vii
List of Figures
Figure No. Title
Pages
Figure 2.1. Boiled anchote tubers (after peeling) 12
Figure 3.1 Anchote flour from raw anchote tuber 25
Figure 3.2 Anchote flour from boiled anchote tuber 26
Figure 3.3 Anchote flour from roasted anchote tuber 27
Figure 3.4 Anchote flour from fermented anchote tuber 28
Figure 3.5
Figure 4.1
Flow diagram for biscuit production
Samples of raw anchote tuber
30
43
Figure 4.2 Biscuit made from anchote-wheat composite flour 69
Figure 5.1 Equipment layout of biscuit producing plant
86

Page viii
List of Tables
Table No. Title Pages
Table 2.1
Table 2.2
Comparison of the main composition of anchote and some root
crops commonly grown in southern and southwestern parts of
Ethiopia
Nutritional and anti-nutritional composition of raw and
processed anchote tubers
9
11
Table 4.1 Proximate compositions of raw and processed anchote flour 49
Table 4.2 Mineral compositions of raw and processed anchote flour 52
Table 4.3 Antinutritional factors of raw and processed anchote flour 56
Table 4.4 Physicochemical properties of raw and processed anchote flour 58
Table 4.5 Functional properties raw and processed anchote flour 64
Table 4.6 Proximate composition of biscuit recipe 65
Table 4.7 Proximate composition of anchote- wheat based biscuit 66
Table 4.8 Mineral compositions of anchote-wheat based biscuits 67
Table 4.9 Sensory characteristics of anchote- wheat based biscuits 69
Table 5.1 Major equipments delivered purchasing cost 78
Table 5.2 Human resource requirement 79
Table 5.3 Cost of raw materials 80
Table 5.4 Cost of utilities 81
Table 5.5 Estimation of direct and indirect cost 82
Table 5.6 Estimation of total product cost 83

Page ix
List of Abbreviations
Amh. Amharic
ANOVA Analysis Of Variance
AOAC Association of Analytical Chemists
AWB1 10% Anchote-wheat biscuit
AWB2 20% Anchote-wheat Biscuit
AWB3 30% Anchote-wheat Biscuit
AWF
BP
Anchote Wheat Flour blend
Blend proportion
BD Bulk Density
CHO Carbohydrate
EHNRI Ethiopian Health and Nutrition Research
Institute
FAO Food and Agricultural Organization
FC Foam Capacity
FCI Fixed Capital Investment
MC Moisture Content
OAC Oil Absorption Capacity
Oro. Oromiffa
TEC Total Equipment Cost
TDC Total Direct Cost
TPC Total Product Cost
SP Swelling Power
TTA Titratable Acidity
WAC Water Absorption Capacity
WB Wheat Biscuit
wwb Wet weight basis

Page x
List of Appendices
Appendix No. Title Pages
Appendix-I Photo of anchote processing and laboratory equipments used 99
Appendix-II The value of cost indexes (n) for different equipments 101
Appendix-III
Appendix-IV
Factors with separation of materials and labor
Samples of analysis results from Jije Laboglass plc and
EHNRI
102

Page xi
Abstract
The effect of boiling, roasting and natural fermentation on anchote flour samples
collected from Nekemte and Dembidollo regions of western Ethiopia were studied for
their effects on proximate composition, antinutritional factors, physicochemical and
functional properties. The moisture content of samples was 6.36% for Nekemte sample
and 6.60% for Dembidollo sample for raw flour samples. Based on dry weight basis, the
ash, fat, protein, crude fibre and total carbohydrate were 3.96, 1.15, 7.28, 3.94, and
77.31%, respectively for the raw sample of Nekmte and 4.67, 0.88, 5.17, 4.73, 77.95% for
the raw sample of Dembidollo. The energy values were 348.71and 340.40Kcal/100g for
Nekemte and Dembidollo samples, respectively. Among antinutritional factors analyzed,
the level of phytate, tannin, oxalate and cyanide, were 20.65, 50.19, 6.56 and
5.32mg/100g in raw Nekemte sample and 33.06, 56.34, 7.32 and 6.06mg/100g in raw
Dembidollo flour samples, respectively. Significant difference (P<0.05) was observed in
level of all the antinutrients of the two samples. A reduction of 29.5, 56.6, 35.8 and
17.50% in the level of phytate, tannin, oxalate and cyanide was achieved by boiling
process, respectively. Fermentation reduced about 54.8, 72.4, 62.6 and 47.7%, in the
level of phytate, tannin oxalate and cyanide in Nekemte sample. Phytate, tannin, oxalate
and cyanide were reduced by 32.8, 52.5, 43.6 and 30.4% by boiling and 65.4, 71.1, 63.5
and 50.3% reduction was achieved by fermentation for Dembidollo sample. Natural
fermentation has resulted in significant reduction in all types of antinutrients. Nekemte
sample is preferred where it contains lowest levels of antinutritional factors compared to
Dembidollo sample. The possibility of using anchote flour for the production of biscuit by
blending with wheat flour was also investigated. Fermented anchote and wheat flour
were blended using 10, 20 and 30% proportion. The proximate composition and mineral
composition of biscuit were evaluated. Sensory qualities of biscuit were evaluated in
terms of color, flavor, crispiness and overall acceptability. The biscuits made from wheat
flour supplemented with 10% fermented anchote flour rated at par to control biscuits
with respect to sensory characteristics without significant difference and also improved
nutritional profile of mineral and crude fiber content significantly.
Key words: Anchote, Fermentation, Boiling, Roasting, Effect of processing, Antinutritional
factors, Physicochemical properties, Functional properties, Composite biscuit

Page 1
CHAPTER ONE
INTRODUCTION
1.1 Background
Many of the developing world’s poorest producers and most undernourished households
depend on root and tuber as a contributing, if not principal, source of food and nutrition.
In part, these farm households value root and tuber, because root and tuber produce large
quantities of dietary energy and have stable yields under conditions in which other crops
may fail root and tubers produce remarkable quantities of energy per day, even in
comparison to cereals. Potatoes lead the way in energy production, followed by yam. In
addition, some root and tuber are an important source of vitamins, minerals, and essential
amino acids such as lysine (Scott, et al., 2000). Yared (2007) pointed out that, root and
tuber crops play multi-purpose roles in the global food system as a starch supplier, food
security crop, source of cash income, raw material for feed and processed products, and
as key components in small-scale agro-enterprise development.
Anchote, Coccinia Abyssinica, is an endemic root crop which has been widely grown
throughout the south and southwestern parts of Ethiopia for centuries and belongs the
family Cucurbitaceae family (Abera, 1995).The name ‘anchote’ is derived from
Oromiffa, a native language spoken by the Oromo nationalities in Ethiopia, and refers to
the edible tuber of the cultivated races of Coccinia Abyssinica. It is also known by
different vernacular names at different places and tribe such as ‘ushushe’ in Walaita,
‘shushe’ in Dawero and ‘ajo’ in Kaffa (Amsalu et al., 2008). However, its cultivation as a
root crop is common in Wollega, Iluababor, Jimma, Kaffa, and Sidama (Amare, 1973).
Nutritionally, anchote is a good source of minerals and fiber content. Its protein content is
also by far greater than other root crops, although, root crops are known for their low
protein content. It is rich source of calcium, which is an important constituent of our
bones and teeth. Anchote is also an ample source of potassium and iron. So it can
contribute to the food security in the country (Habtamu, 2011). Anchote root crop not
only have beneficial nutrients, but also contains traces of antinutritional factors, which

Page 2
may have adverse effects on health like Phytate, tannin, oxalate and cyanide ( Habtamu,
2011).
Now a day’s industrialization is growing at a much faster rate and among this, food
processing industries cover most of the percentages. Therefore utilization of different raw
materials, which are locally available, at a processing scale is necessary. Among this are
different root crops cover lower parts in the food sector. These root crops include
anchote, potato, carrot, beat root, sweet potato, yam, garlic, and others. The utilization of
the tubers of anchote plant is also categorized under this group. Anchote flour contains
higher amount of minerals and crude fiber than wheat flour (Habtamu Fekadu, 20011).
Biscuit produced from blend of anchote and wheat may have good potential for a number
of reasons. It will increase the consumption of anchote and encourage farmers; the
products will be a more acceptable healthy alternative since it enriches the products by
dietary fiber and minerals. Fibers exhibit beneficial physiological effects to human body,
as they stimulate and accelerate intestinal contraction and transit (Ahmed et al, 2010).
1.2 Statement of the problem
One major limiting factor in the utilization of root crops is the presence of antinutritional
factors, which may have adverse effect on health through inhibition of digestion,
absorption, and growth. Root crops, in common with most plants, contain small amounts
of potential toxins and antinutritional factors (FAO, 1990). Taro contains large amount of
Phytate (855mg/100g) (FAO, 1990). Marfo and Oke (1988) have shown that cassava,
cocoyam and yam contain 624 mg, 855 mg and 637 mg of phytate per 100 g respectively.
Abdulrashid and Agwunobi (2009) reported oxalates, phytates and tannins are the anti-
nutritional factors found in taro The high content of calcium oxalate crystals, about 780
mg per 100 g in some species of cocoyam, Colocasia and Xanthosoma, has been
implicated in the acridity or irritation caused by cocoyam (Oke, 1967). Phytate reduces
protein and mineral bioavailability (Khare, 2000). Tannins reduce protein digestibility
and adversely influencing the bioavailability of non-haem iron leading to poor iron and
calcium absorption (Adeparusi, 2001). Oxalic acid forms water soluble salts with Na+,
K+, and NH4+ ions. It also binds with Ca2+, Fe2+ and Mg2+ rendering these minerals
unavailable to animals (Noonan & Savage, 1999). Understanding the level of
Page 3
antinutritional factors in anchote and processing methods that are effective in reducing
these factors may significantly contribute in reducing health risk that are associated with
consumption of anchote.
As described by Elevina E. Perez Sira, (2000), before consideration is given to tubers as
potential sources of flour and starch to produce foods, it is necessary to characterize their
chemical composition, physical, physicochemical and functional properties.
Understanding the physicochemical and functional properties of flours from the raw and
processed anchote may help us in utilization of anchote flour with other flours and the
development of value added products from anchote.
Although the anchote is familiar to the farmers in the region, a full understanding of the
economic, ecological and nutritional advantages is lacking in many parts of the region.
The production of anchote flour is not practiced. Replacement of part of wheat flour with
non-wheat ingredients for the production of cookies and baked products had been
reported by various researchers (Sammy et al., 1970). Nip et al. (1994) have reported that
taro flour can be used to partially replace regular wheat flour for cookie manufacturing.
Anchote is under-utilized endemic crop. The development of value-added products from
anchote flour is unknown, but may have good potential for a number of reasons. It could
increase opportunities to expand the utilization of anchote and could help improve the
economy of various anchote-producing areas. Considering the nutritional status of
anchote that is more than twice of the protein, ash and dietary fiber content of root crops
and containing high amounts of calcium, potassium and iron (Habtamu and Kelbessa,
1997; Habtamu Fekadu, 2011), blending anchote flour in biscuit formulation with wheat
flour could also be very beneficial.
1.3 Objectives
� General objective
The general objective of the research was to study the effects of various methods of
processing on nutritional compositions, anti-nutritional factors, physicochemical and
functional properties of anchote flour and to develop anchote-wheat based biscuit.

Page 4
� Specific Objectives
The specific objectives of this research were
1. Analysis of proximate composition, antinutritional factors, physicochemical and
functional properties of raw and processed anchote flour samples
2. Compare the proximate composition, antinutritional factors, physicochemical and
functional properties of anchote flour samples collected from two different
regions of Ethiopia
3. Evaluate the effect of processing methods (boiling, roasting and natural
fermentation) on proximate composition, antinutritional factors, physicochemical
and functional properties
4. Proximate composition analysis and sensory evaluation of anchote-wheat based
biscuit
5. To evaluate techno-economic feasibility of anchote-wheat based biscuit
1.4 Significance of the study
Generally the study will result the following benefits
• Provide information about the effect of processing on physicochemical
composition, functional properties and antinutritional factors of anchote
• They can also provide income opportunities for local communities involved in
agricultural practices of the crops and diversify farmers’ incomes as well
• Blend formulation with other cereals
• Resource utilization maximization
• Value addition
• Add variety to the agro-processing industry
• Researchers, government and other organization may use the outcome of this
research as a reference materials

Page 5
CHAPTER TWO
LITERATURE REVIEW
2.1 Origin and Distribution of anchote
Anchote (Coccinia Abyssinica) belongs to the family Cucurbitaceae. Endashaw Bekele
(2007) reported that there are ten species of the genus in the country. Of these, Coccinia
Abyssinica is the only species grown for its edible tuberous roots. It is an annual trailing
herbaceous vine whose young shoots and tuberous roots are processed and used as
vegetables and root crops, respectively (Abera Hora, 1995; Endashaw Bekele, 2007;
Habtamu Fekadu, 2011).
Edwards (1991) indicated that anchote is found in many parts of the country, including
the western, southeastern and northern parts. But, anchote is cultivated as a root crop only
in the west, southwest and southern regions of the country (Amare, 1973). It is also
reported that the crop is grown and much liked in all parts of Wallagga, lllubabor, Jimrna,
Kafa and Sidamo (Amare 1973). Abera Hora (1995) also pointed out the presence of
anchote in the Southern Nations, Nationalities and Peoples’ and Abera, also indicated that
the regions have their own local name for anchote. Zemede Asfaw (1997) also gave a
sign on the presence of Anchote in northern parts of Ethiopia (Gonder, Gojam) and Bale
though he didn’t clarify as to what role anchote has and whether it is cultivated or wild in
those areas. There are also some literatures indicating the presence of anchote relatives,
whose fruits are consumed, in Kenya, e.g. Coccinia grandis and Coccinia triloba
(Maundu, 1999). Generally speaking, many authors agreed that the center of origin and
diversity for anchote seems to be the western and southwestern areas of Ethiopia.
2.2 Ecology and agriculture of anchote
The crop seems to have a wider ecological adaptation as it grows well in ‘Qolla’,
‘Weinadega’ and ‘Dega’ (Amh.), the traditional agro-ecological zones of Ethiopia based
on relative altitudinal ranges; 500-1500 m, 1500-2300 m and 2300-3200 m above sea
level, respectively (Zemede Asfaw, 1997). But, there is almost no research information
on the ecological adaptation of the crop. In the growing regions, very fertile soils in
homestead areas are used for anchote cultivation. The information on other soil types is

Page 6
lacking. According to Abera Hora (1995), southwestern parts of Ethiopia with oxisol,
ultisol and vertisol soil types, altitudinal range of 1500-2400 m.a.s.l, receiving an annual
rain fall of about 1500 mm to over 2000 mm might be suitable for anchote. But, on the
contrary, he also found anchote growing in areas outside the indicated ecological limits.
According to Holstein and Norbert (2011), Coccinia species can grow on lateritic soils
(i.e. red tropical soils), and are distributed in semi-arid, wood-lands and forest habitats of
Sub-Saharan Africa.
Tubers vary in shape depending on environmental conditions, but generally spherical or
elongated at maturity. Almost all activities associated to anchote culture are done by
women (Abera Hora, 1995; Endashaw Bekele, 2007). Land preparation, sowing,
weeding, staking, harvesting, processing, storing and marketing are mainly accomplished
by women, and usually, home gardens are used for anchote growing. Pests such as
porcupines, wild pigs, and wart hogs hunt anchote tubers. The vicinity of anchote plots to
home area helps family members and guarding dogs in protection. Parasites of fungal,
bacterial, viral, and/or nematode origin and insect pests may also attack the aerial and/or
underground parts of the plant.
Anchote can be propagated both vegetatively and by seeds. In the vegetative propagation,
high quality tubers that might have been obtained from market or any other source, can
be planted and used as seed sources during the next growing season. Some tubers may
also be left in soil for regrowth as ‘guboo’ (Oro.) for the coming season (Abera Hora,
1995; Habtamu Fufa and Kelbessa Urga, 1997; Endashaw Bekele, 2007). But, the
commonest way of anchote propagation is via seeds. Mature red/yellow fruits are
collected and seeds extracted. The seeds are stored in safe area and used during the
coming season. Sowing is by broadcasting, although sowing in line may increase tuber
quality (Abera Hora, 1995). Staking may be essential to increase fruit number, and
thereby seed production. Fencing may also be important to protect the aerial parts of
anchote from devastation by domestic animals such as sheep, goats, donkeys, and the
like.
Page 7
2.3 Importance of anchote
Anchote is endemic root crop of Ethiopia and it is a unique root crop in its uses and the
parts consumed. All the three harvestable parts of anchote (i.e. seeds, shoot tips and
tubers) are marketable even though the root is the most economic concern in most
growing areas of Ethiopia. The consumable parts: root, leaf, and fruit are rich in protein,
calcium, iron, and potassium. Few analyses made on the food content of anchote show
that anchote is best in protein, utilizable carbohydrate, iron and calcium content as
compared to some root crops grown in anchote growing areas and fourth after enset,
sugar beet and potato in energy content, (Table 2.1). The crop has been contributing
much to the diet of the rural societies in its growing areas since its domestication (Amare
Getahun, 1976). As its protein, calcium, iron and carbohydrate contents are better than
other root crops, it could be an excellent source of macro- and micronutrients. But, its
agriculture needs to be modernized and scaled up. As native biological resources are
adapted to local conditions, due attention should be given to such crops (Legesse Negash,
2010). Traditional indigenous crops have the potential to diversify and expand the diet of
the local societies in particular, and the world, in general (Habtamu Fekadu, 2011).
In addition to its nutritional importance, anchote is a cultural and medicinal crop widely
used in growing areas (Amare Getahun, 1976). Anchote is a local dish highly
recommended for individuals suffering from bone fractures and displaced joints. The
belief that anchote has a repairing effect is knowledge gained by the Oromo elders from
years of practical experience. More than its other uses, anchote is getting popular because
of its medicinal value even with the non-Oromos (Abera Hora, 1995). The high medicinal
value of the anchote tuber seems to be because of its high calcium as compared to other
common and widespread root and tuber crops (Abera Hora, 1995). Possibly its calcium
content is important in repairing damaged bones. Juice prepared from roots of anchote
has been used in Ethiopian traditional medicine. Spiced and flavored anchote paste is
recommended for people suffering from bone fracture and displaced joints (Amare
Getahun, 1976; Habtamu Fufa and Kelbesa Urga, 1997; Endashaw Bekele, 2007).
According to Abera (1995), juice of anchote root is used to treat cancer, tuberculosis,
skin eruptions and gonorrhea by traditional medicine practitioners of Ethiopia.

Page 8
Anchote has a special place in the traditions and customs of the Oromo people in the
anchote growing areas. According to Abera Hora (1995), the inclusion of anchote in
dishes served at ritual ceremonies is prestigious. Anchote dishes in different forms are
usually served in special occasions such as the ‘masqal’ celebration in September,
weddings, marriage ties (betrothals), circumcision, birth days and thanks giving days at
the start of a New Year, or harvest time. During such occasions and/or at times of
physical injuries, a neighbor that has no anchote for that season may get a present of
anchote tubers from those who have it. This is done to share their happiness and
strengthen social relationships. So, anchote has considerable social importance in the
anchote growing societies.

Page 9
Table 2.1 Comparison of the main composition of anchote and some root crops
commonly grown in southern and southwestern parts of Ethiopia (per 100g edible portion
based on wet weight basis)
Source: Agren and Gibson (1968), Bradbury and Holloway (1988) cited in Abera Hora (1995), Teshome
Alemayehu and Muluneh Girma (2005) and Habtamu Fekadu (2011). NF= not found
Factors Anchote
(Coccinia
abyssinica)
Sweet potato
(Ipomoea
batatas)
Potato
(Solanum
tuberosum)
Oromo
potato
(Plectranth
us edulis)
Enset
(Ensete
ventricos
um)
Cassava
(Manihot
esculenta)
Major contents(g)
Moisture 74.93 67.40 74.7 81.2 48.7 62.8
Crude protein 3.25 1.30 1.6 1.5 0.6 0.53
Utilizable
carbohydrate
16.86 28.20 22.6 16 49 31.0
Crude fat 0.19 2.0 0.1 0.2 0.3 0.17
Total ash 2.19 1.10 0.6 1.1 0.9 0.84
Crude fiber 2.58 1.10 0.4 0.7 1.2 1.48
Gross energy
(Kcal)
82.12 136.00 97.0 71 200 NF
Minerals & cyanide(mg)
Ca 119.5 52.00 10.0 29 82 20
Fe 5.49 3.40 6.7 9.3 3.7 0.23
P 34.61 34.0 40 90 36 46
Mg 79.73 NF NF NF NF 30
Zn 2.23 NF NF NF NF NF
Cyanide 12.67 NF NF NF NF NF
Page 10
2.4 Traditional processing of anchote
Aerial parts and fibrous roots are removed from the tubers. After thorough washing, they
are boiled in a clay pot called ‘xuwwee’ (Oro.). To achieve rapid cooking, the pot is
covered by leaves of enset, maize, sorghum, or pumpkin. Final sealing may be by a lid or
cow dung. This arrangement minimizes heat loss. The well-boiled tubers are then, cooled,
peeled and processed in different ways. Anchote tubers are, most of the time, consumed
boiled (Abera, 1995).
Habtamu Fekadu (2011) mentioned the consumption of raw anchote, but this is
uncommon. Boiling decreases both nutritional and anti-nutritional (substances that
interfere with food utilization and affect health in animals including humans) contents of
foods by leaching and/or decomposition (FAO, 1990; Makkar, 1993). But, boiling makes
most foods palatable, increases digestibility and bioavailability of some nutrients,
inactivates some anti-nutritionals and enzyme inhibitors, and increases consumer
preferences (FAO, 1990; Habtamu Fekadu, 2011). Except for moisture, crude fiber and
iron, all contents were seen reduced after boiling. But, boiling after peeling caused more
reduction in both nutritional and anti-nutritional contents (Table 2.2). Reduction in the
anti-nutritionals such as phytate, oxalate, tannin and cyanide is desirable. Loss of the
nutritions is disadvantageous. So, boiling before peeling is recommended for anchote as
this minimizes the nutritional losses and unnecessary moisture gain. Dish preference may
also depend on processing. According to Habtamu Fekadu (2011), 66% of anchote
consumers given, at a time, both ‘boiled-after-peeling’ and ‘boiled-before-peeling’
anchote dishes, have preferred dishes from ‘boiled-before-peeling’ anchote tubers.

Page 11
Table 2.2 Nutritional and anti-nutritional composition of raw and processed anchote
tubers (based on wet weight basis of the sample)
(Source: Habtamu Fekadu, 2011)
Contents Raw Boiled-after peeling Boiled-before-peeling
Nutrients (g/100g)
Moisture 74.93 81.74 76.73
Crude protein 3.25 2.67 3.14
Total ash 2.19 1.33 1.99
Crude fiber 2.58 3.71 2.77
Crude fat 0.19 0.13 0.14
Utilizable carbohydrate 16.86 10.42 15.23
Gross
energy(Kcal/100g)
82.12 53.48 72.26
Minerals (mg/100g)
Ca 119.50 115.70 118.20
Fe 5.49 7.60 6.60
Mg 79.73 73.50 76.47
Zn 2.23 2.03 2.20
P 34.61 28.12 25.45
Antinutritional factors (mg/100g)
Phytate 389 333 334
Oxalate 8.23 4.23 4.66
Tannin 173.55 102.36 121.21
Cyanide 12.67 8.16 11.14

Page 12
2.4.1 Traditional ways of serving anchote
� Boiled anchote tubers served as chips/slices (‘Murmura ancootee’/Oro.)
The tuber is sliced longitudinally into several chips and served with ‘difo dabo’ (Amh.)
and ‘qocqocaa’ (Oro.), a paste of green or red pepper with pungent taste; also known as
‘daaxaa’ in southern Ethiopia. ‘Qocqocaa’ is flavored with a traditionally processed
butter ‘nitir qibe’ (Amh.) and other spices. Such chips are mainly served on special
occasions such as the ‘masqal’(Abera, 1995).
� Boiled anchote tubers as paste (‘Ancootee lanqaxxii’ /Oro.).
The boiled, peeled and washed tubers are chopped into smaller pieces and ground using
‘dhagaa daakuu’ (Oro.)/ ‘yej wofcho’ (Amh.) - Ethiopian traditional mill. The resulting
paste is flavored with processed butter and others, including salt (Abera, 1995). This is
then served with ‘injera’ or bread. This anchote dish is the form being served in small
and large hotels and restaurants in Addis Ababa and anchote growing areas. In Addis
Ababa, it is available in hotels/restaurants owned by businessmen of anchote growing
area origin, e.g. Hawi Hotel around ‘Global’.
� Boiled anchote tubers as stew (‘ittoo’/Oro.; ‘ wat’/Amh.)
Boiled tubers are peeled and chopped into pieces and made into a stew, alone or in
combination with legumes such as haricot beans, peas, or with meat. This is then salted,
flavored and served with ‘injera’ (Abera, 1995).
Figure 2.1. Boiled anchote tubers (after peeling) Source: Habtamu Fekadu (2011)

Page 13
� Toasted tubers (‘tibs’/ Amh.)
Slightly boiled/unboiled and peeled tubers are chopped up and toasted using oil and a
limited amount of water. This is then, served with other foods after adding the necessary
ingredients (Abera, 1995). In addition to the above major anchote dishes, Abera Hora
(1995) mentioned the following miscellaneous dishes.
� Miscellaneous anchote dishes
Baked anchote (‘dibaa ancootee’, Oro.) - few tubers are baked by placing them under
glowing fire or hearth. They are peeled, sliced vertically, and served alone or with other
food items.
Anchote soup (‘Mooqa ancootee’, Oro.) - unboiled tubers are peeled, chopped into
pieces, sun dried and ground/pounded. The flour is then, used to make anchote soup.
These last two anchote dishes are not widely known among the anchote growing
societies.
2.5 Antinutritional factors
Antinutritional factors have been defined as substances, which by themselves, or through
their metabolic products arising in living systems, interfere with food utilization and
affect the health and production of animals (Francis et al., 2001). Root crops, in common
with most plants, contain small amounts of potential toxins and antinutritional factors
(FAO, 1990). Phytate, tannin, oxalate and cyanide are common antinutritional factors,
which mostly occur in various root crops.
2.5.1 Antinutritional effects of phytate
Phytate is a salt form of phytic acid. Phytic acid acts as a strong chelator, forming protein
and mineral-phytic acid complexes; the net result being reduced protein and mineral
bioavailability (Khare, 2000). Phytic acid is reported to chelate metal ions such as
calcium, magnesium, zinc, copper, iron and molybdenum to form insoluble complexes
that are not readily absorbed from gastrointestinal tract. Phytic acid also inhibits the
action of gastrointestinal tyrosinase, trypsin, pepsin, lipase and amylase (Khare, 2000).

Page 14
The major concern about the presence of phytate in the diet is its negative effect on
mineral uptake. Especially zinc and iron deficiencies were reported as a consequence of
high phytate intake (Greiner et al., 2006). Phytic acid decreases the availability of zinc,
manganese, copper, molybdenum, calcium, magnesium, iron as well as protein (Beleia et
al., 1993). When bound to protein, it induces a decrease of solubility and functionality of
the protein. Phytate lowers the bioavailability of certain minerals through formation of
insoluble complexes at intestinal pH. Adane and Gullelat (2009) and Huang, et al.
(2007) reported phytate concentrations (115.43- 135.28mg/100g) for unprocessed taro
cultivars. For raw and processed cassava, Tilahun and Shimelis (2009) reported phytate
content of 543.97mg/100g to 168.24mg/100g. The phytate content of cassava flour
reported by (Edeogu and Ekuma, 2007), ranges from 253 to 400 mg/100g.
In average, the daily intake of phytate was estimated to be 2000–2600 mg for vegetarian
diets as well as diets of inhabitants of rural areas of developing countries and 150–1400
mg for mixed diets (Reddy NR, 2002). Hurrel, R. F et al. (1992) reported that phytic acid
intake of 4-9mg/100g is said to decrease iron absorption by 4-5 folds in humans.
2.5.2 Antinutritional effects of tannins
Tannins are water soluble phenolic compounds with a molecular weight greater than 500
daltons. They have the ability to precipitate proteins in aqueous solution (Kumar and
Horigome, 1986; D’Mello, 2000). Tannins are secondary compounds of various chemical
structures widely occurring in plant kingdom (Francis et al., 2001). They are defined as
high-molecular-weight polyphenolic compounds that have the ability to bind with protein
and preserve animal hides. Tannins are generally divided into hydrolysable (glucose
polyesters of Gallic or hexahydroxydiphenic acids) and condensed tannins
(proanthocyanidins) (Bender, 2006).
Tannins readily form indigestible complexes with proteins and other macro-molecules
under specific environmental conditions, up on this, they reduce protein digestibility and
adversely influencing the bioavailability of non-haem iron leading to poor iron and
calcium absorption, also carbohydrate is affected leading to reduced energy value of a
diet containing tannins (Adeparusi, 2001).

Page 15
Tannins also reduce the absorption of vitamin B12. Contrary to condensed tannins, the
hydrolysable tannins are easily degraded in biological systems, forming smaller
compounds that can enter the blood stream and over a period of time cause toxicity to the
organs (e.g., liver and kidney) (Francis et al., 2001).
Tannins may form a less digestive complex with dietary proteins and may bind and
inhibit the endogenous protein, such as digestive enzymes. Tannin-protein complexes
involve both hydrogen bonding and hydrophobic interactions. The precipitation of the
protein-tannin complex depends upon pH, ionic strength and molecular size of tannins.
Both the protein precipitation and incorporation of tannin phenolics into the precipitate
increase with increase in molecular size of tannins (Kumar and Horigome, 1986).
However, when the molecular weight exceeds 5,000 daltons, the tannins become
insoluble and lose their protein precipitating capacity and degree of polymerization
becomes imperative to assess the role of tannins in ruminant. Tannins have been found to
interfere with digestion by displaying anti-trypsin and anti-amylase activity. Helsper et
al. (1993) reported that condensed tannins were responsible for the testabloat trypsin
inhibitor activity of faba beans. Tannins also have the ability to complex with vitamin B.
Other adverse nutritional effects of tannins have been reported to include intestinal
damage, interference with iron absorption and the possibility of tannins producing a
carcinogenic effect (Butler, 1989). The total acceptable tannin daily intake for man is
560mg (Anonymous, 1973). Adane and Gulelat (2009) reported a tannin concentration in
a range of 47.69 - 59.92mg/100g and Akpan and Umoh (2004) obtained a tannin
concentration of 640mg/100g for raw samples of taro. Cassava also found to contain a
small amount of tannin vary from 3.6 to 6.9mg/100g (Oboh and Akindahunsi, 2003;
Oboh et al., 2002, Fasuyi, 2005).
2.5.3 Antinutritional effects of oxalate
Oxalic acid (or its salts) is widely distributed in the plant kingdom although its nutritional
significance is limited to relatively few plants and forages (Noonan and Savage, 1999).
Ingestion of foods containing oxalates has been reported to cause caustic effects,
irritation to the intestinal tract and absorptive poisoning. Oxalic acid forms water soluble
salts with Na+, K+ and NH4+ ions it also binds with Ca2+, Fe2+ and Mg2+ rendering these

Page 16
minerals unavailable to animals. However Zn2+ appears to be relatively unaffected. In
plants with a cell sap of approximately pH 2, such as some species of Oxalis and Rumex
oxalate exists as the acid oxalate (HC2O4), primarily as acid potassium oxalate. In plants
with a cell sap of approximately pH 6, such as some plants of goosefoot family it exists
as oxalate (C2O4)2- ion usually as soluble sodium oxalate and insoluble calcium and
magnesium oxalates. Calcium oxalate is insoluble at a neutral or alkaline pH, but freely
dissolves in acid (Noonan and Savage, 1999). The high content of calcium oxalate
crystals, about 780 mg per 100 g in some species of cocoyam, Colocasia and
Xanthosoma, has been implicated in the acridity or irritation caused by cocoyam (Oke,
1967). The acridity of high oxalate cultivars of cocoyam can be reduced by peeling,
grating, soaking and fermenting during processing (Oke, 1967). Cooking can affect the
soluble oxalate but not the insoluble oxalate content of the food. Boiling can reduce the
soluble oxalate content of a food if the cooking water is discarded, while soaking,
germination and fermentation will also reduce the content of soluble oxalates (Noonan &
Savage, 1999). The lethal level of oxalate in man is 3-5g as reported by Balogoplan C., et
al. (1998). Relatively high of oxalate content was reported by Adane and Shimelis (2009)
265.88mg/100g and 243.06mg/100g for raw taro samples of two different varieties.
2.5.4 Antinutritional effects of cyanide
Cyanides are organic or inorganic compounds which contains the C=N group (Health
Canada, 1991). Cyanide is toxic to a wide spectrum of organisms as a consequence of its
ability to form complex with metals (Fe2+, Mn2+ and Cu2+) that are functional groups of
many enzymes, inhibiting processes like the reduction of oxygen in the cytochrome
respiratory chain, electron transport in the photosynthesis and the activity of enzymes like
catalase, oxidase (McMahon et al., 1995). Hydrocyanic acid or HCN is a volatile
compound. It evaporates rapidly in water in the air at temperature over 280c and dissolves
readily in water. It may easily be lost during transport, storage and analysis of specimens
(FAO, 1990). The consumption of cyanide even at low levels over a long period can
induce iodine deficiency, leading to goiter (Sahore, et al., 2006). Hydrogen cyanide
inactivates the enzyme cytochrome oxidase in the mitochondria of cells by binding to the
Fe3+/Fe2+ contained in the enzyme. This causes a decrease in the utilization of oxygen in
the tissues. Cyanide causes an increase in blood glucose and lactic acid levels and a

Page 17
decrease in the ATP/ADP ratio indicating a shift from aerobic to anaerobic metabolism.
Cyanide activates glycogenolysis and shunts glucose to the pentose phosphate pathway
decreasing the rate of glycolysis and inhibiting the tricarboxylic acid cycle.
The main toxic principle which occurs in varying amounts in all parts of the cassava plant
is a chemical compound called linamarin (Nartey, 1981). It often coexists with its methyl
homologue called methyl-linamarin or lotaustralin. Linamarin is a cyanogenic glycoside
which is converted to toxic hydrocyanic acid or prussic acid when it comes into contact
with linamarase, an enzyme that is released when the cells of cassava roots are ruptured
(Nartey, 1981). Otherwise linamarin is a rather stable compound which is not changed by
boiling the cassava (Nartey, 1981). Some cultivars of taro also contain small quantity of
cyanide. It contains about 1-5% of cyanide content of cassava (Bradbury and Sylvia,
1995). Hydrogen cyanide will reduce the energy availability in all cells, but its effect will
be most immediate on the respiratory system and heart (Nartey, 1981). In 1991 FAO/
WHO recommended that HCN levels in mammals is 10mg/kg dry weight (10ppm.)
Lethal level of hydrogen cyanide is 36 mg/100 g (Oke, 1969).
2.6 Physicochemical and functional properties
2.6.1 Physicochemical properties
� pH of the flour
The acidity or alkalinity of a food is usually expressed as pH. It gives us information on;
to what extent a certain food sample is acidified. The pH of a food can dramatically alter
the growth of microbes in food and is a major determinant of the type of food
preservation process used for that food. Yeasts and molds usually grow best between pH
4 and 6 and bacteria usually grow best at pH near 7. In selecting a food preservation
process that makes a food shelf stable, the initial pH of that food must be considered to
minimize the likelihood of bacterial growth in that food (Mbofung, 2006).
� Titratable acidity
Titratible acidity measures the total amount of hydrogen ions available in the food and
expressed as mg lactic acid eq/g of the food sample. Titratible acidity is different than
total acidity, although at times both terms are used to mean the same thing. Total acidity

Page 18
is the total amount of organic acids in the food sample. The titratible acidity of any food
sample in the form of solution is an approximation of the solutions total acidity usually
measured by reacting the acids present in the food sample with a base such as sodium
hydroxide to the chosen end point close to neutrality, as indicated by an acid sensitive
colour indicator (John, 2007).
2.6.2 Functional properties
Functional properties are very important in determining the level of utilization in
ingredient formulation and new food product development (Fasasi, 2007). As described
by Elevina E. Perez Sira, (2000), before consideration is given to tubers as potential
sources of flour and starch to produce foods, it is necessary to characterize their chemical
composition, physical, physicochemical, and functional properties. The chemical
composition of flours and starches exhibits differences especially in amylose and
phosphorous content, as a function of the botanical origin. It is significant because of the
influence of amylose and phosphorous content in the functional properties of flours and
starches. It is a general consensus that the influence of both amylose and phosphorous
content affects the gelatinization and pasting behavior of starches and flours. These two
parameters determine the functional properties of flours and starches such as: texture,
consistency, binding, coating, adhesiveness, cohesiveness, thickening, viscosity, and
palatability (Sira, 2000).
� Water and oil absorption
The ability to absorb water is a very important property of flours used in food
preparation. The ability of food materials to absorb water is sometimes attributed to the
protein content (Mbfung, 2006). WAC is an important functional property required in
food formulations especially those involving dough handling (Udensi1, et al., 2008).
WAC plays a major role in the functionality of dough. In particular, WAC has been
shown to be related to dough consistency (Njintang, et al., 2008).
It is known that water binding by starches and flours is a function of several parameters
including size, shape, conformational characteristics, steric factors, hydrophilic-
hydrophobic balance in the starch molecule, lipids and carbohydrates associated with the
proteins, thermodynamic properties of the system (energy of bonding, interfacial tension,
Page 19
etc.), physicochemical environment (pH, ionic strength, vapor pressure, temperature,
presence/absence of surfactant etc.), solubility of starch molecules and others (Shimelis,
et al., 2006).
� Bulk density
Bulk density gives an indication of the relative volume of packaging material required.
Generally, higher bulk density is desirable for the greater ease of dispersibility and
reduction of paste thickness which is an important factor in convalescent child feeding
(Udensi, and Okoronkwo, 2006)
� Foam Capacity and Stability
Foaming property is very important to improve texture, consistency, and appearance of
food; such as baked and confectionary goods. Foam ability or foaming power (capacity)
corresponds to the ratio of gas volume to liquid volume in foams (Soetrisno, 2007).
Foaming, the capacity of proteins to build stable foams with gas by forming impervious
protein films, is an important property in some food applications, including beverages, as
well as angel and sponge cakes.Stable foams are known to occur when low surface
tension and high viscosity occur at the interface, forming a continuous cohesive film
around the air vacuoles in the foam. Soluble proteins in general play an important role in
the formation of foam and this probably justify why legumes exhibit higher foaming
capacity (Mbofung et al., 2006).
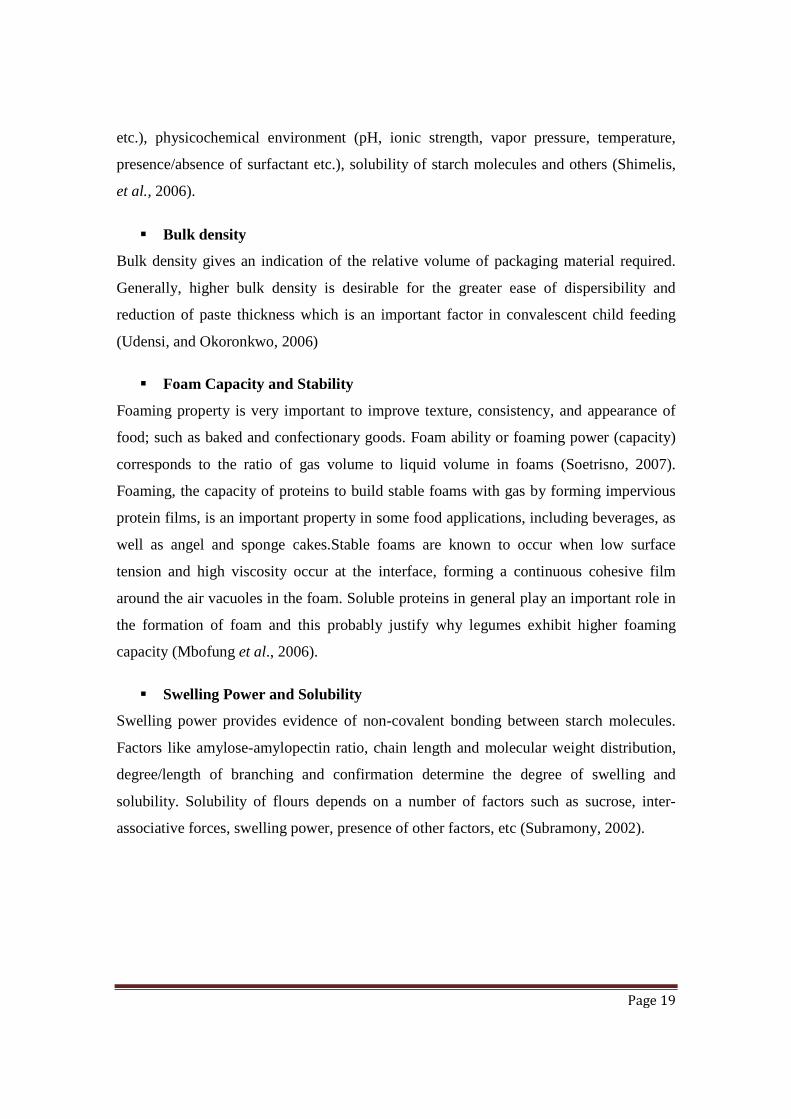
� Swelling Power and Solubility
Swelling power provides evidence of non-covalent bonding between starch molecules.
Factors like amylose-amylopectin ratio, chain length and molecular weight distribution,
degree/length of branching and confirmation determine the degree of swelling and
solubility. Solubility of flours depends on a number of factors such as sucrose, inter-
associative forces, swelling power, presence of other factors, etc (Subramony, 2002).

Page 20
2.7 Processing methods as a means of reducing antinutritional factors
Processing methods are critical when utilization of nutrients contained in anchote is
maximized and toxicity due to antinutritional is minimized. Different processing
technology or treatment conditions are reported to eliminate or minimize antinutrients in
root crops. However, more research is needed to evaluate the potential nutritional
advantages of the new crops on the basis of agronomic and morphological characteristics
as well as to determine acceptable threshold levels of each of antinutrients and to make
best use of their nutritional values. Reduction or inactivation of antinutritional factors
through process technology requires knowledge of the type, distribution, chemical
reactivity and thermal sensitivity of these factors within the seed matrix and complete
knowledge of process technologies.
2.7.1 Boiling and roasting
Boiling/cooking and roasting are important food processing methods. As a thermal
process, boiling/cooking could enhance the palatability and nutritional value by
inactivating endogenous toxic factors (Thomas, 1988). Roasting is similar to
cooking/boiling but involves higher temperature and reduced time. Boiling is effective
method in reducing water soluble antinutrients. For example boiling of root crops such as
taro and cassava will lead to significant reduction of oxalates and cyanide respectively
(Albihn and Savage, 2001). Boiling also found to decrease some amount of soluble
Phytate (Kawabata, 2006). Cooking methods for cassava can, if efficiently carried out,
reduce the cyanide content to non-toxic levels. Since boiling needs energy it is not
economical method as other processing methods such as natural fermentation for poor
rural community.
2.7.2 Fermentation
Fermentation also is a very interesting process used in plant foods to increase the
nutritional quality and remove undesirable compounds. Fermentation enhances the
nutrient content of foods through the biosynthesis of vitamins, essential amino acids and
proteins, by improving protein quality and fibre digestibility. It also enhances

Page 21
micronutrient bioavailability and aids in degrading antinutritional factors (Oboh, and
Elusiyan, 2007).
Over the centuries, fermentation has evolved and been refined and diversified. Today, a
variety of food products are derived from this technology in households, small-scale food
industries as well as in large enterprises. Furthermore, fermentation is an affordable food
preservation technology and of economic importance to developing countries. It enhances
the nutritional quality of foods and contributes to food safety particularly under
conditions where refrigeration or other foods processing facilities are not available
(Motarjemi, 2002).
Organic acids produced, such as acetic, lactic, citric, formic and butyric acids, during
fermentation potentiate zinc absorption by forming ligands with zinc. Microbial
fermentation enhances zinc bioavailability through hydrolysis induced by microbial
phytase enzymes Reduction of phytates in the diet could also favor enhanced absorption
of other minerals like calcium and iron (Sandberg and Andlid, 2002).
Fermentation reduces phytate content via the action of phytases that catalyze conversion
of phytate to inorganic orthophosphate and a series of myoinositols, lower phosphoric
esters of phytate (Sandberg and Andlid, 2002).
There are differences in optimal conditions for phytate degradation between plant
species. Most cereal phytases have pH optima between 4·5 and 5·6, but pH optima of
some legumes are neutral or alkaline. To optimize the food process for increased mineral
bioavailability by phytate degradation, it is essential to know optimal conditions for the
phytases, responsible for phytate degradation in the process (Sandberg and Andlid, 2002).
Hydrolysis of phytate during biological food processes and preparation such as
fermentation is a result of activity of phytase enzymes, naturally synthesized by plants
and many microorganisms. Phytases (InsP6-phosphohydrolases) are by definition
enzymes able to hydrolyse InsP6 to InsP5 and inorganic phosphate (Pi). Typically,
phytases are not specific for InsP6; leading to further hydrolysis to myo-inositol via
intermediate myo-inositol phosphates (penta- to monophosphates). Phytases constitute a

Page 22
subgroup of the family of acid phosphatases. Those that exhibit the ability to hydrolyse
InsP6 can be considered to be phytase (Sandberg and Andlid, 2002).
It is also reported that fermentation can reduce tannin content of foods. Reduction in
tannin due to processing might have been caused by the activity of polyphenol oxidase or
fermented microflora on tannins (Fagbemi et al., 2005).
All over the world, fermented foods provide an important part of human diet. Fermented
foods and beverages provide about 20-40% of human food supply. Traditional food
fermentation is capable of improving nutrients of the food, preserve it by generating
acidic condition, detoxify and reduce cooking time of the food (Fagbemi et al., 2005).
Fermentation are found to be useful in flavouring foods, in inhibiting spoilage bacteria
and pathogens, in intestinal health and other health benefits related to blood cholesterol
levels, immune competence and antibiotics production (Sobowale, 2007). Lactic acid
fermentation is inexpensive and often little or no heat is required during the process thus
making it fuel efficient (Shimelis and Rakshit, 2008).
Fermentation generally improves extractability of minerals, probably because of the
decreased content of phytic acid in the fermented product (Eltayeb et al., 2007).

Page 23
CHAPTER THREE
MATERIALS AND METHODS
3.1 Materials
Tubers of anchote were obtained from local markets of Nekemte and Dembidollo regions
(western Ethiopia). Soft wheat flour, shortening, sugar, skimmed milk powder,
ammonium bicarbonate sodium bicarbonate, sugar syrup, water, flavor and color were
obtained from Kaliti Food Share Company. Polyethylene bags, cooking utensil,
aluminum foil, ice box, stainless steel knives, tray from local markets and different
laboratory equipments were purchased and used in this study. Sample preparation was
done at Addis Ababa Institute of Technology Chemical Engineering Department
laboratories and Kality Food Share Company. The proximate, mineral and antinutritional
analysis was carried out at Ethiopian Health and Nutrition Research Institute and Jije
Laboglass p.l.c.. Physicochemical and functional properties were determined at Chemical
Engineering laboratories.

Page 24
3.2 Framework of the experiment
Proximate analysis
Fermented anchote flour
Roasted anchote flour
Samples of tubers of anchote
Proximate analysis
Sensory analysis
Crude Protein
Crude Fat Crude Fiber Moisture Total ash Minerals
Antinutritional factors (ANF)
analysis
Raw anchote flour
Crude Protein
Crude Fat Crude Fiber Moisture Total ash Minerals
Biscuit
Physicochemical and functional properties Analysis
Phytate, Tannins Oxalate, Cyanide
Boiled anchote flour
Wheat flour
Proximate analysis
Crude Protein
Crude Fat Crude Fiber Moisture Total ash

Page 25
3.3 Processing methods
3.3.1 Flour preparation from raw, boiled, roasted and fermented anchote tubers
� Flour preparation from raw anchote tubers
The raw anchote flour was prepared by the method described by Njintang et al. (2006) for
taro flour preparation with some modifications. All the samples were cleaned manually to
remove foreign matters adhering to it and hand peeled carefully using stainless steel knives
and the peeled anchote were washed and sliced to 0.5cm thick slices. The slices were dried
overnight in a hot air oven at 500c. The dried anchote chips were milled using an electric
miler (model: A11B, Germany) and sieved to pass through 100 mesh sieve, packed, stored
until analysis.
Figure 3.1 Anchote flour from raw anchote tuber
� Flour preparation from boiled anchote tuber
Boiled anchote flour was prepared based on the method described by Babajide et al. (2006) for
yam flour preparation with some modifications. Samples were carefully selected and cleaned to
remove adhering materials and soils. Then they were thoroughly washed using a running tap
water. About 500g medium size samples of cleaned and washed anchote were placed in
cooking utensil and 1500ml of water were added to it and the cooking utensil were placed
Drying in oven (500c)
Selecting fresh anchote
Washing of anchote
Peeling and slicing (0.5cm)
Grinding and sieving (0.1mm)
Packaging and storing

Page 26
over a hot plate to boil. The time of boiling were recorded after the water start to boil and
allowed to boil for 2hrs until they become soften. After boiling the water were discarded and
the boiled tubers were allowed to drip dry. Then the tubers were hand peeled and sliced in to
approximately 0.5mm thick and placed on a stainless steel tray and allowed to dry in oven at
500c over night to a constant weight. The dried anchote chips were converted to flour using
electric miller (model: A11B, Germany) and sieved to pass through 100 mesh sieves and
packed in polyethylene bags and stored in desiccators until analysis.
Figure 3.2 Anchote flour from boiled anchote tuber
� Flour preparation from roasted anchote tuber
Roasted anchote flour was prepared based on the method described for yam flour preparation by
Babajide et al. (2006) with some modifications. Fresh, equal and medium sized anchote
samples were selected and washed thoroughly. The cleaned anchote samples were pierced
with fork and baked in oven preheated to 4000F to approximately 1hr until its body and
texture becomes soft. Then the tubers were hand peeled and sliced in to approximately
Selecting fresh anchote
Washing of anchote
Boiling with the skin
Peeling the boiled Anchote
Slicing to pieces
Drying in oven (50oc)
Grinding and sieving (0.1mm)
Packaging and storing
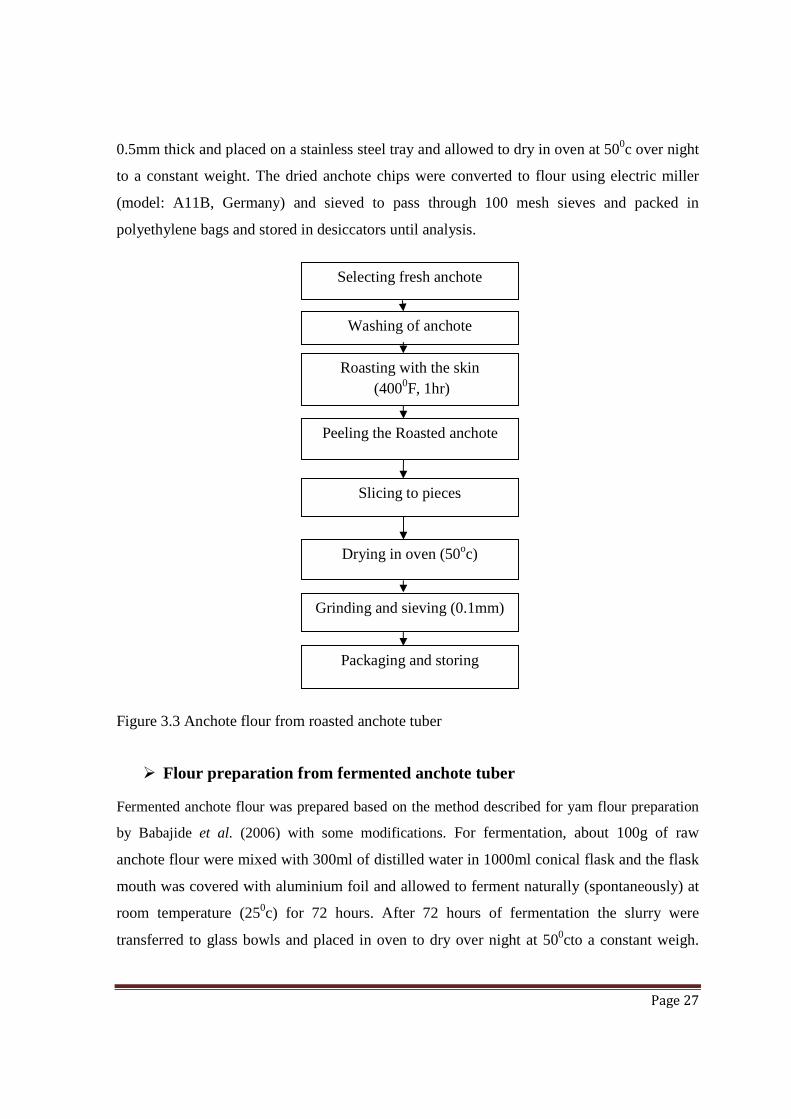
Page 27
0.5mm thick and placed on a stainless steel tray and allowed to dry in oven at 500c over night
to a constant weight. The dried anchote chips were converted to flour using electric miller
(model: A11B, Germany) and sieved to pass through 100 mesh sieves and packed in
polyethylene bags and stored in desiccators until analysis.
Figure 3.3 Anchote flour from roasted anchote tuber
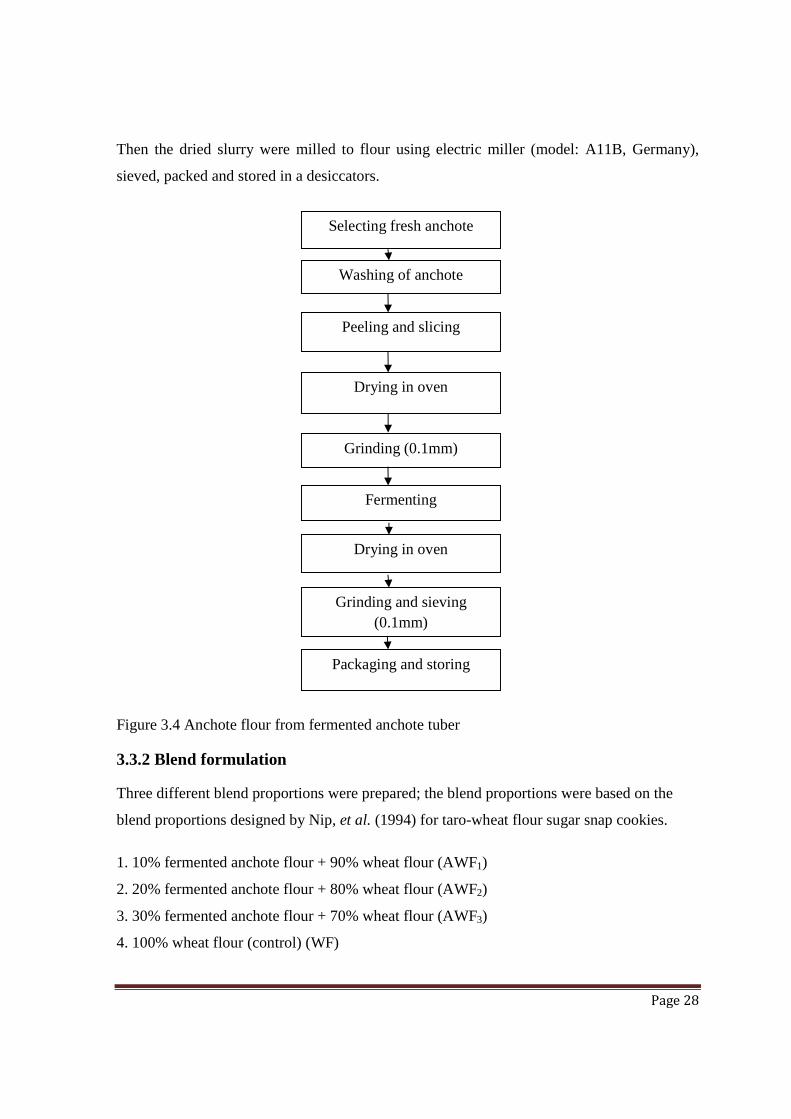
� Flour preparation from fermented anchote tuber
Fermented anchote flour was prepared based on the method described for yam flour preparation
by Babajide et al. (2006) with some modifications. For fermentation, about 100g of raw
anchote flour were mixed with 300ml of distilled water in 1000ml conical flask and the flask
mouth was covered with aluminium foil and allowed to ferment naturally (spontaneously) at
room temperature (250c) for 72 hours. After 72 hours of fermentation the slurry were
transferred to glass bowls and placed in oven to dry over night at 500cto a constant weigh.
Peeling the Roasted anchote
Selecting fresh anchote
Slicing to pieces
Drying in oven (50oc)
Washing of anchote
Roasting with the skin (4000F, 1hr)
Grinding and sieving (0.1mm)
Packaging and storing
Page 28
Then the dried slurry were milled to flour using electric miller (model: A11B, Germany),
sieved, packed and stored in a desiccators.
Figure 3.4 Anchote flour from fermented anchote tuber
3.3.2 Blend formulation
Three different blend proportions were prepared; the blend proportions were based on the
blend proportions designed by Nip, et al. (1994) for taro-wheat flour sugar snap cookies.
1. 10% fermented anchote flour + 90% wheat flour (AWF1)
2. 20% fermented anchote flour + 80% wheat flour (AWF2)
3. 30% fermented anchote flour + 70% wheat flour (AWF3)
4. 100% wheat flour (control) (WF)
Drying in oven
Selecting fresh anchote
Grinding (0.1mm)
Fermenting
Washing of anchote
Peeling and slicing
Drying in oven
Grinding and sieving (0.1mm)
Packaging and storing

Page 29
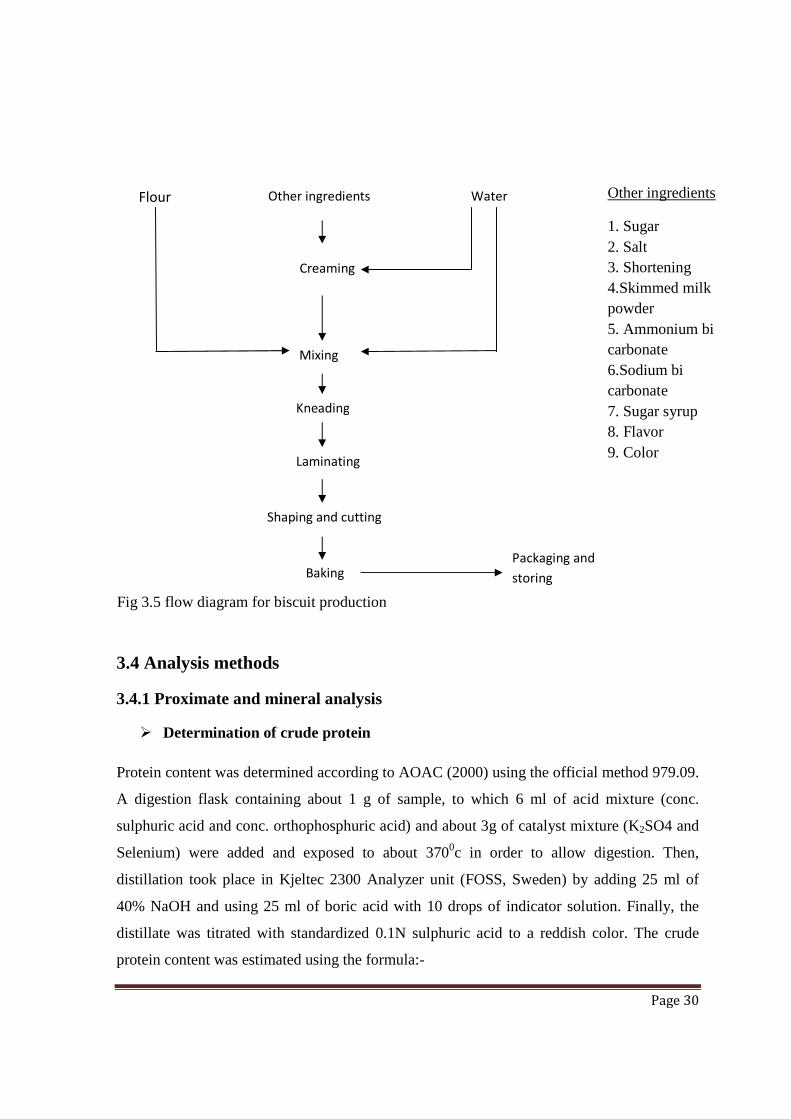
3.3.3 Processing method of biscuit made from anchote-wheat composite flour
The three blend formulations and the control flour were baked. The baking formula was
wheat flour or anchote-wheat flour blends 60.7%, Sugar 13.35%, Salt 0.41%, Shortening
5.25%, Skimmed milk powder 0.3%, Ammonium bicarbonate 0.79%, Sodium bicarbonate
0.15%, Sugar syrup 4.25%, Flavor 0.06%, Color 0.03% and water 14.71%. The baking
formula was adopted from Kality Food Share Company with some modifications (Pedersen,
2004).
Biscuits were produced according to a commercial formulation and baking practice of Kality
Food Share Company (Pedersen, 2004). The prepared fermented anchote flour was blended
with wheat flour as given below along with other ingredients. Then the dough was kept at a
normal room temperature for about 5 minutes to allow proper fermentation. Then fermented
dough was placed in biscuit molding rollers so that it attains the proper thickness (1.5mm).
Then this thin dough was shaped using a cylinder of model G.P.A. Orlandi SPA Verona,
Italia. Samples were baked in an Electric Convection Oven (model: G.P.A. Orlandi oven,
Italy, 1993) at 1700C for 5 min, and were allowed to cool for about 15 min on a rack. Then
the biscuits are ready for packaging and distribution. The preparation and processing flow
diagram is shown in Figure-3.6.
Page 30
3.4 Analysis methods
3.4.1 Proximate and mineral analysis
� Determination of crude protein
Protein content was determined according to AOAC (2000) using the official method 979.09.
A digestion flask containing about 1 g of sample, to which 6 ml of acid mixture (conc.
sulphuric acid and conc. orthophosphuric acid) and about 3g of catalyst mixture (K2SO4 and
Selenium) were added and exposed to about 3700c in order to allow digestion. Then,
distillation took place in Kjeltec 2300 Analyzer unit (FOSS, Sweden) by adding 25 ml of
40% NaOH and using 25 ml of boric acid with 10 drops of indicator solution. Finally, the
distillate was titrated with standardized 0.1N sulphuric acid to a reddish color. The crude
protein content was estimated using the formula:-
Other ingredients
1. Sugar 2. Salt 3. Shortening 4.Skimmed milk powder 5. Ammonium bi carbonate 6.Sodium bi carbonate 7. Sugar syrup 8. Flavor 9. Color
Flour Other ingredients Water
Mixing
Shaping and cutting
Kneading
Laminating
Baking Packaging and
storing
Creaming
Fig 3.5 flow diagram for biscuit production

Page 31
Total nitrogen percentage = ……………………… (3.1)
Where, V2 = volume in ml of the standard sulphuric acid solution used in the titration of the
test material
V1 = volume in ml of the standard sulfuric acid used in the titration for the blank
determination
N = normality of the standard sulphuric acid
W = weight in grams of test material
The conversion factor is 6.27 for anchote, which is obtained from food composition table of
EHNRI.
Crude protein content (%) = total nitrogen (%) × 6.27 ………………………. (3.2)
� Determination of crude fat
A clean and dried thimble containing about 5 g of dried sample and covered with fat free
cotton at the bottom and top was placed in the extraction chamber. Then, extraction took
place using 2055 Soxtec extraction unit (FOSS extractor, Sweden) for at least 4 hrs according
to AOAC (2000) official method 4.5.01. The crude fat content was determined by the
formula:-
Crude fat (%) = …………………………………………………….. (3.3)
Where, M2 = mass of flask and lipid extracted, M1 = mass of dried flask
M = weight of sample on dry basis
� Determination of crude fiber
Crude fiber analysis was conducted using the method of AOAC (2000) official method
962.09. About 1.6g weighed sample was transferred into a 600 ml beaker and about 200 ml
1.25% sulfuric acid was added and boiled for 30 minutes. Recording took place by placing a
watch glass over the mouth of the beaker. After 30 minutes heating by gently keeping the
level constant with distilled water, 20 ml 28% KOH was added and boiled gently again for
another 30 minutes. Subsequently, washing was conducted with 1% sulfuric acid and NaOH

Page 32
solution. After, filtering it was then dried in an electric oven (Memmert 854 Schwabach,
West Germany) at 1300C for 2hrs. Furthermore, it was cooled at room temperature for 30
minutes in a desiccators and weighed, then transferred the crucibles to muffle furnace
(Carbolite Aston Lane, Hope,S20 England.) for 30 minute ashing at 5500C. Finally, it was
cooled again in desiccators and reweighed. The crude fiber content was determined by using
the formula:-
Crude fiber content = ……………………………… (3.4)
Where, W1= crucible weight after drying, W2 = crucible weight after ashing, W3 = dry weight
M = % moisture of the sample
� Determination of moisture content
Moisture was determined according to AOAC (2000) using the official method 925.09. A
clean dried and covered flat aluminum dishes were weighed and about 5gm of the sample
were transferred to the dish. The dish then placed in the oven (Memmert 854 Schwabach,
West Germany) at 1020C for overnight and cooled in desiccators and re-weighed. Then, the
moisture content was estimated by the formula:-
MC (%) = ( ) × 100 ……….. (3.5)
� Determination of total ash The porcelain dish used for the analysis was washed by dilute hydrochloric acid on boiling.
And it was washed with distilled and de-mineralized water respectively. Then dried at 1200C
in an oven and ignited at 5500C in (Carbolite, Aston Lane, Hope, Sheffield s30 2RR,
England) furnace for 3 hour. The dish was then removed from furnace and cooled in
desiccators. The mass of the dish was measured using (ARZ140, N315, SNR=1203290469,
USA) analytical balance (M1). About 2.5 gm of sample powder was weighed in to the
porcelain dish (M2).The sample was charred at 1200C on hot plate (Wagtech, UK, hot plate
SH3), until the whole content becomes carbonized. Then the sample was placed in a
(Carbolite, Aston Lane, Hope, Sheffield s30 2RR, England) furnace at 5500C until whitish

Page 33
color appears. The sample was removed from the furnace and placed in desiccators. Finally
the mass was weighed as (M3).
Ash (%) = × 100 ………………………………………………………….... (3.6)
M1 = mass of the dried dish
M2 = mass of the dish and the sample (on DB)
M3 = mass of the dish and the ash
� Utilizable carbohydrate determination
The total utilizable carbohydrate was calculated by difference with the exclusion of crude
fiber.
Total carbohydrate (%) = 100 - (crude fat + crude fiber + crude protein + ash) ……... (3.7)
� Total energy in kilo calories
The gross energy (GE) content in each sample was determined mathematically using the
following formulae:
Total energy (Kcal) = (9 × CF + 4 × CP + 4 × CHO) ……………………………….. (3.8)
Where, CF- crude fat content, CP-crude protein content, CHO-carbohydrate content
� Calcium
The calcium content was determined according to the method of Association of Official
Analytical Chemists’ (AOAC, 2000) using the official method Flame Atomic absorption
Spectrophotometery, 923.03. About 1.0g sample was treated with 10ml of concentrated
HNO3 and 4 ml of 70% HClO4. The resulting solution was evaporated to a smaller volume
(7ml) by careful heating and transferred to 50ml volumetric flask. About 1ml of SrCl2.6H2O
was added and made up to volume with distilled water. The solution was sprayed into atomic
absorption spectrophotometer (Perkin Elmer, model 5100 PCAAS, USA) at 422.7nm to
determine the concentration of calcium. The calcium standards used were 0ppm, 5ppm,
10ppm, 20ppm and 30ppm.

Page 34
� Potassium
Potassium was determined according to the method of Association of Official Analytical
Chemists’ (AOAC, 2000) by using the official method Flame Atomic absorption
Spectrophotometery, 923.03. About g of the samples was dry ashed in a muffle furnace
(Muffle furnace size 2, England) at 550˚C for 5 hours until a white residue of constant weight
was obtained. The mineral was extracted from the ash by dissolving the ash in 10 ml HCl
solution (1:1, HCl: H2O). Ashed sample diluted to 25 ml, then 0.2 ml diluted to 100 ml and
stored in clean polyethylene bottles and potassium content was determined using atomic
absorption spectrophotometer (Perkin Elmer model 5100 PCAAS, USA) at 285.2nm.
� Iron
The iron content was determined based on the method described by the method of
Association of Official Analytical Chemists’ (AOAC, 2000) using the official method Flame
Atomic absorption Spectrophotometery, 923.03. 10ml of concentrated HNO3 was added to
about1g of the sample and left overnight. The sample was carefully heated until the
production of red nitrogen dioxide fumes ceased. The sample was cooled and 4ml of 70%
HClO4 was added and evaporated to a smaller volume (7ml) by careful heating. The resulting
solution was quantitatively transferred into 50ml volumetric flask and diluted to the mark
with distilled water. The solution was sprayed into an atomic absorption spectrophotometer
(Perkin Elmer, model 5100 PCAAS, USA) at 248.3nm to determine the concentration of
iron. The iron standards used were 0ppm, 1ppm, 2ppm, 3ppm and 4ppm.
� Zinc
Zinc determination was done based on the method determined according to Association of
Official Analytical Chemists’ (AOAC, 2000) using the official method Atomic Absorption
Spectrophotometery, 923.03. The ash obtained after dry ashing at 525oC was treated with
7ml of 6N HCl to wet it completely and 15ml of 3N HCl was added and the dish was heated
on the hot plate until the solution just boils. Then, it has been cooled and filtered. 10ml of 3N
HCl was added to the dish and heated until the solution just boils. Finally, cooled and filtered
into the graduated flask.
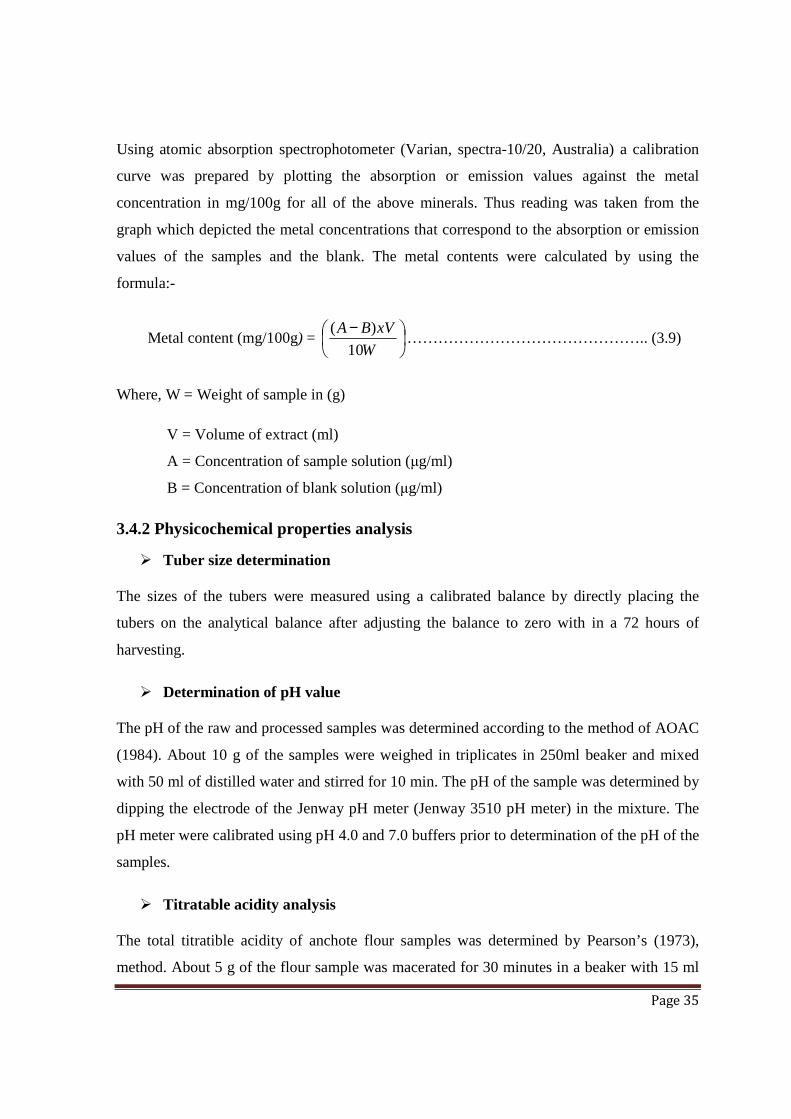
Page 35
Using atomic absorption spectrophotometer (Varian, spectra-10/20, Australia) a calibration
curve was prepared by plotting the absorption or emission values against the metal
concentration in mg/100g for all of the above minerals. Thus reading was taken from the
graph which depicted the metal concentrations that correspond to the absorption or emission
values of the samples and the blank. The metal contents were calculated by using the
formula:-
Metal content (mg/100g) =
−W
xVBA
10
)(……………………………………….. (3.9)
Where, W = Weight of sample in (g)
V = Volume of extract (ml)
A = Concentration of sample solution (µg/ml)
B = Concentration of blank solution (µg/ml)
3.4.2 Physicochemical properties analysis
� Tuber size determination
The sizes of the tubers were measured using a calibrated balance by directly placing the
tubers on the analytical balance after adjusting the balance to zero with in a 72 hours of
harvesting.
� Determination of pH value
The pH of the raw and processed samples was determined according to the method of AOAC
(1984). About 10 g of the samples were weighed in triplicates in 250ml beaker and mixed
with 50 ml of distilled water and stirred for 10 min. The pH of the sample was determined by
dipping the electrode of the Jenway pH meter (Jenway 3510 pH meter) in the mixture. The
pH meter were calibrated using pH 4.0 and 7.0 buffers prior to determination of the pH of the
samples.
� Titratable acidity analysis
The total titratible acidity of anchote flour samples was determined by Pearson’s (1973),
method. About 5 g of the flour sample was macerated for 30 minutes in a beaker with 15 ml

Page 36
of distilled water as 1 part of the flour to three parts of the water (w/v) ratio. A known
volume of water is used for further dilution in order to hydrolyze all the acids in the sample.
Before titration of the sample, the water that is used for dilution purpose will be titrated to be
used as a blank. Three drops of 1% alcoholic phenolphthalein indicator was added to water
extract of the sample (dispersion). The dispersion was then titrated with standard base (0.1N
NaOH) to phenolphthalein end point. The result of determination will be reported as
percentage lactic acid consuming definite volume of 0.1 N NaOH. The end point of the
titration was reached when the white dispersion changed from a clear white solution to a faint
violet colored turbid solution. Triplicate determinations were made in all cases. Finally it is
given that the amount of lactic acid in the sample was determined from the relation (1ml 0.1
N NaOH = 0.009008mg C3H
6O
3).
� Water activity analysis
The water activity of the raw and processed flour was determined using Aqua Lab Lite water
activity measuring unit manufactured by Decagon. Each sample were half filled in a small
plastic cup supplied with the instrument and inserted in to the instrument then the water
activity of each sample were displayed automatically.
3.4.3 Functional properties analysis
� Bulk density
Using the procedure of Okaka and Potter (1979), 50g of Anchote flour were put into a 100 ml
measuring cylinder and tapped to a constant volume and the bulk density (gcm-3) were
calculated using the formula:
Bulk density = ……………………………………. (3.10)
� Water and oil absorption capacities
About one gram of Anchote flour was mixed with 10 ml distilled water or refined palm oil
(frytol) in a pre-weighed 20 ml centrifuge tube. The slurry were agitated for 2 min, allowed to
stand at 280C for 30 min and then centrifuged at 2000 rpm for 20 min. The clear supernatant
were decanted and discarded. The adhering drops of water or oil in the centrifuge tube will be

Page 37
removed with cotton wool and the tube will be weighed, the weight of water or oil absorbed by
about 1 g of flour were calculated and expressed as water or fat absorption capacity (Buchat,
1977).
� Foam capacity and stability
The foam capacity was determined using the method of Coffman and Garcia, (1977) the flour
(2g) was suspended in distilled water (100 ml) and stirred at room temperature for 5 min
using a magnetic stirrer at 10 Ruhrer speed. The contents along with the foam were
immediately poured into a 250 ml measuring cylinder. Volume of foam (ml) after mixing
was expressed as the foam capacity and then volume after 60 min as foam stability.
� Swelling power and solubility
Swelling power and solubility determinations were carried out in the temperature range of
60-90°C (using the method of Leach et al., 1959). About one gram of anchote flour sample
was accurately weighed and quantitatively transferred in to a clear dried test tube and
weighed (W1). About 15 ml of distilled water were added and mixed gently at low speed for
5 min. The slurry was heated in a thermo stated water bath, at 80°C for 30 min with mixing
the suspension intermittently. The test tube was cooled with its content rapidly to 200C.
During heating, the slurry was stirred gently to prevent lumps forming in the flour. Then the
cool paste was centrifuge at 2200rpm for 15 min. The supernatant was decanted immediately
after centrifuging into a pre-weighed evaporating can and dried at 100°C to constant weight
approximately for 4 hours. The weight of the sediment was taken and recorded as (W2) or
swollen mass.
Swelling power = ………………….…………………… (3.11)
Solubility index (%) = × 100 ………..…………………………....... (3.12)

Page 38
3.4.4 Antinutritional factor analysis
� Phytate analysis
The phytate content in the sample was determined according to the method described by
Latta and Eskin (1980), and later modified by Vaintraub and Lapteva (1988).About 0.05gm
of dried sample was extracted with 10ml 2.4% HCl in methanol for 1 hr at ambient
temperature and centrifuged (3000 rpm) for 30 minutes. The clear supernatant was used for
the phytate estimation. About 1ml of wade reagent (0.03% solution of FeC13 water) was
added to 3ml of the sample solution and the mixture was centrifuged. The absorbance at
500ηm was measured using spectrophotometer calculated from the difference between the
absorbance of the control (3reagent) and that of the assayed sample. The concentration of
phytate was calculated using acid standard curve and the weight.
To prepare the phytic acid standard curve, a series of standard solution was prepared
containing 5–40 mg/ml phytic acid in water. About 3ml of the standards was pipetted into
15ml centrifuge tubes with 3ml of water used as a zero level. To each tube was added about
1ml of the wade reagent, and the solution was mixed on a vortex mixer for 5s. The mixture
was centrifuged for 10 minutes and the supernatant read at 500ηm was read by using water as
a blank.
� Tannin analysis
Tannin content was determined by the method of Burns (1971) as modified by Maxson and
Rooney (1972). About 2.0 gram of anchote flour was weighed in a screw cap test tube. The
anchote flour was extracted with 10ml of 1% HCl in methanol for 24 hours at room
temperature with mechanical shaking. After 24 hours shaking, the solution was centrifuged at
1000rpm for 5 minutes. About 1ml of supernatant was taken and mixed with 5 ml of vanillin
HCl reagent (prepared by combining equal volume of 8% concentrated HCl in methanol and
4% vanillin in methanol).
D-catechin was used as standard for condensed tannin determination. A 40mg of D-catechin
was weighed and dissolved in 1000 ml of 1% HCl in methanol, which was used as stock
solution. A bout 0, 0.2, 0.4, 0.6, 0.8 and 1 ml of stock solution was taken in test tube and the
volume of each test tube was adjusted to 1ml with 1% HCl in methanol. About 5ml of

Page 39
vanillin HCl reagent was added into each test tube. After 20 minutes, the absorbance of
sample solutions and the standard solution were measured at 500nm by using water to zero
the spectrophotometer, and the calibration curve was constructed from the series of standard
solution using SPSS-15. A standard curve was made from absorbance versus concentration
and the slope and intercept were used for calculation. Concentration of tannin was read in mg
of D-catechin per 100gm of sample
Tannin in mg/100g = ……………………….. (3.13)
� Oxalate analysis
The oxalate content was determined using the method originally employed by Ukpabi and
Ejidoh (1989). The procedure involves three steps: digestion, oxalate precipitation and
permanganate titration.
• Digestion: At this step, about 2 g (db) of flour was suspended in 190 ml of distilled water
contained in a 250-ml volumetric flask; 10 ml of 6M HCl was added and the suspension
digested at 1000C for 1 h, followed by cooling, and then made up to 250 ml before
filtration.
• Oxalate precipitation: Duplicate portions of 125 ml of the filtrate were measured into a
beaker and four drops of methyl red indicator added, followed by the addition of
concentrated NH40H solution (drop wise) until the test solution changed from its salmon
pink colour to a faint yellow colour (pH 4-4.5). Each portion was then heated to 900C,
cooled and filtered to remove precipitate containing ferrous ion. The filtrate was again
heated to 900C and 10 ml of 5% CaCl2 solution was added while being stirred constantly.
After heating, it was cooled and left overnight at 5°C. The solution was then centrifuged
at a speed of 2500 rev/min for 5 min. The supernatant was decanted and the precipitate
completely dissolved in 10 ml of 20% (v/v) H2SO4, solution.
• Permanganate titration: At this point, the total filtrate resulting from digestion of 2 g of
flour was made up to 300 ml. Aliquots of 125 ml of the filtrate were heated until near
boiling, and then titrated against 0.5M standardized KMnO4, solution to a faint pink

Page 40
colour which persisted for 30 s. The calcium oxalate content was calculated using the
formula.
Oxalate (mg/100g) = ……………………………………… (3.14)
Where, T is the titre of KMnO4 (ml), Vme is the volume - mass equivalent (i.e. that 1 cm
3 of
0.05 M KMnO4, solution is equivalent to 0.00225 g anhydrous oxalic acid), DF is the
dilution factor VTA (2.4, where VT is the total volume of filtrate (300ml) and A is the
aliquot used (125 ml)), ME is the molar equivalent of KMnO4
in oxalate and mf is the mass
of flour used.
� Cyanide analysis
The cyanide content of the raw and differently processed anchote flours (boiled and
fermented and roasted) samples was determined by (AOAC, 1995). About 20 g of anchote
flour sample was placed in extraction flask and followed by addition of 100 ml of distilled
water and allowed to stand for two hours, in order to set free all the bound hydrocyanic acid,
meanwhile keeping the flask connected with an apparatus for distillation. After two hours of
maceration, 100 ml of distilled water was added to the slurry and steam distilled. The
distillate was collected in 20 ml 0.01N AgNO3
that has been acidified with 1 ml HNO3. The
distillation process was allowed to proceed for 40 minutes with vigorous boiling. After
passing over of 150 ml of the distillate, the distillate was filtered through Gooch with little
water and the excess AgNO3
was titrated in combined filtrate and washings with 0.02N
KSCN, using ferric alum indicator. The end point of titration was indicated by appearance of
faint reddish color up on addition of 0.02 N KSCN solution. The quantity of HCN present in
the sample was calculated from the following relation.
Volume (ml) of AgNO3 consumed to complex CN
-= 20 – 2 × Volume of the titere ….. (3.15)
1ml 0.01 N AgNO3 = 0.27 mg HCN …………………………………………………… (3.16)

Page 41
3.4.5 Sensory value analysis
Color, taste, flavor, crispness and overall acceptability of all the biscuits including the control
were evaluated by method using a 9 point Hedonic Scale (Giami et al, 2006).
Panelists were trained in the use of sensory evaluation procedures and the meaning of the
descriptive terms used. Panelists were instructed to evaluate color first and then to taste each
sample to evaluate flavor, crispness and overall acceptability. A nine point hedonic scale
with 1 = dislike extremely, 5 = neither like nor dislike, 9 = like extremely was used (Giami,
et al, 2006). Water was provided to rinse the mouth between evaluations and covered
expectoration cups were also provided when panelists didn’t wish to swallow the samples.
3.5 Experimental design and statistical analysis of data
A simple comparative experiment was designed for the study. The experiment was
completely randomized design (CRD). The study considered processing methods as one
factor with three levels of treatments (boiling, roasting and fermentation) to see their effects
on the proximate composition, ANF, physicochemical and functional properties of raw
anchote flour and one factor namely blend proportions with three levels of treatment to see
their effects on the quality of biscuits.
All analysis was done in triplicates. The results of the three replicates were taken and
expressed as mean ± standard deviation. A one-way analysis of variance (ANOVA) and the
least significance difference (LSD) were carried out using JMPIN 5.0.1 software to compare
the difference between treatment means. Significance difference was accepted at 0.05 level
of probability (P < 0.05).
3.6 Techno-economic feasibility analysis
� Material and energy Balance
Material and energy balance for the production of anchote flour and anchote-wheat flour
biscuit product were carried out based up on the generated laboratory data and by considering
the assumptions, that the plant has a capacity of 1500 ton per year and the plant operates for
300 days in a year.

Page 42
� Economic analysis
The total capital investment for the production of biscuit product was estimated by summing
up the fixed capital investment (FCI) and working capital. The working capital was taken as
15% of the fixed capital investment which is commonly used.
The total production cost for the production of biscuit product was estimated by summing up
the manufacturing cost and general expenses.
Unit product cost was evaluated by dividing the total product cost to the total plant capacity
per year.
Rate of return (ROR): the rate of return on investment for the production of biscuit product
was calculated by using the following equation;
Rate of return (ROR) = (Net profit/ total capital employed) ×100%
Payback period: The time required to return the allocated total investment for the production
of biscuit were calculated by using the equation;
Payback period (PBP) = (Fixed Capital Investment) / (Net profit + Depreciation)
Break – even analysis: the break-even production is the number of units necessary to produce
and sell in order fully to cover the annual fixed costs. It was computed as:
Total product cost = Total income
Break-even point =
Vcup = Variable costs per unit of production
Sup = Selling price per unit of production

Page 43
CHAPTER FOUR
RESULTS AND DISCUSSIONS
In this chapter the outcome of, proximate composition, mineral composition, functional
properties, the physicochemical properties and the levels of antinutritional factors of the raw
and processed anchote flours of the two samples were discussed. Table 4.1, 4.2, 4.3, 4.4, and
4.5, show the results of proximate composition, the mineral composition, the levels of
antinutritional factors, physicochemical and functional properties for raw and processed
anchote flour samples, respectively. Additionally the nutritional and sensory evaluation of
anchote-wheat flour composite biscuit is also discussed. All results were based on dry weight
basis of anchote flour.
(a) (b)
Figure 4.1 Samples of anchote tuber, a) Nekemte sample, b) Dembiddollo sample
4.1 Proximate and mineral composition of anchote flour
� Crude Protein
The protein content of raw and processed anchote flour samples collected from Nekemte
regions were in the range of 6.78% and 10.68%. The fermented sample (NF) had highest
protein value (10.68%) and the minimum corresponds to boiled samples of anchote (6.78%).
The protein percentage of the raw and roasted samples were 7.28 (3.00%, wwb) and 7.13%
respectively. The results showed that fermentation significantly (P < 0.05) increased the
protein content of the anchote sample by 46.9%. Boiling and roasting on the other hand had
Page 44
no significant effect (P > 0.05) on the protein content of the Nekemte anchote sample. The
result in raw Nekemte anchote was in agreement with the finding of Habtamu and Kelbessa
(1997) reported the raw anchote tuber contained 3.0g/100g crude protein (wwb). EHNRI also
reported that raw anchote contained 3.2% crude protein (wwb). Recently, Habtamu Fekadu
(2011) reported a protein content of 3.25 and 3.14% (wwb) for raw and boiled samples of
anchote, which agrees with the present finding.
The results of crude protein of the Dembidollo sample were in the range of 4.50 and 8.32%.
The maximum protein content was observed for the fermented sample (DF) and the
minimum for boiled anchote (DB). The protein content of raw Dembidollo (DR) anchote was
found to be 5.17% (2.1%, wwb) and roasted anchote sample (DRD) had a protein content of
4.68%. The crude protein content of the raw anchote sample of Dembidollo sample was
lower than the values reported by EHNRI, 1997(crude protein: 3.2%, wwb) and Habtamu and
Kelbessa, 1997(crude protein: 3.0%, wwb). In the Dembidollo sample it was observed that
among the three processing methods only fermentation had a significant effect (P < 0.05) on
the protein content of Dembidollo anchote flour sample, which was increased the crude
protein content by 60.9%. Similarly, Habtamu Fekadu (2011) reported that boiling had no
significant effect on the protein content of anchote. The increase in the protein content of
anchote flour during fermentation may be because some microorganisms such as micro-
fungi, which degrade anchote flour readily (Reade and Gregory, 1975), could have secreted
some extracellular enzymes (protein) in the anchote flour which can be possible reason for
the increase in the percentage of protein content in both samples. The decrease of
carbohydrate by fermentation and increase of carbohydrate by boiling contributes
proportionally to the increase and decrease of protein by fermentation and boiling
respectively as the values of all proximate analysis was computed out of hundred percent. It
is known that fermentation may enrich foods in protein by removing part of the fermentable
carbohydrate as documented in fermented foods made from cassava (Okafor 1998).In the
result higher protein content of anchote was recorded, it is evident that anchote crop contains
higher amount of protein content than any other crop (Abera, 1995). The mean values also
showed that there was a significant difference between the two samples of anchote collected
from different regions. From the result, it was shown that Nekemte anchote had higher
protein content in preference to the Dembidollo anchote sample.

Page 45
� Crude fat
The crude fat compositions of the two anchote flour samples are displayed in the table 4.1.
The table shows that the fat content of raw and processed anchote flour sample from
Nekemte were in the range of 0.6% (for NRD) and 1.32% (for NF). The value of raw
Nekemte (NR) sample was determined to be 1.15% (0.47%, wwb) and boiled anchote (NB)
had 0.78%.
On the other hand as shown in the table that the fat content for the raw and processed
Dembidollo flour sample were 0.59%, 0.88% (0.36% , wwb), 0.42% and 1.10% for DB, DR,
DRD and DF respectively. Maximum value was recorded for the fermented and minimum for
the roasted flour sample. The results show that the raw flours of both samples had higher fat
contents in compared to the results reported for raw anchote flour sample by Agren and
Gibson, 1968 (0.1%, wwb), EHNRI, 1997 (0.1%, wwb) and Habtamu and Kelbessa
,1997(0.17%, wwb) and Habtamu Fekadu, 2011 (0.19%, wwb). All three processes had a
significant effect (P < 0.05) on the fat content of both samples. An increase in fat content
during fermentation for both samples could be attributed to the possibility that, the fermenter
organisms could secrete microbial oil (Oboh and Akindahunsi, 2003). There was also a
significant difference between the fat content of the two samples. Higher fat content was
observed for Nekemte anchote sample than Dembidollo sample. Boiling significantly
reduced the crude fat content. It was indicated that boiling significantly reduced the crude fat
content of anchote flour (Habtamu Fekadu, 2011). The observed reduction in the fat content
of anchote flour during boiling is due to the leaching into boiling water (Ukwuru, 2003).
� Crude fiber
The crude fiber contents of the raw and processed Nekemte anchote flour sample are shown
in table 4.1, which were found to be 3.94% (1.6% , wwb), 4.67%, 2.82% and 2.83% for NR,
NB, NRD and NF, respectively. These values showed that boiling increased significantly (P
< 0.05) the crude fiber content. In contrast to boiling, roasting and fermentation significantly
(P < 0.05) reduced the fiber contents of the Nekemte anchote flour sample. The percentage
compositions for the crude fiber contents of the Dembidollo anchote flour sample were
between 3.67 and 5.78%. The maximum was for boiled sample (DB) and the minimum for

Page 46
roasted anchote (DRD). Fermented sample (DF) had 3.75% crude fiber and raw sample (DR)
4.73% (1.93%, wwb) crude fiber content. All three processes affected significantly (P < 0.05)
the crude fiber content in Dembidollo sample. Boiling significantly (by 22%) increased the
crude fiber content of the Dembidollo sample. Roasting and fermentation significantly
reduced the crude fiber content of the anchote sample from Dembidollo by 23 and 21%
respectively. The values for raw anchote of the two samples were in agreement with the
value reported by Agren and Gibson, 1968 (1.7%). But, the findings of Habtamu and
Kelbessa, 1997 (0.6%, wwb) and EHNRI, 1997 (0.7%, wwb) in crude fiber content of raw
anchote had lower crude fiber values. But, Habtamu Fekadu (2011) reported higher crude
fiber contents (2.58%, wwb). The decrease in fiber content of raw anchote flour of both
samples during fermentation is attributed to the possibility that the fermenter micro-
organisms could secrete hydrolytic enzymes (Oboh, 2005). These enzymes are capable of
hydrolyzing crude fiber into simple sugars, which the organism could use as its carbon
source and change it to other macromolecules or metabolites such as protein and fat (Oboh,
2006). The increment in crude fiber during boiling could be due to the fact that as samples
were subjected to boiling, and thus all the soluble components might have lost in the process
thereby increasing the crude fiber contents ( Ahmed et al., 2010).
� Ash
The results of ash values displayed in the table 4.1 shows that the ash percentage of the
sample collected from Nekemte regions had variation from 3.27 to 4.21 which corresponding
to NB and NF respectively. The percentage of ash for NRD and NR was 3.64% and 3.96%
(1.60%, wwb) respectively. The maximum and minimum ash content in Nekemte sample
was 4.21% and 3.27% respectively. Based on the findings, boiling and roasting processes
significantly (P < 0.05) reduced the ash content. Fermentation on the other hand significantly
(P < 0.05) increased the ash percentage. The decrease of carbohydrate and crude fiber
percentage by fermentation contributes proportionally to the increase of ash by fermentation
as the values of all proximate analysis was computed out of hundred percent. Contamination
from utensil during sample preparation and fermentation may also be the probable reason for
the increment in ash. The ash contents of Dembidollo sample were 4.67 (1.90%, wwb), 4.32,
3.86 and 4.54 for DR, DB, DRD, and DF respectively. All three processes significantly (P <
Page 47
0.05) reduced the ash values of the sample collected from Dembidollo region. The mean ash
content of raw anchote flours of Dembidollo sample was comparable to the findings of
Habtamu and Kelbessa, 1997 (2.00%, wwb) and Habtamu Fekadu, 2011 (2.19%, wwb). But
a lesser value was reported by EHNRI, 1997 and Agren and Gibson (1968) which was 1.10%
(wwb). Additionally, the ash percentage of raw sample of Nekemte was lower than the value
reported by Habtamu and Kelbesa (1997) and Habtamu Fekadu, 2011, but higher than the
report of EHNRI, 1997 and Agren and Gibson (1997). The reduction of total ash during
boiling and fermentation may be attributed due to leaching of mineral compound and water
absorption during boiling and fermentation (Lewu et al., 2009).
The observed difference in the ash contents between the two samples may be attributed to
climatic factor, the soil type, and the varietal and/or cultivar difference. From the high ash
contents of the anchote samples studied, one can easily understand that there would be
appreciable quantity of minerals in anchote.
� Moisture
The moisture determinations of the samples collected from Nekemte region ranged from 4.05
and 6.86 %. The maximum was for fermented sample (NF) and the minimum for roasted
sample (NRD) .Boiled sample (NB) had a moisture value of 5.78% and raw anchote (NR)
had a moisture content of 6.36%. The results of the moisture analysis for Demb idollo were
7.01% for DF, 6.60% for DR, 4.13% for DRD, 5.92% for DB. The determinations of
moisture for the two samples showed that boiling and roasting had a significant effect (P <
0.05) on moisture reduction of the two samples. Fermentation on the other hand significantly
(P < 0.05) increased the moisture content of both anchote samples.
In summary it seems that the moisture content for both samples in all treatments is in the
moisture range generally accepted for dry products in order to obtain a desirable shelf life of
the product (Sriroth et al., 2000).
� Utilizable carbohydrate
From the results of the study it could be observed that anchote is a very good source of
carbohydrate (CHO). The carbohydrate content of the Nekemte sample was 77.31% (27%,

Page 48
wwb), 78.72%, 81.76%, and 74.1% for NR, NB, NRD and NF respectively. Boiling and
roasting increased significantly (P < 0.05) the carbohydrate content while fermentation
reduced significantly (P < 0.05) the carbohydrate content of the sample. The reduction of
carbohydrate content by fermentation was around 4.2%. The sample from Dembidollo
regions had a carbohydrate content varied from 75.28 to 82.78 %. The least value, 75.28%
corresponds to fermented sample (DF) and the maximum was 82.78% and corresponds to
DRD sample. The raw sample (DR) had a carbohydrate content of 77.95% (27%, wwb) and
DB had a carbohydrate content of 79.35%. The result in raw anchote of the two samples were
higher than the finding of Habtamu and Kelbessa, 1997 (22.5%, wwb), EHNRI, 1967
(21.1%, wwb) and Agren and Gibson, 1968 (21.2%, wwb). Habtamu Fekadu (2011) reported
even lower CHO content (16.86%, wwb) and he also reported a significant reduction of CHO
contents during boiling, which contradicts to the present study.
In both samples, boiling has increased the carbohydrate content to some extent which results
from solubilization of starch which makes it much more available and increase in the
carbohydrate content of both samples (Tilahun et al. 2009). The possible basis for the
decrease in the carbohydrate of the fermented anchote flour of both samples will not be far
from the possibility that the micro-organisms could secrete hydrolytic enzymes (Oboh et al.,
2003; Oboh, 2005). These enzymes are capable of hydrolyzing carbohydrate into simple
sugars, such as maltose which the organism could use as its carbon source and changes it to
other macromolecules or metabolites such as protein and fat (Oboh and Akindahunsi, 2003;
Oboh,2006).

Page 49
Table 4.1 Proximate compositions of raw and processed anchote flour
Sample
Type
Protein (%) Fat (%) Fiber (%) Ash (%) Moisture
(%)
CHO (%) Energy
(Kcal/100g)
NR 7.28±0.320c 1.15±0.0436b 3.94±0.3387c 3.96±0.1609cde 6.36±0.1277c 77.31±0.2107f 348.71
NB 6.78±0.2623c 0.78±0.0458c 4.67±0.2750b 3.27±0.2330f 5.78±0.1967d 78.72±0.1153d 349.02
NRD 7.13±0.5205c 0.60±0.0557d 2.82±0.2551d 3.64±0.2615ef 4.05±0.1442e 81.76±0.1200b 360.96
NF 10.68±0.2007a 1.32±0.0361a 2.83±0.1587d 4.21±0.2400bcd 6.86±0.0917a 74.1±0.2498h 351.0
DR 5.17±0.4943d 0.88±0.0557c 4.73±0.1572b 4.67±0.3279a 6.60±0.0954b 77.95±0.1552e 340.4
DB 4.50±0.4355d 0.59±0.0458d 5.78±0.2910a 3.86±0.3064de 5.92±0.0794d 79.35±0.1200c 340.71
DRD 4.68±0.4818d 0.42±0.0265e 3.67±0.2193c 4.32±0.2358abc 4.13±0.0721e 82.78±0.4124a 353.62
DF 8.32±0.4600b 1.10±0.1153b 3.75±0.1931c 4.54±0.2107ab 7.01±0.1114a 75.28±0.2750g 344.3
All values are the means of triplicates ± standard deviation.
Means with the same superscript letters within a column are not significantly different (P > 0.05)
Key: NR- Nekemte raw, DR-Dembidollo raw, NB -Nekemte boiled, DB-Dembidollo boiled, NRD-Nekemte roasted, DRD-Dembidollo roasted, NF-Nekemte
fermented, DF-Dembidollo fermented, a ,b ,c, d, e …. are superscripts given to show the significant difference between means, a > b > c > d….
All values are expressed in (g/100g) of dry weight basis of edible portion

Page 50
� Calcium
The calcium contents of Nekemte sample were 470.13 (164mg/100g, wwb), 464.12, 462.2
and 424.18mg/100g which correspond to NR, NB, NRD and NF respectively. The calcium
contents of Dembidollo sample were 549.009 (192mg/100g, wwb), 544.3, 541 and
501.1mg/100g for DR, DB, DRD and DF in the given order. The calcium contents of the raw
anchote from the two places were higher than the values reported by Agren and Gibson, 1968
(119mg/100g, wwb) and EHNRI, 1997 and Habtamu Fekadu, 2011(119mg/100g, wwb) and
lower compared with the results reported by Habtamu and Kelbesa, 1997 (344mg/100g ,
wwb). All three processes reduced significantly (P < 0.05) the calcium contents of the
anchote samples from the two places. Comparing the two samples of anchote the sample
from the Dembidollo had higher calcium content than the corresponding Nekemte sample.
The probable reason for the reduction of Ca during roasting may be antinutrients have
interfered with the bioavailability of Ca as suggested by Alonso et al. (2010) and Anigo et al.
(2009). The reduction during boiling and fermentation may be attributed to leaching out in
boiling and fermentation water. The reduction in Ca content during boiling agrees with
previous report of Habtamu Fekadu (2011). The probable reason for difference in Ca content
of the two samples may be due to difference in genetic origin, geographical source and soil
conditions of the samples collected.
� Iron
Sample of Nekemte had Fe content of 13.38 (5.5mg/100g, wwb), 14.85, 14.23 and 10.70
mg/100g for NR, NB, NRD and NF respectively. Sample from Dembidollo also contained Fe
content of 14.12mg/100g (5.8mg/100g, wwb) for DR, 15.63 mg/100g for DB, 15.12 mg/100g
for DRD and 12.34 mg/100g correspond to DF. The result in raw anchote of the two samples
was comparable with the finding of Habtamu and Kelbesa, 1997 and Habtamu Fekadu, 2011
(5.5mg/100g, wwb). However, EHNRI (1997) (1.3mg/100g, wwb) and Agren and Gibson,
1968 (1.8mg/100g, wwb) reported lower iron contents. Boiling and roasting increased
significantly (P < 0.05) the Fe content, but fermentation reduced the Fe content significantly
(P < 0.05). The Fe increment during boiling could be due to contamination from cooking
utensils (Akin-Idowu et al., 2009). A significant increase in Fe content during boiling of
anchote was also reported by Habtamu Fekadu, 2011.

Page 51
� Zinc
The mean values of zinc content of the Nekemte sample were 6.43 mg/100g (2.64mg/100g,
wwb), 5.34 mg/100g, 6.31mg/100g and 7.63mg/100g for the corresponding NR, NB, NRD
and NF respectively. Dembidollo anchote had zinc content values varied from 5.29 to
7.42mg/100g. The minimum corresponds to DB and the maximum to DF. The raw sample
(DR) had a Zn content of 6.37mg/100g (2.61mg/100g, wwb) and DRD had a value
6.28mg/100g. Boiling reduced significantly (P < 0.05) zinc content, while fermentation
increased significantly (P < 0.05) zinc content. No significant (P > 0.05) difference was
observed between the two samples in zinc content. The results of zinc content of the raw
anchote samples were higher than the report of Habtamu and Kelbessa, 1997 (1.8mg/100g,
wwb) and Habtamu Fekadu, 2011 (2.23mg/100g, wwb). The probable reason for the
reduction of zinc during boiling may be attributed to leaching out of Zn in boiling water.
� Potassium
The results in the table 4.2 show that the K contents of Nekemte sample were between
1252.23 and 1468.42mg/100g. The minimum K content corresponds to NB and the
maximum belongs to NF. NR and NRD had a K content of 1293.75mg/100g and
1256.9mg/100g respectively. The K contents of Dembidollo sample were 1562.50, 1511.56,
1516.2, and 1745.1mg/100g for the corresponding DR, DB, DRD and DF respectively. The
results show that boiling and roasting reduced the K content of anchote collected from the
two places significantly (P < 0.05). But, Fermentation process increased the K content
significantly (P < 0.05) in both samples. The potassium salts present in the nutrient solution
could have caused this increase in K content (Oboh G. and Elusiyan C. A.). The results also
showed the K contents of the two anchote samples were significantly (P < 0.05) different,
this may be due to varietal difference, environmental factors and soil type as the two samples
were collected from different places. Very high amount of K contents were recorded in both
samples.

Page 52
Table 4.2 Mineral compositions of raw and processed anchote flour
Sample
Type
Ca
(mg/100g)
Fe
(mg/100g)
Zn
( mg/100g)
K
(mg/100g)
NR 470.13±1.0709e 13.38±0.4491e 6.43±0.4386b 1293.75±1.0371f
NB 464.12±0.9498f 14.85±0.5386bc 5.34±0.3576c 1252.23±1.0697h
NRD 462.2±1.5037f 14.23±0.3143cd 6.31±0.3342b 1256.9±0.7669g
NF 424.18±1.1067g 10.70±0.4328g 7.63±0.4371a 1468.42±1.1761e
DR 549.00±1.0106a 14.12±0.3676d 6.37±0.4161b 1562.50±1.2371b
DB 544.3±0.9849b 15.63±0.2987a 5.29±0.4314c 1511.56±0.9364d
DRD 541±0.9297c 15.12±0.2787ab 6.28±0.3751b 1516.2±0.9983c
DF 501.1±1.3647d 12.34±0.4258f 7.42±0.3372a 1745.1±0.9450a
All values are the means of triplicates ± standard deviation.
Means with the same superscript letters within a row are not significantly different (P>0.05)
Key: NR- Nekemte raw, DR-Dembidollo raw, NB -Nekemte boiled, DB-Dembidollo boiled, NRD-Nekemte
roasted, DRD-Dembidollo roasted, NF-Nekemte fermented, DF-Dembidollo fermented, Ca-calcium, Fe-iron,
Zn-zinc, K-potassium, a, b, c, d, e …. are superscripts given to show the significant difference between means, a
> b > c > d….
All values are expressed in (mg/100g) of dry weight basis of edible portion
4.2 Antinutritional factors of anchote flour
Anti-nutrients are known to reduce the maximum utilization of nutrients especially proteins,
vitamins and minerals (Ugwu and Oranye, 2006). So that, the levels of ant-nutritional factors
in the anchote tubers are important in the assessment of its antinutritional status. The contents
of antinutritional factors, phytate, tannin, oxalate and cyanide of the raw and processed
anchote tuber is shown in table 4.3.
4.2.1 Phytate
The phytate contents obtained in the two anchote samples are indicated in table 4.3. The
levels of phytate in anchote flour prepared from Nekemte sample ranged from 9.34mg/100g
to 20.65mg/100g. The phytate content for NR was 20.65mg/100g and for fermented Nekemte
anchote (NF) the phytate level was 9.34mg/100g. The phytate level of the boiled (NB) and
roasted Nekemte (NRD) anchote were 14.54 and 13.67mg/100g respectively. The phytate

Page 53
level in Dembidollo sample ranged from 11.45 mg/100g to 33.06 mg/100g, where the
intermediate levels were 22.21 mg/100g for DB and 21.65mg/100g for DRD. All three
processes reduced significantly (P < 0.05) the phytate content in both samples. In both
samples fermentation had a more significant implication on the reduction which reduced the
phytate by 55 and 65% in Nekemte and Dembidollo samples respectively. There was also a
significant difference between the two anchote samples. The sample collected from Nekemte
regions had lower phytate level in comparison to sample collected from Dembidollo region.
The possible reason for the decrease in phytate content during fermentation and boiling may
be partly due to leachching out of phytate with boiling and fermentation water and either to
the formation of insoluble complexes between phytate and other components, such as
phytate-protein and phytateprotein– mineral complexes or to the inositol hexaphosphate
hydrolyzed to penta- and tetraphosphates (Siddhuraju and Becker, 2001). The decrease in the
phytate content of the fermented anchote flour for both samples could possibly be attributed
to the secretion of the enzyme phytase. This enzyme is capable of hydrolyzing phytate (Oboh
et al., 2003), thereby decreasing the phytate content of the anchote flour. The Phytate content
reported by (Habtamu Fekadu, 2011), which is 389.3mg/100g for raw anchote and
334.74mg/100g for boiled anchote sample is drastically higher than the phytate concentration
determined in the present study. The Phytate concentration range obtained in the present study is
lower compared to the acceptable concentrations. In average, the daily intake of phytate was
estimated to be 2000–2600 mg for vegetarian diets as well as diets of inhabitants of rural
areas of developing countries and 150–1400 mg for mixed diets (Reddy NR, 2002). But,
Hurrel, R. F et al. (1992) reported that phytic acid intake of 4-9mg/100g is said to decrease
iron absorption by 4-5 folds in humans.
4.2.2 Tannin
Tannins affect nutritive value of food by forming a complex with protein (both substrate and
enzyme) thereby inhibiting digestion and absorption (Oboh and Elusian, 2007). The tannin
determinations of the two samples of anchote flour are shown in table 4.3. The levels of
tannin for Nekemte sample were given 50.19mg/100g, 21.76 mg/100g, 19.82 mg/100g and
13.87 mg/100g for NR, NB,NRD and NF respectively and these values showed that the total
tannin content was the highest for NR (50.19 mg/100g) which was control or unprocessed

Page 54
sample, and minimum for NF (13.67 mg/100g). All three processes reduced significantly (P
< 0.05) the tannin content in Nekemte sample. Fermentation reduced the tannin content
approximately by 73%. The tannin content for anchote flour of Dembidollo sample varied
between 16.23 mg/100g and 56.34 mg/100g, which referred to DF and DR as the minimum
and maximum determinations respectively. The tannin content of DB was 26.73mg/100g and
the tannin content for DRD was 22.45mg/100g. A significant (P < 0.05) reduction of tannin
content was observed in all three processes, where the maximum reduction was observed by
fermentation process (71% reduction). The levels of tannin between the two samples were
differed significantly (P < 0.05). Dembidollo sample contain higher level of tannin than the
corresponding Nekemte sample. The decrease in the levels of tannin during boiling and
roasting might be due to thermal degradation and denaturation of the antinutrients as well as
the formation of insoluble complexes and leaching out of hydrolysable tannin in the boiling
water (Kataria et al., 1989). Reduction in tannin contents due to fermentation might have
been caused by the activity of polyphenoloxidase or tanniase of fermenting microflora on
tannins (Fagbemi et al., 2005). The tannins content of anchote flour in this study is quite less
than the tannins content reported by (Habtamu Fekadu, 2011). Anchote flour samples from
the two regions could be considered safe with regard to tannin, since the tannin content is far
below the total acceptable tannin daily intake for man, 560mg (Anonymous, 1973).
4.2.3 Oxalate
The results for oxalate analysis of the raw and processed samples of anchote indicated that
the levels of oxalate in Nekemte sample ranged in between 2.45 and 6.56mg/100g. Raw
sample (NR) had oxalate content of 6.56mg/100g and the fermented sample (NF) had
2.45mg/100g oxalate content. The oxalate contents of NB and NRD were 4.21 and
3.65mg/100g respectively. The oxalate content of the samples collected from Dembidollo
regions were 7.32, 4.13, 3.74, and 2.67 in mg/100g for DR, DB, DRD, and DF respectively.
All three processes reduced significantly (P < 0.05) the oxalate content in both samples. The
maximum oxalate reduction was observed by fermentation, which was 63% for both samples.
Fermenting and boiling may cause considerable cell rupture and facilitate the leakage of
soluble oxalate into fermenting and cooking water (Albihn and Savage, 2001). The oxalate
content of the present study is comparable to the oxalate content recorded by (Habtamu

Page 55
Fekadu, 2011) which is 8.23mg/100g for raw anchote sample and 4.66mg/100g for boiled
anchote sample. The lethal level of oxalate in man is 3-5g as reported by Balogoplan C., et
al. (1998), so the oxalate levels of anchote samples in the present study is very low, which
will not result a serious harm.
4.2.4 Cyanide
Cyanide either in synthetic inorganic forms as in KCN or NaCN, or organic forms as in
cyanogenic glucosides, is a potent specific inhibitor of several enzyme-catalyzed processes
(Aletor, 1993). The results of cyanide levels are displayed in table 4.3. For Nekemte sample
the determinations were 5.32, 4.39, 4.03 and 2.78mg/100g for NR, NB, NRD, and NF
respectively. All processes reduced significantly (P < 0.05) the cyanide level. The maximum
cyanide reduction was 48% by fermentation for Nekemte sample.
The cyanide levels for the corresponding anchote sample from Dembidollo were
6.06mg/100g for DR, 4.22mg/100g for DB, 4.6mg/100g for DRD and 3.01mg/100g for DF.
Again with Dembiollo sample all the three processes reduced significantly (P < 0.05) the
cyanide. The maximum reduction of cyanide for dembidollo sample was by fermentation and
it was 50%. The results obtained showed that the processed anchote tuber could be
considered safe with regard to cyanide poisoning due to the fact that the cyanide levels were
far below the detrimental levels of 50 to 200mg (Kingsbury, 1964). The cyanide
concentration in the present study is lower than the report of Habtamu Fekadu (2011), who
recorded 12.67mg/100g for raw anchote and 11.14mg/100g for boiled anchote sample.

Page 56
Table 4.3 Antinutritional factors of raw and processed anchote flour
Sample
Type
Phytate
(mg/100g
Tannin
(mg/100g)
Oxalate
(mg/100g)
Cyanide
(mg/100g)
NR 20.65±0.4257c 50.19±0.2179b 6.56±0.3219b 5.32±0.2706b
NB 14.54±0.2931d 21.76±0.3483e 4.21±0.2358c 4.39±0.3764c
NRD 13.67±0.3451e 19.82±0.3341f 3.65±0.4004d 4.03±0.3439c
NF 9.34±0.2893h 13.87±0.2835h 2.45±0.2910e 2.78±0.4875d
DR 33.06±0.1513a 56.34±0.2498a 7.32±0.2787a 6.06±0.1513a
DB 22.21±0.2718b 26.73±0.2163c 4.13±0.2651cd 4.22±0.3940c
DRD 21.65±0.5011b 22.45±0.3439d 3.74±0.1868cd 4.6±0.4371c
DF 11.45±0.3242g 16.23±0.2910g 2.67±0.2464e 3.01±0.4687d
All values are the means of triplicates ± standard deviation.
Means with the same superscript letters within a column are not significantly different (P>0.05)
Key: NR- Nekemte raw, DR-Dembidollo raw, NB -Nekemte boiled, DB-Dembidollo boiled, NRD-Nekemte
roasted, DRD-Dembidollo roasted, NF-Nekemte fermented, DF-Dembidollo fermented, a,b,c,d,e …. are
superscripts given to show the significant difference between means, a > b > c > d….
All values are expressed in (mg/100g) of dry weight basis of edible portion
4.3 Physicochemical properties of anchote flour
The physicochemical properties of raw and processed anchote flours are presented in Table
4.4. All results except peel percentage are based on dry weight basis of edible portions of
anchote.
• Tuber size and peel percentage
The average tuber sizes of both samples were determined .The average tuber sizes of
Nekemte sample were from 50.5 to 324g and the sample collected from Dembidolo regions
were in the range of 55.6 to 315g. The peel percentage was determined and it was 6.1 and
6.2% on wet weight basis for Nekemte and Dembidollo samples respectively.

Page 57
• pH value
Table 4.4 shows the results of PH values of the raw and processed anchote of the two
samples. The PH for Nekemte anchote was in the range of 4.7 and 6.2 where as that of
Dembidolo varied between 4.8 and 6.4. For Nekemte sample the maximum PH value
corresponded with NR and NB (6.2) and the minimum PH value belonged to NF (4.7) while
the NRD (5.6) had intermediate PH value. Roasting and fermentation had a significant effect
(P < 0.05) on the PH value of Nekemte sample. Boiling had no significant effect (P > 0.05)
on the PH values of Nekemte sample. For Dembidolo sample the PH values were DR (6.4),
DB (6.3), DF (4.8) and DRD (5.6). From the result it was observed that all the three
processing had a significant effect (P < 0.05) on the PH values of the Dembidolo flour
sample of anchote. Fermentation reduced the PH values of both samples by 25%; this is due
to the fact that during fermentation some of the sugar present in anchote is converted to
acids. Acid production during anchote fermentation might be attributed to the activities of the
lactic acid bacteria on the carbohydrates of the anchote root (Oyewole, 1990) that results in
the formation of lactic acid and formic acid where the formation of these acids in turn
increases the rate of acid tolerant microorganisms such as Geotriccum Candida that converts
lactic acid in to aldehydes and eaters developing a product of good aroma and flavor due to
the formation of these organic compounds.
• Titratable acidity
The titratable acidity values of the raw and processed Nekemte sample, which are expressed
as percentage of lactic acid in the sample, ranged of 0.182 and 0.358%, where the lower
value belonged to the raw Nekemte anchote sample and the higher for the fermented sample.
The titratable acidity of NB and NRD were 0.187 and 0.270% respectively. With the same
trend the titratable acidity for the Dembidolo samples were between 0.114 and 0.323%.
Again the maximum (0.323%) was for fermented sample and the minimum (0.114%) for raw
Dembidollo sample. The values for DB and DRD were 0.145 and 0.236% respectively. All
the three processes had a significant effect (P < 0.05) on the titratable acidity of both
samples. Fermentation had a more significant effect on titratable acidity of both anchote
samples than other processing methods, which is evident that fermented foods have higher
lactic acid content and lower PH values.

Page 58
• Water activity
The results for the water activity of the flours of anchote are displayed in table 4.4. The
anchote sample from Nekemte had values ranged from 0.390 to 0.492.The maximum value
was for NF and the minimum for NB. The water activity of NR was 0.406 and NRD had a
water activity of 0.466. All processing methods had a significant effect (P < 0.05) on the
water activity of Nekemte flour sample. In Dembidollo anchote sample the water activity
values varied from 0.415 to 0.502. Again the maximum corresponded to DF and the
minimum to DB. The water activities of DR and DRD were 0.480 and 0.487 respectively.
The Dembidolo samples were affected significantly (P < 0.05) by the three processing
methods.
Table 4.4 Physicochemical properties of raw and processed anchote flour
Sample
Type
Properties
PH Tuber
Size(g)
Peel percentage
(%), wwb
Water Activity Titratable Acidity
(%)
NR 6.2±0.1b 50.5-324 6.1 0.406±0.0031f 0.182±0.0021cd
NB 6.2±0.1b x x 0.390±0.0030g 0.187±0.0099c
NRD 5.6±0.1c x x 0.466±0.0031d 0.270±0.0076b
NF 4.7±0.1d x x 0.492±0.0025b 0.358±0.0111a
DR 6.4±0.2a 55.6-315 6.2 0.480±0.0040c 0.114±0.0098e
DB 6.3±0.1b x x 0.415±0.0025e 0.145±0.0115de
DRD 5.7±0.1c x x 0.487±0.0040b 0.236±0.0164b
DF 4.8±0.1d x x 0.502±0.0035a 0.323±0.0575a
All values are the means of triplicates ± standard deviation.
Means with the same superscript letters within a column are not significantly different (P > 0.05)
Key: NR- Nekemte raw, DR-Dembidollo raw, NB -Nekemte boiled, DB-Dembidollo boiled, NRD-Nekemte
roasted, DRD-Dembidollo roasted, NF-Nekemte fermented, DF-Dembidollo
a, b, c, d, e …. are superscripts given to show the significant difference between means, a > b > c > d….
All values are expressed in dry weight basis except peel percentage

Page 59
4.4 Functional properties of anchote flour
Functional properties of both raw and processed anchote flours obtained from the two
different places used in this study were determined. Table (4.5) shows the values of the
different functional properties. These are bulk density, water and oil absorption capacity,
foaming capacity, foaming stability, swelling power and solubility index.
� Bulk density
The bulk density of flour is important in relation to its packaging. The results of the bulk
density for the two flour samples are displayed in table 4.5. The bulk density values for the
anchote flour samples collected from Nekemte regions were 0.73, 0.75, 0.83,0.83 in g/ml for
NR, NF, NRD and NB respectively. These values shows that boiling and roasting had a
significant effect (P < 0.05) on the bulk densities of the Nekemte anchote flour and
fermentation had no significant effect (P > 0.05). Boiling and roasting increased significantly
(P < 0.05) the bulk density of Nekemte flour sample. For the anchote flour sample collected
from Dembidollo the values were in the range of 0.69 to 0.90g/ml. The maximum value
0.90g/ml belongs to DRD and the minimum value (0.69) corresponds to DR. DF and DRD
had values of 0.72g/ml and 0.78g/ml respectively. The results show that all the three
processing methods had a significant effect (P < 0.05) on the bulk density of Dembidollo
anchote flour. Generally anchote flour sample of Nekemte regions have higher bulk density
than anchote flours collected from Dembidollo regions. Having higher bulk density is an
advantage because it takes less packaging materials and hence less cost of packaging. Plaami
(1997) reported that bulk density is influenced by the structure of the starch polymers and
loose structure of the starch polymers could result in low bulk density. Bulk density is very
important in determining the packaging requirement, materials handling and application in
wet processing in the food industry (Karuna et al., 1996).
� Water absorption capacity
The water absorption capacity of raw and processed flours the two anchote samples is
presented in table 4.5. The water absorption capacity of anchote flour of Nekemte sample
ranged from 1.88 to 1.97ml/g which belonged to NF and NB representing the lowest and the
highest determinations respectively. The WAC of raw sample (NR) and roasted sample

Page 60
(NRD) were 1.93ml/g and 1.94ml/g respectively. The results shows that all three processes
had a significant effect (P < 0.05) on water absorption capacity of Nekemte anchote samples.
The water absorption capacity of Dembidolo samples ranged from 1.92 to 2.51ml/g which
belong to DF and DB samples, respectively. The raw sample, DR had a water absorption
capacity value of 2.19 ml/g and DRD had a value of 2.34ml/g. For Dembidolo anchote flour
all three processes had a significant effect (P < 0.05) on the WAC of the flour. Water
absorption capacity describes flour – water association ability under limited water supply.
Water binding capacity is a useful indication of whether flour or isolates can be incorporated
into aqueous food formulations (Udensi and Okoronkwo, 2006). From the results it was
shown that the anchote samples collected from Dembidollo had higher water absorption
capacity than the Nekemte anchote samples. Boiling increase WAC is probably due to the
loose structure of starch and removal of fat exposes the water binding sites of amino acids
(Adebowale et al 2005, Oladopo and Nwokocha, 2011). The decrease in WAC during
fermentation could be attributed to the increment in fat content, as fat block the hydrophilic
sites of amino acids and CHO.
� Oil absorption capacity
Oil absorption capacity (OAC) is another important functional property since it plays an
important role in enhancing the mouth feel while retaining the flavor of food products
(Kinsella, 1976). It has been reported that variations in the presence of non-polar side chains,
which might bind the hydrocarbon side chains of oil among the flours, explain differences in
the oil binding capacity of the flours (Adebowale & Lawal, 2004). The oil absorption
capacity of the anchote flour is given in table 4.5. The table shows that the OAC of Nekemte
anchote samples ranged from 1.1 to1.82 ml /g where it was maximum for NB and minimum
for NR. OAC of NRD was 1.13ml/g and NF had OAC of 1.80ml/g. Boiling and fermentation
has a significant effect (P<0.05) on the OAC of Nekemte anchote flour. It was observed that
roasted sample had no significant difference (P > 0.05) to the OAC of the raw Nekemte flour.
The OAC of Dembidolo anchote flour was varied between 1.73 to 1.82ml/g for DR and DF
respectively. In this sample, the oil absorption was found to be highest for DF (1.82 ml/g)
and minimum for DR (1.73ml/g). All three processes had shown a significant effect (P <
0.05) on the OAC of the Dembidolo anchote flour. It was observed also that the OAC of both

Page 61
samples of anchote showed a greater OAC than cassava studied before (Tilahun A., 2009)
which was in the range of 0.65 to 1.5ml/g. Values reported by Adane T., 2009, for the other
root crop, taro (OAC 0.9 to 1.63ml/g) is also showed less OAC than observed here in anchote
samples. Oil absorption is an important property in food formulations because fats improve
the flavor and mouth feel of foods (Odoemela, 2005). The increase in OAC of anchote flour
during fermentation and boiling might be attributed to structural modifications of residual
starch and protein (Tjahjadic, Lins, Breen WM, 1988) and also the presence of non polar side
chains which might bind th hydrocarbons side chains of oil among the flours (Adebowale and
Luwal, 2004).
� Foaming capacity
The foamability is related to the amount of solubilized protein (Narayana and Narasinga Rao,
1984) and the amount of polar and non-polar lipids in a sample (Nwokolo, 1985). It is also
dependent on the configuration of protein molecules (D.E. Graham, and M.C. Philips, 1976).
The results showed that the foaming capacity values of the Nekemte sample were 4.07, 2.1,
3.5, and 4.97ml/g. The maximum value corresponds with NF and the minimum for NB. The
intermediate values, 4.07ml/g and 3.5ml/g belong to NR and NRD respectively. The foaming
capacities of the Dembidolo sample were 3.93, 3.5, 4.40, and 1.5ml/g for DR, DRD, DF, and
DB respectively. All processing methods had a significant effect (P < 0.05) on the foaming
capacity. Roasting and boiling reduced the foaming capacity significantly (P < 0.05). The
reason for the reduction of foaming capacity during roasting and boiling is due to the fact that
proteins are denatured irreversibly that results the lower protein content which in turn reduce
foaming capacity. Foam formation and stability are a function of the type of protein, pH,
processing methods, viscosity and surface tension (Yasumatsu et al., 1972). The increase and
decrease of the foam capacity is due to the increase and decrease of the protein content due to
the processing. The foamability of flours has been shown to be related to the amount of
native protein. Native protein gives higher foam stability than the denatured protein. It is
related to the amount of solubilized protein (Odoemelam, 2005). Soluble proteins in general
play an important role in the formation of foam and this probably justify why legumes
exhibit higher foaming capacity (Mbofung et al., 2006). On the other hand fermentation
process increased the foam capacities on both samples significantly (P < 0.05). The most

Page 62
probable reason for an increase in the foaming capacity of flour is due to an increase in the
percentage of protein content by fermentation process. The low foam capacity may be
attributed to the low protein content of the flour since foamability is related to the amount of
solubilized protein and the amount of polar and non-polar lipids in a sample (Nwokolo,
1985). It was also showed that the anchote sample collected from Nekemte had higher
foaming capacity in comparison with Dembidolo sample; this was due to the reason that the
Nekemte sample had higher protein content than the corresponding Dembidollo sample.
� Foam stability
The foaming stabilities of two samples of anchote flour are presented in table 4.5 and the
values ranged from 0.36 to 2.70ml/g for Nekemte sample. The maximum determination was
obtained for NF and the minimum determination was found to be for NB. NRD and NR have
values of 1.07 and 2.03ml/g respectively. The foaming stabilities of Dembidollo sample were
determined to be 1.13, 0.11, 0.26 and 2.35ml/g for DR, DB, DRD, and DF respectively.
From the result, it was shown that fermentation increased significantly (P < 0.05) but boiling
and roasting reduced significantly (P < 0.05) the foaming stability in both samples. Foam
stability is important since the usefulness of whipping agents depend on their ability to
maintain the whip as long as possible (Lin et al., 1974).
� Swelling power
The swelling powers of the two flour samples were in the range of 9.36 to 12.58g/g as shown
in table 4.5. The values for Nekemte anchote flour were between 9.36 and 10.93g/g. The
highest swelling power (10.93g/g) was recorded to NB and the minimum was recorded for
NF. NR and NRD had 10.59 and 10.68g/g swelling powers respectively. The results for
Dembidolo sample were 11.88g/g (RD), 10.58g/g (BD), 12.39g/g (DRD), and 10.01g/g (DF).
These values were greater compared with other root crop, cassava, reported by T.Abera
(2009) studied in Ethiopia. All the three processing had a significant effect (P < 0.05) on the
swelling power of both samples of anchote flour. Boiling and roasting methods increased
significantly (P < 0.05) the swelling power of the anchote sample collected from the two
different regions of Ethiopia. Fermentation significantly reduced the swelling powers of the
samples. Swelling powers of the two samples were significantly (P < 0.05) different.
Page 63
Dembidollo sample had higher swelling power than the Nekemte sample; this may be
attributed to the inhibitory action of lipid (fat) on water as Dembidollo samples had lower fat
content than Nekemte anchote samples (table 5.1). As swelling refers to absorption of water,
it may be inhibited by the lipid content of the flour (Hood et al., 1998). The swelling power is
an indication of presence of amylase which influences the quantity of amylose and
amylopectin present in the anchote flour. Therefore, the higher the swelling power, the higher
the associate forces (Ruales et al, 1993). The variation in the swelling power indicates the
degree of exposure of the internal structure of the starch present in the flour to the action of
water (Ruales et al, 1993). Boiling enhances the WAC of the flours and hence increases the
swelling powers, as swelling power of starch-based flour is related WAC of the flour during
heating (Loos et al 1981).
� Solubility index
The results of the solubility index for the two samples are displayed in table 4.5. From the
table it was observed that the solubility indexes for the Nekemte sample were between 15.30
and 48.10%. The maximum was for the NR and the minimum for NF. The other values were
NB (43.38%) and NRD (36.87%).The results of Dembidolo sample were 41.55% (DR),
54.23% (DB), 63.29 % (DRD), and 13.18% (DF). The maximum solubility index was
observed for the roasted Dembidollo (DRD) sample and fermented Dembidolo sample (DF)
had the least solubility index. It was observed that all processes had a significant effect (P <
0.05) on the solubility index of the two samples of anchote flours. Boiling and roasting
reduced significantly (P < 0.05) the solubility index of the Nekemte sample and increased
significantly (P < 0.05) the solubility index of Dembidollo sample. Fermentation reduced
significantly (P < 0.05) the solubility index of both samples. As a direct result of flour
swelling, there is a parallel increase in the solubility of flour (Onitilo et al., 2007). High
solubility implies high leaching. The high water solubility of any sample analyzed may be
attributed to the degree of swelling power and swelling power and solubility of the flour
provide evidence of non-covalent bonding between molecules within the flour (Rasper,
1969).

Page 64
Table 4.5 Functional properties raw and processed anchote flour
All values are the means of triplicates ± standard deviation.
Means with the same superscript letters within a column are not significantly different (P>0.05)
NB: NR- Nekemte raw, DR-Dembidollo raw, NB -Nekemte boiled, DB-Dembidollo boiled, NRD-Nekemte roasted, DRD-Dembidollo roasted, NF-Nekemte
fermented, DF-Dembidollo fermented, Ca-calcium, Fe-iron, Zn-zinc, K-potassium, a, b, c, d, e …. are superscripts given to show the significant difference
between means, a > b > c > d….
All values are expressed in dry weight basis of edible portions of anchote
Sample
Type
Properties
BD(g/ml) WAC (ml/g) OAC(ml/g) Swelling
Power (g/g)
Solubility
Index (%)
Foam
capacity(ml/g)
Foam Stability
(ml/g)
NR 0.73±0.0185d 1.93±0.0058e 1.11±0.0223c 10.59±0.0010f 48.10±0.0208c 4.07±0.2082c 2.03±0.0757c
NB 0.83±0.0090b 1.97±0.0153d 1.82±0.0153a 10.93±0.0025d 43.38±0.2651d 2.10±0.1000f 0.36±0.1528e
NRD 0.83±0.0066b 1.94±0.0100de 1.13±0.0220c 10.68±0.0030e 36.87±0.0300f 3.5±0.1000d 1.07±0.0100d
NF 0.75±0.0085d 1.88±0.0100f 1.80±0.0100a 9.36±0.0030h 15.30±0.1539g 4.97±0.1528a 2.70±0.0100a
DR 0.69±0.0070e 2.19±0.0611c 1.73±0.0153b 11.88±0.0030c 41.55±0.0611e 3.93±0.1000c 1.13±0.0100d
DB 0.90±0.0148a 2.51±0.0100a 1.81±0.0153a 12.58±0.0010a 54.23±0.0902b 1.50±0.2000g 0.11±0.0100f
DRD 0.78±0.0108c 2.34±0.0300b 1.81±0.0208a 12.39±0.0030b 63.29±0.2138a 3.00±0.1000e 0.26±0.0100e
DF 0.72±0.0085d 1.92±0.0200ef 1.82±0.0153a 10.01±0.0031g 13.18±0.0513h 4.40±0.1528b 2.35±0.0643b

Page 65
4.5 Proximate and mineral compositions of anchote- wheat based biscuit
� Proximate compositions
The proximate compositions of the control biscuit and the 10% fermented anchote-wheat
blended biscuit (AWB1) selected based on high sensory acceptability were determined in the
analysis. The results are displayed in table 4.7 below. The protein contents were found to be
8.92% and 9.1% for the control biscuit (WB) and the blended biscuit (AWB1) respectively.
The fat percentage varied from 12.34 to 12.37% with incorporation of 10% fermented
anchote flour. The percentage compositions of ash were found to be 1.12 and 1.43% for WB
and AWB1 respectively. With the same trend the crude fiber content was between 0.34 and
0.59%. A significant (P < 0.01) increase of ash and crude fiber contents were observed with
10% substitution of wheat flour with anchote flour. This is due to the fact that anchote is
known for its higher mineral and crude fiber content (Table 4.1). But no significant effect on
protein and fat contents were observed between the two biscuits. The reason for no
significant difference of protein and fat contents was due to the fact that fermented anchote
and wheat flour had similar protein and fat contents.
Table 4.6 Proximate compositions of biscuit recipe
Constituents Fermented anchote flour Wheat flour
Protein 10.68±0.2007a 9.43±0.3831b
Fat 1.32±0.0361a 1.11±0.0324b
Crude fiber 2.83±0.1587a 0.51±0.05743b
Ash 4.21±0.2400a 1.07±0.0465b
Moisture 6.86±0.0917b 10.34±0.2578a
Carbohydrate 74.1±0.2498b 77.54± 0.2577a
All values are the means of triplicates ± standard deviation.
Means with the same superscript letters within a row are not significantly different (P>0.05)
All values are expressed in dry weight basis of edible portions of anchote
Key: a, b, c, d, e …. are superscripts given to show the significant difference between means, a > b > c > d….

Page 66
Table 4.7 Proximate compositions of anchote- wheat based biscuit
Constituents Control
biscuit(WB)
AWB1
Protein 8.92 ± 0.1345a 9.1 ± 0.1513a
Fat 12.34 ± 0.4521a 12.37 ± 0.3315a
Ash 1.12 ± 0.0557b 1.43 ± 0.1153a
Crude fiber 0.34 ± 0.0721b 0.59 ± 0.1058a
Moisture 4.04 ± 0.0173a 3.94 ± 0.0200b
Carbohydrates 73.24 ± 0.7544a 72.57 ± 0.4444a
All values are the means of triplicates ± standard deviation.
Means with the same superscript letters within a row are not significantly different (P > 0.05)
All values are expressed in dry weight basis of edible portions of anchote
Key: WB-whole wheat biscuit, AWB1- 10% fermented anchote-wheat biscuit, a, b, c, d, e …. are superscripts
given to show the significant difference between means, a > b > c > d….
� Mineral compositions
Mineral compositions of the control and 10% anchote-wheat biscuits were evaluated. All the
minerals under considerations were found to be increased significantly (P < 0.05) with
incorporations of anchote flour on wheat flour biscuits. The K contents were significantly
increased (P < 0.01) by 51% with 10% replacement of wheat flour with anchote flour. The
Ca contents were found to be 31.45mg/100g for control biscuit and 112.39mg/100g for
AWB1. Ca content was found to be significantly increased (P < 0.01) with 10% anchote flour
replacement. The percentage increase in Ca was 250%, which was an evident that anchote is
an ample source of Ca. Six-fold increase in Fe content was also observed, which was evident
that anchote flour has higher amount of Fe compared to wheat flour. A three-fold increment
in Zn content was also recorded.

Page 67
Table 4.8 Mineral compositions of anchote-wheat based biscuit
Minerals (mg/100g) K Ca Fe Zn
Control biscuit(WB) 153.27±0.6940b 31.45±0.6223b 0.61±0.09135b 0.42±0.0917b
AWB1 231.56±0.4603a 112.39±0.6471a 4.38±0.4543a 1.64±0.3651a
All values are the means of triplicates ± standard deviation.
Means with the same superscript letters within a column are not significantly different (P>0.05)
All values are expressed in dry weight basis of edible portions of anchote
Key: Ca-calcium, Fe-iron, Zn-zinc, K-potassium, a, b, c, d, e …. are superscripts given to show the significant
difference between means, a > b > c > d….
4.6 Sensory qualities of anchote-wheat biscuit
Color and flavor
Color is very important parameter in judging properly baked biscuits. It doesn’t only reflect
the suitable raw material used for the preparation but also provides information about the
formulation and quality of the product (Hussain, et al., 2006). As it can be seen from table
4.8 color has been observed to be significantly affected by blend proportion.
A decrease in the acceptability of the biscuit color was observed with an increase in the
amount of anchote in the blend. The color of the 10% anchote flour was found superior than
the rest of the blends scoring 7.12. This result was not significantly (P > 0.05) different from
the control biscuit signifying that replacement of wheat flour with anchote flour up to 10 %
didn’t bring a difference on the acceptability of the biscuits with respect to color.
Flavor is the main criterion that makes the product to be liked or disliked. Flavor, as color,
was observed to be affected significantly (P < 0.05) by blend proportion. The mean flavor
score of the biscuits was found to decrease with an increase in the proportion of anchote flour
in the biscuit. As with color, 10 % anchote flour biscuits were observed not to be
significantly (P < 0.05) different from the control biscuits with respect to flavor. Moreover,
means of flavor scores had exhibited similar scores and statistical interpretation to color.

Page 68
Crispiness
Crispiness was found to be affected significantly (P < 0.05) by blend proportion. Crispiness
was observed to decrease with an increase in the anchote flour proportion in the biscuits. As
with flavor and color, biscuits of 10% anchote flour were observed to not be significantly
different from the control biscuits. But the other two blends, 20 and 30% anchote flour were
found to be significantly different from the control and they were not acceptable.
Overall acceptability
Overall acceptability was affected significantly (P < 0.05) by blend proportion. A decrease in
the acceptability was observed with an increase in the amount of anchote flour in the
composite flour biscuits.
According to the analysis of the means, overall acceptability of 10% anchote flour biscuits
was not significantly different from the control. Moreover, the average mean score of overall
acceptability of 10% anchote flour biscuit was well above 7 (like moderately) suggesting that
it was well above minimum acceptable score. Therefore, as with all other sensory parameters,
supplementation of anchote flour up to 10% was observed to not have a significant difference
with wheat flour biscuits (control) with respect to overall acceptability. The other two blend
biscuits were observed to be significantly different from the control and their mean score was
observed to be below the minimum acceptable score (7, like moderately).
In general, the mean score of the overall acceptability of the biscuits ranged from 4.34 of the
30% anchote flour to 7.52 of the 10% anchote flour biscuits. These results very clearly
indicated that anchote flour can be used to replace a small portion of the wheat flour for
biscuit.

Page 69
Table 4.9 Sensory characteristics of anchote- wheat based biscuit
Sensory Qualities
Blend proportion
(WF : AF)
Color Flavor Crispiness Overall
acceptability
Control (100 : 00) 7.23±0.1436a 7.52±0.4264a 7.64±0.3486a 7.52±0.2638a
90 : 10 7.12±0.2311a 7.73±0.1991a 7.53±0.3752a 7.21±0.2463a
80 : 20 5.32±0.1149b 5.92±0.1278b 5.97±0.1963b 5.65±0.3186b
70 : 30 3.13±0.1875c 4.68±0.4376c 4.86±0.3486c 4.34±0.2179c
All values are the means of triplicates ± standard deviation
Means with the same superscript letters within a column are not significantly different (P > 0.05)
Key: WF-wheat flour, AF-fermented anchote flour, a, b, c, d, e …. are superscripts given to show the significant
difference between means, a > b > c > d….
a) AWB1 b) AWB2 c) AWB3
Fig 4.2 Biscuit made from anchote - wheat composite flour

Page 70
CHAPTER FIVE
SUGGESTED TECHNOLOGY FOR BISCUIT PRODUCTION
5.1 Biscuit-making procedure
Biscuits were prepared using fermented anchote flour, soft wheat flour and other ingredients
like sugar, shortening, ammonium bicarbonate and salt according to a commercial
formulation and baking practice of Kality Food Share Company. The dough was prepared by
blending fermented anchote flour and wheat flour with other ingredients and mixing it in
mixer (Model G.P.A. Orlandi mixer, Italy). The dough was removed from the mixer and
allowed to rest for 5 min. After that, the dough was sheeted using a sheeting machine
(Model: G.P.A. Orlandi sheeter, Italy) and flattened using roller into a sheet of about 1.5mm,
and then cut into circular pieces measuring 3.8cm in diameter. Samples were baked in an
electric convection oven (model G.P.A. Orlandi oven, Italy) at 1700C for 5 min, and were
allowed to cool for about 15 min on a rack. Then the biscuits are ready for packaging and
distribution.

Page 71
5.2 Material and energy balance
5.2.1 Material balance to prepare anchote flour
During washing, peeling and slicing of anchote root 6.4% is removed in the form of peels,
dusts, roots.
1000kg of Anchote Slices 936 kg
Peels, dusts, roots, water 64 kg
During the next unit operation, drying, the total loss in the form of water vapor accounts
50.1% of the initial weight.
Sliced mass 936 kg Dried anchote 435 kg
501 kg of moisture
The last stage was milling, at this stage there was 2.8% loss of the total weight. Finally the
anchote flour obtained from 1000 kg of anchote root was 407 kg which is 40.7% of the total
weight.
Dried Anchote Flour 435kg 407 kg of Anchote flour
Over sieve size 28kg
Milling and Sieving
Washing, Peeling and slicing
Drying

Page 72
5.2.2 Material balance for anchote-wheat biscuit preparation
� Assumptions for the production of biscuit
Ø The plant is working for 300 days per year and 16 hrs per day
Ø Dough moisture content is 25%
Ø Final biscuit moisture content = 3.94%
Ø Dry matter content of biscuit = 96.06%
Ø Production capacity of a machine is 5000kg /day so in order to calculate in an hourly basis,
divided its production capacity by 16 hrs
= = 312.5kg/hr
� Material balance during cooling and packaging of biscuit
Assummption: processing loss - 5%
Processing loss (0.05 × 312.5kg/hr =15.62kg/hr))
Biscuit leaving from oven (A) 312.5kg/hr
Moisture leaving from biscuit (B)
Moisture = 7% Moisture =3.94%
Dry matter content = 93 Dry matter content = 96.06%
General A = B + 15.62 kg/h + 312.5 kg/hr
A – B = 328.12kg/hr - - - - - - - - - - - - - - - - - - - - - - - - (1)
Moisture (A × 0.07) – B = 312.5kg/hr × 0.0394 + 15.62kg/hr × 0.0394
(A × 0.07) – B = 12.93kg/hr - - - - - - - - - - - - - - - - - - - - (2)
Substituting equation 1 into equation 2
(328.12kg/hr + B) × 0.07 – B = 12.93kg/h
Cooling and packaging

Page 73
0.93B = 10.04kg/hr
B = 10.8kg/h
B = 10.8kg/hr - - - - - - - - - - - - - - - - - - - - - - - - - - - - - - - (3)
Substituting equation 3 in to equation 1
A = B + 15.62 + 312.5
A = 338.92kg/hr - - - - - - - - - - - - - - - - - - - - - - - - - - - - - (4)
Dry matter
A × y = 312.5 × 0.9606 + 15.62 × 0.9606
A × y = 315.2
y = 93% - - - - - - - - - - - - - - - - -- - - -- - - -- - - - - - - - - - - (5)
� Material balance during baking (oven drying) of biscuit
Sheeted and laminated A (338.92kg/h)
Dough (C)
Moisture = 25% Water vapor (Wv) Moisture = 7%
Dry matter = x Dry matter content = 93%
General C = Wv + 338.92kg/hr - - - - - - - - - - - - - - - - - - - - - - - - - - - - (1)
Moisture C × 0 .25 = Wv + 338.92kg/hr × 0.07
C × 0.25 = Wv + 23.72kg/hr - - - - - - - - - - - - - - - - - - - - - - - - (2)
Dry matter C × x = 338.92kg/h × 0.93 - - - - - - - -- - - - - - - - - - - - - - - - - - (3)
Substituting equation 1 into equation 2
(Wv + 338.92kg/h) × 0.25 = Wv + 23.72kg/h
0.25 Wv + 84.73kg/h = Wv + 23.72kg/h
0.75 Wv = 61.01kg/h
Wv = 81.35 kg/hr - - - - - - -- - - - - - - - - - - - - - - - - - - - - - - - (4)
Substituting equation 4 into equation 1
C = Wv + 338.92kg/h
C = 81.35kg/hr + 338.92kg/h
Oven

Page 74
C = 420.27 kg/hr - - - - - - - - - - - - - - - - - - - - - - - - - - - - - - - (5)
Substituting equation 5 into equation 3
C × x = 338.92kg/h × 0.93
420.27 × x = 338.92kg/h × 0.93
x = 75% - - - - - - - - - - - - - - - - - - - - - - - - - - - - - - - - - - - - - - ( 6)
� Material balance during sheeting and laminating
Dough Mass (D) C (420.27 kg/h)
Moisture content = w Moisture = 25 %
Dry matter content = z Dry matter content = 75%
General D = 420.27 kg/hr
Moisture D × w= 418.78 × 0.25
w = 25%
Dry matter D × z = 418.78 × 0.75
z = 75%
� Material balance during mixing of ingredient
Flour and other recipe (M) D (420.27kg/h)
General M = 420.27kg/h
Sheeting & laminating
Mixing
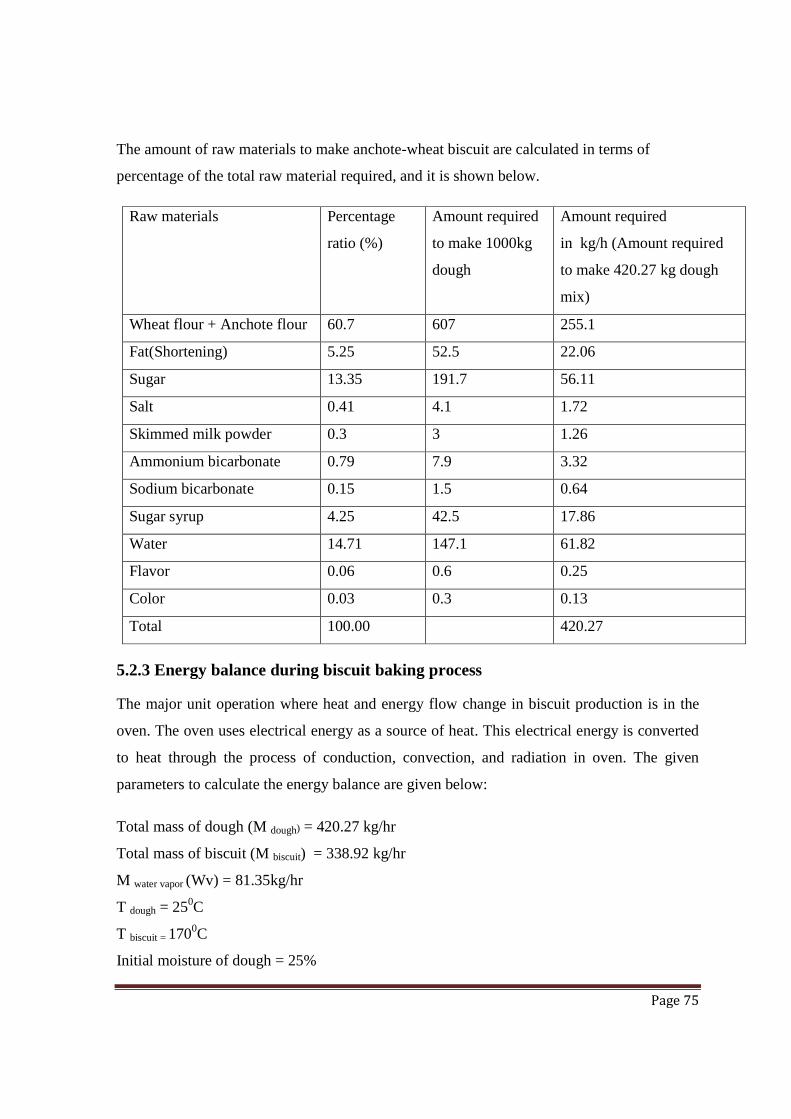
Page 75
The amount of raw materials to make anchote-wheat biscuit are calculated in terms of
percentage of the total raw material required, and it is shown below.
Raw materials Percentage
ratio (%)
Amount required
to make 1000kg
dough
Amount required
in kg/h (Amount required
to make 420.27 kg dough
mix)
Wheat flour + Anchote flour 60.7 607 255.1
Fat(Shortening) 5.25 52.5 22.06
Sugar 13.35 191.7 56.11
Salt 0.41 4.1 1.72
Skimmed milk powder 0.3 3 1.26
Ammonium bicarbonate 0.79 7.9 3.32
Sodium bicarbonate 0.15 1.5 0.64
Sugar syrup 4.25 42.5 17.86
Water 14.71 147.1 61.82
Flavor 0.06 0.6 0.25
Color 0.03 0.3 0.13
Total 100.00 420.27
5.2.3 Energy balance during biscuit baking process
The major unit operation where heat and energy flow change in biscuit production is in the
oven. The oven uses electrical energy as a source of heat. This electrical energy is converted
to heat through the process of conduction, convection, and radiation in oven. The given
parameters to calculate the energy balance are given below:
Total mass of dough (M dough) = 420.27 kg/hr
Total mass of biscuit (M biscuit) = 338.92 kg/hr
M water vapor (Wv) = 81.35kg/hr
T dough = 250C
T biscuit = 1700C
Initial moisture of dough = 25%

Page 76
Temperature of dough after mixing (T ref) = 250c
Temperature of dough before entering to oven (T 1) = 300c
Assume Temperature of biscuit when it go out of oven (T2) =1700C
Final moisture content of biscuit = 7%
Latent heat of evaporation for water at 1000c (λ) = 2257kJ/kg
Composition of dough (M = 25, P = 8.11, F = 6.72, CHO = 59.23, and A = 0.94)
Composition of biscuit (M = 3.94, P = 9.1, F = 12.37, CHO=72.57, and A=1.43)
C p dough = 1.424Xc + 1.549Xp+1.675Xf + 0.837Xa+4.187Xw (kJ/kg.k)
C p dough = 1.424(0.5923) + 1.549(0.0811) + 1.675(0.0672) + 0.837(0.0094) + 4.187(0.25)
C p dough = 2.14kJ/ kg.k
C p biscuit = 1.424Xc+ 1.549Xp+ 1.675Xf + 0.837Xa + 4.187Xw (J/kg.k)
C p biscuit = 1.424(0.7257) + 1.549(0.091) + 1.675(0.1237) + 0.837(0.0143) + 4.187(0.0394)
C p biscuit = 1.56 J/ Kgk
Q water vapor
Q feed Q product
Q electrical heating
General
Q feed + Q electric heating = Q water vapor + Q product - - - - - - - - - - - - - - - - - - - - - - - - - - - -- - - - (1)
Q feed = M dough CP dough (T feed-T ref)
= 420.27 kg/hr x 2.14kJ/ kg.k × (30-25) k
= 2.48 × 10⁶J/hr - - - - - - - - - - - - - - - - - - - - - - - -- - - - - - - - - - - - - - - - (2)
Q product = M product C p product(T2 – T1)
= 338.92 kg/hr × 1.56 kJ/ kg.k (170-30) k
Oven

Page 77
= 7.40 × 10 7J/hr - - - - - - - - - - - - - - - - - - - - - - - - - - - - - - - - - - - - - - (3)
Q water vapour = M water vopour × λ water vapour ( at 1000C)
= 81.35kg/hr × 2257kJ/kg
= 1.836 × 10⁸ J/hr - - - - - - - - - - - - - - - - - - - - - - - - - - - - - - - - - - - - - - (4)
Substituting equation 2, 3, & 4 into equation 1
Q feed + Q electric heating = Q water vapour + Q product
Q electric heating = Q water vapour + Q product – Q feed
= 1.836 × 10⁸J/hr + 7.40 × 10 7J/hr – 2.48 × 10⁶J/hr
= 2.6 × 10⁸ J/hr - - - - - - -- - - - - - - - - - - - - - - - - - - - - - - - - - - - - - - - - (5)
5.3 Economic analysis of the study
Given Plant parameters
• Capacity, tons per year 1500 ton per year
• Number of shifts /day 2
• Working days/year 300
• Land area/ covered, m2 1500
� Machinery and equipment cost
If the cost of a piece of equipment or plant of size or capacity q1 is C1, then the cost of a
similar piece of equipment or plant of size or capacity q2 can be calculated from C2=C1
(q2/q1 )n 2 (Robert H. Perry, 2007). Where the value of the exponent n depends on the type
of equipment or plant (Appendix II).

Page 78
Table 5.1 Major equipments delivered purchasing cost
SN Item Quantity Unit Price(birr) Total Price(birr)
1 Universal Mixer
420.27kg/h capacity
1 79,589.00 79,589.00
2 Flour sifter 1 58,566.00 58,566.00
3 laminator 1 52,000.00 52,000.00
4 Rotary cutting
machine
1 33,000.00 33,000.00
5 Electric band oven -
size 25m
1 187,198.00 187,198.00
6 Cooling conveyer -
size 10m
1 13,200.00 13,200.00
7 Work conveyer – size
10m
1 19,566.00 19,566.00
8 Heat sealer 2 32,567.00 65,134.00
9 Delivery vehicle 1 500,000.00 500,000.00
10 Water tank(6000L) 1 8,456.00 8,456.00
11 Water tank(10,000L) 1 10,000.00 10,000.00
12 Water tank(15,000L) 1 13,489.00 13,489.00
13 Weighing scale 1 31,234.00 31,234.00
14 Contingencies on equipment (15 %)
136,630.00 141,215.00
Total 13 1,047,495.00 1,232,146.80
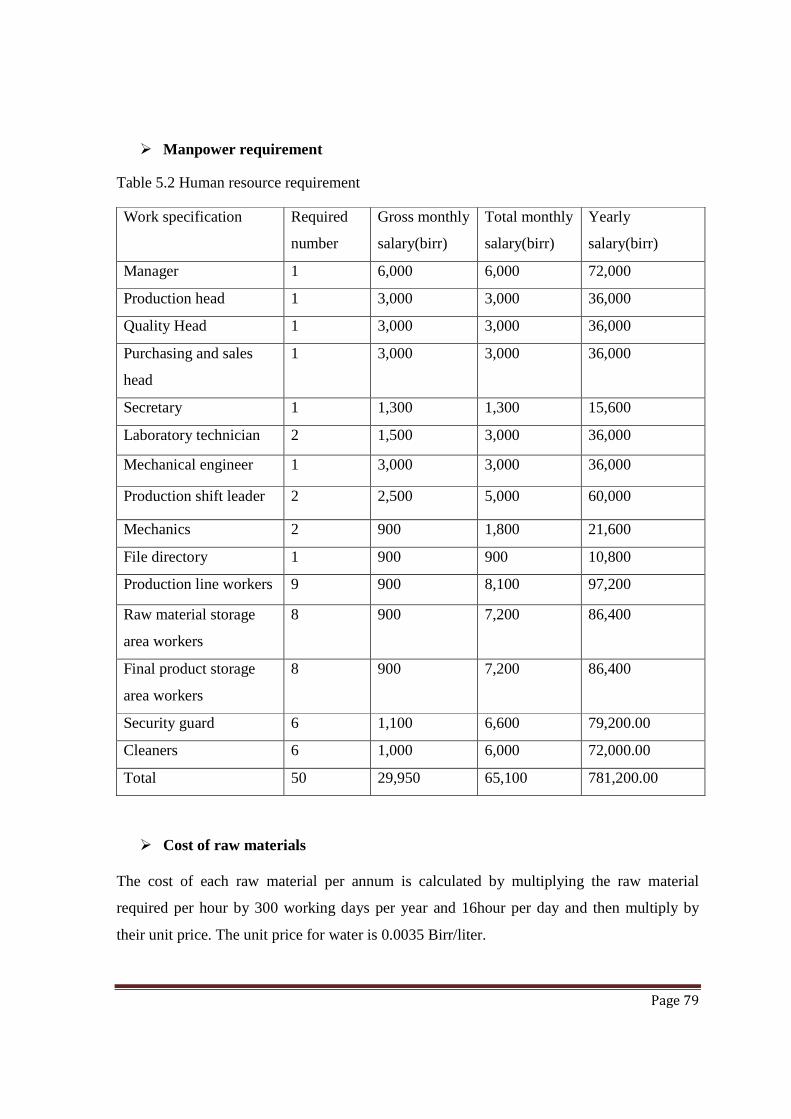
Page 79
� Manpower requirement
Table 5.2 Human resource requirement
Work specification Required
number
Gross monthly
salary(birr)
Total monthly
salary(birr)
Yearly
salary(birr)
Manager 1 6,000 6,000 72,000
Production head 1 3,000 3,000 36,000
Quality Head 1 3,000 3,000 36,000
Purchasing and sales
head
1 3,000 3,000 36,000
Secretary 1 1,300 1,300 15,600
Laboratory technician 2 1,500 3,000 36,000
Mechanical engineer 1 3,000 3,000 36,000
Production shift leader 2 2,500 5,000 60,000
Mechanics 2 900 1,800 21,600
File directory 1 900 900 10,800
Production line workers 9 900 8,100 97,200
Raw material storage
area workers
8 900 7,200 86,400
Final product storage
area workers
8 900 7,200 86,400
Security guard 6 1,100 6,600 79,200.00
Cleaners 6 1,000 6,000 72,000.00
Total 50 29,950 65,100 781,200.00
� Cost of raw materials
The cost of each raw material per annum is calculated by multiplying the raw material
required per hour by 300 working days per year and 16hour per day and then multiply by
their unit price. The unit price for water is 0.0035 Birr/liter.

Page 80
Table 5.3 Cost of raw materials
Particulars Quantity
per hour
(kg/h)
Quantity
per day
(kg/day)
Quantity per
annum
(kg/year)
Unit price
(birr/kg)
Total cost
(birr/kg)
Wheat flour 229.6
3673.6 1,102,080
11 12,122,880.0
0
Anchote
flour
25.5 408 122,400
11 1,468,800.00
Shortening 22.06 352.96 105,888 25.00 1,270,656.00
Sugar 56.11 897.76 269,328 14.50 3,231,936.00
Salt 1.72 27.52 8,256 3.00 99,072.00
Flavor 0.25 4 1,200 18.00 14,400.00
Sodium
bicarbonate
0.64 10.24 3,072
12.00 36,864.00
Ammonium
bicarbonate
0.79 12.64 3,792
12.00 45,504.00
Skimmed
Milk
Powder
1.26
20.16 6,048
50
72,576.00
Water 61.82 989.12 296,736 0.0035 1,039.00
Total
399.75 6396 1,918,800
18,363,727.0
0
� Cost of utility
The water required for the production of biscuit includes the water required for the main
production line, for laboratory, for cleaning and others like for garage and for steam on
process line. The yearly water consumption of Kality food Share Company is 510,000 litters
and half of this is taken for this anchote-wheat biscuit production plant. The packaging
material for the biscuit has a capacity of 250gm per pack. The yearly production of 1,500,000
(312.5 × 16 × 300) kilogram per year and it requires 6,000,000 packs per year.

Page 81
Table 5.4 Cost of utilities
Utilities Quantity per
annum
Unit price (Birr) Total cost (Birr)
Electricity (Kwh) 346,666.7 0.51 176,800.00
Water (L) 255,000 0.0035 892.00
Packing material
(packs)
6,000,000 0.7 4,200,000.00
Total 4,377,692.00
� Fixed capital cost estimation
The factors are based on the grass type processing industries and based on the data of H. C.
Bauman, Fundamentals of Cost Engineering in the Chemical Industry, Van Nostr and
Reinhold, New York, 1964, p. 295, for essentially carbon steel equipment. For, a given
company’s labor costs and material costs may inflate at different rates. To quite a large
extent, inflation becomes repressed, or differentiated, in such fields as taxation, import
control, and price restriction. The material and labor cost is estimated 5.27 times the sum of
equipment, installation, instrumentation, piping, and electrical cost. See appendix-III.
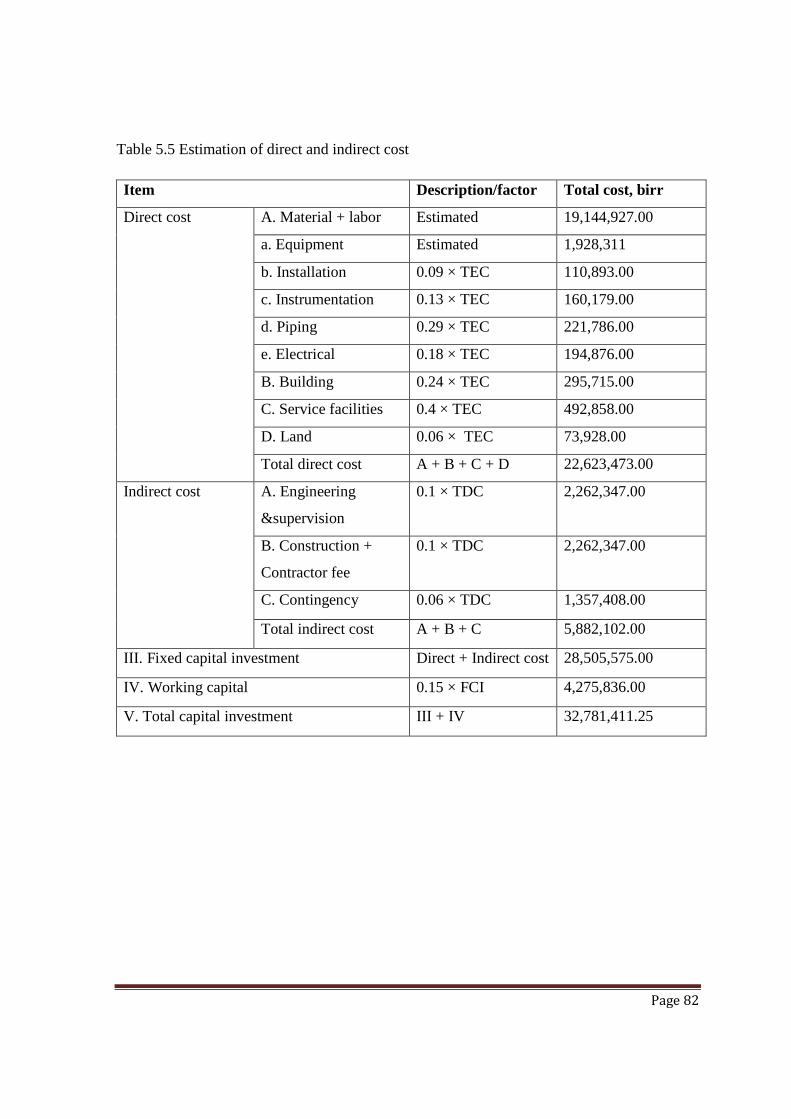
Page 82
Table 5.5 Estimation of direct and indirect cost
Item Description/factor Total cost, birr
Direct cost A. Material + labor Estimated 19,144,927.00
a. Equipment Estimated 1,928,311
b. Installation 0.09 × TEC 110,893.00
c. Instrumentation 0.13 × TEC 160,179.00
d. Piping 0.29 × TEC 221,786.00
e. Electrical 0.18 × TEC 194,876.00
B. Building 0.24 × TEC 295,715.00
C. Service facilities 0.4 × TEC 492,858.00
D. Land 0.06 × TEC 73,928.00
Total direct cost A + B + C + D 22,623,473.00
Indirect cost A. Engineering
&supervision
0.1 × TDC 2,262,347.00
B. Construction +
Contractor fee
0.1 × TDC 2,262,347.00
C. Contingency 0.06 × TDC 1,357,408.00
Total indirect cost A + B + C 5,882,102.00
ІІІ. Fixed capital investment Direct + Indirect cost 28,505,575.00
ІV. Working capital 0.15 × FCI 4,275,836.00
V. Total capital investment ІІІ + ІV 32,781,411.25

Page 83
Table 5.6 Estimation of total product cost
Item Description/factor Total cost, birr
І. Manufacturing cost
A. Fixed Charges
a. Depreciation 0.1×instrumentation + 0.02×building 21,932.00 b. Local taxes 0.02×FCI 570,111.00 c. Insurance 0.006×FCI 171,033.00 Total of A 763,076.00 B.Direct production cost
Total production cost (tpc)
Total fixed charge/0.15 5,087,173.00
a. Raw material Already estimated 18,363,727.00 b. Utilities 4,377,692.00 c. Operating labor (ol)
0.1×tpc 508,717.00
d. Supervisory 0.1×ol 50,871.00 e. Maintenance 0.05*FCI 1,425,278.00 f. Lab charges 0.12×ol 61,046.00 Total of B 29,874,504.00 C. Plant overheads
0.1×tpc 508,717.00
Total manufacturing cost
A + B + C 31,146,297.00
П. General Expenses a. Administrative cost
0.05×tpc 254,358.00
b. Distribution 0.1×tpc 508,717.00
c. R & D 0.05×tpc 254,358.00
d. Interest 0.05×tpc 254,358.00
Total general expenses
1,271,791.00
Total product cost І + П 32,418,088.00
Total product cost/kg of biscuit per year 21.61

Page 84
� Gross earnings
BEP = Break-even point (units of production)
ROR = Rate of return
Vcup = Variable costs per unit of production
Sup = Selling price per unit of production
TPC = Total product cost
DPC = Direct production cost
NP = Net profit
FCI = Fixed capital investment
Assuming that whole selling price of 1kg of biscuit =26birr
Expecting all produced biscuit will be sold
Total income = 26×1,500,000 = 39,000,000.00
Gross income = total income – total product cost …………………………………….. (5.1)
= 39,000,000.00 – 32,418,088.00 = 6,581,912.00 birr
Let the tax rate be 35% (income tax of Ethiopia)
Vat is 10% of gross income
The taxable is 30% of yearly income (gross income)
Taxable money = 30% × 6,581,912.00 birr = 1,974,573.6 birr
Taxes = 0.35×1,974,573.6 birr = 691,100.76 birr
Vat= 10%×6,581,912.00 = 658,191.2birr
Net profit = gross income – (tax + vat) ………………………………………………… (5.2)
= 6,581,912.00 – (691,100.76 + 658,191.2) birr
= 5,232,620.04 birr/year
Rate of return
ROR = × 100 = × 100 = 16% … (5.3)
Payback period = = = 5years …………….... (5.4)

Page 85
Breakeven point
V cup = = = 19.91birr/kg …………………. (5.5)
BEP = = = 417,665.7 kg/year ……. (5.6)
BEP (%) = = × 100 = 27.84% …………….. (5.7)
� Plant location
To select proper locations and sites, certain key requirements or criteria should be set, that
would allow the assessment of a number of potential locations, and the rejection of those not
fulfilling those requirements. It is assumed that the factory or plant is installed in the western
Ethiopia region where the production of Anchote is high and there is availability of utilities
such as water, electricity and other infrastructures in Nekemte area.

Page 86
5.4 Equipment layout of biscuit producing plant
Figure 5.1 Equipment layout of biscuit producing plant

Page 87
CHAPTER SIX
CONCLUSIONS AND RECOMMENDATIONS
6.1 Conclusions
The study attempted to investigate the effect of three processing methods (boiling, roasting
and natural fermentation) on nutritional composition, antinutritional factors, functional and
physicochemical properties of anchote flour and the possibility of using anchote flour for the
production of biscuit by blending with wheat flour.
From the results of the present study it was understood that anchote contains appreciable
quantity of carbohydrate, crude protein, crude fiber, calcium, potassium and iron. The results
of this study also showed that anchote contains low levels of antinutrients (phytate, tannin,
oxalate and cyanide) when compared to other root and tuber crops. Moreover, there were
further reductions of the antinutritional factors during processing. Additionally, it was
observed in the study that functional property of anchote flour is remarkably higher. Higher
water absorption capacity, oil absorption capacity, swelling power and solubility index than
other root crops flour was recorded. But the foaming capacity and stability was lower.
Evaluation of the three processing methods in terms of antinutrients reduction and nutrients
enrichments indicated that all the three processing method was found to be effective in the
reduction of antinutrients. Effect of natural fermentation was found to be highest in the
reduction. In relation to nutritional profile, the low protein content of both anchote flour
samples was observed to be increased by fermentation. Natural fermentation of anchote flour
is a more acceptable process as it is inexpensive, fuel efficient method and environmentally
friendly by which people can obtain good quality food and this process can only be
performed at their own homes. However, boiling and roasting were found to enhance most of
the functional properties of anchote flour. Fermentation enhances the foaming capacity of the
raw anchote flour.
Page 88
The results found also indicated that anchote flour could be blended with wheat flour to
produce biscuit with acceptable sensory qualities. It was found that the more the anchote
flour in the composite, the more the fiber and ash content of the biscuits. Incorporation of the
anchote flour up to 10% resulted in biscuit of comparable in sensory qualities with respect to
biscuits produced using 100% wheat flour (control biscuit). In regard to nutritional profile the
mineral content and crude fiber content of the control biscuit were improved substantially.
As per the results of this study, anchote-wheat flour biscuit are both nutritious and exhibited
acceptable sensory quality. Thus it could be concluded that the composite flour will reduce
our dependence in the wheat flour for the production of biscuit and other similar products.
The results of this study are good indicators of the possibility for better utilization of anchote
through developing variety of new food products.
6.2 Recommendations
Due to the low attention given to the research and development of anchote, there is no variety
so far developed and released. As anchote is an endemic and potential root crop, further
research should be done for the development and release of anchote variety. Cultivation of
anchote should be introduced to anchote non-growing areas of the country, as it is rich
sources of protein, carbohydrate, calcium, iron and potassium; it can play its role in ensuring
food security.
The following recommendations are made based on the experiences faced during the study
� In order to prevent the possible nutritional impacts on consumers of anchote from
other antinutritional factors, such as trypsin inhibitors, amylase inhibitors and others,
the crop should be investigated for these antinutritional factors.
� Analysis should be done for the vitamins and other minerals content of anchote
� Anchote is an excellent source of carbohydrate. Therefore it can be used as industrial
raw material for starch production. Determining the quality and quantity of starch
found in anchote could be one area which needs investigation.
Page 89
� Biscuit production from anchote-wheat composite flour should be given due emphasis
and processors should be encouraged to utilize the potential of anchote flour thereby
diversify their products for better income and service for the consumer.
� A comprehensive study on optimization of ingredient and baking condition and shelf
life stability of baked products of anchote blended with other cereals should be
conducted to come-up with complete and usable information.
� Studies should be done on other value added anchote based food products like
anchote supplemented cookies, breads and others and as it has medicinal importance
using the anchote flour for new functional and neutraceutical food products should
also be assessed.
Page 90
REFERENCE
Abera Hora (1995). Anchote: An Endemic Tuber Crop. Jimma College of Agriculture.
Jimma, Oromia, Ethiopia
Adane Tilahun and Shimelis Admasu (2009). Effect of Processing on Some Physicochemical
and Antinutritional Factors of Taro (Colocasia Esculenta (L.)Schott.) Cultivars Grown
In Ethiopia, MSc Thesis, Addis Ababa University, Addis Ababa, Ethiopia.
Adebowale KO & Lawal, OS (2004). Comparative study of the functional properties of
bambara ground nut, jack bean and mucuna bean flours. Food Res. Int 37: 355 – 364
Adeparusi, E. O. (2001). Effect of processing on the nutrients and antinutrients of lima bean
(Phaseolus lunatus L.) flour. Nahrung/Food, 4: 94-96
Agren, G. and Gibson, R. (1968). Food Composition Table for Use in Ethiopia I. Children
Nutrition Unit Report No. 16. Ethiopia
Albihn, P.B.E. and Savage, G.P. (2001). The effect of cooking on the location and
concentration of oxalate in three cultivars of New Zealand-grown oca (Oxalis tuberosa
Mol). J. of the Science of Food and Agric. 81: 1027–1033
Aletor, VA. (1993). Allelochemicals in plant foods and feeding stuffs. Part I. Nutritional,
biochemical, and physiopathological aspects in animal production. Vet. Human
Toxicol. 35(1):57-67
Amare Getahun (1976). Some common medicinal and poisonous plants used in Ethiopian
folk medicine. College of Natural Sciences, Addis Ababa University, Addis Ababa,
Ethiopia.
Amare Getahun (1973). Developmental Anatomy of Tuber of Anchote; A Potential Dry Land
tuber Crop. In: Godfrey-Sam-Aggrey,W. and Bereke Tsehai Tuku (Eds.). Proceedings:
First Ethiopian Horticultural Workshop, Feb.20-23, 1985, 2:313-323. Addis Ababa,
Ethiopia.

Page 91
Amsalu Nebiyu, Weyessa Garedew, Assefa Tofu, Wubishet Abebe, Asfaw Kifle and Edosssa
Etisa (2008). Variety development of taro, cassava, yam, and indigenous root and
tuber crops of Ethiopia. pp. 303-315. In: Gebremedhin Woldegiorgis, Endale Gebre
and Berga Lemaga (Eds). Root and Tuber Crops: The Untapped Resources. EIAR,
Addis Ababa, Ethiopia.-1
AOAC (1984). Association of Official Analytical Chemists. Official methods of Analysis
(14th edition) AOAC, International, Washington, DC, USA, Official methods 14.022
AOAC (1995). Official Methods of Analysis. Washington, DC: Association of Official
Analytical Chemists. August 1995. ICRAF-HQ, Nairobi, Kenya.
Beleia A, Thu,TL, Ida, EI. (1993). Lowering phytic phosphorus by hydration of soybean. J.
Food Sci., 58: 375-377, 388.
Bender, D.A. (2006). Benders’ dictionary of nutrition and food technology. Wood head
publitiong in food science, technology and nutrition. Eighth edition; Cambridge,
England
Brune M, Rossander-Hulthén L, Hallberg L, Gleerup A, Sandberg AS. Iron absorption from
proteins. J. Agric. Food Chem. 25: 258–261.
Buchat, L.R. (1977). Functional and electrophoretic characteristics of succinylated peanut
flour proteins. J. Agric. Food Chem. 25: 258–261.
Bula Sirika (2011). ‘Buna Qalaa’ A Quest for traditional uses of coffee among Oromo
people with special emphasis on Wallaga, Ethiopia. The African Diaspora
Archaeology Network, September 2011 Newsletter, pp. 1-18.
Butler, L.G. (1989). Effects of condensed tannins on animal nutrition. In: Chemistry and
significance of condensed tannins. (Editors: Hemingway, R.W. and J.J. Karchesy).
Plenum Press, New York, pp: 391- 402

Page 92
Butler,L.G., Price,M.L.,Brotherton J.E.(1982). Vanillin assay for Proanthocyanidins
(Condensed Tannins): Modification of the Solvent for Estimation of the Degree of
Polymerization. J.Agric.Food Chem., 30: 1087 -1089.
Coffman CW and Garcia VV. (1977).Functional properties and amino acid content of a
protein isolate from mungbean flour. J. Food Tech. 12:473–484
D.E. Graham, and M.C. Philips (1976). The conformation of proteins at the air-water
interface and their role in stabilizing foam. In Akers, R.J. (Ed.). Foams. (Academic
Press, New York, 1976), p. 237- 255.
D’Mello, J.P.F. (2000). Anti-nutritional factors and mycotoxins. In: Farm animal metabolism
and nutrition. CAB International Wallingford, UK, pp: 383-403
Desta Fekadu and Derbew B. (2009). Phenotypic and Nutritional Characterization of
Anchote [Coccinia Abyssinica (Lam.) Cogn] Accessions of Ethiopia. MSc thesis,
College of Agriculture and Veterinary Medicine, Jimma University
Edwards, S. (1991) Crops with wild relatives in Ethiopia. In: Engels, J.M.M., Hawkes, J.G.
and Melaku Worede (eds.), Plant Genetic Resources of Ethiopia. Cambridge
University Press.
EHNRI (1997). Food composition table for use in Ethiopia. Part III. Addis Ababa.
Eltayeb, M.M., Hassn B.A., Sulieman A.M. and Babiker, E.E. (2007). Effect of processing
followed by fermentation on antinutritional factors content of pearl millet (Pennisetum
Glaucum I.) cultivars. Pakistan J. of Nutrition, 6, 463-467
Endashaw Bekele (2007). Study on actual situation of medicinal plants in Ethiopia
[http://www.jaicaf.or.jp/en/publications/detail/article/119.html, accessed on April 3,
2012]
Fagbemi,T.N., Oshodi, A.A. and Ipinmoroti, K.O. (2005). Processing effects on some
antinutritional factors and in vitro multi-enzyme protein digestibility (IVPD) of three
Page 93
tropical seeds: breadnut (Artocarpus altilis), cashewnut (Anacardium occidentale) and
fluted pumpkin (Telfairia Occidentalis). Pakistan Journal of Nutrition, 4: 250-256
FAO, (1990). Roots, tubers, plantain and bananas in human, Nutrition. Food and Agriculture
Organization of the United Nations, (FAO), Rome Italy
Francis, G., Makkarb, H.P.S. and Becker, K. (2001). Anti-nutritional factors present in plant
derived alternate fish feed ingredients and their effects in fish. Review article.
Aquaculture, 199:197–227
Fufa, H and Urga, K. (1997). Nutritional and Antinutritional Characteristics of Anchote
(Coccinia Abyssinica), 1997; 11(2):163-168
Gepts, P. (2004). Crop domestication as a long-term selection experiment. In: Plant Breeding
Reviews, vol. 24 part 2 (Janick, J., ed.). John Wiley and Sons, Inc., pp. 1-44
Giami, S.Y., Achinewhu, S.C., & Ibaakee, C. (2006). The quality and Sensory Attributes of
Cookies Supplemented with Fluted Pumpkin (Telfairia occidentalis Hook) Seed Flour.
International Journal of Food Science & Technology, 40(6): 613-620
Greiner R, Konietzny U, and Jany KD. (2006). Phytate - an undesirable constituent of plant
based foods. J. für Ernährungsmedizin; 8 (3): 18-28
H. C. Bauman (1964). Fundamentals of Cost Engineering in the Chemical Industry for
essentially carbon steel equipment. Van Nostrand Reinhold, 295, New York
Habtamu Fekadu (2011). Effect of traditional processing methods on nutritional composition
and anti-nutritional factors of anchote (Coccinia Abyssinica (Lam.) Cogn) grown in
westerm Ethiopia. MSc. thesis, Food Science Program Unit, Addis Ababa University
Habtamu Fufa and Kelbessa Urga (1997). Nutritional and anti-nutritional characteristics of
anchote (Coccinia Abyssinica). Ethiop. J. Health Dev. 11(2): 163-168

Page 94
Haimanot Reta (2010). An ethinobotanical study of useful plants of the farming site in
Gozamen woreda, East Gojam Zone, Ethiopia. MSc. thesis, Biology Dep’t, Addis
Ababa University
Helsper, J.P., J.M. Hoogendijk, A. Van Norel and K. Burger-meyer (1993). Antinutritional
factors in faba beans (Vicia faba L.) as affected by breeding toward the absence of
condensed tannins. J. Agric. Food Chem., 41: 1058-1061
Holstein, N. and Renner, S.S. (2011). A dated phylogeny and collection records reveal
repeated Biome shifts in the African genus Coccinia (Cucurbitaceae).
[http://www.biomedcentral.com/1471-2148/11/28, accessed on July 16, 2012]
Ihekoronye AI, Ngoddy PO (1985). Integrated food science and technology for the tropics.
1st ed. McMillan publishers, 261- 291.
Karuna, d. Kulkarni, Noel Govinden and Dilip Kulkarni (1996). Food and Nutrition bullet.
Vol. 17 No. 2 United Nation University
Kataria, A., Chauhan, BM. And Punia, D.(1989). Antinutrients and protein digestibility (in
vitro) of mungbean as affected by domestic processing and cooking. Food Chem. 3: 9-
17
Khare, S.K. (2000). Application of immobilized enzymes in soybean processing .The Third
International Soybean Processing and Utilization Conference (ISPCRC III): 2000 of
the Innovation Era for mycotoxins. In: 15-20, October, 2000, Tsukuba, Ibaraka, Japan,
pp: 381-382
Kinsella JE (1976). Functional properties of proteins in food survey. Crit. Rev. Food Sci.
Nutr. 7: 219-280
Kumar, R. and T. Horigome (1986). Fractionation, characterization and protein precipitating
capacity of characterization and protein precipitating capacity of (L.) leaves. J. Agric.
Food Chem., 34: 487-489

Page 95
Latta, M. and Eskin, M.A simple and rapid colorimetric determination of phytate. J. Agri.
Food Chem. 28: 1313-1315
Latta, M. and Eskin, M.A simple and rapid colorimetric determination of phytate. J. Agri.
Food Chem. 28: 1313-1315
Leach, H.W., L.D. Mc. Cowen and T.J. Schoch (1959). Structure of the starch granules, in:
Swelling and solubility patterns of various starches. Cereal Chemistry, 36: 534-544
Legesse Negash (2010). A Selection of Ethiopia’s Indigenous Trees: Biology, Uses and
Propagation Techniques. Addis Ababa University press and Legesse Negash, Addis
Ababa, pp.1-21.
Lewu, M. N., Adebola, P.O. and Afolayan, A. J. (2009). Effect of cooking on the proximate
composition of the leaves of some accessions of Colocacia esculenta (L.) Schott in
Kwazulu-natal province of South Africa. African J. of Biotechn., 8: 1619 – 1622.
Lin, M.J.Y., Humbert, E.S. and Sosulski, F.W. (1974). Certain functional properties of
sunflower meal products. J. of Food Sci. 39: 368–370.
Lönnerdal B. (2002). Phytic acid-trace element (Zn, Cu, Mn) interactions International J.
Food Sci. and Techn. 37: 749–758.
Lopez HW, Leenhardt F, Coudray C, Remesy C. (2002). Minerals and phytic acid
interactions: is it a real problem for human nutrition? International J. Food Sci. and
Tech. 37: 727–739
Makkar, HP., Singh,B., and Dawra, RK. (1988). Effect of tannin rich leaves of oak (Quercus
incana) on various microbial enzyme activities of the bovine rumen. Br. J. Nutr., 60:
287
Maundu, P.M. (1999). The status of traditional vegetable utilization in Kenya. In: Traditional
African vegetables, Proceedings of the IPGRI International Workshop on Genetic
Resources of Traditional Vegetables in Africa. Nairobi, Kenya. August, 1995

Page 96
Mbofung (2006). Physicochemical and Functional Properties of Taro (Colocasia esculenta L.
Schott) Flour, J. of Food Tech. 4(2): 132-142
McMahon JM, White WLB, Sayre RT (1995) Cyanogenesis in cassava (Manihot esculanta
Crantz). J. Exp Bot. 46: 731-741
Motarjemi, Y. (2002). Impact of small scale fermentation technology on food safety in
developing countries. International J. of Food Mic. 75: 213-229
Noonan, S. C., & Savage, G. P. (1999). Oxalate content of foods and its effect on humans.
Asia Pacific J. of Clinical Nutrition 8: 64–74.
Nwokolo, E. (1985). Nutritional quality of the seeds of the African breadfruit (Treculia
Africana Decne). J. Trop. Sci. 27: 39-47
Oboh, G. (2006). Nutrient and anti-nutrient composition of condiments produced from some
fermented underutilized legumes. J. Food Biochem. 6: 32-37
Oboh, G., and Elusiyan, C. A. (2007). Changes in the nutrient and anti-nutrient content of
micro-fungi fermented cassava flour produced from low- and medium-cyanide variety
of cassava tubers. African J. of Biotech. 6: 2150-2157
Odoemelam S.A. (2005). Functional Properties of Raw and Heat processed Jackfruit
(Artocarpus heterophyllus), Pakistan J. of Nutrition, 4 (6): 366-370
Okafor, N. (1998). An Integrated Bio-system for the Disposal of Cassava Wastes, Integrated
Bio-Systems in Zero Emissions Applications, Proceedings of the internet Conference
on integrated Bio-Systems
Okaka, JC, and Potter N. (1979). Physico-chemical and functional properties of cowpea
powder processed to reduce beany flavour. J. Food Sci. 44: 1235-1240
Onitilo, M.O., Sanni, L.O., Oyewole, O.B. and Maziya-Dixon, B. (2007). Physicochemical
and Functional Properties of Sour Starches from Different Cassava Varieties. Int. J. of
Food Properties.10: 607 – 620

Page 97
Oyewole, O. B. (1990). Optimization of cassava fermentation for fufu production: effects of
single starter cultures. J. Appl. Bacteriol, 68:49–54.
Plant Genetic Resources Center (1995). Ethiopia: country report to the FAO International
Technical Conference on Plant Genetic Resources, 17-23 June, 1996, Leipzig,
Germany.
Phillippy, B.Q., Lin, M. and Rasco, B. (2004). Analysis of phytate in raw and cooked
potatoes. J. of Food Composition and Analysis 17: 217–226
Plaami, S.P (1997). Content of dietary Fiber in Foods and its physiological effects, Food
Rev. Internl. 13:27-76
Reade, A.E. and Gregory, K.F. (1975). High temperature protein enriched feed from cassava
fungi. J. of Appl. Microbiol. 30: 897–907
Robert, H. Perry. (1997). Perry’s chemical engineers’ handbook 7th ed., printed by R. R.
Donnelley & Sons Company in the United States of America
Ruales, J., Valencia, S and Nair, B (1993). Effect of processing on the physiochemical
characteristics of guinea flour. (Chenopodium guinea Wild) starch. J. of Agric. and
Food Chem.46 (1): 13-19
Sahore DA, NG Amani and A Kamenan, (2006). Antinutritional factors in wild yam tubers,
Tropropical Sci., 46(2), 113–115)
Shimelis A.E. Mersh Meaza and Rakshit,S.K.(2006). Physico-chemical properties,
pastingbehavior and Functional Characteristics of Flour and Starches from Improved
Bean (phaseolus vulgaris L.) Agricultural Engineering International: the CIGR
Ejornal. Manuscript FP 05 015. Vol.VIII
Shimelis, E.A. and Rakshit, S.K. (2008). Influence of natural and controlled fermentations on
galactosides, antinutrients and protein digestibility of beans (Phaseolus vulgaris L.)
International J. of Food Sci. and Techn. 43: 658–665

Page 98
Siddhuraju, P. and Becker, K. (2001). Effect of various domestic processing methods on anti
nutrients and in vitro-protein and starch digestibility of two indigenous varieties of
Indian pulses, Mucuna pruries var utilis. J. of Agric. and Food Chem. 49: 3058–3067
Sobowale, A. O., Olurin, T. O. and Oyewole, O. B. (2007). Effect of lactic acid bacteria
starter culture fermentation of cassava on chemical and sensory characteristics of fufu
flour. African J. of Biotech. 6: 1954-1958
Subramony Narayana Moorthy, (2002). Physicochemical and Functional Properties of
Tropical Tuber Starches. African J. of Biotech. 54: 559–592
Udensi, E. A. and Okoronkwo, K. A. (2006). Effects of fermentation and germination on the
physicochemical properties of Mucuna cochinchinensis protein isolate. African J. of
Biotech. 5: 896-900
Ugwu, F. M. and Oranye, N. A. (2006). Effects of some processing methods on the toxic
components of African breadfruit (Treculia qfricana). African J. of Biotech. 5: 2329-
2333
Vaintraub, I.A., Lapteva, N.A. (1988). Colorimetric determination of phytate in unpurified
extracts of seed and the products of their processing. Analytical Biochemistry 17:
227–230.
Yasumatsu, K., Sawada, K., Moritakas, S., Misaki, M., Toda, J., Wada, T., and Ishii, K.,
(1972). Whipping and emulsifying properties of soybean products. Agriculture
Biological Chemistry, 36:719
Zemede Asfaw (1997). Conservation and use of traditional vegetables in Ethiopia. In:
Proceedings of the IPGRI International Workshop on Genetic Resources of Traditional
Vegetables in Africa (Guarino, L., ed.): Conservation and use, 29-31 August 1995.
ICRAF-HQ, Nairobi, Kenya
Zippel-Karin (2002). Enset (Ensete ventricosum (Welw.) Cheesm.) in subsistence farming
systems in Ethiopia. Conference on International Agricultural Research for
Development, Witzenhausen,

Page 99
APPENDICES
Appendix-I Photo of anchote processing and laboratory equipments used
a) Nekemte anchote tuber b) Dembidollo anchote tuber
c) Sliced anchote tuber d) Drying anchote in oven e) Dried anchote samples
f) Anchote flour (dembidollo sample) g) Anchote flour (Nekemte sample)

Page 100
h) AWB1 i) AWB2 j) AWB3
k) Mixer B15 l) MB 35 moisture analyzer
m) Screen n) miller

Page 101
Appendix-II The value of cost index (n) for different equipments
(Source: Robert H. Perry, 2007)

Page 102
Appendix-III Factors with separation of materials and labor
(Source: H. C. Bauman, 1964)
Related Documents