Habitat selection models for European wildcat conservation Nina Klar a,b, *, Ne ´stor Ferna ´ ndez c,a , Stephanie Kramer-Schadt a,d , Mathias Herrmann e , Manfred Trinzen f , Ingrid Bu ¨ ttner f , Carsten Niemitz b a Department of Ecological Modelling, Helmholtz Centre for Environmental Research – UFZ, Permoser Straße 15, D-04318 Leipzig, Germany b Department of Human Biology and Anthropology, Freie Universita ¨t Berlin, Albrecht-Thaer-Weg 6, 14195 Berlin, Germany c Department of Ecology and Plant Biology, University of Almerı ´a, Ctra. Sacramento s/n La Can ˜ ada de San Urbano, 04120 Almerı ´a, Spain d Department of Biology, University of Bergen, Thormøhlensgate 55, N-5200 Bergen, Norway e OEKO-LOG.COM, Hof 30, 16247 Parlow, Germany f Biologische Station im Kreis Euskirchen e.V., Steinfelder Straße 10, 53947 Nettersheim, Germany ARTICLE INFO Article history: Received 16 March 2007 Received in revised form 30 August 2007 Accepted 12 October 2007 Keywords: Carnivore conservation Felis silvestris Use-availability habitat model Germany GLMM European habitats directive ABSTRACT Populations of the European wildcat (Felis silvestris) are only slowly recovering in Central Europe after a severe decline in the last centuries and require specific conservation plans in many areas. However, detailed information on wildcat occurrence and habitat require- ments is still scarce and controversial. We present a fine-scale habitat selection model for wildcats based on detailed species and land use information and evaluate its accu- racy to predict habitat distribution in new areas. We analysed habitat use within home ranges using single locations of 12 radio-tracked individuals from south western Germany. Several competing models were fitted and compared using generalised linear mixed models (GLMM) and information-theoretic approaches. Radio-tracking data of 9 and 10 wildcats from two distant areas were used to evaluate the models. The selected model predicted habitat associated to close distance to forest, watercourses and mead- ows and a critical distance to villages, single houses and roads. To predict area suitable for home ranges we superimposed rules derived from home range attributes at a higher level of selection. Predictions from the combination of the fine-scale habitat model and home range rules matched well with more than 2000 wildcat observations of south- western Germany. We discuss the application of the model in wildcat conservation for finding potential reintroduction sites, identifying small isolated populations and aiding in the evaluation of the needs of mitigation and compensation within the scope of the European Habitats Directive. Ó 2007 Elsevier Ltd. All rights reserved. 1. Introduction Where does a species occur and where could it occur are the two initial questions in wildlife conservation planning (Peter- son and Dunham, 2003). In recent years, the development of predictive habitat models has greatly improved our ability to address both questions. First, models can help to detect the occurrence of cryptic or rare species difficult to survey (e.g. Pearce et al., 2001; Ferna ´ ndez et al., 2006a). Second, mapping habitat predictions can further be used to assess the impact 0006-3207/$ - see front matter Ó 2007 Elsevier Ltd. All rights reserved. doi:10.1016/j.biocon.2007.10.004 * Corresponding author: Address: Department of Ecological Modelling, Helmholtz Centre for Environmental Research – UFZ, Permoser Street 15, D-04318 Leipzig, Germany. Tel.: +49 40 23 81 80 82. E-mail addresses: [email protected] (N. Klar), [email protected] (N. Ferna ´ ndez), [email protected] (S. Kramer-Schadt), oeko-log@ t-online.de (M. Herrmann), [email protected] (M. Trinzen), [email protected] (I. Bu ¨ ttner), [email protected] (C. Niemitz). BIOLOGICAL CONSERVATION xxx (2007) xxx – xxx available at www.sciencedirect.com journal homepage: www.elsevier.com/locate/biocon Please cite this article in press as: Klar, N. et al, Habitat selection models for European wildcat conservation, Biol. Conserv. (2007), doi:10.1016/j.biocon.2007.10.004 ARTICLE IN PRESS

Welcome message from author
This document is posted to help you gain knowledge. Please leave a comment to let me know what you think about it! Share it to your friends and learn new things together.
Transcript
B I O L O G I C A L C O N S E R V A T I O N x x x ( 2 0 0 7 ) x x x – x x x
. sc iencedi rec t . com
ARTICLE IN PRESS
ava i lab le a t www
journal homepage: www.elsevier .com/ locate /b iocon
Habitat selection models for European wildcat conservation
Nina Klara,b,*, Nestor Fernandezc,a, Stephanie Kramer-Schadta,d, Mathias Herrmanne,Manfred Trinzenf, Ingrid Buttnerf, Carsten Niemitzb
aDepartment of Ecological Modelling, Helmholtz Centre for Environmental Research – UFZ, Permoser Straße 15, D-04318 Leipzig, GermanybDepartment of Human Biology and Anthropology, Freie Universitat Berlin, Albrecht-Thaer-Weg 6, 14195 Berlin, GermanycDepartment of Ecology and Plant Biology, University of Almerıa, Ctra. Sacramento s/n La Canada de San Urbano, 04120 Almerıa, SpaindDepartment of Biology, University of Bergen, Thormøhlensgate 55, N-5200 Bergen, NorwayeOEKO-LOG.COM, Hof 30, 16247 Parlow, GermanyfBiologische Station im Kreis Euskirchen e.V., Steinfelder Straße 10, 53947 Nettersheim, Germany
A R T I C L E I N F O
Article history:
Received 16 March 2007
Received in revised form
30 August 2007
Accepted 12 October 2007
Keywords:
Carnivore conservation
Felis silvestris
Use-availability habitat model
Germany
GLMM
European habitats directive
0006-3207/$ - see front matter � 2007 Elsevidoi:10.1016/j.biocon.2007.10.004
* Corresponding author: Address: DepartmenStreet 15, D-04318 Leipzig, Germany. Tel.: +4
E-mail addresses: [email protected] (N. Klt-online.de (M. Herrmann), mtrinzen@t-onl(C. Niemitz).
Please cite this article in press as: Klar, N(2007), doi:10.1016/j.biocon.2007.10.004
A B S T R A C T
Populations of the European wildcat (Felis silvestris) are only slowly recovering in Central
Europe after a severe decline in the last centuries and require specific conservation plans
in many areas. However, detailed information on wildcat occurrence and habitat require-
ments is still scarce and controversial. We present a fine-scale habitat selection model
for wildcats based on detailed species and land use information and evaluate its accu-
racy to predict habitat distribution in new areas. We analysed habitat use within home
ranges using single locations of 12 radio-tracked individuals from south western
Germany. Several competing models were fitted and compared using generalised linear
mixed models (GLMM) and information-theoretic approaches. Radio-tracking data of 9
and 10 wildcats from two distant areas were used to evaluate the models. The selected
model predicted habitat associated to close distance to forest, watercourses and mead-
ows and a critical distance to villages, single houses and roads. To predict area suitable
for home ranges we superimposed rules derived from home range attributes at a higher
level of selection. Predictions from the combination of the fine-scale habitat model and
home range rules matched well with more than 2000 wildcat observations of south-
western Germany. We discuss the application of the model in wildcat conservation for
finding potential reintroduction sites, identifying small isolated populations and aiding
in the evaluation of the needs of mitigation and compensation within the scope of the
European Habitats Directive.
� 2007 Elsevier Ltd. All rights reserved.
1. Introduction
Where does a species occur and where could it occur are the
two initial questions in wildlife conservation planning (Peter-
son and Dunham, 2003). In recent years, the development of
er Ltd. All rights reserved
t of Ecological Modelling9 40 23 81 80 82.ar), [email protected] (N. Ferine.de (M. Trinzen), ingr
. et al, Habitat selectio
predictive habitat models has greatly improved our ability to
address both questions. First, models can help to detect the
occurrence of cryptic or rare species difficult to survey (e.g.
Pearce et al., 2001; Fernandez et al., 2006a). Second, mapping
habitat predictions can further be used to assess the impact
.
, Helmholtz Centre for Environmental Research – UFZ, Permoser
nandez), [email protected] (S. Kramer-Schadt), oeko-log@[email protected] (I. Buttner), [email protected]
n models for European wildcat conservation, Biol. Conserv.
2 B I O L O G I C A L C O N S E R V A T I O N x x x ( 2 0 0 7 ) x x x – x x x
ARTICLE IN PRESS
of changing land use, to detect important areas for reintro-
duction, and to identify potential conflicts with human activ-
ities (e.g. Johnson et al., 2004; Kramer-Schadt et al., 2005;
Sawyer et al., 2006).
Habitat models based on presence–absence data are the
most standard approach to habitat modelling (e.g. Schadt
et al., 2002b; Woolf et al., 2002; Naves et al., 2003; Seoane
et al., 2003; Niedzialkowska et al., 2006). These models are of-
ten based on coarse-grained landscape and species informa-
tion allowing coarse habitat inferences and predictions, but
they may overlook biological details important for species
conservation. Indeed, fine-scale models based on detailed
species and landscape information have shown a great poten-
tial to detect crucial habitat structures not obvious at broader
scales (e.g. Fernandez et al., 2003). However, the expandability
of fine-scale models for habitat predictions remains largely
unexplored partly because the required information is diffi-
cult to gather. Therefore, one current challenge in conserva-
tion is to reconcile fine-scale habitat inferences with broad-
scale predictions required for more comprehensive species
management. This approach has great potential in the design
of mitigation and compensation measures required within
the European habitats directive for species under protection.
A typical example for a cryptic species difficult to detect
and listed in the European habitats directive in appendix IV
is the European wildcat (Felis silvestris, Schreber, 1777). Once
widely distributed throughout Europe, this medium-sized
carnivore has suffered significant reduction in its original
range due to extensive hunting and trapping resulting in
fragmented and small populations (Piechocki, 1990). Wild-
cats were for a long time seen as a serious competitor for
hunters, despite its specialisation on small mammals, espe-
cially rodents, in Central Europe (Sladek, 1973; Stahl, 1986;
Kozena, 1990; Liberek, 1999; Biro et al., 2005). During the
last decades, wildcats have slowly recovered in Central Eur-
ope, due to total protection and reduced trapping (Stubbe
and Stubbe, 2002; Pott-Dorfer and Raimer, 2004). However,
habitat degradation, direct kills and hybridisation with feral
cats (Felis S. catus) are still important threats for many pop-
ulations (Stahl and Artois, 1995; Pierpaoli et al., 2003; Lecis
et al., 2006). In addition, their large home ranges and their
high mobility make this species highly vulnerable to traffic
mortality, especially in densely populated landscapes.
Therefore, potential impact on this species has to be as-
sessed and compensatory measures as well as reintroduc-
tions should be considered where necessary.
The inconspicuous behaviour of wildcats, the easy confu-
sion with its domesticated relative, the feral cat, low popula-
tion densities and the fact that there is nearly no risk of
becoming a threat to domestic livestock contributed to qua-
si-ignorance of the species (Stahl and Artois, 1995). Hence, de-
tailed information on occurrence and potential occurrence as
well as on wildcat habitat requirements is still scarce and
controversial (Stahl and Artois, 1995; Lozano et al., 2003).
The present study aims to develop fine-scale habitat selec-
tion models for wildcats using detailed species and habitat
information and to evaluate their reliability to predict habi-
tats over a broad spatial extent. For this, we first designed a
set of models and compared their fit using radio-tracking data
and fine-grained landscape information from one wildcat
Please cite this article in press as: Klar, N. et al, Habitat selectio(2007), doi:10.1016/j.biocon.2007.10.004
population in western Germany. Then, we spatially extrapo-
lated model predictions and evaluated the predictive accuracy
using two additional radio-tracking datasets from distant
populations as well as sighting data from the whole area.
Model evaluation, using independent datasets, reduces the
risk of spurious habitat inferences, but they are seldom avail-
able (Mladenoff et al., 1999; Pearce and Ferrier, 2000). Finally,
we give examples on how to use our model predictions in
wildcat conservation.
2. Methods
2.1. Study area
We radio-tracked wildcats and developed the initial habitat
model in an area encompassing 150 km2 in south-western
Germany (50�3 0N, 6�39 0E) in the western part of Rhineland-
Palatinate in the low mountain range Eifel (Fig. 1, ‘‘Southern
Eifel’’). It is a rural area with a population density of about
70 inhabitants per km2. Thirty-seven percent of the area is
forested. The elevation ranges from 200 m in the steep for-
ested creek valleys to 450 m on plateaus dedicated to agricul-
ture. It lies in the Western-European Atlantic climatic region
with mild but longsome winters and temperate humid-cool
summers. The annual precipitation is 800 mm, the average
temperature in January is 0 �C, in July 15 �C. Snow is recorded
on an average of 28 days per year.
Model extrapolation and evaluation was performed in a lar-
ger area encompassing the whole Federal State Rhineland-
Palatinate (Fig. 1; 19,850 km2). Average population density is
200 inh/km2. The State is characterised by low mountain
ranges and large forests covering 42% of the surface. The dom-
inant native trees, red beech (Fagus sylvatica) and oak (Quercus
spec.), were commonly replaced by spruce (Picea abies), pine
(Pinus sylvestris), and douglas fir (Pseudotsuga menziesii), so that
today 44% of the forests are coniferous (Fischer, 1989; Lande-
sforsten Rheinland-Pfalz, 2006). One evaluation area was situ-
ated in the northern part of the low mountain range Eifel
with elevations of 450–750 m (‘‘Northern Eifel’’). The second
evaluation area was the lowland forest ‘‘Bienwald’’ in the
southeastern part of Rhineland-Palatinate at the river Rhine
(Fig. 1).
2.2. Wildcat data
The wildcat habitat model was built using a radio-telemetry
database containing 13,000 locations of 12 individuals (6 fe-
males, 6 males) captured and monitored between 2001 and
2004. Individuals were radio-tracked for periods between 4
and 30 months each before the signal failed. Locations were
performed using triangulation (White and Garrott, 1990).
The estimated maximum radio-tracking error was 100 m.
Every animal was located once at daytime for at least 10 days
per month and monitored intensively (one location every
15 min) during at least 20 nights.
For habitat modelling we filtered the initial sample to min-
imize temporal autocorrelation by selecting only locations
separated by at least 6 h. This resulted in a dataset of 2481
locations, ranging between 121 and 477 locations per cat.
n models for European wildcat conservation, Biol. Conserv.
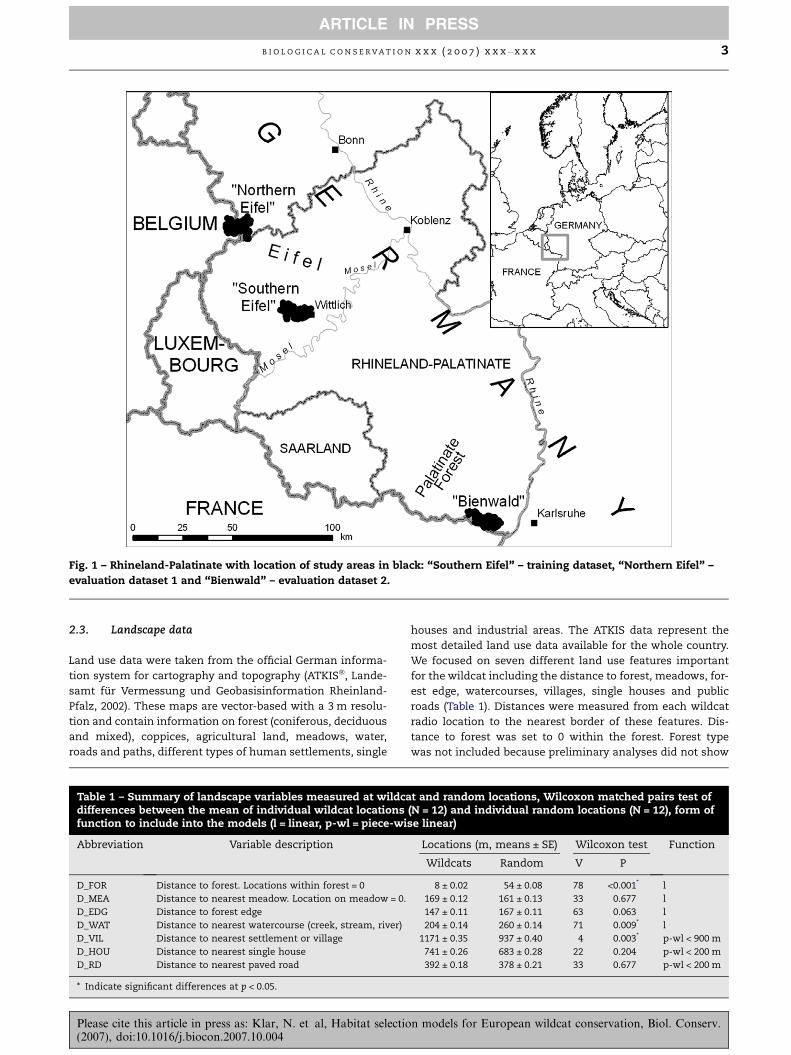
Fig. 1 – Rhineland-Palatinate with location of study areas in black: ‘‘Southern Eifel’’ – training dataset, ‘‘Northern Eifel’’ –
evaluation dataset 1 and ‘‘Bienwald’’ – evaluation dataset 2.
B I O L O G I C A L C O N S E R V A T I O N x x x ( 2 0 0 7 ) x x x – x x x 3
ARTICLE IN PRESS
2.3. Landscape data
Land use data were taken from the official German informa-
tion system for cartography and topography (ATKIS�, Lande-
samt fur Vermessung und Geobasisinformation Rheinland-
Pfalz, 2002). These maps are vector-based with a 3 m resolu-
tion and contain information on forest (coniferous, deciduous
and mixed), coppices, agricultural land, meadows, water,
roads and paths, different types of human settlements, single
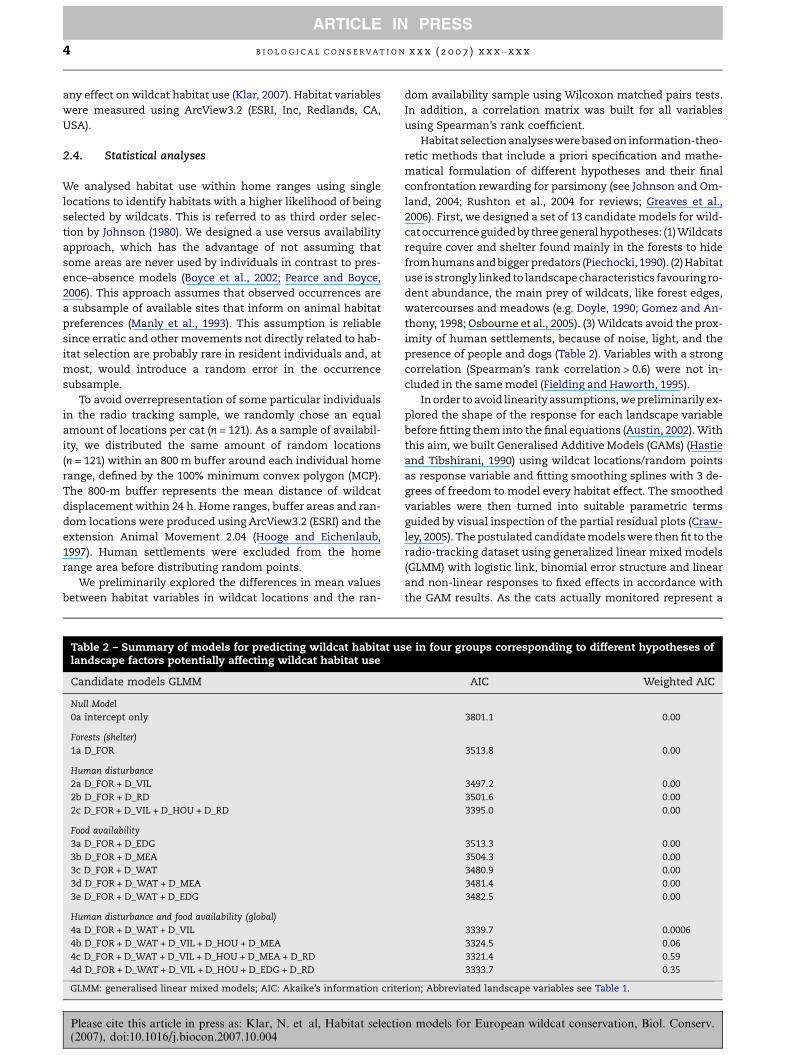
Table 1 – Summary of landscape variables measured at wildcadifferences between the mean of individual wildcat locationsfunction to include into the models (l = linear, p-wl = piece-wi
Abbreviation Variable description
D_FOR Distance to forest. Locations within forest = 0
D_MEA Distance to nearest meadow. Location on meadow = 0.
D_EDG Distance to forest edge
D_WAT Distance to nearest watercourse (creek, stream, river)
D_VIL Distance to nearest settlement or village
D_HOU Distance to nearest single house
D_RD Distance to nearest paved road
* Indicate significant differences at p < 0.05.
Please cite this article in press as: Klar, N. et al, Habitat selectio(2007), doi:10.1016/j.biocon.2007.10.004
houses and industrial areas. The ATKIS data represent the
most detailed land use data available for the whole country.
We focused on seven different land use features important
for the wildcat including the distance to forest, meadows, for-
est edge, watercourses, villages, single houses and public
roads (Table 1). Distances were measured from each wildcat
radio location to the nearest border of these features. Dis-
tance to forest was set to 0 within the forest. Forest type
was not included because preliminary analyses did not show
t and random locations, Wilcoxon matched pairs test of(N = 12) and individual random locations (N = 12), form ofse linear)
Locations (m, means ± SE) Wilcoxon test Function
Wildcats Random V P
8 ± 0.02 54 ± 0.08 78 <0.001* l
169 ± 0.12 161 ± 0.13 33 0.677 l
147 ± 0.11 167 ± 0.11 63 0.063 l
204 ± 0.14 260 ± 0.14 71 0.009* l
1171 ± 0.35 937 ± 0.40 4 0.003* p-wl < 900 m
741 ± 0.26 683 ± 0.28 22 0.204 p-wl < 200 m
392 ± 0.18 378 ± 0.21 33 0.677 p-wl < 200 m
n models for European wildcat conservation, Biol. Conserv.
4 B I O L O G I C A L C O N S E R V A T I O N x x x ( 2 0 0 7 ) x x x – x x x
ARTICLE IN PRESS
any effect on wildcat habitat use (Klar, 2007). Habitat variables
were measured using ArcView3.2 (ESRI, Inc, Redlands, CA,
USA).
2.4. Statistical analyses
We analysed habitat use within home ranges using single
locations to identify habitats with a higher likelihood of being
selected by wildcats. This is referred to as third order selec-
tion by Johnson (1980). We designed a use versus availability
approach, which has the advantage of not assuming that
some areas are never used by individuals in contrast to pres-
ence–absence models (Boyce et al., 2002; Pearce and Boyce,
2006). This approach assumes that observed occurrences are
a subsample of available sites that inform on animal habitat
preferences (Manly et al., 1993). This assumption is reliable
since erratic and other movements not directly related to hab-
itat selection are probably rare in resident individuals and, at
most, would introduce a random error in the occurrence
subsample.
To avoid overrepresentation of some particular individuals
in the radio tracking sample, we randomly chose an equal
amount of locations per cat (n = 121). As a sample of availabil-
ity, we distributed the same amount of random locations
(n = 121) within an 800 m buffer around each individual home
range, defined by the 100% minimum convex polygon (MCP).
The 800-m buffer represents the mean distance of wildcat
displacement within 24 h. Home ranges, buffer areas and ran-
dom locations were produced using ArcView3.2 (ESRI) and the
extension Animal Movement 2.04 (Hooge and Eichenlaub,
1997). Human settlements were excluded from the home
range area before distributing random points.
We preliminarily explored the differences in mean values
between habitat variables in wildcat locations and the ran-
Table 2 – Summary of models for predicting wildcat habitat uslandscape factors potentially affecting wildcat habitat use
Candidate models GLMM
Null Model
0a intercept only
Forests (shelter)
1a D_FOR
Human disturbance
2a D_FOR + D_VIL
2b D_FOR + D_RD
2c D_FOR + D_VIL + D_HOU + D_RD
Food availability
3a D_FOR + D_EDG
3b D_FOR + D_MEA
3c D_FOR + D_WAT
3d D_FOR + D_WAT + D_MEA
3e D_FOR + D_WAT + D_EDG
Human disturbance and food availability (global)
4a D_FOR + D_WAT + D_VIL
4b D_FOR + D_WAT + D_VIL + D_HOU + D_MEA
4c D_FOR + D_WAT + D_VIL + D_HOU + D_MEA + D_RD
4d D_FOR + D_WAT + D_VIL + D_HOU + D_EDG + D_RD
GLMM: generalised linear mixed models; AIC: Akaike’s information crite
Please cite this article in press as: Klar, N. et al, Habitat selectio(2007), doi:10.1016/j.biocon.2007.10.004
dom availability sample using Wilcoxon matched pairs tests.
In addition, a correlation matrix was built for all variables
using Spearman’s rank coefficient.
Habitat selection analyseswere based on information-theo-
retic methods that include a priori specification and mathe-
matical formulation of different hypotheses and their final
confrontation rewarding for parsimony (see Johnson and Om-
land, 2004; Rushton et al., 2004 for reviews; Greaves et al.,
2006). First, we designed a set of 13 candidate models for wild-
cat occurrenceguided by three general hypotheses: (1) Wildcats
require cover and shelter found mainly in the forests to hide
from humans and bigger predators (Piechocki, 1990). (2) Habitat
use is strongly linked to landscape characteristics favouring ro-
dent abundance, the main prey of wildcats, like forest edges,
watercourses and meadows (e.g. Doyle, 1990; Gomez and An-
thony, 1998; Osbourne et al., 2005). (3) Wildcats avoid the prox-
imity of human settlements, because of noise, light, and the
presence of people and dogs (Table 2). Variables with a strong
correlation (Spearman’s rank correlation > 0.6) were not in-
cluded in the same model (Fielding and Haworth, 1995).
In order to avoid linearity assumptions, we preliminarily ex-
plored the shape of the response for each landscape variable
before fitting them into the final equations (Austin, 2002). With
this aim, we built Generalised Additive Models (GAMs) (Hastie
and Tibshirani, 1990) using wildcat locations/random points
as response variable and fitting smoothing splines with 3 de-
grees of freedom to model every habitat effect. The smoothed
variables were then turned into suitable parametric terms
guided by visual inspection of the partial residual plots (Craw-
ley, 2005). The postulated candidate models were then fit to the
radio-tracking dataset using generalized linear mixed models
(GLMM) with logistic link, binomial error structure and linear
and non-linear responses to fixed effects in accordance with
the GAM results. As the cats actually monitored represent a
e in four groups corresponding to different hypotheses of
AIC Weighted AIC
3801.1 0.00
3513.8 0.00
3497.2 0.00
3501.6 0.00
3395.0 0.00
3513.3 0.00
3504.3 0.00
3480.9 0.00
3481.4 0.00
3482.5 0.00
3339.7 0.0006
3324.5 0.06
3321.4 0.59
3333.7 0.35
rion; Abbreviated landscape variables see Table 1.
n models for European wildcat conservation, Biol. Conserv.
B I O L O G I C A L C O N S E R V A T I O N x x x ( 2 0 0 7 ) x x x – x x x 5
ARTICLE IN PRESS
random sample of all trappable wildcats potentially present in
the study area, we controlled for the effect of the individual
including it as a random term.
Fitted models were compared and hierarchically ordered
using Akaikes Information Criterion (AIC), a statistic method
that rewards parsimony by penalizing the maximum likeli-
hood for the number of model parameters (Akaike, 1973; Rich-
ards, 2005). Finally, we evaluated model selection uncertainty
weighting all AIC values using a randomisation method. For
this we included the full dataset of cat locations (2481 loca-
tions filtered for temporal independence and 2481 random
points) and randomly chose 100 locations per cat and an
equal amount of random points within wildcat home ranges.
Then we fitted all 13 models, calculated the AIC and recorded
the model with the lowest value. This routine was iterated
10,000 times, and the probability of model selection was esti-
mated counting the number of randomisations in which each
model was scored as best.
All statistical analyses were performed using the R statis-
tical software V. 2.3.0 (R Development Core Team 2006, Vien-
na, Austria), GAM and GLMM were fitted using the gam and
lme4 packages, respectively.
2.5. Model evaluation
We first evaluated the accuracy of habitat predictions, using
an independent random sample of wildcat locations from
the ‘‘Southern Eifel’’ dataset not used for model fitting. In
addition, we evaluated predictions outside the calibration
range using radio-tracking data from two areas situated 50
and 150 km apart from the calibration area (Fig. 1). The
‘‘Northern Eifel’’ dataset consisted of 7700 radio locations
from 7 males and 3 females, monitored from 2002 to 2004 in
an area of 150 km2. The ‘‘Bienwald’’ dataset consisted of 800
radio locations of 5 males and 5 females, monitored in 2005
and 2006 in an area of 130 km2.
We assessed model predictive accuracy by comparing pre-
dictions to the observed number of wildcat locations in the
evaluation datasets following the method suggested by Boyce
et al. (2002) (e.g. Nielsen et al., 2004). This method relates
model predictions to the probability of habitat use from pres-
ence-only data. This is an advantage over more traditional
methods such as ROC and Kappa, because a true binary data-
set is not required (Pearce and Boyce, 2006). First, predictions
from the selected model were translated into a grid map with
25 · 25 m grids covering Rhineland-Palatinate. Then we
ranked probability values into eight classes of equal area
amounts. The proportion of wildcat locations within each
probability class was calculated and divided by the proportion
of the available area. Last, the area-adjusted use frequencies
were correlated with the probability ranks using Spearman
rank correlation. High correlation scores indicate that areas
resulting in high predicted probability of use are indeed used
more often in relation to availability, therefore indicating high
model accuracy.
2.6. Habitat mapping
We aim at providing information in detail regarding habitat
selection within home ranges, facilitating the mapping of
Please cite this article in press as: Klar, N. et al, Habitat selectio(2007), doi:10.1016/j.biocon.2007.10.004
suitable wildcat habitats at this detailed level. However, we
also wanted to exclude those habitat patches potentially suit-
able for wildcats but too small or too scattered to constitute
part of home ranges. Therefore we formulated a set of rules
for predicted habitat patches that may constitute home
ranges as defined by the 100% MCP of all 14 females in the
three study areas (Fig. 3). First, we defined a circular area of
700 ha – i.e. 1500 m radius – representing the average female
home range size. Each cell was assigned as a potential home
range centre if all the following rules were followed: (1) Hu-
man settlements are not present within the 700 ha circular
area; (2) suitable habitat (probability > 0.45) constitutes at
least 185 ha of the area and (3) optimal habitat (p > 0.65) at
least 94 ha. These thresholds correspond to the values calcu-
lated from the female home range with the smallest amount
of suitable habitat. Therefore, we take as much area as possi-
ble which still fulfils the characteristics of the least optimal
home range recorded. The sensitivity of the rules was evalu-
ated changing values of suitable and optimal habitat between
the minimum and the average value within female home
ranges and amount of settlements between minimum and
maximum (see Appendix, Tables A.1, A.2). The rules were
implemented using a moving window routine in ArcView3.2.
Later the suitable home range centre cells were buffered with
the surrounding connected forest patch plus 300 m. This was
done to give the predicted area a more natural shape, since
wildcats shaped their home ranges around forest patches
and used only areas close to forests for hunting. This area
was then assigned as the total area of potential home ranges
within the map area. Within this area habitat quality can be
addressed due to the fine-scale model predictions.
A dataset of 2306 wildcat observations and 333 casualties
from a systematic questionnaire survey for Rhineland-Palati-
nate with an accuracy of 1 km (Knapp et al., 2000) was used to
compare our home range predictions with wildcat distribu-
tion data. We recognise that observational data may be biased
for example due to potential habitat-dependent probability of
observing wildcats and the sporadic confusion with domestic
cats. Still, this source of information provides an unique
opportunity to confront our fine-scale habitat predictions
with coarse-grained distributional data frequently used in
conservation.
3. Results
The exploratory univariate analyses showed that distances
from wildcat locations to forests and watercourses were sig-
nificantly lower than random, whereas distances to villages
were significantly higher (Table 2). Other differences were
not significant. A strong correlation was only observed be-
tween distance to forest edge and to meadows (r = 0.68,
p < 0.001).
The visual inspection of GAMs indicated a linear relation-
ship between wildcat occurrence and all predictors, except for
the distance to villages, houses and roads, which were mod-
elled as piece-wise linear effects. The best threshold accord-
ing to the lowest residual deviance (Crawley, 2005) was
900 m for villages and 200 m for single houses and roads,
indicating that wildcat habitat use was affected by human
n models for European wildcat conservation, Biol. Conserv.
6 B I O L O G I C A L C O N S E R V A T I O N x x x ( 2 0 0 7 ) x x x – x x x
ARTICLE IN PRESS
disturbance only up to moderate distances smaller than the
average length of home ranges.
3.1. Model selection
The global models including human disturbance and surro-
gates of food availability showed the highest parsimony ranks
according to AIC scores. The selected model (4c, Table 3) in-
cluded as predictors the distance to forest, water, villages,
single houses, meadows and roads. Uncertainty analysis re-
vealed a selection probability of 0.58 for this model. The sec-
ond best model 4d, which included forest edge and not
meadows, showed a probability of 0.36, whereas other alter-
native models were selected with a much lower probability
(Table 3). Parameter estimates for the two best models are
shown in Table 3.
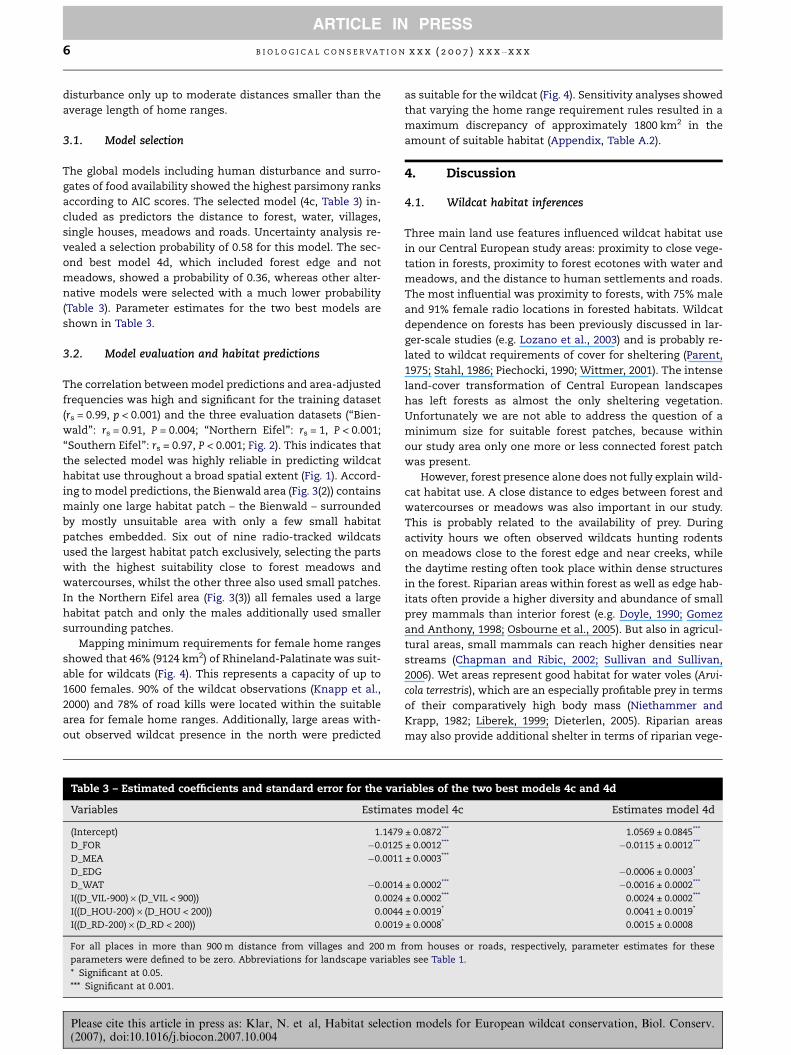
3.2. Model evaluation and habitat predictions
The correlation between model predictions and area-adjusted
frequencies was high and significant for the training dataset
(rs = 0.99, p < 0.001) and the three evaluation datasets (‘‘Bien-
wald’’: rs = 0.91, P = 0.004; ‘‘Northern Eifel’’: rs = 1, P < 0.001;
‘‘Southern Eifel’’: rs = 0.97, P < 0.001; Fig. 2). This indicates that
the selected model was highly reliable in predicting wildcat
habitat use throughout a broad spatial extent (Fig. 1). Accord-
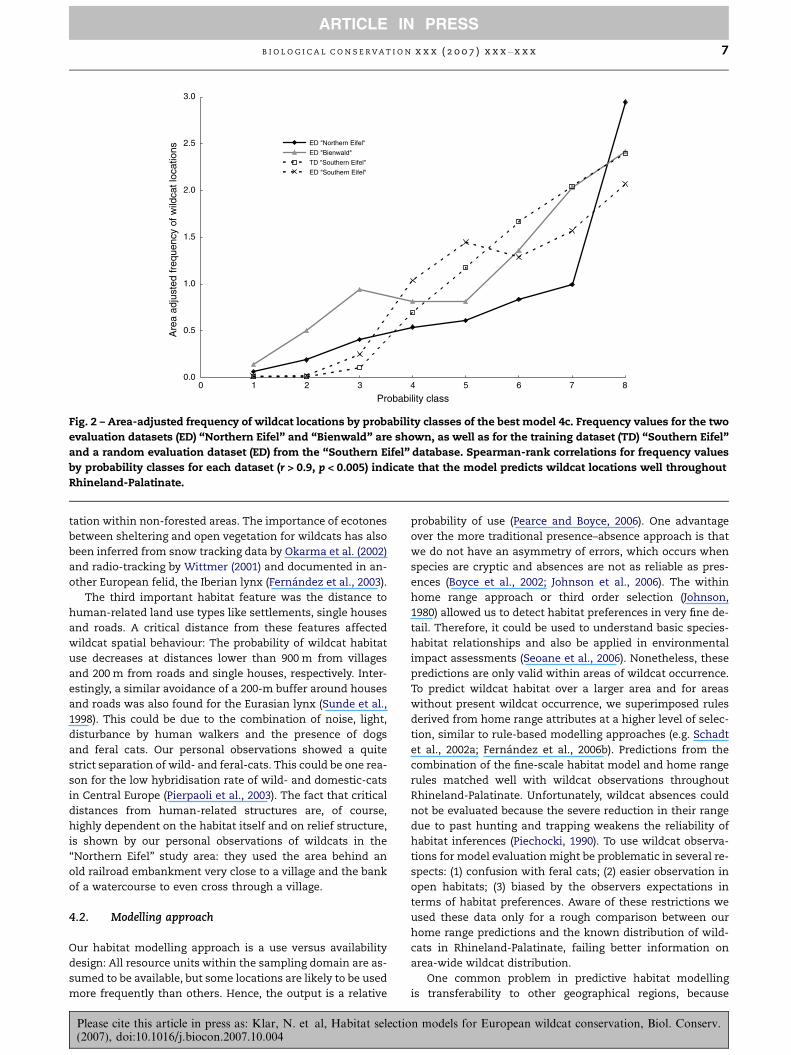
ing to model predictions, the Bienwald area (Fig. 3(2)) contains
mainly one large habitat patch – the Bienwald – surrounded
by mostly unsuitable area with only a few small habitat
patches embedded. Six out of nine radio-tracked wildcats
used the largest habitat patch exclusively, selecting the parts
with the highest suitability close to forest meadows and
watercourses, whilst the other three also used small patches.
In the Northern Eifel area (Fig. 3(3)) all females used a large
habitat patch and only the males additionally used smaller
surrounding patches.
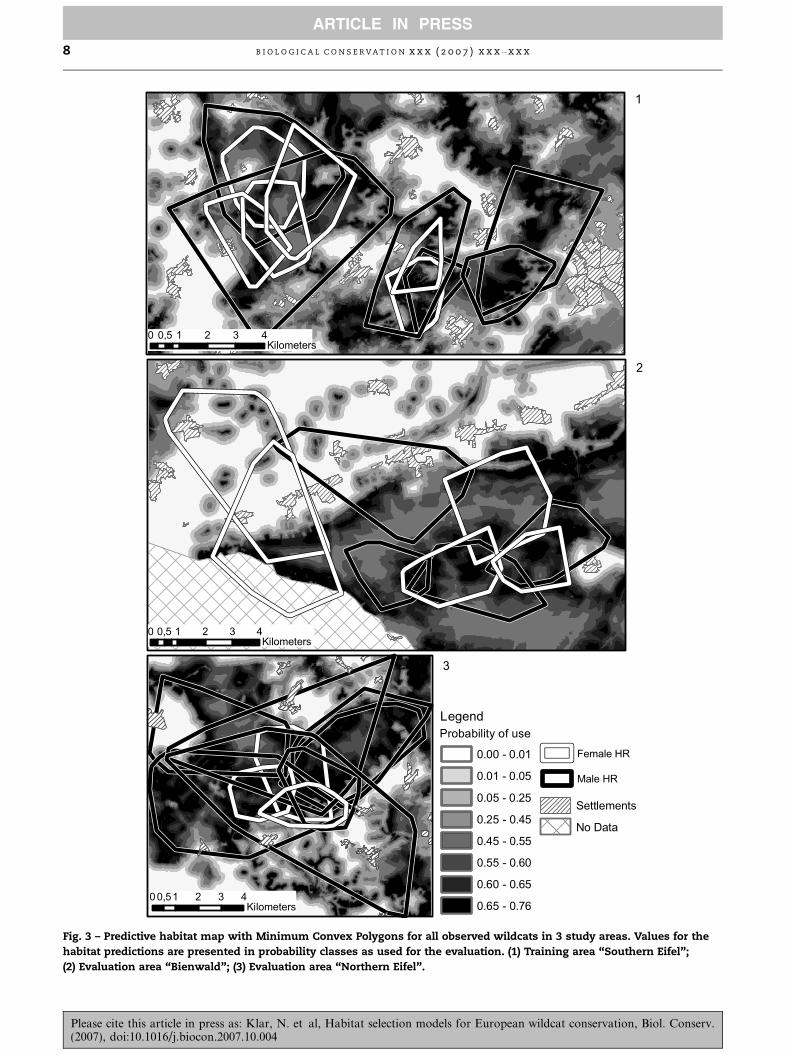
Mapping minimum requirements for female home ranges
showed that 46% (9124 km2) of Rhineland-Palatinate was suit-
able for wildcats (Fig. 4). This represents a capacity of up to
1600 females. 90% of the wildcat observations (Knapp et al.,
2000) and 78% of road kills were located within the suitable
area for female home ranges. Additionally, large areas with-
out observed wildcat presence in the north were predicted
Table 3 – Estimated coefficients and standard error for the var
Variables Estimat
(Intercept) 1.1479
D_FOR �0.0125
D_MEA �0.0011
D_EDG
D_WAT �0.0014
I((D_VIL-900) · (D_VIL < 900)) 0.0024
I((D_HOU-200) · (D_HOU < 200)) 0.0044
I((D_RD-200) · (D_RD < 200)) 0.0019
For all places in more than 900 m distance from villages and 200 m
parameters were defined to be zero. Abbreviations for landscape variabl
* Significant at 0.05.
*** Significant at 0.001.
Please cite this article in press as: Klar, N. et al, Habitat selectio(2007), doi:10.1016/j.biocon.2007.10.004
as suitable for the wildcat (Fig. 4). Sensitivity analyses showed
that varying the home range requirement rules resulted in a
maximum discrepancy of approximately 1800 km2 in the
amount of suitable habitat (Appendix, Table A.2).
4. Discussion
4.1. Wildcat habitat inferences
Three main land use features influenced wildcat habitat use
in our Central European study areas: proximity to close vege-
tation in forests, proximity to forest ecotones with water and
meadows, and the distance to human settlements and roads.
The most influential was proximity to forests, with 75% male
and 91% female radio locations in forested habitats. Wildcat
dependence on forests has been previously discussed in lar-
ger-scale studies (e.g. Lozano et al., 2003) and is probably re-
lated to wildcat requirements of cover for sheltering (Parent,
1975; Stahl, 1986; Piechocki, 1990; Wittmer, 2001). The intense
land-cover transformation of Central European landscapes
has left forests as almost the only sheltering vegetation.
Unfortunately we are not able to address the question of a
minimum size for suitable forest patches, because within
our study area only one more or less connected forest patch
was present.
However, forest presence alone does not fully explain wild-
cat habitat use. A close distance to edges between forest and
watercourses or meadows was also important in our study.
This is probably related to the availability of prey. During
activity hours we often observed wildcats hunting rodents
on meadows close to the forest edge and near creeks, while
the daytime resting often took place within dense structures
in the forest. Riparian areas within forest as well as edge hab-
itats often provide a higher diversity and abundance of small
prey mammals than interior forest (e.g. Doyle, 1990; Gomez
and Anthony, 1998; Osbourne et al., 2005). But also in agricul-
tural areas, small mammals can reach higher densities near
streams (Chapman and Ribic, 2002; Sullivan and Sullivan,
2006). Wet areas represent good habitat for water voles (Arvi-
cola terrestris), which are an especially profitable prey in terms
of their comparatively high body mass (Niethammer and
Krapp, 1982; Liberek, 1999; Dieterlen, 2005). Riparian areas
may also provide additional shelter in terms of riparian vege-
iables of the two best models 4c and 4d
es model 4c Estimates model 4d
± 0.0872*** 1.0569 ± 0.0845***
± 0.0012*** �0.0115 ± 0.0012***
± 0.0003***
�0.0006 ± 0.0003*
± 0.0002*** �0.0016 ± 0.0002***
± 0.0002*** 0.0024 ± 0.0002***
± 0.0019* 0.0041 ± 0.0019*
± 0.0008* 0.0015 ± 0.0008
from houses or roads, respectively, parameter estimates for these
es see Table 1.
n models for European wildcat conservation, Biol. Conserv.
0.0
0.5
1.0
1.5
2.0
2.5
3.0
0 87654321
Probability class
Are
a ad
just
ed fr
eque
ncy
of w
ildca
t loc
atio
ns
ED "Northern Eifel"
ED "Bienwald"
TD "Southern Eifel"
ED "Southern Eifel"
Fig. 2 – Area-adjusted frequency of wildcat locations by probability classes of the best model 4c. Frequency values for the two
evaluation datasets (ED) ‘‘Northern Eifel’’ and ‘‘Bienwald’’ are shown, as well as for the training dataset (TD) ‘‘Southern Eifel’’
and a random evaluation dataset (ED) from the ‘‘Southern Eifel’’ database. Spearman-rank correlations for frequency values
by probability classes for each dataset (r > 0.9, p < 0.005) indicate that the model predicts wildcat locations well throughout
Rhineland-Palatinate.
B I O L O G I C A L C O N S E R V A T I O N x x x ( 2 0 0 7 ) x x x – x x x 7
ARTICLE IN PRESS
tation within non-forested areas. The importance of ecotones
between sheltering and open vegetation for wildcats has also
been inferred from snow tracking data by Okarma et al. (2002)
and radio-tracking by Wittmer (2001) and documented in an-
other European felid, the Iberian lynx (Fernandez et al., 2003).
The third important habitat feature was the distance to
human-related land use types like settlements, single houses
and roads. A critical distance from these features affected
wildcat spatial behaviour: The probability of wildcat habitat
use decreases at distances lower than 900 m from villages
and 200 m from roads and single houses, respectively. Inter-
estingly, a similar avoidance of a 200-m buffer around houses
and roads was also found for the Eurasian lynx (Sunde et al.,
1998). This could be due to the combination of noise, light,
disturbance by human walkers and the presence of dogs
and feral cats. Our personal observations showed a quite
strict separation of wild- and feral-cats. This could be one rea-
son for the low hybridisation rate of wild- and domestic-cats
in Central Europe (Pierpaoli et al., 2003). The fact that critical
distances from human-related structures are, of course,
highly dependent on the habitat itself and on relief structure,
is shown by our personal observations of wildcats in the
‘‘Northern Eifel’’ study area: they used the area behind an
old railroad embankment very close to a village and the bank
of a watercourse to even cross through a village.
4.2. Modelling approach
Our habitat modelling approach is a use versus availability
design: All resource units within the sampling domain are as-
sumed to be available, but some locations are likely to be used
more frequently than others. Hence, the output is a relative
Please cite this article in press as: Klar, N. et al, Habitat selectio(2007), doi:10.1016/j.biocon.2007.10.004
probability of use (Pearce and Boyce, 2006). One advantage
over the more traditional presence–absence approach is that
we do not have an asymmetry of errors, which occurs when
species are cryptic and absences are not as reliable as pres-
ences (Boyce et al., 2002; Johnson et al., 2006). The within
home range approach or third order selection (Johnson,
1980) allowed us to detect habitat preferences in very fine de-
tail. Therefore, it could be used to understand basic species-
habitat relationships and also be applied in environmental
impact assessments (Seoane et al., 2006). Nonetheless, these
predictions are only valid within areas of wildcat occurrence.
To predict wildcat habitat over a larger area and for areas
without present wildcat occurrence, we superimposed rules
derived from home range attributes at a higher level of selec-
tion, similar to rule-based modelling approaches (e.g. Schadt
et al., 2002a; Fernandez et al., 2006b). Predictions from the
combination of the fine-scale habitat model and home range
rules matched well with wildcat observations throughout
Rhineland-Palatinate. Unfortunately, wildcat absences could
not be evaluated because the severe reduction in their range
due to past hunting and trapping weakens the reliability of
habitat inferences (Piechocki, 1990). To use wildcat observa-
tions for model evaluation might be problematic in several re-
spects: (1) confusion with feral cats; (2) easier observation in
open habitats; (3) biased by the observers expectations in
terms of habitat preferences. Aware of these restrictions we
used these data only for a rough comparison between our
home range predictions and the known distribution of wild-
cats in Rhineland-Palatinate, failing better information on
area-wide wildcat distribution.
One common problem in predictive habitat modelling
is transferability to other geographical regions, because
n models for European wildcat conservation, Biol. Conserv.
0 1 2 3 40,5Kilometers
0 1 2 3 40,5Kilometers
0 1 2 3 40,5Kilometers
1
2
3
Probability of useLegend
0.00 - 0.01
0.01 - 0.05
0.05 - 0.25
0.25 - 0.45
0.45 - 0.55
0.55 - 0.60
0.60 - 0.65
0.65 - 0.76
No Data
Settlements
Female HR
Male HR
Fig. 3 – Predictive habitat map with Minimum Convex Polygons for all observed wildcats in 3 study areas. Values for the
habitat predictions are presented in probability classes as used for the evaluation. (1) Training area ‘‘Southern Eifel’’;
(2) Evaluation area ‘‘Bienwald’’; (3) Evaluation area ‘‘Northern Eifel’’.
8 B I O L O G I C A L C O N S E R V A T I O N x x x ( 2 0 0 7 ) x x x – x x x
Please cite this article in press as: Klar, N. et al, Habitat selection models for European wildcat conservation, Biol. Conserv.(2007), doi:10.1016/j.biocon.2007.10.004
ARTICLE IN PRESS
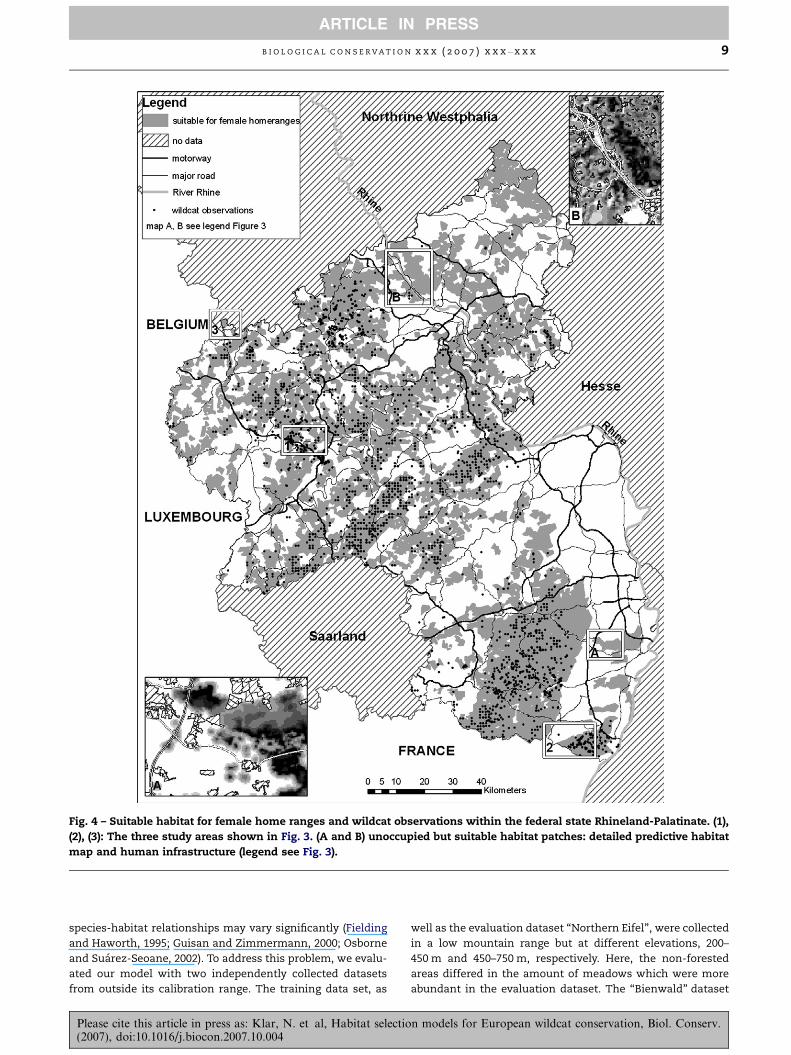
Fig. 4 – Suitable habitat for female home ranges and wildcat observations within the federal state Rhineland-Palatinate. (1),
(2), (3): The three study areas shown in Fig. 3. (A and B) unoccupied but suitable habitat patches: detailed predictive habitat
map and human infrastructure (legend see Fig. 3).
B I O L O G I C A L C O N S E R V A T I O N x x x ( 2 0 0 7 ) x x x – x x x 9
ARTICLE IN PRESS
species-habitat relationships may vary significantly (Fielding
and Haworth, 1995; Guisan and Zimmermann, 2000; Osborne
and Suarez-Seoane, 2002). To address this problem, we evalu-
ated our model with two independently collected datasets
from outside its calibration range. The training data set, as
Please cite this article in press as: Klar, N. et al, Habitat selectio(2007), doi:10.1016/j.biocon.2007.10.004
well as the evaluation dataset ‘‘Northern Eifel’’, were collected
in a low mountain range but at different elevations, 200–
450 m and 450–750 m, respectively. Here, the non-forested
areas differed in the amount of meadows which were more
abundant in the evaluation dataset. The ‘‘Bienwald’’ dataset
n models for European wildcat conservation, Biol. Conserv.
10 B I O L O G I C A L C O N S E R V A T I O N x x x ( 2 0 0 7 ) x x x – x x x
ARTICLE IN PRESS
was collected in a lowland forest, with more watercourses
and less fragmentation than the other regions. Despite these
landscape differences, the model performed well in both eval-
uation regions. Consequently, we believe that our model can
greatly help to predict wildcat habitats in other regions than
the study area, although specific evaluation in new extrapola-
tion areas is recommended where possible. Moreover, the
landscape variables can easily be obtained from available dig-
ital information in many other regions, which allows evaluat-
ing our predictions to a broader spatial extent.
4.3. Conservation and management implications
As shown in Fig. 4, about half of the study area was identified
as suitable for wildcat home ranges. The approach of develop-
ing rules of minimal habitat requirements from observed
home ranges is conservative, so that we might have over-
looked some areas which could also be suitable for wildcats.
Due to the historical decline in wildcat populations, not all
predicted habitats are populated to date. For example, within
the small habitat patches in the southern Rhine valley
(Fig. 4A) and northeast of the river Rhine (Fig. 4B) no wildcats
could be detected after 1970 (Roben, 1974; Vogt and Grunwald,
1990). Despite the slow expansion of the wildcat population
after its total protection in the 1930s and the consistent suit-
ability of the patches, wildcats did not succeed in repopulat-
ing the area. This might be due to the large distance to the
nearest populated habitat patch together with barriers in
terms of human infrastructure, which are abundant in the
Rhine valley. The small size of the patches could also play a
role.
The wildcat as a species of the Annex IV in the European
Habitats Directive should be maintained in a favourable con-
servation status. Therefore, information on potential popula-
tion size within a patch, connectivity of patches and on
habitat quality is essential. With the predictive habitat map,
we were able to show that Rhineland-Palatinate contains
large areas of connected habitat in the central and north-wes-
tern part (Eifel and Hunsruck) which is partly connected to
the North Rhine-Westphalian, Belgian and Luxembourg popu-
lations. The large area predicted as suitable habitat and the
connectivity with other populations seem to provide good
conditions for the viability of wildcats in the centre of RLP.
However, the high density of roads and motorways may also
pose a threat to wildcats throughout the whole area. A rough
estimation shows that this area is large enough for about 1500
wildcats. For a more exact population size estimation data on
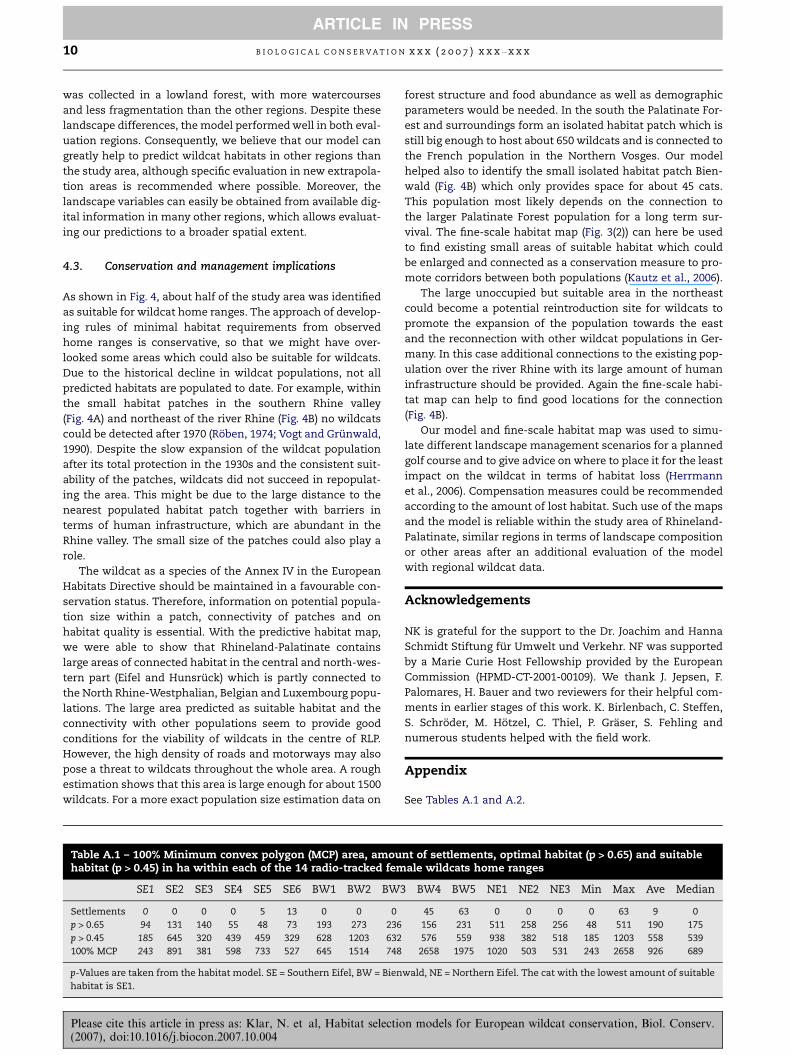
Table A.1 – 100% Minimum convex polygon (MCP) area, amouhabitat (p > 0.45) in ha within each of the 14 radio-tracked fem
SE1 SE2 SE3 SE4 SE5 SE6 BW1 BW2 BW3
Settlements 0 0 0 0 5 13 0 0 0
p > 0.65 94 131 140 55 48 73 193 273 236
p > 0.45 185 645 320 439 459 329 628 1203 632
100% MCP 243 891 381 598 733 527 645 1514 748
p-Values are taken from the habitat model. SE = Southern Eifel, BW = Bien
habitat is SE1.
Please cite this article in press as: Klar, N. et al, Habitat selectio(2007), doi:10.1016/j.biocon.2007.10.004
forest structure and food abundance as well as demographic
parameters would be needed. In the south the Palatinate For-
est and surroundings form an isolated habitat patch which is
still big enough to host about 650 wildcats and is connected to
the French population in the Northern Vosges. Our model
helped also to identify the small isolated habitat patch Bien-
wald (Fig. 4B) which only provides space for about 45 cats.
This population most likely depends on the connection to
the larger Palatinate Forest population for a long term sur-
vival. The fine-scale habitat map (Fig. 3(2)) can here be used
to find existing small areas of suitable habitat which could
be enlarged and connected as a conservation measure to pro-
mote corridors between both populations (Kautz et al., 2006).
The large unoccupied but suitable area in the northeast
could become a potential reintroduction site for wildcats to
promote the expansion of the population towards the east
and the reconnection with other wildcat populations in Ger-
many. In this case additional connections to the existing pop-
ulation over the river Rhine with its large amount of human
infrastructure should be provided. Again the fine-scale habi-
tat map can help to find good locations for the connection
(Fig. 4B).
Our model and fine-scale habitat map was used to simu-
late different landscape management scenarios for a planned
golf course and to give advice on where to place it for the least
impact on the wildcat in terms of habitat loss (Herrmann
et al., 2006). Compensation measures could be recommended
according to the amount of lost habitat. Such use of the maps
and the model is reliable within the study area of Rhineland-
Palatinate, similar regions in terms of landscape composition
or other areas after an additional evaluation of the model
with regional wildcat data.
Acknowledgements
NK is grateful for the support to the Dr. Joachim and Hanna
Schmidt Stiftung fur Umwelt und Verkehr. NF was supported
by a Marie Curie Host Fellowship provided by the European
Commission (HPMD-CT-2001-00109). We thank J. Jepsen, F.
Palomares, H. Bauer and two reviewers for their helpful com-
ments in earlier stages of this work. K. Birlenbach, C. Steffen,
S. Schroder, M. Hotzel, C. Thiel, P. Graser, S. Fehling and
numerous students helped with the field work.
Appendix
See Tables A.1 and A.2.
nt of settlements, optimal habitat (p > 0.65) and suitableale wildcats home ranges
BW4 BW5 NE1 NE2 NE3 Min Max Ave Median
45 63 0 0 0 0 63 9 0
156 231 511 258 256 48 511 190 175
576 559 938 382 518 185 1203 558 539
2658 1975 1020 503 531 243 2658 926 689
wald, NE = Northern Eifel. The cat with the lowest amount of suitable
n models for European wildcat conservation, Biol. Conserv.
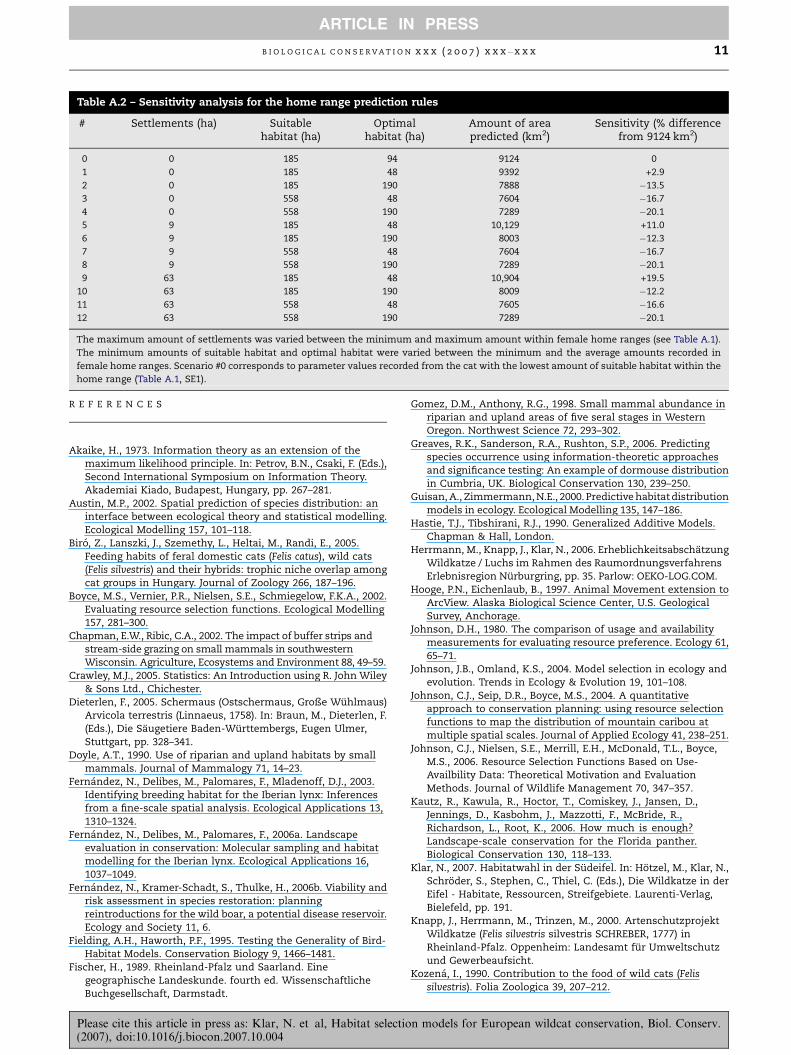
Table A.2 – Sensitivity analysis for the home range prediction rules
# Settlements (ha) Suitablehabitat (ha)
Optimalhabitat (ha)
Amount of areapredicted (km2)
Sensitivity (% differencefrom 9124 km2)
0 0 185 94 9124 0
1 0 185 48 9392 +2.9
2 0 185 190 7888 �13.5
3 0 558 48 7604 �16.7
4 0 558 190 7289 �20.1
5 9 185 48 10,129 +11.0
6 9 185 190 8003 �12.3
7 9 558 48 7604 �16.7
8 9 558 190 7289 �20.1
9 63 185 48 10,904 +19.5
10 63 185 190 8009 �12.2
11 63 558 48 7605 �16.6
12 63 558 190 7289 �20.1
The maximum amount of settlements was varied between the minimum and maximum amount within female home ranges (see Table A.1).
The minimum amounts of suitable habitat and optimal habitat were varied between the minimum and the average amounts recorded in
female home ranges. Scenario #0 corresponds to parameter values recorded from the cat with the lowest amount of suitable habitat within the
home range (Table A.1, SE1).
B I O L O G I C A L C O N S E R V A T I O N x x x ( 2 0 0 7 ) x x x – x x x 11
ARTICLE IN PRESS
R E F E R E N C E S
Akaike, H., 1973. Information theory as an extension of themaximum likelihood principle. In: Petrov, B.N., Csaki, F. (Eds.),Second International Symposium on Information Theory.Akademiai Kiado, Budapest, Hungary, pp. 267–281.
Austin, M.P., 2002. Spatial prediction of species distribution: aninterface between ecological theory and statistical modelling.Ecological Modelling 157, 101–118.
Biro, Z., Lanszki, J., Szemethy, L., Heltai, M., Randi, E., 2005.Feeding habits of feral domestic cats (Felis catus), wild cats(Felis silvestris) and their hybrids: trophic niche overlap amongcat groups in Hungary. Journal of Zoology 266, 187–196.
Boyce, M.S., Vernier, P.R., Nielsen, S.E., Schmiegelow, F.K.A., 2002.Evaluating resource selection functions. Ecological Modelling157, 281–300.
Chapman, E.W., Ribic, C.A., 2002. The impact of buffer strips andstream-side grazing on small mammals in southwesternWisconsin. Agriculture, Ecosystems and Environment 88, 49–59.
Crawley, M.J., 2005. Statistics: An Introduction using R. John Wiley& Sons Ltd., Chichester.
Dieterlen, F., 2005. Schermaus (Ostschermaus, Große Wuhlmaus)Arvicola terrestris (Linnaeus, 1758). In: Braun, M., Dieterlen, F.(Eds.), Die Saugetiere Baden-Wurttembergs, Eugen Ulmer,Stuttgart, pp. 328–341.
Doyle, A.T., 1990. Use of riparian and upland habitats by smallmammals. Journal of Mammalogy 71, 14–23.
Fernandez, N., Delibes, M., Palomares, F., Mladenoff, D.J., 2003.Identifying breeding habitat for the Iberian lynx: Inferencesfrom a fine-scale spatial analysis. Ecological Applications 13,1310–1324.
Fernandez, N., Delibes, M., Palomares, F., 2006a. Landscapeevaluation in conservation: Molecular sampling and habitatmodelling for the Iberian lynx. Ecological Applications 16,1037–1049.
Fernandez, N., Kramer-Schadt, S., Thulke, H., 2006b. Viability andrisk assessment in species restoration: planningreintroductions for the wild boar, a potential disease reservoir.Ecology and Society 11, 6.
Fielding, A.H., Haworth, P.F., 1995. Testing the Generality of Bird-Habitat Models. Conservation Biology 9, 1466–1481.
Fischer, H., 1989. Rheinland-Pfalz und Saarland. Einegeographische Landeskunde. fourth ed. WissenschaftlicheBuchgesellschaft, Darmstadt.
Please cite this article in press as: Klar, N. et al, Habitat selectio(2007), doi:10.1016/j.biocon.2007.10.004
Gomez, D.M., Anthony, R.G., 1998. Small mammal abundance inriparian and upland areas of five seral stages in WesternOregon. Northwest Science 72, 293–302.
Greaves, R.K., Sanderson, R.A., Rushton, S.P., 2006. Predictingspecies occurrence using information-theoretic approachesand significance testing: An example of dormouse distributionin Cumbria, UK. Biological Conservation 130, 239–250.
Guisan, A., Zimmermann, N.E., 2000. Predictive habitat distributionmodels in ecology. Ecological Modelling 135, 147–186.
Hastie, T.J., Tibshirani, R.J., 1990. Generalized Additive Models.Chapman & Hall, London.
Herrmann, M., Knapp, J., Klar, N., 2006. ErheblichkeitsabschatzungWildkatze / Luchs im Rahmen des RaumordnungsverfahrensErlebnisregion Nurburgring, pp. 35. Parlow: OEKO-LOG.COM.
Hooge, P.N., Eichenlaub, B., 1997. Animal Movement extension toArcView. Alaska Biological Science Center, U.S. GeologicalSurvey, Anchorage.
Johnson, D.H., 1980. The comparison of usage and availabilitymeasurements for evaluating resource preference. Ecology 61,65–71.
Johnson, J.B., Omland, K.S., 2004. Model selection in ecology andevolution. Trends in Ecology & Evolution 19, 101–108.
Johnson, C.J., Seip, D.R., Boyce, M.S., 2004. A quantitativeapproach to conservation planning: using resource selectionfunctions to map the distribution of mountain caribou atmultiple spatial scales. Journal of Applied Ecology 41, 238–251.
Johnson, C.J., Nielsen, S.E., Merrill, E.H., McDonald, T.L., Boyce,M.S., 2006. Resource Selection Functions Based on Use-Availbility Data: Theoretical Motivation and EvaluationMethods. Journal of Wildlife Management 70, 347–357.
Kautz, R., Kawula, R., Hoctor, T., Comiskey, J., Jansen, D.,Jennings, D., Kasbohm, J., Mazzotti, F., McBride, R.,Richardson, L., Root, K., 2006. How much is enough?Landscape-scale conservation for the Florida panther.Biological Conservation 130, 118–133.
Klar, N., 2007. Habitatwahl in der Sudeifel. In: Hotzel, M., Klar, N.,Schroder, S., Stephen, C., Thiel, C. (Eds.), Die Wildkatze in derEifel - Habitate, Ressourcen, Streifgebiete. Laurenti-Verlag,Bielefeld, pp. 191.
Knapp, J., Herrmann, M., Trinzen, M., 2000. ArtenschutzprojektWildkatze (Felis silvestris silvestris SCHREBER, 1777) inRheinland-Pfalz. Oppenheim: Landesamt fur Umweltschutzund Gewerbeaufsicht.
Kozena, I., 1990. Contribution to the food of wild cats (Felissilvestris). Folia Zoologica 39, 207–212.
n models for European wildcat conservation, Biol. Conserv.
12 B I O L O G I C A L C O N S E R V A T I O N x x x ( 2 0 0 7 ) x x x – x x x
ARTICLE IN PRESS
Kramer-Schadt, S., Revilla, E., Wiegand, T., 2005. Lynxreintroductions in fragmented landscapes of Germany:Projects with a future or misunderstood wildlife conservation?Biological Conservation 125, 169–182.
Landesforsten Rheinland-Pfalz, 2006. Internet representation.Ministerium fur Umwelt Forsten und VerbraucherschutzRheinland-Pfalz. 12.12.2006: www.wald-rlp.de.
Lecis, R., Pierpaoli, M., Biro, Z.S., Szemethy, L., Ragni, B., Vercillo,F., Randi, E., 2006. Bayesian analyses of admixture in wild anddomestic cats (Felis silvestris) using linked microsatellite loci.Molecular Ecology 15, 119–131.
Liberek, M., 1999. Eco-ethologie du chat sauvage Felis S. silvestris,Schreber 1777 dans le Jura Vaudois (Suisse). Influence de lacouverture neigeuse. These de doctorat, Universite deNeuchatel.
Lozano, J., Virgos, E., Malo, A.F., Huertas, D.L., Casanovas, J.G.,2003. Importance of scrub-pastureland mosaics for wild-livingcats occurrence in a Mediterranean area: implications forconservation of the wildcat (Felis silvestris). Biodiversity andConservation 12, 921–935.
Manly, B.F.J., McDonald, L.L., Thomas, D.L., 1993. ResourceSelection by Animals: Statistical Design and Analysis for FieldStudies. Chapman & Hall, London.
Mladenoff, D.J., Sickley, T.A., Wydeven, A.P., 1999. Predicting graywolf landscape recolonization: Logistic regression models vs.new field data. Ecological Applications 9, 37–44.
Naves, J., Wiegand, T., Revilla, E., Delibes, M., 2003. Endangeredspecies constrained by natural and human factors: The Caseof Brown Bears in Northern Spain. Conservation Biology 17,1276–1289.
Niedzialkowska, M., Jedrzejewski, W., Myslajek, R.W., Nowak, S.,Jedrzejewska, B., Schmidt, K., 2006. Environmental correlatesof Eurasian lynx occurrence in Poland – Large scale census andGIS mapping. Biological Conservation 133, 63–69.
Nielsen, S.E., Herrero, S., Boyce, M.S., Mace, R.D., Benn, B., Gibeau,M.L., Jevons, S., 2004. Modelling the spatial distribution ofhuman-caused grizzly bear mortalities in the Central Rockiesecosystem of Canada. Biological Conservation 120, 101–113.
Niethammer, J., Krapp, F., 1982. Handbuch der Saugetiere Europas.Akademische Verlagsgesellschaft, Wiesbaden.
Okarma, H., Sniezko, S., Olszanska, A., 2002. The occurrence ofwildcat in the Polish Carpathian Mountains. Acta Theriologica47, 499–504.
Osborne, P.E., Suarez-Seoane, S., 2002. Should data be partitionedspatially before building large-scale distribution models?Ecological Modelling 157, 249–259.
Osbourne, J., Anderson, J., Spurgeon, A., 2005. Effects of habitat onsmall-mammal diversity and abundance in West Virginia.Wildlife Society Bulletin 33, 814–822.
Parent, G.H., 1975. La migration recente, a caractere invasionnel,du chat sauvage, Felis silvestris Lorraine Belge. Mammalia 39,251–288.
Pearce, J.L., Boyce, M.S., 2006. Modelling distribution andabundance with presence-only data. Journal of AppliedEcology 43, 405–412.
Pearce, J., Ferrier, S., 2000. Evaluating the predictive performanceof habitat models developed using logistic regression.Ecological Modelling 133, 225–245.
Pearce, J.L., Cherry, K., Drielsma, M., Ferrier, S., Whish, G., 2001.Incorporating expert opinion and fine-scale vegetationmapping into statistical models of faunal distribution. Journalof Applied Ecology 38, 412–424.
Peterson, J.T., Dunham, J.A., 2003. Combining inferences frommodels of capture efficiency, detectability, and suitable habitatto classify landscapes for conservation of threatened bulltrout. Conservation Biology 17, 1070–1077.
Piechocki, R., 1990. Die Wildkatze, first ed. A. Ziemsen, WittenbergLutherstadt.
Please cite this article in press as: Klar, N. et al, Habitat selectio(2007), doi:10.1016/j.biocon.2007.10.004
Pierpaoli, M., Biro, S., Herrmann, M., Hupe, K., Fernandes, M.,Ragni, B., Szemethy, L., Randi, E., 2003. Genetic distinction ofwildcat (Felis silvestris) populations in Europe, andhybridization with domestic cats in Hungary. MolecularEcology 12, 2585–2598.
Pott-Dorfer, B., Raimer, F., 2004. Zur Verbreitung der Wildkatze inNiedersachsen. Informationsdienst NaturschutzNiedersachsen 6, 279–281.
Richards, S.A., 2005. Testing ecological theory using theinformation-theoretic approach: exmaples and cautionaryresults. Ecology 86, 2805–2814.
Roben, P., 1974. Die Verbreitung der Wildkatze, Felis silvestrisSchreber, 1777, in der Bundesrepublik Deutschland.Saugetierkundliche Mitteilungen 22, 244–250.
Rushton, S.P., Ormerod, S.J., Kerby, G., 2004. New paradigms formodelling species distributions? Journal of Applied Ecology 41,193–200.
Sawyer, H., Nielson, R.M., Lindzey, F., McDonald, L.L., 2006. Winterhabitat selection of mule deer before and during thedevelopment of a natural gas field. Journal of WildlifeManagement 70, 396–403.
Schadt, S., Knauer, F., Kaczensky, P., Revilla, E., Wiegand, T., Trepl,L., 2002a. Rule-based assessment of suitable habitat and patchconnectivity for the Eurasian lynx in Germany. EcologicalApplications 12, 1469–1483.
Schadt, S., Revilla, E., Wiegand, T., Knauer, F., Kaczensky, P.,Breitenmoser, U., Bufka, L., Cerveny, J., Koubek, P., Huber, T.,Stanisa, C., Trepl, L., 2002b. Assessing the suitability of centralEuropean landscapes for the reintroduction of Eurasian lynx.Journal of Applied Ecology 39, 189–203.
Seoane, J., Vinuela, J., Diaz-Delgado, R., Bustamante, J., 2003.The effects of land use and climate on red kite distributionin the Iberian peninsula. Biological Conservation 111,401–414.
Seoane, J., Justribo, J.H., Garcia, F., Retamar, J., Rabadan, C.,Atienza, J.C., 2006. Habitat-suitability modelling to assess theeffects of land-use changes on Dupont’s lark Chersophilusduponti: A case study in the Layna Important Bird Area.Biological Conservation 128, 241–252.
Sladek, S., 1973. Jahreszeitliche und jahresbedingteVeranderungen der Nahrung der Wildkatze (Felis silvestris,Schreber 1777) in den Westkarpaten. Zoologicke Listy 22,127–144.
Stahl, P., 1986. Le chat forestier d’Europe (Felis silvestris, SCHREBER1777). Exploitation des ressources et organisation spatiale.These de doctorat, Universite de Nancy I.
Stahl, P., Artois, M., 1995. Status and conservation of the wildcat(Felis silvestris) in Europe and around the Mediterranean rim,pp. 76. Strasbourg: Council of Europe.
Stubbe, M., Stubbe, A., 2002. Die Wildkatze kehrt zuruck. Wild undHund 10, 24–25.
Sullivan, T.P., Sullivan, D.S., 2006. Plant and small mammaldiversity in orchard versus non-crop habitats. Agriculture,Ecosystems and Environment 116, 235–243.
Sunde, P., Snorre, O.S., Kvam, T., 1998. Tolerance to humans ofresting lynxes Lynx lynx in a hunted population. WildlifeBiology 4, 177–183.
Vogt, D., Grunwald, A., 1990. Die Wildkatze. MainzerNaturwissenschaftliches Archiv Beiheft 13, 347–356.
White, G.C., Garrott, R.A., 1990. Analysis of Wildlife Radio-Tracking Data. Academic Press, San Diego.
Wittmer, H.U., 2001. Home range size, movements, and habitatutilization of three male European wildcats (Felis silvestrisSchreber, 1777) in Saarland and Rheinland-Pfalz (Germany).Mammalian Biology 66, 365–370.
Woolf, A., Nielsen, C.K., Weber, T., Gibbs-Kieninger, T.J., 2002.Statewide modeling of bobcat, Lynx rufus, habitat in Illinois,USA. Biological Conservation 104, 191–198.
n models for European wildcat conservation, Biol. Conserv.
Related Documents