10.1101/gr.169011.113 Access the most recent version at doi: published online September 30, 2014 Genome Res. Agustín F Fernández, Gustavo F Bayón, Rocío G Urdinguio, et al. human stem and differentiated cells H3K4me1 marks DNA regions hypomethylated during aging in P<P Published online September 30, 2014 in advance of the print journal. Manuscript Accepted manuscript is likely to differ from the final, published version. Peer-reviewed and accepted for publication but not copyedited or typeset; accepted License Commons Creative . http://creativecommons.org/licenses/by-nc/4.0/ described at a Creative Commons License (Attribution-NonCommercial 4.0 International), as ). After six months, it is available under http://genome.cshlp.org/site/misc/terms.xhtml first six months after the full-issue publication date (see This article is distributed exclusively by Cold Spring Harbor Laboratory Press for the Service Email Alerting click here. top right corner of the article or Receive free email alerts when new articles cite this article - sign up in the box at the object identifier (DOIs) and date of initial publication. by PubMed from initial publication. Citations to Advance online articles must include the digital publication). Advance online articles are citable and establish publication priority; they are indexed appeared in the paper journal (edited, typeset versions may be posted when available prior to final Advance online articles have been peer reviewed and accepted for publication but have not yet http://genome.cshlp.org/subscriptions go to: Genome Research To subscribe to Published by Cold Spring Harbor Laboratory Press Cold Spring Harbor Laboratory Press on October 29, 2014 - Published by genome.cshlp.org Downloaded from Cold Spring Harbor Laboratory Press on October 29, 2014 - Published by genome.cshlp.org Downloaded from

Welcome message from author
This document is posted to help you gain knowledge. Please leave a comment to let me know what you think about it! Share it to your friends and learn new things together.
Transcript

10.1101/gr.169011.113Access the most recent version at doi: published online September 30, 2014Genome Res.
Agustín F Fernández, Gustavo F Bayón, Rocío G Urdinguio, et al. human stem and differentiated cellsH3K4me1 marks DNA regions hypomethylated during aging in
P<P
Published online September 30, 2014 in advance of the print journal.
Manuscript
Accepted
manuscript is likely to differ from the final, published version. Peer-reviewed and accepted for publication but not copyedited or typeset; accepted
License
Commons Creative
.http://creativecommons.org/licenses/by-nc/4.0/described at
a Creative Commons License (Attribution-NonCommercial 4.0 International), as ). After six months, it is available underhttp://genome.cshlp.org/site/misc/terms.xhtml
first six months after the full-issue publication date (see This article is distributed exclusively by Cold Spring Harbor Laboratory Press for the
ServiceEmail Alerting
click here.top right corner of the article or
Receive free email alerts when new articles cite this article - sign up in the box at the
object identifier (DOIs) and date of initial publication. by PubMed from initial publication. Citations to Advance online articles must include the digital publication). Advance online articles are citable and establish publication priority; they are indexedappeared in the paper journal (edited, typeset versions may be posted when available prior to final Advance online articles have been peer reviewed and accepted for publication but have not yet
http://genome.cshlp.org/subscriptionsgo to: Genome Research To subscribe to
Published by Cold Spring Harbor Laboratory Press
Cold Spring Harbor Laboratory Press on October 29, 2014 - Published by genome.cshlp.orgDownloaded from Cold Spring Harbor Laboratory Press on October 29, 2014 - Published by genome.cshlp.orgDownloaded from

1
H3K4me1 marks DNA regions hypomethylated during aging in human stem and differentiated cells Agustín F. Fernández1†*, Gustavo F. Bayón1†, Rocío G. Urdinguio1, Estela G. Toraño1, María G. García1; Antonella Carella1; Sandra Petrus-Reurer1, Cecilia Ferrero1, Pablo Martinez-Camblor2, Isabel Cubillo3, Javier García-Castro3, Jesús Delgado-Calle4, Flor M. Pérez-Campo4, José A. Riancho4, Clara Bueno5, Pablo Menéndez5,6, Anouk Mentink7, Katia Mareschi8,9, Fabian Claire10, Corrado Fagnani11, Emanuela Medda11, Virgilia Toccaceli11, Sonia Brescianini11, Sebastián Moran12, Manel Esteller6, 12, 13, Alexandra Stolzing10,14, Jan de Boer7,15, Lorenza Nisticò11, Maria A. Stazi11 and Mario F. Fraga1,16*. 1Cancer Epigenetics Laboratory, Institute of Oncology of Asturias (IUOPA), HUCA, Universidad de Oviedo, Oviedo, Spain. 2Oficina de Investigación Biosanitaria (OIB-FICYT) de Asturias, Oviedo, Spain and Universidad Autónoma de Chile, Chile. 3Unidad de Biotecnología Celular. Área de Genética Humana. Instituto de Salud Carlos III. 4Department of Internal Medicine, Hospital U.M. Valdecilla, University of Cantabria, IDIVAL. Santander. 5Josep Carreras Leukemia Research Institute. School of Medicine. University of Barcelona. 08036. Barcelona. Spain 6Institut Català de Recerca i Estudis Avançats (ICREA). Barcelona. Spain. 7MIRA Institute of Biomedical Technology and Technical Medicine, University of Twente, Enschede, The Netherlands 8Pediatric Onco-Hematology, Stem Cell Transplantation and Cellular Therapy Division, City of Science and Health of Turin, Regina Margherita Children’s Hospital; Turin, Italy 9 Department of Public Health and Pediatrics, University of Turin, Italy 10Translational Centre for Regenerative Medicine, University Leipzig, Leipzig, Germany 11Genetic Epidemiology Unit; National Centre of Epidemiology, Surveillance and Health Promotion; Istituto Superiore di Sanità; Viale Regina Elena 299, 00161, Rome, Italy 12Cancer Epigenetics and Biology Program (PEBC), Bellvitge Biomedical Research Institute (IDIBELL), Barcelona, Catalonia, Spain. 13Department of Physiological Sciences II, School of Medicine, University of Barcelona, 08036 Barcelona, Catalonia, Spain. 14Loughborough University, Wolfson School of Mechanical and Manufacturing Engineering, Loughborough, UK 15cBITE laboratory, Merln Institute of Technology-inspired Regenerative Medicine, Maastricht University, Maastricht, The Netherlands 16Department of Immunology and Oncology, National Center for Biotechnology, CNB-CSIC, Cantoblanco, 28049 Madrid, Spain. †Same contribution. *Correspondence to: Mario F. Fraga: [email protected] Agustín F. Fernández: [email protected] Short title: Epigenetic signatures of aging
Cold Spring Harbor Laboratory Press on October 29, 2014 - Published by genome.cshlp.orgDownloaded from
2
Abstract In differentiated cells, aging is associated with hypermethylation of DNA regions
enriched in repressive histone posttranslational modifications. However, the chromatin
marks associated with changes in DNA methylation in adult stem cells during lifetime
are still largely unknown. Here, DNA methylation profiling of mesenchymal stem cells
obtained from individuals aged 2 to 92 identified 18735 hypermethylated and 45407
hypomethylated CpG sites associated with aging. As in differentiated cells,
hypermethylated sequences were enriched in chromatin repressive marks. Most
importantly, hypomethylated CpG sites were strongly enriched in the active chromatin
mark H3K4me1 in stem and differentiated cells, suggesting this is a cell type-
independent chromatin signature of DNA hypomethylation during aging. Analysis of
scedasticity showed that interindividual variability of DNA methylation increased
during aging in MSCs and differentiated cells, providing a new avenue for the
identification of DNA methylation changes over time. DNA methylation profiling of
genetically identical individuals showed that both the tendency of DNA methylation
changes and scedasticity depended on non-genetic as well as genetic factors. Our results
indicate that the dynamics of DNA methylation during aging depend on a complex
mixture of factors that include the DNA sequence, cell type and chromatin context
involved, and that, depending on the locus, the changes can be modulated by genetic
and/or external factors.
Cold Spring Harbor Laboratory Press on October 29, 2014 - Published by genome.cshlp.orgDownloaded from
3
Introduction
Genomic DNA methylation is known to change during lifetime and aging (Jaenisch and
Bird 2003). Some changes play important roles in development but others occur
stochastically without any apparent biological purpose (Fraga 2009; Feil and Fraga
2012). These molecular alterations, which are known as the epigenetic drift, are
currently being investigated as they have been proposed to account for many age-related
diseases (Bjornsson et al. 2004; Heyn et al. 2013; Timp and Feinberg 2013). Various
recent studies using 1.5K and 27K Illumina methylation arrays have identified a group
of gene promoters in blood that become hypermethylated during aging (Christensen et
al. 2009; Rakyan et al. 2010; Teschendorff et al. 2010; Bell et al. 2012; Fernandez et al.
2012). Interestingly, some of these studies have also shown that these DNA sequences
are enriched in bivalent chromatin domains in embryonic stem cells (Rakyan et al.
2010; Fernandez et al. 2012; Heyn et al. 2012) and repressive histone marks such as
H3K9me3 and H3K27me3 in differentiated cells (Rakyan et al. 2010), and that many of
them are also frequently hypermethylated in cancer. However, drawing conclusions
from some of these studies is limited by their low genome coverage (less than 0.1%)
and the location of the sequences analyzed (mainly at gene promoters). Further studies
using HumanMethylation450 BeadChip and larger cohorts (Heyn et al. 2012; Hannum
et al. 2013; Johansson et al. 2013) have, though, corroborated most of the previous
observations with the 27K methylation arrays and have, in addition, identified new sets
of genes that become hypermethylated and hypomethylated during aging in humans.
Finally, a recent study that analyzed the genome wide DNA methylation status of
newborns, middle-aged individuals and centenarians confirmed the results obtained
with the methylation arrays and showed that aging is associated with overall
hypomethylation, which primarily occurs at repetitive DNA sequences (Heyn et al.
2012). Most of the above studies were conducted with whole blood and, consequently,
changes in cell heterogeneity during aging could have affected the results (Calvanese et
al. 2012; Houseman et al. 2012). However, some genes presented consistent changes in
different tissues which indicates that, in some cases, the changes truly are associated
with aging (Rakyan et al. 2010; Horvath et al. 2012). Interestingly, Houseman and
colleagues (Houseman et al. 2012) have recently reported an algorithm that, using the
DNA methylation values of certain genes, estimates the relative proportion of the
different blood cell types in a specific sample. This algorithm was successfully used by
Cold Spring Harbor Laboratory Press on October 29, 2014 - Published by genome.cshlp.orgDownloaded from
4
Liu and colleagues in a study to identify DNA methylation alterations associated with
rheumatoid arthritis (Liu et al. 2013).
In addition to the studies using blood, other works have identified specific DNA
methylation signatures of aging in differentiated cell types including brain (Hernandez
et al. 2011; Numata et al. 2012; Guintivano et al. 2013; Lister et al. 2013), muscle
(Zykovich et al. 2014) and saliva (Bocklandt et al. 2011). Two studies have analyzed
DNA methylation during aging in human adult stem cells: Bork and colleagues (Bork et
al. 2010) used 27k methylation arrays to analyze the DNA methylation status of
mesenchymal stem cells (MSCs) obtained from young (21–50 years) and old donors
(53–85 years) and found similar DNA methylation changes over time during prolonged
in vitro culture and in vivo aging. Using the same methylation arrays, Bocker and
colleagues (Bocker et al. 2011) observed a bimodal pattern of methylation changes in
older hematopoietic progenitor cells, with hypomethylation of differentiation-associated
genes, as well as de novo methylation events resembling epigenetic mutations. Recent
studies in mice have revealed a number of genome-wide alterations in DNA methylation
(Taiwo et al. 2013) which might play an important role in the functional decline of
hematopoietic stem cells during aging (Beerman et al. 2013). To study the role of DNA
methylation in adult stem cell aging further, the present study used
HumanMethylation450 BeadChips to characterize the genome wide DNA methylation
status of bone marrow MSCs obtained from individuals aged between 2 and 92. We
then systematically compared our results with previously published data to identify the
chromatin signatures associated with DNA methylation changes in adult stem cells and
to determine whether these changes were also present in other tissues. Finally, we
analyzed monozygotic twins of different ages to determine the effect of genetic factors
on the DNA methylation changes during aging identified in our study.
Cold Spring Harbor Laboratory Press on October 29, 2014 - Published by genome.cshlp.orgDownloaded from

5
Results
Global DNA methylation profiling in adult MSCs
To identify DNA methylation changes during MSC aging we compared the DNA
methylation status of 429789 CpG sites in 34 independently isolated primary MSC,
obtained from individuals from 2 to 92-years old, using the HumanMethylation450
BeadChip (Illumina®) (Supplemental Fig. S1 and Supplemental Table 1).
Using an empirical Bayes moderated t-test (see Materials and Methods) we first
identified 64142 autosomal CpG sites which were differentially methylated (dmCpGs)
(FDR<0.05) between MSCs obtained from young (ages ranging from 2 to 22) and
elderly (aged between 61 and 91) individuals. Hierarchical clustering of all samples
using the dmCpGs alone enabled each sample to be correctly allocated to its
corresponding age group (Figure 1A). Of the dmCpG sites, 18735 (29.20%) had
become hypermethylated and 45407 (70.80%) hypomethylated with aging (Figure 1B
and Supplemental Tables 2, 3).
To study, from a functional genomics point of view, the characteristics of these dmCpG
sites we first determined their distribution within the different regions of the CpG
islands (Wu et al. 2010). Interestingly, both hyper- and hypomethylated CpG sites were
enriched in non CpG islands (CGI) (chi-square test; p<0.001, OR=2.58 and p<0.001,
OR=1.76 respectively) (Figure 1C) and in intragenic DNA regions (chi-square test;
p<0.001, OR=1.23 and p<0.001, OR=1.34 respectively) (Figure 1D).
To validate the results obtained with the methylation arrays, we randomly selected 5 of
the sequences previously identified and analyzed their methylation status by bisulfite
pyrosequencing in an independent cohort of 46 MSCs obtained from individuals from 7
months to 80-years old (Supplemental Table 1). In total, in the validation phase we
obtained information on the DNA methylation status of 950 CpGs. The sequences
selected corresponded to the genes HAND2 and SIX2, which become hypermethylated
with aging, and to the genes TBX15, PITX2 and HOXA11, which become
hypomethylated. Bisulfite pyrosequencing results showed that all the sequences selected
for validation displayed the same DNA methylation dynamics during aging as in the
study samples (Figure 1 E).
Tissue-specific DNA methylation changes during aging
Cold Spring Harbor Laboratory Press on October 29, 2014 - Published by genome.cshlp.orgDownloaded from

6
Global DNA methylation patterns are tissue/cell type-specific (Calvanese et al. 2012).
To determine whether the CpG sites displaying DNA methylation changes during aging
in adult stem cells are also affected in differentiated tissues, we used the same workflow
described in the previous section to analyze the data obtained in previous aging studies
which used the same methylation arrays with samples from blood (human whole blood
from a mixed population of 426 Caucasian and 230 Hispanic individuals, with ages
ranging from 19 to 101) and brain (neuronal and glial cells, from post mortem frontal
cortex of 29 healthy individuals (14 male, 15 female, aged 32.6 ± 16.1) (Guintivano et
al. 2013; Hannum et al. 2013) (Supplemental Fig. S1). To reduce confounding factors
in the blood dataset, we first corrected for cellular heterogeneity with respect to the
major cell subtypes (Houseman et al. 2012) to filter out only those associations which
were the consequence of aging. Using this approach we identified 63512
hypermethylated and 60155 hypomethylated sequences in blood (FDR<0.05), 11603
hypermethylated and 14143 hypomethylated sequences in glial cells (FDR<0.05) and
5171 hypermethylated and 2380 hypomethylated sequences in neural cells (FDR<0.05)
(Supplemental Fig. S2 and Supplemental Tables 4, 5). As in MSCs, hypomethylated
cytosines in the differentiated cells preferentially occurred at both non-CGI regions
(chi-square test; blood, p<0.001, OR=2.35; neural, p<0.001, OR=1.74; glial, p<0.001,
OR=3.03) and at intragenic regions (chi-square test; blood, p<0.001, OR=1.11; neural,
p<0.001, OR=2; glial, p<0.001, OR=1.89) (Supplemental Fig. S2). However, in brain
samples (neuronal and glial cells), hypermethylated cytosines occurred preferentially at
both non-CGI regions (chi-square test; neural, p<0.001, OR=1.43; glial, p<0.001,
OR=1.43) and at intragenic regions (chi-square test; neural, p<0.001, OR=1.1; glial,
p<0.001, OR=1.1), while they occurred preferentially in both CGIs (chi-square test;
p<0.001, OR=3.5) and at promoter regions (chi-square test; p<0.001, OR=1.49) in
blood samples (Supplemental Fig. S2).
To identify possible cell type-independent DNA methylation signatures of aging, we
created two additional datasets containing the hyper- and hypomethylated probes from
selected subsets of the different tissues analyzed (Figure 1F). This approach showed
only a small overlap between MSC and differentiated cells (42 hypomethylated and 38
hypermethylated), suggesting that systemic DNA methylation changes during aging are
restricted to specific regions of the genome (Figure 1F and Supplemental Tables 6,
7).
Cold Spring Harbor Laboratory Press on October 29, 2014 - Published by genome.cshlp.orgDownloaded from

7
Hypermethylated CpG sites during aging are associated with repressive chromatin
marks
In blood, DNA hypermethylation during aging has been shown to occur at gene
promoters enriched in repressive histone marks such as H3K9me3 and H3K27me3
(Rakyan et al. 2010). To identify possible chromatin signatures associated with DNA
hypermethylation during aging in adult MSCs, we compared our methylation data with
previously published data on a range of histone modifications and chromatin modifiers
in 10 different cell types obtained from healthy individuals (see Materials and
Methods). In the present study we found statistically significant associations with the
repressive histone marks H3K9me3, H3K27me3 and EZH2 in most differentiated
ENCODE cell lines (Fisher´s exact test; p<0.001) (Figure 2), which is in line with
previously published data (Rakyan et al. 2010). To determine whether these
observations can be extrapolated to other cell types, we used the same approach to
analyze the CpG sites which are hypermethylated during aging in blood, neural and
glial cells (Guintivano et al. 2013; Hannum et al. 2013) (Supplemental Table 4). The
results showed that hypermethylated CpG sites in blood and brain were enriched in the
same chromatin marks identified in the adult MSCs (Figure 2), suggesting that
chromatin context is an important cell type-independent mark of DNA
hypermethylation during aging. Analysis of the 38 commonly hypermethylated CpG
sites in blood, MSCs and neural and glial cells also showed statistically significant
associations (FDR<0.05) with the repressive histone marks H3K9me3, H3K27me3 and
EZH2 found in some types of differentiated cells (Figure 2).
DNA hypomethylation during aging preferentially occurs at H3K4me1 rich sites
To identify chromatin marks associated with CpG sites hypomethylated in aged MSCs,
we aligned the DNA sequences identified in our study with the same database of histone
modifications and chromatin modifiers described in the previous section. Of note is the
fact that hypomethylation largely occurred at regions occupied by the active histone
mark H3K4me1 in most of the ENCODE cell lines (FDR<0.05) (Figure 2).
To determine whether these associations occurred in differentiated cells, we used the
same approach to analyze CpG hypomethylation during aging in blood, neural and glial
cells (Guintivano et al. 2013; Hannum et al. 2013) (Supplemental Table 5). Blood and
Cold Spring Harbor Laboratory Press on October 29, 2014 - Published by genome.cshlp.orgDownloaded from

8
brain samples showed similar enrichment patterns to those of the MSCs in that
hypomethylated CpG sites were preferentially located at regions enriched in H3K4me1
(Figure 2). Interestingly, the analysis of the 42 commonly hypomethylated CpG sites in
blood, MSCs and neural and glial cells only showed statistically significant associations
with H3K4me1 (FDR<0.05) (Figure 2A).
Dynamics of interindividual DNA methylation variability during aging
As in most previous studies on DNA methylation and aging, our analytical design
allowed the identification of DNA sequences showing a specific tendency to change
(hyper- or hypomethylation) during aging, but not other putative DNA regions
exhibiting no change tendency (i.e., sequences that do not become hyper- or
hypomethylated with aging but rather show an increase or a decrease in interindividual
variability). To address this issue, we carried out an alternative data analysis on our
MSCs based on the aging-dependent behavior of interindividual variability (i.e. DNA
methylation scedasticity). Interindividual variability was higher in MSCs obtained from
older individuals than in those obtained from younger individuals (Figure 3A). Analysis
of the scedasticity identified 16243 heteroscedastic CpG sites, of which 2437 were
convergent and 13806 divergent. We also identified 124611 homoscedastic CpG sites,
68927 showing low interindividual variability in both young and old individuals (LV)
and 55684 showing high interindividual variation in both populations (HV) (see
Materials and Methods) (Figure 3B, C and Supplemental Tables 8-11).
We studied these sequences from a functional genomics standpoint to identify factors
associated with the behavior of DNA methylation changes during aging. We observed
that divergent and HV CpG sites were preferentially enriched in non-CGIs (chi-square
test; p<0.001, OR=1.59 and p<0.001, OR=1.58 respectively), and convergent and LV
CpG sites in CGIs (chi-square test; p<0.001, OR=1.11 and p<0.001, OR=5.00
respectively) (Figure 3D). Both divergent and convergent sequences were more
abundant in intragenic regions (chi-square test; p<0.001, OR=1.38 and p<0.001,
OR=1.16 respectively), with HV being more frequently found in intergenic regions (chi-
square test; p<0.001, OR=1.50), and LV in promoter regions (chi-square test; p<0.001,
OR=3.62) (Figure 3D).
To determine whether scedasticity behavior can also identify DNA methylation changes
during aging in differentiated cells we repeated these same analyses on previously
Cold Spring Harbor Laboratory Press on October 29, 2014 - Published by genome.cshlp.orgDownloaded from
9
published blood DNA methylation data (Hannum et al. 2013). As Hannum et al.’s
cohort contains DNA methylation data on more than 600 individuals, statistical analyses
were carried out using a Brown-Forsythe test (see Materials and Methods). To discount
a possible confounding effect of cell heterogeneity in the analysis of the scedasticity in
blood, in addition to applying the algorithm described by Houseman et al. (Houseman et
al. 2012), we carried out in silico functional analysis of the groups of genes established
according to the behavior of the variance (see Materials and Methods). These analyses
showed no significant associations between these groups of genes and any of the blood
cell lineages examined (Supplemental Tables 12 and 13). As in MSCs, interindividual
variability was higher in blood obtained from older individuals than in blood obtained
from younger individuals (Figure 4A). Furthermore, in line with the findings for adult
MSCs, in differentiated cells, the analyses identified 19454 heteroscedastic CpG sites,
of which 4037 were convergent and 15417 divergent. Of the homoscedastic CpG sites,
92074 showed LV in both young and old individuals and 92753 showed HV in both
populations (Figure 4B, C).
The role of genetic factors on DNA methylation changes during aging
To study the role of genetic factors on DNA methylation changes during aging we used
HumanMethylation450 BeadChips to analyze the DNA methylation status of 24
monozygotic twins from two age groups (young, 21-22-yo and old, 58-66-yo). The
effect of genotype was assessed comparing the Euclidean distance (ED) and the
interindividual variability in methylation values between old and young monozygotic
(MZ) pairs. To reduce possible bias due to cell heterogeneity, DNA methylation data
was corrected with the algorithm described by Houseman (Houseman et al. 2012). As in
the larger cohort previously analyzed (Figure 4), interindividual DNA methylation
variability substantially increased during aging in the MZ twins (Figure 5A).
Interestingly, mean ED between MZ twins also increased (> 2-fold) with age in 46763
CpG sites (Figure 5B and Supplemental Table 14), which indicates that, at these CpG
sites, the increase in interindividual methylation variability depends, at least in part, on
non-genetic factors. In 24782 of these sequences (Figure 5B and Supplemental Table
15) the increase in ED (> 2-fold) was higher than could be accounted for solely by
interindividual variability, suggesting that, in these CpG sites, genetic factors play a less
important role in the regulation of DNA methylation changes during aging. However, in
Cold Spring Harbor Laboratory Press on October 29, 2014 - Published by genome.cshlp.orgDownloaded from

10
21908 of these sequences (Figure 5B and Supplemental Table 16), the increase in ED
(> 2-fold) was less than could be accounted for solely by interindividual variability,
which suggests that, in contrast, at these CpG sites, genetic factors are more relevant for
the regulation of DNA methylation during aging.
Although the general trend was an increase in ED with age, for 22542 CpG sites ED
between older MZ pairs decreased (> 2-fold) (Figure 5B and Supplemental Table 17).
As the EDs between older MZ individuals are greater than those between younger MZs
in more than half the sequences identified, our results support the notion that, in general,
DNA methylation patterns diverge with age, even in genetically identical individuals. In
11624 sequences (Figure 5B and Supplemental Table 18) the decrease in ED (> 2-
fold) was lower than could be accounted for solely by interindividual variability, which
suggests that, in these CpG sites, genetic factors play a more important role in the
regulation of DNA methylation changes during aging. In 10883 sequences (Figure 5B
and Supplemental Table 19), the decrease in ED was higher than could be accounted
for solely by interindividual variability, indicating that in these CpG sites, genetic
factors play a less important role in the regulation of DNA methylation during aging. As
in the analysis of the previously published blood DNA methylation data, in silico
functional analysis of the groups of genes identified in the monozygotic twins
(Supplemental Tables 20,21), suggested that, after correcting with the Houseman
algorithm, cell heterogeneity had little impact on the Euclidean distances for changes in
DNA methylation with age.
Comparative analysis of the interindividual variation and the EDs suggests that the
effect of genotype on the regulation of DNA methylation changes during aging was
locus-specific. Thus, to identify those DNA regions differentially affected by the
genotype, we used Circos representations to study the genomic distribution of CpG sites
which showed changes in ED with age (Figure 5C). The results demonstrated that
whilst CpG sites showing a decrease, or no difference, in ED between young and old
MZs presented a random distribution, those showing an age-dependent increase in ED
were strongly enriched in subtelomeric DNA regions. The greatest changes occurred at
chromosomes 11 and 19 and, in general, clustering occurred at the same genomic
regions in both young and old twins.
To study the effect of the genotype on DNA methylation and its interindividual
variability during aging we analyzed the Twins data using similar strategies to those
Cold Spring Harbor Laboratory Press on October 29, 2014 - Published by genome.cshlp.orgDownloaded from

11
described in previous sections, identifying 41987 hypermethylated, 56923
hypomethylated, 1018 convergent, 1635 divergent, 58680 HV and 59795 LV CpG sites
(data not shown). The comparison of EDs between young and old MZ pairs for these
groups of genes showed that the effect of genotype depended on the tendency and the
scedasticity of the change (Figure 5D).
ED increased (>2-fold) with age in 9.5% of the hypomethylated and in 14% of the
hypermethylated CpGs, suggesting that genetic factors have a greater effect on the
former during aging (Figure 5D and Supplemental Tables 22, 23). ED increased (>2-
fold) in most (83.73%) of the divergent CpG sites and decreased (>2-fold) in most
(66.7%) of the convergent CpG sites (Figure 5D and Supplemental Tables 24, 25).
However, changes in interindividual variability were higher than the increase or
decrease in ED (Figure 5D), which indicates that genetic factors play a role in the
regulation of DNA methylation of these DNA regions during aging. Interestingly, ED
also increased in most of the HV and LV sequences (>2-fold) during aging (Figure 5D).
Furthermore, in most CpG sites, the increase in ED between the MZ twins was higher
than the interindividual variability changes during aging (Figure 5D), suggesting that
genotype has little effect on epigenetic drift in homoscedastic DNA regions.
Cold Spring Harbor Laboratory Press on October 29, 2014 - Published by genome.cshlp.orgDownloaded from
12
Discussion
Recent studies have shown that DNA methylation is altered during aging in a number of
differentiated cell types (Rakyan et al. 2010; Teschendorff et al. 2010; Bell et al. 2012;
Fernandez et al. 2012; Heyn et al. 2012; Numata et al. 2012; Guintivano et al. 2013;
Hannum et al. 2013; Johansson et al. 2013). Here, we studied the dynamics and the
context of DNA methylation changes during aging in human adult stem cells as they
have been proposed to play an important role in aging (Sharpless and DePinho 2004).
Indeed, a recent study in mice showed that epigenomic alterations of the DNA
methylation landscape contribute to the functional decline of hematopoietic stem cells
(HSCs) during aging (Beerman et al. 2013). To analyze our DNA methylation data, we
first used an analytical strategy similar to that used in most of the previous studies on
DNA methylation and aging (i.e. linear models). Using this approach, we identified
18735 CpG sites which were hypermethyated and 45407 which were hypomethylated
during aging in MSCs, which provides support for the idea that, as in blood (Heyn et al.
2012), aging is associated with global DNA hypomethylation in MSCs. In addition, we
validated 5 of the genes identified through the methylation arrays (HAND2, SIX2,
TBX15, PITX2, and HOXA11) by bisulfite pyrosequencing, using an independent
sample set of 46 MSCs obtained from individuals from 7 months to 80-years old. The
results corroborated the data obtained from the methylation arrays and suggest that our
genome-wide data can be extrapolated to independent sample sets of MSCs. HAND2
and SIX2 genes code for transcription factors and have been also found hypermethylated
in several cancer types (Rauch et al. 2006; Tong et al. 2010; Jones et al. 2013). In
contrast, the genes which are hypomethylated during MSC aging, TBX15, PITX2, and
HOXA11, code for transcription factors involved in several differentiation and
developmental processes (Singh et al. 2005; Gross et al. 2012; Gage et al. 2014).
Interestingly, 80 of the differentially methylated sequences identified in the MSCs were
present in both blood and brain, which is in line with previous observations that suggest
the existence of systemic DNA methylation changes during aging (Rakyan et al. 2010;
Heyn et al. 2012). However, as many of the sequences were not common to different
tissues, our data indicate that, as has recently been proposed (Christensen et al. 2009;
Day et al. 2013) systemic changes are restricted to specific loci, and cell type plays an
important role in the regulation of DNA methylation changes over time.
Cold Spring Harbor Laboratory Press on October 29, 2014 - Published by genome.cshlp.orgDownloaded from

13
The factors determining the behavior of DNA methylation during aging have received
much attention during the last few years. Recent works have shown that genes which
are hypermethylated in blood during aging are associated with the presence of bivalent
chromatin domains in embryonic stem cells (Rakyan et al. 2010; Teschendorff et al.
2010; Fernandez et al. 2012; Heyn et al. 2012) and with repressive histone marks
(H3K27me3/H3K9me3) in differentiated cells (Rakyan et al. 2010). Our data indicate
that the same repressive histone marks in differentiated cells are also present in
sequences in those MSCs which are hypermethylated during aging, implying that,
independent of morphogenic potential and/or cell type, these repressive histone marks
are associated with DNA methylation gain during aging. Of note, our data provide new
evidence that sequences which are hypomethylated in MSCs and differentiated cells
during aging are strongly enriched in the active chromatin mark H3K4me1, which
suggests that this histone modification is a cell type-independent chromatin signature of
DNA hypomethylation during aging. Interestingly, H3K4me1 has recently been
associated with enhancers (Rada-Iglesias et al. 2010), genomic regions that play a
fundamental role in cis-regulation of gene function. In addition, a recent study has
shown that DNA hypomethylation within specific transposable elements is associated
with tissue-specific enhancer marks, including H3K4me1, suggesting that these
sequences might play an important role in tissue-specific epigenetic gene regulation
(Xie et al. 2013), which implies that H3K4me1-associated DNA hypomethylation could
play a role in the deregulation of gene expression during aging (Bahar et al. 2006).
Further parallel studies analysing DNA hypomethylation in enhancers and gene
expression during aging should shed light on this matter. Collectively, our data indicate
that, although there are few altered DNA sequences which are common to different cell
types, the chromatin signatures associated with DNA hyper- and hypomethylation
during aging were similar for different tissues, supporting the notion that chromatin
context is associated with the dynamics of systemic DNA methylation changes during
aging. The reasons why the repressive histone marks H3K27me3/H3K9me3 favor
hypermethylation and the active histone mark H3K4me1 promotes hypomethylation
during aging are not known. A simple explanation could be the preferential location of
DNA methyltransferases (DNMTs) at repressive chromatin regions (Jeong et al. 2009).
Repressive chromatin regions could be predisposed to becoming hypermethylated due
to the abundance of DNMTs. In contrast, active chromatin regions would be more
Cold Spring Harbor Laboratory Press on October 29, 2014 - Published by genome.cshlp.orgDownloaded from

14
susceptible to losing methylation because the low levels of DNMTs at these regions
make it more difficult to maintain DNA methylation patterns after mitosis. This
possibility is supported by the fact that postmitotic tissues such as brain (Numata et al.
2012; Guintivano et al. 2013) and muscle (Zykovich et al. 2014) present far fewer
hypomethylated sequences during aging than highly mitotic cells such as blood and
MSCs. Further studies analyzing the genome wide distribution of DNMTs during aging
are needed to support this possibility.
One possible limitation of our study is the purification and the in vitro culture of MSCs
(Calvanese et al. 2008; Choi et al. 2012), although this should have no great impact
when comparing young and old MSCs as both sets of samples were cultured under
exactly the same conditions. Moreover, cell heterogeneity, which is a major issue in
DNA methylation studies (Houseman et al. 2012; Guintivano et al. 2013), has less
impact in relation to MSCs as they are more homogeneous than blood cell populations.
However, to minimise the impact of cell heterogeneity in our analysis of blood we
corrected DNA methylation data with a recently published algorithm (Houseman et al.
2012), which yielded slightly different sequences to those previously proposed,
suggesting that some of the DNA changes previously identified might be cell-type
dependent. However, as this algorithm considers only the major cell subtypes, possible
variations driven by minor subtypes would not be detected. Another limitation of our
study is that the differences in the number of individuals analyzed and different data
analyses undertaken make difficult the interpretation of the comparison of age-
dependent DNA methylation changes in different cell types. However, the conserved
pattern of chromatin signatures in stem and differentiated cells suggests that
H3K9me3/H3K27me3 and H3K4me1 are truly tissue-independent histone marks of
DNA hyper- and hypomethylation respectively during aging.
As in most previous studies on DNA methylation and aging, CpG sites showing DNA
methylation changes during lifetime associated with a specific tendency (i.e. hyper- or
hypomethylation) were identified. However, using this analytical approach means that
other possible changes occurring at CpG sites displaying high interindividual variability
in both young and old individuals and/or age-dependent interindividual variability are
overlooked. To address this issue, we re-analyzed the DNA methylation data to
characterize the age-dependent interindividual variability (i.e. scedasticity).
Cold Spring Harbor Laboratory Press on October 29, 2014 - Published by genome.cshlp.orgDownloaded from
15
Using this approach we identified 16243 heteroscedastic (2437 convergent and 13806
divergent), and 55684 homoscedastic CpG sites with high (HV) and 68927 with low
(LV) interindividual variability. Most of these CpG sites were not identified through
linear model analysis, leading us to suggest that DNA methylation changes during aging
might be more frequent than has previously been thought. Interestingly, although there
were some CpG sites that converged during aging, most of the heteroscedastic changes
were divergent, providing support for the notion that interindividual DNA methylation
variability increases during lifetime (Gemma et al. 2013; Ong and Holbrook 2013).
Although the behavior adults stem cell populations during aging is still poorly
understood (Pollina and Brunet 2011), the clonal expansion or decline of specific cell
populations could affect the interpretation of changes of interindividual DNA
methylation variability with aging. As it has been proposed that the number of MSCs
declines with age (Stolzing et al. 2008), it is possible that the increase in interindividual
variability might in fact be even larger than was observed in our study.
Functional genomics analyses of the groups of CpG sites established according to the
behavior of the variance revealed that low variable CpG sites were enriched in CpG
islands and gene promoters. As DNA methylation occurring at CpG island promoters
has been proposed to play an important role in gene regulation (Bird 1986; Bird and
Wolffe 1999; Calvanese et al. 2012), our results could indicate that the DNA
methylation involved in gene regulation is protected against the stochastic epigenetic
changes that occur during lifetime (Feil and Fraga 2012). Interestingly, analysis of the
interindividual variability of DNA methylation during aging in blood, showed that, as in
adult stem cells, the DNA methylation patterns of differentiated cells also diverge with
age, thereby supporting the notion that a systemic epigenetic drift occurs during the
lifetime of higher organisms (Feil and Fraga 2012; Issa 2014). To confirm that the
sequences identified in blood after correcting with the Houseman algorithm were not
affected by cell heterogeneity, we carried out in silico functional analysis to discard a
possible blood cell lineage-dependent regulation. The analyses showed no meaningful
associations, which further supports our contention that, after correcting with the
Houseman algorithm, cell heterogeneity had a minor impact on our blood DNA
methylation data.
Cold Spring Harbor Laboratory Press on October 29, 2014 - Published by genome.cshlp.orgDownloaded from

16
Previous reports have demonstrated that genetic factors play an important role in the
regulation of DNA methylation during aging (Heijmans et al. 2007; Coolen et al. 2011;
Gertz et al. 2011; Bell et al. 2012). To determine whether the effect of genotype is
different depending on the intrinsic behavior of the DNA changes during aging at each
specific CpG site, we analyzed the DNA methylation status of monozygotic twins of
different ages. The results showed that interindividual variability increased with aging,
in agreement with the notion that epigenetic drift during lifetime occurs even in
genetically identical individuals (Fraga et al. 2005; Wong et al. 2010; Pirazzini et al.
2012; Talens et al. 2012; van Dongen et al. 2012). However, our results also showed
that the DNA methylation status of some CpG sites may converge during lifetime.
Specifically, the analysis of genetically identical individuals revealed that the effect of
genotype depended on the intrinsic behavior of the DNA methylation changes during
aging. For example, although the mechanisms underlying methylation convergence are
still largely unknown, our MZ data indicate that genetic factors must be involved, at
least in part, as the intrapair changes were similar to, or even less than, the
interindividual variations. In addition, in contrast to the convergent and divergent CpG
sites, genotype seems to play a less important role in whether the CpG sites display high
or low interindividual variability, as evidenced by the fact that the increase in ED in the
homoscedastic sequences for MZ twin pairs during aging was higher than the
differences explained by interindividual variability. Of particular note is the finding that
genotype had the lowest effect on the CpG sites, displaying high interindividual
variability in young and old individuals, evidenced by the increase Euclidean distance in
MZ twins during aging being similar to or even higher than the increase in
interindividual variability. Our results indicate that these CpG sites, which have
received little attention until now, might be important targets of environmental and/or
stochastic epigenetic variation during development and aging. Although we have
reduced the effect of cell heterogeneity and immune status over time (Allegretta et al.
1990) using the Houseman algorithm (Houseman et al. 2012) and by performing several
functional in silico analyses of the groups of the genes showing age-related changes in
Euclidean distance, we cannot completely discount a partial effect of these in our
results.
Our data indicate that the differences in the effect of genotype on DNA changes during
lifetime depend largely on the genomic region involved, which is in agreement with
Cold Spring Harbor Laboratory Press on October 29, 2014 - Published by genome.cshlp.orgDownloaded from

17
previously published data (Wong et al. 2010). In line with this, the greatest DNA
methylation changes for MZs were clustered at subtelomeric DNA regions, which
suggests that the regulation of DNA methylation at these sequences is largely
independent of genetic factors. Interestingly, subtelomeric DNA methylation has been
shown to be affected by environmental factors (unpublished observations). It is worth
noting that, although for most CpG sites the ED in young twins was lower than for older
twins, they still clustered in the same subtelomeric regions, providing support for the
previous proposal that epigenetic drift starts early in life (Martino et al.; Kaminsky et al.
2009; Ollikainen et al. 2010; Wong et al. 2010) and accumulates during lifetime at
particular CpG sites that, for still unknown reasons, evade the control of genetic factors
(Fraga 2009).
Collectively, our results indicate that the dynamics of DNA methylation during lifetime
in humans is associated with a complex mixture of factors. These include the DNA
sequence itself, tissue type and, in particular the chromatin context, where repressive
histone modifications such us H3K9me3 and H3K27me3 are related to DNA
hypermethylation and, most notably, the active histone mark H3K4me1 is related to
DNA hypomethylation. Finally, depending on the locus, the changes appear to be
modulated by genetic and/or external factors.
Cold Spring Harbor Laboratory Press on October 29, 2014 - Published by genome.cshlp.orgDownloaded from

18
Materials and methods
Isolation and culture of MSCs
MSCs were purchased from Lonza (Verviers, Belgium), Millipore (Billerica, MA,
USA), and Inbiobank. (San Sebastian, Spain) or directly obtained from young and
elderly donors. After informed consent, bone marrow aspirates were obtained from one
group of patients and, from a second group, bone scrapings were obtained following hip
replacement surgery. Mononuclear cells were isolated by Ficoll density centrifugation
(400 g, 25 min, 20C), washed twice by sedimentation with phosphate buffer (300 g, 5
min) and the cells resuspended in MSC medium (DMEM plus 10% FBS) and seeded
into culture flasks (Nunc, Roskilde, Denmark) at 1.5x10e5 cells/cm2 and allowed to
adhere for 24 hours. MSCs were then cultured (37C, 5% CO2) in MSC medium. DNA
methylation analyses were carried out at cell passages 4-6 (Supplemental Table 1).
MZ twins samples
Genomic DNA from 24 samples from the Italian Twin Registry, corresponding to 12
pairs of MZ twins, were extracted from buffy coats following standard procedures. Two
different age groups were included for array-based DNA methylation profiling; one
included individuals between 21 and 22 years old (young MZ twins), and the other
individuals between 58 and 66 (old MZ twins). The sample distribution by gender was
the same in both groups.
Genome-wide DNA methylation analysis with high-density arrays
Microarray-based DNA methylation profiling was performed with the
HumanMethylation450 BeadChip (Bibikova et al. 2011). Bisulfite conversion of DNA
was performed using the EZ DNA Methylation Kit (Zymo Research, Orange, CA)
following the manufacturer’s procedures, with the modifications described in the
Infinium Assay Methylation Protocol Guide. Processed DNA samples were then
hybridized to the BeadChip (Illumina), following the Illumina Infinium HD Methylation
Protocol. Genotyping services were provided by the Spanish "Centro Nacional de
Genotipado” (CEGEN-ISCIII)" (www.cegen.org).
Datasets of blood and brain samples
DNA methylation data of blood (Hannum et al. 2013) and brain (neuron and glia)
(Guintivano et al. 2013) samples produced with the HumanMethylation450 BeadChip
were used to compare with the results obtained in MSCs. DNA methylation β value data
was downloaded from GEO accession numbers GSE40279 and GSE41826. The data
Cold Spring Harbor Laboratory Press on October 29, 2014 - Published by genome.cshlp.orgDownloaded from

19
analysis workflow is outlined in Supplemental Fig. S1.
HumanMethylation450 BeadChip data preprocessing
IDAT files from the HumanMethylation450 BeadChip were processed further using the
R/Bioconductor package minfi (Hansen and Aryee). In order to adjust for the different
probe design types present in the HumanMethylation450 BeadChip architecture, red and
green signals from the IDAT files were corrected using the SWAN algorithm
(Makismovic et al. 2012). No background correction or control probe normalization
was applied. Probes where at least two samples had detection p-values over 0.01 were
filtered out. In accordance with Du et al. (Du et al. 2010), both beta values and m-
values were computed and employed across the analysis pipeline. M-values were used
for all the statistical analyses, assuming homoscedasticity (with the exception of the
blood heterogeneity adjustment), while beta values were mostly used for the intuitive
interpretation and visualization of results.
Filtering confounding probes
Probes located in the X/Y chromosomes were removed from the dataset when
differential methylation profiles were analyzed. Probes that had been found to
cohybridate with probes in the sex chromosomes (Lemire et al. 2013) were also
removed. We used the information from the SNP137Common track from the UCSC
Genome Browser (Sherry et al. 2001) in order to remove those probes with an SNP
located inside their 2bp central region.
Batch effect correction
Multidimensional Scaling (MDS) was employed to detect whether there was any
significant batch effect depending on the different HumanMethylation450 BeadChip
plates which comprised the experiments. When there was, the ComBat method
implemented in the R/Bioconductor package sva (Leek et al.) was used to adjust the
datasets accordingly, employing the variable age as the outcome of interest and the
sample plate as a batch covariate.
White blood cell heterogeneity adjustment
Methylation data for the Blood and Twins datasets was adjusted for blood cell
heterogeneity, with respect to the major cell subtypes, using the method described in
Houseman et. al. (Houseman et al. 2012). In order to feed this method, we used the
original 27k database of purified white blood cell subtypes included in the original
implementation of the algorithm. The correction was performed on the beta values due
Cold Spring Harbor Laboratory Press on October 29, 2014 - Published by genome.cshlp.orgDownloaded from

20
to the fact that the 27k database was expressed using those units. M-values were
obtained from the corrected beta values for subsequent downstream analyses.
Detection of differentially methylated probes
For the MSC dataset, the 34 samples were divided into two groups: young (ages ranging
from 2 to 22) and old (ages between 61 and 92). Similarly, samples in the Twins dataset
were divided into young (ages ranging from 21 to 22) and old (age between 58 and 66).
For the neuron and glia datasets, the two groups were defined by taking those
individuals whose age was below the 33rd percentile (young) and above the 66th
percentile (old). Blood samples were not divided into groups, and the age predictor was
used as a quantitative covariate. For the MSCs, Twins, neuron and glia datasets,
significant methylation of a probe was determined by the moderated t-test implemented
in the R/Bioconductor package limma (Smyth 2005). Probes in the blood dataset were
tested with a linear regression. A linear model, with methylation level as response and
age as the only predictor, was used on all the datasets. P-values were corrected for
multiple testing using the Benjamini-Hochberg method for controlling the false
discovery rate (FDR). A significance level of 0.05 was employed to determine
differentially methylated probes. An additional threshold of effect size was applied,
meaning that only those probes with the strongest differences between groups (the top
70%) were selected. The application of this threshold is essential to remove those
differences prone to coming from technical artifacts, and consequently ensure a more
biologically sound statistical data analysis (Pan et al. 2005). Our threshold was adjusted
according to the differences in M-values between groups in the brain and MSC datasets
and the slope coefficients extracted from the blood dataset linear regression model.
Analysis of variability trends
To analyze aging-dependent behavior of DNA interindividual variability (i.e. DNA
methylation scedasticity), two groups, corresponding to young (samples where age was
below the 33rd percentile) and old (those where age is above the 66th percentile)
individuals, were selected for all the datasets. This separation allows the method to
focus on the global tendency of the variability, and be less dependent on a fixed,
underlying model. A Brown-Forsythe test for the equality of variances was used to
determine which probes in the blood dataset had significantly different variability in
methylation between the two groups. For the remaining datasets, and due to the small
number of available samples and low statistical power for conducting a variance test, a
Cold Spring Harbor Laboratory Press on October 29, 2014 - Published by genome.cshlp.orgDownloaded from

21
simple descriptive approach was used, labeling a probe as having a significant
difference in methylation variability when the absolute value of the base-2 logarithm of
the change of the variances for the two groups was greater than 3 fold. We did not apply
any threshold of effect size for any of the datasets. For the blood dataset, p-values were
corrected for multiple testing using FDR (Benjamini-Hochberg method) and a
significance level of 0.05 used to determine which probes had a significant trend in
variability. Two special subsets of probes with no significant trends in variability were
generated: one, named HV (High Variance), for those probes with variance values
above the 75th percentile of the whole set of variances for both the young and old
sample groups, and one named LV (Low Variance), generated with those probes where
both young and old variances were below the 25th percentile.
The in silico functional analysis and interpretation of the groups of genes established
according to the behavior of the variance in blood was performed using the Database for
Annotation, Visualization and Integrated Discovery (DAVID) and the "Gene ontology"
and “UP_TISSUE" categories (Dennis et al. 2003; Huang da et al. 2009).
Measuring intra- and interindividual distance
Euclidean distances between twins were computed for every probe in the original Twins
dataset, using beta-values. In a simple scenario, the Euclidean distance accounts for the
absolute difference between the beta values of the two siblings. Differences in distances
were computed as the base-2 logarithm of the fold change between the average
Euclidean distance for the young and old sample groups.
Histone enrichment analysis
In order to analyze the enrichment of a histone mark on a given subset of probes, we
used the information contained in the UCSC Genome Browser Broad Histone track
from the ENCODE Project (Rosenbloom et al. 2010; Rosenbloom et al. 2012)
(Supplemental Table 26). Histone peak data for every histone modification and
chromatin modifier in hESCs and 10 different cell types obtained from healthy
individuals were downloaded from the UCSC Genome Browser. Small peaks were
discarded when they were completely contained within wider peaks. Following the
ENCODE Broad Histone Methods description, discrete intervals of ChIP-seq fragment
enrichment were identified using Scripture, a scan statistics approach, under the
assumption of uniform background signal (http://genome.ucsc.edu//cgi-
bin/hgTrackUi?db=hg19&g=wgEncodeBroadHistone).
Cold Spring Harbor Laboratory Press on October 29, 2014 - Published by genome.cshlp.orgDownloaded from
22
For each combination of cell line and mark, a 2x2 contingency table was built to
determine its association with the input subset of probes. Probes in the array were
classified according to whether they belonged to the subset or not, and whether they
intersected with a significant broad peak for the given combination of cell line and
mark. A Fisher´s exact test was used to determine if the given subset of probes was
significantly enriched for each combination of cell line and mark. P-values were
corrected for multiple testing using FDR (Benjamini-Hochberg method) and a
significance level of 0.05 was used to determine which probes had significant
enrichment. The base-2 logarithm of the Odds Ratio was used as a measure of effect
size.
Genomic region analysis
The probes in the microarray were assigned a genomic region according to their
position relative to the transcript information extracted from the R/Bioconductor
package TxDb.Hsapiens.UCSC.hg19.knownGene (Carlson). A probe was said to be in a
Promoter region if it was located inside the first exon, the 5'-UTR or a region up to
2kbp upstream of the transcription start site (TSS) of any given transcript. Similarly, a
probe was labeled as Intragenic if it was inside any intron or any exon other than the
first. Intergenic probes were determined as those not falling into either of the two
previous categories. According to this definition, a probe could be in both a Promoter
and an Intragenic region at the same time for different transcripts. A contingency table
was built for each selected subset of probes and a given genomic region, with one
variable indicating whether a given probe belonged or not to the subset, and the other
indicating whether a given probe was labeled with the selected region. Significance of
the association was determined by a Pearson's chi-squared test with Yates' continuity
correction. A significance level of 0.05 was used to determine whether a subset was
dependent with respect to a given genomic region. Odds Ratio was used as a measure of
effect size.
CpG Island status analysis
The CpG island locations used in the analyses were obtained from the R/Bioconductor
package FDb.InfiniumMethylation.hg19 (Triche 2013) The generation procedure of
these CpG Islands is described by Wu and colleagues (Wu et al. 2010). CpG shores
were defined as the 2kbp regions flanking a CpG Island. CpG shelves were defined as
the 2kbp region either upstream or downstream of each CpG shore. Probes not
Cold Spring Harbor Laboratory Press on October 29, 2014 - Published by genome.cshlp.orgDownloaded from

23
belonging to any of the regions thus far mentioned were assigned to the special category
Non-CpG Island. Each probe was assigned to only one of the categories. A 4x2
contingency table was constructed for every subset of probes in order to study the
association between the given subset and the different CpG Island categories. A chi-
squared test was used to determine if any of the categories had a significant association
with the given subset. For each of the CpG Island status levels, a 2x2 contingency table
was defined and another chi-squared test was used to independently evaluate the
association of the given subset with each status level, a significance level of 0.05 being
employed for all tests. Effect size was reported as the Odds Ratio for each of the
individual tests.
Microarray background correction
Although it is sometimes referred to as a genome wide solution, the
HumanMethylation450 BeadChip only covers a fraction of the entire genome. In its 27k
predecessor, the probes were mainly located at gene promoter regions, while in addition
to the promoter probes, the HumanMethylation450 BeadChip includes probes located
inside genes and in intergenic regions (Dedeurwaerder et al. 2011).
The irregular distribution of probes can lead to unwanted biases when studying whether
a selected subset of probes is enriched with respect to any functional or clinical mark. A
reference to the background distribution of features was included in every type of
statistical test performed in order to prevent our conclusions from being driven by the
irregular distribution of probes. In qualitative tests (CpG Island status, genomic region
or histone mark enrichment), the contingency matrix was built to represent the
background distribution of the microarray. Thus, any significant result would indicate a
departure from the fixed background distribution, and ignore any manufacturer bias.
Circos data track smoothing
In order to plot the CpG information on the Circos genome-wide graphs (Krzywinski et
al. 2009), smoothing was applied to our data. Broad histone peak information from
UCSC Genome Browser was averaged by partitioning the genome into intervals of
200kbp and assigning to each a score corresponding to the average of the broad peak
scores found within it. CpG locations were not smoothed. Distances in the Twins
dataset were averaged using a 2Mbp window size.
Bisulfite pyrosequencing
DNA methylation patterns of representative dmCpGs during aging were analyzed by
Cold Spring Harbor Laboratory Press on October 29, 2014 - Published by genome.cshlp.orgDownloaded from

24
bisulfite pyrosequencing in an independent sample set of 46 MSCs obtained from
individuals of different ages (Supplemental Table 1). Bisulfite modification of DNA
was performed with the EZ DNA Methylation-Gold kit (Zymo Research) following the
manufacturer's instructions. The set of primers for PCR amplification and sequencing
were designed using the specific software PyroMark assay design (version 2.0.01.15).
Primer sequences were designed to hybridize with CpG free sites to ensure methylation-
independent amplification (Supplemental Table 27). After PCR amplification of the
region of interest with the specific primers, pyrosequencing was performed using
PyroMark Q24 reagents, and vacuum prep workstation, equipment and software
(Qiagen). A linear regression model was fitted to the pyrosequencing methylation data
using age as a predictor.
Data analysis workflow
All the necessary steps for upstream and downstream analyses were defined and
implemented using the Snakemake tool (Köster and Rahmann 2012). This tool helps
data scientists to generate a reproducible and inherently parallel processing pipeline.
The source code of the workflow is included as Supplemental Material.
Data access
The HumanMethylation450 BeadChip data sets from this study have been submitted to
the NCBI Gene Expression Omnibus (GEO; http://www.ncbi.nlm.nih.gov/geo/) under
accession number GSE52114 (SubSeries GSE52112 and GSE52113).
Acknowledgments
We thank Ronnie Lendrum for editorial assistance and Tim Triche, Jr. for his invaluable
advice. This work has been financially supported by the Fondo de Investigaciones
Sanitarias FIS/FEDER (PI11/01728 to AF.F., PI 12/0615 to J.A.R.; PI10/0449 to P.M,
and PI11/0119 to C.B.); the ISCIII-Subdirección General de Evaluación y Fomento de
la Investigación (Miguel Servet contract: CP11/00131 to A.F.F., and CP07/0059 to
C.B.); the Spanish Ministry of Health (PS09/ 02454 and PI12/01080 to M.F.F.); the
Spanish National Research Council (CSIC; 200820I172 to M.F.F.); IUOPA (to C.F. and
G.F.B.); Fundacion Cientifica de la AECC (to R.G.U. and to P.M.); Fundación Ramón
Areces (to M.F.F); and FICYT (to E.G.T.). J.G-C receives funding from the Fondo de
Investigaciones Sanitarias (FIS; PI05/2217 and PI08/0029) and the Madrid Regional
Cold Spring Harbor Laboratory Press on October 29, 2014 - Published by genome.cshlp.orgDownloaded from

25
Government (S-BIO-0204-2006 and S2010/BMD-2420). J.A.R. receives funding from
the Fondo de Investigaciones Sanitarias (ISCIII-FIS PI 12/0615). P.M. is also supported
by MINECO (SAF2013/43065), ERANET E-Rare (PI112/03112) and Fundación
Sandra Ibarra. P.M. also acknowledges the supports from Obra Social "La
Caixa/Fundacio "Josep Carreras". The IUOPA is supported by the Obra Social Cajastur,
Spain.
Cold Spring Harbor Laboratory Press on October 29, 2014 - Published by genome.cshlp.orgDownloaded from

26
Figure legends
Figure1. DNA methylation changes during MSC aging. (A) Unsupervised hierarchical
clustering and heatmap including the 15000 most variable CpG sites with differential
DNA methylation between young and old MSCs. Average methylation values are
displayed from 0 (blue) to 1 (yellow). (B) Density plot for differentially methylated
CpG sites between representative young (two years old; 2-yo) and old (87 years old; 87-
yo) MSCs. (C) Distribution of differentially methylated CpGs relative to CpG Island.
(D) Relative distribution of differentially methylated CpGs across different genomic
regions. (E) Examples of aging-specific CpG methylation in particular genes further
validated by pyrosequencing in an independent set of samples. For each of the genes of
interest, a scatter plot of the percentage of methylation obtained for each sample and
CpG of interest is shown. The two genes at the top show an age-dependent
hypermethylation tendency, while the three genes at the bottom show hypomethylation
with respect to age. Each point represents a single observation for a given sample and
CpG of interest. The blue line represents a linear model fit. A 0.95 confidence interval
of the fitted model is shown in gray. (F) Venn diagrams showing the number of CpG
sites (hyper- and hypomethylated) shared by the different tissues
Figure2. Chromatin signatures associated with DNA methylation changes during aging.
(A) Heatmaps showing significant enrichment of hyper- and hypomethylated CpG sites,
identified in MSCs, blood, neurons and glia, with different histone marks and chromatin
modifiers contained in the UCSC Genome Browser Broad Histone track from the
ENCODE Project. Color code indicates the significant enrichment based on log2 odds
ratio (OR). (B) Circular representation of three representative chromosomes (1, 6, and
17), indicating whether the CpGs were hypermethylated (red) or hypomethylated (blue)
during MSC aging. Inner tracks display chromatin marks (H3K4me1, H3K9me3,
H3K27me3, and EZH2), generated for HUVEC cells, and associated with differentially
methylated regions during aging. Broad histone peak information was averaged in 200
kbp genomic windows and represented as histogram tracks. Three examples of hypo-
and hypermethylated DNA regions associated with specific chromatin signatures are
displayed below.
Figure3. Interindividual DNA methylation variability during MSC aging. (A) Density
plot for CpG sites showing significant changes in variance in young and old MSCs. (B)
Cold Spring Harbor Laboratory Press on October 29, 2014 - Published by genome.cshlp.orgDownloaded from

27
Bar plot showing the number of age-dependent heteroscedastic (convergent and
divergent) and homoscedastic (high (HV) and low (LV) variability) CpG sites in MSCs.
(C) Box plots showing the classification of CpG sites into different groups based on the
aging-dependent behavior of the interindividual variability. Representative examples of
CpG sites for each group are shown below (mvalue: relative methylation values). (D)
Distribution of homoscedastic and heteroscedastic CpGs relative to CpG island status
and relative distribution across different genomic regions.
Figure4. Interindividual DNA methylation variability during aging of blood cells. (A)
Density plot for CpG sites showing significant changes of variance in young and old
individuals. (B) Bar plot showing the number of age-dependent heteroscedastic
(convergent and divergent) and homoscedastic (high (HV) and low (LV) variability)
CpG sites. (C) Box plots showing the classification of the CpG sites in different groups
based on the aging-dependent behavior of the interindividual variability.
Figure5. Role of genetic factors in interindividual DNA methylation variability during
aging. (A) Density plot for CpG sites showing significant changes of methylation
variance in blood cells of MZ twins during aging. (B) Density plot for comparison
between the mean Euclidean distance (⎯δ) and the interindividual variability (σ2) in
methylation values between old and young MZ twins. The horizontal dotted lines
represent a 2 fold change in the ⎯δ between MZ twins. (C) Circular representation of
genome-wide CpG sites showing differences, in the ⎯δ between methylation values of
young and old MZ twins. δ was averaged using a 2Mbp window size. Inner tracks show
genomic regions where the ⎯δ was higher (blue region) or lower (green region) in old
compared with young MZ twins. (D) Density plots for comparison between the ⎯δ and
the σ2 in methylation values between old and young MZ twins, in hyper-,
hypomethylated, heteroscedastic and homoscedastic CpGs.
Cold Spring Harbor Laboratory Press on October 29, 2014 - Published by genome.cshlp.orgDownloaded from
28
References
Allegretta M, Nicklas JA, Sriram S, Albertini RJ. 1990. T cells responsive to myelin
basic protein in patients with multiple sclerosis. Science 247(4943): 718-721. Bahar R, Hartmann CH, Rodriguez KA, Denny AD, Busuttil RA, Dolle ME, Calder
RB, Chisholm GB, Pollock BH, Klein CA et al. 2006. Increased cell-to-cell variation in gene expression in ageing mouse heart. Nature 441(7096): 1011-1014.
Beerman I, Bock C, Garrison BS, Smith ZD, Gu H, Meissner A, Rossi DJ. 2013. Proliferation-dependent alterations of the DNA methylation landscape underlie hematopoietic stem cell aging. Cell Stem Cell 12(4): 413-425.
Bell JT, Tsai PC, Yang TP, Pidsley R, Nisbet J, Glass D, Mangino M, Zhai G, Zhang F, Valdes A et al. 2012. Epigenome-wide scans identify differentially methylated regions for age and age-related phenotypes in a healthy ageing population. PLoS Genet 8(4): e1002629.
Bibikova M, Barnes B, Tsan C, Ho V, Klotzle B, Le JM, Delano D, Zhang L, Schroth GP, Gunderson KL et al. 2011. High density DNA methylation array with single CpG site resolution. Genomics 98(4): 288-295.
Bird AP. 1986. CpG-rich islands and the function of DNA methylation. Nature 321(6067): 209-213.
Bird AP, Wolffe AP. 1999. Methylation-induced repression--belts, braces, and chromatin. Cell 99(5): 451-454.
Bjornsson HT, Cui H, Gius D, Fallin MD, Feinberg AP. 2004. The new field of epigenomics: implications for cancer and other common disease research. Cold Spring Harb Symp Quant Biol 69: 447-456.
Bocker MT, Hellwig I, Breiling A, Eckstein V, Ho AD, Lyko F. 2011. Genome-wide promoter DNA methylation dynamics of human hematopoietic progenitor cells during differentiation and aging. Blood 117(19): e182-189.
Bocklandt S, Lin W, Sehl ME, Sanchez FJ, Sinsheimer JS, Horvath S, Vilain E. 2011. Epigenetic predictor of age. PLoS One 6(6): e14821.
Bork S, Pfister S, Witt H, Horn P, Korn B, Ho AD, Wagner W. 2010. DNA methylation pattern changes upon long-term culture and aging of human mesenchymal stromal cells. Aging Cell 9(1): 54-63.
Calvanese V, Fernandez AF, Urdinguio RG, Suarez-Alvarez B, Mangas C, Perez-Garcia V, Bueno C, Montes R, Ramos-Mejia V, Martinez-Camblor P et al. 2012. A promoter DNA demethylation landscape of human hematopoietic differentiation. Nucleic Acids Res 40(1): 116-131.
Calvanese V, Horrillo A, Hmadcha A, Suarez-Alvarez B, Fernandez AF, Lara E, Casado S, Menendez P, Bueno C, Garcia-Castro J et al. 2008. Cancer genes hypermethylated in human embryonic stem cells. PLoS One 3(9): e3294.
Carlson M. TxDb.Hsapiens.UCSC.hg19.knownGene: Annotation package for TranscriptDb object(s). R package version 2.9.2.
Coolen MW, Statham AL, Qu W, Campbell MJ, Henders AK, Montgomery GW, Martin NG, Clark SJ. 2011. Impact of the genome on the epigenome is manifested in DNA methylation patterns of imprinted regions in monozygotic and dizygotic twins. PLoS One 6(10): e25590.
Choi MR, In YH, Park J, Park T, Jung KH, Chai JC, Chung MK, Lee YS, Chai YG. 2012. Genome-scale DNA methylation pattern profiling of human bone marrow mesenchymal stem cells in long-term culture. Exp Mol Med 44(8): 503-512.
Cold Spring Harbor Laboratory Press on October 29, 2014 - Published by genome.cshlp.orgDownloaded from

29
Christensen BC, Houseman EA, Marsit CJ, Zheng S, Wrensch MR, Wiemels JL, Nelson HH, Karagas MR, Padbury JF, Bueno R et al. 2009. Aging and environmental exposures alter tissue-specific DNA methylation dependent upon CpG island context. PLoS Genet 5(8): e1000602.
Day K, Waite LL, Thalacker-Mercer A, West A, Bamman MM, Brooks JD, Myers RM, Absher D. 2013. Differential DNA methylation with age displays both common and dynamic features across human tissues that are influenced by CpG landscape. Genome Biol 14(9): R102.
Dedeurwaerder S, Defrance M, Calonne E, Denis H, Sotiriou C, Fuks F. 2011. Evaluation of the Infinium Methylation 450K technology. Epigenomics 3(6): 771-784.
Dennis G, Jr., Sherman BT, Hosack DA, Yang J, Gao W, Lane HC, Lempicki RA. 2003. DAVID: Database for Annotation, Visualization, and Integrated Discovery. Genome Biol 4(5): P3.
Du P, Zhang X, Huang C-C, Jafari N, Kibbe Wa, Hou L, Lin SM. 2010. Comparison of Beta-value and M-value methods for quantifying methylation levels by microarray analysis. BMC Bioinformatics 11: 587.
Feil R, Fraga MF. 2012. Epigenetics and the environment: emerging patterns and implications. Nat Rev Genet 13(2): 97-109.
Fernandez AF, Assenov Y, Martin-Subero JI, Balint B, Siebert R, Taniguchi H, Yamamoto H, Hidalgo M, Tan AC, Galm O et al. 2012. A DNA methylation fingerprint of 1628 human samples. Genome Res 22(2): 407-419.
Fraga MF. 2009. Genetic and epigenetic regulation of aging. Curr Opin Immunol 21(4): 446-453.
Fraga MF, Ballestar E, Paz MF, Ropero S, Setien F, Ballestar ML, Heine-Suner D, Cigudosa JC, Urioste M, Benitez J et al. 2005. Epigenetic differences arise during the lifetime of monozygotic twins. Proc Natl Acad Sci U S A 102(30): 10604-10609.
Gage PJ, Kuang C, Zacharias AL. 2014. The homeodomain transcription factor PITX2 is required for specifying correct cell fates and establishing angiogenic privilege in the developing cornea. Dev Dyn.
Gemma C, Ramagopalan SV, Down TA, Beyan H, Hawa MI, Holland ML, Hurd PJ, Giovannoni G, David Leslie R, Ebers GC et al. 2013. Inactive or moderately active human promoters are enriched for inter-individual epialleles. Genome Biol 14(5): R43.
Gertz J, Varley KE, Reddy TE, Bowling KM, Pauli F, Parker SL, Kucera KS, Willard HF, Myers RM. 2011. Analysis of DNA methylation in a three-generation family reveals widespread genetic influence on epigenetic regulation. PLoS Genet 7(8): e1002228.
Gross S, Krause Y, Wuelling M, Vortkamp A. 2012. Hoxa11 and Hoxd11 regulate chondrocyte differentiation upstream of Runx2 and Shox2 in mice. PLoS One 7(8): e43553.
Guintivano J, Aryee MJ, Kaminsky ZA. 2013. A cell epigenotype specific model for the correction of brain cellular heterogeneity bias and its application to age, brain region and major depression. Epigenetics 8(3): 290-302.
Hannum G, Guinney J, Zhao L, Zhang L, Hughes G, Sadda S, Klotzle B, Bibikova M, Fan JB, Gao Y et al. 2013. Genome-wide methylation profiles reveal quantitative views of human aging rates. Mol Cell 49(2): 359-367.
Cold Spring Harbor Laboratory Press on October 29, 2014 - Published by genome.cshlp.orgDownloaded from

30
Hansen KD, Aryee M. minfi: Analyze Illumina's 450k methylation arrays. R package version 1.7.15.
Heijmans BT, Kremer D, Tobi EW, Boomsma DI, Slagboom PE. 2007. Heritable rather than age-related environmental and stochastic factors dominate variation in DNA methylation of the human IGF2/H19 locus. Hum Mol Genet 16(5): 547-554.
Hernandez DG, Nalls MA, Gibbs JR, Arepalli S, van der Brug M, Chong S, Moore M, Longo DL, Cookson MR, Traynor BJ et al. 2011. Distinct DNA methylation changes highly correlated with chronological age in the human brain. Hum Mol Genet 20(6): 1164-1172.
Heyn H, Li N, Ferreira HJ, Moran S, Pisano DG, Gomez A, Diez J, Sanchez-Mut JV, Setien F, Carmona FJ et al. 2012. Distinct DNA methylomes of newborns and centenarians. Proc Natl Acad Sci U S A 109(26): 10522-10527.
Heyn H, Moran S, Esteller M. 2013. Aberrant DNA methylation profiles in the premature aging disorders Hutchinson-Gilford Progeria and Werner syndrome. Epigenetics 8(1): 28-33.
Horvath S, Zhang Y, Langfelder P, Kahn RS, Boks MP, van Eijk K, van den Berg LH, Ophoff RA. 2012. Aging effects on DNA methylation modules in human brain and blood tissue. Genome Biol 13(10): R97.
Houseman EA, Accomando WP, Koestler DC, Christensen BC, Marsit CJ, Nelson HH, Wiencke JK, Kelsey KT. 2012. DNA methylation arrays as surrogate measures of cell mixture distribution. BMC Bioinformatics 13: 86.
Huang da W, Sherman BT, Lempicki RA. 2009. Systematic and integrative analysis of large gene lists using DAVID bioinformatics resources. Nat Protoc 4(1): 44-57.
Issa JP. 2014. Aging and epigenetic drift: a vicious cycle. J Clin Invest 124(1): 24-29. Jaenisch R, Bird A. 2003. Epigenetic regulation of gene expression: how the genome
integrates intrinsic and environmental signals. Nat Genet 33 Suppl: 245-254. Jeong S, Liang G, Sharma S, Lin JC, Choi SH, Han H, Yoo CB, Egger G, Yang AS,
Jones PA. 2009. Selective anchoring of DNA methyltransferases 3A and 3B to nucleosomes containing methylated DNA. Mol Cell Biol 29(19): 5366-5376.
Johansson A, Enroth S, Gyllensten U. 2013. Continuous Aging of the Human DNA Methylome Throughout the Human Lifespan. PLoS One 8(6): e67378.
Jones A, Teschendorff AE, Li Q, Hayward JD, Kannan A, Mould T, West J, Zikan M, Cibula D, Fiegl H et al. 2013. Role of DNA methylation and epigenetic silencing of HAND2 in endometrial cancer development. PLoS Med 10(11): e1001551.
Kaminsky ZA, Tang T, Wang SC, Ptak C, Oh GH, Wong AH, Feldcamp LA, Virtanen C, Halfvarson J, Tysk C et al. 2009. DNA methylation profiles in monozygotic and dizygotic twins. Nat Genet 41(2): 240-245.
Köster J, Rahmann S. 2012. Snakemake--a scalable bioinformatics workflow engine. Bioinformatics (Oxford, England) 28: 2520-2522.
Krzywinski M, Schein J, Birol I, Connors J, Gascoyne R, Horsman D, Jones SJ, Marra MA. 2009. Circos: an information aesthetic for comparative genomics. Genome Res 19(9): 1639-1645.
Leek JT, Johnson WE, Parker HS, Jaffe AE, Storey JD. sva: Surrogate Variable Analysis. R package version 3.7.0.
Lemire M, Butcher DT, Grafodatskaya D, Zanke BW, Weksberg R. 2013. Discovery of cross-reactive probes and polymorphic CpGs in the Illumina Infinium HumanMethylation450 microarray. 203-209.
Cold Spring Harbor Laboratory Press on October 29, 2014 - Published by genome.cshlp.orgDownloaded from

31
Lister R, Mukamel EA, Nery JR, Urich M, Puddifoot CA, Johnson ND, Lucero J, Huang Y, Dwork AJ, Schultz MD et al. 2013. Global epigenomic reconfiguration during mammalian brain development. Science 341(6146): 1237905.
Liu Y, Aryee MJ, Padyukov L, Fallin MD, Hesselberg E, Runarsson A, Reinius L, Acevedo N, Taub M, Ronninger M et al. 2013. Epigenome-wide association data implicate DNA methylation as an intermediary of genetic risk in rheumatoid arthritis. Nat Biotechnol 31(2): 142-147.
Makismovic J, Gordon L, Oshlack A. 2012. SWAN: Subset-quantile within array normalization for Illumina Infinium HumanMethylation450 BeadChips. Genome Biology.
Martino D, Loke YJ, Gordon L, Ollikainen M, Cruickshank MN, Saffery R, Craig JM. Longitudinal, genome-scale analysis of DNA methylation in twins from birth to 18 months of age reveals rapid epigenetic change in early life and pair-specific effects of discordance. Genome Biol 14(5): R42.
Numata S, Ye T, Hyde TM, Guitart-Navarro X, Tao R, Wininger M, Colantuoni C, Weinberger DR, Kleinman JE, Lipska BK. 2012. DNA methylation signatures in development and aging of the human prefrontal cortex. Am J Hum Genet 90(2): 260-272.
Ollikainen M, Smith KR, Joo EJ, Ng HK, Andronikos R, Novakovic B, Abdul Aziz NK, Carlin JB, Morley R, Saffery R et al. 2010. DNA methylation analysis of multiple tissues from newborn twins reveals both genetic and intrauterine components to variation in the human neonatal epigenome. Hum Mol Genet 19(21): 4176-4188.
Ong ML, Holbrook JD. 2013. Novel region discovery method for Infinium 450K DNA methylation data reveals changes associated with ageing in muscle and neuronal pathways. Aging Cell.
Pan KH, Lih CJ, Cohen SN. 2005. Effects of threshold choice on biological conclusions reached during analysis of gene expression by DNA microarrays. Proc Natl Acad Sci U S A 102(25): 8961-8965.
Pirazzini C, Giuliani C, Bacalini MG, Boattini A, Capri M, Fontanesi E, Marasco E, Mantovani V, Pierini M, Pini E et al. 2012. Space/population and time/age in DNA methylation variability in humans: a study on IGF2/H19 locus in different Italian populations and in mono- and di-zygotic twins of different age. Aging (Albany NY) 4(7): 509-520.
Pollina EA, Brunet A. 2011. Epigenetic regulation of aging stem cells. Oncogene 30(28): 3105-3126.
Rada-Iglesias A, Bajpai R, Swigut T, Brugmann SA, Flynn RA, Wysocka J. 2010. A unique chromatin signature uncovers early developmental enhancers in humans. Nature 470(7333): 279-283.
Rakyan VK, Down TA, Maslau S, Andrew T, Yang TP, Beyan H, Whittaker P, McCann OT, Finer S, Valdes AM et al. 2010. Human aging-associated DNA hypermethylation occurs preferentially at bivalent chromatin domains. Genome Res 20(4): 434-439.
Rauch T, Li H, Wu X, Pfeifer GP. 2006. MIRA-assisted microarray analysis, a new technology for the determination of DNA methylation patterns, identifies frequent methylation of homeodomain-containing genes in lung cancer cells. Cancer Res 66(16): 7939-7947.
Cold Spring Harbor Laboratory Press on October 29, 2014 - Published by genome.cshlp.orgDownloaded from

32
Rosenbloom KR, Dreszer TR, Long JC, Malladi VS, Sloan CA, Raney BJ, Cline MS, Karolchik D, Barber GP, Clawson H et al. 2012. ENCODE whole-genome data in the UCSC Genome Browser: update 2012. Nucleic Acids Res 40(Database issue): D912-917.
Rosenbloom KR, Dreszer TR, Pheasant M, Barber GP, Meyer LR, Pohl A, Raney BJ, Wang T, Hinrichs AS, Zweig AS et al. 2010. ENCODE whole-genome data in the UCSC Genome Browser. Nucleic Acids Res 38(Database issue): D620-625.
Sharpless NE, DePinho RA. 2004. Telomeres, stem cells, senescence, and cancer. J Clin Invest 113(2): 160-168.
Sherry ST, Ward MH, Kholodov M, Baker J, Phan L, Smigielski EM, Sirotkin K. 2001. dbSNP: the NCBI database of genetic variation. Nucleic acids research 29: 308-311.
Singh MK, Petry M, Haenig B, Lescher B, Leitges M, Kispert A. 2005. The T-box transcription factor Tbx15 is required for skeletal development. Mech Dev 122(2): 131-144.
Smyth GK. 2005. limma: Linear Models for Microarray Data. In Bioinformatics and Computational Biology Solutions Using R and Bioconductor, pp. 397-420.
Stolzing A, Jones E, McGonagle D, Scutt A. 2008. Age-related changes in human bone marrow-derived mesenchymal stem cells: consequences for cell therapies. Mech Ageing Dev 129(3): 163-173.
Taiwo O, Wilson GA, Emmett W, Morris T, Bonnet D, Schuster E, Adejumo T, Beck S, Pearce DJ. 2013. DNA methylation analysis of murine hematopoietic side population cells during aging. Epigenetics 8(10).
Talens RP, Christensen K, Putter H, Willemsen G, Christiansen L, Kremer D, Suchiman HE, Slagboom PE, Boomsma DI, Heijmans BT. 2012. Epigenetic variation during the adult lifespan: cross-sectional and longitudinal data on monozygotic twin pairs. Aging Cell 11(4): 694-703.
Teschendorff AE, Menon U, Gentry-Maharaj A, Ramus SJ, Weisenberger DJ, Shen H, Campan M, Noushmehr H, Bell CG, Maxwell AP et al. 2010. Age-dependent DNA methylation of genes that are suppressed in stem cells is a hallmark of cancer. Genome Res 20(4): 440-446.
Timp W, Feinberg AP. 2013. Cancer as a dysregulated epigenome allowing cellular growth advantage at the expense of the host. Nat Rev Cancer 13(7): 497-510.
Tong WG, Wierda WG, Lin E, Kuang SQ, Bekele BN, Estrov Z, Wei Y, Yang H, Keating MJ, Garcia-Manero G. 2010. Genome-wide DNA methylation profiling of chronic lymphocytic leukemia allows identification of epigenetically repressed molecular pathways with clinical impact. Epigenetics 5(6): 499-508.
Triche TJ. 2013. FDb.InfiniumMethylation.hg19: Annotation package for Illumina Infinium DNA methylation array probes. R package version 1.0.1.
van Dongen J, Slagboom PE, Draisma HH, Martin NG, Boomsma DI. 2012. The continuing value of twin studies in the omics era. Nat Rev Genet 13(9): 640-653.
Wong CC, Caspi A, Williams B, Craig IW, Houts R, Ambler A, Moffitt TE, Mill J. 2010. A longitudinal study of epigenetic variation in twins. Epigenetics 5(6): 516-526.
Wu H, Caffo B, Jaffee HA, Irizarry RA, Feinberg AP. 2010. Redefining CpG islands using hidden Markov models. Biostatistics 11(3): 499-514.
Xie M, Hong C, Zhang B, Lowdon RF, Xing X, Li D, Zhou X, Lee HJ, Maire CL, Ligon KL et al. 2013. DNA hypomethylation within specific transposable
Cold Spring Harbor Laboratory Press on October 29, 2014 - Published by genome.cshlp.orgDownloaded from

33
element families associates with tissue-specific enhancer landscape. Nat Genet 45(7): 836-841.
Zykovich A, Hubbard A, Flynn JM, Tarnopolsky M, Fraga MF, Kerksick C, Ogborn D, MacNeil L, Mooney SD, Melov S. 2014. Genome-wide DNA methylation changes with age in disease-free human skeletal muscle. Aging Cell 13(2): 360-366.
Cold Spring Harbor Laboratory Press on October 29, 2014 - Published by genome.cshlp.orgDownloaded from

Cold Spring Harbor Laboratory Press on October 29, 2014 - Published by genome.cshlp.orgDownloaded from
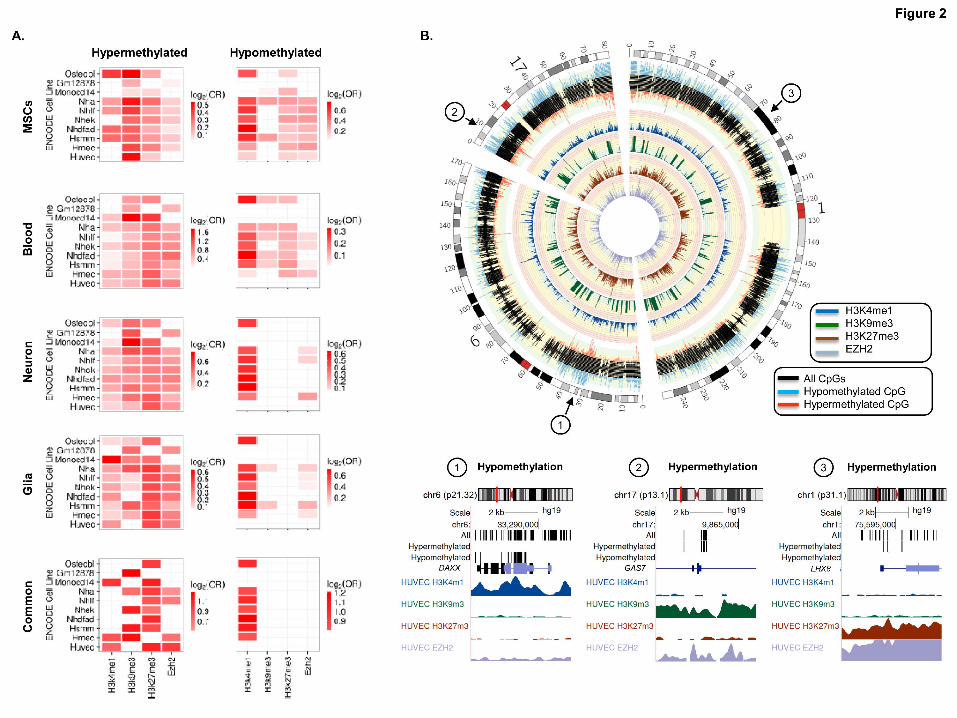
Cold Spring Harbor Laboratory Press on October 29, 2014 - Published by genome.cshlp.orgDownloaded from

Cold Spring Harbor Laboratory Press on October 29, 2014 - Published by genome.cshlp.orgDownloaded from

Cold Spring Harbor Laboratory Press on October 29, 2014 - Published by genome.cshlp.orgDownloaded from

Cold Spring Harbor Laboratory Press on October 29, 2014 - Published by genome.cshlp.orgDownloaded from
Related Documents