United States Department of Agriculture Forest Service Northeastern Forest Northeastern Forest Northeastern Forest Northeastern Forest Northeastern Forest Experiment Station Experiment Station Experiment Station Experiment Station Experiment Station General Technical Report NE-233 Forest Health Technology Enterprise Team Gypsy Moth in the United States: Gypsy Moth in the United States: Gypsy Moth in the United States: Gypsy Moth in the United States: Gypsy Moth in the United States: An Atlas An Atlas An Atlas An Atlas An Atlas Andrew M. Liebhold Kurt W. Gottschalk Eugene R. Luzader Douglas A. Mason Renate Bush Daniel B. Twardus

Welcome message from author
This document is posted to help you gain knowledge. Please leave a comment to let me know what you think about it! Share it to your friends and learn new things together.
Transcript

United StatesDepartment ofAgriculture
Forest Service
Northeastern ForestNortheastern ForestNortheastern ForestNortheastern ForestNortheastern ForestExperiment StationExperiment StationExperiment StationExperiment StationExperiment Station
General TechnicalReport NE-233
Forest Health TechnologyEnterprise Team
Gypsy Moth in the United States:Gypsy Moth in the United States:Gypsy Moth in the United States:Gypsy Moth in the United States:Gypsy Moth in the United States:An AtlasAn AtlasAn AtlasAn AtlasAn Atlas
Andrew M. LiebholdKurt W. GottschalkEugene R. LuzaderDouglas A. MasonRenate BushDaniel B. Twardus
Published by: For additional copies:
USDA FOREST SERVICE USDA Forest Service5 RADNOR CORP CTR SUITE 200 Publications DistributionRADNOR PA 19087-4585 359 Main Road
Delaware, OH 43015February 1997
AbstractAbstractAbstractAbstractAbstract
This atlas includes 52 maps that document the historical spread of gypsy mothfrom 1900 to the present, historical forest defoliation in the Northeast from 1984 tothe present, and the distribution of susceptible forests in the conterminous UnitedStates. These maps should be useful for planning activities to limit the spread ofgypsy moth and mitigate the effects of this forest insect pest in areas that have notyet been invaded.
The AThe AThe AThe AThe Authoruthoruthoruthoruthorsssss
ANDREW M. LIEBHOLD is a research entomologist, KURT W. GOTTSCHALK is aresearch forester, EUGENE R. LUZADER is a computer specialist, and DOUGLASA. MASON is a computer programmer with the Northeastern Forest ExperimentStation’s laboratory at Morgantown, West Virginia. RENATE BUSH is abiometrician with the USDA Forest Service’s Forest Management Service Centerat Fort Collins, Colorado. DANIEL B. TWARDUS is a forest health specialist withthe Northeastern Area, State and Private Forestry, Morgantown, West Virginia.
Manuscript received for publication 9 July 1996
AcknowledgmentAcknowledgmentAcknowledgmentAcknowledgmentAcknowledgment
The authors gratefully acknowledge the cooperative assistance of the Morgantown,West Virginia, field office of the Forest Health Technology Enterprise Team in thepublication of this report.
COVER: COVER: COVER: COVER: COVER: Map depicts frequency (number of years) of defoliation by the gypsy mothin the United States, 1984 to 1994 (See Figure 30).
1
IntroductionIntroductionIntroductionIntroductionIntroduction
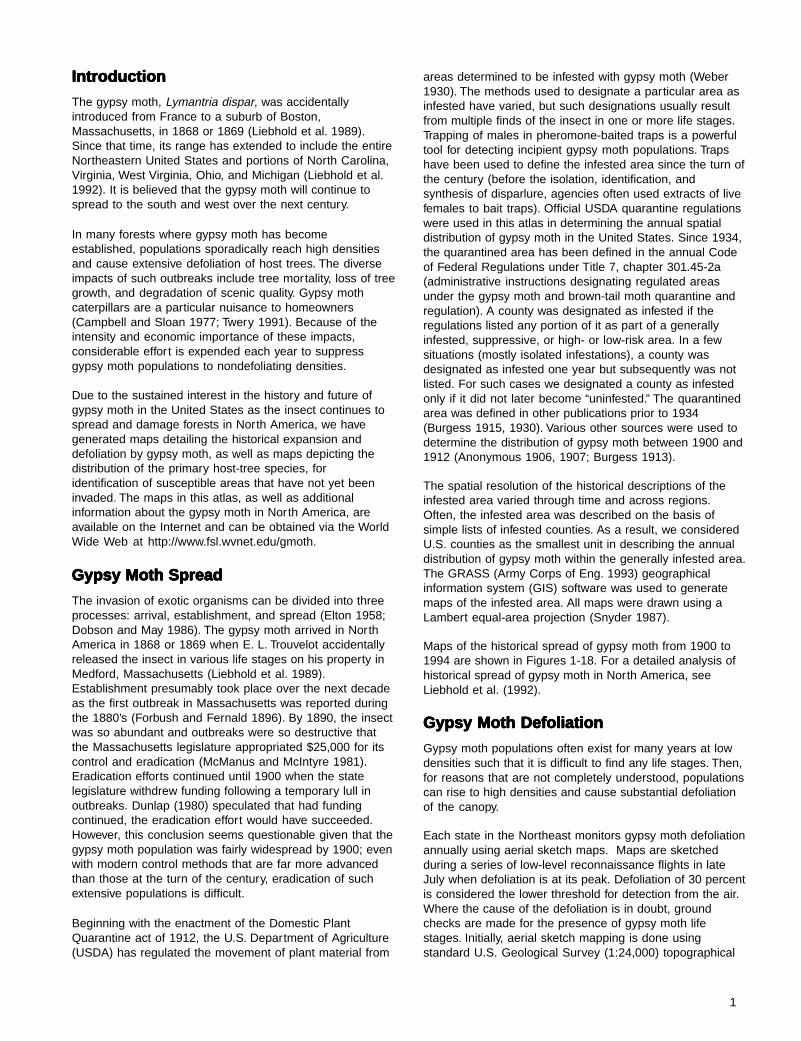
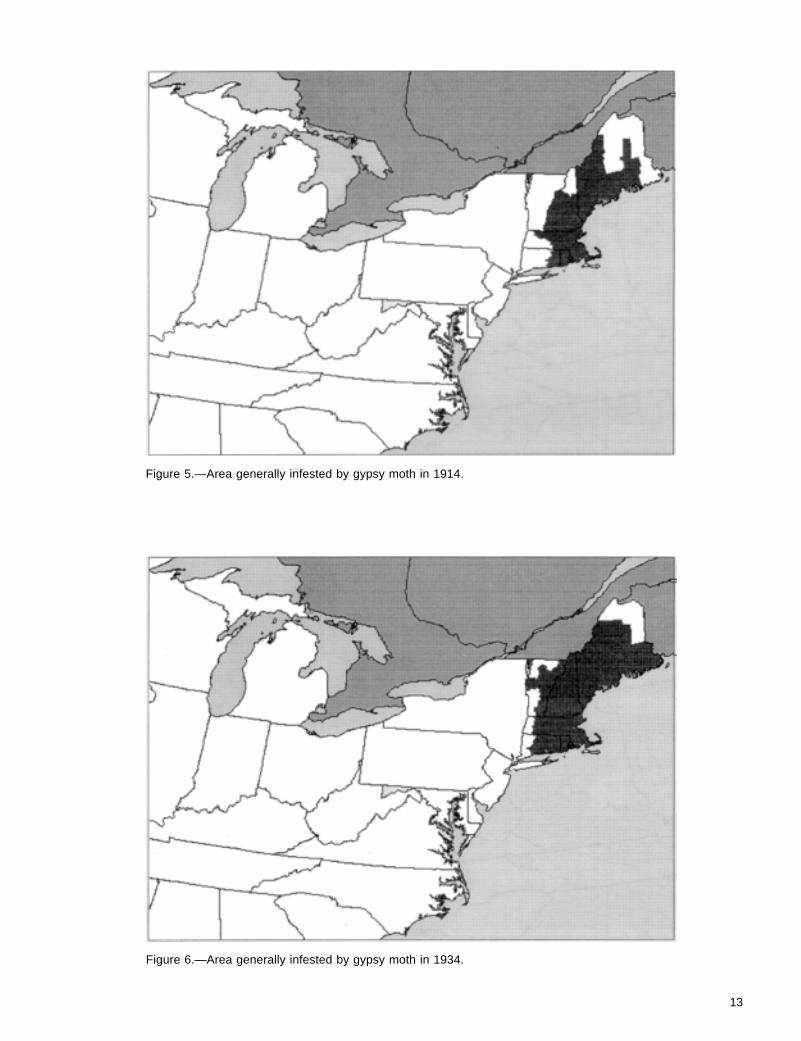
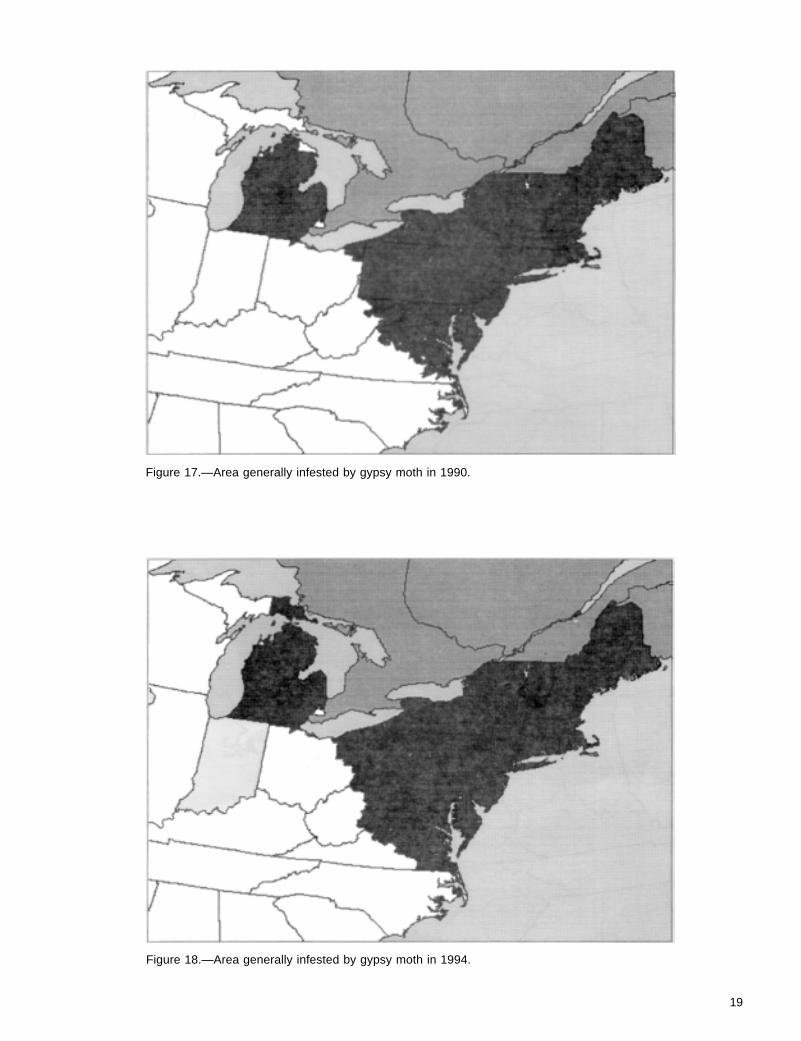
The gypsy moth, Lymantria dispar, was accidentallyintroduced from France to a suburb of Boston,Massachusetts, in 1868 or 1869 (Liebhold et al. 1989).Since that time, its range has extended to include the entireNortheastern United States and portions of North Carolina,Virginia, West Virginia, Ohio, and Michigan (Liebhold et al.1992). It is believed that the gypsy moth will continue tospread to the south and west over the next century.
In many forests where gypsy moth has becomeestablished, populations sporadically reach high densitiesand cause extensive defoliation of host trees. The diverseimpacts of such outbreaks include tree mortality, loss of treegrowth, and degradation of scenic quality. Gypsy mothcaterpillars are a particular nuisance to homeowners(Campbell and Sloan 1977; Twery 1991). Because of theintensity and economic importance of these impacts,considerable effort is expended each year to suppressgypsy moth populations to nondefoliating densities.
Due to the sustained interest in the history and future ofgypsy moth in the United States as the insect continues tospread and damage forests in North America, we havegenerated maps detailing the historical expansion anddefoliation by gypsy moth, as well as maps depicting thedistribution of the primary host-tree species, foridentification of susceptible areas that have not yet beeninvaded. The maps in this atlas, as well as additionalinformation about the gypsy moth in North America, areavailable on the Internet and can be obtained via the WorldWide Web at http://www.fsl.wvnet.edu/gmoth.
Gypsy Moth SpreadGypsy Moth SpreadGypsy Moth SpreadGypsy Moth SpreadGypsy Moth Spread
The invasion of exotic organisms can be divided into threeprocesses: arrival, establishment, and spread (Elton 1958;Dobson and May 1986). The gypsy moth arrived in NorthAmerica in 1868 or 1869 when E. L. Trouvelot accidentallyreleased the insect in various life stages on his property inMedford, Massachusetts (Liebhold et al. 1989).Establishment presumably took place over the next decadeas the first outbreak in Massachusetts was reported duringthe 1880’s (Forbush and Fernald 1896). By 1890, the insectwas so abundant and outbreaks were so destructive thatthe Massachusetts legislature appropriated $25,000 for itscontrol and eradication (McManus and McIntyre 1981).Eradication efforts continued until 1900 when the statelegislature withdrew funding following a temporary lull inoutbreaks. Dunlap (1980) speculated that had fundingcontinued, the eradication effort would have succeeded.However, this conclusion seems questionable given that thegypsy moth population was fairly widespread by 1900; evenwith modern control methods that are far more advancedthan those at the turn of the century, eradication of suchextensive populations is difficult.
Beginning with the enactment of the Domestic PlantQuarantine act of 1912, the U.S. Department of Agriculture(USDA) has regulated the movement of plant material from
areas determined to be infested with gypsy moth (Weber1930). The methods used to designate a particular area asinfested have varied, but such designations usually resultfrom multiple finds of the insect in one or more life stages.Trapping of males in pheromone-baited traps is a powerfultool for detecting incipient gypsy moth populations. Trapshave been used to define the infested area since the turn ofthe century (before the isolation, identification, andsynthesis of disparlure, agencies often used extracts of livefemales to bait traps). Official USDA quarantine regulationswere used in this atlas in determining the annual spatialdistribution of gypsy moth in the United States. Since 1934,the quarantined area has been defined in the annual Codeof Federal Regulations under Title 7, chapter 301.45-2a(administrative instructions designating regulated areasunder the gypsy moth and brown-tail moth quarantine andregulation). A county was designated as infested if theregulations listed any portion of it as part of a generallyinfested, suppressive, or high- or low-risk area. In a fewsituations (mostly isolated infestations), a county wasdesignated as infested one year but subsequently was notlisted. For such cases we designated a county as infestedonly if it did not later become “uninfested.” The quarantinedarea was defined in other publications prior to 1934(Burgess 1915, 1930). Various other sources were used todetermine the distribution of gypsy moth between 1900 and1912 (Anonymous 1906, 1907; Burgess 1913).
The spatial resolution of the historical descriptions of theinfested area varied through time and across regions.Often, the infested area was described on the basis ofsimple lists of infested counties. As a result, we consideredU.S. counties as the smallest unit in describing the annualdistribution of gypsy moth within the generally infested area.The GRASS (Army Corps of Eng. 1993) geographicalinformation system (GIS) software was used to generatemaps of the infested area. All maps were drawn using aLambert equal-area projection (Snyder 1987).
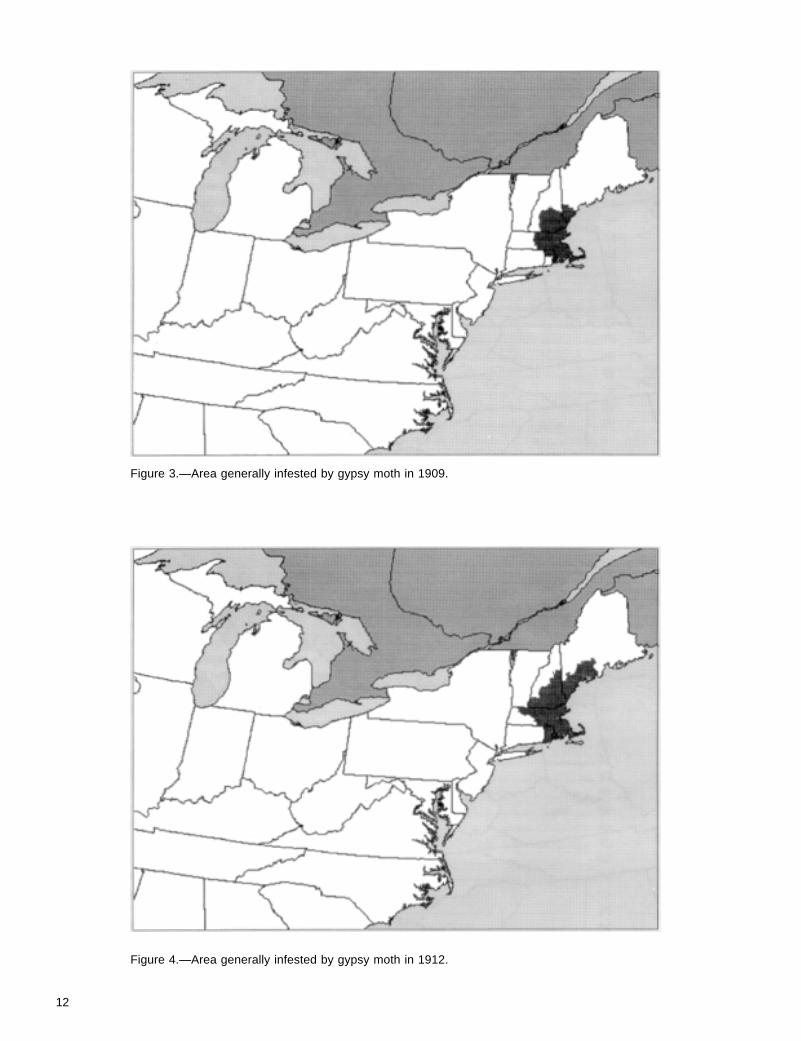
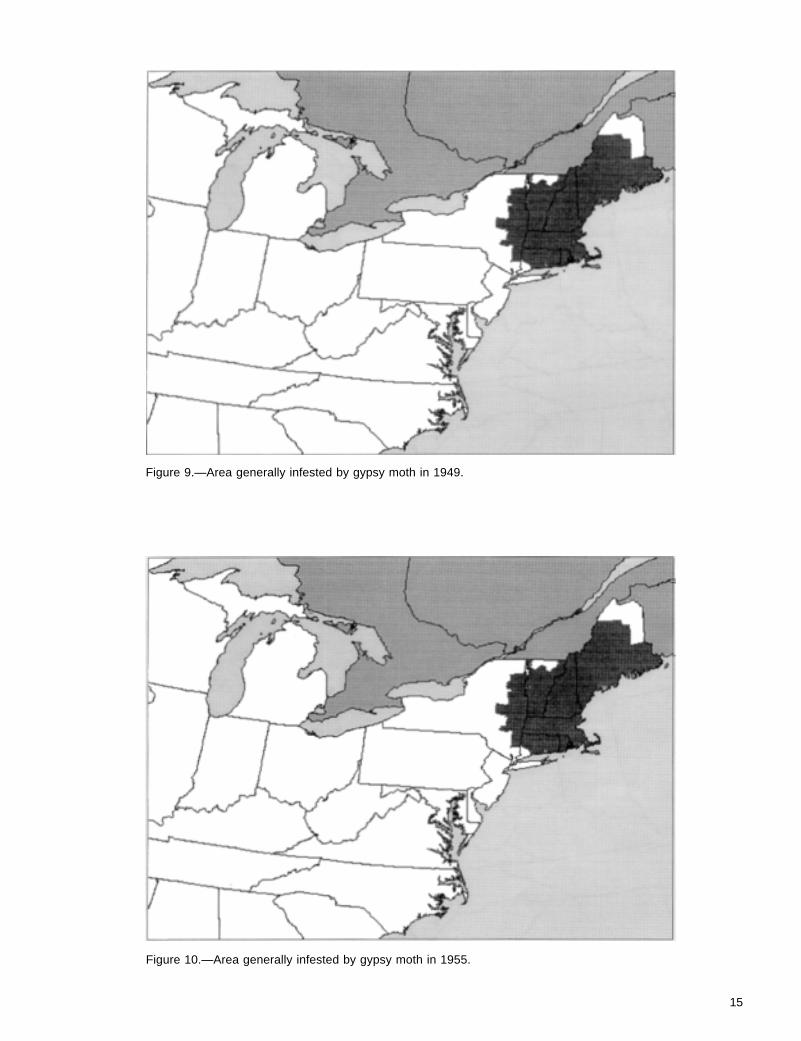
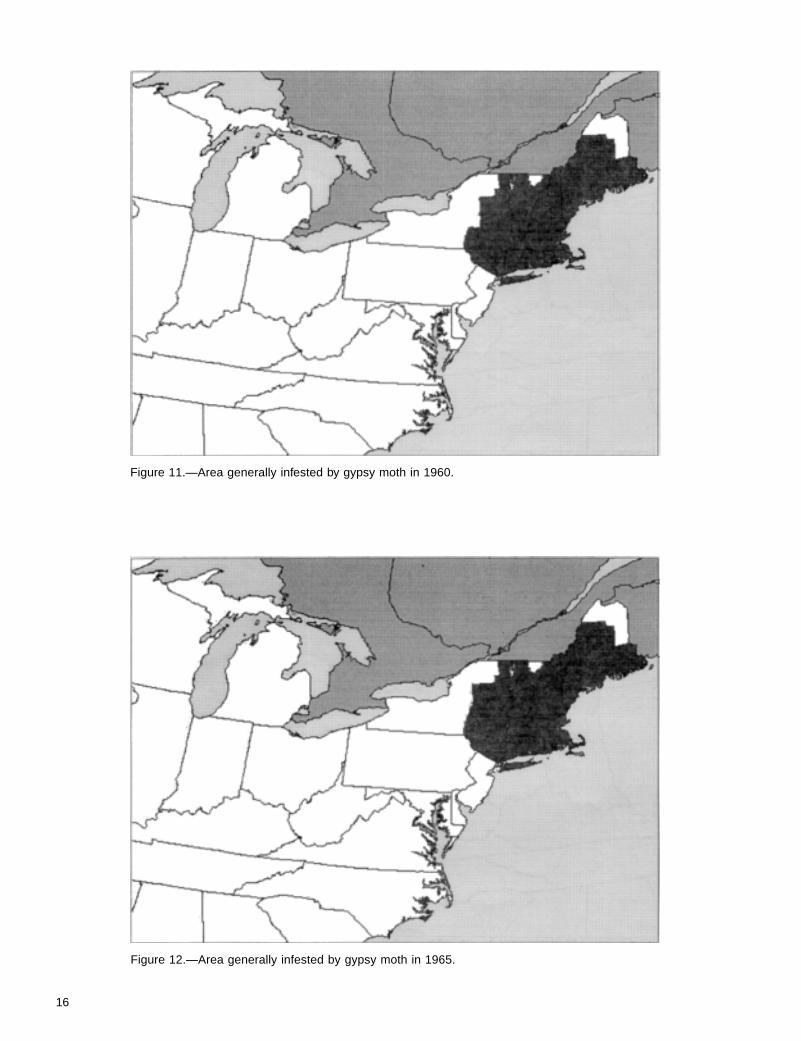
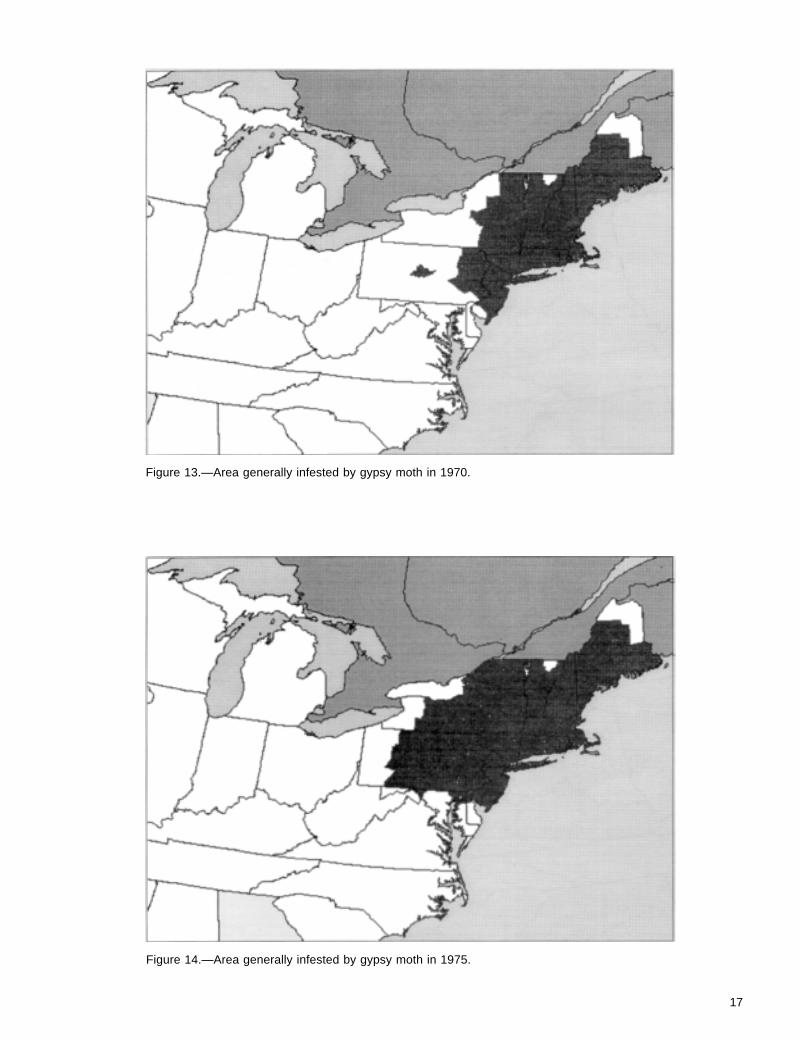
Maps of the historical spread of gypsy moth from 1900 to1994 are shown in Figures 1-18. For a detailed analysis ofhistorical spread of gypsy moth in North America, seeLiebhold et al. (1992).
Gypsy Moth DefoliationGypsy Moth DefoliationGypsy Moth DefoliationGypsy Moth DefoliationGypsy Moth Defoliation
Gypsy moth populations often exist for many years at lowdensities such that it is difficult to find any life stages. Then,for reasons that are not completely understood, populationscan rise to high densities and cause substantial defoliationof the canopy.
Each state in the Northeast monitors gypsy moth defoliationannually using aerial sketch maps. Maps are sketchedduring a series of low-level reconnaissance flights in lateJuly when defoliation is at its peak. Defoliation of 30 percentis considered the lower threshold for detection from the air.Where the cause of the defoliation is in doubt, groundchecks are made for the presence of gypsy moth lifestages. Initially, aerial sketch mapping is done usingstandard U.S. Geological Survey (1:24,000) topographical

2
maps as the base. Composite mosaics then are generatedfor each state on maps of varying scales and projections.Mapping processes vary among state agencies and years,resulting in a strong likelihood of significant data errors fromboth systematic and nonsystematic sources. The likelypresence of these errors dictated the coarse spatialresolution of maps (2 x 2-km rasters) presented in thisatlas.
Another GIS software package, IDRISI, was used toassemble, collate, and analyze data on gypsy mothdefoliation (Eastman 1989). A raster-based (grid cell) GISused to capture, store, analyze, and display geographicdata, IDRISI was designed for research applications. Abase map of boundary coordinates of counties was used todefine the study area. A 2 x 2-km grid cell size was selectedas standard for all map layers in the GIS. As mentionedpreviously, this grid size represented the minimumdependable spatial resolution of defoliation data availablefrom state agencies.
In the process of recording defoliation on sketch maps fromaircraft (Talerico 1981), spatial error occurs with respect tothe exact location, degree, and aerial extent of defoliation;this locational error generally is less than 1 km inmagnitude. One advantage of a raster-based GIS is thatthe inherent uncertainty of data is maintained and displayedby the “sawtooth” effect of adjacent cells. However, such acoarse scale of resolution raises serious issues concerningaccuracy and the cascading effect of errors as data layersare manipulated (Chrisman 1987). Without corroboratingevidence at a fine scale of resolution, it is not possible toprovide accurate estimates of the errors.
GIS analysis is possible by the use of multiple layers ofgeographical data (map layers), each coordinated with theothers by geo-referenced points. To create a uniform set ofgeographically referenced defoliation data, the compositemaps for 1969-89 were first transferred to mylar stable-base sheets. At least four geo-referenced points werelocated accurately on clearly recognizable intersections ofcounty boundaries. The prepared maps were then scannedwith a digital scanner set at a resolution of 150 dots perinch. Binary TIFF files from the scanner were converted toASCII IDRISI raster format and saved as IDRISI images ormap layers. Each map layer was transformed to acommon base-map resolution and projection was by a“rubber-sheeting” procedure (Burrough 1988). Intransforming maps of various scales and projections,IDRISI resamples each scanned defoliation image tomatch the location of the four geo-referenced points on thebase map (Eastman 1989).
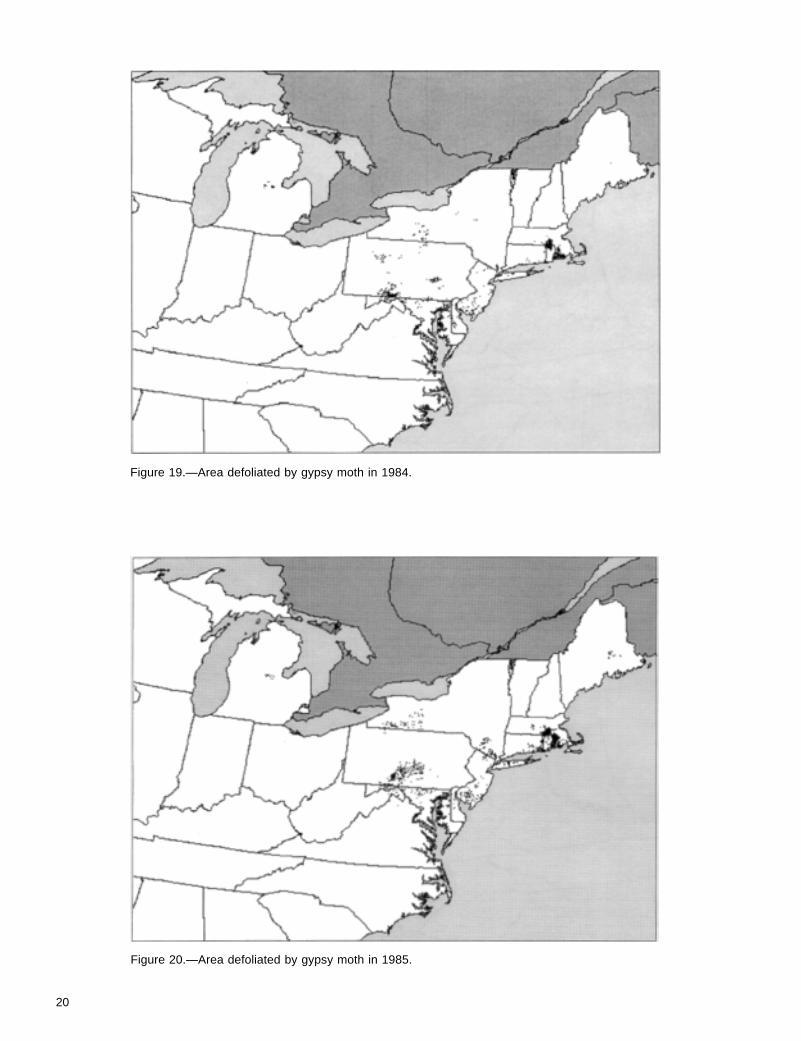
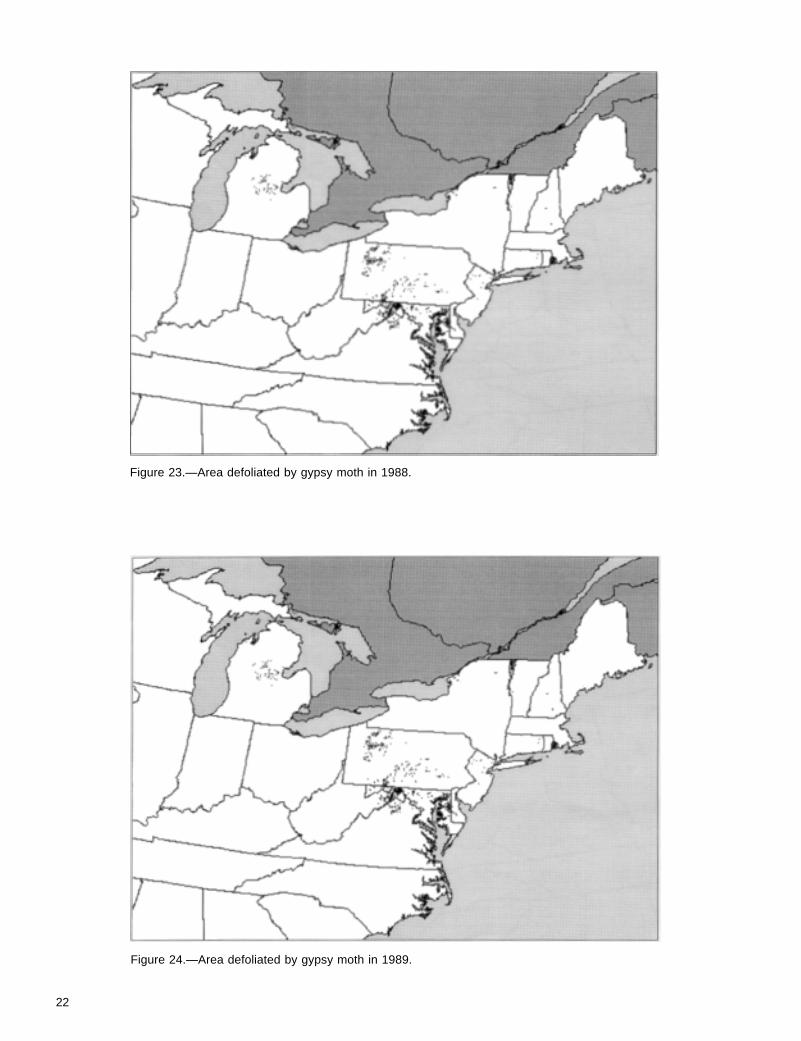
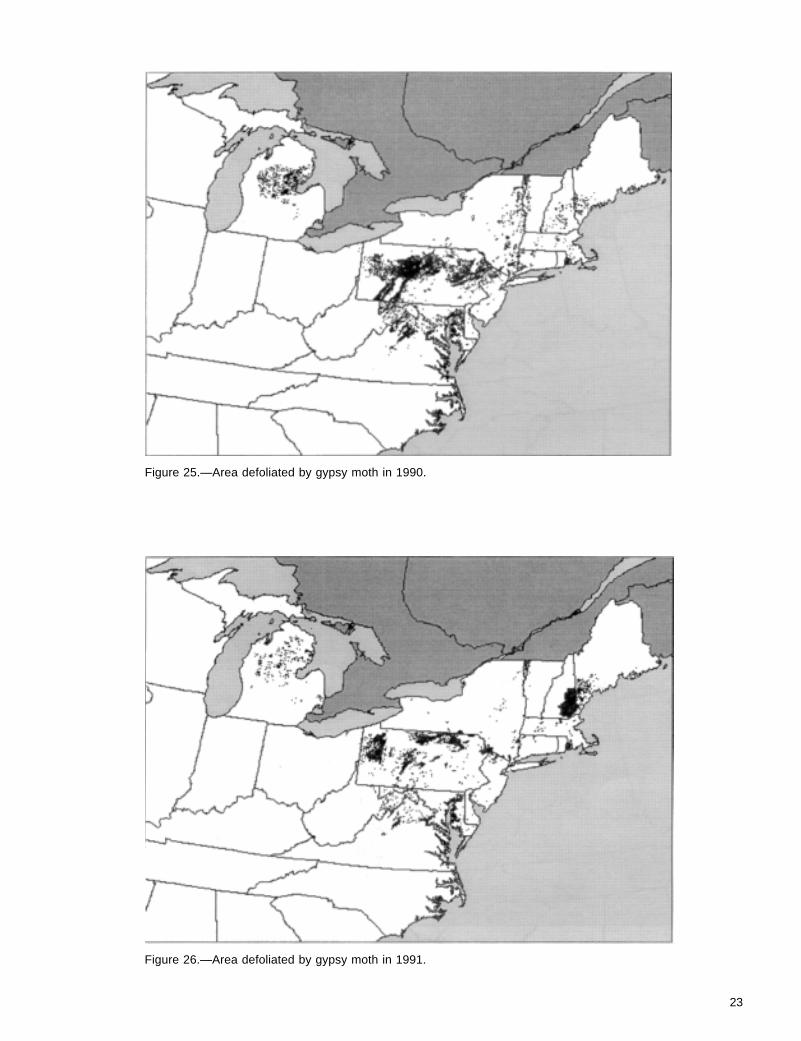
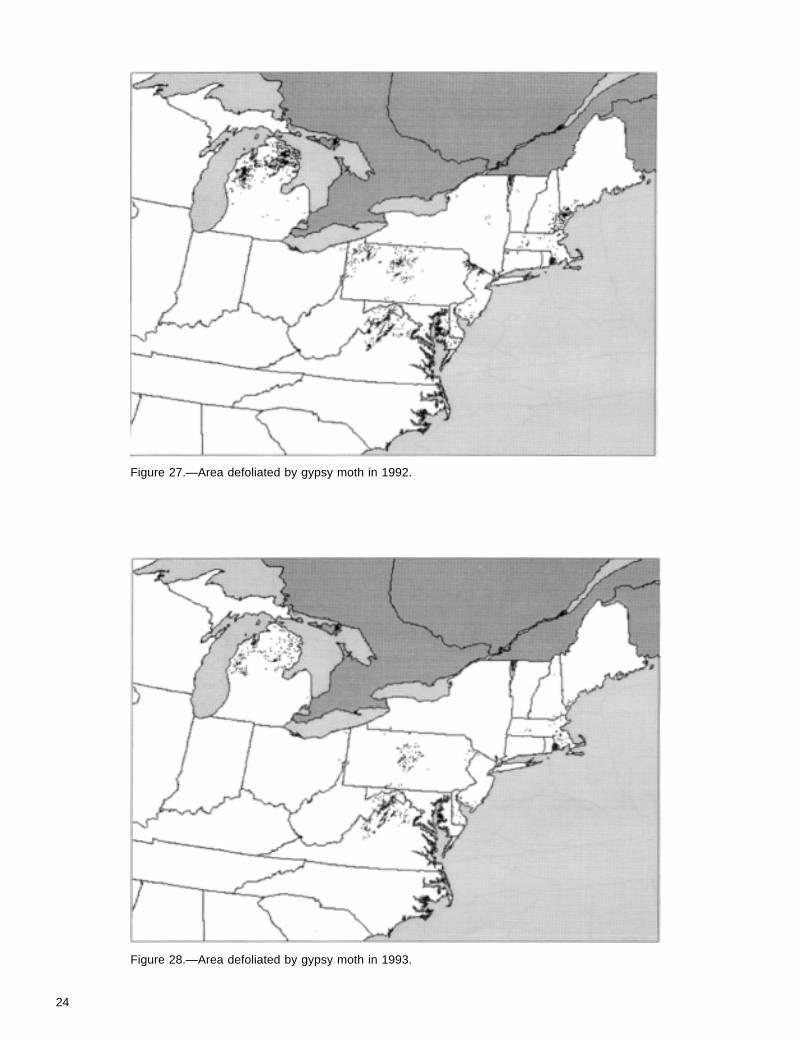
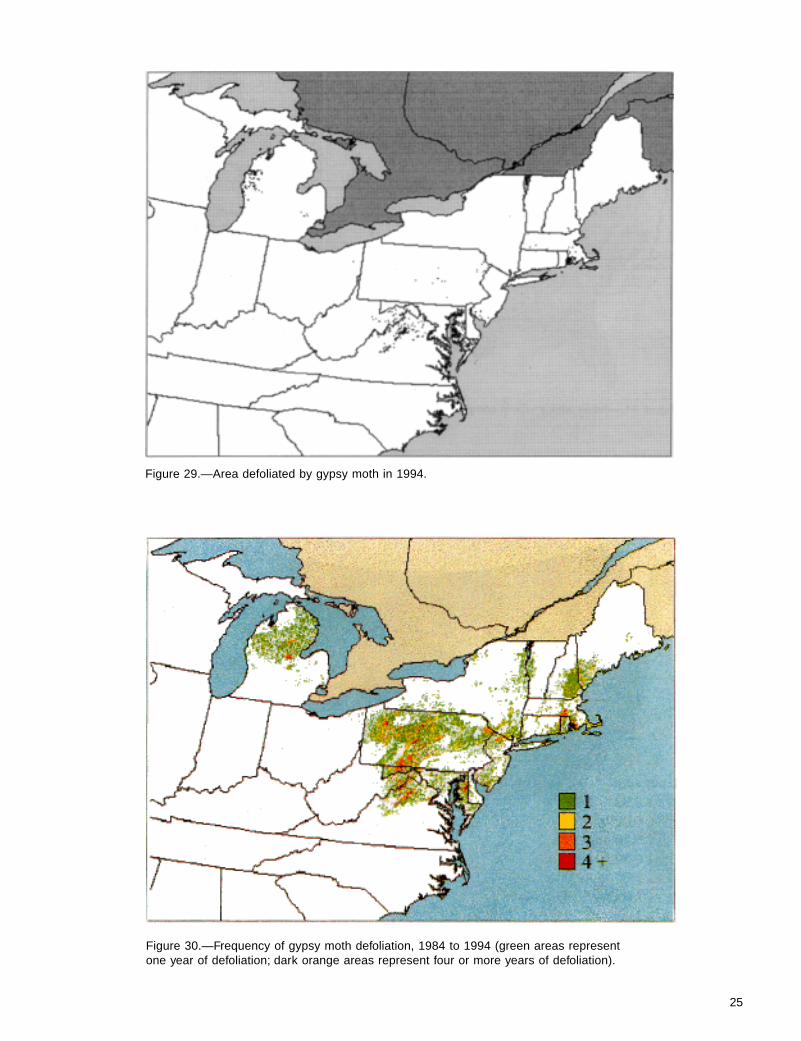
Maps of historical defoliation from 1984 to 1994 are shownin Figures 19-29. Historical maps of defoliation were notavailable for some states prior to 1984. It is obvious fromthese maps that outbreaks occur over large regions, oftenwith considerable synchrony, and can persist for manyyears (Liebhold and Elkinton 1989; Hohn et al. 1993;Williams and Liebhold 1995). Figure 30 depicts the totalfrequency of defoliation from 1984 to 1994. Obviously,
areas that gypsy moth has invaded only recently will have alower frequency of defoliation, but beyond that pattern,areas with high defoliation frequencies represent forestedareas where composition is highly susceptible to defoliation(Liebhold et al. 1994; Gansner et al. 1993).
Forest SusceptibilityForest SusceptibilityForest SusceptibilityForest SusceptibilityForest Susceptibility
The gypsy moth eventually will be present in most of theforested land in the United States, though outbreaksprobably will be restricted to areas where forest compositionfavors population growth. As mentioned earlier,considerable effort is being expended to document thespatial extent of gypsy moth defoliation via aerial sketchmapping and other techniques. This information has beenused to map the spatial distribution of forests susceptible tothe insect within the generally infested region (Liebhold andElkinton 1989; Liebhold et al. 1994). Planning for themanagement of gypsy moth over the next decade andbeyond requires that the distribution of susceptible standsbe delimited in areas that currently are uninfested.
The gypsy moth is polyphagous; North Americanpopulations feed on more than 300 different shrub and treespecies (Liebhold et al. 1995). Despite this wide range ofhost preference, there is considerable variation withinnortheastern U.S. forests with respect to susceptibility todefoliation. In this atlas, “susceptibility” is defined as theprobability or frequency of defoliation. For a description ofalternative approaches, see Twery et al. (1990).
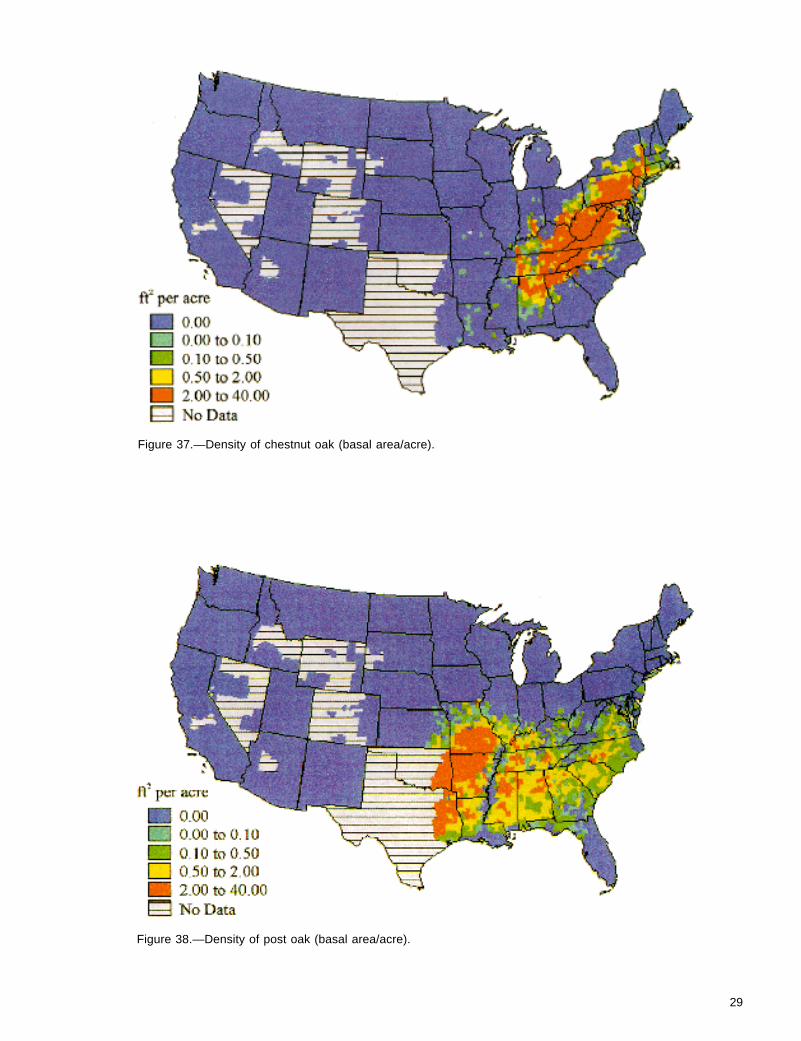
Several studies that have focused on relating variouscharacteristics of forests to susceptibility to defoliation bygypsy moth have yielded susceptibility models of varyinglevels of complexity. Probably the most important factoraffecting stand susceptibility is the proportion of basal arearepresented by species that are highly preferred by theinsect (Herrick and Gansner 1986). Other variables, suchas the predominance of chestnut oak, abundance of treestructural features (e.g., bark flaps), and various sitecharacteristics (e.g., soils), also are known to be correlatedwith susceptibility (Bess et al. 1947; Valentine and Houston1979; Herrick and Gansner 1986), but these correlationsoften are specific to certain regions or the variables arerarely measured in forest inventories.
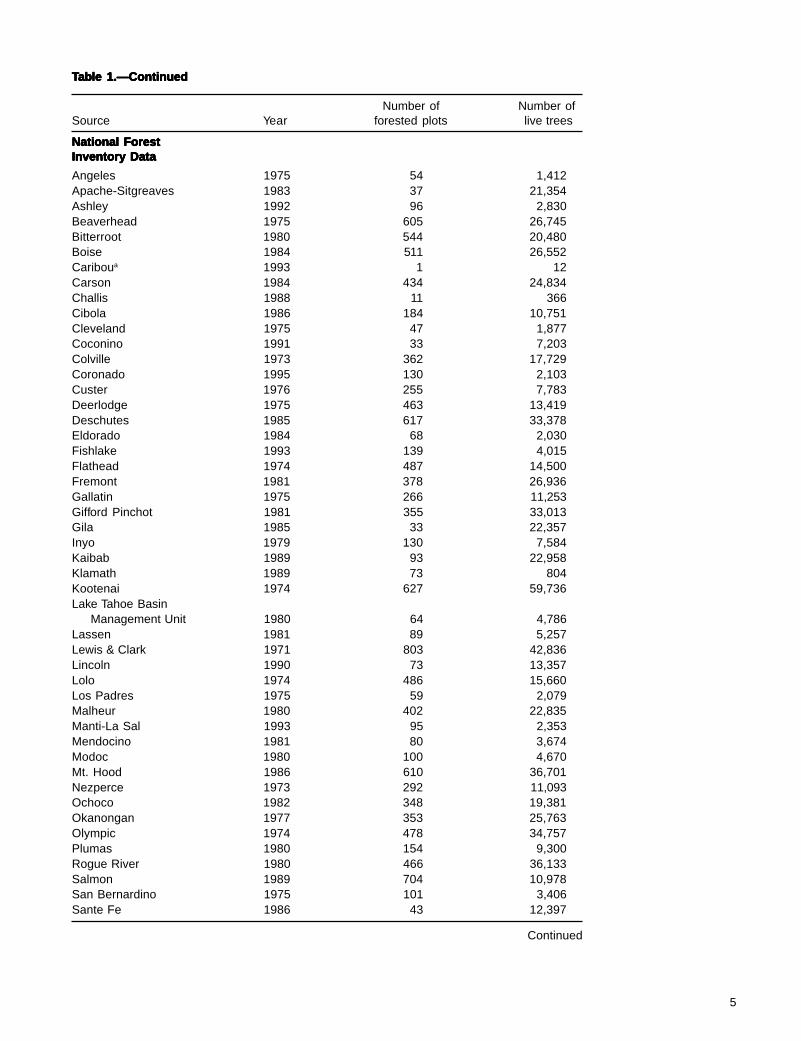
Gansner et al. (1993) demonstrated how susceptibilitymodels can be applied to forest inventory data to mapsusceptibility at the landscape level. We used a similartechnique to map forest susceptibility over the conterminousUnited States. Assessment of forest susceptibility wasbased on existing forest-inventory data collected throughoutthe conterminous United States. In the East, all inventorydata were obtained from the USDA Forest Service’s ForestInventory and Analysis (FIA) unit (Hansen et al. 1993),which inventories Federal as well as privately held land inthis region. Such inventories usually are conducted every 5to 15 years. Each state in the Northeast typically containsmore than 1,000 irregularly spaced FIA plots. In theWestern United States, FIA does not inventory NationalForests. As a result, information on western forests

3
constitute a mixture of FIA and National Forest inventorydata.
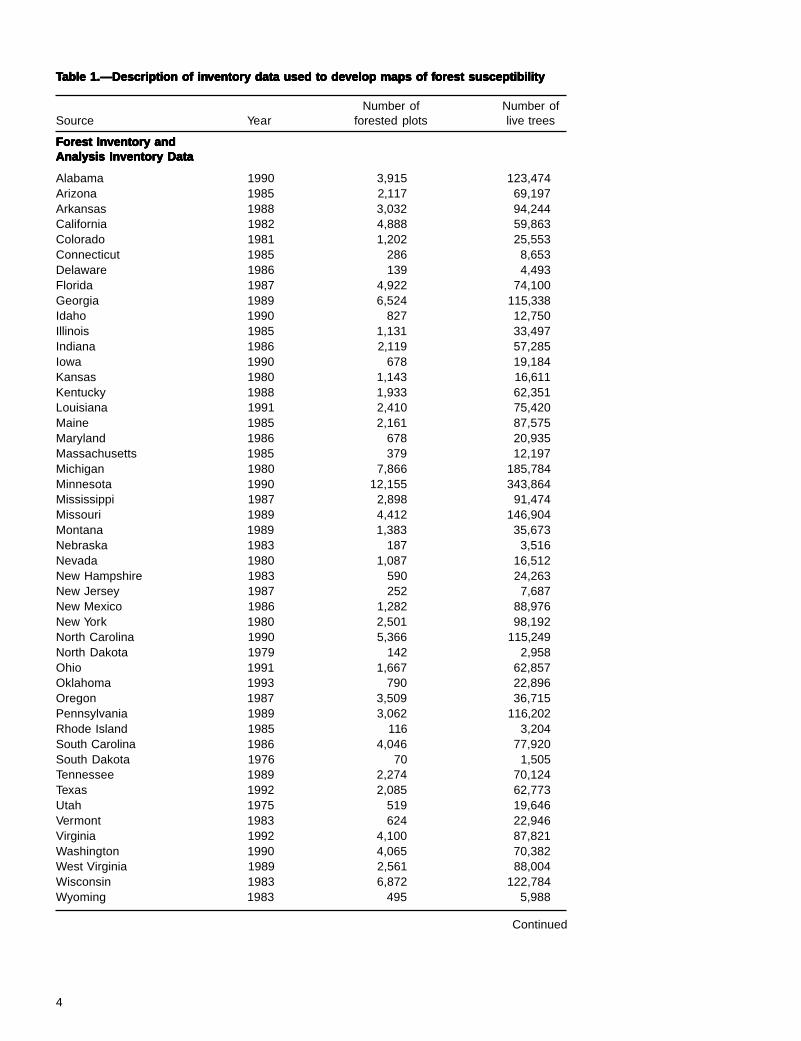
Sampling methods used to inventory forest resourcesvaried among regions and organizations (Table 1). Allinventory data contained information on individual trees andplots. Individual-tree records were used to sum total basalarea by each species for each plot. These plot records werethen expanded (using appropriate expansion factors) tocounty-level estimates of basal area per acre.
Inventory data were available from most portions of theconterminous United States. (Fig. 31). However, state andprivate land in the western two-thirds of Oklahoma andTexas are not inventoried by FIA. FIA data were availablefrom every state but National Forest inventory data werenot available for some areas in the West.
For example, all National Forest data from California(Forest Service Region 5) did not include ranger districts orcounties. Therefore, it was necessary to assign plotsrandomly within a given National Forest to counties(weighted by the proportion of the National Forest in eachcounty). In portions of the Southwest (Region 3), countieswere not included and similar assignments were made tothose within a ranger district.
We adopted proportion of basal area represented bypreferred species as the measure of forest susceptibility.While other variables (e.g., proportion of chestnut oak) mayhelp explain more variation in susceptibility, these modelsare less likely to be applied successfully outside the rangeof data originally used to calibrate them. Montgomery's(1991) 3-way classification (preferred, resistant, immune)was used to determine the degree to which each treespecies is susceptible to gypsy moth. This classification,based on a summary of field and laboratory studies and onextrapolations based on taxonomic affinity, is described indetail in Liebhold et al. (1995).
Table 2 lists the top 20 preferred species ranked by totalbasal area over the inventoried area. Of the top 10 speciesin the rank, only quaking aspen is found in the WesternUnited States. Caution should be used in interpreting thisranking because the lack of inventory data in certaincounties in the West (Fig. 31) resulted in a bias favoringeastern species. Nevertheless, these data indicate thatmost of the susceptible basal area (which is closelycorrelated to foliage area) is concentrated in the EasternUnited States.
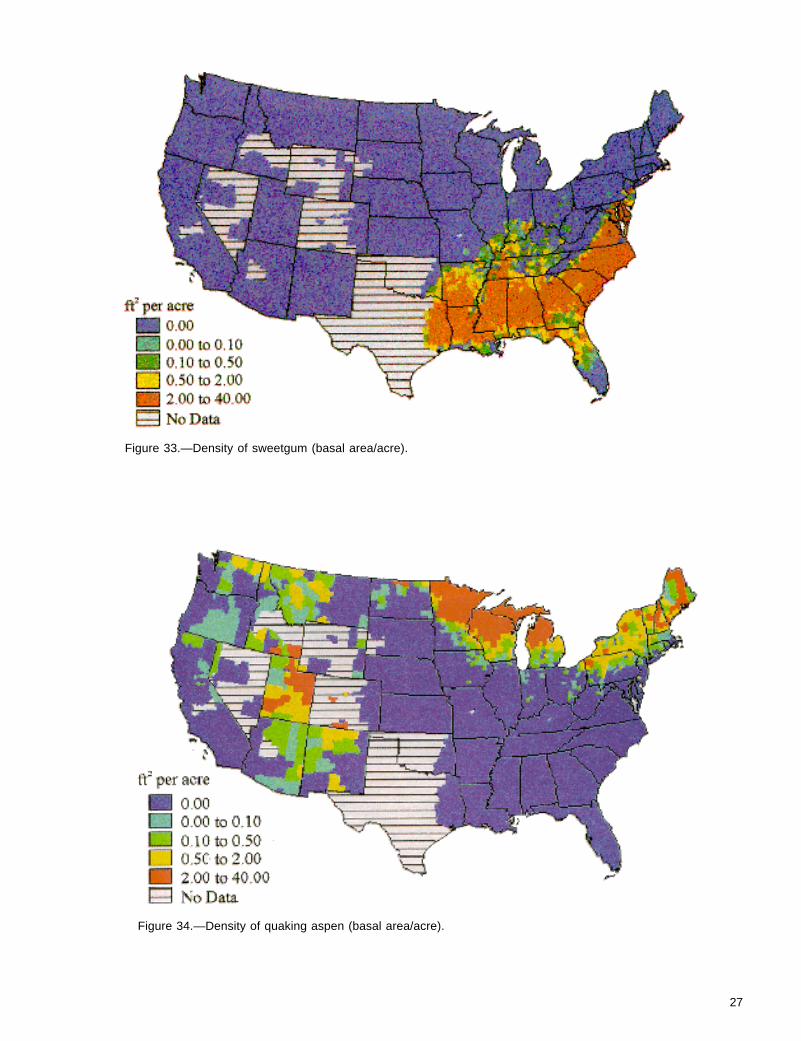
White oak was the highest ranking susceptible species(Table 2); the distribution of this species is shown in Figure32. Although there are high concentrations of white oakthroughout the East, the highest are in the OzarkMountains, Cumberland Plateau, and southernAppalachians. Most of these areas are currently beyond theexpanding range of the gypsy moth. Sweetgum, the secondmost common susceptible species (Table 2), is prevalentthroughout the Piedmont from North Carolina to Louisiana;it is mostly distributed beyond the current range of gypsy
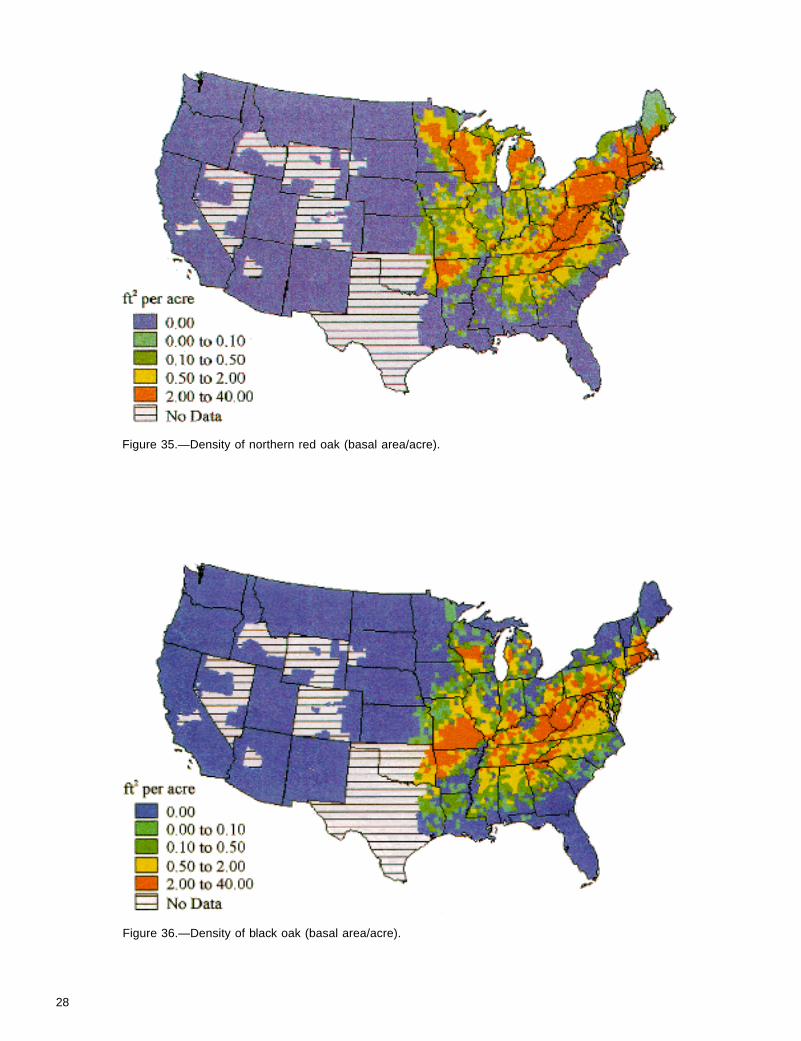
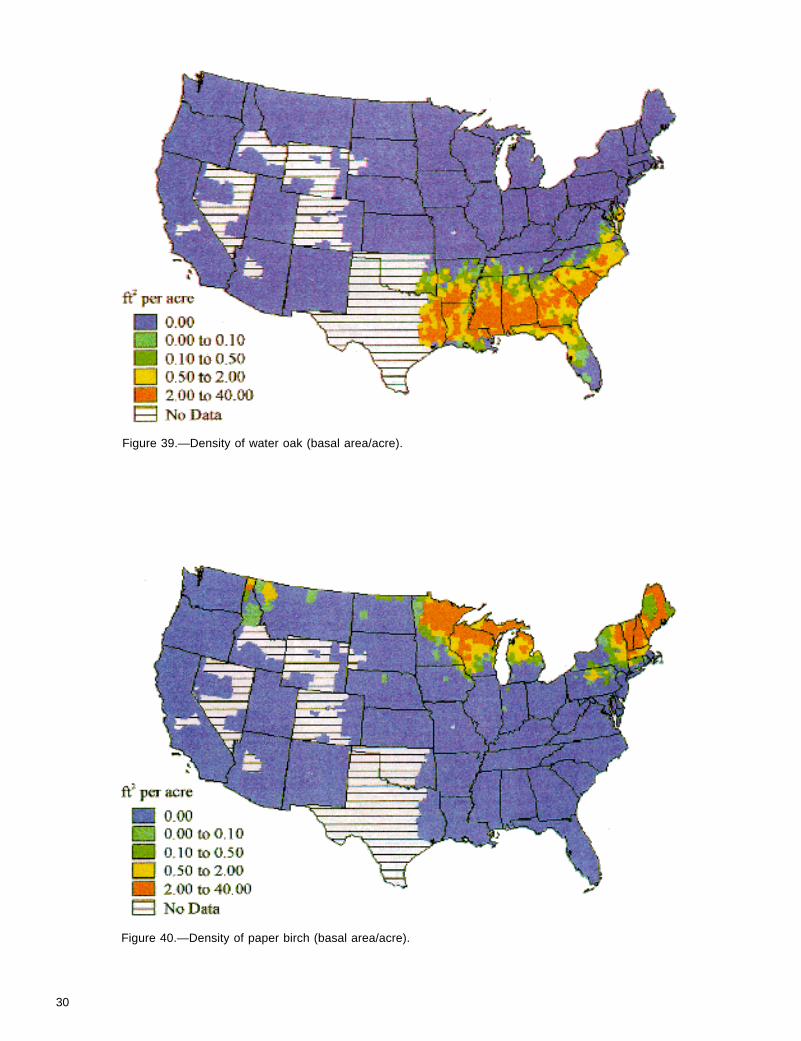
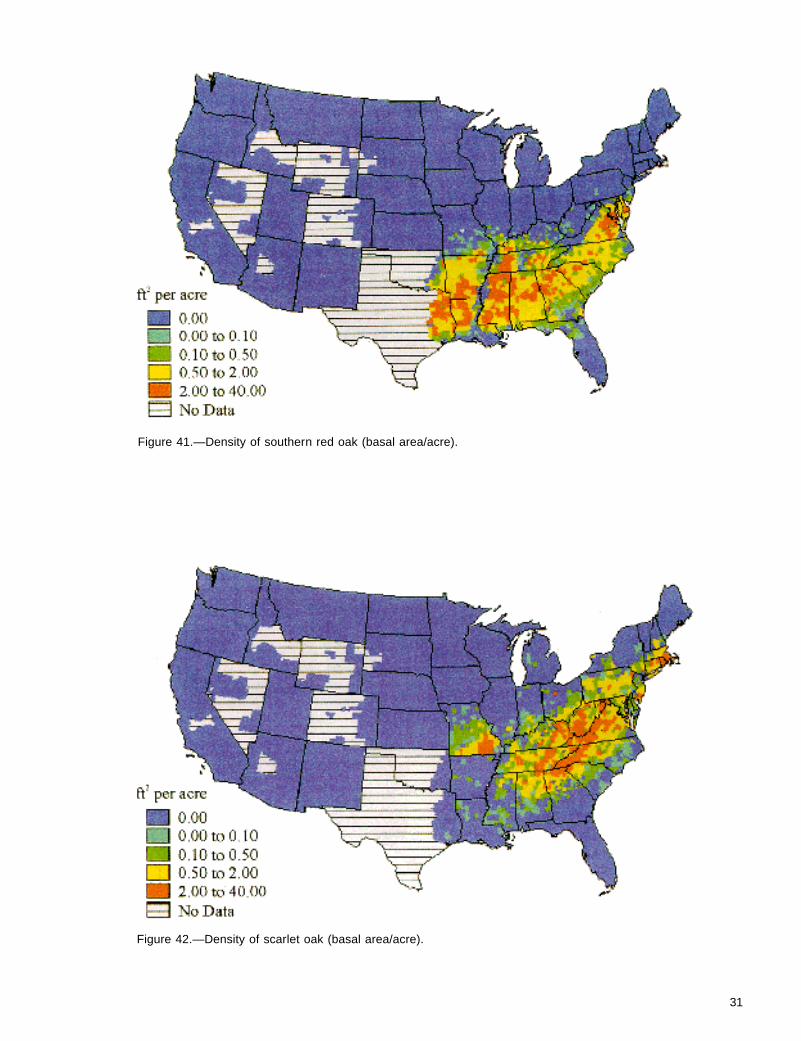
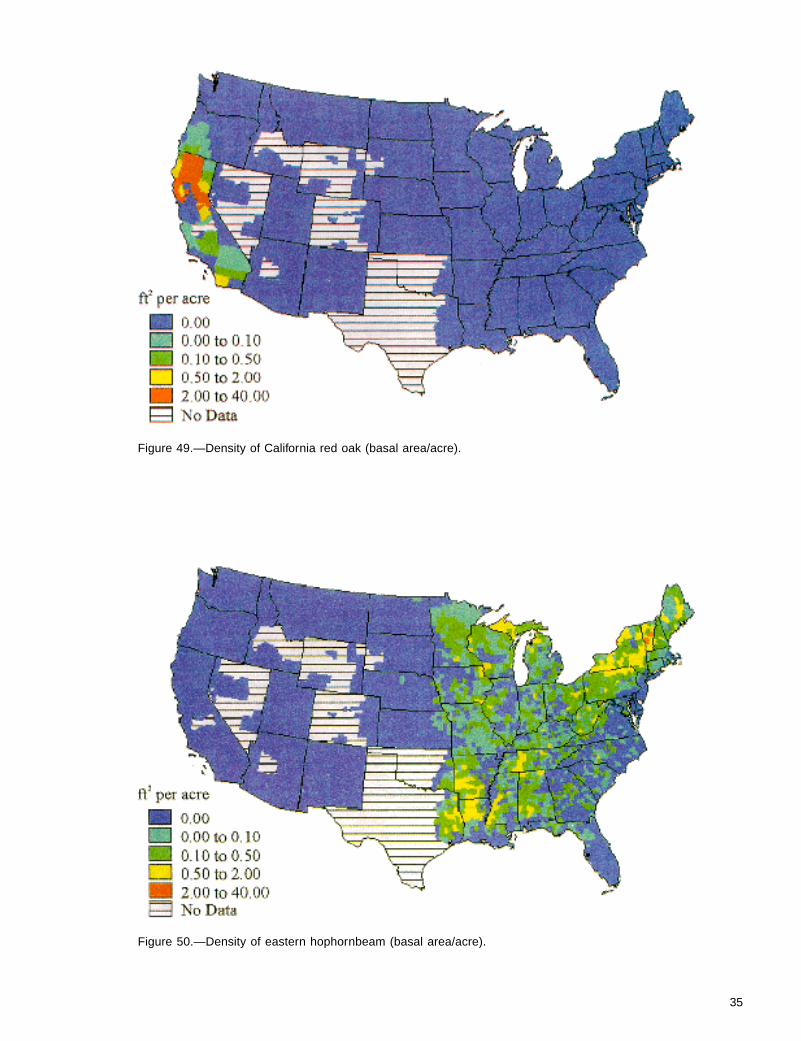
moth (Fig. 33). Quaking aspen, which ranked as the thirdmost common susceptible species (Table 2), is one of onlyseveral tree species whose range extends across theeastern and western portions of the continent. This speciesis most common in the northern portions of the Lake States(Fig. 34). Most of the areas with a high concentration ofaspen are beyond the current range of the gypsy moth.Northern red oak, ranked fourth in total basal area (Table2), is common throughout the Northeast and in portions ofthe Lake States (Fig. 35). Much of the range of this speciesencompasses areas already infested by gypsy moth. Theranges of the other most common preferred tree speciesare given in Figures 36-51.
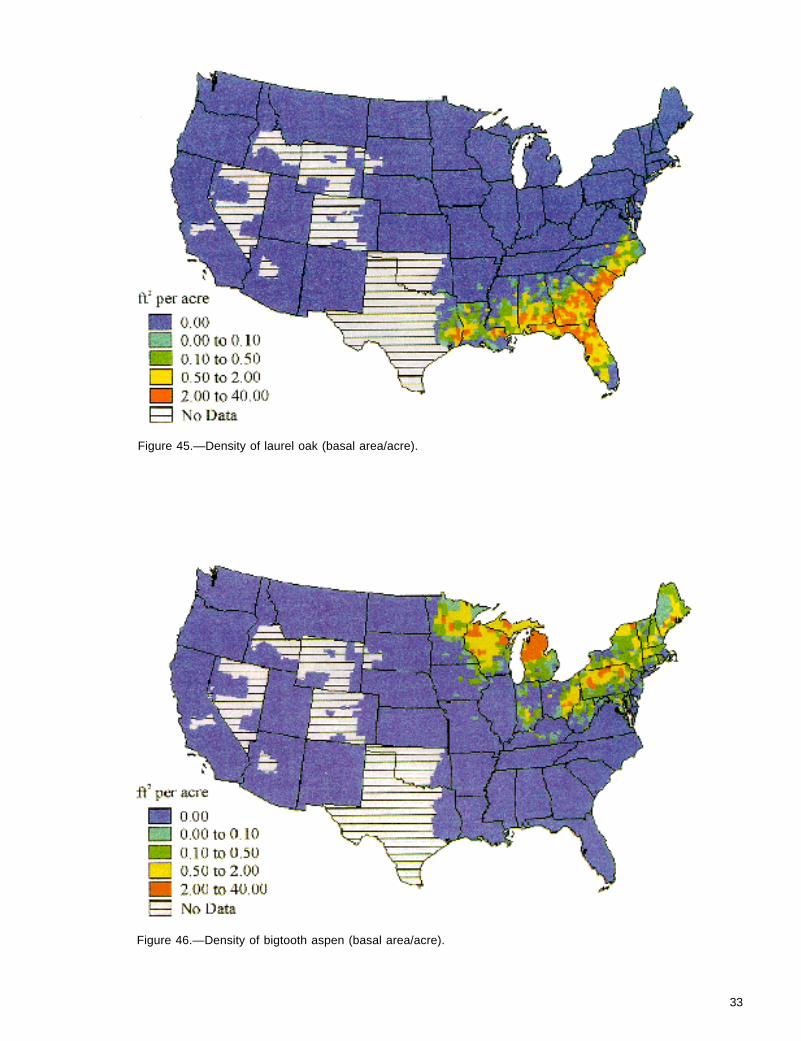
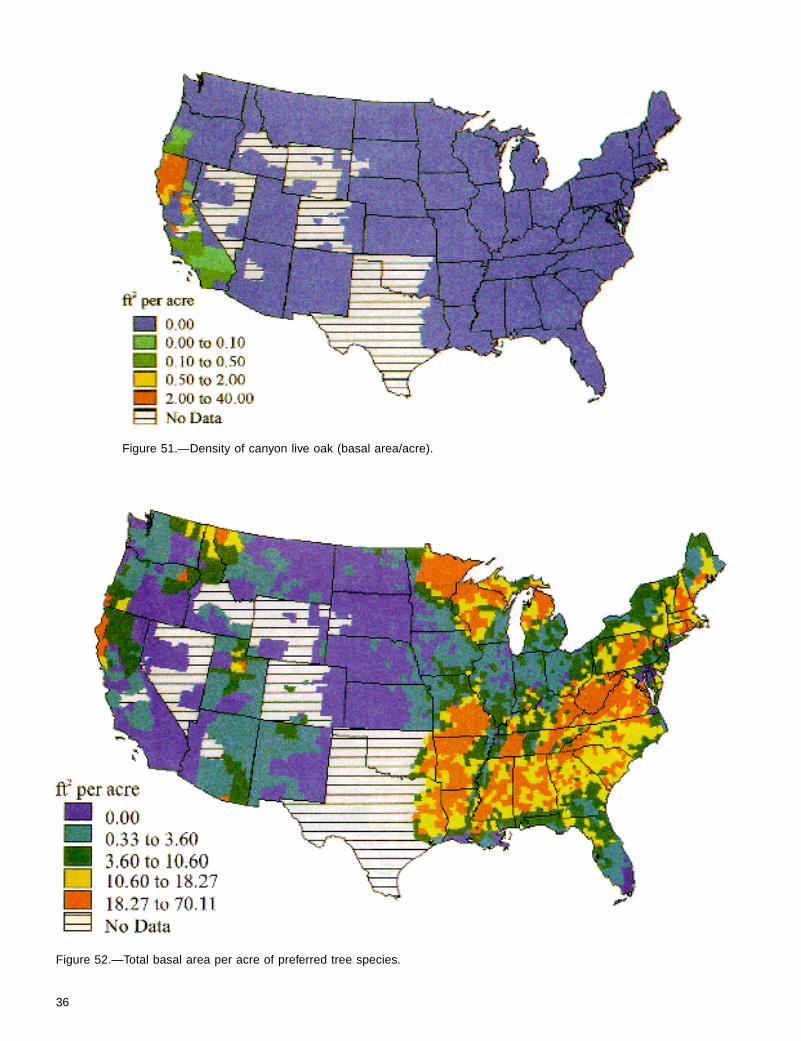
Overall forest susceptibility was quantified using the totalbasal area per acre of all preferred species (Fig. 52). Theareas with the highest concentration of susceptible forestswere in the central and southern Appalachians, CumberlandPlateau, Ozark Mountains, and northwestern Lake States.Comparison of these maps with the known distribution ofindividual susceptible species (Figs. 32-51) indicates thatoaks are the major component of susceptible forests inthese areas, and that quaking aspen is the majorsusceptible species in the northwestern Lake States.Although sweetgum is the second most commonsusceptible species (Table 2), it is not sufficiently abundantto achieve high levels of stand susceptibility. In thePiedmont, it is rarely associated with enough othersusceptible species for stands to be classified as highlysusceptible (Fig. 52).
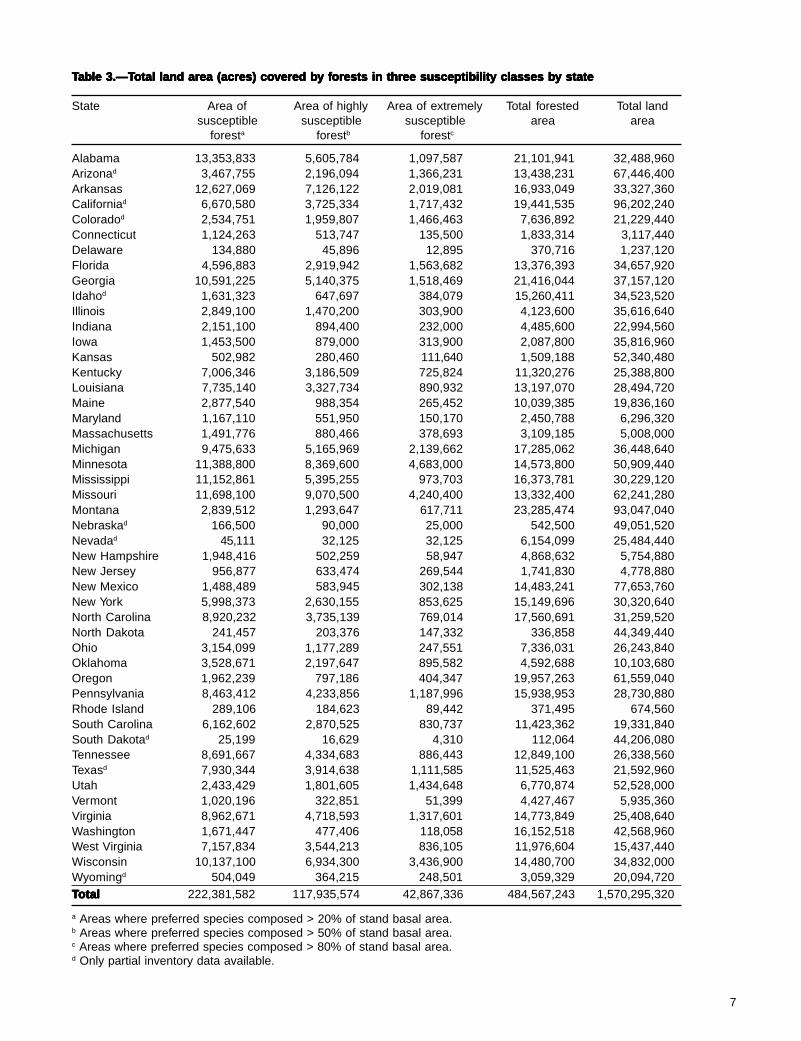
Table 3 summarizes total acreages of susceptible, highlysusceptible, and extremely susceptible forests for eachstate in the conterminous United States. This classificationof forest susceptibility was adopted from Herrick andGansner’s (1986) analysis of susceptibility in the Northeast.These data agree with the geographical trends depicted inFigure 32; susceptible forests are most abundant in thesouthern Appalachian, Cumberland Plateau, OzarkMountain, and northwestern Lake States.
Several caveats are attached to the interpretation of thesedata. As mentioned earlier, inventories were not availablefor urban forests, and there were no inventory data forseveral forested areas in the West (Fig. 31). Also, it isimportant to note that assumptions concerningsusceptibility are based on other hypotheses that have notbeen proven. For example, the suitability of many treespecies to gypsy moth often is based on incompleteinformation. Feeding trials have not been conducted formany species, and for others, there are no data onsusceptibility to defoliation in natural forests (Liebhold etal. 1995).
Despite all of the limitations cited, the maps in this atlasshould be useful for future planning. The finding that gypsymoth has not yet invaded most of the susceptible forests inthe United States suggests that there still may beconsiderable value in limiting the spread of this insect pest,and that both the impacts of defoliation and cost ofmanaging gypsy moth management are likely to increase.
4
TTTTTababababable 1.—Description of inle 1.—Description of inle 1.—Description of inle 1.—Description of inle 1.—Description of inventorventorventorventorventory data used to dey data used to dey data used to dey data used to dey data used to develop maps of fvelop maps of fvelop maps of fvelop maps of fvelop maps of forest susceptibilityorest susceptibilityorest susceptibilityorest susceptibilityorest susceptibility
Number of Number ofSource Year forested plots live trees
Forest Inventory andForest Inventory andForest Inventory andForest Inventory andForest Inventory andAnalysis Inventory DataAnalysis Inventory DataAnalysis Inventory DataAnalysis Inventory DataAnalysis Inventory Data
Alabama 1990 3,915 123,474Arizona 1985 2,117 69,197Arkansas 1988 3,032 94,244California 1982 4,888 59,863Colorado 1981 1,202 25,553Connecticut 1985 286 8,653Delaware 1986 139 4,493Florida 1987 4,922 74,100Georgia 1989 6,524 115,338Idaho 1990 827 12,750Illinois 1985 1,131 33,497Indiana 1986 2,119 57,285Iowa 1990 678 19,184Kansas 1980 1,143 16,611Kentucky 1988 1,933 62,351Louisiana 1991 2,410 75,420Maine 1985 2,161 87,575Maryland 1986 678 20,935Massachusetts 1985 379 12,197Michigan 1980 7,866 185,784Minnesota 1990 12,155 343,864Mississippi 1987 2,898 91,474Missouri 1989 4,412 146,904Montana 1989 1,383 35,673Nebraska 1983 187 3,516Nevada 1980 1,087 16,512New Hampshire 1983 590 24,263New Jersey 1987 252 7,687New Mexico 1986 1,282 88,976New York 1980 2,501 98,192North Carolina 1990 5,366 115,249North Dakota 1979 142 2,958Ohio 1991 1,667 62,857Oklahoma 1993 790 22,896Oregon 1987 3,509 36,715Pennsylvania 1989 3,062 116,202Rhode Island 1985 116 3,204South Carolina 1986 4,046 77,920South Dakota 1976 70 1,505Tennessee 1989 2,274 70,124Texas 1992 2,085 62,773Utah 1975 519 19,646Vermont 1983 624 22,946Virginia 1992 4,100 87,821Washington 1990 4,065 70,382West Virginia 1989 2,561 88,004Wisconsin 1983 6,872 122,784Wyoming 1983 495 5,988
Continued
5
Angeles 1975 54 1,412Apache-Sitgreaves 1983 37 21,354Ashley 1992 96 2,830Beaverhead 1975 605 26,745Bitterroot 1980 544 20,480Boise 1984 511 26,552Cariboua 1993 1 12Carson 1984 434 24,834Challis 1988 11 366Cibola 1986 184 10,751Cleveland 1975 47 1,877Coconino 1991 33 7,203Colville 1973 362 17,729Coronado 1995 130 2,103Custer 1976 255 7,783Deerlodge 1975 463 13,419Deschutes 1985 617 33,378Eldorado 1984 68 2,030Fishlake 1993 139 4,015Flathead 1974 487 14,500Fremont 1981 378 26,936Gallatin 1975 266 11,253Gifford Pinchot 1981 355 33,013Gila 1985 33 22,357Inyo 1979 130 7,584Kaibab 1989 93 22,958Klamath 1989 73 804Kootenai 1974 627 59,736Lake Tahoe Basin Management Unit 1980 64 4,786Lassen 1981 89 5,257Lewis & Clark 1971 803 42,836Lincoln 1990 73 13,357Lolo 1974 486 15,660Los Padres 1975 59 2,079Malheur 1980 402 22,835Manti-La Sal 1993 95 2,353Mendocino 1981 80 3,674Modoc 1980 100 4,670Mt. Hood 1986 610 36,701Nezperce 1973 292 11,093Ochoco 1982 348 19,381Okanongan 1977 353 25,763Olympic 1974 478 34,757Plumas 1980 154 9,300Rogue River 1980 466 36,133Salmon 1989 704 10,978San Bernardino 1975 101 3,406Sante Fe 1986 43 12,397
TTTTTababababable 1.—Continle 1.—Continle 1.—Continle 1.—Continle 1.—Continueduedueduedued
Number of Number ofSource Year forested plots live trees
National ForestNational ForestNational ForestNational ForestNational ForestInventory DataInventory DataInventory DataInventory DataInventory Data
Continued

6
TTTTTababababable 1.—Continle 1.—Continle 1.—Continle 1.—Continle 1.—Continueduedueduedued
Number of Number ofSource Year forested plots live trees
Sawtootha 1992 1 33Sequoia 1980 101 5,630Shasta-Trinity 1980 145 7,490Sierra 1975 94 3,150Siskiyou 1979 183 10,721Siuslaw 1987 543 26,496Six Rivers 1978 150 8,485Stanislaus 1981 60 3,008Tahoe 1980 110 6,453Tonto 1981 32 8,669Uinta 1992 86 1,990Umatilla 1981 559 38,700Umpqua 1980 330 26,661Wallowa-Whitman 1979 502 32,429Wasatch/Cache 1993 83 2,353Wenatchee 1977 508 48,937Willamette 1981 489 46,355Winema 1981 446 32,554a Only partial inventory data available.
TTTTTababababable 2.—Most common gypsy moth hosts (listed in descendingle 2.—Most common gypsy moth hosts (listed in descendingle 2.—Most common gypsy moth hosts (listed in descendingle 2.—Most common gypsy moth hosts (listed in descendingle 2.—Most common gypsy moth hosts (listed in descendingabundance) in the conterminous United Statesabundance) in the conterminous United Statesabundance) in the conterminous United Statesabundance) in the conterminous United Statesabundance) in the conterminous United States
Common name Scientific name Total based area
100 million ft/acreWhite oak Quercus alba 14.3Sweetgum Liquidambar styraciflua 11.6Quaking aspen Populus tremuloides 10.1Northern red oak Quercus rubra 9.62Black oak Quercus velutina 7.31Chestnut oak Quercus prinus 6.84Post oak Quercus stellata 5.47Water oak Quercus nigra 4.34Paper birch Betula papyrifera 3.81Southern red oak Quercus falcata 3.75Scarlet oak Quercus coccinea 3.31American basswood Tilia americana 2.41Western larch Larix occidentalis 2.40Laurel oak Quercus laurifolia 1.94Bigtooth aspen Populus grandidentata 1.90Tanoak Lithocarpus densiflorus 1.64Willow oak Quercus phellos 1.49California red oak Quercus kelloggii 1.45Eastern hophornbeam Ostrya virginiana 1.26Canyon live oak Quercus chrysolepis 1.14
7
TTTTTababababable 3.—Tle 3.—Tle 3.—Tle 3.—Tle 3.—Total land area (acres) cootal land area (acres) cootal land area (acres) cootal land area (acres) cootal land area (acres) covered bvered bvered bvered bvered by fy fy fy fy forests in three susceptibility corests in three susceptibility corests in three susceptibility corests in three susceptibility corests in three susceptibility classes blasses blasses blasses blasses by statey statey statey statey state
State Area of Area of highly Area of extremely Total forested Total landsusceptible susceptible susceptible area area
foresta forestb forestc
Alabama 13,353,833 5,605,784 1,097,587 21,101,941 32,488,960Arizonad 3,467,755 2,196,094 1,366,231 13,438,231 67,446,400Arkansas 12,627,069 7,126,122 2,019,081 16,933,049 33,327,360Californiad 6,670,580 3,725,334 1,717,432 19,441,535 96,202,240Coloradod 2,534,751 1,959,807 1,466,463 7,636,892 21,229,440Connecticut 1,124,263 513,747 135,500 1,833,314 3,117,440Delaware 134,880 45,896 12,895 370,716 1,237,120Florida 4,596,883 2,919,942 1,563,682 13,376,393 34,657,920Georgia 10,591,225 5,140,375 1,518,469 21,416,044 37,157,120Idahod 1,631,323 647,697 384,079 15,260,411 34,523,520Illinois 2,849,100 1,470,200 303,900 4,123,600 35,616,640Indiana 2,151,100 894,400 232,000 4,485,600 22,994,560Iowa 1,453,500 879,000 313,900 2,087,800 35,816,960Kansas 502,982 280,460 111,640 1,509,188 52,340,480Kentucky 7,006,346 3,186,509 725,824 11,320,276 25,388,800Louisiana 7,735,140 3,327,734 890,932 13,197,070 28,494,720Maine 2,877,540 988,354 265,452 10,039,385 19,836,160Maryland 1,167,110 551,950 150,170 2,450,788 6,296,320Massachusetts 1,491,776 880,466 378,693 3,109,185 5,008,000Michigan 9,475,633 5,165,969 2,139,662 17,285,062 36,448,640Minnesota 11,388,800 8,369,600 4,683,000 14,573,800 50,909,440Mississippi 11,152,861 5,395,255 973,703 16,373,781 30,229,120Missouri 11,698,100 9,070,500 4,240,400 13,332,400 62,241,280Montana 2,839,512 1,293,647 617,711 23,285,474 93,047,040Nebraskad 166,500 90,000 25,000 542,500 49,051,520Nevadad 45,111 32,125 32,125 6,154,099 25,484,440New Hampshire 1,948,416 502,259 58,947 4,868,632 5,754,880New Jersey 956,877 633,474 269,544 1,741,830 4,778,880New Mexico 1,488,489 583,945 302,138 14,483,241 77,653,760New York 5,998,373 2,630,155 853,625 15,149,696 30,320,640North Carolina 8,920,232 3,735,139 769,014 17,560,691 31,259,520North Dakota 241,457 203,376 147,332 336,858 44,349,440Ohio 3,154,099 1,177,289 247,551 7,336,031 26,243,840Oklahoma 3,528,671 2,197,647 895,582 4,592,688 10,103,680Oregon 1,962,239 797,186 404,347 19,957,263 61,559,040Pennsylvania 8,463,412 4,233,856 1,187,996 15,938,953 28,730,880Rhode Island 289,106 184,623 89,442 371,495 674,560South Carolina 6,162,602 2,870,525 830,737 11,423,362 19,331,840South Dakotad 25,199 16,629 4,310 112,064 44,206,080Tennessee 8,691,667 4,334,683 886,443 12,849,100 26,338,560Texasd 7,930,344 3,914,638 1,111,585 11,525,463 21,592,960Utah 2,433,429 1,801,605 1,434,648 6,770,874 52,528,000Vermont 1,020,196 322,851 51,399 4,427,467 5,935,360Virginia 8,962,671 4,718,593 1,317,601 14,773,849 25,408,640Washington 1,671,447 477,406 118,058 16,152,518 42,568,960West Virginia 7,157,834 3,544,213 836,105 11,976,604 15,437,440Wisconsin 10,137,100 6,934,300 3,436,900 14,480,700 34,832,000Wyomingd 504,049 364,215 248,501 3,059,329 20,094,720TTTTTotalotalotalotalotal 222,381,582 117,935,574 42,867,336 484,567,243 1,570,295,320
a Areas where preferred species composed > 20% of stand basal area.b Areas where preferred species composed > 50% of stand basal area.c Areas where preferred species composed > 80% of stand basal area.d Only partial inventory data available.
8
Literature CitedLiterature CitedLiterature CitedLiterature CitedLiterature Cited
Anonymous. 1906. First annual repoFirst annual repoFirst annual repoFirst annual repoFirst annual reporrrrrt of thet of thet of thet of thet of thesuperintendent for supressing the gypsy and brown-superintendent for supressing the gypsy and brown-superintendent for supressing the gypsy and brown-superintendent for supressing the gypsy and brown-superintendent for supressing the gypsy and brown-tail mothstail mothstail mothstail mothstail moths. Publ. Doc. No. 73. Boston: State ofMassachusetts. 161 p.
Anonymous. 1907. Second annual repoSecond annual repoSecond annual repoSecond annual repoSecond annual reporrrrrt of thet of thet of thet of thet of thesuperintendent for supressing the gypsy and brown-superintendent for supressing the gypsy and brown-superintendent for supressing the gypsy and brown-superintendent for supressing the gypsy and brown-superintendent for supressing the gypsy and brown-tail moths.tail moths.tail moths.tail moths.tail moths. Publ. Doc. No. 73. Boston: State ofMassachusetts. 170 p.
Bess, H.A.; Spurr, S.H.; Littlefield, E.W. 1947. Forest siteForest siteForest siteForest siteForest siteconditions and the gypsy moth.conditions and the gypsy moth.conditions and the gypsy moth.conditions and the gypsy moth.conditions and the gypsy moth. Harvard ForestBulletin. 22. 56 p.
Burgess, A.F. 1913. The disperThe disperThe disperThe disperThe dispersion of the gipsy mothsion of the gipsy mothsion of the gipsy mothsion of the gipsy mothsion of the gipsy moth..Agric. Bull. No. 119. Washington, DC: U.S. Departmentof Agriculture. 62 p.
Burgess, A.F. 1915. ReporReporReporReporReport on the gipsy moth wt on the gipsy moth wt on the gipsy moth wt on the gipsy moth wt on the gipsy moth work inork inork inork inork inNeNeNeNeNew England.w England.w England.w England.w England. Agric. Bull. No. 204. Washington, DC:U.S. Department of Agriculture. 32 pp.
Burgess, A.F. 1930. The gipsy moth and the brThe gipsy moth and the brThe gipsy moth and the brThe gipsy moth and the brThe gipsy moth and the brooooown-tailwn-tailwn-tailwn-tailwn-tailmoth.moth.moth.moth.moth. Farmers’ Bull. 1623. Washington, DC: U.S.Department of Agriculture. 32 p.
Burrough, P.A. 1988. Principles of gPrinciples of gPrinciples of gPrinciples of gPrinciples of geographicaleographicaleographicaleographicaleographicalinfinfinfinfinformation systems formation systems formation systems formation systems formation systems for land resouror land resouror land resouror land resouror land resources Assesment.ces Assesment.ces Assesment.ces Assesment.ces Assesment.Oxford, OK: Clarendon Press. 194 p.
Campbell, R.W.; Sloan, R.J. 1977. Forest standForest standForest standForest standForest standresponses to defoliation by the gypsy moth.responses to defoliation by the gypsy moth.responses to defoliation by the gypsy moth.responses to defoliation by the gypsy moth.responses to defoliation by the gypsy moth. ForestScience Monograph. 19. 34 p.
Chrisman, N.R. 1987. The accuracy of map overlays: aThe accuracy of map overlays: aThe accuracy of map overlays: aThe accuracy of map overlays: aThe accuracy of map overlays: areassessment.reassessment.reassessment.reassessment.reassessment. Landscape and Urban Planning. 14:427-439.
Eastman, J.R. 1989. IDRISI: a grid-based geographicalIDRISI: a grid-based geographicalIDRISI: a grid-based geographicalIDRISI: a grid-based geographicalIDRISI: a grid-based geographicalanalanalanalanalanalysis ysis ysis ysis ysis system.system.system.system.system. Worcester, MA: Clark University. 178 p.
Dobson, A.P.; May, R.M. 1986. PPPPPatterns of inatterns of inatterns of inatterns of inatterns of invvvvvasions basions basions basions basions byyyyypathogpathogpathogpathogpathogens and parasitesens and parasitesens and parasitesens and parasitesens and parasites. In: Mooney, H.A.; Drake J.A.,eds. Ecology of biological invasions of North Americaand Hawaii. Ecol. Stud. 58. New York: Springer-Verlag:58-76.
Dunlap, T.R. 1980. The gypsy moth:The gypsy moth:The gypsy moth:The gypsy moth:The gypsy moth: a stud a stud a stud a stud a study in sciencey in sciencey in sciencey in sciencey in scienceand puband puband puband puband public policlic policlic policlic policlic policyyyyy..... Journal of Forest History. 24: 116-126.
Elton, C.S. 1958. The ecology of invasions by animalsThe ecology of invasions by animalsThe ecology of invasions by animalsThe ecology of invasions by animalsThe ecology of invasions by animalsand plantsand plantsand plantsand plantsand plants. London: Methuen. 181 p.
Forbush, E.H.; Fernald, C.H. 1896. The gypsy moth.The gypsy moth.The gypsy moth.The gypsy moth.The gypsy moth.Boston: Wright & Potter. 495 p.
Gansner, David A.; Drake, David A.; Arner, Stanford L.;Hershey, Rachel R.; King, Susan L. 1993. DefDefDefDefDefoliationoliationoliationoliationoliation
potential of gypsy moth.potential of gypsy moth.potential of gypsy moth.potential of gypsy moth.potential of gypsy moth. Res. Note NE-354. Radnor,PA: U.S. Department of Agriculture, Forest Service,Northeastern Forest Experiment Station. 8 p.
Hansen, M.H.; Frieswyk, T.; Glover, J.F.; Kelly, J.F. 1993.The eastwide forest inventoThe eastwide forest inventoThe eastwide forest inventoThe eastwide forest inventoThe eastwide forest inventorrrrry data base: usersy data base: usersy data base: usersy data base: usersy data base: usersmanmanmanmanmanual.ual.ual.ual.ual. Gen. Tech. Rep. NC-151. St. Paul, MN: U.S.Department of Agriculture, Forest Service, North CentralForest Experiment Station. NC-151. 48 p.
Herrick, O.W.; Gansner, D.A. 1986. Rating f Rating f Rating f Rating f Rating forest standsorest standsorest standsorest standsorest standsfor gypsy moth defoliation. for gypsy moth defoliation. for gypsy moth defoliation. for gypsy moth defoliation. for gypsy moth defoliation. Res. Pap. NE-583.Broomall, PA: U.S. Department of Agriculture, ForestService, Northeastern Forest Experiment Station. 4 pp.
Hohn, M.E.; Liebhold, A.M.; Gribko, L.S. 1993. AAAAAgeostatistical model for forecasting the spatialgeostatistical model for forecasting the spatialgeostatistical model for forecasting the spatialgeostatistical model for forecasting the spatialgeostatistical model for forecasting the spatialdynamics of defoliation caused by the gypsy moth,dynamics of defoliation caused by the gypsy moth,dynamics of defoliation caused by the gypsy moth,dynamics of defoliation caused by the gypsy moth,dynamics of defoliation caused by the gypsy moth,LLLLLymantria disparymantria disparymantria disparymantria disparymantria dispar (Lepidoptera: (Lepidoptera: (Lepidoptera: (Lepidoptera: (Lepidoptera: L L L L Lymantriidae).ymantriidae).ymantriidae).ymantriidae).ymantriidae).Environmental Entomology. 22: 1066-1077.
Liebhold, A.M.; Elkinton, J.S. 1989. Characterizing spatialCharacterizing spatialCharacterizing spatialCharacterizing spatialCharacterizing spatialpatterns of gypsy moth regional defoliation.patterns of gypsy moth regional defoliation.patterns of gypsy moth regional defoliation.patterns of gypsy moth regional defoliation.patterns of gypsy moth regional defoliation. ForestScience. 35: 557-568.
Liebhold, Andrew; Mastro, Victor; Schaefer, Paul W. 1989.Learning frLearning frLearning frLearning frLearning from the legacom the legacom the legacom the legacom the legacy of Leopold y of Leopold y of Leopold y of Leopold y of Leopold TTTTTrrrrrouvelot.ouvelot.ouvelot.ouvelot.ouvelot.Bulletin of the Entomological Society of America. 35: 20-21.
Liebhold, A.M.; Halverson, J.; Elmes, G. 1992.Quantitative analysis of the invasion of gypsy mothQuantitative analysis of the invasion of gypsy mothQuantitative analysis of the invasion of gypsy mothQuantitative analysis of the invasion of gypsy mothQuantitative analysis of the invasion of gypsy mothin Noin Noin Noin Noin Norrrrrth America.th America.th America.th America.th America. Journal of Biogeography. 19: 513-520.
Liebhold, A.M.; Elmes, G.A.; Halverson, J.A.; Quimby, J.1994. Landscape characterization of forestLandscape characterization of forestLandscape characterization of forestLandscape characterization of forestLandscape characterization of forestsusceptibility to gypsy moth defoliation.susceptibility to gypsy moth defoliation.susceptibility to gypsy moth defoliation.susceptibility to gypsy moth defoliation.susceptibility to gypsy moth defoliation. ForestScience. 40: 18-29.
Liebhold, Andrew M.; Gottschalk, Kurt W.; Muzika, Rose-Marie; Montgomery, Michael E.; Young, Regis.; O’Day,Kathleen; Kelley, Brooks. 1995. Suitability of NoSuitability of NoSuitability of NoSuitability of NoSuitability of NorrrrrthththththAmerican tree species to the gypsy moth: aAmerican tree species to the gypsy moth: aAmerican tree species to the gypsy moth: aAmerican tree species to the gypsy moth: aAmerican tree species to the gypsy moth: asummasummasummasummasummarrrrry of field and laboratory of field and laboratory of field and laboratory of field and laboratory of field and laboratory tests.y tests.y tests.y tests.y tests. Gen. Tech.Rep. NE-211. St. Paul, MN: U.S. Department ofAgriculture, Forest Service, North Central ForestExperiment Station. 34 p.
McManus, Michael L.; McIntyre, Thomas. 1981.IntrIntrIntrIntrIntroduction.oduction.oduction.oduction.oduction. In: Doane, C.C.; McManus, M.L., eds. Thegypsy moth: research toward integrated pestmanagement. Tech. Bull. 1584. Washington, DC: U.S.Department of Agriculture, Forest Service: 1-7.
Montgomery, M.E. 1991. VVVVVariation in the suitability ofariation in the suitability ofariation in the suitability ofariation in the suitability ofariation in the suitability oftree species ftree species ftree species ftree species ftree species for gypsy moth.or gypsy moth.or gypsy moth.or gypsy moth.or gypsy moth. In: Gottschalk, K.W.;Twery, M.J.; Smith, S.I., eds. Proceedings, U.S.Department of Agriculture interagency gypsy mothresearch review 1990; 1990 January 22-25; EastWindsor, CT. Gen. Tech. Rep. NE-146. Radnor, PA: U.S.
9
Department of Agriculture, Forest Service, NortheasternForest Experiment Station: 1-13.
Snyder, J.P. 1987. Map prMap prMap prMap prMap projections—a wojections—a wojections—a wojections—a wojections—a working manorking manorking manorking manorking manual.ual.ual.ual.ual.Prof. Pap. 1395. Washington, DC: U.S. GeologicalSurvey. 383 p.
Talerico, R.L. 1981. DefDefDefDefDefoliation as an indirect means ofoliation as an indirect means ofoliation as an indirect means ofoliation as an indirect means ofoliation as an indirect means ofpopulation assessment.population assessment.population assessment.population assessment.population assessment. In: Doane, C.C.; McManus,M.L., eds. The gypsy moth: research toward integratedpest management. Tech. Bull. 1584. Washington, DC:U.S. Department of Agriculture, Forest Service: 38-49.
Twery, M.J.; Elmes, G.A.; Yuill, C.B.; Millette, T.L. 1990.Using GIS to assess gypsy moth hazard.Using GIS to assess gypsy moth hazard.Using GIS to assess gypsy moth hazard.Using GIS to assess gypsy moth hazard.Using GIS to assess gypsy moth hazard. In:Proceedings of the 50th annual meeting of the ASPRS/ACSM convention, vol. 3; 1990 March 18-23; Denver,CO. Bethesda, MD: American Society ofPhotogrammerty and Remote Sensing: 284-290.
Twery, M.J. 1991. EffEffEffEffEffects of defects of defects of defects of defects of defoliation boliation boliation boliation boliation by gypsy moth.y gypsy moth.y gypsy moth.y gypsy moth.y gypsy moth.In: Gottschalk, K.W.; Twery, M.J.; Smith, S.I., eds.Proceedings, U.S. Department of Agriculture interagency
gypsy moth research review 1990; 1990 January 22-25;East Windsor, CT. Gen. Tech. Rep. NE-146. Radnor, PA:U.S. Department of Agriculture, Forest Service,Northeastern Forest Experiment Station: 27-30.
U.S. Army Corps of Engineers. 1993. GRASS 4.1 userGRASS 4.1 userGRASS 4.1 userGRASS 4.1 userGRASS 4.1 usersssssrefrefrefrefreference manerence manerence manerence manerence manual.ual.ual.ual.ual. Champaign, IL: U.S. Army Corps ofEngineers. 555 p.
Valentine, H.T.; Houston, D.R. 1979. A discriminantA discriminantA discriminantA discriminantA discriminantfunction for identifying mixed-oak standfunction for identifying mixed-oak standfunction for identifying mixed-oak standfunction for identifying mixed-oak standfunction for identifying mixed-oak standsusceptibility to gypsy moth defoliation.susceptibility to gypsy moth defoliation.susceptibility to gypsy moth defoliation.susceptibility to gypsy moth defoliation.susceptibility to gypsy moth defoliation. ForestScience. 25: 468-474.
Weber, G.A. 1930. The plant quarantine and contrThe plant quarantine and contrThe plant quarantine and contrThe plant quarantine and contrThe plant quarantine and controlololololadministration:administration:administration:administration:administration: its histo its histo its histo its histo its historrrrryyyyy,,,,, activities and activities and activities and activities and activities andorororororganization.ganization.ganization.ganization.ganization. Rep. No. 59. Washington, DC: BrookingsInstitution. 198 p.
Williams, D.W.; Liebhold, A.M. 1995. Influence of weatherInfluence of weatherInfluence of weatherInfluence of weatherInfluence of weatheron the synchrony of gypsy moth (Lepidoptera:on the synchrony of gypsy moth (Lepidoptera:on the synchrony of gypsy moth (Lepidoptera:on the synchrony of gypsy moth (Lepidoptera:on the synchrony of gypsy moth (Lepidoptera:LLLLLymantriidae) outbreaks in Neymantriidae) outbreaks in Neymantriidae) outbreaks in Neymantriidae) outbreaks in Neymantriidae) outbreaks in New England.w England.w England.w England.w England.Environmental Entomology. 24: 987-995

10
Index to FiguresIndex to FiguresIndex to FiguresIndex to FiguresIndex to Figures
Figure 1.—Area generally infested by gypsy moth in 1900. .................................................................. 11Figure 2.—Area generally infested by gypsy moth in 1905. .................................................................. 11Figure 3.—Area generally infested by gypsy moth in 1909. .................................................................. 12Figure 4.—Area generally infested by gypsy moth in 1912. .................................................................. 12Figure 5.—Area generally infested by gypsy moth in 1914. .................................................................. 13Figure 6.—Area generally infested by gypsy moth in 1934. .................................................................. 13Figure 7.—Area generally infested by gypsy moth in 1938. .................................................................. 14Figure 8.—Area generally infested by gypsy moth in 1943. .................................................................. 14Figure 9.—Area generally infested by gypsy moth in 1949. .................................................................. 15Figure 10.—Area generally infested by gypsy moth in 1955. ................................................................ 15Figure 11.—Area generally infested by gypsy moth in 1960. ................................................................. 16Figure 12.—Area generally infested by gypsy moth in 1965. ................................................................ 16Figure 13.—Area generally infested by gypsy moth in 1970. ................................................................ 17Figure 14.—Area generally infested by gypsy moth in 1975. ................................................................ 17Figure 15.—Area generally infested by gypsy moth in 1980. ................................................................ 18Figure 16.—Area generally infested by gypsy moth in 1985. ................................................................ 18Figure 17.—Area generally infested by gypsy moth in 1990. ................................................................ 19Figure 18.—Area generally infested by gypsy moth in 1994. ................................................................ 19Figure 19.—Area defoliated by gypsy moth in 1984. ............................................................................. 20Figure 20.—Area defoliated by gypsy moth in 1985. ............................................................................. 20Figure 21.—Area defoliated by gypsy moth in 1986. ............................................................................. 21Figure 22.—Area defoliated by gypsy moth in 1987. ............................................................................. 21Figure 23.—Area defoliated by gypsy moth in 1988. ............................................................................. 22Figure 24.—Area defoliated by gypsy moth in 1989. ............................................................................. 22Figure 25.—Area defoliated by gypsy moth in 1990. ............................................................................. 23Figure 26.—Area defoliated by gypsy moth in 1991. ............................................................................. 23Figure 27.—Area defoliated by gypsy moth in 1992. ............................................................................. 24Figure 28.—Area defoliated by gypsy moth in 1993. ............................................................................. 24Figure 29.—Area defoliated by gypsy moth in 1994. ............................................................................. 25Figure 30.—Frequency of gypsy moth defoliation, 1984 to 1994. ......................................................... 25Figure 31.—Areas where lack of complete inventory data did not allow analysis. ............................... 26Figure 32.—Density of white oak (basal area/acre). .............................................................................. 26Figure 33.—Density of sweetgum (basal area/acre). ............................................................................. 27Figure 34.—Density of quaking aspen (basal area/acre). ...................................................................... 27Figure 35.—Density of northern red oak (basal area/acre). .................................................................. 28Figure 36.—Density of black oak (basal area/acre). .............................................................................. 28Figure 37.—Density of chestnut oak (basal area/acre). ......................................................................... 29Figure 38.—Density of post oak (basal area/acre). ................................................................................ 29Figure 39.—Density of water oak (basal area/acre). .............................................................................. 30Figure 40.—Density of paper birch (basal area/acre). ........................................................................... 30Figure 41.—Density of southern red oak (basal area/acre). .................................................................. 31Figure 42.—Density of scarlet oak (basal area/acre). ............................................................................ 31Figure 43.—Density of American basswood (basal area/acre). ............................................................. 32Figure 44.—Density of western larch (basal area/acre). ........................................................................ 32Figure 45.—Density of laurel oak (basal area/acre). .............................................................................. 33Figure 46.—Density of bigtooth aspen (basal area/acre). ..................................................................... 33Figure 47.—Density of tanoak (basal area/acre). ................................................................................... 34Figure 48.—Density of willow oak (basal area/acre). ............................................................................. 34Figure 49.—Density of California red oak (basal area/acre). ................................................................. 35Figure 50.—Density of eastern hophornbeam (basal area/acre). .......................................................... 35Figure 51.—Density of canyon live oak (basal area/acre). .................................................................... 36Figure 52.—Total basal area per acre of preferred tree species. .......................................................... 36

11
Figure 1.—Area generally infested by gypsy moth in 1900.
Figure 2.—Area generally infested by gypsy moth in 1905.
12
Figure 3.—Area generally infested by gypsy moth in 1909.
Figure 4.—Area generally infested by gypsy moth in 1912.
13
Figure 5.—Area generally infested by gypsy moth in 1914.
Figure 6.—Area generally infested by gypsy moth in 1934.

14
Figure 7.—Area generally infested by gypsy moth in 1938.
Figure 8.—Area generally infested by gypsy moth in 1943.
15
Figure 10.—Area generally infested by gypsy moth in 1955.
Figure 9.—Area generally infested by gypsy moth in 1949.
16
Figure 11.—Area generally infested by gypsy moth in 1960.
Figure 12.—Area generally infested by gypsy moth in 1965.
17
Figure 13.—Area generally infested by gypsy moth in 1970.
Figure 14.—Area generally infested by gypsy moth in 1975.

18
Figure 15.—Area generally infested by gypsy moth in 1980.
Figure 16.—Area generally infested by gypsy moth in 1985.
19
Figure 17.—Area generally infested by gypsy moth in 1990.
Figure 18.—Area generally infested by gypsy moth in 1994.
20
Figure 19.—Area defoliated by gypsy moth in 1984.
Figure 20.—Area defoliated by gypsy moth in 1985.

21
Figure 21.—Area defoliated by gypsy moth in 1986.
Figure 22.—Area defoliated by gypsy moth in 1987.
22
Figure 23.—Area defoliated by gypsy moth in 1988.
Figure 24.—Area defoliated by gypsy moth in 1989.
23
Figure 25.—Area defoliated by gypsy moth in 1990.
Figure 26.—Area defoliated by gypsy moth in 1991.
24
Figure 27.—Area defoliated by gypsy moth in 1992.
Figure 28.—Area defoliated by gypsy moth in 1993.
25
Figure 29.—Area defoliated by gypsy moth in 1994.
Figure 30.—Frequency of gypsy moth defoliation, 1984 to 1994 (green areas representone year of defoliation; dark orange areas represent four or more years of defoliation).

26
Figure 31.—Areas where lack of complete inventory data did not allow analysis.
Figure 32.—Density of white oak (basal area/acre).
27
Figure 33.—Density of sweetgum (basal area/acre).
Figure 34.—Density of quaking aspen (basal area/acre).
28
Figure 35.—Density of northern red oak (basal area/acre).
Figure 36.—Density of black oak (basal area/acre).
29
Figure 37.—Density of chestnut oak (basal area/acre).
Figure 38.—Density of post oak (basal area/acre).
30
Figure 39.—Density of water oak (basal area/acre).
Figure 40.—Density of paper birch (basal area/acre).
31
Figure 41.—Density of southern red oak (basal area/acre).
Figure 42.—Density of scarlet oak (basal area/acre).

32
Figure 43.—Density of American basswood (basal area/acre).
Figure 44.—Density of western larch (basal area/acre).
33
Figure 45.—Density of laurel oak (basal area/acre).
Figure 46.—Density of bigtooth aspen (basal area/acre).

34
Figure 47.—Density of tanoak (basal area/acre).
Figure 48.—Density of willow oak (basal area/acre).
35
Figure 49.—Density of California red oak (basal area/acre).
Figure 50.—Density of eastern hophornbeam (basal area/acre).
36
Figure 51.—Density of canyon live oak (basal area/acre).
Figure 52.—Total basal area per acre of preferred tree species.

Printed on Recycled Paper
Liebhold, Andrew M.; Gottschalk, Kurt W.; Luzader, Eugene R.; Mason, Douglas A.;Bush, Renate; Twardus, Daniel B. 1997. Gypsy moth in the United States:Gypsy moth in the United States:Gypsy moth in the United States:Gypsy moth in the United States:Gypsy moth in the United States: an an an an anatlas.atlas.atlas.atlas.atlas. Gen. Tech. Rep. NE-233. Radnor, PA: U.S. Department of Agriculture,Forest Service, Northeastern Forest Experiment Station. 36 p.
This atlas includes 52 maps that document the historical spread of gypsy moth from1900 to the present, historical forest defoliation in the Northeast from 1984 to thepresent, and the distribution of susceptible forests in the conterminous UnitedStates. These maps should be useful for planning activities to limit the spread ofgypsy moth and mitigate the effects of this forest insect pest in areas that have notyet been invaded.
KKKKKeeeeeywywywywywororororords:ds:ds:ds:ds: Lymantria dispar, Lepidoptera, Lymantriidae, forest susceptibility, maps,invasion, defoliation, history
HeadquarHeadquarHeadquarHeadquarHeadquarterterterterters of the Nos of the Nos of the Nos of the Nos of the Norrrrrtheastern Researtheastern Researtheastern Researtheastern Researtheastern Researccccch Station is in Neh Station is in Neh Station is in Neh Station is in Neh Station is in Newtowtowtowtowtown Squarewn Squarewn Squarewn Squarewn Square,,,,,PPPPPennsylvennsylvennsylvennsylvennsylvania.ania.ania.ania.ania. Field laboratories are maintained at: Field laboratories are maintained at: Field laboratories are maintained at: Field laboratories are maintained at: Field laboratories are maintained at:
AmherAmherAmherAmherAmherst,st,st,st,st, Massac Massac Massac Massac Massachusetts,husetts,husetts,husetts,husetts, in cooperation with the Univer in cooperation with the Univer in cooperation with the Univer in cooperation with the Univer in cooperation with the University of Massacsity of Massacsity of Massacsity of Massacsity of Massachusettshusettshusettshusettshusetts
Burlington,Burlington,Burlington,Burlington,Burlington, VVVVVermont,ermont,ermont,ermont,ermont, in cooperation with the Univer in cooperation with the Univer in cooperation with the Univer in cooperation with the Univer in cooperation with the University of sity of sity of sity of sity of VVVVVermontermontermontermontermont
DelaDelaDelaDelaDelawarewarewarewareware,,,,, Ohio Ohio Ohio Ohio Ohio
Durham,Durham,Durham,Durham,Durham, Ne Ne Ne Ne New Hampshirew Hampshirew Hampshirew Hampshirew Hampshire,,,,, in cooperation with the Univer in cooperation with the Univer in cooperation with the Univer in cooperation with the Univer in cooperation with the University of Nesity of Nesity of Nesity of Nesity of New Hampshirew Hampshirew Hampshirew Hampshirew Hampshire
Hamden,Hamden,Hamden,Hamden,Hamden, Connecticut, Connecticut, Connecticut, Connecticut, Connecticut, in cooperation with in cooperation with in cooperation with in cooperation with in cooperation with YYYYYale Univerale Univerale Univerale Univerale Universitysitysitysitysity
MorMorMorMorMorgantogantogantogantogantown,wn,wn,wn,wn, WWWWWest est est est est VirVirVirVirVirginia,ginia,ginia,ginia,ginia, in cooperation with in cooperation with in cooperation with in cooperation with in cooperation with WWWWWest est est est est VirVirVirVirVirginia Univerginia Univerginia Univerginia Univerginia Universitysitysitysitysity
PPPPParararararsons,sons,sons,sons,sons, WWWWWest est est est est VirVirVirVirVirginiaginiaginiaginiaginia
Princeton,Princeton,Princeton,Princeton,Princeton, WWWWWest est est est est VirVirVirVirVirginiaginiaginiaginiaginia
SyracuseSyracuseSyracuseSyracuseSyracuse,,,,, Ne Ne Ne Ne New w w w w YYYYYork,ork,ork,ork,ork, in cooperation with the State Univer in cooperation with the State Univer in cooperation with the State Univer in cooperation with the State Univer in cooperation with the State University of Nesity of Nesity of Nesity of Nesity of New w w w w YYYYYork,ork,ork,ork,ork,CollegCollegCollegCollegCollege of Ene of Ene of Ene of Ene of Envirvirvirvirvironmental Sciences and Forestronmental Sciences and Forestronmental Sciences and Forestronmental Sciences and Forestronmental Sciences and Forestry at Syracuse Univery at Syracuse Univery at Syracuse Univery at Syracuse Univery at Syracuse Universitysitysitysitysity
WWWWWarren,arren,arren,arren,arren, P P P P Pennsylvennsylvennsylvennsylvennsylvaniaaniaaniaaniaania
The U. S. Department of Agriculture (USDA) prohibits discrimination in all its programs andactivities on the basis of race, color, national origin, gender, religion, age, disability, politicalbeliefs, sexual orientation, and marital or family status. (Not all prohibited bases apply to allprograms.) Persons with disabilities who require alternative means for communication ofprogram information (Braille, large print, audiotape, etc.) should contact the USDA's TARGETCenter at (202)720-2600 (voice and TDD).
To file a complaint of discrimination, write USDA, Director, Office of Civil Rights, Room 326-W,Whitten Building, 14th and Independence Avenue SW, Washington, DC 20250-9410, or call(202)720-5964 (voice and TDD). USDA is an equal opportunity provider and employer.
“Ca“Ca“Ca“Ca“Carrrrring for the Land and Seing for the Land and Seing for the Land and Seing for the Land and Seing for the Land and Serrrrrving People Thrving People Thrving People Thrving People Thrving People Through Reseaough Reseaough Reseaough Reseaough Researrrrrch”ch”ch”ch”ch”
Related Documents


