GV for the Evaluation of High Resolution Precipitation Products using WPMM in Korea J.C. Nam 1 , K.Y. Nam 1 , G.H. Ryu 2 , and B.J. Sohn 2 1 Korea Meteorological Administration(KMA) 2 Seoul National University (SNU) The 2 nd GPM-GV Workshop, 27-30, September 2005, Taiwan

GV for the Evaluation of High Resolution Precipitation Products using WPMM in Korea J.C. Nam 1, K.Y. Nam 1, G.H. Ryu 2, and B.J. Sohn 2 1 Korea Meteorological.
Jan 02, 2016
Welcome message from author
This document is posted to help you gain knowledge. Please leave a comment to let me know what you think about it! Share it to your friends and learn new things together.
Transcript
GV for the Evaluation of High Resolution Precipitation Products using WPMM
in Korea
GV for the Evaluation of High Resolution Precipitation Products using WPMM
in Korea
J.C. Nam1, K.Y. Nam1, G.H. Ryu2, and B.J. Sohn2
1 Korea Meteorological Administration(KMA)2 Seoul National University (SNU)
J.C. Nam1, K.Y. Nam1, G.H. Ryu2, and B.J. Sohn2
1 Korea Meteorological Administration(KMA)2 Seoul National University (SNU)
The 2nd GPM-GV Workshop, 27-30, September 2005, TaiwanThe 2nd GPM-GV Workshop, 27-30, September 2005, Taiwan

Remote Sensing Research Lab.
Ground Observation Networks of KMA - Automatic Weather Station(AWS) Network - Radar Network - Haenam Supersite
Window Probability Matching Method (WPMM)
Evaluation Precipitation Products using WPMM
Comparison precipitation products in space and time
Concluding Remarks
ContentsContents
Remote Sensing Research Lab.
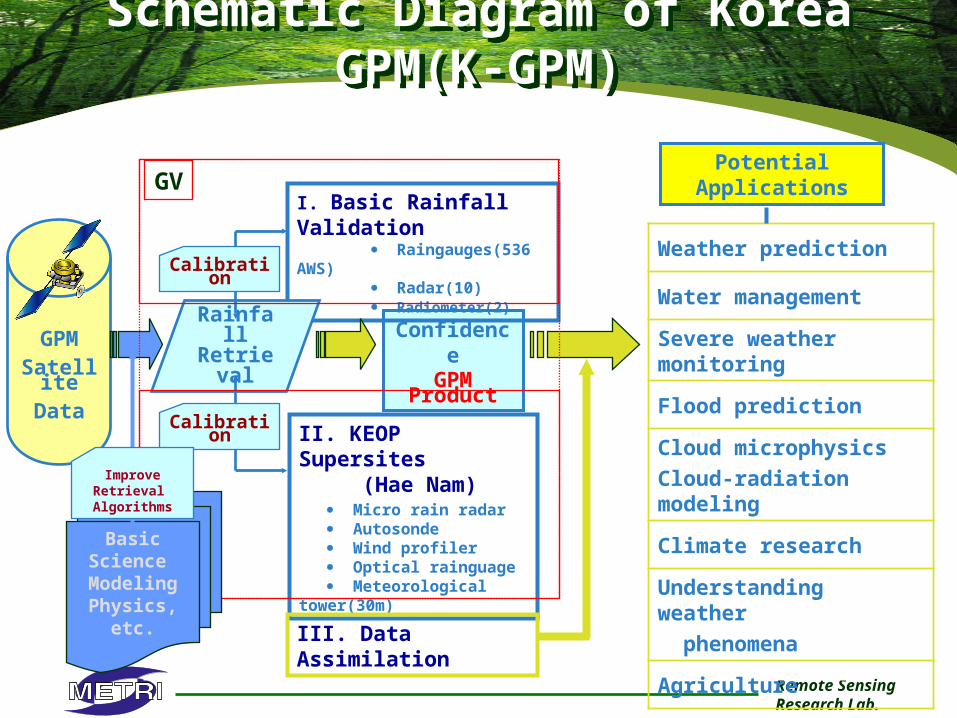
ConfidenceGPM
Product
II. KEOP Supersites (Hae Nam) Micro rain radar Autosonde Wind profiler Optical rainguage Meteorological tower(30m)
I. Basic Rainfall Validation Raingauges(536 AWS) Radar(10) Radiometer(2)
RainfallRetrieva
lGPM
SatelliteData
Potential Applications
Weather prediction
Water management
Severe weather monitoring
Flood prediction
Cloud microphysics
Cloud-radiation modeling
Climate research
Understanding weather
phenomena
Agriculture III. Data Assimilation
GV
Basic Science Modeling
Physics, etc.
Calibration
Calibration
Improve Retrieval
Algorithms
Schematic Diagram of Korea GPM(K-GPM)Schematic Diagram of Korea GPM(K-GPM)

Remote Sensing Research Lab.
Observation NetworkConventional Station
Automatic Weather Station
No.
Obs.
No. of station
No. of daily observation
Surface 74 8-24
Upper-air 3 2-4
Aeronautical 9 24-48
No.
Obs.No. of station
No. of daily observation
Measured elements
AWS 536Every min.
(Continuous)Temp., Wind,
Preci., etc
Ocean Buoy
5 24Temp., Wind,
Wave, SST, etc.
Ground Observation NetworkGround Observation Network

Remote Sensing Research Lab.
Automatic Weather Station(AWS) Network
- ASOS(Automated Surface Observing System) : 42 sites
- Manned AWS(Automatic Weather System) : 35 sites - Unmanned AWS(Automatic Weather System) : 459 sites
ASOS AWS Mountain AWS
Ground Observation NetworkGround Observation Network

Remote Sensing Research Lab.
• Spatial resolution ASOS + AWS network : 13 km
Unmanned AWS network : 14 km
• Temporal resolution : 1 min.
•Data Collection - DSU Modem leased line(9,600 bps)
- DSU Modem + Microwave comm.
- ORBCOMM Satellite comm.
Ground Observation NetworkGround Observation Network

Remote Sensing Research Lab.
Real Time Data Collection NetworkReal Time Data Collection NetworkTelecommunication Network in KMA
Remote Sensing Research Lab.
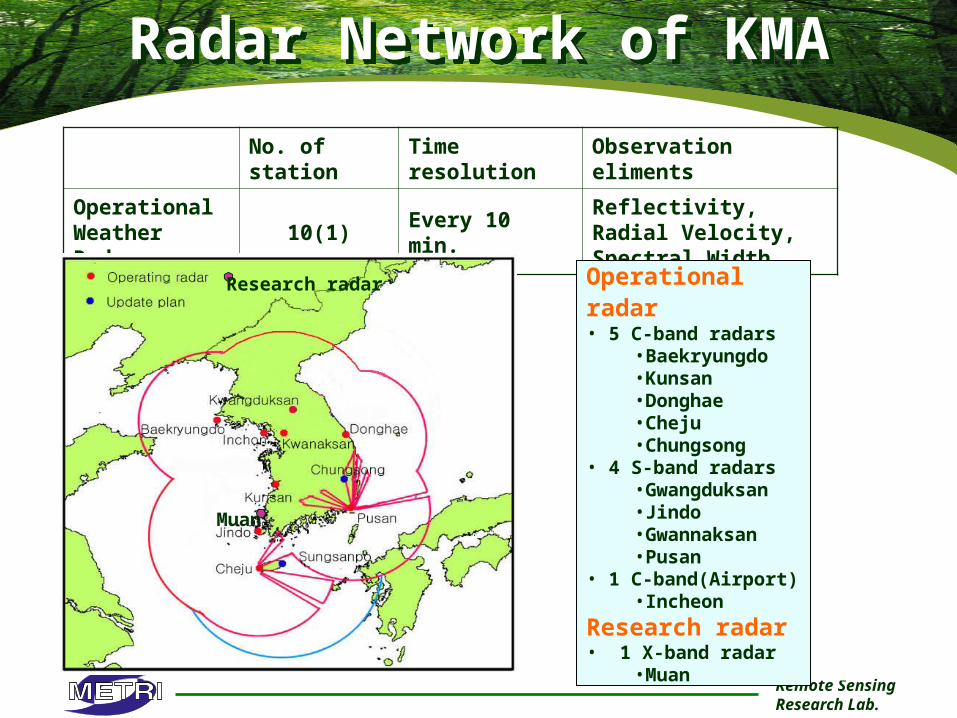
Radar Network of KMARadar Network of KMA
No. of station Time resolution Observation eliments
Operational Weather Radar
10(1) Every 10 min.Reflectivity, Radial Velocity, Spectral Width
Research radar
Muan
Operational radar • 5 C-band radars
•Baekryungdo•Kunsan•Donghae•Cheju•Chungsong
• 4 S-band radars•Gwangduksan•Jindo•Gwannaksan•Pusan
• 1 C-band(Airport)•Incheon
Research radar • 1 X-band radar
•Muan

Remote Sensing Research Lab.
C-band radar(ROKAF)
S-band radar
Aerosonde(from Australia)
X-band radar
Haenam Special observation site• autosonde for continuous upper air obs.• boundary layer wind profiler• micro rain radar for vertical structure of rain• optical rain gauge for continuous accurate rain rate observation• conventional synoptic weather observation
Ground Observation SupersiteGround Observation Supersite

Remote Sensing Research Lab.
Heanam Super sites
Understanding of the land-surface hydrological and cloud-precipitation processes in cloud physics and numerical model.
IntensiveObservation
Micro Rain RadarProducing vertical profiles
of rain rate, LWC anddrop size distribution
Flux TowerProducing sensible, latent, and radiative
fluses over land surface
Optical Rain GaugeContinuous accurate rain rate observation.
AutosondeContinuous upper air
observation
Boundary Layer RadarProducing one-minute profile
of vertical and horizontal winds
Produce high resolution temporal and spatial data for the monitoring, analysis and prediction of severeweather phenomena(typhoon, fronts…)
Ground Observation SupersiteGround Observation Supersite

Remote Sensing Research Lab.
Ground Observation NetworkGround Observation Network
Facility Agency Equipment Status Additional Info
National KMA
536 Rain Gauges, 13 x 13 km 1 minute readout
Operational.1 and .5 mm tipping
bucket
10 Radars (C-, S-band) Operational
10 Wind ProfilersPlanned2004 (2),2005-’08 (8)
HaenamKEOP
Supersite
METRI(KMA)
X-band Doppler Radar OperationalOperating as CEOP Supersite
Autosonde Operational
Boundary Layer Wind Profiler
Operational
Micro Rain Radar Operational
Flux Tower (10 m) Operational
Optical Rain Gauge Operational
Radiometer Operational
Remote Sensing Research Lab.
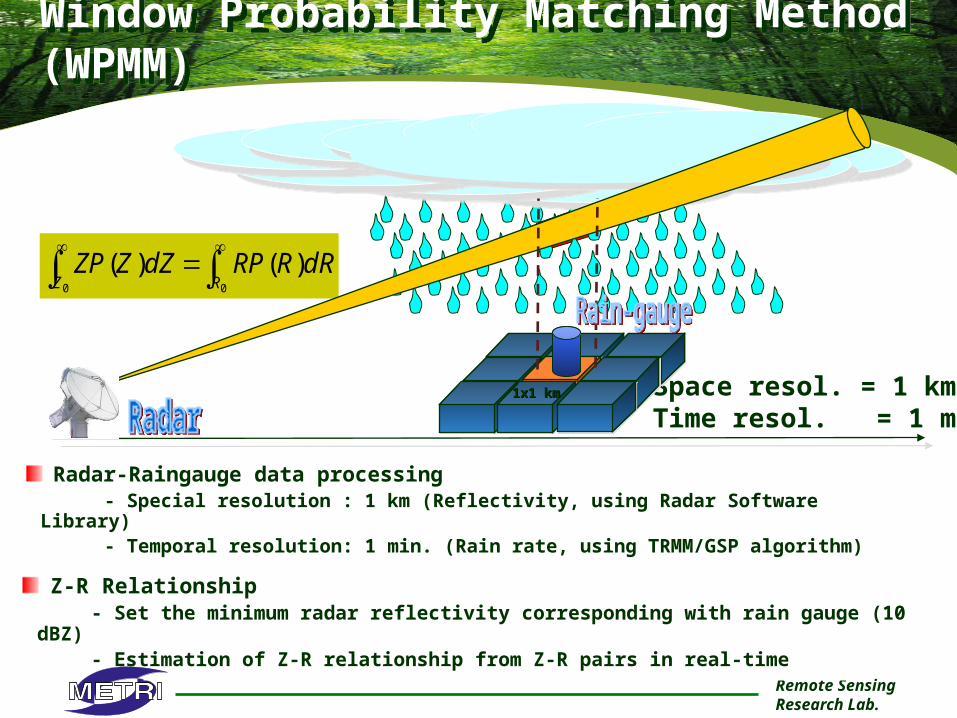
Radar-Raingauge data processing - Special resolution : 1 km (Reflectivity, using Radar Software Library) - Temporal resolution: 1 min. (Rain rate, using TRMM/GSP algorithm)
Z-R Relationship - Set the minimum radar reflectivity corresponding with rain gauge (10 dBZ) - Estimation of Z-R relationship from Z-R pairs in real-time
Window Probability Matching Method (WPMM)Window Probability Matching Method (WPMM)
00
)()(RZ
dRRRPdZZZP
Space resol. = 1 kmTime resol. = 1 min.
1x1 km1x1 km
Remote Sensing Research Lab.
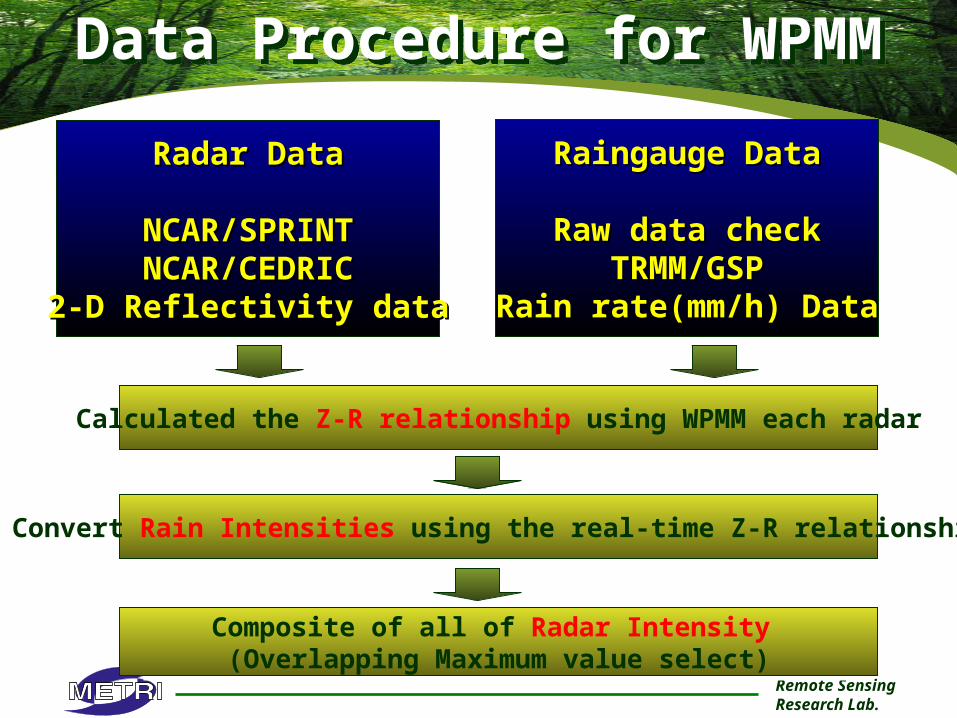
Radar DataRadar Data
NCAR/SPRINTNCAR/SPRINTNCAR/CEDRICNCAR/CEDRIC
2-D Reflectivity data2-D Reflectivity data
Raingauge DataRaingauge Data
Raw data checkRaw data checkTRMM/GSPTRMM/GSP
Rain rateRain rate((mm/h) Datamm/h) Data
Calculated the Z-R relationship using WPMM each radar
Convert Rain Intensities using the real-time Z-R relationship
Composite of all of Radar Intensity (Overlapping Maximum value select)
Data Procedure for WPMMData Procedure for WPMM
Remote Sensing Research Lab.
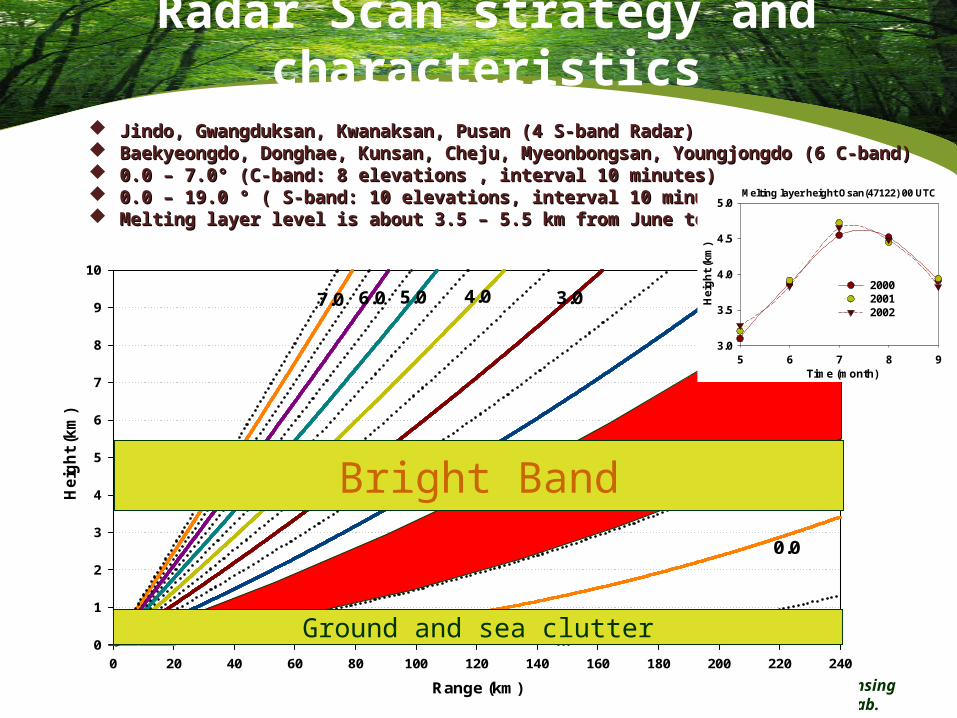
Radar Scan strategy and characteristics
Range (km)
0 20 40 60 80 100 120 140 160 180 200 220 240
He
igh
t (k
m)
0
1
2
3
4
5
6
7
8
9
10
0.0
1.0
2.03.04.05.06.07.0
Bright Band
Ground and sea clutter
Jindo, Gwangduksan, Kwanaksan, Pusan (4 S-band Radar)Jindo, Gwangduksan, Kwanaksan, Pusan (4 S-band Radar) Baekyeongdo, Donghae, Kunsan, Cheju, Myeonbongsan, Youngjongdo Baekyeongdo, Donghae, Kunsan, Cheju, Myeonbongsan, Youngjongdo (6 (6 C-band)C-band) 0.0 – 7.00.0 – 7.0° (C-band: 8 elevations ° (C-band: 8 elevations , , interval 10 minutesinterval 10 minutes)) 0.0 – 19.0 ° ( S-band: 10 elevations, interval 10 minutes)0.0 – 19.0 ° ( S-band: 10 elevations, interval 10 minutes) Melting layer level is about Melting layer level is about 3.5 – 5.5 3.5 – 5.5 km from June to Augustkm from June to August
Melting layer height Osan(47122) 00 UTC
Time (month)5 6 7 8 9
He
igh
t (k
m)
3.0
3.5
4.0
4.5
5.0
200020012002
Remote Sensing Research Lab.
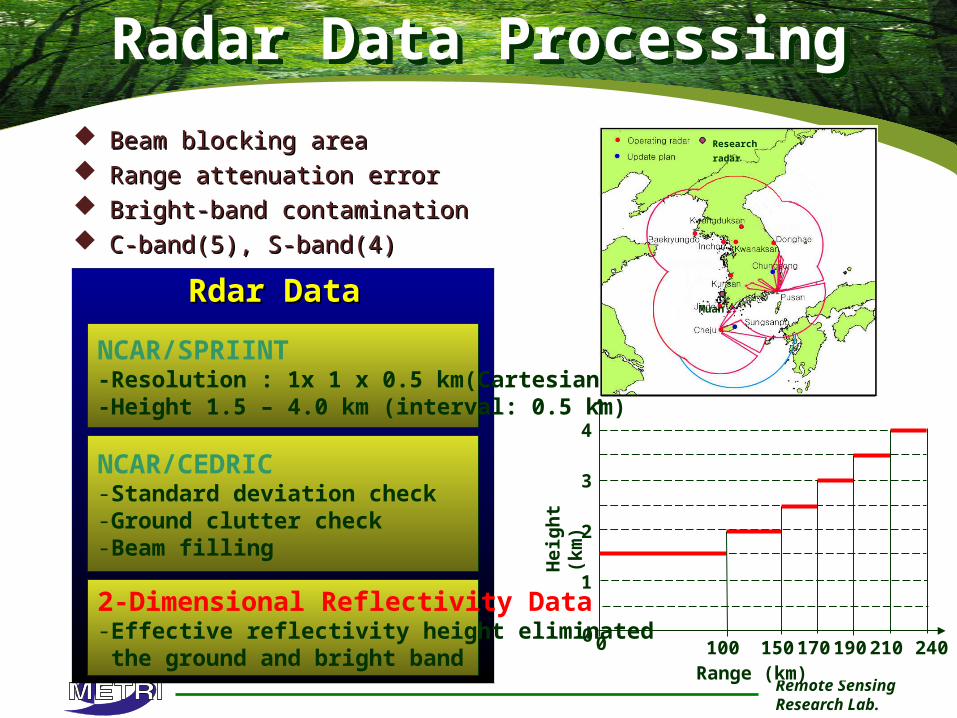
Beam blocking areaBeam blocking area Range attenuation errorRange attenuation error Bright-band contaminationBright-band contamination C-band(5), S-band(4)C-band(5), S-band(4)
NCAR/SPRIINT -Resolution : 1x 1 x 0.5 km(Cartesian)-Height 1.5 – 4.0 km (interval: 0.5 km)
NCAR/CEDRIC-Standard deviation check-Ground clutter check-Beam filling
2-Dimensional Reflectivity Data-Effective reflectivity height eliminated the ground and bright band
Rdar DataRdar Data
1
2
3
4
Hei
ght (
km)
150 170 190 210100 240Range (km)
0 0
Radar Data ProcessingRadar Data Processing
Research
radar
Muan

Remote Sensing Research Lab.
Precipitation events check (B, rain event ) : if the time interval between Tips less than 30 minutes, B is rain event
Half tip (C) : if the time interval between tips is within 20-30 minutes, insert the half tip in the middle
Calculate the 1-minute rain rate(mm/h) using Cubic Spline Interpolation each rain eventCalculate the bias of measured rainfall and interpolated rainfall
Bias = rainfall(measured) / rainfall(interpolationed)
Rain-rate greater than 1000 mm/hr
single tip or isolated tips (A) -> Gaussian interpolation is applied( R=R0exp(-x2/100) )
Calculated rain-rate = bias * {rain(1st sec. of min.) – rain(2nd sec. of min.} *60TRM
M/G
SP
t
mm
AB
C TRMM/GSP algorithmTRMM/GSP algorithm
Raingauge Data ProcessingRaingauge Data Processing

Remote Sensing Research Lab.
0-15 15
100/0
2
)( xeRtR
Rai
n-r
ate
(mm
/hr)
Time (min.)
x j-1
Time (min.)
Acc
um
ula
ted
Rai
nfa
ll (
mm
)
x j x j+1
y j-1
y j
y j+1
x
y
21
3
21
3
1
1
''1
''1
))((6
1
))((6
1
1
jj
jj
jj
j
jjjj
xxBBD
xxAAC
ABxx
xxA
DyCyByAyy
Cubic Spline Interpolation - tip interval within 30 minutes, effective data > 3 point - the slope of accumulated precipitation convert to rain-rate
Gaussian Interpolation(Not TRMM/GSP algorithm) - tip interval greater than 30 minutes => Single tip - single tip consider as small convective precipitation
Raingauge Data ProcessingRaingauge Data Processing
Remote Sensing Research Lab.
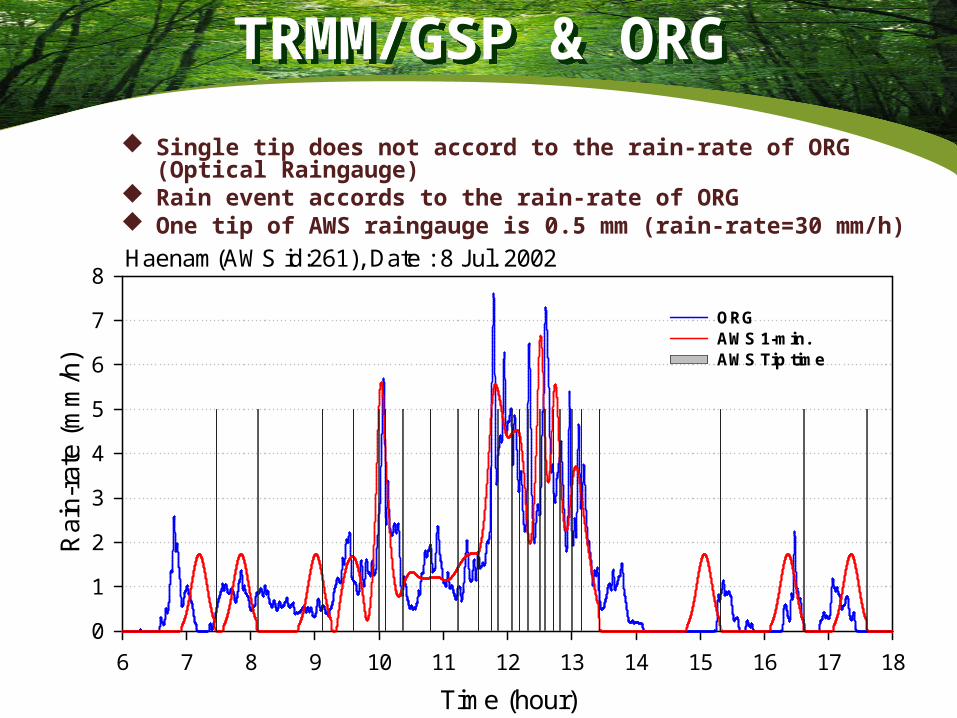
Single tip does not accord to the rain-rate of ORG (Optical Raingauge) Rain event accords to the rain-rate of ORG One tip of AWS raingauge is 0.5 mm (rain-rate=30 mm/h)
Haenam(AWS id:261), Date : 8 Jul. 2002
Time (hour)
6 7 8 9 10 11 12 13 14 15 16 17 18
Rai
n-ra
te (
mm
/h)
0
1
2
3
4
5
6
7
8
ORGAWS 1-min.AWS Tip time
TRMM/GSP & ORGTRMM/GSP & ORG

Remote Sensing Research Lab.
Computation of Z-R pair every 10 minutes during 1 hour : (1) Rain rates of raingauges (- 9 ~ 0 minutes) (2) Reflectivites of radar grids(3×3) around raingauge (horizontal res.: 1 km) (3) Threshold : 10 ~ 60 dBZ, 0.5 mm/h (4) Rain-rate calculates using M – P relationship (if Reiteration Num. = 1)
Computation of rain rates applied Z-R relationship every 10 min. (No precipitation under threshold dBZ)
Z-R Fitting : - Median Fitting ( Under and Over the 30 dBZ )
Z-R pairs > Threshold Num.
Z-R Fitting : - Z-R relationship of former time
Yes No
Data reading : (1) 1-minute rain rate of each raingauge using TRMM-GSP (2) 10-minute reflectivity of each radar using RSL
Produce Rain Rate from each radar-raingauges rain rate
WPMM (Window Probability Matching Method)
Reiteration Num. > 1
YesNo
Rain Rate ProductRain Rate Product
Remote Sensing Research Lab.
Z-R relationship
Rain-Rate(mm/h)
0.01 0.1 1 10 100
Re
fle
cti
vit
y(d
BZ
)
-10
-5
0
5
10
15
20
25
30
35
40
45
50
55
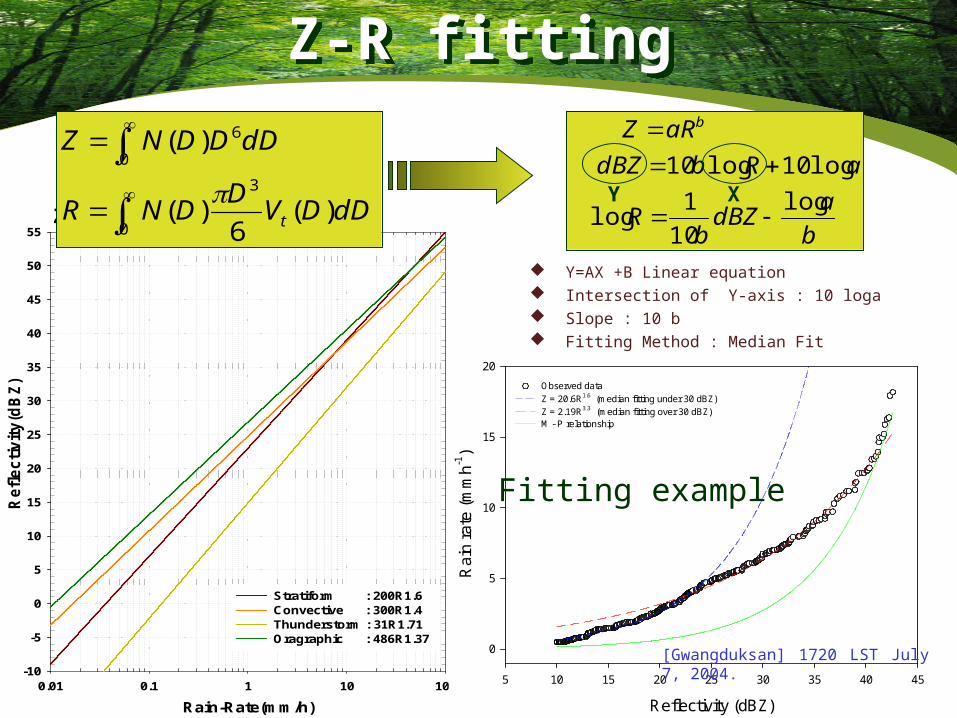
Stratiform : 200R1.6 Convective : 300R1.4 Thunderstorm : 31R1.71 Oragraphic : 486R1.37
b
adBZb
R
aRbdBZ
aRZ b
log
10
1log
log10log10
Y X )(
6)(
)(
0
3
0
6
dDDVD
DNR
dDDDNZ
t
Reflectivity (dBZ)
5 10 15 20 25 30 35 40 45
Ra
in r
ate
(m
mh-1
)
0
5
10
15
20
Observed data
Z = 20.6R1.6 (median fitting under 30 dBZ)Z = 2.19R3.3 (median fitting over 30 dBZ)M - P relationship
Y=AX +B Linear equation Intersection of Y-axis : 10 loga Slope : 10 b Fitting Method : Median Fit
Fitting example
[Gwangduksan] 1720 LST July 7, 2004.
Z-R fittingZ-R fitting

Remote Sensing Research Lab.
0
2
4
6
8
10
12
14
16
J indo Gwangduksan Gwannaksan Baereongdo Kunsan Pusan Cheju
Mean E
rror(
mm
/h)
Z=200R1.6(1- hour)
Z=200R1.6(10- minute)
WPMM(1- hour)
WPMM(10- minute)
0
2
4
6
8
10
12
14
16
J indo Gwangduksan Gwanaksan Baereongdo Kunsan Pusan Cheju
Mean E
rror(
mm
/h)
Z=200R1.6(1- hour)
Z=200R1.6(10- minute)
WPMM(1- hour)
WPMM(10- minute)
7 July 2004
18 August 2004
S-band RadarOperation stop(reinstalling)
Sensitivity test for Z-R relationshipSensitivity test for Z-R relationship
S-Band C-Band

Remote Sensing Research Lab.
19 Jun. 20 Jun.
19 Jun. 20 Jun.
Nowon(407)Corr. = 0.94, RMSE=3.04 mm/h
Dongdaemun (408)Corr. = 0.95, RMSE=3.05 mm/h
Jungrang(409)Corr. = 0.90, RMSE=3.12 mm/h
Dongjak(410)Corr. = 0.97, RMSE=4.4 mm/h
Precipitation Product Comparison Precipitation Product Comparison 19-20 June 2004
TRMM/GSPWPMM

Remote Sensing Research Lab.
TOTAL RAINFALL [ 19-20 Jun. 2004]
Time(hour)
1 3 5 7 9 11 13 15 17 19 21 23 1 3 5 7 9 11 13 15 17 19 21 23
To
tal R
ain
fall
(mm
)
0
1000
2000
3000
4000
AWS WPMMZ=200R1.6Z=300R1.4TRMM/GSP
19 Jun. 20 Jun.
Comparison Total RainfallComparison Total Rainfall
Remote Sensing Research Lab.
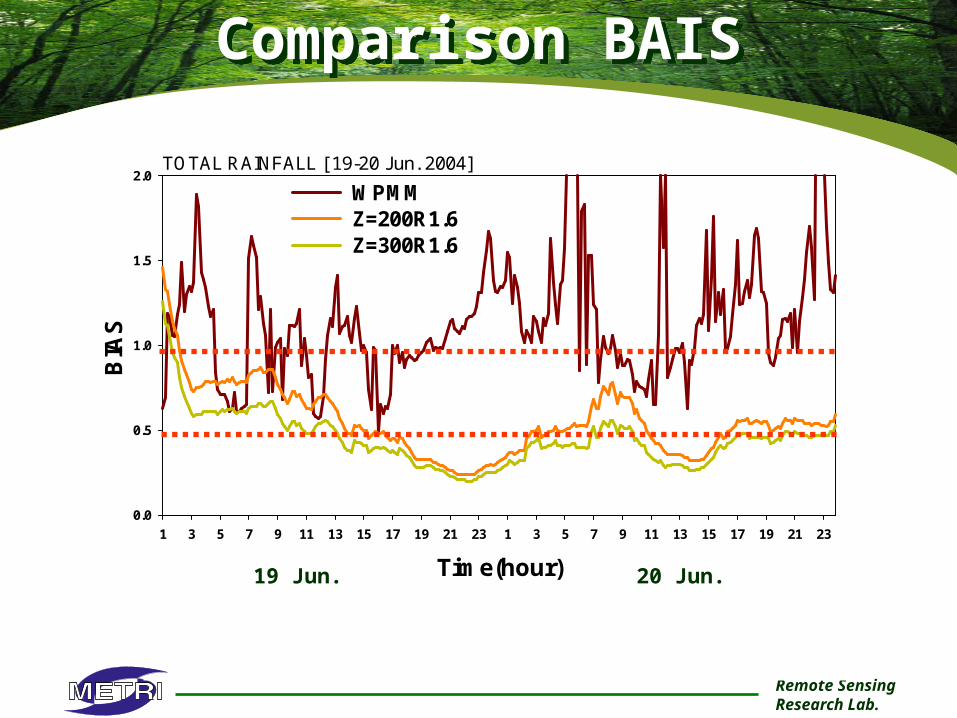
TOTAL RAINFALL [ 19-20 Jun. 2004]
Time(hour)
1 3 5 7 9 11 13 15 17 19 21 23 1 3 5 7 9 11 13 15 17 19 21 23
BIA
S
0.0
0.5
1.0
1.5
2.0
WPMM Z=200R1.6Z=300R1.6
19 Jun. 20 Jun.
Comparison BAISComparison BAIS
Remote Sensing Research Lab.
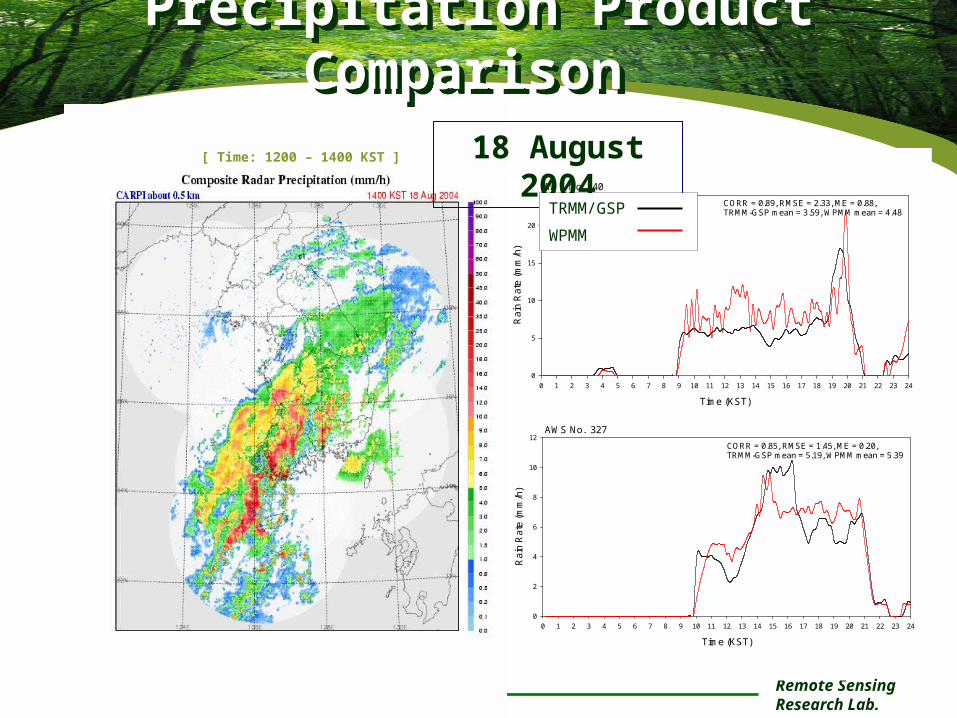
AWS No. 140
Time (KST)
0 1 2 3 4 5 6 7 8 9 10 11 12 13 14 15 16 17 18 19 20 21 22 23 24
Ra
in R
ate
(mm
/h)
0
5
10
15
20
TRMM-GSPWPMM
CORR = 0.89, RMSE = 2.33, ME = 0.88,TRMM-GSP mean = 3.59, WPMM mean = 4.48
AWS No. 327
Time (KST)
0 1 2 3 4 5 6 7 8 9 10 11 12 13 14 15 16 17 18 19 20 21 22 23 24
Rai
n R
ate
(mm
/h)
0
2
4
6
8
10
12CORR = 0.85, RMSE = 1.45, ME = 0.20,TRMM-GSP mean = 5.19, WPMM mean = 5.39
18 August 2004[ Time: 1200 – 1400 KST ]
Precipitation Product Comparison Precipitation Product Comparison
TRMM/GSP
WPMM
Remote Sensing Research Lab.
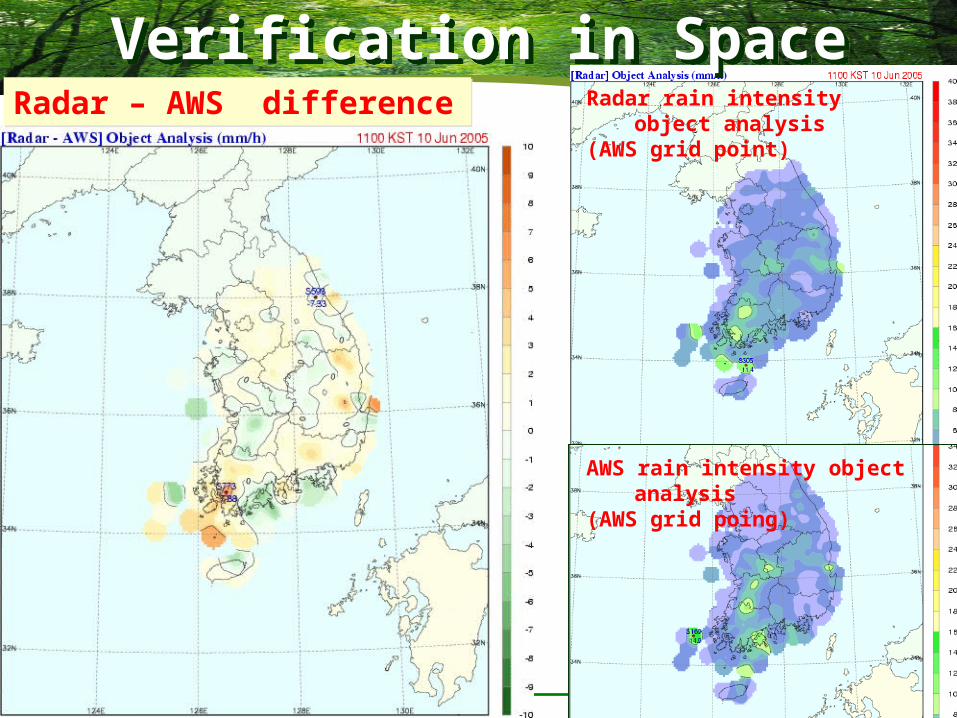
Radar – AWS differenceRadar – AWS difference Radar rain intensity object analysis (AWS grid point)
AWS rain intensity object analysis (AWS grid poing)
Verification in SpaceVerification in Space

Remote Sensing Research Lab.
WPMM rain intensity
AWS rain intensity
Z=200R1.6 rain intensity
Verification AreaManned AWS site
-Seoul-Gyungki-Gwangwon-Chungcheong-Jeonla-Gyungsang-Cheju
Verification in TimeVerification in Time
Remote Sensing Research Lab.
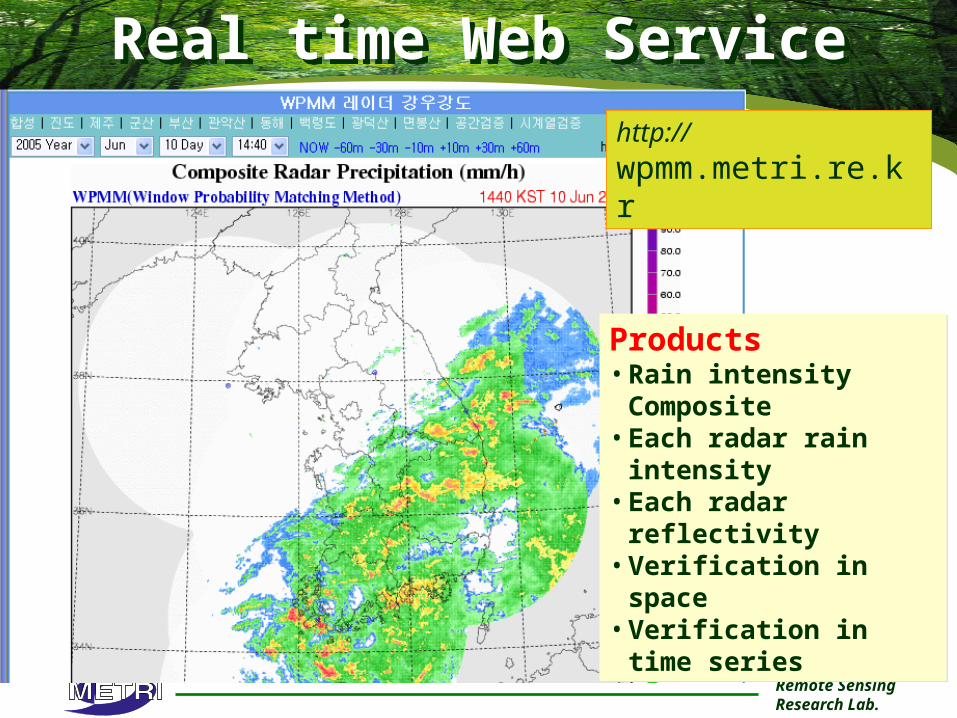
Products• Rain intensity Composite• Each radar rain intensity• Each radar reflectivity• Verification in space• Verification in time series
Products• Rain intensity Composite• Each radar rain intensity• Each radar reflectivity• Verification in space• Verification in time series
http://wpmm.metri.re.kr
Real time Web ServiceReal time Web Service
Remote Sensing Research Lab.
KMA’s operational Automatic Weather Station Network (13km*13km, one minute) and Weather radar(10 stations) can be used for GPM calibration and validation.
High resolution(1km x 1km) precipitation intensity were estimated from radar reflectivity with the various Z-R relationship obtained by WPMM using raingauges data of AWS operated by Korea Meteorological Administration (KMA).
Rain intensity produced by WPMM has a good agreement with ground rainfall data measured by raingauge and Optical Rain Gauge (ORG).
Rain intensities of S-band and C-band radars obtained by WPMM were more accurate than Z-R relationship (Z=200R1.6) and S-band radars were more accurate than C-band radars.
Concluding RemarksConcluding Remarks

Thank you for your attention !
Thank you for your attention !
Related Documents