Structural Constraints Identified with Covariation Analysis in Ribosomal RNA Lei Shang 1 , Weijia Xu 2 , Stuart Ozer 3 , Robin R. Gutell 1 * 1 Institute for Cellular and Molecular Biology, Center for Computational Biology and Bioinformatics, The University of Texas at Austin, Austin, Texas, United States of America, 2 Texas Advanced Computing Center, The University of Texas at Austin, Austin, Texas, United States of America, 3 Microsoft Corporation, Redmond, Washington, United States of America Abstract Covariation analysis is used to identify those positions with similar patterns of sequence variation in an alignment of RNA sequences. These constraints on the evolution of two positions are usually associated with a base pair in a helix. While mutual information (MI) has been used to accurately predict an RNA secondary structure and a few of its tertiary interactions, early studies revealed that phylogenetic event counting methods are more sensitive and provide extra confidence in the prediction of base pairs. We developed a novel and powerful phylogenetic events counting method (PEC) for quantifying positional covariation with the Gutell lab’s new RNA Comparative Analysis Database (rCAD). The PEC and MI- based methods each identify unique base pairs, and jointly identify many other base pairs. In total, both methods in combination with an N-best and helix-extension strategy identify the maximal number of base pairs. While covariation methods have effectively and accurately predicted RNAs secondary structure, only a few tertiary structure base pairs have been identified. Analysis presented herein and at the Gutell lab’s Comparative RNA Web (CRW) Site reveal that the majority of these latter base pairs do not covary with one another. However, covariation analysis does reveal a weaker although significant covariation between sets of nucleotides that are in proximity in the three-dimensional RNA structure. This reveals that covariation analysis identifies other types of structural constraints beyond the two nucleotides that form a base pair. Citation: Shang L, Xu W, Ozer S, Gutell RR (2012) Structural Constraints Identified with Covariation Analysis in Ribosomal RNA. PLoS ONE 7(6): e39383. doi:10.1371/journal.pone.0039383 Editor: Jens Kleinjung, MRC National Institute for Medical Research, United Kingdom Received December 13, 2011; Accepted May 24, 2012; Published June 19, 2012 Copyright: ß 2012 Shang et al. This is an open-access article distributed under the terms of the Creative Commons Attribution License, which permits unrestricted use, distribution, and reproduction in any medium, provided the original author and source are credited. Funding: This project has been funded by an External Research grant from Microsoft Research (awarded to RRG), and the National Institutes of Health (GM067317(awarded to RRG) and GM085337(awarded to RRG and WX)). Lei Shang was supported by NIH grants GM067317 and GM085337. The funders had no role in the study design, data collection and analysis, decision to publish, or preparation of the manuscript. While Stuart Ozer is an employee of Microsoft, no one else at Microsoft / Microsoft Research was involved with any aspect of this manuscript. No additional external funding received for this study. Competing Interests: Microsoft Research provided an external research grant to RRG. Although one of the authors, SO, is employed by Microsoft, this does not alter the authors’ adherence to all PLoS ONE policies on sharing data and materials. * E-mail: [email protected] Introduction Covariation analysis, one form of comparative analysis, identifies the positions in the RNA molecule that have similar patterns of variation, or covariation, for all or a subset of the sequences within the same RNA family. It was initially utilized to predict the cloverleaf secondary structure for tRNA [1] which was subsequently verified with high-resolution crystallography [2,3]. A few other examples of RNA molecules that were predicted with comparative analysis and verified with high-resolution crystallog- raphy are the 5S, 16S, and 23S rRNA [4,5,6], group I introns [7,8,9], RNase P [10,11,12], tmRNA [13,14], U RNA [15,16], and SRP RNA [17,18,19]. These examples provide additional support that comparative analysis can identify the secondary structure for some RNAs with extremely high accuracy. While the earliest covariation analysis methods searched for G:C, A:U, and G:U base pairs that occur within a regular secondary structure helix [1,20,21,22], newer more mathemati- cally and computational rigorous methods primarily searched for columns in an alignment of sequences for similar patterns of variation, based on their nucleotide frequencies, regardless of the type of base pair and the location of each putative base pair in relation to the other base pairs [23,24,25,26]. These latter studies had a simple and profound result. The vast majority of all base pair types were canonical - G:C, A:U, and G:U, and these base pairs were consecutive and antiparallel to form a regular helix. Thus this structure agnostic method for the identification of positional covariation had independently identified two of the most fundamental principles of RNA structure – the two base pair types initially determined by Chargaff [27,28], and Watson and Crick [29], and the arrangement of these base pair types into regular nucleic acid helical structures [29]. However, this search for positions in an alignment with similar patterns of variation have also identified numerous non-canonical base pair exchanges [30,31], pseudo-knots [31,32], base triples [33,34,35], and sets of positions with a weak network of covariations [26,33]. Thus, while the vast majority of the nucleotide positions with a very strong covariation form a canonical base pair within a standard helix, a small number of significant covariations are not part of a regular helix and do not exchange solely between canonical base pair types. The traditional methods to identify positional covariation utilize the nucleotide frequencies for each of the base pair types. While this approach has been very successful, as discussed earlier, the phylogenetic relationships between the sequences can enhance the sensitivity for the determination of the number of PLoS ONE | www.plosone.org 1 June 2012 | Volume 7 | Issue 6 | e39383

Gutell 119.plos_one_2017_7_e39383
May 11, 2015
Shang L., Xu W., Ozer S., and Gutell R.R. (2012).
Structural Constraints Identified with Covariation Analysis in Ribosomal RNA.
PLoS ONE, 7(6):e39383.
Structural Constraints Identified with Covariation Analysis in Ribosomal RNA.
PLoS ONE, 7(6):e39383.
Welcome message from author
This document is posted to help you gain knowledge. Please leave a comment to let me know what you think about it! Share it to your friends and learn new things together.
Transcript
Structural Constraints Identified with CovariationAnalysis in Ribosomal RNALei Shang1, Weijia Xu2, Stuart Ozer3, Robin R. Gutell1*
1 Institute for Cellular and Molecular Biology, Center for Computational Biology and Bioinformatics, The University of Texas at Austin, Austin, Texas, United States of
America, 2 Texas Advanced Computing Center, The University of Texas at Austin, Austin, Texas, United States of America, 3 Microsoft Corporation, Redmond, Washington,
United States of America
Abstract
Covariation analysis is used to identify those positions with similar patterns of sequence variation in an alignment of RNAsequences. These constraints on the evolution of two positions are usually associated with a base pair in a helix. Whilemutual information (MI) has been used to accurately predict an RNA secondary structure and a few of its tertiaryinteractions, early studies revealed that phylogenetic event counting methods are more sensitive and provide extraconfidence in the prediction of base pairs. We developed a novel and powerful phylogenetic events counting method (PEC)for quantifying positional covariation with the Gutell lab’s new RNA Comparative Analysis Database (rCAD). The PEC and MI-based methods each identify unique base pairs, and jointly identify many other base pairs. In total, both methods incombination with an N-best and helix-extension strategy identify the maximal number of base pairs. While covariationmethods have effectively and accurately predicted RNAs secondary structure, only a few tertiary structure base pairs havebeen identified. Analysis presented herein and at the Gutell lab’s Comparative RNA Web (CRW) Site reveal that the majorityof these latter base pairs do not covary with one another. However, covariation analysis does reveal a weaker althoughsignificant covariation between sets of nucleotides that are in proximity in the three-dimensional RNA structure. This revealsthat covariation analysis identifies other types of structural constraints beyond the two nucleotides that form a base pair.
Citation: Shang L, Xu W, Ozer S, Gutell RR (2012) Structural Constraints Identified with Covariation Analysis in Ribosomal RNA. PLoS ONE 7(6): e39383.doi:10.1371/journal.pone.0039383
Editor: Jens Kleinjung, MRC National Institute for Medical Research, United Kingdom
Received December 13, 2011; Accepted May 24, 2012; Published June 19, 2012
Copyright: � 2012 Shang et al. This is an open-access article distributed under the terms of the Creative Commons Attribution License, which permitsunrestricted use, distribution, and reproduction in any medium, provided the original author and source are credited.
Funding: This project has been funded by an External Research grant from Microsoft Research (awarded to RRG), and the National Institutes of Health(GM067317(awarded to RRG) and GM085337(awarded to RRG and WX)). Lei Shang was supported by NIH grants GM067317 and GM085337. The funders had norole in the study design, data collection and analysis, decision to publish, or preparation of the manuscript. While Stuart Ozer is an employee of Microsoft, no oneelse at Microsoft / Microsoft Research was involved with any aspect of this manuscript. No additional external funding received for this study.
Competing Interests: Microsoft Research provided an external research grant to RRG. Although one of the authors, SO, is employed by Microsoft, this does notalter the authors’ adherence to all PLoS ONE policies on sharing data and materials.
* E-mail: [email protected]
Introduction
Covariation analysis, one form of comparative analysis,
identifies the positions in the RNA molecule that have similar
patterns of variation, or covariation, for all or a subset of the
sequences within the same RNA family. It was initially utilized to
predict the cloverleaf secondary structure for tRNA [1] which was
subsequently verified with high-resolution crystallography [2,3]. A
few other examples of RNA molecules that were predicted with
comparative analysis and verified with high-resolution crystallog-
raphy are the 5S, 16S, and 23S rRNA [4,5,6], group I introns
[7,8,9], RNase P [10,11,12], tmRNA [13,14], U RNA [15,16],
and SRP RNA [17,18,19]. These examples provide additional
support that comparative analysis can identify the secondary
structure for some RNAs with extremely high accuracy.
While the earliest covariation analysis methods searched for
G:C, A:U, and G:U base pairs that occur within a regular
secondary structure helix [1,20,21,22], newer more mathemati-
cally and computational rigorous methods primarily searched for
columns in an alignment of sequences for similar patterns of
variation, based on their nucleotide frequencies, regardless of the
type of base pair and the location of each putative base pair in
relation to the other base pairs [23,24,25,26]. These latter studies
had a simple and profound result. The vast majority of all base
pair types were canonical - G:C, A:U, and G:U, and these base
pairs were consecutive and antiparallel to form a regular helix.
Thus this structure agnostic method for the identification of
positional covariation had independently identified two of the
most fundamental principles of RNA structure – the two base pair
types initially determined by Chargaff [27,28], and Watson and
Crick [29], and the arrangement of these base pair types into
regular nucleic acid helical structures [29]. However, this search
for positions in an alignment with similar patterns of variation
have also identified numerous non-canonical base pair exchanges
[30,31], pseudo-knots [31,32], base triples [33,34,35], and sets of
positions with a weak network of covariations [26,33]. Thus, while
the vast majority of the nucleotide positions with a very strong
covariation form a canonical base pair within a standard helix, a
small number of significant covariations are not part of a regular
helix and do not exchange solely between canonical base pair
types.
The traditional methods to identify positional covariation
utilize the nucleotide frequencies for each of the base pair types.
While this approach has been very successful, as discussed
earlier, the phylogenetic relationships between the sequences can
enhance the sensitivity for the determination of the number of
PLoS ONE | www.plosone.org 1 June 2012 | Volume 7 | Issue 6 | e39383
mutual changes that have occurred during the evolution of the
RNA. Our confidence in one of the first putative helices that
forms a pseudo knot was significantly bolstered when we
determined that several of the same base pair types (e.g. A:U,
G:C) had evolved multiple times in the evolution of the 570/866
base pair in 16S rRNA [32], thus increasing the likelihood that
these two positions with similar patterns of variation did not
occur by chance. Accordingly, our analysis of the sequences in
hairpin loops with four nucleotides (commonly called –
tetraloops) revealed hairpin loops in the 16S rRNA that
frequently changed between GNRA, UUCG, and CUUG [36]
during the evolution of the rRNA. Thus the evolutionary history
of the sequences and the positions within the sequences is
another dimension of information that enhances the resolution
and alternative interpretations of the covariation analysis. For
these two studies published in 1986 and 1990, the numbers of
phylogenetic events - coordinated changes during the evolution
of the RNA, were counted from a visual inspection of the data.
However, new computational methods are essential to automat-
ically identify covariations based on phylogenetic relationships.
Several papers have been presented that identify covariations
based on modeling phylogenetic relationships [37,38,39].
The Gutell lab developed a novel and sophisticated multidi-
mensional relational database system for the comparative analysis
of RNA. This system was named rCAD – RNA Comparative
Analysis Database [40]. It integrates and cross-indexes several
dimensions of information for storage, retrieval, and analysis.
While this infrastructure has multiple applications for the analysis
of the structure, function, and evolution of RNA, for the objectives
of this study, we have utilized rCAD to determine the changes at
each position in the RNA molecule during its evolution. This
Phylogenetic Event Counting (PEC) method traversals the
phylogenetic tree hierarchy and measures the significance of
covariations between two positions. A Joint N-Best method and a
Helix-extension procedure are utilized to enhance the identifica-
tion and accuracy of identification of the structural constraints
present in the sequence alignment. A comparison between our
PEC based method and other covariation methods reveals that
while PEC is overall superior in the identification of base pairs, MI
based methods identify unique base pairs, and they jointly identify
many other base pairs. Both types of methods, when applied
simultaneously identifies even more base pairs than either method
by themselves. And last, these covariation methods also identify
other types of constraints in an RNA structure.
Results
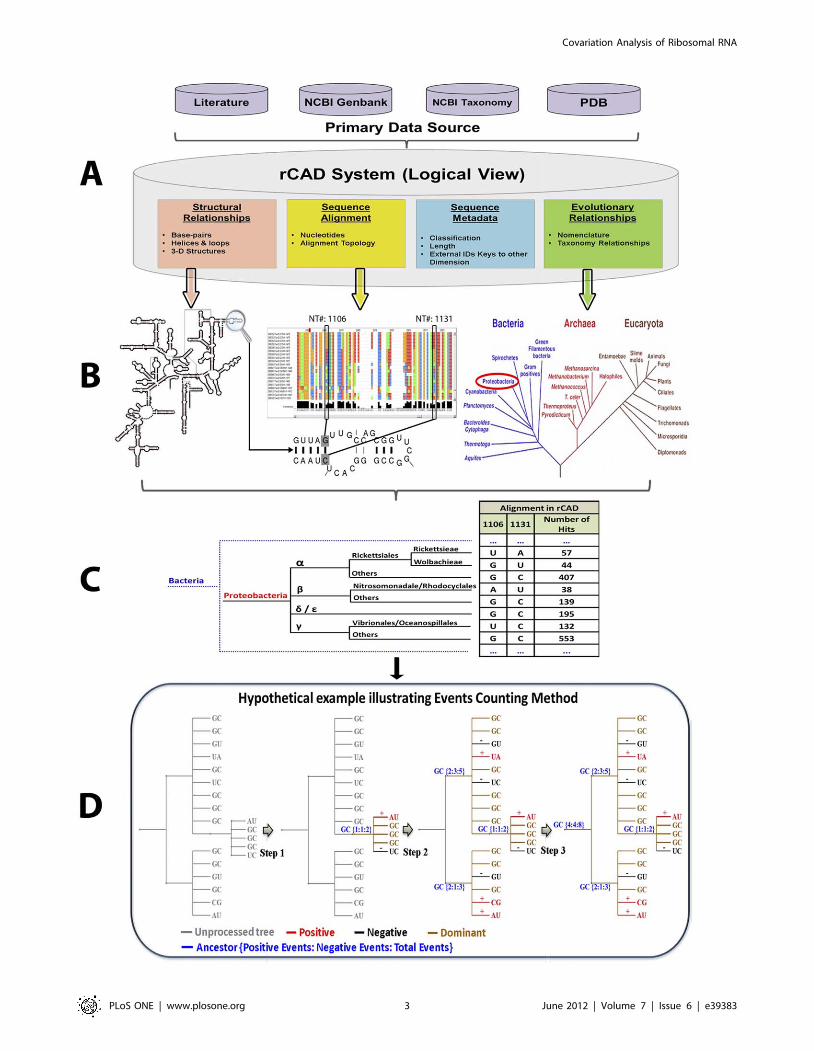
1. Conceptual Overview of the Methods Used in Analysis1.1. The phylogenetic event counting method. The
overall analysis workflow of the Phylogenetic Event Counting
method (PEC) is shown in Figure 1. The four primary forms of
data are: (1) metadata, including functional information about
sequences and structures; (2) sequences and sequence alignment;
(3) higher-order structure and (4) evolutionary/phylogenetic
relationships between the sequences and structures are stored
and analyzed in rCAD (Figure 1A & 1B). For each pair of positions
under consideration, the nucleotides are mapped onto the
phylogenetic tree (Figure 1C). A tree-traversal from leaf nodes to
root counts all positive events (both position change from child
node to its direct parent node) and negative events (only one
position changes) (Figure 1D). The nucleotides of ancestor nodes
are determined by using maximum parsimony strategy. However,
to avoid bias caused by repeat sampling in certain branches, each
type of pair of child nucleotides is counted only once. For example,
ancestor node is {U:A}, child nodes contain U:A which occurs 10
times, A:U which occurs 2 times, A:C which occurs 1 time. The
A:U pair will be counted only once as positive events regardless of
its actual occurrence. Thus we minimize the observed events in
our analysis to assure high confidence. The pseudo code of PEC
algorithm is described in Figure S1. The covariation between two
positions is determined by calculating the Covariation Percentage
of Events (CPE), the ratio of positive events to the total number of
events (positive and negative) (Details in Method section).
1.2. Base pair identification process. The analysis proce-
dure that reveals structural constraints of RNA molecules is
presented in Figure 2. Base pairs with covariations are identified
with a Joint N-Best strategy which measures the significance of
covariation score between the two positions, followed by a helix
extension procedure to further improve the sensitivity (Process
colored blue in Figure 2).
The N-Best strategy was initially used with mutual information
(MIxy) on a set of tRNA sequences [26]. MIxy values increase for
similar extents of covariation as the entropy value decreases (ie.
increases in variation, the MIxy values should be standardized for
the different entropy values). A simple method to approximate this
is to rank the positions with the highest mutual information scores,
or covariation for each individual position. For the majority of
base pairs in the comparative structures for the tRNAs [26], the
positions that form a base pair with the cardinal position number
usually has a MIxy value significantly higher than the MIxy values
for the other ranked positions.
This standardizes the covariation scores by first ranking the
positions with their MIxy values, followed by the calculation of a
ratio value of the second highest covariation score to the highest
score. Our confidence in the prediction of a base pair is
proportional to the difference between the two positions with the
largest values. The likelihood that position X is base paired to
position Y is further enhanced when the position with the highest
score for X is Y, and when the position with the highest score for Y
is X. This Joint N-Best with PEC method (PEC/JN-Best) improves
the sensitivity and accuracy of the base-pair identification (see the
Method section). Pairs of positions satisfying a predefined N-Best
threshold (#0.5) are considered as base pair candidates with
significant covariations.
The amount of covariation is directly proportional to the
amount of variation in a sequence alignment. Figure S2 reveals the
relationship between the overall variation in the bacterial 16S
rRNA alignment and the amount of variation in three categories
in the secondary structure: 1) both positions involved in base pairs,
2) one of the two base paired positions, and 3) the unpaired
positions.
This variation/covariation analysis reveals that more conserved
positions are less likely to be identified as a base pair with
covariation methods than positions that have more variation (ie –
no variation, no covariation). Since our objective is to identify all
of the secondary structure base pairs, the base pair candidates
identified with Joint N-Best strategy are used as the nucleation
pairs in the helix extension process. The helix extension increases
the length of a putative helix with G:C, A:U, and G:U base pairs
that are 1) adjacent and antiparallel with the nucleation pair and 2)
occur in at least 85% of the sequences. A less quantitative version
of this helix extension was first applied in the original Noller-
Woese 16S and 23S rRNA secondary structure models [20,41]. A
helix with the maximal number of G:C, A:U, and G:U base pairs
was formed when at least one base pair had a covariation. As more
16S and 23S rRNA sequences were determined, some of the
extended base pairs from the nucleation base pair were removed
when the two positions did not have similar patterns of variation
Covariation Analysis of Ribosomal RNA
PLoS ONE | www.plosone.org 2 June 2012 | Volume 7 | Issue 6 | e39383
Covariation Analysis of Ribosomal RNA
PLoS ONE | www.plosone.org 3 June 2012 | Volume 7 | Issue 6 | e39383

while the majority of the extended base pairs did have similar
patterns of variation in alignments that contained more sequences
[6,25]. Our confidence in a predicted base pair is directly
proportional to the amount of covariation. Thus, we have less
confidence in those base pairs that have minimal or no
covariation.
The high-resolution crystal structure of the T. thermophilus 30S
ribosomal subunit (PDBID: 1J5E) which contains the 16S rRNA
and E. Coli 50S ribosomal subunit (PDBID: 2AW4)are the
reference structures for this study. All identified covariant pairs are
categorized as either true positives (annotated in the reference
crystal structure) or false positives (not annotated in the reference
crystal structure).
1.3. Neighbor effects identification process. Previous
analysis has revealed that when two positions in a sequence
alignment have very similar patterns of variation, as gauged with a
high covariation score, those positions usually form a base pair in
the RNA higher-order structure. However as the extent of
positional covariation decreases, our observations here and in
our previous analysis [26,33] reveals that some pairs with lower
covariation scores form base pairs, and others do not. While the
full significance of these observations have not been determined,
we have observed that the positions in these clusters of significant
but lower covariation scores are usually very close with one
another in the three-dimensional structure with the traditional,
covariation methods, hereafter named neighbor effects [33,42].
Figure S3 shows that the highest covariation score for the
majority of all positions that are base paired is significantly higher
than the position with the second best score (example of
nucleotides 3 in tRNA are presented in S3a left side, while the
overall picture are shown in S3b). However, the highest
covariation value for some base pairs is lower while the set of
next highest positions are closer to the highest (see Figure S3a right
side and Figure S4).
Figure 1. The highlight and underlying concepts of the PEC based covariation analysis in rCAD. A: data source; B: multi-dimensionaldata; C: mapping the substitutions; D: counting the positive and negative events.doi:10.1371/journal.pone.0039383.g001
Figure 2. The flowchart of analysis in the identification of base-pairs and neighbor effects.doi:10.1371/journal.pone.0039383.g002
Covariation Analysis of Ribosomal RNA
PLoS ONE | www.plosone.org 4 June 2012 | Volume 7 | Issue 6 | e39383

We identify a set of ‘‘neighbor effects’’ using a standard one-
directional N-best method with some covariation and structural
constraints (Process colored green in Figure 2, details in the
Method section).
2. Application of the Methods on Datasets2.1. The datasets used and the strategy of reducing the
number of pairwise comparisons. Three data sets are used
in this analysis: a bacterial 16S rRNA sequence alignment
containing 4142 sequences with 3236 Columns (Dataset S1); a
bacteria 5S rRNA alignment containing 2088 sequences with 333
columns (Dataset S2); and a bacteria 23S rRNA alignment
containing 2339 sequences with 7330 columns (Dataset S3). The
sequences in this analysis include organisms from most of the
major branches of the bacterial phylogenetic tree (details in Table
S1).
The significance of this covariation analysis is dependent on the
accuracy of the alignment of sequences. We have utilized
alignments from the Comparative RNA Web (CRW) Site [6].
These alignments are the culmination of more than twenty years
of refinement. Starting with sequences that have sufficient
sequence identity, covariation analysis was used to predict the
early secondary structure models that were subsequently used to
refine the alignment in parallel with the addition of more
sequences. Additional covariation analysis with more sophisticated
algorithms were used to refine the secondary structure in the
regions of the rRNA that are present in all of the sequences,
regions present in just the major phylogenetic domains (ie.
Archaea, Bacteria, and Eucarya), present in sub-branches within
these three domains, etc. This process resulted in secondary
structure models that are very accurate. A total of 97–98% of the
base pairs predicted with comparative analysis are in the high-
resolution crystal structure [43]. This high accuracy substantiates
the accuracy of the sequence alignments and the subsequent
covariation analysis. A more detailed description of the alignment
of RNA sequences have been published [6,25,30].
The Escherichia coli [44] is the typical reference sequence for 5S,
16S, and 23S rRNA comparative structure models. The high-
resolution three-dimensional structure for Thermus thermophiles 30S
ribosomal subunit [5] is utilized in the analysis of the 16S rRNA
while the high-resolution structure for Escherichia coli 50S ribosomal
subunit [45] is used in the analysis of the 5S and 23S rRNA. The
sequences in these crystal structures are used as the reference
sequences. To expedite the phylogenetic event counting method,
only those pairwise positions that have the likelihood of having a
significant covariation were analyzed. The process of selecting
those sets of positions is illustrated for 16S rRNA. This sequence
has 1521 nucleotides, while the alignment contains 3,236 columns.
Every column in the alignment is analyzed with every other
column. Thus the total number of pairwise comparisons is
5,234,230. The time complexity of PEC algorithm on this dataset
scales to O(4.461010). The PEC algorithm requires a significant
amount of time to transverse the entire phylogenetic tree and
count the number of changes during the evolution of the RNA.
Since the positions with similar conservation scores have the
higher probability to have good covariation score (details in Figure
S5), the number of pairwise comparison calculations is reduced
significantly by analyzing only those sets of positions with similar
conservation scores., Therefore a coarse filter is applied to reduce
the number of pairwise comparison to 14,276 ([46], details in
Method section, a complete list in Table S2).
2.2. Performance comparison of different covariation
methods in the identification of base pairs. The perfor-
mance of our PEC method in the identification of real base pairs -
is compared with other published methods using the bacterial 5S,
16S, and 23S rRNA alignment data sets. The percentage of
predicted base pairs that are present in the crystal structures are
measured as a function of rank order using a variety of methods:
PEC, MIxy [24,26], MIp [47], OMES [48], ELSC [49], and
McBASC [50]. In addition to the methods that are used here to
evaluate the performance of our PEC method, we also tried to
evaluate several other programs including PSICov [51], Direct
information (DI) [52], RNAalifold [53], RNAfold [54,55], Pfold
[56,57]and Evofold [58]. However, these programs are either not
suitable for the prediction of higher-order structure of RNA with
covariation analysis or they are unable to operate on the large
alignments used in our study.
The precision of top N ranked prediction plot, utilized in several
similar covariation analysis studies [47,51,59,60] to gauge the
precision of several covariation methods, is shown in Figure 3.
These plots reveal the fraction of pairs with ranked N or higher in
each data set that are the contacting base pairs in the crystal
structures. For the 16S rRNA alignment (Figure 3B), the PEC
method performs better than Mixy and MIp, and significantly
better than ELSC, OMES, and McBASC. For the 5S and 23S
rRNA alignments, PEC and the MIp have higher values that are
similar with one another, while the values for the ELSC, OMES,
and McBASC methods are considerably lower (Figure 3A and
3C). The total event (positive events plus negative events) measures
the total number of changes on a pair of positions throughout their
evolution. Adding the total event threshold (e.g. . = 10) reduces
background noise and improves the accuracy of PEC method. As
shown in Figure 3A and 3B, PEC with total events threshold
achieves higher accuracy than PEC without total events threshold.
However, that performance of PEC with or without total events
threshold is exactly the same on the 23S rRNA data set
(Figure 3C). Overall while the PEC method is superior, MIp is
the second best method in identifying base pairs.
2.3. Application of joint N-best. The precision of top N
ranked curve plot in Figure 3 reveals that the PEC, MIp, and
MIxy methods are the top 3 solutions for our data sets. Mutual
information (MIxy) measures the dependence between two
positions in the RNA sequence alignment. It was first introduced
for the identification of base pairs in RNA [24,26]. Lindgreen et al.
evaluated 10 different mutual information based methods for the
identification of covariations in RNA alignments [61]. While they
demonstrated that the standard implementation of MIxy is a good
measure for the prediction of base pairs in the secondary structure,
several variations of the simple implementation improved the
prediction of the base pairs. Additional improvements in the
implementation of Mixy [47] utilized a method (MIp) that
estimates the level of background mutual information for each
pair of positions. After removing the background and introducing
a Z-score (MIp/Z-score), Dunn et al. [47] have determined that
their MIp/Z-score method identified substantially more co-
varying positions than other existing mutual information based
methods.
In our analysis, we use Joint N-best algorithm to determine
the significance of the covariation scores calculated in different
methods (details in Methods section). The Joint N-best
algorithm is used with PEC, MIxy, and MIp methods (PEC/
JN-Best, MIp/JN-Best, MIxy/JN-Best). The recommended
(default) cutoff value of N-best score is 0.5. We also make a
conversion from MIp to Z-score (MIp/Z-score) with the
recommended Z-score cutoff as comparison [47].
The PEC/JN-Best, MIxy/JN-Best and MIp/JN-Best methods
are used on the 5S, 16S and 23S rRNA data sets. For the 16S
rRNA (Figure 4), the PEC/JN-Best method identifies 186 real
Covariation Analysis of Ribosomal RNA
PLoS ONE | www.plosone.org 5 June 2012 | Volume 7 | Issue 6 | e39383
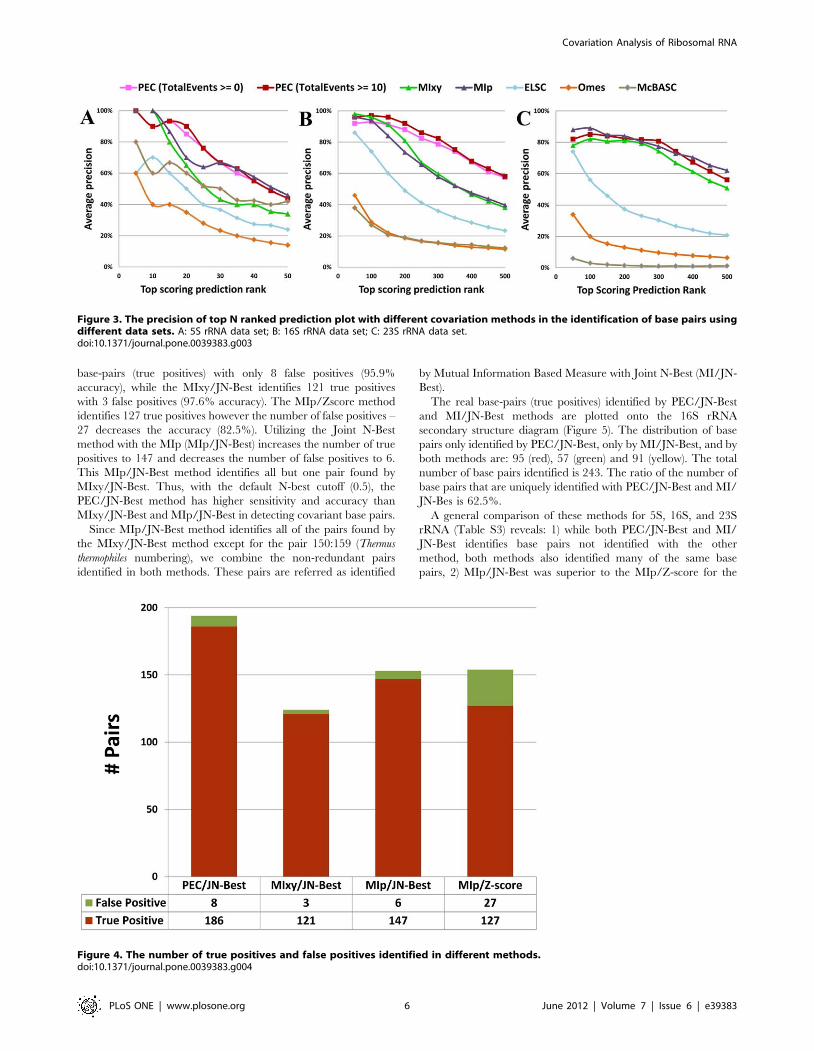
base-pairs (true positives) with only 8 false positives (95.9%
accuracy), while the MIxy/JN-Best identifies 121 true positives
with 3 false positives (97.6% accuracy). The MIp/Zscore method
identifies 127 true positives however the number of false positives –
27 decreases the accuracy (82.5%). Utilizing the Joint N-Best
method with the MIp (MIp/JN-Best) increases the number of true
positives to 147 and decreases the number of false positives to 6.
This MIp/JN-Best method identifies all but one pair found by
MIxy/JN-Best. Thus, with the default N-best cutoff (0.5), the
PEC/JN-Best method has higher sensitivity and accuracy than
MIxy/JN-Best and MIp/JN-Best in detecting covariant base pairs.
Since MIp/JN-Best method identifies all of the pairs found by
the MIxy/JN-Best method except for the pair 150:159 (Thermus
thermophiles numbering), we combine the non-redundant pairs
identified in both methods. These pairs are referred as identified
by Mutual Information Based Measure with Joint N-Best (MI/JN-
Best).
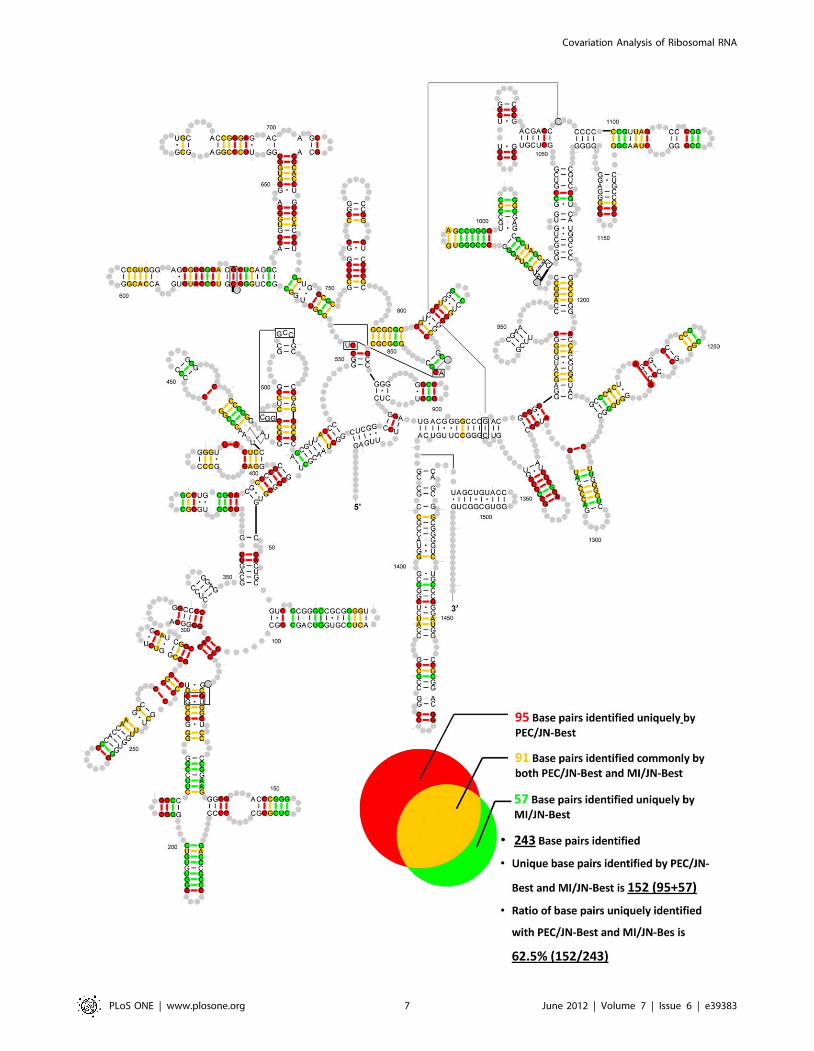
The real base-pairs (true positives) identified by PEC/JN-Best
and MI/JN-Best methods are plotted onto the 16S rRNA
secondary structure diagram (Figure 5). The distribution of base
pairs only identified by PEC/JN-Best, only by MI/JN-Best, and by
both methods are: 95 (red), 57 (green) and 91 (yellow). The total
number of base pairs identified is 243. The ratio of the number of
base pairs that are uniquely identified with PEC/JN-Best and MI/
JN-Bes is 62.5%.
A general comparison of these methods for 5S, 16S, and 23S
rRNA (Table S3) reveals: 1) while both PEC/JN-Best and MI/
JN-Best identifies base pairs not identified with the other
method, both methods also identified many of the same base
pairs, 2) MIp/JN-Best was superior to the MIp/Z-score for the
Figure 3. The precision of top N ranked prediction plot with different covariation methods in the identification of base pairs usingdifferent data sets. A: 5S rRNA data set; B: 16S rRNA data set; C: 23S rRNA data set.doi:10.1371/journal.pone.0039383.g003
Figure 4. The number of true positives and false positives identified in different methods.doi:10.1371/journal.pone.0039383.g004
Covariation Analysis of Ribosomal RNA
PLoS ONE | www.plosone.org 6 June 2012 | Volume 7 | Issue 6 | e39383
Covariation Analysis of Ribosomal RNA
PLoS ONE | www.plosone.org 7 June 2012 | Volume 7 | Issue 6 | e39383
16S rRNA with the default settings, and 3) MIp/JN-Best
identifies a larger percentage of the base pairs found with by
MIxy/JN-Best.
2.4. Identification of highly conserved base pair with
helix-extension strategy. The sum of non-redundant predict-
ed base pairs by PEC/JN-Best and MI/JN-Best methods in 5S,
16S, and 23S rRNA datasets are used as nucleation pairs in the
helix-extension procedure. Extended pairs are composed of the
nucleotides that are adjacent and antiparallel to the nucleation
pair. All extended pairs have more than 85% WC/Wobble base-
pair nucleotides in the alignment. Additional base pairs that satisfy
this helix extension threshold continue to be added to this
extending helix until they fail the extending threshold. A complete
list of pairs involved in helix extension is shown in Table S4. For
16S rRNA data set (Figure 6 left), the total number of base pairs
added with the helix extension is 160; 129 of these are present in
the crystal structure, while the 31 false positives primarily occur at
the end of helices. The nucleation and extended pairs are mapped
onto the secondary structure diagram of T. thermophilus 16S rRNA,
as shown in Figure 7. The number of nucleation pairs with PEC/
JN-Best and MI/JN-Best, the extended pairs in the helix
extensions - and the secondary structure diagrams are shown in
Figure 6 (middle and right), and Figure S6 respectively. This result
demonstrates that with a collection of high-quality nucleation
pairs, the helix extension strategy is accurate and sensitive in the
identification of highly conserved base pairs. The successful
application of this Helix-extension method onto the 5S and 23S
rRNA data sets further substantiates this conclusion (A complete
list in Table S4).
2.5. The purity of the secondary and tertiary structure
base pairs in the crystal structure compared with the
conservation scores. Most of the base pairs identified are part
of the secondary structure. Of these, 240 are identified with the
Joint N-best analysis and 127 are found with the helix extension
procedure for the 16S rRNA data set (represented as closed circle
in Figure 7). Only a few tertiary structure base pairs are identified:
3 in Joint N-best and 2 in helix extension procedure (represented
as open circle and get highlighted by arrows in Figure 7).
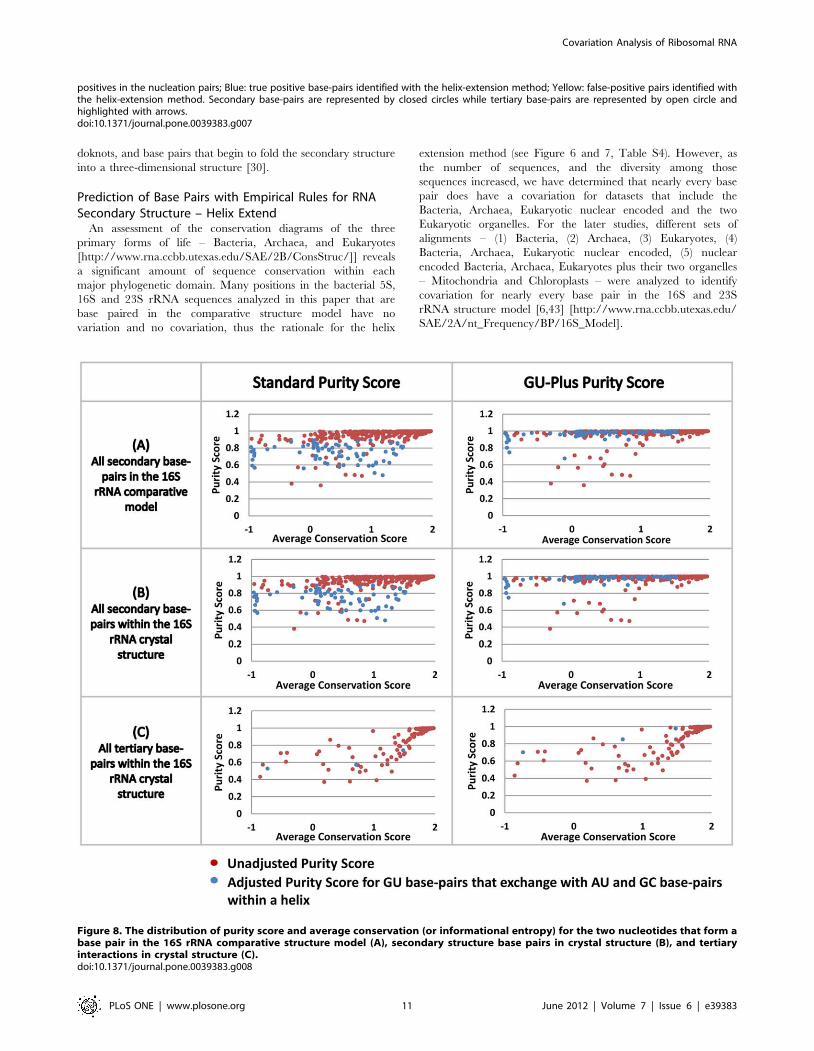
A quantitative and graphical analysis illustrates the general
observation noted in the previous paragraph – secondary structure
base pairs usually have strong covariation between the two
nucleotides that form that interaction while the majority of the
tertiary structure base pairs have weak or no covariation between
the two nucleotides that form that interaction. The purity score – a
measure of the precision of covariation (details in Method section
and Figure S7), is plotted against the conservation score (or
informational entropy, see Method section) for the two positions
that form a base pair (Figure 8). This analysis was performed for
the 16S rRNA comparative secondary structure and the high
resolution crystal structure for Thermus thermophilus 16S rRNA. For
both of these molecules, two plots were created, the first for the
unaltered purity score and the second for purity scores adjusted for
G:U base pairs (see Methods section; Figure 8). Base pairs in the
bacterial 16S rRNA dataset range from highly conserved to highly
variable in the comparative and crystal structures. The overall
results from these plots are as expected: (1) The majority of the
secondary structure base pairs are at or very close to a purity score
of 1; (2) Many of the base pairs with a lower absolute purity score
increase their GU-plus score to or near 1, indicating that many of
the base pairs associated with these lower purity scores involve a
G:U base pair; (3) The majority of tertiary structure base pairs do
not have the highest purity scores, indicating that many of
positions that form tertiary base pairs have no covariation, or some
covariation with many exceptions, consistent with our previous
observation [43] [http://www.rna.ccbb.utexas.edu/SAE/2A/
xtal_Info/16S/Index].
2.6. The identification of ‘‘neighbor effects’’. As shown
in earlier sections of this manuscript and previous studies [37,38],
phylogenetic event-based covariation methods have the potential
to identify covariations that are not observed with the traditional
methods.
The covariation values for the highest and second highest
positions for the base pairs identified in our PEC/JN-Best method
are significantly different (threshold value of 0.5, see ‘‘The Joint N-
Best strategy’’ in the Methods section). These base pairs are
analogous to the tRNA base pair 3:70 in Figure S3a left side.
However the difference between the highest and the set of next
highest positions in our Bacterial 16S rRNA dataset are smaller for
numerous positions, analogous to Figure S3a right side and Figure
S4. As first defined in [26], positions with these characteristic
covariation values are referred to as neighbor effects, and are
usually physically close to one another. Neighbor effects are
defined herein as those positions with the N-best scores exceeding
a predefined threshold of $0.85 (see Methods section) and are in
close proximity. For this manuscript, the physical distance is
minimal for those positions that are defined to be a neighbor
effect. This criterion is satisfied for those positions with at least 10
phylogenetic events (Figure S8).
With this criteria, 89 neighbor-effect pairs are identified and
plotted onto the secondary structure diagram of T. thermophilus
16S rRNA (Figure 9, a complete list in Table S5). Among the
89 neighbor effect pairs, 15 have hydrogen bonding between
the nucleotides in the 16S T. Thermophilus rRNA crystal
structure (8 secondary base-pairs, 4 tertiary base-pairs and 3
base-triples). These are colored green in Figure 8. The
remaining 74 pairs do not form hydrogen bonds between the
bases. These are colored red. Of the 89 neighbor effects pairs,
only four (686:905, 686:930, 686:1209 and 686:1371, T.
thermophiles numbering) are separated by more than 30 A. The
average distance between these neighbor effects is 8.8265.91 A.
Most of these neighbor effects involve nucleotides that are either
consecutive on the sequence, each nucleotide of the pair are on
opposite sides of a helix, adjacent to two nucleotides that form a
base pair, or involve a nucleotide in a loop and a nucleotide in
a helix that is very close to the loop. Our analysis of the 5S and
23S rRNA datasets also revealed neighbor effects using the
same parameter setting (complete list in Table S5).
This observation reveals that nucleotides that do not form a
base pair can influence the evolution of other nucleotides that are
physically close with one another. While the complete structural
and functional significance of these neighbor effects remains to be
determined, several studies have revealed that: 1) nucleotides
associated with base triples and in proximity to these base triples in
and near the D stem in tRNA and group I introns have
moderately high covariation values [26,33] (see Figure S4), 2)
experimental studies of the ribosome reveal that the D stem in
tRNA is dynamic during protein synthesis [62,63].
Figure 5. The base pairs (true positives) identified by PEC/JN-Best and MI/JN-Best are plotted onto the T. thermophiles 16S rRNAsecondary structure diagram. Red: base pairs only identified by PEC/JN-Best; Green: base pairs only identified by MI/JN-Best; Yellow: base pairsidentified by both methods.doi:10.1371/journal.pone.0039383.g005
Covariation Analysis of Ribosomal RNA
PLoS ONE | www.plosone.org 8 June 2012 | Volume 7 | Issue 6 | e39383

Two other research groups have determined covariations by
modeling phylogenetic relationships in bacterial 16S rRNA
[37,38]. A comparison of our results with their new covariations
revealed that: 1) A few new pairings were identified with both
methods; 2) Some of the nucleotides with a covariation identified
with their methods are separated by a minimal distance (ie.
neighbor effect) while other nucleotides are separated by a much
larger distance in the high-resolution crystal structure. A detailed
assessment of the similarities and differences are presented in
Table S6.
Discussion
Utilizing the Evolution of the RNA Structure to Improvethe Covariation Methods
Our previous work, presented many years ago revealed that
the sensitivity and accuracy of the covariation analysis can be
enhanced with the evolutionary history of the RNA [32]. Our
analysis of tetraloops in 16S rRNA revealed that this hairpin
with four nucleotides that caps a helix can evolve from one
common form of the tetraloop to another many times during
the evolution of the RNA [36]. This temporal dimension of the
RNA structure can distinguish divergent and convergent
evolution of specific regions of the RNA. For these studies,
the number of times these positions changed during their
evolution was determined after the base pairs and tetraloop
were identified. While our preference is to utilize the
evolutionary history of the positions in the RNA to identify
these base pairs and other structural elements, monitoring these
temporal changes is a significant computational challenge.
Two groups have modeled the evolution of each position in
RNA to identify positional covariation with some success
[37,38]. The Gutell lab’s new RNA Comparative Analysis
Database [40,46] cross-indexes data from each of the dimen-
sions onto the other dimensions. This creates the opportunity to
perform several types of novel analysis, including the phyloge-
netic event counting used for the covariation analysis presented
in this manuscript.
Implementing a Phylogenetic Event Counting Method,and it’s Overall Comparison with Mutual Information
Analysis presented here reveals that overall our Phylogenetic
Event Counting method (PEC) is superior than other methods in
the identification of base pairs (Figure 3).PEC/JN-Best is more
sensitive and accurate than the mutual information based methods
that do not utilize the evolution of the RNA in its calculation (see
Figures 4), though it does not identify all pairs identified by mutual
information based methods (see Figure 5). The modified MIxy
method – MIp, when integrated with the JN-Best method,
improves the initial mutual information method. The ratio of
the number of base pairs that are uniquely identified with PEC/
JN-Best and MI/JN-Bes is 62.5% in the 16S rRNA data set
(Figure 5) and 76.0% for the three rRNAs (Table S3). Thus the
combination of these two covariation methods results in a
significant increase in the number of base pairs found. It also
demonstrates that the Joint N-Best also improves the sensitivity
and accuracy. Of the base pairs identified with covariation
analysis, the vast majority occur in secondary structure helices. A
few of the base pairs identified with covariation analysis are in the
tertiary structure, this includes non-canonical base pairs, psueu-
Figure 6. For each method, the number of true positives and false positives identified in the Joint N-Best calculation (nucleationpairs), following helix extension procedure (extended pairs), and sum of them are shown as a stacked histogram.doi:10.1371/journal.pone.0039383.g006
Covariation Analysis of Ribosomal RNA
PLoS ONE | www.plosone.org 9 June 2012 | Volume 7 | Issue 6 | e39383

Figure 7. Base pairs in the Bacterial 16S rRNA structure model that are identified with the helix extension method. Red: true positivebase-pairs identified as the sum of PEC/JN-Best and MIxy/JN-Best methods, which are used as nucleation points in the helix extension Magenta: false
Covariation Analysis of Ribosomal RNA
PLoS ONE | www.plosone.org 10 June 2012 | Volume 7 | Issue 6 | e39383
doknots, and base pairs that begin to fold the secondary structure
into a three-dimensional structure [30].
Prediction of Base Pairs with Empirical Rules for RNASecondary Structure – Helix Extend
An assessment of the conservation diagrams of the three
primary forms of life – Bacteria, Archaea, and Eukaryotes
[http://www.rna.ccbb.utexas.edu/SAE/2B/ConsStruc/]] reveals
a significant amount of sequence conservation within each
major phylogenetic domain. Many positions in the bacterial 5S,
16S and 23S rRNA sequences analyzed in this paper that are
base paired in the comparative structure model have no
variation and no covariation, thus the rationale for the helix
extension method (see Figure 6 and 7, Table S4). However, as
the number of sequences, and the diversity among those
sequences increased, we have determined that nearly every base
pair does have a covariation for datasets that include the
Bacteria, Archaea, Eukaryotic nuclear encoded and the two
Eukaryotic organelles. For the later studies, different sets of
alignments – (1) Bacteria, (2) Archaea, (3) Eukaryotes, (4)
Bacteria, Archaea, Eukaryotic nuclear encoded, (5) nuclear
encoded Bacteria, Archaea, Eukaryotes plus their two organelles
– Mitochondria and Chloroplasts – were analyzed to identify
covariation for nearly every base pair in the 16S and 23S
rRNA structure model [6,43] [http://www.rna.ccbb.utexas.edu/
SAE/2A/nt_Frequency/BP/16S_Model].
positives in the nucleation pairs; Blue: true positive base-pairs identified with the helix-extension method; Yellow: false-positive pairs identified withthe helix-extension method. Secondary base-pairs are represented by closed circles while tertiary base-pairs are represented by open circle andhighlighted with arrows.doi:10.1371/journal.pone.0039383.g007
Figure 8. The distribution of purity score and average conservation (or informational entropy) for the two nucleotides that form abase pair in the 16S rRNA comparative structure model (A), secondary structure base pairs in crystal structure (B), and tertiaryinteractions in crystal structure (C).doi:10.1371/journal.pone.0039383.g008
Covariation Analysis of Ribosomal RNA
PLoS ONE | www.plosone.org 11 June 2012 | Volume 7 | Issue 6 | e39383
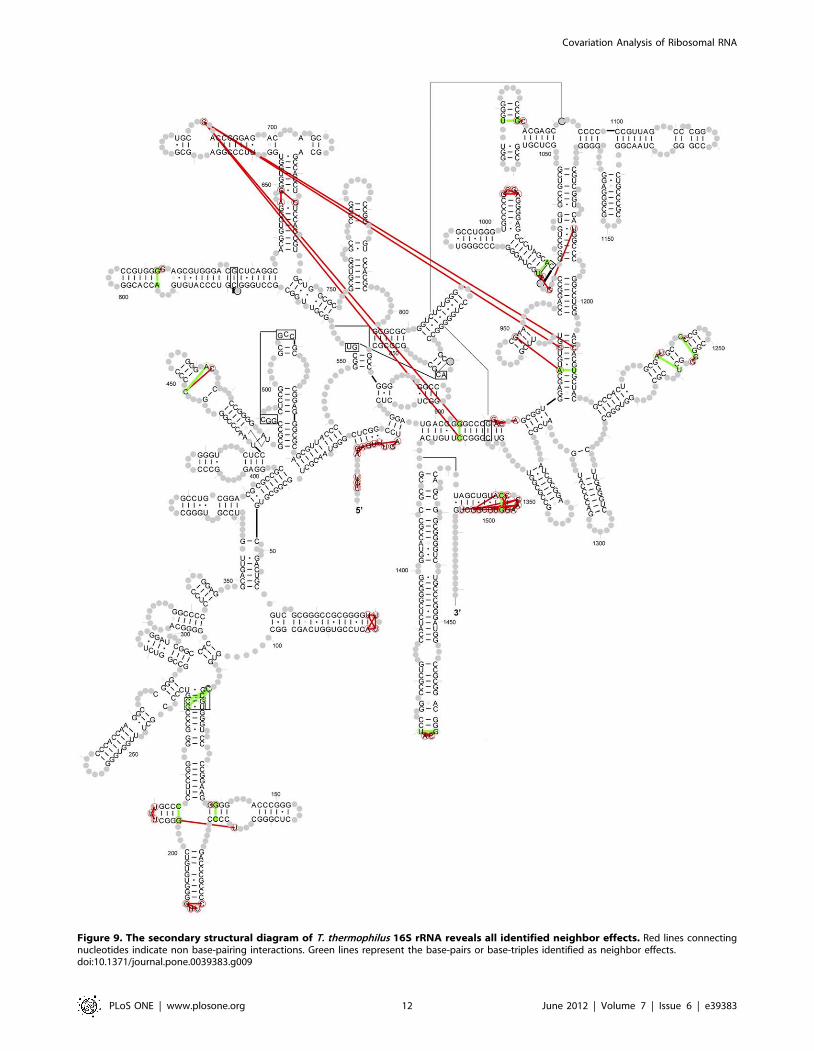
Figure 9. The secondary structural diagram of T. thermophilus 16S rRNA reveals all identified neighbor effects. Red lines connectingnucleotides indicate non base-pairing interactions. Green lines represent the base-pairs or base-triples identified as neighbor effects.doi:10.1371/journal.pone.0039383.g009
Covariation Analysis of Ribosomal RNA
PLoS ONE | www.plosone.org 12 June 2012 | Volume 7 | Issue 6 | e39383

The Purity of the Covariation between the Two Positionsthat Form a Base Pair, and the Identification NeighborEffects - Weaker Covariations between Positions that donot form a Base Pair
The purity of these covariations that underlies the prediction of
a base pair range from an absolute 1:1 relationship (ie. only base
pairs with a strict covariation are found at a specific location in the
structure, e.g. 60% G:C and 40% A:U) to base pairs with an
increase in the number and types of exceptions (e.g. 50% G:C,
30% A:U, 10% G:U, 5% A:C, 3% A:A and 2% G:G). While our
confidence in the prediction of a base pair is higher when the
covariation is very pure, the prediction of a base pair becomes
increasingly more difficult as the purity of the covariation
decreases (see Figure 8). While the pairs of positions with the
strongest covariation scores are nearly always base paired in the
RNAs higher-order structure, many base pairs have a lower
covariation score. Some of the pairs of positions with similar
covariation scores do not form a base pair. Instead due to their
close proximity in the high-resolution three-dimensional structure,
they form a neighbor effect [26,33] (see Figure 9 and Table S5).
While a complete understanding of these neighbor effects are not
known, it has been observed that some neighbor effects in tRNA
and group I introns are involved in base triple interactions [26,33]
and could be involved in the fine tuning of tRNA structure in
protein synthesis [62].
The Majority of the Nucleotides that Form Base Pairs inthe Tertiary Structure do not Covary with One Another
The prediction of an RNA structure with comparative
analysis has one primary underlying assumption – the sequences
within the same RNA family will fold into the same general
secondary and three-dimensional structure. However, while base
pairs are predicted when both positions in an alignment have
the same pattern of variation, it was implicitly assumed that the
sets of nucleotides that form each of the base pairs in an RNAs
secondary and tertiary structure will have similar patterns of
variation. Our previous analysis of the high-resolution three-
dimensional structure revealed in detail at the Gutell lab’s
Comparative RNA Web (CRW) Site [http://www.rna.ccbb.
utexas.edu/SAE/2A/nt_Frequency/BP/] and substantiated
more recently [62] that the vast majority of the sets of
nucleotides that form tertiary structure base pairs do not have
similar patterns of variation. Thus while we want to identify all
of the base pairs in an RNAs higher-order structure with
comparative analysis, the current form of covariation analysis
will not identify a high percentage of the tertiary structure base
pairs for several reasons: 1) While the different base pair types
that covary with one another can form similar conformations
when two positions in an alignment have similar patterns of
variation (e.g. G:C ,-. A:U ,-. U:A ,-. C:G; C:C ,-.
U:U; A:G ,-. G:A; etc.), base pair types that do not covary
with one another (e.g. G:A ,-. A:A) can also form a similar
conformation [33,64,65,66]. Usually the conformations of the
base pair types that do not covary with one another are unable
to form within a secondary structure helix due to their non-
helical backbone conformation. In contrast the local structure
flanking most of the tertiary structure base pairs can
accommodate the non-helical backbone conformation associated
with base pair types that do not covary with one another; 2)
Analysis of the high resolution crystal structure of different
tRNAs revealed that similar three-dimensional structures of the
tRNA form with different sets of tertiary structure interactions
[33]. Thus while sets of analogous positions in the RNAs in the
same family usually form base pairs in a secondary structure
helix, sets of analogous positions do not always form a tertiary
structure interaction; 3) Analysis of the high-resolution crystal
structures for the rRNAs during different stages of protein
synthesis reveals that the secondary structure remains the same
to a first approximation. However the ribosome, and for this
discussion, the rRNA, is dynamic. The movement is associated
with changes in the tertiary structure interaction [67].
In conclusion, we have developed a more sophisticated
phylogenetic event counting based method, utilizing the Gutell
lab’s new rCAD system. This method in combination with the
enhanced mutual information and helix extension methods creates
a suite of programs that are superior to existing programs. It has
greater sensitivity and accuracy for the identification of the
maximum number of secondary and other higher-order base pairs,
and the identification of neighbor effects.
Methods
Phylogenetic Events Counting (PEC) Method and rCADSystem
Given a set of sequences that are properly aligned to form a
high quality multiple sequence alignment (MSA) and phylogenetic
relationships between all of the sequences in the MSA, the
phylogenetic event counting (PEC) method gauges the evolution of
RNA to determine two or more positions in a sequence alignment
that have similar patterns of variation. A base pair in the RNAs
secondary structure is usually associated with the two positions
with a strong covariation. The pseudo code of the PEC algorithm
is in Figure S1. The phylogenetic relationships are obtained from
the taxonomy tree at NCBI (ftp://ftp.ncbi.nih.gov/pub/tax-
onomy/).
The nucleotides of each pair of positions are mapped onto the
phylogenetic tree according to the phylogenetic information. A
tree-traversal from leaf nodes to root counts all types of changes
throughout evolution. The NCBI tree is not a binary tree since
each node may have more than two child nodes, therefore a
standard variation of Fitch’s maximum parsimony approach
adapted for non-binary tree is used to determine the nucleotides
of ancestor nodes. The nucleotides of ancestor nodes (equality set)
are determined as the type of pair occurring most frequently in all
sequences within the sub-tree rooted at that node. Each type of
child nucleotide pair, which is different from the equality set, will
be counted as a positive event (both positions changed) or a
negative event (only one position changed) according to the
definition. To avoid bias caused by repeat sampling, each type of
child nucleotide pair will only be counted once regardless of its
number of occurrence. As a consequence, we only consider the
minimum number of variations. The Covariation Percentage of
Events (CPE) is calculated as the sum of positive events divided by
the sum of positive and negative events. High CPE score indicates
strong covariation between the two positions.
The PEC method is implemented on the Gutell lab’s RNA
Comparative Analysis Database (rCAD) system. This system stores
and cross-indexes multiple dimensions of information including
raw RNA sequence, multiple sequence alignment, structure and
phylogenetic information [40,46]. This system supports SQL
statements accessing individual rows, columns and cells in an
alignment as well as RNA structure and taxonomy information. It
provides the basis for novel analysis of the fundamental structural
characterizations of RNA, such as covariation analysis and
structural statistics at the Gutell lab’s Comparative RNA Web
(CRW) Site (http://www.rna.ccbb.utexas.edu/SAE/2D/index.
php).
Covariation Analysis of Ribosomal RNA
PLoS ONE | www.plosone.org 13 June 2012 | Volume 7 | Issue 6 | e39383

Other Covariation MeasuresStandard Mutual information (MIxy) is utilized here as a measure
for the coordinated or compensatory mutations between two
positions. It has been used in several previous studies of RNA
[24,26,38,68]. The MIxy between column x and column y in the
alignment is calculated as
MI x, yð Þ~X
M, N A, C, G, Uf gPr Mx, Ny
� �� ln
Pr Mx, Ny
� �
Pr Mxð Þ � Pr Ny
� � ð1Þ
where Pr(Mx,Ny) is the joint probability function of nucleotide M
and N from column x and y, and Pr(Mx) and Pr(Ny) is the marginal
probability for a nucleotide (M or N) in column x and y.
An advanced mutual information based method (MIp) was
presented by Dunn et al in 2008 [47]. This method estimates the
background for each pair of positions, and uses it to remove the
influence of entropy and phylogeny. The resulting corrected
mutual information (MIp) improves the base-pair identification.
We repeated the MIp calculation process described in their
research.
An independent method OMES measures the difference
between the expected and observed nucleotides frequency for a
pair of columns [48]. It is implemented using the formula:
OMES~{Px
i N0{Neð Þ2
Nt
ð2Þ
Where N0 is the observed number of di-nucleotides in a pair of
positions, Ne is the expected number, N is the total number of
possible di-nucleotide pairs, and Nt is the total number of
sequences in the alignment.
The calculation of McBASC [50] and ELSC [49] is
implemented using the code provided by the authors (http://
www.afodor.net/).
The Joint N-Best StrategyIn 1992, a simple ranking of the highest to lowest mutual
information values for tRNA revealed that the top 19 pairings are
base pairs in the tRNA secondary structure [26]. And the 20th
pairing was a tertiary base pair. However many pairings that are
not base paired in the tRNA higher-order structure have higher
mutual information values than several of the base pairs in the
tRNA secondary structure model. It was determined that the
mutual information score has an association with Shannon’s
information entropy [69]; The mutual information between two
positions is the difference between the sum of the entropies of
those two positions minus the joint entropy [http://sciencehouse.
wordpress.com/2009/08/08/information-theory/]. At one ex-
treme, a position that only has one type of nucleotide has the
minimum entropy (i.e. – highly conserved), while positions that are
highly variable (e.g. equal percentages of the four nucleotides) have
the maximum entropy. Thus the mutual information value for two
positions that have identical patterns of variation (i.e. Covariation)
is greater when the entropy value is smaller (ie. greater variation).
Thus a simple, although not the most mathematically eloquent
means to correct for this, is to determine the positions with the
highest mutual information scores, or covariation for each
individual position. This simple method, named N-Best was
utilized in 1992 to enhance the interpretation of base pairs from
the mutual information scores [26].
A variation of N-Best method, Joint N-Best, is used to determine
the pairs of nucleotides with the best covariation scores. For each
pair (X1:Y1), the N-Best score of position X1 is measured as the
ratio of the second highest covariation scores (MIxy, MIp, CPE
etc) divided by the highest covariation score in the series of pairs
(X1:Y1, X1:Y2, ……, X1:Yn ). The N-Best score of position Y1 is
measured in the same manner from the series of pairs (X1:Y1,
X2:Y1, ……, Xn:Y1 ). The pairs with both N-Best scores lower than
the predefined threshold (#0.5) will be considered as candidate
base-pairs having significant covariations.
Helix-extension StrategyOur ultimate goal is to identify every base pair in the RNAs
higher-order structure with covariation analysis. However, de-
pending on the RNA dataset, some of the nucleotides that form a
base pair might be invariant, or nearly so, and thus they cannot be
identified with covariation analysis. Our helix-extension strategy,
first implemented in 1980 [20] simply increases the length of a
putative helix with G:C, A:U, and G:U base pairs that are 1)
adjacent and antiparallel with base pairs with a significant
covariation (also referred to as a ‘‘nucleation pair’’) and 2) occur
in at least 85% of the sequences.
Calculation of Conservation Score and Purity ScoreThe conservation score for each column of the sequence
alignment is calculated with a variation of the Shannon equation,
C~X
Pi � log2 4 � Pið ÞzPD � log2PD ð3Þ
where Pi is the frequency of occurrence of base i at a given column
and PD is the frequency of deletions (gaps) at that column [6].
The purity score measures the extent that each nucleotide – A, U,
C, and G, is only associated with one other nucleotide. For
example, the following sets of paired nucleotides have the highest
purity score –100%: {A:A; G:G; C:C; and U:U}; {A:U; G:C; U:A;
C:G}; {A:U; G:G}; {A:A; G:G}; {A:G; G:A}; {A:C; G:U}. The
set {A:U; G:C; G:U; and C:G} would have a lower purity score
since G is associated with C and U, and the set {A:A, A:G; A:C;
and A:U} would have the lowest purity score since A is associated
with four different nucleotides. The first group of examples with
100% purity has several sets of perfect covariations, the second
lower purity score has a few covariations with one anomaly, while
the last set with the lowest purity score has no covariations. Using
the procedure described in the Figure S7 that defines the list of
base pair types that have a covariation with one another the purity
score is the sum of the ranked percentages of base-pairs that have a
covariation with the other base pairs. An example showing each
step in the calculation of the purity score for two columns in the
sequence alignment is presented in Figure S7. When only the
overall frequencies of the base pairs are considered, a G:U base
pair is not a covariation when the same two positions have a
higher percentage of A:U and G:C base pairs. However, since
G:U base pairs, also called the wobble base pair [70] occur within
a regular helix, a GU-Plus purity score is calculated with a slightly
modified procedure; The base pairs G:U (or U:G) are counted as a
covariation with G:C (or C:G) and A:U (or U:A) for all of the
known base pairs in Figure 8 right side.
Identification of ‘‘Neighbor Effects’’ and Physical DistanceCalculation
The ‘‘neighbor effects’’ are identified with the standard one-
directional N-Best method with some constraints. Our objective
here is to identify pairs that have not already been identified as
a potential base pair, but those pairs that still have a significant
covariation. Those pairing are not necessarily indicative of a
Covariation Analysis of Ribosomal RNA
PLoS ONE | www.plosone.org 14 June 2012 | Volume 7 | Issue 6 | e39383
base pair, instead they comprise a constraint on the evolution of
a set of nucleotides. For a pair (X1, Y1), the N-Best score is
calculated as the ratio of the two highest CPE scores in the
series of pairs (X1:Y1, X1:Y2, ……, X1:Yn ). This analysis is
composed of three steps. The pairs with: 1) N-Best scores
exceeding the predefined threshold (0.85); 2) Covariation score
(CPE) higher than a predefined lowest cutoff (25%); 3) Total
events (positive plus negative) higher than a minimum event
threshold, will be considered as neighbor effects.
When the covariation score (CPE) is low (for example pairs with
CPE ,20%), the background noise could interfere with the signal
severely. To remove this noise, only those pairs with a CPE score
higher than a predefined lowest cutoff value (25%) will be
considered as neighbor effects. The total events threshold is the
minimum number of changes at the pair of positions during the
evolution of the RNA.
For all neighbor effects, the atomic level physical distance
between the atoms are estimated from the three-dimensional high-
resolution crystal structure (16S rRNA:,PDBID 1J5E; 5S and 23S
rRNA: PDBID 2AW4). The physical distance between two
nucleotides is calculated as the Euclidean distance between the
centers of atoms that usually form the hydrogen bonds in two
nucleotides that are base paired (equation 4).
Dist~
ffiffiffiffiffiffiffiffiffiffiffiffiffiffiffiffiffiffiffiffiffiffiffiffiffiffiffiffiffiffiffiffiffiffiffiffiffiffiffiffiffiffiffiffiffiffiffiffiffiffiffiffiffiffiffiffiffiffiffiffiffiffiffiffiffiffiffi�xx1{�xx2ð Þ2z �yy1{�yy2ð Þ2z �zz1{�zz2ð Þ2
qð4Þ
Dataset and Filtration ProcessThe Multiple Sequence Alignments (MSA) of bacterial 16S
rRNA (Dataset S1), 5S rRNA (Dataset S2) and 23S rRNA
(Dataset S3) are used in this analysis. Considering a MSA
consisting of m columns and n rows, the total number of pairwise
comparison is N*(N-1)/2 and the time complexity of the PEC
algorithm is in the order of O(m2n).
Positions that have similar conservation values (Shannon’s
information entropy) have the potential to have a higher mutual
information score (Figure S5). Thus, the number of pairwise
comparison calculations can be reduced significantly by analyzing
only those sets of positions with similar conservation values. A
coarse filter based on relative conservation score and the mutual
information measurement is applied to eliminate the comparisons
between two columns in the alignment that will have an
insignificant covariation score, which will significantly reduce the
computational time for this step of the analysis. The PEC analysis
was only performed on those pairwise sets of nucleotides with: 1)
the relative entropy score lower than a predefined threshold (0.2)
and 2) mutual information value between column X and column Y
are among the top 100 of (Column X : any other column) and (any
other column : Column Y) [46]. For 16S rRNA, this coarse filter
helps to reduce the total of approximately 5,234,230 pairwise
comparisons to 14,276 pairings. This smaller number of pairings is
analyzed with the PEC method (A complete list in Table S2). The
same filtration procedure is applied in processing the 5S rRNA
and 23S rRNA data sets.
Among the 608 base pairs (both secondary and tertiary base
pairs) in the T. thermophilus 16S rRNA high resolution crystal
structure, 218 are eliminated in the coarse filter. Almost all of these
eliminated base pairs have weak covariations, while only 1 of them
can be identified with the PEC/JN-Best. Thus the coarse filter
effectively decreases the computational cost by a factor of over 300
with a minor decrease in sensitivity.
Supplemental MaterialAll supplemental figures and tables are also available online at:
http://www.rna.ccbb.ute-xas.edu/SIM/4A/Phylogenetic_Event_
Counting/.
Supporting Information
Figure S1 Pseudo code of phylogenetic event countingalgorithm.
(EPS)
Figure S2 Variation/covariation analysis of the second-ary structure of the bacterial 16S rRNA sequencealignment. Total variation in each pairwise set of sequences (X-
direction) is plotted vs. (1) the amount of variation in that set of
sequences for the two positions that are base paired in the secondary
structure (blue), (2) only one position of the two that are base paired
in the secondary structure (red), and (3) variation in the unpaired
region of the second structure (green) (Y-direction). The slope, Y-
intercept, and R2 co-efficiency values of the linear regression line for
each of the three analyses are at the right side of the line.
(EPS)
Figure S3 Graphical representation of N-Best method.While the mutual-information (MIxy) covariation method compares
all positions against all other positions, the N-best method ranks
covariation scores for two positions for each individual position. The
position numbers are in the X-axis and the MIxy values are in the
Y-axis. (A) Left: The MIxy scores for position 3 with all 76 positions
in tRNA; Right: The MIxy values for position 13 with all 76
positions are also displayed in the right side with the same manner.
(B) Each nucleotide position in a tRNA is shown in the X-axis while
the MIxy score are displayed in the Y-axis. The vertical bar is the
MIxy value for position Z and each of the individual positions in the
X-axis. When the positions with the best covariation scores for each
position are base paired in the tRNA structure, that vertical bar is
shown in red. The positions with lower MIxy values are shown as
black vertical lines. This diagram illustrates that the majority of all
positions that are base paired has a MIxy value significantly higher
than the MIxy value for all of the other positions.
(EPS)
Figure S4 The secondary (A) and three-dimensionalstructure (B) of S. cerevisiae Phe tRNA with neighboreffect identified in 1992.
(EPS)
Figure S5 The underlying principle of coarse filter thatreduce the number of pairwise comparison. (A) The
conservation scores for all nucleotides that are base paired in the
16S rRNA comparative structure model. Each base pair is
represented with a colored circle, where the color indicates the
purity score (minimal value: 0.472; maximum value: 1). The vast
majority of the dots representing base pairs are close to the diagonal.
(B) The conservation scores for each nucleotide position from 138
to 205 which is under the shadow on the entire Escherichia coli 16S
rRNA secondary structure (right). The red and blue lines indicate
the outer and inner boundaries of the helices respectively while grey
lines connect the positions that form a base pair.
(EPS)
Figure S6 Base pairs in the Bacterial 16S rRNAstructure model that are identified with the helixextension method using different nucleation pairs. Red:
true positive base-pairs identified in Joint N-Best method, which
are used as nucleation points in the helix extension Magenta: false
positives in the nucleation pairs; Blue: true positive base-pairs
Covariation Analysis of Ribosomal RNA
PLoS ONE | www.plosone.org 15 June 2012 | Volume 7 | Issue 6 | e39383
identified with the helix-extension method; Yellow: false-positive
pairs identified with the helix-extension method. Secondary base-
pairs are represented by closed circles while tertiary base-pairs are
represented by open circle and highlighted with arrows. (A) Using
pairs identified in PEC/JN-Best as the nucleation pairs. (B) Using
pairs identified in MI/JN-Best as the nucleation pairs.
(EPS)
Figure S7 Example of the determination of a purityscore. For a given pair of positions in the alignment, all base-pair
types are ranked by their frequency, from the highest to the lowest
as shown in the middle. Starting from the highest ranked base-pair
type, each base-pair type is processed to determine if both
positions change (ie. covariation). The sum of the percentages of
the base pair types that are a covariation (red circles) are calculated
as the purity score for this set of positions. The base pairing
frequency matrix is rearranged during this process. The most
frequent nucleotides are first placed as the top 39 nucleotide and
leftmost 59 nucleotide. Subsequently the 59 and 39 nucleotides that
form a covariation pair are placed in descending order, resulting in
the placement of the base pairs that covary along a diagonal.
(EPS)
Figure S8 The maximal distance between the positionsdefined to be a neighbor effect is determined from acomparison of the number of phylogenetic events.Different phylogenetic events and their number of positions with
different physical distances were calculated. Those positions with
at least 10 phylogenetic events contain a large number of positions
that are very close in three-dimensional space and a very small
number of positions with larger physical distances.
(EPS)
Table S1 The phylogenetic distribution and sequencesimilarities of the 16S, 5S and 23S rRNA datasets used inanalysis.(XLS)
Table S2 Detail information about all 14276 pairs ofcolumns process in Phylogenetic Event Counting analy-sis on 16S rRNA data set.
(XLS)
Table S3 The unique and common pairs identified byPEC/JN-Best, MIxy/JN-Best and MIp/JN-Best using the16S, 5S and 23S rRNA data sets.
(XLS)
Table S4 The complete list of nucleation pairs andextended pairs involved in the Helix Extension analysison the 16S, 5S and 23S rRNA data sets.
(XLS)
Table S5 A complete list of neighbor effects identifiedwith our analysis.
(XLS)
Table S6 The evaluation of the ‘‘new putative interac-tions in 16S Rrna’’ discovered by 2 other groups.
(XLS)
Dataset S1 The bacterial 16S rRNA sequence align-ment.
(FASTA)
Dataset S2 The bacterial 5S rRNA sequence alignment.
(FASTA)
Dataset S3 The bacterial 23S rRNA sequence align-ment.
(FASTA)
Author Contributions
Conceived and designed the experiments: LS WX SO RRG. Analyzed the
data: LS WX SO RRG. Wrote the paper: LS WX SO RRG.
References
1. Holley RW, Apgar J, Everett GA, Madison JT, Marquisee M, et al. (1965)
Structure of a ribonucleic acid. Science 147: 1462–1465.
2. Suddath FL, Quigley GJ, McPherson A, Sneden D, Kim JJ, et al. (1974) Three-
dimensional structure of yeast phenylalanine transfer RNA at 3.0 angstroms
resolution. Nature 248: 20–24.
3. Robertus JD, Ladner JE, Finch JT, Rhodes D, Brown RS, et al. (1974) Structure
of yeast phenylalanine tRNA at 3 A resolution. Nature 250: 546–551.
4. Ban N, Nissen P, Hansen J, Moore PB, Steitz TA (2000) The complete atomic
structure of the large ribosomal subunit at 2.4 A resolution. Science 289: 905–
920.
5. Wimberly BT, Brodersen DE, Clemons WM, Jr., Morgan-Warren RJ, Carter
AP, et al. (2000) Structure of the 30S ribosomal subunit. Nature 407: 327–339.
6. Cannone JJ, Subramanian S, Schnare MN, Collett JR, D’Souza LM, et al.
(2002) The comparative RNA web (CRW) site: an online database of
comparative sequence and structure information for ribosomal, intron, and
other RNAs. BMC Bioinformatics 3: 2.
7. Cate JH, Gooding AR, Podell E, Zhou K, Golden BL, et al. (1996) Crystal
structure of a group I ribozyme domain: principles of RNA packing. Science
273: 1678–1685.
8. Adams PL, Stahley MR, Kosek AB, Wang J, Strobel SA (2004) Crystal structure
of a self-splicing group I intron with both exons. Nature 430: 45–50.
9. Burke JM, Belfort M, Cech TR, Davies RW, Schweyen RJ, et al. (1987)
Structural conventions for group I introns. Nucleic Acids Res 15: 7217–7221.
10. Kazantsev AV, Krivenko AA, Harrington DJ, Holbrook SR, Adams PD, et al.
(2005) Crystal structure of a bacterial ribonuclease P RNA. Proc Natl Acad Sci
USA 102: 13392–13397.
11. Torres-Larios A, Swinger KK, Krasilnikov AS, Pan T, Mondragon A (2005)
Crystal structure of the RNA component of bacterial ribonuclease P. Nature
437: 584–587.
12. Pace NR, Smith DK, Olsen GJ, James BD (1989) Phylogenetic comparative
analysis and the secondary structure of ribonuclease P RNA–a review. Gene 82:
65–75.
13. Bessho Y, Shibata R, Sekine S, Murayama K, Higashijima K, et al. (2007)Structural basis for functional mimicry of long-variable-arm tRNA by transfer-
messenger RNA. Proc Natl Acad Sci USA 104: 8293–8298.
14. Williams KP, Bartel DP (1996) Phylogenetic analysis of tmRNA secondarystructure. RNA 2: 1306–1310.
15. Vidovic I, Nottrott S, Hartmuth K, Luhrmann R, Ficner R (2000) Crystalstructure of the spliceosomal 15.5 kD protein bound to a U4 snRNA fragment.
Mol Cell 6: 1331–1342.
16. Guthrie C, Patterson B (1988) Spliceosomal snRNAs. Annu Rev Genet 22: 387–419.
17. Hainzl T, Huang S, Sauer-Eriksson AE (2002) Structure of the SRP19 RNAcomplex and implications for signal recognition particle assembly. Nature 417:
767–771.
18. Batey RT, Rambo RP, Lucast L, Rha B, Doudna JA (2000) Crystal structure ofthe ribonucleoprotein core of the signal recognition particle. Science 287: 1232–
1239.
19. Zwieb C (1985) The secondary structure of the 7SL RNA in the signal
recognition particle: functional implications. Nucleic Acids Res 13: 6105–6124.
20. Woese CR, Magrum LJ, Gupta R, Siegel RB, Stahl DA, et al. (1980) Secondarystructure model for bacterial 16S ribosomal RNA: phylogenetic, enzymatic and
chemical evidence. Nucleic Acids Res 8: 2275–2293.
21. Noller HF, Kop J, Wheaton V, Brosius J, Gutell RR, et al. (1981) Secondary
structure model for 23S ribosomal RNA. Nucleic Acids Res 9: 6167–6189.
22. Fox GE, Woese CR (1975) 5S RNA secondary structure. Nature 256: 505–507.
23. Olsen GJ (1983) Comparative analysis of nucleotide sequence data [Ph.D.]:
University of Colorado.
24. Chiu DK, Kolodziejczak T (1991) Inferring consensus structure from nucleic
acid sequences. Comput Appl Biosci 7: 347–352.
25. Gutell RR, Weiser B, Woese CR, Noller HF (1985) Comparative anatomy of 16-S-like ribosomal RNA. Prog Nucleic Acid Res Mol Biol 32: 155–216.
26. Gutell RR, Power A, Hertz GZ, Putz EJ, Stormo GD (1992) Identifyingconstraints on the higher-order structure of RNA: continued development and
application of comparative sequence analysis methods. Nucleic Acids Res 20:5785–5795.
Covariation Analysis of Ribosomal RNA
PLoS ONE | www.plosone.org 16 June 2012 | Volume 7 | Issue 6 | e39383
27. Chargaff E (1950) Chemical specificity of nucleic acids and mechanism of their
enzymatic degradation. Experientia 6: 201–209.
28. Chargaff E (1951) Some recent studies on the composition and structure of
nucleic acids. J Cell Physiol Suppl 38: 41–59.
29. Watson JD, Crick FH (1953) Molecular structure of nucleic acids; a structure for
deoxyribose nucleic acid. Nature 171: 737–738.
30. Gutell RR, Larsen N, Woese CR (1994) Lessons from an evolving rRNA: 16S
and 23S rRNA structures from a comparative perspective. Microbiol Rev 58:
10–26.
31. Gutell RR, Woese CR (1990) Higher order structural elements in ribosomal
RNAs: pseudo-knots and the use of noncanonical pairs. Proc Natl Acad Sci USA
87: 663–667.
32. Gutell RR, Noller HF, Woese CR (1986) Higher order structure in ribosomal
RNA. EMBO J 5: 1111–1113.
33. Gautheret D, Damberger SH, Gutell RR (1995) Identification of base-triples in
RNA using comparative sequence analysis. J Mol Biol 248: 27–43.
34. Michel F, Ellington AD, Couture S, Szostak JW (1990) Phylogenetic and genetic
evidence for base-triples in the catalytic domain of group I introns. Nature 347:
578–580.
35. Conn GL, Gutell RR, Draper DE (1998) A functional ribosomal RNA tertiary
structure involves a base triple interaction. Biochem 37: 11980–11988.
36. Woese CR, Winker S, Gutell RR (1990) Architecture of ribosomal RNA:
constraints on the sequence of ‘‘tetra-loops’’. Proc Natl Acad Sci USA 87: 8467–
8471.
37. Yeang CH, Darot JF, Noller HF, Haussler D (2007) Detecting the coevolution of
biosequences–an example of RNA interaction prediction. Mol Biol Evol 24:
2119–2131.
38. Dutheil J, Pupko T, Jean-Marie A, Galtier N (2005) A model-based approach for
detecting coevolving positions in a molecule. Mol Biol Evol 22: 1919–1928.
39. Tuffery P, Darlu P (2000) Exploring a Phylogenetic Approach for the Dectection
of Correlated Substitutions in Proteins. Mol Biol Evol 17: 1753–1759.
40. Ozer S, Doshi KJ, Xu W, Gutell RR (2011) rCAD: A Novel Database Schema
for the Comparative Analysis of RNA. 7th IEEE International Conference on e-
Science.
41. Noller HF, Kop J, Wheaton V, Brosius J, Gutell RR, et al. (1981) Secondary
structure model for 23S ribosomal RNA. Nucleic Acids Res 9: 6167–6189.
42. Gutell R (1993) Comparative studies of RNA: inferring higher-order structure
from patterns of sequence variation. Curr Opin Struct Biol 3: 313–322.
43. Gutell RR, Lee JC, Cannone JJ (2002) The accuracy of ribosomal RNA
comparative structure models. Curr Opin Struct Biol 12: 301–310.
44. Brosius J, Dull TJ, Sleeter DD, Noller HF (1981) Gene organization and primary
structure of a ribosomal RNA operon from Escherichia coli. J Mol Biol 148:
107–127.
45. Schuwirth BS, Borovinskaya MA, Hau CW, Zhang W, Vila-Sanjurjo A, et al.
(2005) Structures of the bacterial ribosome at 3.5 A resolution. Science 310:
827–834.
46. Xu W, Ozer S, Gutell RR (2009) Covariant Evolutionary Event Analysis for
Base Interaction Prediction Using a Relational Database Management System
for RNA Lecture Notes in Computer Science 5566: 200–216.
47. Dunn SD, Wahl LM, Gloor GB (2008) Mutual information without the
influence of phylogeny or entropy dramatically improves residue contact
prediction. Bioinformatics 24: 333–340.
48. Kass I, Horovitz A (2002) Mapping pathways of allosteric communication in
GroEL by analysis of correlated mutations. Proteins 48: 611–617.
49. Dekker JP, Fodor A, Aldrich RW, Yellen G (2004) A perturbation-based method
for calculating explicit likelihood of evolutionary co-variance in multiplesequence alignments. Bioinformatics 20: 1565–1572.
50. Fodor AA, Aldrich RW (2004) Influence of conservation on calculations of
amino acid covariance in multiple sequence alignments. Proteins 56: 211–221.51. Jones DT, Buchan DW, Cozzetto D, Pontil M (2012) PSICOV: precise
structural contact prediction using sparse inverse covariance estimation on largemultiple sequence alignments. Bioinformatics 28: 184–190.
52. Sadowski MI, Maksimiak K, Taylor WR (2011) Direct correlation analysis
improves fold recognition. Computational Biology and Chemistry 35: 323–332.53. Bernhart SH, Hofacker IL, Will S, Gruber AR, Stadler PF (2008) RNAalifold:
improved consensus structure prediction for RNA alignments. BMC Bioinfor-matics 9.
54. Hofacker IL, Fontana W, Stadler PE, Bonhoeffer S, Tacker M, et al. (1994) FastFolding and Comparison of RNA Secondary Structures. Monatshefte f Chemie
125: 167–188.
55. Hofacker IL, Stadler PE (2006) Memory Efficient Folding Algorithms forCircular RNA Secondary Structures. Bioinformatics 22: 1172–1176.
56. Knudsen B, Hein J (1999) Using stochastic context free grammars and molecularevolution to predict RNA secondary structure. Bioinformatics 15: 446–454.
57. Knudsen B, Hein J (2003) Pfold: RNA secondary structure prediction using
stochastic context-free grammars. Nucleic Acids Res 31: 3423–3428.58. Pedersen JS, Bejerano G, Siepel A, Rosenbloom K, lindblad-Toh K, et al. (2006)
Identification and Classification of Conserved RNA Secondary Structures in theHuman Genome. PLoS Comput Biol 2: e33.
59. Marks DS, Colwell LJ, Sheridan R, Hopf TA, Pagnani A, et al. (2011) Protein3D Structure Computed from Evolutionary Sequence Variation. PLOS One 6:
e28766.
60. Weigt M, White RA, Szurmant H, Hoch JA, Hwa T (2009) Identification ofdirect residue contacts in protein-protein interaction by message passing. Proc
Natl Acad Sci U S A 106: 67–72.61. Lindgreen S, Gardner PP, Krogh A (2006) Measuring covariation in RNA
alignments: physical realism improves information measures. Bioinformatics 22:
2988–2995.62. Cochella L, Green R (2005) An active role for tRNA in decoding beyond
codon:anticodon pairing. Science 308: 1178–1180.63. Schmeing TM, Voorhees RM, Kelley AC, Ramakrishnan V (2011) How
mutations in tRNA distant from the anticodon affect the fidelity of decoding. NatStruct Mol Biol 18.
64. Gautheret D, Gutell RR (1997) Inferring the conformation of RNA base pairs
and triples from patterns of sequence variation. Nucleic Acids Res 25: 1559–1564.
65. Elgavish T, Cannone JJ, Lee JC, Harvey SC, Gutell RR (2001) [email protected]: A:A and A:G base-pairs at the ends of 16 S and 23 S rRNA helices. J Mol
Biol 310: 735–753.
66. Lee JC, Gutell RR (2004) Diversity of base-pair conformations and theiroccurrence in rRNA structure and RNA structural motifs. J Mol Biol 344: 1225–
1249.67. Schmeing TM, Ramakrishnan V (2009) What recent ribosome structures have
revealed about the mechanism of translation. Nature 461: 1234–1242.68. Buck MJ, Atchley WR (2005) Networks of coevolving sites in structural and
functional domains of serpin proteins. Mol Biol Evol 22: 1627–1634.
69. Shannon CE (1948) A Mathematical theory of communication. Bell SystemTech J 27: 379–423.
70. Crick FH (1966) Codon–anticodon pairing: the wobble hypothesis. J Mol Biol19: 548–555.
Covariation Analysis of Ribosomal RNA
PLoS ONE | www.plosone.org 17 June 2012 | Volume 7 | Issue 6 | e39383
Related Documents