Flow Modelling of Boundary Shear Stress Distribution for a Converging Compound Channel using ANSYS Shiba Shankar Satapathy ROLL NO- 711CE4006 Department of Civil Engineering Water Resource Engineering

Welcome message from author
This document is posted to help you gain knowledge. Please leave a comment to let me know what you think about it! Share it to your friends and learn new things together.
Transcript

Flow Modelling of Boundary Shear Stress Distribution for a Converging Compound Channel using ANSYS
Shiba Shankar Satapathy
ROLL NO- 711CE4006
Department of Civil Engineering
Water Resource Engineering
Introduction
• Rivers have always played an important role in the development of ancient civilization. From being used as a source of water, for obtaining food, for transport, as a defensive measure, to being the largest source of hydropower to drive machinery, Rivers have proved to be of utmost importance in our lives. In spite of this, the research growth in perceiving the hydraulic characteristics of Natural River flood plains is not satisfactory. Recent hazards and disasters clearly states that the aftermath resulting from flood can turn out to be catastrophic in nature. Therefore the flood protection methods need to be studied precisely and ahead of time in order to forecast the water levels that are the outcome of any flood discharge. Numerical analysis of compound channel flow has not been explored in the past as compared to the number of experiments that have been conducted on compound channel. Fortunately the advancement in sophisticated CFD techniques has given rise a lot more scope to the research areas in this field now. Not only CFD techniques have proved to be most economical and time saving, they also cover the aspects of flow behavior which are very difficult to determine by experimentation. A number of CFD packages such as Fluent, CFX, Star-CD are now available in market and are used for research in water flows. (Wormleaton(2005),Nguyan et al (2007), Zhang et al(2008), Shiono et al(2008)) have made a good use of these software packages for prediction of different aspects of 3D flow fields. In their work, they detected that flow characteristics in a compound channel depend on factors like topography, sinuosity, surface roughness, convergence etc.
• Despite such progress in CFD, alteration in flow behavior still remains an unresolved phenomenon. Since it’s not practically possible to predict the flow behavior from experiments, the researchers have utilized various numerical models in order to predict the flow behavior. This problem arises due to errors that are generated in numerical modeling, such as grid generation, choice of turbulence model, discretizing scheme, specifying the initial and boundary conditions etc.
• This paper highlights the flow modelling of boundary shear stress distribution for a converging compound channel which can be further used to analyse flood inundation in a river. The present work investigates effects of boundary shear stress distribution in a converging compound channel by using experimental data of a compound channel with different angles. In research the results and observations have been compared and modelled in ANSYS 15.

OBJECTIVE
• The objective of this flow modelling for converging compound channel is to find out the shear stress distribution at the walls and on the bed of converging compound channel. Various experiments are conducted in laboratory under different discharge and relative depths. These are further analysed and compared with the results of modelling in 3-Dimensional modelling software ANSYS 15.0 whose prime purpose is to obtain contours of longitudinal, lateral and resultant body shear stress for converging compound channel of 90using K-Omega model.

Selection of Study Area
Selection of Roundabout Facilities and Data Collection Procedure
Data Collection
Video Data(Traffic Flow Data)Geometric Features
Calibration of the modelPerformance Measures:(Degree of Saturation, Delay, Queue
Estimation)Compute capacity and LOS for RoundaboutsValidity of the model
Summary, Conclusion and Scope for future
OVERALL FRAMEWORK OF THE STUDY

LITERATURE REVIEW

Author Year RemarkJames & Brown
1977 They worked on three different skew angle of 7.2°, 11.0° and 24.0° and concluded that resistance to the flow increased with the skew angle and also explained the flow on the expanding floodplain accelerated while the flow on the converging floodplain decelerated.
Johnson et.al 1989 He investigated on attached flow in diffuser with small divergence angle. He concluded that for a diffuser half angle of less than 5o, the density current remains attached to both walls in a diffuser with horizontal bottom. He also concluded that if the densimetric Froude number is less than 2.0, the density current does not separate from the wall at diffuser half angle as large as 40o.
Elliott & Sellin 1990 Further skewed channel experiments were done at the Flood Channel Facility (FCF) by researchers Elliott & Sellin (1990), with three different skew angle of 2.1°, 5.1° and 9.2°.
Elliott 1990 He carried out further work at the Flood Channel Facility in the UK as part of the Series- A experiments on straight channels. He carried out detailed measurements of velocity, boundary shear stress and direction of flow.
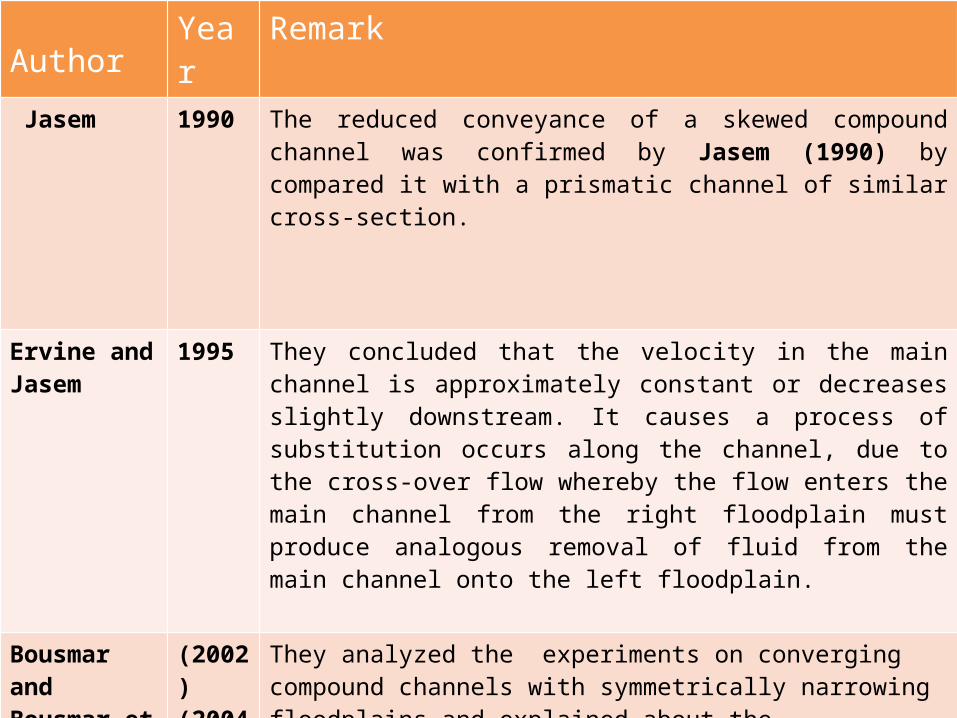
Author Year Remark Jasem 1990 The reduced conveyance of a skewed compound channel was
confirmed by Jasem (1990) by compared it with a prismatic channel of similar cross-section.
Ervine and Jasem
1995 They concluded that the velocity in the main channel is approximately constant or decreases slightly downstream. It causes a process of substitution occurs along the channel, due to the cross-over flow whereby the flow enters the main channel from the right floodplain must produce analogous removal of fluid from the main channel onto the left floodplain.
Bousmar and Bousmar et al.
(2002)(2004)
They analyzed the experiments on converging compound channels with symmetrically narrowing floodplains and explained about the geometrical momentum transfer and the associated additional head loss due to symmetrically narrowing floodplains. They also estimated the additional head loss due to the mass transfer.
Bousmar et al. 2004 He also executed an additional investigations by using digital imaging to record surface velocities and horizontal turbulent structures that generally develop in prismatic channels.

Author Year RemarkKimber 1980 He designed the most efficient roundabout model for the capacity
estimation . The basic principle of this model was the empirical analysis to determine the capacity of the roundabout. The various parameters used to design this model include central island diameter, entry width, flaring, entry angle, approach half width and entry radius. The reliability percentage of this model is very high as the empirical equations are still applicable in the present traffic scenario.
Troutbeck 1986 Queueing theory has also been used to estimate delay at unsignalized intersections. He applied the Pollaczek-Khintchine formula from queueing theory to estimatedelay at minor approaches.
Stuwe 1991 developed a formula for calculating the capacity of roundabouts. These formulae were developed by use of an empirical procedure and regression techniques. Therefore, traffic flow at several roundabouts was observed and recorded by video equipment. Based on the assumption that the entry flow was saturated, traffic flow of entering and circulating vehicles were analyzed and counted in 1 minute intervals. Based on these data samples, a provisory formula has been developed for the prediction of roundabout capacity.
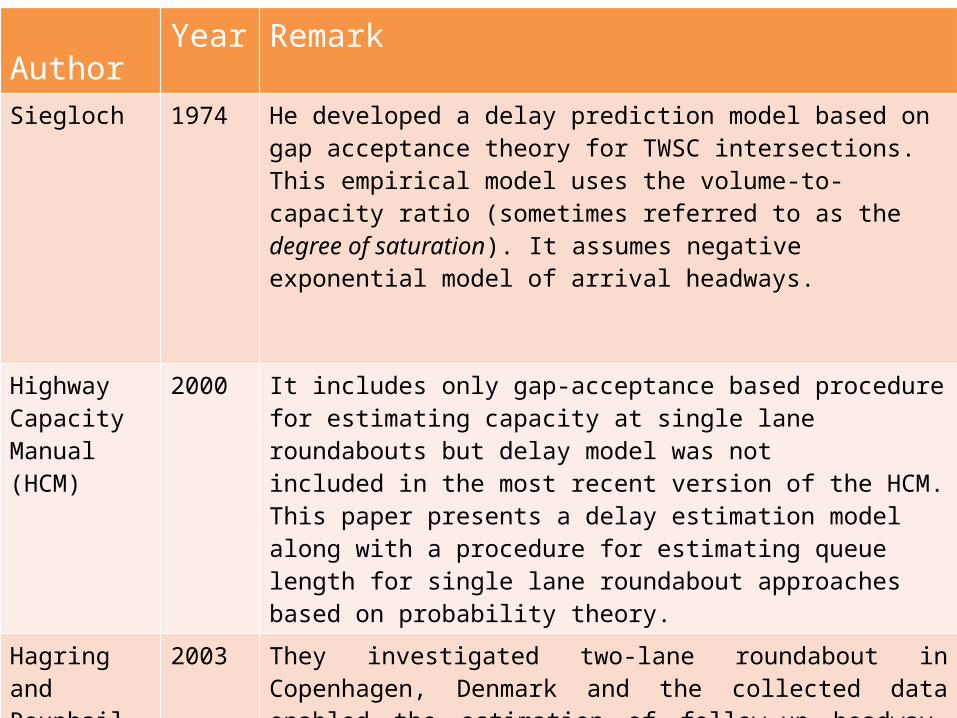
Author Year RemarkSiegloch 1974 He developed a delay prediction model based on gap acceptance
theory for TWSC intersections. This empirical model uses the volume-to-capacity ratio (sometimes referred to as the degree of saturation). It assumes negative exponential model of arrival headways.
Highway Capacity Manual (HCM)
2000 It includes only gap-acceptance based procedure for estimating capacity at single lane roundabouts but delay model was notincluded in the most recent version of the HCM. This paper presents a delay estimation model along with a procedure for estimating queue length for single lane roundabout approaches based on probability theory.
Hagring and Rouphail
2003 They investigated two-lane roundabout in Copenhagen, Denmark and the collected data enabled the estimation of follow-up headway, critical gap, and delay and entry capacity. The basic objective of this research was the evaluation of the need for more complex capacity models than existing currently in order to properly represent gap acceptance behavior of driver at multilane roundabouts. This approach requires the independent evaluation of the circulating- lane headways and critical gaps and not to superpose in a single traffic stream unlike most current capacity guides assume. This implies that the origin and destination of the flow comprising the circulating traffic must be accounted for capacity estimation.

Author Year RemarkHighway Capacity Manual
2010 It gives a new model for determining entry capacity of single lane and multi-lane roundabouts. It is developed using the field measured parameter values on the early Seigloch model form. One of the main strength of this model is that it is developed using significant quantity of data collected from 40 roundabouts in USA. As known this model is a simple, yet a globally accepted one. It uses a combination of lane-based regression and gap acceptance theory to determine the entry capacities. As the model specifies, a local calibration needs to be done for the better prediction of the capacities. This local calibration is mainly done using the measured gap acceptance parameters.
Wang and Yang
2012 He estimated the capacity of a roundabout by modelling weaving gap acceptance at weaving section of 21 roundabouts at Beijing. The research demonstrated that capacity estimates with weaving section vehicles result in improved prediction of the actual capacity of a roundabout.
Hellinga and Alaa Sindi
2012 It is based on gap acceptance and queuing models and explicitly estimates delays for each of the four sources for each origin–destination movement in the roundabout. The proposed model is evaluated for a typical single-lane roundabout by comparing the model estimates with estimates obtained from the VISSIM simulation model and the Highway Capacity Manual (HCM) method for a range of traffic and pedestrian volumes.

Roundabout AnalysisMethodology
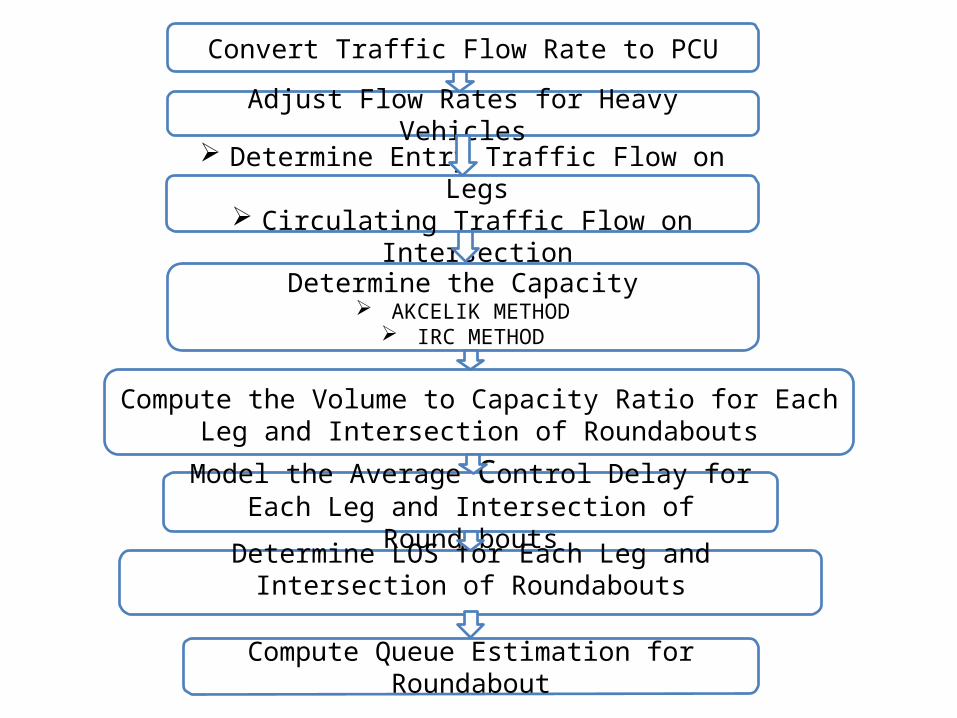
Convert Traffic Flow Rate to PCU
Adjust Flow Rates for Heavy Vehicles
Determine Entry Traffic Flow on Legs Circulating Traffic Flow on Intersection
Determine the Capacity AKCELIK METHOD
IRC METHOD
Compute the Volume to Capacity Ratio for Each Leg and Intersection of Roundabouts
Model the Average Control Delay for Each Leg and
Intersection of Roundabouts
Determine LOS for Each Leg and Intersection of Roundabouts
Compute Queue Estimation for Roundabout

AKCELIK METHOD
• Average durations of block and unblock periods (seconds) is given by
= 1/λ λ= Model ParameterФ=Proportion of free unblocked vehiclesΔ=Average minimum headway
• Average gap acceptance cycle time is given byC = • Unblocked time ratio is given byu = g/c = (1−+0.5𝑡f)
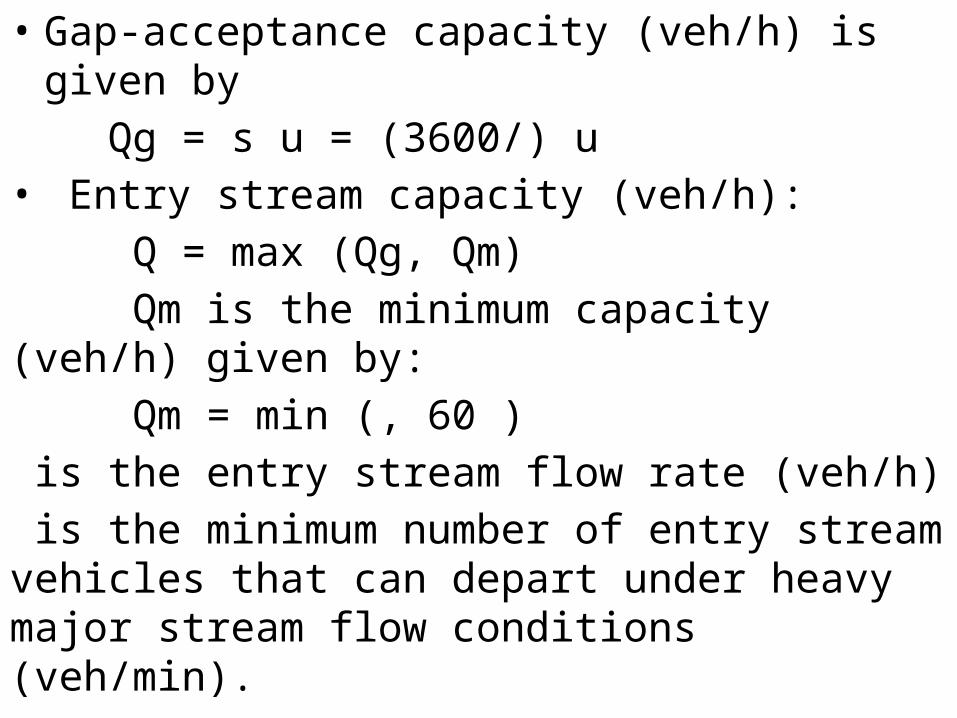
• Gap-acceptance capacity (veh/h) is given by Qg = s u = (3600/) u• Entry stream capacity (veh/h): Q = max (Qg, Qm) Qm is the minimum capacity (veh/h) given by: Qm = min (, 60 ) is the entry stream flow rate (veh/h) is the minimum number of entry stream vehicles that can depart under heavy major stream flow conditions (veh/min).

DATA COLLECTION

Instruments For Data Collection
Video CameraTripod Stand
Measuring Tape

Data Collection SitesData Collection from the following sites were taken from Chandigarh
Signalised
• Sector 17 Bus Stop,Chandigarh• Kishan Bhawan Chowk,Chandigarh• Junction 51,Chandigarh• Junction 59,Chandigarh
Un Signalised
• Sector 42 Chowk,Chandigarh• Sector 44 Chowk,Chandigarh• Junction 49,Chandigarh
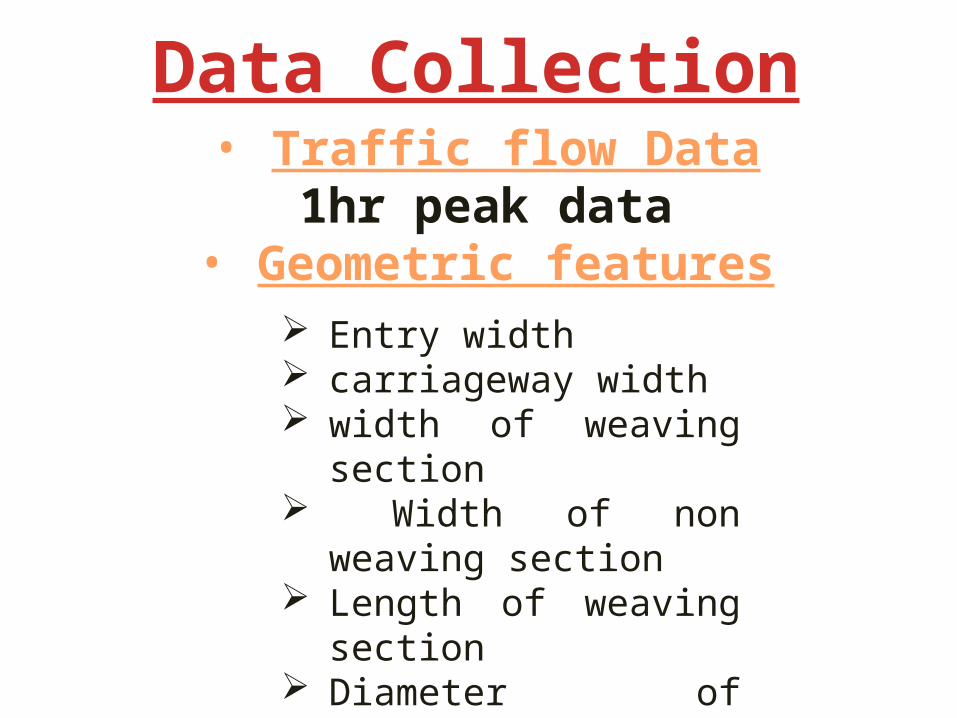
Data Collection• Traffic flow Data
1hr peak data• Geometric features Entry width carriageway width width of weaving section Width of non weaving
section Length of weaving section Diameter of Central Island
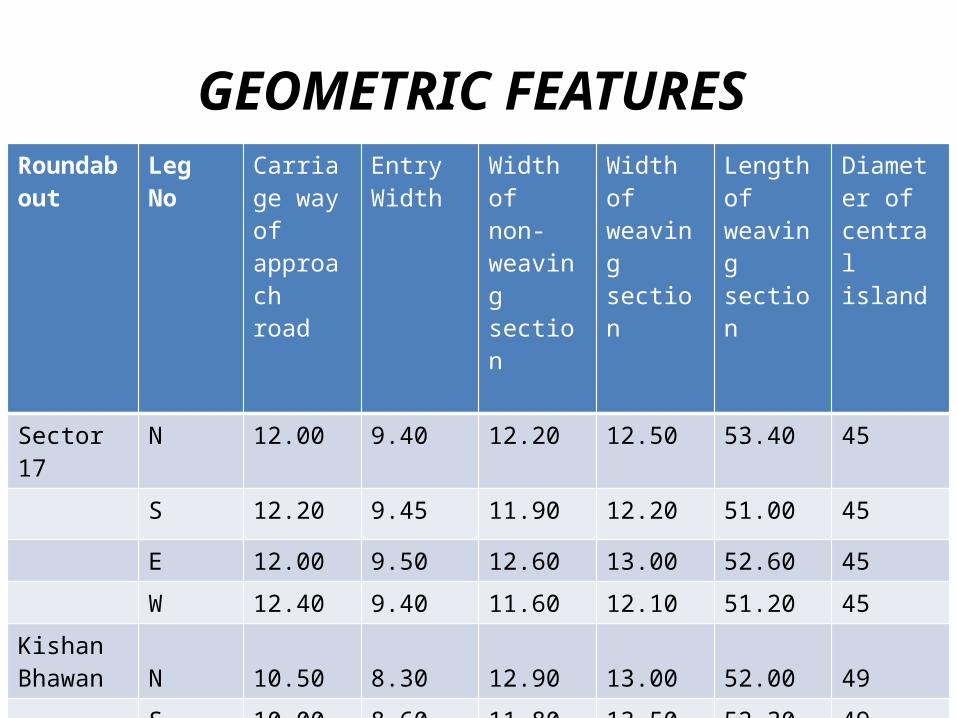
GEOMETRIC FEATURES Roundabout
Leg No Carriage way of approach road
Entry Width
Width of non-weaving section
Width of weaving section
Length of weaving section
Diameter of central island
Sector 17 N 12.00 9.40 12.20 12.50 53.40 45
S 12.20 9.45 11.90 12.20 51.00 45
E 12.00 9.50 12.60 13.00 52.60 45
W 12.40 9.40 11.60 12.10 51.20 45
Kishan Bhawan N 10.50 8.30 12.90 13.00 52.00 49
S 10.00 8.60 11.80 13.50 52.30 49
E 10.00 8.20 11.30 14.00 51.60 49
W 10.00 8.50 10.90 13.80 52.50 49
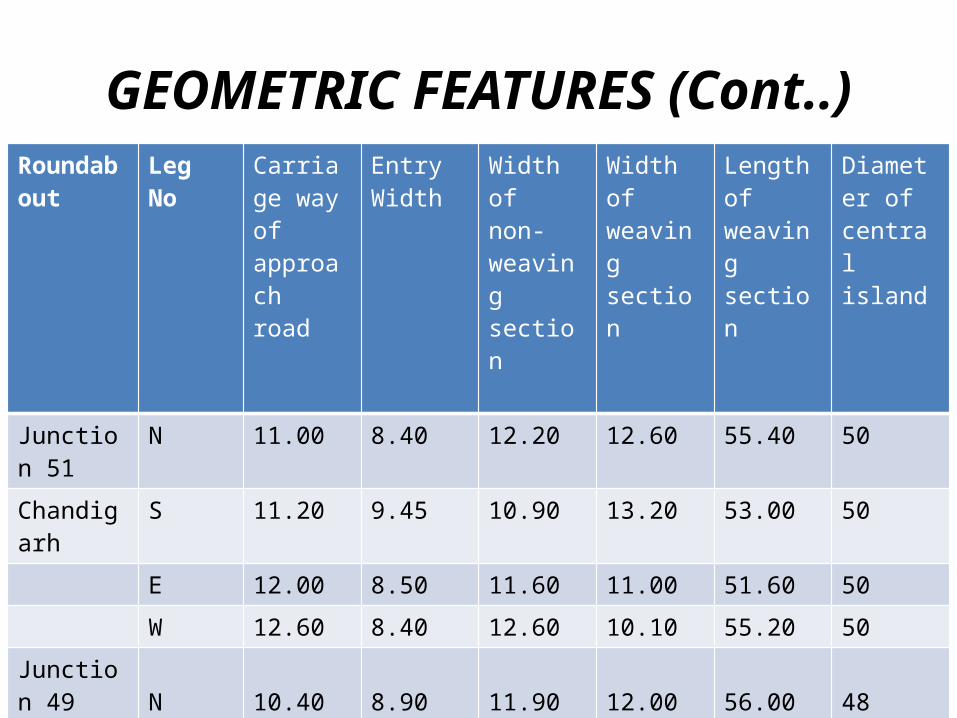
GEOMETRIC FEATURES (Cont..)Roundabout
Leg No Carriage way of approach road
Entry Width
Width of non-weaving section
Width of weaving section
Length of weaving section
Diameter of central island
Junction 51 N 11.00 8.40 12.20 12.60 55.40 50
Chandigarh S 11.20 9.45 10.90 13.20 53.00 50
E 12.00 8.50 11.60 11.00 51.60 50
W 12.60 8.40 12.60 10.10 55.20 50
Junction 49Chandigarh N 10.40 8.90 11.90 12.00 56.00 48
S 10.00 8.40 12.80 11.50 58.30 48
E 10.60 8.20 11.30 13.00 51.60 48
W 11.00 9.20 12.90 12.80 58.50 48
Results and Analysis
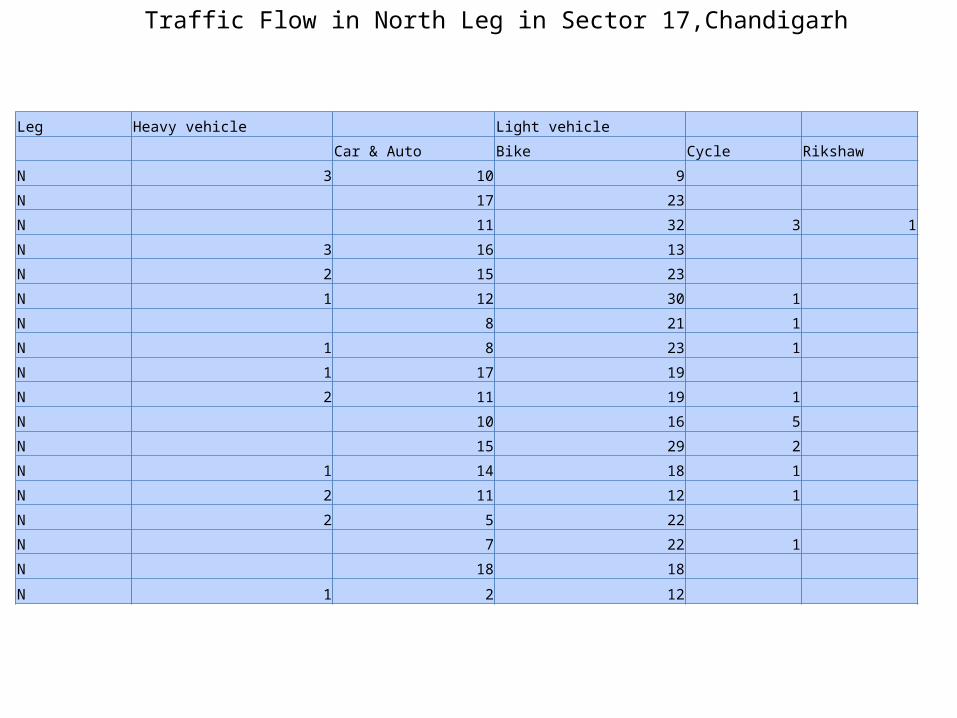
Traffic Flow in North Leg in Sector 17,Chandigarh
Leg Heavy vehicle Light vehicle
Car & Auto Bike Cycle Rikshaw
N 3 10 9
N 17 23
N 11 32 3 1
N 3 16 13
N 2 15 23
N 1 12 30 1
N 8 21 1
N 1 8 23 1
N 1 17 19
N 2 11 19 1
N 10 16 5
N 15 29 2
N 1 14 18 1
N 2 11 12 1
N 2 5 22
N 7 22 1
N 18 18
N 1 2 12

Traffic Flow in South Leg in Sector 17,Chandigarh
Time (min) Leg Heavy vehicle Light vehicle
Car & Auto Bike Cycle Rikshaw
(0-1) S 2 9 22 2
(1-3) S 14 35 2
(3-5) S 24 30 2
(5-7) S 1 13 29 1
(7-9) S 2 15 30 2
(9-11) S 25 27 1
(11-13) S 15 31 1
(13-14) S 20 20 3
(14-16) S 20 24 1
(16-18) S 8 17 5
(18-20) S 1 18 40 2
(20-22) S 14 25 1
(22-23) S 13 26
(23-25) S 1 13 16 3
(25-27) S 1 17 24 1
(27-29) S 2 11 23 4
(29-31) S 12 24 1
(31-32) S 9 27 3
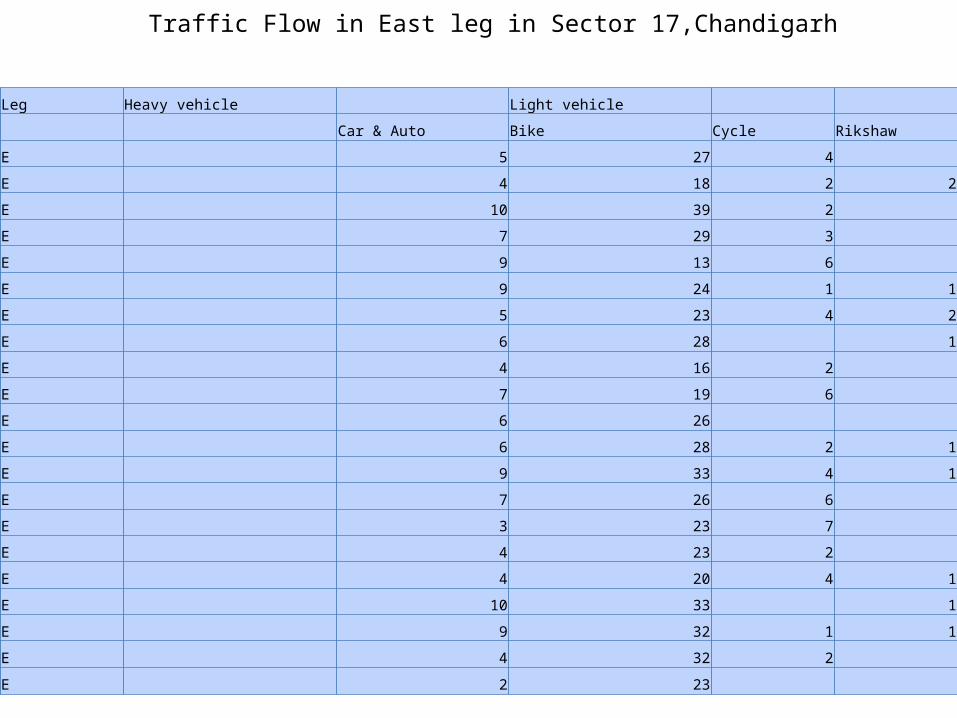
Traffic Flow in East leg in Sector 17,Chandigarh
Leg Heavy vehicle Light vehicle
Car & Auto Bike Cycle Rikshaw
E 5 27 4
E 4 18 2 2
E 10 39 2
E 7 29 3
E 9 13 6
E 9 24 1 1
E 5 23 4 2
E 6 28 1
E 4 16 2
E 7 19 6
E 6 26
E 6 28 2 1
E 9 33 4 1
E 7 26 6
E 3 23 7
E 4 23 2
E 4 20 4 1
E 10 33 1
E 9 32 1 1
E 4 32 2
E 2 23
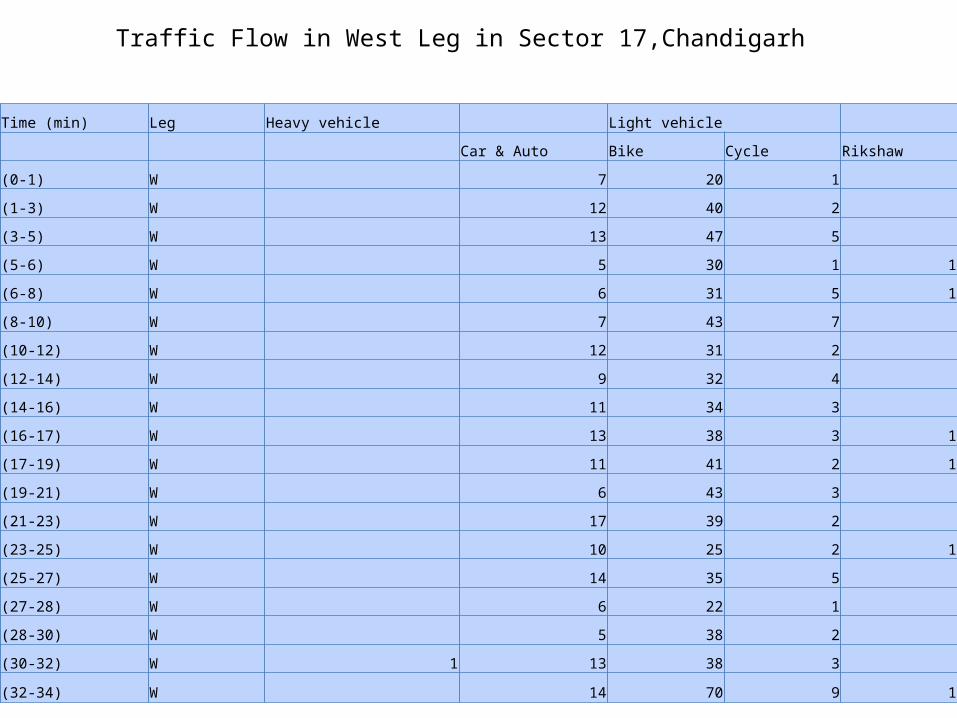
Traffic Flow in West Leg in Sector 17,Chandigarh
Time (min) Leg Heavy vehicle Light vehicle
Car & Auto Bike Cycle Rikshaw
(0-1) W 7 20 1
(1-3) W 12 40 2
(3-5) W 13 47 5
(5-6) W 5 30 1 1
(6-8) W 6 31 5 1
(8-10) W 7 43 7
(10-12) W 12 31 2
(12-14) W 9 32 4
(14-16) W 11 34 3
(16-17) W 13 38 3 1
(17-19) W 11 41 2 1
(19-21) W 6 43 3
(21-23) W 17 39 2
(23-25) W 10 25 2 1
(25-27) W 14 35 5
(27-28) W 6 22 1
(28-30) W 5 38 2
(30-32) W 1 13 38 3
(32-34) W 14 70 9 1

Scope for Future Work
Data are to be extracted for several Signalized Roundabouts in Indian cities for comparison of the Performance Measures.
Develop a new DELAY model to satisfy the Indian traffic conditions.
Speed Data are to be required for Delay and Queuing analysis.
Validation of the model are to be done for measuring the Delay and LOS analysis.
REFERENCES• Mereszczak, Y., M. Dixon, M. Kyte, L. Rodegerdts, and M. Blogg,
(2006), “Including Exiting Vehicles in Capacity Estimation at Single-Lane U.S. Roundabouts”, Transportation Research Record: Journal of the Transportation Research Board, No. 1988, pp. 23–30.
• Bie, J., Lo, H.K., Wong, S.C.(2010), “Capacity evaluation of multi-lane traffic roundabout”, Journal of advanced transportation,vol.44(4),pp.245-255.
• Gagnon,C., A. W. Sadek, A. Touchette, and M. Smith(2008), “Calibration Potential of Common Analytical and Microsimulation Roundabout Models”, Journal of the Transportation Research Board, No. 2071,2008, pp. 77–86.
• INTERNET
THANK YOU
Related Documents