Guiding Producers Today to Feed the World Tomorrow. WARDGUIDE brought to you by: WARD Laboratories, Inc. 4007 Cherry Ave, P.O. Box 788 Kearney, NE 68848 1-800-887-7645 www.wardlab.com

Welcome message from author
This document is posted to help you gain knowledge. Please leave a comment to let me know what you think about it! Share it to your friends and learn new things together.
Transcript

Guiding Producers Today to Feed the World Tomorrow.
WARDGUIDE brought to you by:
WARD Laboratories, Inc. 4007 Cherry Ave, P.O. Box 788 Kearney, NE 68848 1-800-887-7645 www.wardlab.com

Table of Contents › ii
Good Day from Ward Laboratories!
Thank you for reading our handy reference book, WARDGUIDE. We trust you will use
it often in the day-to-day operation of your agriculture business.
WARDGUIDE is designed to help answer some of your basic questions. WARDGUIDE is
produced from a variety of credible sources and our fifty plus years of experience in
providing quality agricultural testing to thousands of producers throughout the United
States. The guide is comprehensive, however, it will not answer all of your crop
production questions…but Ward Laboratories is always just a phone call away and we
are ready and willing to help you.
We have designed WARDGUIDE to be as useful to you as possible with a quick-
referencing table of contents to help locate the information you need. If you have any
questions about its usage or content, please call us at (308) 234-2418 or (800) 887-
7645 or send us a question by e-mail.
We are proud of WARDGUIDE and trust it will be a valuable asset to your operation
for years to come. Our best to you…
Sincerely yours,
Raymond C. Ward,
President Ward Laboratories, Inc.

Table of Contents › iii
CONTENTS CROP NUTRITION AND MANAGEMENT
Essential Plant Nutrient Elements ............................................................................................ 2 The Plant: Parts and Basic Functions ...................................................................................... 3 Plant Nutrient Uptake ..................................................................................................................... 4 Essential Plant Nutrients: Macronutrients ............................................................................ 5 Essential Plant Nutrients: Micronutrients ............................................................................. 8 General Outline: Nutrient Deficiency Symptoms ............................................................ 10 Seed Quality ..................................................................................................................................... 13 Effect of Tillers on Corn Yield .................................................................................................. 14
FEED TESTING
The Value of Feed Testing .......................................................................................................... 17 Feed Sampling Procedures ........................................................................................................ 17 Fractions of Feed ........................................................................................................................... 19 Nutrient Feed Tests ...................................................................................................................... 19 The pH of Feed ................................................................................................................................ 26 Energy Values .................................................................................................................................. 26 Forage Quality Indexes ............................................................................................................... 28 Near-Infrared Spectroscopy (NIRS) ...................................................................................... 29 Toxicity and Animal Health Related Tests ......................................................................... 30 Frequently Asked Questions ..................................................................................................... 33
FERTILIZER RECOMMENDATIONS
Nitrogen Fertilizer Recommendations ................................................................................ 35 Phosphorus Fertilizer Recommendations .......................................................................... 37 Potassium Fertilizer Recommendations ............................................................................. 39 Sulfur Fertilizer Recommendations ...................................................................................... 41 Zinc Fertilizer Recommendations .......................................................................................... 42 Iron Fertilizer Recommendations .......................................................................................... 43 Copper Fertilizer Recommendations .................................................................................... 44 Manganese Fertilizer Recommendations ........................................................................... 45 Lime Recommendations ............................................................................................................. 47 Magnesium Fertilizer Recommendations ........................................................................... 49 Boron Fertilizer Recommendation ........................................................................................ 50 Quantity of Plant Nutrients in Various Crops ................................................................... 52 Soil Fertility Ratings ..................................................................................................................... 53 Nitrogen and Sulfur Fertilizer Recommendation Calculations ................................. 54 Phosphorus Recommendation Calculation ........................................................................ 56 Potassium Recommendation Calculation ........................................................................... 57 Micronutrient and Lime Recommendation Calculations ............................................. 58 Fertilizer Requirements for Corn Silage .............................................................................. 61 Nitrogen Fertilizer – Use Wisely ............................................................................................. 62 Fertilizer Effectiveness and Starter Technology ............................................................. 63 Fertilizer Placement Methods .................................................................................................. 64 Fertilizing for Alfalfa .................................................................................................................... 68
SOIL TESTING
General Soil Properties ............................................................................................................... 71 Cation Exchange Capacity .......................................................................................................... 73 Soil Water .......................................................................................................................................... 75 Organic Matter ................................................................................................................................ 76

Table of Contents › iv
Soil Microorganisms ..................................................................................................................... 78 Principles of Soil pH ..................................................................................................................... 80 Soil Fertility ...................................................................................................................................... 81 Six Essential Steps for a Successful Soil Fertility Program ......................................... 82 Soil Nitrogen .................................................................................................................................... 83 Soil Phosphorus .............................................................................................................................. 86 Soil Potassium ................................................................................................................................. 88 Soil Sulfur .......................................................................................................................................... 90 Soil Zinc .............................................................................................................................................. 92 Collecting Representative Soil Samples............................................................................... 93 Soil Test Calibration ..................................................................................................................... 94 Expression of Yield Responses ................................................................................................ 95 Soil Test Methods: Nitrate ......................................................................................................... 96 Soil Test Methods: Phosphorus ............................................................................................... 97 Soil Test Methods: Potassium .................................................................................................. 99 Soil Test Methods: Sulfur ........................................................................................................ 100 Soil Test Methods: Zinc, Iron, Manganese and Copper .............................................. 101 Soil Test Methods: Calcium and Magnesium .................................................................. 102 Salt Affected Soil ......................................................................................................................... 103
SOIL HEALTH
The History .................................................................................................................................... 109 The Relationship Between Plants and Soil Microbial Life ........................................ 109 Principles of Soil Health ........................................................................................................... 110 Haney Test ..................................................................................................................................... 112 PLFA ................................................................................................................................................. 113 Enzymes .......................................................................................................................................... 114 Available Water Hold Capacity ............................................................................................. 114
PLANT TESTING
Plant Analysis – Introduction ................................................................................................ 116 Plant Analysis – Sampling ....................................................................................................... 117 Interpretation of Plant Analysis: Corn .............................................................................. 118 Interpretation of Plant Analysis: Soybeans..................................................................... 121 Interpretation of Plant Analysis: Milo ............................................................................... 122 Interpretation of Plant Analysis: Wheat ........................................................................... 124 Interpretation of Plant Analysis: Alfalfa ........................................................................... 126 Potato Tissue Analysis ............................................................................................................. 128 Potato Nitrate Tissue Analysis .............................................................................................. 130
MANURE
The Role of Manure in Soil Nutrient Cycling .................................................................. 132 What is Compost? ....................................................................................................................... 132 Collecting Representative Samples .................................................................................... 136 Understanding Your Results .................................................................................................. 137
WATER
Irrigation Water Quality and Interpretation .................................................................. 145 Livestock Water Quality .......................................................................................................... 146 Drinking Water Suitability ..................................................................................................... 149 Drinking Water: Bacteriological Testing .......................................................................... 150 Proper Disinfection of Water Wells .................................................................................... 150 Drinking Water Sampling Procedures .............................................................................. 152
Table of Contents › v
Table of Tables
Table 1: Sources of Essential Elements for Plant Nutrients ........................................................................................................................ 2 Table 2: Essential Elements and Forms for Plant Uptake ............................................................................................................................ 3 Table 3: Interpretation of Mixer Analysis ........................................................................................................................................................ 22 Table 4: Mineral Requirements and Tolerance Levels in Livestock ..................................................................................................... 23 Table 5: Expected pH Ranges for Ensiled Feeds ............................................................................................................................................ 26 Table 6: USDA Quality Guidelines for Alfalfa .................................................................................................................................................. 28 Table 7: Relative Forage Quality Suggested for Different Cattle Types ............................................................................................... 28 Table 8: Grass Hay Quality ...................................................................................................................................................................................... 29 Table 9: NIR Recommended and Wet Chemistry Required Tests.......................................................................................................... 29 Table 10: Animal Response to Nitrate-Nitrogen Concentrations .......................................................................................................... 30 Table 11: Animal Response to Prussic Acid .................................................................................................................................................... 31 Table 12: Feeding Risks at Various Mold Spore Counts ............................................................................................................................. 32 Table 13: FDA Guidelines for Acceptable Aflatoxin Level in Corn Based on Intended Use......................................................... 32 Table 14 Available Nitrogen from a Past Legume Crop ............................................................................................................................. 35 Table 15 Available Nitrogen from Manure Application ............................................................................................................................. 35 Table 16 Nitrogen Requirements and Subsoil Factors for Various Crops .......................................................................................... 36 Table 17: Sufficiency Ranges for Phosphorus Soil Tests............................................................................................................................ 37 Table 18: Recommended Manure Application Rates for Phosphorus ................................................................................................. 37 Table 19: Phosphorus Fertilizer Recommendations for Various Crops .............................................................................................. 38 Table 20: Sufficiency Ranges for Soil Potassium Test ................................................................................................................................. 39 Table 21: Recommended Manure Application Rates for Potassium..................................................................................................... 39 Table 22: Potassium Fertilizer Recommendations for Various Crops ................................................................................................. 40 Table 23: Sulfur Recommendations for Various Crops .............................................................................................................................. 41 Table 24: Zinc Fertilizer Recommendations for Various Crops .............................................................................................................. 43 Table 25: Iron Soil Test Ratings ............................................................................................................................................................................ 44 Table 26: Copper Fertilizer Recommendations ............................................................................................................................................. 45 Table 27: Manganese Fertilizer Recommendations for Various Crops ............................................................................................... 46 Table 28: Desired pH Levels for Various Crops ............................................................................................................................................. 48 Table 29: Lime Recommendation Based on Buffer pH ............................................................................................................................... 48 Table 30: Magnesium Soil Test Ratings ............................................................................................................................................................. 49 Table 31: Magnesium Fertilizer Recommendations .................................................................................................................................... 50 Table 32: Boron Fertilizer Recommendations ............................................................................................................................................... 51 Table 33: Quantity of Plant Nutrients in Various Crops ............................................................................................................................. 52 Table 34: Soil Fertility Ratings for Soil Nutrients ......................................................................................................................................... 53 Table 35: CEC Ranges for Different Soil Textures, pH < 7.0 ..................................................................................................................... 54 Table 36: 1:1 pH Rating ............................................................................................................................................................................................ 54 Table 37: Soluble Salt Ratings ............................................................................................................................................................................... 54 Table 38: Nitrogen and Sulfur Requirements for Various Crops ........................................................................................................... 55 Table 39: Phosphorus Fertilizer Recommendations for Various Crops .............................................................................................. 56 Table 40: Potassium Fertilizer Recommendations for Various Crops ................................................................................................. 57 Table 41: Micronutrient and Lime Recommendation Factors for Various Crops ........................................................................... 60 Table 42: Phosphorus Requirements for Corn Silage ................................................................................................................................. 61 Table 43: Potassium Requirements for Corn Silage ..................................................................................................................................... 61 Table 44: Zinc Requirements for Corn Silage ................................................................................................................................................. 62 Table 45: Alfalfa Plant Nutrient Content ........................................................................................................................................................... 68 Table 46: Liming Soil for Alfalfa Production ................................................................................................................................................... 68 Table 47: Alfalfa Phosphorus Fertility ............................................................................................................................................................... 68 Table 48: Yield Loss Without Phosphorus in Alfalfa.................................................................................................................................... 68 Table 49: P2O5 Fertilizer Rates for Alfalfa ........................................................................................................................................................ 68 Table 50: P2O5 Fertilizer Cost and Return ........................................................................................................................................................ 69

Table of Contents › vi
Table 51: Alfalfa Potassium Fertility .................................................................................................................................................................. 69 Table 52: Alfalfa Yield Loss Without Potassium ............................................................................................................................................ 69 Table 53: K2O Fertilizer Rates ............................................................................................................................................................................... 69 Table 54: K2O Fertilizer Cost and Return ......................................................................................................................................................... 69 Table 55: Common CEC Ranges in Soil Texture ............................................................................................................................................. 74 Table 56: C:N Ratios of Organic Materials ........................................................................................................................................................ 79 Table 57: Effect of Carbon Dioxide Concentration on pH and Calcium Ions ..................................................................................... 81 Table 58: Range and Average Soil Test Values from Four Sites in a North Dakota Field............................................................. 93 Table 59: Phosphorus Sufficiency Levels for Mehlich P-3, Bray P-1, and Olsen P Soil Tests ..................................................... 98 Table 60: Percent Sufficiency of Soil K Tests .................................................................................................................................................. 99 Table 61: Zinc, Iron, Manganese and Copper Availability Ratings for Various Crops ................................................................. 101 Table 62: Interpreting Mg Soil Test Levels .................................................................................................................................................... 102 Table 63: Classification of Salt Affected Soils Based on Saturation Extracts ................................................................................... 104 Table 64: The Relationship Between Conductivity and Degree of Salinity ...................................................................................... 104 Table 65: Soil Respiration Ranking Table ...................................................................................................................................................... 112 Table 66: Soil Fertility Rating for Haney H3A Extraction Table ........................................................................................................... 113 Table 67: Organic C:N Ration Ranking Table ................................................................................................................................................ 113 Table 68: Procedures for Collecting Leaf and Plant Tissue for a Plant Analysis ........................................................................... 118 Table 69: Nutrient Range Descriptions for Corn ......................................................................................................................................... 118 Table 70: Corn Nutrient Ranges for Whole Plant and Ear Leaf Silking.............................................................................................. 119 Table 71: Nutrient Range Descriptions for Soybeans ............................................................................................................................... 121 Table 72: Soybean Plant Analysis Interpretation - Flowering Stage .................................................................................................. 121 Table 73: Nutrient Range Descriptions for Milo .......................................................................................................................................... 122 Table 74: Milo Nutrient Ranges for Whole Plant and 2nd Leaf .............................................................................................................. 122 Table 75: Nutrient Range Descriptions for Wheat ..................................................................................................................................... 124 Table 76: Wheat Nutrient Deficiency Ranges for Full Tiller and Head Emergence Stages ....................................................... 124 Table 77: Nutrient Range Descriptions for Alfalfa...................................................................................................................................... 126 Table 78: Alfalfa Nutrient Ranges for the Top 1/3 and Whole Plant .................................................................................................. 127 Table 79: Potato Plant Growth Stages .............................................................................................................................................................. 130 Table 80: Recommended Soil and Petiole NO3-N Concentration ......................................................................................................... 130 Table 81: Interpreting N Mineralization in Compost ................................................................................................................................ 135 Table 82: Organic N Conversion Factor for Various Manure Sources ................................................................................................ 138 Table 83: Conversion Factors for Manure Nutrients ................................................................................................................................. 138 Table 84: Average Nutrient Content of Swine Manure ............................................................................................................................. 139 Table 85: Average Nutrient Content for Beef Manure .............................................................................................................................. 140 Table 86: Average Nutrient Content for Poultry Manure ........................................................................................................................ 141 Table 87: Average Nutrient Content of Compost ........................................................................................................................................ 142 Table 88: Average Nutrient Content of Dairy Manure .............................................................................................................................. 143 Table 89: Salinity Hazard Interpretation Guide........................................................................................................................................... 145 Table 90: Interpretation of Adjusted SAR for Various Soil Types ........................................................................................................ 146 Table 91: Potential Hazards to Irrigation Water Quality ......................................................................................................................... 146 Table 92: Use of Water Containing Salt ........................................................................................................................................................... 147 Table 93: Water Hardness Guidelines ............................................................................................................................................................. 147 Table 94: Use of Water Containing Nitrates .................................................................................................................................................. 148 Table 95: Use of Water Containing Sulfate .................................................................................................................................................... 148 Table 96: Drinking Water Standards ................................................................................................................................................................ 149 Table 97: Well Water Disinfection Guidelines .............................................................................................................................................. 151

Table of Contents › vii
Table of Figures
Figure 1: Quartering a Sample (Top View) ...................................................................................................................................................... 18 Figure 2: Fractions of Feed Used in Analysis .................................................................................................................................................. 19 Figure 3: Four Relationships Between Broadcast and Band Phosphorus .......................................................................................... 67 Figure 4: The Soil Texture Triangle .................................................................................................................................................................... 72 Figure 5: CEC Exchange Sites on a Clay Particle ............................................................................................................................................ 73 Figure 6: Soil Water Potential................................................................................................................................................................................ 75 Figure 7: Microbial Activity Response to Various C:N Ratio Material .................................................................................................. 79 Figure 8: The Nitrogen Cycle ................................................................................................................................................................................. 84 Figure 9: Influence of Soil pH on Phosphorus Availability ........................................................................................................................ 87 Figure 10: Fate of Added Fertilizer P in Soil .................................................................................................................................................... 87 Figure 11: Phosphorus Fixation in Soil.............................................................................................................................................................. 87 Figure 12: A Summary of Potassium Gains and Losses .............................................................................................................................. 90 Figure 13: The Sulfur Cycle ..................................................................................................................................................................................... 91 Figure 14: Salt Tolerance of Vegetable Crops ............................................................................................................................................... 106 Figure 15: Salt Tolerance of Field Crops ......................................................................................................................................................... 106 Figure 16: Salt Tolerance of Forage Crops ..................................................................................................................................................... 107 Figure 17: Volume of Soil Water, from Kramer 1983 ................................................................................................................................ 114 Figure 18: Selecting Petioles to Sample .......................................................................................................................................................... 129 Figure 19: Removing All Leaf Tissue from the Petiole .............................................................................................................................. 129 Figure 20: Suggested Sampling Pattern for a Potato Field with Uniform Conditions ................................................................. 129 Figure 21: Phases of Composting ....................................................................................................................................................................... 134
CROP NUTRITION AND
MANAGEMENT

Raymond C. Ward, Ph.D., Certified Professional Soil Scientist
Crop Nutrition and Management › 2
Essential Plant Nutrient Elements
There are two criteria that must be met for an element to be considered essential. First, if the plant cannot complete its life cycle (i.e. form viable seed) in the total absence of that element, it is essential. Secondly, an element is essential when it can be shown that it forms part of any molecule or constituent of the plant that is essential, such an N in amino acids and proteins, or magnesium in chlorophyll.
Fourteen mineral elements are considered essential. By adding H2O and CO2 to the 14 minerals, a total of 17 are considered essential. With these elements and sunlight, a plant is able to synthesize all the needed compounds it requires to complete its life cycle. Table 1-1 lists essential plant elements.
Table 1: Sources of Essential Elements for Plant Nutrients
Macronutrients Micronutrients
From Air and Water From Soil From Soil
Hydrogen (H) Nitrogen (N) Iron (Fe)
Oxygen (O) Phosphorus (P) Manganese (Mn)
Carbon (C) Potassium (K) Boron (B)
Calcium (Ca) Molybdenum (Mo)
Magnesium (Mg) Copper (Cu)
Sulfur (S) Zinc (Zn)
Chloride (Cl)
Nickel (Ni)
Elements needed in relatively large amounts are referred to as macronutrients while those needed in smaller relative amounts are known as micronutrients, or trace elements. Micronutrients are most apt to be a problem in a) sandy soils, b) organic soils, or c) very alkaline soils. This is because of relatively small quantities of nutrients in sands and organic soils, and low availability in alkaline soils. Of the macronutrients, N, P, and K are called the primary nutrients while Ca, Mg, and S are considered secondary nutrients.
C, H, and O compose about 95% of a plant. The mineral elements are obtained naturally from the weathering of primary and secondary soil minerals, biodegradation of organic matter, and gases in the atmosphere. These natural sources are supplemented with fertilizer, manure, compost, and sludge.
Usually only a small amount of an element is available in soil solution while a large amount is adsorbed on soil particles. Availability is related to many soil factors other than total quantity.
The following is a list of the essential elements and the main forms in which they are taken up by plant roots.

Raymond C. Ward, Ph.D., Certified Professional Soil Scientist
Crop Nutrition and Management › 3
Table 2: Essential Elements and Forms for Plant Uptake
Cations Anions
Ammonium N NH4+ Nitrate N NO3-
Potassium K+ Sulfur SO4 - -
Magnesium Mg++ Chloride Cl-
Calcium Ca++ Phosphorus H2PO4-, HPO4 - -
Iron Fe++, Fe+++ Boron H3BO3
Manganese Mn++ Molybdenum Mo4O - -
Zinc Zn++
Copper Cu++
Nickel Ni++
ADDITIONAL REFERENCES:
» Barber, S.A. 1984. Soil Nutrient Bioavailability, Wiley-Interscience Publication, New York.
» Brady, N.C. 2008. The Nature and Properties of Soils, 8th edition. Macmillan Publishing Company, Inc., New York.
» Havlin, J.L., Benton, J.D., Tisdale, S.L. and Nelson, W.L. 2005. Soil Fertility and Fertilizers, 7th edition. Pearson Prentice Hall, New Jersey.
» Salisbury, F.B., and C.W. Ross. 1978. Plant Physiology, 2nd edition. Wadsworth Publishing Company, Inc.
The Plant: Parts and Basic Functions
Roots
The important functions of plant roots are to:
1. anchor the plant in the soil 2. absorb water and nutrients from the soil 3. transport materials from the point of absorption to the base of the stem
The root tips have cells that divide and grow to increase root length. As length increases, the volume of soil penetrated increases for water and nutrient uptake. Roots do not grow in dry soil; thus, moisture must be present. Corn roots may grow 2.5” per day early in the season. The horizontal spread of the root system is capable of about 3 feet for wheat, 8 feet for corn, and about 12 feet for sorghum. Downward penetrations may range from 3 to 6 feet for grain crops while alfalfa may go as deep as 20 feet.
Stems
The stem is a rigid structure between leaves and roots. Stems contain vascular bundles, the plant tissues that transport water, nutrients, and metabolic products up or down the plant. Xylem is the part of the vascular tissue responsible for upward movement while the phloem is responsible for downward movement. The corn plant has well defined vascular bundles as evidenced by the string-like fibers found inside corn stalks.

Raymond C. Ward, Ph.D., Certified Professional Soil Scientist
Crop Nutrition and Management › 4
Leaves
Leaves are the sites of photosynthesis. There are four major parts to a leaf:
1. Epidermis – a single layer of cells that are on the upper and lower leaf surface, covered by a waxy layer that slows the movement of water and gases in and out of the leaf.
2. Mesophyll – makes up the largest portion of the leaf thickness, is found between the two epidermis layers and is composed of loosely arranged cells on the bottom side and well-ordered cells on the top side of the leaf.
3. Veins and Vascular Bundles – are continuation of those in the stems and roots. In grass plants, veins run parallel to each other while in legumes they are arranged in a “net” pattern.
4. Stoma – these are openings through which water and air can pass when the guard cells are open. Guard cells open and close in response to osmotic pressure. Carbon dioxide, oxygen and water vapor are the most important atmospheric gases that pass through stoma. In most crops, the stoma opens during the day and closes at night.
Transpiration
Transpiration (T) is the loss of water from plants to the atmosphere. As much as 99 percent of the water taken up by plants is transpired. Transpiration helps cool the plant and continues the extraction of water from the soil. The water requirement to produce a pound of dry matter varies considerably among different crops. A corn crop may require 24 inches of water (evapotranspiration) throughout the growing season. If the crop produces 240 bushels per acre of grain, that translates to 2,700 gallons of water used to produce one bushel of corn. Less yield often increases amount of water used.
If available soil moisture cannot replace the water losses due to evaporation and transpiration, wilting occurs. Wind, light intensity, temperature, and humidity can all affect transpiration. Wind, bright sunshine, and high temperatures elevate transpiration rates.
Photosynthesis and Respiration
Photosynthesis is the process by which carbon dioxide (CO2) and water (H2O) are converted, through energy supplied by sunlight, to chemical energy in the form of carbohydrates and oxygen (O2). The chemical equation is:
𝑪𝒂𝒓𝒃𝒐𝒏 𝒅𝒊𝒐𝒙𝒊𝒅𝒆 +𝒘𝒂𝒕𝒆𝒓 𝒍𝒊𝒈𝒉𝒕 + 𝒆𝒏𝒆𝒓𝒈𝒚 → 𝒄𝒂𝒓𝒃𝒐𝒉𝒚𝒅𝒓𝒂𝒕𝒆𝒔 + 𝒐𝒙𝒚𝒈𝒆𝒏
Respiration is the reverse process of photosynthesis. O2 is consumed from the atmosphere and CO2 is given off. The production of carbohydrates by photosynthesis is responsible for increasing the dry matter of a plant. Thus, photosynthesis is a “building” process while respiration is a “breaking down” process. Obviously, photosynthesis must exceed respiration in order for plant growth to occur.
ADDITIONAL REFERENCES
» Salisbury, F. B., and Ross, C.W. 1978. Plant Physiology, 2nd edition. Wadsworth Publishing Company, Inc. Belmont, CA.
Plant Nutrient Uptake
Plant nutrient uptake is governed by the available nutrient supply and by the concentration of that element at plant root surfaces. Nutrients are supplied to roots in three ways. First, roots penetrate the soil and come in direct contact with soil colloids and the nutrient held by the colloids. This is called root interception. Second, some nutrients in the soil solution move to the root with the water through mass flow. Third, some nutrients move in response to concentration gradients between the immediate root zone and soil zones farther away. This is called diffusion. Plants take up nitrogen mainly by mass flow, phosphorus by diffusion, and potassium by diffusion.

Raymond C. Ward, Ph.D., Certified Professional Soil Scientist
Crop Nutrition and Management › 5
Nutrient solubility is affected by root exudates and microbial activity near the root. Nutrient entrance into the root depends largely on reactions associated with the plant. Energy, supplied by respiration in root cells, is needed for active absorption of plant nutrients. Active uptake is also against chemical and electrochemical potential gradients, thus the need for energy. Uptake generally increases as soil solution concentrations increase, however, a maximum is reached at high ion concentrations. Reactions occurring within the cell govern the rate at which uptake occurs. Passive uptake does not require energy for nutrient absorption.
The rate of active uptake is influenced in several ways. First, if oxygen is limited the absorption rate is reduced. Second, cold temperatures limit respiration and therefore slow uptake rates. Slow plant growth in early spring can be attributed somewhat to the uptake inhibition by cold soil temperatures. Third, several compounds such as malonic acid, azide (N3) and cyanide (CN) can lower uptake rates. The latter two interfere with the mitochondrial cytochrome electron transport system.
Some ions move across root cell membranes with the help of “carriers”. The carrier for a given element receives energy from respiration and selectively binds to the ion from the soil solution, moves across the cell membrane, and releases the ion from the soil solution into a more concentrated solution inside the cell. Because these carriers are ion specific, one element may be preferentially absorbed over another in the soil solution.
ADDITIONAL REFERENCES
» Brady, N.C. 2008. The Nature and Properties of Soils, 8th ed. Macmillan Pub. Co., Inc., New York.
» Salisbury, F.B. and Ross, C.W. 1978. Plant Physiology, 2nd ed. Wadsworth Publishing Co., Belmont, CA.
Essential Plant Nutrients: Macronutrients
There are seventeen elements known to be essential to plant growth. Natural organic and inorganic substances, supplied by soil weathering are the primary sources for these plant nutrients. Sometimes the nutrient reservoir is lacking or deficient in supplying adequate nutrients to meet plant demands and elements must be added.
Nitrogen
Nitrogen (N) is considered a major or macronutrient element and ranks fourth in importance among essential elements with carbon, hydrogen and oxygen ranked respectively ahead of N. Nitrogen represents 79% of the earth’s atmosphere and even more is found in the soil as organic sediments. Unfortunately, this N exists in a form that cannot be used or taken up by plants, as only oxidized (NO3
-) or reduced (NH4+) forms of N can be used. Atmospheric N2 is combined with
hydrogen (H) from methane (CH4) to form anhydrous ammonia (NH3), the basic nitrogen fertilizer. Transforming organic N to usable forms is a biological process. Because these processes are biological, they are sensitive to soil pH, temperature and moisture.
The nitrogen concentration of most crop plants averages 2 – 4%. Crop plants take up both nitrate (NO3-) and ammonium (NH4+). The form used by plants depends in part on rainfall, soil pH, and the age of the plant.
Once NO3 - is taken into the plant by either active or passive uptake, it must gain an electron in a process called
reduction, which is accomplished by an enzyme called nitrate reductase. Enzymes are the catalysts for specific chemical processes and can be used repeatedly. They can be illustrated as puzzle pieces with notches that will fit only specific molecules. Nitrate is the only molecule that “fits” the notches of nitrate reductase. This reduction process receives energy from the products of photosynthesis. As available energy increases, so does nitrate reductase, explaining why nitrates accumulate in plants during cloudy weather.

Raymond C. Ward, Ph.D., Certified Professional Soil Scientist
Crop Nutrition and Management › 6
Nitrogen in this reduced form is found in amino acids and proteins, including the genetic information proteins, DNA and RNA. Amino acids are the building blocks that are joined together by a low energy bond to form proteins. The diagram below illustrates the path N takes in a plant.
𝑵𝑶𝟑 + 𝑵𝑯𝟒 → 𝑨𝒎𝒊𝒏𝒐 𝑨𝒄𝒊𝒅𝒔 → 𝑷𝒓𝒐𝒕𝒆𝒊𝒏𝒔
Because nitrogen is the key ingredient in amino acids, it is found and needed virtually everywhere in the plant. It is the glue that holds cellulose, the rigid elements of a cell wall, together. A rigid cell wall supports the plant and keeps it upright and sturdy. Chlorophyll, the pigment that absorbs light in photosynthesis, is made of proteins, bonded around magnesium. Nitrogen is also found in chemical substances that control growth, auxins and kinins, and is part of the nucleoproteins, or genetic makeup of plants. Nucleoproteins are found in the nucleus of all plant cells.
All these uses make nitrogen essential for plant growth through cell division and enlargement and thus, is responsible for an overall gain in dry matter. Nitrogen is very mobile in plants and can be drawn from some plant parts and translocated to regions of higher demand within the plant. A deficiency interrupts the growth process, causing stunting, due to poor cell development, and yellowing, due to decreased chlorophyll formation.
High amounts of nitrogen stimulate shoot growth more than root growth most likely because N is needed to make chlorophyll, in addition to the genetic proteins and cell walls needed by all cells. However, an adequate supply of N promotes deep and numerous roots due to the greater leaf area providing energy for growth.
Phosphorus
Phosphorus (P) is derived from soil organic matter and minerals. It is actively absorbed by plant roots as primarily H2PO4 - or HPO4-. The latter is absorbed more in soils of pH 7.0 or greater. It is mobile in the plant and redistributes from older to younger plant parts as demand changes.
Phosphorus is a structural component of plant energy transfer molecules known as ATP, ADP, NADPH2 and NADP. It is also a part of the genetic information compounds DNA and RNA. Because of the role of P in energy and genetic transfer systems, it is found throughout the plant, concentrating in leaves where photosynthesis takes place and at growing points where energy for growth is needed. A plant captures energy from sunlight by adding P to form an intermediate compound called ATP. ATP energy is used to make long-term energy compounds such as sugar and starch. When these long-term energy-products are formed, the required energy comes from releasing one P group from ATP. This process changes it to ADP, which now contains only two P groups. P is also a part of the other energy transfer compounds, NADP and NADPH2. In these compounds, P functions as a part of the compound and is not the element released or added in energy transfer.
The role of P in energy transfer is also a role that affects the availability of other nutrient elements. Plants gather nutrients through passive absorption (nutrients enter the plant with water and other elements) or active absorption (energy is used to absorb an element) from energy supplied by ATP.
The building blocks of genetic information, called nucleotides, consist of a phosphate group, a sugar, and a nitrogen-based amino acid. These blocks are linked together by the phosphate group to form the genetic code compounds RNA and DNA.
Phosphate groups, called esters, are combined with sugars, alcohols, acids or other phosphates to form polyphosphates. These molecules join the P groups in a chain, which forms a very high-energy bond. This bond, when broken, releases energy. Phytic acid is an example. It is commonly found in seeds and is used to support the high rate of metabolism that occurs during seed germination.

Raymond C. Ward, Ph.D., Certified Professional Soil Scientist
Crop Nutrition and Management › 7
Phosphorus is found in phospholipids, which are waxy compounds that line the cell membrane. Phospholipids are essential to maintaining an intact membrane and limiting what elements are absorbed into the cell. The phosphorus group acts as a float for the compound so that the waxy pair is aligned toward the outside.
Potassium
Potassium (K) is derived from weathered soil minerals such as clay. Generally, the more clay in the soil the more K that is present. Although K is plentiful in the soil, only 1 – 8% of the total K is in a form that is available to plants. Potassium is actively absorbed as a monovalent cation (K+), which means it lacks one electron, causing it to be attracted to other elements. Once inside the plant, K moves mostly upward. Within the plant, K is the most mobile nutrient.
While potassium is essential to all plants, it is not a part of any plant tissue compound. It is stored in large quantities in the vacuoles or reservoirs within each cell. Vacuoles are important factors in cell growth, as the more a vacuole stores, the larger it becomes, stretching the cell as it expands. High concentrations of K seem to contribute significantly to cell expansion.
Potassium does not form any complex organic molecules in plants but does serve as an enzyme activator for 46 enzymes. An enzyme is a protein that assists a chemical reaction. An inorganic element such as K is needed to start the reaction. Since enzymes are not used up in a chemical reaction, it seems that a plant would demand only small amounts of K; however, K ranks fifth in nutritional importance. Potassium accounts for 1 – 5% of a plant’s dry matter; nitrogen, ranked fourth, occupies 1.5 – 5%. Potassium is present in plants in large amounts possibly because it has very loose bonds to the enzyme it activates. High K concentrations are needed to improve bonding.
Potassium aids maintenance of osmotic potential and water uptake. Plants well supplied with K have good cell pressure and stomatal control. Good stomate control is important to the plant as the stomates serve as entryways for water and other elements in the leaf. Each stomate is controlled by two guard cells that swell and shrink to open and close the stomate. Open guard cells have a high concentration of K. Guard cells close when K moves to surrounding cells changing the osmotic pressure of these cells.
Potassium serves a vital role in photosynthesis. It increases growth through vacuole enlargement, which in turn increases the leaf area and therefore the total photosynthetic area. This increases the amount of energy transfer compounds, such as ATP, which supply the energy needed to transport photosynthetic products to other plant parts.
Sulfur
Sulfur (S) is a major plant nutrient that is mainly derived from organic matter decay in the soil. It also comes from inorganic soil compounds or gaseous SO2 in the atmosphere. It is absorbed as the sulfate (SO4 - -) anion. It is actively and passively absorbed into the plant.
Like nitrogen, S is involved in low energy bonds, called thiol bonds, which are similar to the energy level of peptide bonds. Amino acids containing S use thiol bonds join together in chains to form proteins. Sulfur is part of cystine, cysteine, and methionine, which are amino acids. Sulfur is found in certain vitamins, in oils and activates protein separation.
Plants deficient in S express symptoms such as stunting and general plant yellowing; stems are thin. Although sulfur is mobile in the plant, redistribution from older to younger leaves is not as pronounced. Sulfur may be important in the hardening of cells to cold and drought. In energy transfer, its role is similar to phosphorus.

Raymond C. Ward, Ph.D., Certified Professional Soil Scientist
Crop Nutrition and Management › 8
Magnesium
Magnesium (Mg) is derived from weathered soil parent materials. Plants actively and passively absorb Mg as a divalent cation (Mg++), giving it a strong attraction to negatively charged elements.
Magnesium is the center of the chlorophyll molecule. Ten percent of total plant Mg is found in leaves, about ½ of that magnesium resides in chloroplasts. Plastids store the remaining Mg. Magnesium chelates with energy compounds and organic acids acting as a bridge between energy compounds and enzymatic reactions. It is a cofactor for many enzymes. Nitrogen metabolism and protein synthesis depend on Mg.
Magnesium deficiencies appear first as interveinal chlorosis in older leaves and progress to younger tissues. Developing fruits and storage organs depend on Mg redistribution from older leaves. Deficiency symptoms develop slowly on these parts.
Calcium
Calcium (Ca) is a part of many minerals found in the earth’s crust. Soils derived from apatite, calcite, and dolomite are typically rich in Ca. Acid soils are low in available calcium. Plants absorb Ca passively as a bivalent (Ca++) cation (meaning it lacks two electrons), which gives it a strong attraction to other elements. It is the most immobile of plant nutrients and is highly absorbed on the exchange sites which is why is has limited movement to other plant organs. Calcium travels passively through the plant relying on the transpiration stream for transport.
Calcium is an integral part of the plant cell walls. Cell walls are made of three layers, with Ca found in the middle layer as calcium pectate, which acts as a cementing agent between the inner and outer layers. Calcium is also found in cell vacuoles serving as an immobilizer to organic acids and other ions, rendering them non-toxic. This helps to counteract the effects of low soil pH.
Calcium is important to proper plant cell organization. Calcium is essential for cell division and elongation as it is a critical factor in regulating cell membrane permeability. Meristematic or shoot tip growth also needs Ca. It is also needed to convert the amino acid tryptophan to a plant growth hormone, indoleacetic acid (IAA), commonly called auxin. Auxin controls leaf and fruit drop, and initiates plant growth response to a light source. IAA also increases respiration and potassium uptake as IAA binds to cell membranes. The formation of callus tissue on roots and root and root hair curling, essential for N fixation in legumes, is also a result of auxin production.
Deficiency symptoms for Ca are first observed in younger leaves and tissues as deformed and chlorotic leaves. Deficiencies are seldom observed in older tissues. Calcium is not redistributed so younger leaves and fruit are totally dependent on new Ca uptake.
Essential Plant Nutrients: Micronutrients
Plant requirements for minerals vary. These minerals are referred to as micronutrients and although only trace amounts are required, they are essential to successful plant growth.
Zinc
Zinc (Zn) is derived from basic igneous rocks and occupies exchange sites on soil particles. Generally, Zn levels increase with soil organic matter and decrease with increasing soil pH. Zinc uptake is reduced when excess phosphorus is present. Uptake of zinc is primarily in the divalent form.
Zinc is essential for enzymes to produce the compound tryptophan, the precursor of the plant growth stimulator IAA. Zn is present in the enzyme ribonuclease, which mediates some protein synthesis. Plants deficient in Zn are low in tryptophan and IAA. They have small leaves and internodes fail to elongate.

Raymond C. Ward, Ph.D., Certified Professional Soil Scientist
Crop Nutrition and Management › 9
Iron
Iron (Fe) is derived from primary minerals. All soils have ample iron content, but the solubility is regulated by soil pH. Uptake of Fe is primarily as a divalent cation.
Iron is a part of the electron transport enzymes, active in photosynthesis and mitochondrial respiration. It helps breakdown water molecules into hydrogen and oxygen. Iron, along with molybdenum, is an element of the nitrite-nitrate reductase enzymes and of the nitrogen fixation enzyme, nitrogenase.
Although Fe is not a part of the chlorophyll molecule, a major portion of Fe is in the chloroplasts. Iron is essential for chlorophyll structure and synthesis. Plants deficient in Fe have fewer and smaller chloroplasts, which causes plants to develop chlorosis. Iron is very immobile in plants.
Manganese
Manganese (Mn) is supplied by the same parent minerals as Fe; the two are closely associated. Uptake is active and Mn competes with other cations, particularly with NH + and Fe++ for uptake.
Manganese activates several enzymes, especially those involved in fatty acid and nucleoprotein synthesis. It is required for respiration and photosynthesis as part of the electron transfer system.
Manganese is immobile in plants and concentrates in meristematic tissue. Young plants depend on current uptake to supply Mn. New leaves are the first part of the plant to show deficiency symptoms.
Copper
Copper (Cu) is found in primary and secondary minerals but exists in soils mostly as organic complexes. Copper is part of the transport system in photosynthesis. Copper is found in plant organelles and in several enzyme oxidases. Some enzymes use Cu as a cofactor in their synthesis. Copper deficiency interrupts protein synthesis, disrupting growth and causing dieback.
Molybdenum
Molybdenum (Mo) is primarily derived from the weathering of a number of minerals. Plants absorb Mo as a divalent anion.
Molybdenum availability increases as soil pH increases, thus liming acid soils increases availability. The enzymes, nitrite reductase and nitrate reductase, contain Mo, which acts as an electron carrier between oxidized and reduced states.
Deficiency symptoms include interveinal chlorosis, stunted growth, and poor nodule formation in legumes. Often, lime application is the best correction for the deficiency.
Chloride
Chloride is the most abundant anion in nature. Chloride is adsorbed in soils as the chloride (Cl-) anion. Plants may acquire chlorine from atmospheric chlorine gas and convert it to chloride within the plant. The normal accumulation is in cell vacuoles. Chloride is immobile and accumulates in older plant parts.
Chloride is essential for the stimulation of electron transfer from water to chlorophyll in photosystem II of the photosynthesis process.
Deficiency symptoms are the wilting of leaves that become chlorotic and bronze colored. Chloride deficiencies have been noted in areas of the Great Plains.

Raymond C. Ward, Ph.D., Certified Professional Soil Scientist
Crop Nutrition and Management › 10
Boron
Boron (B) is derived from primary minerals and from shale or sedimentary rocks. However, it is found only in low levels in the soil solution. It is absorbed passively by the plant as borate (BO3-3). Boron deficiency occurs more often than other micronutrients, except in semi-arid and arid regions. Absorption of B decreases with increasing soil pH or heavy liming.
Boron is immobile in plants. Young leaves and fruit depend on current uptake to supply required boron. In developing cells, B is needed to control sugar transport and polysaccharide formation. It regulates starch formation at sugar production sites, preventing excess production, and determines how the sugars are used by the plant. Boron is used in the formation and metabolism of pectic compounds needed by cell walls.
Boron deficiencies reduce or stop the elongation of a plant’s growing point, causing a discolored, distorted, and disorganized plant. RNA metabolism is apparently affected, causing possible death to the plant. Excess B leads to toxicity problems, as there is only a narrow B concentration range safe for plants.
General Outline: Nutrient Deficiency Symptoms
I. General Outline for the Identification of Nutrient Deficiency Symptoms
A. Nutrient elements that show their deficiency symptoms on the older leaves of plants first – Nitrogen, Phosphorus, Potassium, Magnesium and Zinc.
B. Nutrients elements that show their deficiency symptoms on the young leaves of plants first.
1. Loss of green color without death of terminal bud or growing point.
a. Veins are lighter than rest of the leaf – Sulfur b. Veins retain dark green color outside of dead spots – Manganese c. Veins retain green color with loss of color between veins – Iron d. Marginal firing – Molybdenum
2. Death of terminal bud preceded by yellowing of bud leaves – Calcium and Boron 3. Permanent wilting of upper leaves – Copper and Chloride
II. Nutrient Deficiency Symptoms that Occur on Older Leaves First
A. Nitrogen
1. Corn - In young corn, nitrogen deficiency is characterized as a stunted, spindly plant with light green foliage. In older plants nitrogen will move out of the lower, older leaves into the new growing parts. The tips of the older leaves will yellow and the yellowing will follow down the midrib in a typical V shaped pattern. The leaf will eventually die.
2. Small Grains and Grasses - Nitrogen deficiency of small grain and grasses can be described as plants that are erect, spindly and poorly tillered. The lower leaves turn yellow and die from the tip to the base.
B. Phosphorus - Phosphorus deficiency symptoms in the field are difficult to interpret because there are no outstanding specific external symptoms. Phosphorus is translocated in the plant. At maturity, plants have the largest portion of phosphorus in the seed.
a. Corn – Phosphorus deficiencies of corn are characterized by slow, stunted growth and dark green color. Sometimes the lower leaves and the stems tend to become purplish.
b. Small Grains and Grasses – Phosphorus deficiencies of small grains and grasses are characterized by slow growth and lack of tillering when plants are dark green.
c. Legumes – The chief symptoms of phosphorus deficiency are a retarded rate of growth and spindly plants, with leaves turning dark green or bluish-green.

Raymond C. Ward, Ph.D., Certified Professional Soil Scientist
Crop Nutrition and Management › 11
C. Potassium
1. Legumes – Potassium deficiency is perhaps the most outstanding and easily recognized symptom of legumes.
a. Soybeans – The first sign of potassium deficiency in soybeans is the irregular mottling around the edges of the leaflets. These chlorotic areas soon merge, forming a continuous yellow border around the tip and along the sides of the leaves. The marginal firing often spreads to include half or more of the leaflet area, while the center and base of the leaf remains green.
b. Alfalfa and Sweet Clover – Small white spots around the leaf margin first appear on the green leaves. Later the tissue between these spots becomes yellowish-green to yellow and finally dies. Generally, the symptoms are more pronounced on the lower leaves. This is because potassium is translocated, like nitrogen and phosphorus, but not to the same extent. Winter-killing of alfalfa also indicates a potassium deficiency.
2. Corn and Sorghum – The first sign of potassium deficiency in corn or sorghum is a slower rate of growth. The leaf edges and tips become dry and scorched, with the rest of the leaf showing yellowish stripes. The lower leaves are affected first. Lodging of corn at maturity is a final result of a potassium deficiency.
3. Small Grains and Grasses – Small grains demand less potassium than corn and legumes. There is one common potassium deficiency symptom – the edge scorch of the leaves.
D. Magnesium - Magnesium is translocated in the plant; therefore, magnesium deficiencies are frequently found on the lower leaves of plants.
1. Corn – The first magnesium deficiency symptom is a striping or chlorosis between the veins and, if the deficiency is severe, a crimson red color frequently appears on the lower leaves.
2. Potato – In potatoes, an orange-yellow coloration appears around the margin of the lower leaves and along the veins.
E. Zinc
1. Corn – Two to three week old corn plants develop pale yellow stripes on each side of the midrib of lower leaves. These yellow stripes start near the base of the leaf and extend about ¾ of the length of the leaf. Later, leaves may become reddish-bronze in color and eventually die. Shortening of internodes and stunting also occur.
2. Small Grains and Grasses – On oats and wheat, zinc deficiency symptoms occur as thin growth and pale green color. The older leaves show collapsed areas at margins and leaf tips are grayish in color. Actually, small grains and grasses are less sensitive to zinc deficiency.
3. Legumes – Zinc deficiency of alfalfa can be described as yellowing between the veins, particularly in the older, lower leaves. Shortened stems resulting in bushy groups of leaves are another zinc deficiency symptom of legumes. Soybeans are more sensitive to zinc deficiency than alfalfa or clover.
III. Nutrient Deficiency Symptoms that Occur on Younger Leaves First
Since these nutrients do not move in the plant, the nutrient will be lacking in the young or new leaves. These nutrients show deficiencies in three general ways, as was shown in section I.

Raymond C. Ward, Ph.D., Certified Professional Soil Scientist
Crop Nutrition and Management › 12
A. Loss of Green Color without Death of Terminal Bud or Growing Point
1. Sulfur – Veins are lighter than rest of leaf
a. Sulfur Deficiency Symptoms – Sulfur deficiency symptoms resemble those of nitrogen. However, with a diminishing supply of sulfur, a distinction may be sharply drawn: on most plants, young leaves are light green to yellowish in color, with even, light colored veins. Sulfur deficient plants are characteristically small and spindly with slender stalks that tend to be woody. They also have decreased root development. Alfalfa and other legumes are particularly sensitive to sulfur deficiency.
2. Manganese – Veins retain dark green color outside of dead spots.
a. Manganese Deficiency Symptoms – In general, plants with net-veined leaves (legumes) that develop chlorosis in the interveinal tissues while the veins remain green are known to have a manganese deficiency. The first symptom of potatoes and soybeans is small pinhead-sized black specks parallel to the main veins. Plants that have parallel veins, such as small grains, develop a general chlorotic condition and secondary symptoms such as gray speck of small grains.
3. Iron – Veins retain green color with loss of color between veins.
a. Iron Deficiency (Chlorosis) Symptoms – The earliest stages of iron chlorosis may consist of a generally pale leaf color without veinal patterns. The next stage consists of an interveinal chlorosis in the leaves. There is no gradation of green coloring within the interveinal areas as in the case of zinc and manganese deficiency symptoms. At the most severe chlorosis stage, the finer veins and even the larger veins are yellow. These deficiency symptoms occur on the young leaves of the plant, since iron is immobile in the plant. Sorghums are the most sensitive to iron chlorosis.
4. Molybdenum – Marginal Firing
a. Molybdenum Deficiency Symptoms – General deficiency symptoms of oats are a bluish coloration of the outer glumes and the grain produced is pinched. In legumes, molybdenum deficiency symptoms show up in about the seventh week. The leaves turn pale with progressive discoloration from greenish-yellow to pale yellow.
B. Death of the Terminal Bud Preceded by Yellowing of Bud Leaves
1. Calcium
a. Calcium Deficiency Symptoms – In most plants, calcium deficiency causes reduced root growth and frequent root rotting. The roots are affected before the tops show any symptoms of calcium deficiency. In moderate stages of deficiency, the young leaves become distorted, fail to grow and show spotting or necrotic areas. Since calcium is not translocated, the growing points and young leaves are affected instead of the lower leaves.
2. Boron
a. Boron Deficiency Symptoms – Boron is largely immobile in plants, causing stunting of the younger growing parts of plants.
(1) Sugar Beets – Heart rot of sugar beets is caused by a boron deficiency. It is first noticed in midsummer after the sugar beets have attained considerable size. The first symptoms are crosschecked petioles and misshapen leaves. The petioles and midribs of the misshapen leaves become twisted. The color of the newer leaves is dark green until they start to disintegrate, when they turn yellow, brown and black. Boron deficient beets also appear to have been stepped on because the leaves grow out in a horizontal position rather than vertical position.
(2) Corn – Boron deficiency of corn causes a striping of the upper leaves and barren stalks.

Raymond C. Ward, Ph.D., Certified Professional Soil Scientist
Crop Nutrition and Management › 13
(3) Alfalfa – In alfalfa, the top of the plant becomes yellow or reddish while the lower leaves stay green. The plant has an umbrella-like appearance. Seed production is very low when boron is lacking.
C. Permanent Wilting of Upper Leaves
1. Copper – Most copper deficiencies are concerned with organic soils.
a. Copper Deficiency Symptoms – The youngest leaves of corn become light yellowish - green near the base of the leaf and the tips become necrotic when deficient in copper. Oats, wheat and barley have similar symptoms. Deficient alfalfa plants have faded green color with a grayish cast, internodes are shortened and necrotic areas appear on the upper leaves.
2. Chloride
a. Chloride Deficiency Symptoms – The youngest leaves first wilt and subsequently can become chlorotic and bronze-colored.
Seed Quality
Poor seed quality is a major cause for poor stand establishment in crops. Other factors that can contribute to poor stands include planting depth, herbicide injury, low soil temperatures, crusting, insects, disease, or improper planter operation.
Variety
Seed is unique in that it is actually a miniature plant that contains the genetic code that governs maturity class, disease and insect resistance, lodging susceptibility, adaptability, and numerous other traits.
Viability
Seed purity and germination percentage are two factors that should concern farmers. Seed purity identifies the kinds of seeds present including by weight: pure seed, other crop seed, weed seed, and inert matter. Equally important to the amount of weed seed by weight is the species of weed seed present.
Viability, or capability of germination, is a test that provides an estimate of stand establishment. Germination conditions include the type of growing medium, moisture, moisture level, duration of the test, and the temperature requirements. Although optimum conditions are rarely present in the field, these germination tests provide uniform results that gives the buyer added confidence when purchasing and comparing seed.
The concept of “pure live seed” (PLS) was developed to provide additional information on a seed’s ability to germinate and produce a “normal” seedling. PLS is calculated as:
% 𝒑𝒖𝒓𝒆 𝒔𝒆𝒆𝒅
𝟏𝟎𝟎𝒙% 𝒑𝒖𝒓𝒆 𝒈𝒆𝒓𝒎𝒊𝒏𝒂𝒕𝒊𝒐𝒏
𝟏𝟎𝟎𝒙 𝟏𝟎𝟎 = 𝑷𝑳𝑺
PLS provides a more accurate estimate of the plant producing ability of the seed than purity or germination values alone.

Raymond C. Ward, Ph.D., Certified Professional Soil Scientist
Crop Nutrition and Management › 14
Vigor
Seed vigor tests were developed to provide a better estimate of seed quality as related to actual field emergence since germination tests over estimate potential stand establishment. Seed vigor is defined as “those seed properties which determine the potential for rapid, uniform emergence and development of normal seedlings under a wide range of field conditions.”
The most common seed vigor tests include:
Cold Test
The seeds are placed in soil or paper towels lined with soil and exposed to 50° F for seven days, then placed in favorable conditions for an additional six days. This test is based on simulation of early spring planting conditions.
Accelerated Aging Test
The seeds are placed in a chamber that provides relative humidity near 100% at 106°F for 72 hours, after which the seeds are removed and germinated according to a standard germination test.
Tetrazolium (TZ) Test
The TZ molecule reacts with hydrogen that is released as a result of respiratory activity. This process forms a water insoluble red pigment called formazan which subjectively categorizes living tissues based on staining patterns and colors. These categories range from weak to strong vigor.
Seedling Growth Rate Test
In soybeans, seedlings greater than 2 inches in length after four days are considered normal seedlings. The percentage of normal seedlings at this count can be used as an indication of vigor.
No single test is considered better than the others. Some seed testing laboratories establish a “vigor index” that represents vigor based on a series of tests.
ADDITIONAL REFERENCES:
» McDonald, M.B. 1986. Three Vs of Seed Quality. Crops and Soils Magazine, November.
Effect of Tillers on Corn Yield
Tillers (commonly known as “suckers”) are beneficial in wheat, other small grains, and grasses. But are they desirable in corn?
What are Tillers?
Tillers are lateral branches extending below ground nodes. The number of tillers that develop depends on plant population, row spacing, soil fertility, early season weather conditions, and the genetic background of the hybrid. In low population situations, many hybrids will take advantage of available soil nutrients and moisture to form tillers. This is more often the case in early stages of the growing season. A few hybrids will form tillers even in high plant densities. To most farmers, this is an unwanted situation since most are concerned that yields may be reduced.
Are Tillers Detrimental to the Main Plant?
In the early 1900’s agronomists found that removal of tillers did not increase yields and often decreased them. In the 1930’s defoliation studies led to a better understanding of tillers. These studies indicated a connection between tillers and main plants: nutrients produced in tiller leaves are allowed to get to the ears on the main plants after the main plants had all of their leaves removed.

Raymond C. Ward, Ph.D., Certified Professional Soil Scientist
Crop Nutrition and Management › 15
Modern tracing methods of plant nutrient movement in the plant are possible with labeled carbon. It has been found that little nutrient exchange takes place between tillers and main plants prior to tasseling. After tasseling, and during grain fill, large amounts of nutrients move from leaves of large, earless tillers to the ear on the main plant. If ears were present on main plant and tillers, little nutrient movement from the tillers took place. Apparently, ears receive nutrients from the structure on which they develop. The only movement of food from the main plant to the tiller occurred when an ear was present on the tiller but not the main plant (a situation which seldom occurs under field conditions).
Small, shaded tillers probably have little influence on main plants; if there is an effect, it is probably positive. Tillers may be detrimental in dry soil conditions when the additional leaf area may increase transpiration rates and cause depletion of soil moisture sooner than if no tiller had developed. In low population densities, increased grain yields are likely due to tillers feeding the main plant or producing their own ears.
Reasons Tillers are Unwanted
Farmers do not like tillers mainly because of the sight created by tillers that die early. Tillers will sometimes produce unsightly tassel ears. Also, more dry matter is produced which can be a problem for combines at harvest. However, those harvesting corn for silage may welcome the additional dry matter.
What if You have Tillers?
Do not avoid hybrids just because they might tiller. Most seed companies select against tillering because they are undesirable.
If tillering occurs, consider your plant population or the uniformity of the stand. Gaps and low plant densities are probably the cause.
In conclusion, tillers will not likely affect yields to any great extent. One should select corn hybrids on yield potential.
ADDITIONAL REFERENCES:
» Carter, P.E. 1986. Friend or Foe? Do Corn Tillers Help or Hurt Yields? Crops and Soils Magazine, January.

FEED TESTING

Rebecca J. Kern, M.S., Professional Animal Scientist Raymond C. Ward, Ph.D., Certified Professional Soil Scientist
Feed Testing › 17
The Value of Feed Testing
Laboratory testing is a beneficial resource for livestock production decision making. Accurate feed information will result in accurate ration and diet formulation, less over or underfeeding of animals, reduced feed waste, and provide more cost-efficient protein, energy and mineral supplementation strategies.
Nutrition is the cornerstone of animal health and production performance. Feed testing is the foundation of a well-managed animal diet resulting in overall better animal health and achievement of production goals such as reaching target average daily gain of a steer in a feedlot or meeting egg production efficiency goals in a laying hen. More efficient utilization of feed resources to meet production goals will result in increased profitability to the livestock operation. The first step in feed testing is identifying your goal as a producer. Your goal will dictate the information relevant to your operation and determine your feed testing needs and interpretation of the results. Ward Laboratories, Inc. has an animal scientist available for consultation before sampling to help you determine what feed analyses best suit your goals (phone: 800-887-7645 ext. 127 or email: [email protected]). Through the implementation of accurate test results, producers can improve animal health and performance while preventing death losses from toxicities to maximize profitability.
Feed Sampling Procedures
The information and results provided by the laboratory report can only be as good as the sample received by the lab. It is important to provide a representative feed sample to produce accurate nutritional information for livestock management. Before retrieving samples, consult with Ward Laboratories personnel and/or follow procedures from a reliable source such as extension resources or the National Forage Testing Association (www.foragetesting.org). Several staff members at Ward Laboratories are Certified Hay Samplers and can guide you through the sampling process. Furthermore, visit our YouTube Channel for video instructions on sample collection.
The first step to obtain a representative sample is to define ‘lots’ of feed. A lot can consist of hay baled from a specific field, a stall of corn silage, a shipment of distiller’s grains or a ration mix. Group your feeds as similarly as possible to distinguish each lot. For example, if you have an alfalfa field and a grass hay field you intend to bale together, each field will represent a ‘lot’ and should be sampled separately. Do not mix them. Each sample should be composed of several subsamples to properly represent the lot due to variation in all feeds. A sample from one spot within a lot may not have the same nutritional value as another. Several subsamples are used to obtain an average value of the whole lot. The National Forage Testing Association recommends a combination of 20 sub-samples as the sample for laboratory testing. Subsamples should be taken randomly. Do not target “good looking spots” or avoid “bad looking spots”. Ensure samples are taken from the outside of the bale or feed pile as well as from 12-18 inches inside the lot. If sampling baled hay, it is best to use a hay probe, which can be purchased from Ward Laboratories. Producers close to Ward Laboratories may rent a hay probe free of charge. Once you have obtained your sample place it in a quart size plastic bag and send it to the laboratory for testing.
Hay
Bales Sample 20 bales from each lot, or take samples from 20% of the bales. Core all rectangular bales from the end and all-round bales from the twine surface. Mix the samples thoroughly and use the quartering procedure (described below) to obtain a representative sample for analysis.

Rebecca J. Kern, M.S., Professional Animal Scientist Raymond C. Ward, Ph.D., Certified Professional Soil Scientist
Feed Testing › 18
Loose Hay Stacks Select 4 stacks from each cutting for sampling. Collect at least 3 core samples from the side of each stack, mix thoroughly and take a representative sample for analysis using the quartering procedure (described below). If a core sampler is not used for hay sampling, hand grab from each of the bales.
Silage
Upright Silo Take random scoops of silage while unloading. Mix the samples thoroughly and take a representative sample for analysis using the quartering procedure (described below).
Horizontal Silo
Remove a column 6 inches by 12 inches wide on the open end of the silo. Mix the sample thoroughly and take a representative sample for analysis using the quartering procedure (described below).
Bunk Sample
Take 8-10 grab samples from the bunk(s) as the ration is being unloaded. Mix the sample thoroughly and take a representative sample for analysis using the quartering procedure (described below).
Grain Sample
Take 5 random hand samples from the bin or truck. Mix the sample thoroughly and take a representative sample for analysis using the quartering procedure (described below).
Quartering-Procedure
Sometimes when forages and feeds are sampled, the total of the aggregate samples is too large and bulky to send into the laboratory. The total sample size can be properly reduced and still maintain a representative sample by quartering the sample. Mix the entire sample thoroughly, then pour it into a pile on clean paper or plastic. Then divide the sample into four equal parts (quarters), saving the opposite two quarters. If the sample is still too large, repeat the procedure until the proper sample size of one pint to a quart is obtained. All samples should be placed in an airtight plastic bag and submitted to the laboratory for analysis.
Figure 1: Quartering a Sample (Top View)

Rebecca J. Kern, M.S., Professional Animal Scientist Raymond C. Ward, Ph.D., Certified Professional Soil Scientist
Feed Testing › 19
Fractions of Feed
Below is a chart of each fraction of feed as defined from proximate analysis. This is your guide to how feed testing breaks down each fraction of the sample to obtain pertinent information about the feed.
Figure 2: Fractions of Feed Used in Analysis
Nutrient Feed Tests
Dry Matter
The amount of dry matter in the feed or the percentage of feed that is not water.
Dry Matter is important in comparing the nutrient value across several feeds, which vary in moisture content. It is also used in diet formulation and ration balancing to predict an animal’s potential feed intake. The National Research Council (NRC) provides required daily dry matter intake values for each livestock species.
Moisture
The amount of water in a feed.
Understanding the moisture content of a feed can help the producer avoid storage problems. Bailing a hay too wet can result in mold and is a risk factor for ignition. It is recommended that hay be baled below 20% moisture content, and ideally to bale below 15% moisture. Storing corn grains or silage under moist, warm conditions can result in a decline in the metabolizable protein of a feed due to heat damage. Moisture and Dry Matter are included in all feed testing reports.
Feed Sample
Water Dry Matter (DM)
Ash (Minerals) Organic Matter (OM)
Non-Nitrogenous Matter Crude Protein (CP)
Ether Extract (EE; Lipid) Carbohydrates
Nitrogen-Free Extract (NFE)
Crude Fiber (CF)

Rebecca J. Kern, M.S., Professional Animal Scientist Raymond C. Ward, Ph.D., Certified Professional Soil Scientist
Feed Testing › 20
Ash
The total elemental or mineral content of the feed.
Ash is used to calculate the nitrogen free extract portion of a feed for proximate analysis energy equations.
Minerals
Important biological co-factors involved in maintenance, growth, reproduction and immunity on a molecular level.
Minerals are typically measured to:
1. compare the guaranteed analysis of a mineral supplement 2. check that a ration has been mixed properly 3. formulate a mineral supplementation plan 4. specifically, to check the calcium to phosphorous ratio 5. periodically check for a deficiency or toxicity in the diet.
Minerals interact with each other, often making the specific diagnosis of a deficiency or toxicity particularly difficult.
Calcium (Ca)
Calcium is a structurally important component of bones, teeth and eggshells. Calcium is also involved in muscle contractions. An excess of calcium in the diet can result in big head disease in equids, twisted snout in swine, and water belly, the formation of urinary calculi most commonly affecting rams. Deficiencies include rickets in young animals, osteomalasia in older animals, and milk fever in nursing cows or ewes. Resorption is a process by which the body removes calcium from bones and/or teeth, for use in other tissues and naturally occurs during lactation and egg laying. Parathyroid hormone (PTH) regulates this process and therefore, hyperthyroidism causes increased PTH which manifests as deficiency symptoms, when there is plenty of calcium in the diet. Phosphorus (P) in high concentrations can depress the absorption rate of calcium also manifesting as deficiency symptoms.
Phosphorus (P)
Due to the close working relationship of phosphorus and calcium in bone building, deficiencies of phosphorus are like those of calcium, including rickets and osteomalasia. Additionally, pica, a condition causing animals to chew on or eat odd things such as dirt and/or wooden structures, is also a symptom of a phosphorus deficiency. In some feeds, such as corn and soybeans, phosphorus may be bound and biologically unavailable to monogastrics as phytic acid. Swine can be supplemented with phytase, an enzyme which breaks down phytic acid, to access the phosphorus in those feeds.
Magnesium (Mg)
Magnesium is an important biological co-factor required for the activation of many enzymes. Symptoms of deficiency include muscular tremors, staggering gait, nervousness, and convulsions. Grass Tetany is a common deficiency syndrome in which animals are grazing a lush spring pasture and the grass has yet to absorb adequate levels of magnesium to support the animals’ requirement. This condition can also be an issue in cover crop grazing operations. Producers often choose a high magnesium mineral supplement to offset inadequate levels of magnesium. High levels of potassium in the soil can interfere with the uptake of magnesium in a plant as well as high levels of potassium in the diet can interfere with the absorption of magnesium by an animal.
Potassium (K)
Potassium plays a critical role in cell and nerve signaling. Deficiencies of potassium are rare, as most plants contain sufficient amounts of potassium.

Rebecca J. Kern, M.S., Professional Animal Scientist Raymond C. Ward, Ph.D., Certified Professional Soil Scientist
Feed Testing › 21
Zinc (Zn)
Zinc is a main component of enzymes critical in many biological processes. A deficiency of zinc results in parakeratosis, or the abnormal keratinization of the skin or epidermal lining causing it to appear thick and scaly, along with inflammation of the nose and mouth, stiffness of joints, and swollen feet. Sub-clinically, low levels of zinc depress the immune system making animals more susceptible to infectious agents.
Iron (Fe)
Iron is largely associated with protein and blood. Deficiency symptoms include anemia, and respiratory distress. High levels of iron interfere with copper absorption, thereby resulting in copper deficiency symptoms.
Manganese (Mn)
Manganese functions in the activation of enzymes. Deficiencies are most commonly seen in poultry, manifesting as slipped tendon in chicks, and malformation of leg bones. Symptoms of deficiency may also be caused by excess calcium and phosphorus in the diet interfering with absorption of manganese.
Copper (Cu)
Copper is a cofactor in multiple enzymes and is responsible for the pigmentation and crimping of hair and wool. Deficiencies of copper result in anemia, loss of crimp and pigmentation of hair and wool, and decreased animal growth. As the liver is the major storage organ for copper, liver necrosis, hepatic coma and death result from excess copper intake. Copper metabolism is linked to molybdenum levels in the diet. Iron and sulfur also interfere with copper absorption.
Sulfur (S)
Sulfur is a component of protein and several vitamins. It is only an elemental requirement for ruminants to support the microbial population. A sulfur deficiency results in a deficiency in sulfur containing amino acids. In excess, sulfur can be very harmful impairing the metabolism of the vitamin thiamin causing polio encephalomalacia (PEM) or animals commonly referred to as ‘brainers’. Sub-clinically high levels of sulfur in the diet can interfere with copper absorption.
Sodium (Na)
Sodium is involved in osmotic regulation and transmission of nerve impulses. A deficiency in sodium results in dehydration, and decreased nutrient absorption, specifically carbohydrates and amino acids. In excess, animals are excessively thirsty, and fluids begin to collect in the body.
Molybdenum (Mo)
Molybdenum is involved in protein metabolism. A deficiency in poultry results in impaired nitrogen excretion. Molybdenum is closely related to copper metabolism and impacts copper toxicity.
Cobalt (Co)
Cobalt is only a requirement for ruminants to support the rumen microbial population. It is a component of vitamin B12. Deficiencies in cobalt, or vitamin B12 include, wasting disease, emaciation, and pernicious anemia.
Selenium (Se)
Selenium is a required mineral but in excess is toxic. It is involved with metabolic reactions involving vitamin E. Deficiencies of selenium include muscular dystrophy, stiff lamb syndrome, also called white muscle disease, a degenerative muscle disease of young ruminants, or crazy chick disease, a nervous system disorder in young poultry. Toxicities include blindness, staggering, nervous disorders, sloughing of the hair and hooves, stiff joints and sometimes sudden death. Excess selenium also has deleterious effect on reproduction of all species. Some plants are accumulators of selenium (e.g. Milk Vetch and Princes Plume). In some locations, selenium is high in the water.

Rebecca J. Kern, M.S., Professional Animal Scientist Raymond C. Ward, Ph.D., Certified Professional Soil Scientist
Feed Testing › 22
Salt Chloride (Cl)
Chloride plays a role in digestion as hydrochloric acid in the stomach and is closely associated with sodium as it plays a role in osmotic regulation. Low concentrations of chloride in the diet can result in a depressed appetite and low water intake while excess chloride in the diet, like sodium, can result in extreme thirst and accumulation of fluids in the body.
Salt is also utilized to perform “Mixer Analysis”. To run a mixer analysis, feed mills or total mixed ration mixers submit 10 different feed samples and run salt on each separately. The percent Coefficient of Variation (CV) is calculated in a special report. The results of the CV over all the samples determines if corrective action should be taken.
Table 3: Interpretation of Mixer Analysis
Percent CV Rating Corrective Action
<10% Excellent None
10-15% Good Increase Mixing time by 25-30%
15-20% Fair Increase mixing time by 50%, look for worn equipment, overfilling, or sequence of ingredient addition
>20% Poor Possible combination of worn equipment, overfilling, or sequence of ingredient addition. Consult extension personal or feed equipment manufacturer

Rebecca J. Kern, M.S., Professional Animal Scientist Raymond C. Ward, Ph.D., Certified Professional Soil Scientist
Feed Testing › 23
Table 4: Mineral Requirements and Tolerance Levels in Livestock
Species Beef Cattle Dairy Cattle Swine Requirement Maximum
Tolerable Level
Requirement Maximum Tolerable
Level
Requirement Maximum Tolerable
Level Mineral
Production Stage (Unit)
Growing/ Finishing
Gestation Lactation Lactation Dry Cow Growing
Heifers/ Bulls Mature
Bulls Gestation Lactation Boars
Calcium % 2.00 0.43 – 0.77 0.39 0.29 – 0.52 0.30 2.00 0.75 0.75 0.75 Chloride % 0.25 0.20 0.20 0.20 0.12 0.16 0.12 Cobalt ppm 0.10 0.10 0.10 10.00 0.10 0.10 0.10 0.10 10.00 400.00 Copper ppm 10.00 10.00 10.00 100.00 10.00 10.00 10.00 10.00 100.00 5.00 5.00 5.00 250.00 Iron ppm 50.00 50.00 50.00 1000.00 50.00 50.00 50.00 50.00 1000.00 43.00 15.00 40.00 600.00 Magnesium % 0.12 0.12 0.20 0.40 0.20 – 0.25 0.16 0.16 0.16 0.50 0.04 0.04 0.04 0.30 Manganese ppm 20.00 40.00 40.00 1000.00 40.00 40.00 40.00 40.00 1000.00 10.80 3.81 10.00 500.00 Molybdenum ppm 5.0 10.00 Phosphorus % 1.0 0.28 – 0.48 0.24 0.23 – 0.31 0.19 1.00 0.60 0.60 0.60 Potassium % 0.60 0.60 0.70 3.00 0.90 – 1.00 0.65 0.65 0.65 3.00 0.20 0.20 0.20 2.00 Selenium ppm 0.10 0.10 0.10 2.00 0.30 0.30 0.30 0.30 2.00 0.08 0.03 0.07 5.00 Sodium % 0.06 – 0.08 0.06 – 0.08 0.10 0.18 0.10 0.10 0.10 0.15 0.20 0.15 Sulfur % 0.15 0.15 0.15 0.40 0.20 – 0.25 0.16 0.16 0.16 0.40 Zinc ppm 30.00 30.00 30.00 500.00 40.00 40.00 40.00 40.00 500.00 27.00 9.52 25.00 2000.00
Species Sheep Goats Horses Chickens Production
Stage (unit) Requirement Maximum
Tolerable Level Requirement Maximum
Tolerable Level Requirement Maximum
Tolerable Level Maximum Tolerable Level
Mineral Mature Ewe Lamb Maintenance Growth Immature Adult Calcium % 0.25 – 0.40 0.55 1.50 0.03-0.80 1.50 Chloride % 4.00 4.00 0.50 - 1.00 0.50 – 1.00 0.70 4.00 – 6.00 Cobalt ppm 0.10 – 0.20 0.10 – 0.20 25.00 0.10 - 0.15 25.00 0.10 0.10 25.00 100.00 Copper ppm 10.00 10.00 15.00 10.00-25.00 40.00 9.00 9.00 250.00 250.00 Iron ppm 40.00 40.00 500.00 35.00 – 95.00 500.00 40.00 50.00 500.00 4500.00 Magnesium % 0.12 – 0.18 0.12 0.60 0.18-0.40 0.60 0.09 0.10 0.80 0.57 1.12 Manganese ppm 40.00 40.00 2000.00 40.00-1000.0 2000.00 40.00 40.00 400.00 4000.00 Molybdenum ppm 0.50 0.50 5.00 0.10 – 1.00 1000.00 350.00 500.00 Phosphorus % 0.20 – 0.30 0.25 0.60 0.25-0.40 0.60 Potassium % 0.50 – 0.80 0.60 2.00 0.80-1.50 2.00 0.40 0.50 1.00 Selenium ppm 0.30 0.30 5.00 0.10-20.00 5.00 0.10 0.10 5.00 10.00 5.00 Sodium % 0.10 – 0.15 0.10 0.20 0.35 0.35 0.89 1.20 Sulfur % 0.15 – 0.25 0.15 0.30 – 0.50 0.20-0.30 0.30 – 0.50 0.15 0.15 0.50 0.81 Zinc ppm 30.00 30.00 300.00 40.00-500.00 40.00 40.00 500.00 800.00
All values on mineral table are taken from National Research Council (NRC) resources. Mineral requirements for horses vary by purpose, activity level, age group and sex; for more detailed information, please refer to the NRC Requirements of Horses. Mineral requirements for poultry vary by species, breed and production purposes; for more detailed information, please refer to the NRC Nutrient Requirements of Poultry. Mineral requirements for sheep and goats vary by production stage, weight, and breed type; for more detailed information, please refer to the NRC Nutrient Requirements of Small Ruminants.

Rebecca J. Kern, M.S., Professional Animal Scientist Raymond C. Ward, Ph.D., Certified Professional Soil Scientist
Feed Testing › 24
Protein
Crude protein is not actually a measurement of the protein content of a feed, but the nitrogen. Total nitrogen of the sample is measured by combustion. The resulting value is multiplied by 6.25 for most feeds except wheat grains, which are multiplied by 5.70, and milk, which is multiplied by 6.38.
Protein provides the animal with essential amino acids made up of carbon and nitrogen, which are utilized to meet most animal performance goals including growth, reproduction and lactation. It is one of the most important nutrients to consider when balancing a ration or diet.
Soluble Protein
Measures the amount of protein not associated with large carbohydrates.
This form of protein is particularly of interest in the ruminant diet because soluble protein is the protein in the diet which will feed the rumen microbes. When balancing a ruminant diet, several fractions of protein must be accounted for. Soluble protein is an estimate of the protein which will be degraded in the rumen and utilized by the microbes, also known as rumen degradable protein (RDP). The portion of crude protein left is the undegradable intake protein (UIP) also referred to as bypass protein or rumen undegradable protein (RUP). The metabolizable protein (MP) of a ruminant animal is the amino acids absorbed in the small intestine. The MP is composed of fed bypass protein, and protein provided by rumen microbes which have washed out of the rumen. To meet the protein needs of a ruminant, a producer must feed the microbes and the animal through RDP and RUP. This is unique because the protein needs of the microbes can be met through feeding non-protein nitrogen.
Non-Protein Nitrogen (NPN)
Measures the amount of urea or ammonia available to microbes for growth and protein production.
Urea is a cheap source of nitrogen which can only be utilized by ruminants. Urea is fed to the ruminant and the microbes in the rumen convert the urea to protein through their own growth and reproduction. The microbially produced protein can then be utilized by the ruminant animal for their own maintenance, growth and reproduction requirements. Ammonia treated, low quality forages, such as corn stovers and straw, are also a cheap way to increase both digestibility and crude protein. The ammonia breaks down the fibers in the feed, thereby increasing digestibility while rumen microbes convert a portion of the ammonia to microbial protein to be utilized by the ruminant animal. Knowing the amount of urea or ammonia the microbes are receiving can help a producer approximate protein gained from feed sources when formulating a diet or ration.
Damaged Protein or Acid Detergent Insoluble Protein (ADIP)
Measures proteins bound to lignin which have become biologically unavailable.
Feeds stored under conditions with high moisture and high oxygen result in heating of the feed which causes proteins to bind to lignin and caramelization of the feed resulting in increased palatability which means the animal will likely consume more of the feed. If too much heat damaged protein is in a feed, it is suggested that an adjusted crude protein value be used for ration balancing and diet formulation. If the ratio of CP:ADIP is at or below 14, the crude protein does not need to be adjusted.
If CP:ADIP is above 14, the crude protein should be adjusted as follows:
𝐴𝑑𝑗𝑢𝑠𝑡𝑒𝑑 𝐶𝑃 = (𝑟𝑎𝑡𝑖𝑜−7
100) × 𝐶𝑃
If the CP:ADIP ratio is at or above 20, the crude protein should be adjusted as follows:
𝐴𝑑𝑗𝑢𝑠𝑡𝑒𝑑 𝐶𝑃 = 𝐶𝑃 − 𝐴𝐷𝐼𝑃

Rebecca J. Kern, M.S., Professional Animal Scientist Raymond C. Ward, Ph.D., Certified Professional Soil Scientist
Feed Testing › 25
Crude Fat or Ether Extract (EE)
The measurement of the fat percentage.
Fat is an important nutrient. First, fat provides 2.25 times more energy than carbohydrates making it very important in the proximate analysis energy prediction of the feed. Second, fats also deliver fat soluble vitamins A, D, E, and K. Consumption of a low-fat diet may result in fat soluble vitamin deficiencies. Third, fat plays a key role in animal health, growth, and reproduction, thus directly affecting production performance. Finally, a diet with more than 7% fat adversely affects fiber digestion in ruminants.
Crude Fiber (CF)
The slowly or indigestible portion of the feed, including cellulose and portions of hemicellulose, lignin, and other indigestible nutrients.
Crude fiber is an estimation of feed digestibility. The feed is treated with an acidic solution, which removes sugars and starches, and an alkaline solution, which removes some but not all hemicellulose and lignin. Fiber is important to the health of the lower gastrointestinal tract in all species.
Acid Detergent Fiber (ADF)
The least digestible portion of a feed and indicates the indigestibility of a feed and contains cellulose, lignin, pectin, but not hemicellulose.
The energy and digestibility of a feed can be predicted solely from ADF. ADF has an inverse relationship with digestibility and energy value of a feed. As ADF increases, the digestibility and energy of the feed decreases and as ADF decreases, the digestibility and energy of the feed increases. ADF is required to calculate the relative feed value (RFV) and relative forage quality (RFQ).
Neutral Detergent Fiber (NDF)
Represents the indigestible and slowly digestible portion of a feed and contains cellulose, hemicellulose, lignin, but not pectin.
NDF is always greater than ADF because the percentage of hemicellulose in a feed is greater than pectin. Feed intake can be predicted based on the NDF value of a feed. As NDF increases, intake decreases and as NDF decreases, intake increases. NDF is used to calculate relative feed value (RFV). Grasses generally have higher NDF values than legumes and NDF increases with plant maturity.
Lignin
An indigestible compound prevalent in straw, woods, and hulls. High lignin content in a feed indicates low feed digestibility.
Nitrogen Free Extract (NFE)
A calculated value estimating the amount of soluble carbohydrates (sugars and starches) in a feed. NFE is calculated for proximate analysis using the equation:
𝑁𝐹𝐸 = 100 − (𝑤𝑎𝑡𝑒𝑟 + 𝑎𝑠ℎ + 𝐶𝑃 + 𝐶𝐹 + 𝐸𝐸)

Rebecca J. Kern, M.S., Professional Animal Scientist Raymond C. Ward, Ph.D., Certified Professional Soil Scientist
Feed Testing › 26
Total Sugars Invert (TSI)
Measures the total amount of sugar in a feed. Feeds guaranteed based on sugar content, such as molasses and other syrups, are generally tested for total sugar invert (TSI). Horse owners may test hay for TSI if equine diabetes is a concern. Cane molasses are guaranteed to be greater than 46% TSI and beet molasses are guaranteed to be greater than 48% TSI.
Total Starch
A measurement of the starch, a rapidly available carbohydrate, in feed. Starch is an energy indicator. High starch feeds are generally high energy feeds such as cereal grains, corn, and corn silage. A high starch diet indicates a risk for bloating in feedlot steers.
Available Starch
The amount of starch available for rumen microbes. Available starch should be analyzed when grain-induced frothy bloat is a concern. This often occurs in feed yards when a high starch diet is introduced too fast without a step-up program in place.
The pH of Feed
pH
A scale to measure the acidity or basicity of a substance. The scale ranges from 0 to 14 with 7 defined as neutral. A pH value below 7 is acidic or has more free hydrogen (H+) ions available to form a covalent bond, and a pH above 7 is basic, or has less free hydrogen ions available and more free hydroxyl (OH-) ions available to form a covalent bond. The pH is a particularly important measurement for ensiled feeds such as corn silage and haylages as pH can be an indicator that a feed was ensiled properly. Typically, corn silage is more acidic than haylages. There are several causes for a pH higher than expected including:
1. low moisture silage 2. incomplete fermentation 3. sampling too early and 4. spoilage by mold and or clostridia bacteria.
Below are expected pH ranges for ensiled feeds:
Table 5: Expected pH Ranges for Ensiled Feeds
Silage Type: Legume Legume Grass Corn
Dry Matter (%) 30 – 40 45 – 55 30 – 35 30 – 40
pH 4.3 – 4.7 4.7 – 5.0 4.3 – 4.7 3.7 – 4.2
Energy Values
Total Digestible Nutrients (TDN)
The sum of digestible crude protein, indigestible crude fiber, digestible nitrogen free extract, and digestible ether extract (fat). The TDN value is used to predict energy values of feed for beef cattle, dairy cattle, sheep, and goats. The TDN of a feed can be calculated through proximate analysis, estimation from the ADF or estimation from the CF. Proximate analysis is the most accurate predictive value of TDN as it utilizes CP, CF, NFE, and EE. Estimation from ADF or CF are less accurate, however require less laboratory testing and are less expensive.

Rebecca J. Kern, M.S., Professional Animal Scientist Raymond C. Ward, Ph.D., Certified Professional Soil Scientist
Feed Testing › 27
Energy Values
Used to balance rations to ensure the animal has adequate energy to meet production and performance goals.
Digestible Energy (DE)
The amount of energy absorbed through the gastrointestinal tract and available for metabolism, or the gross energy of the feed minus energy losses through feces.
Metabolic Energy (ME)
The digestible energy minus energy losses through urine and gasses.
Net Energy (NE)
The metabolic energy minus the energy lost through heat increment.
NEm - the net energy value of feeds for maintenance calculated from TDN. NEg - the net energy value of feeds for the deposition of body tissue, growth or gain calculated from TDN. NEl - net energy of lactation calculated from ADF.
Below are the NRC energy equations for various species of livestock:
Beef Cattle 2000:
𝑫𝑬 (𝑴𝒄𝒂𝒍/𝒌𝒈) = 𝟎. 𝟎𝟒𝟒𝟎𝟗 𝒙 %𝑻𝑫𝑵 𝑴𝑬 (𝑴𝒄𝒂𝒍/𝒌𝒈) = 𝟎. 𝟖𝟐 𝒙 𝑫𝑬
𝑁𝐸𝑚 = 1.37𝑀𝐸 − 0.138𝑀𝐸2 + 0.0105𝑀𝐸3 − 1.12
𝑁𝐸𝑔 = 1.42𝑀𝐸 − 0.174𝑀𝐸2 + 0.0122𝑀𝐸3 − 1.65
The above equations are also used for sheep and goats.
Dairy Cattle 2001:
𝑫𝑬 (𝑴𝒄𝒂𝒍/𝒌𝒈) = 𝟎. 𝟎𝟒𝟒𝟎𝟗 𝒙 %𝑻𝑫𝑵 𝑴𝑬 (𝑴𝒄𝒂𝒍/𝒌𝒈) = 𝟏. 𝟎𝟏 𝒙 𝑫𝑬 − 𝟎. 𝟒𝟓
𝑁𝐸𝑚 = 1.37𝑀𝐸 − 0.138𝑀𝐸2 + 0.0105𝑀𝐸3 − 1.12
𝑁𝐸𝑔 = 1.42𝑀𝐸 − 0.174𝑀𝐸2 + 0.0122𝑀𝐸3 − 1.65
Swine 2012:
𝑫𝑬 (𝑲𝒄𝒂𝒍/𝒌𝒈) = 𝟒𝟏𝟔𝟖 − (𝟗. 𝟏 𝒙 %𝒂𝒔𝒉) + (𝟏. 𝟗 𝒙 %𝒑𝒓𝒐𝒕𝒆𝒊𝒏) + (𝟑. 𝟗 𝒙 %𝒇𝒂𝒕) − (𝟑. 𝟔 𝒙 %𝑵𝑫𝑭) 𝑴𝑬 (𝑲𝒄𝒂𝒍/𝒌𝒈) = 𝟒𝟏𝟗𝟒 − (𝟗. 𝟐 𝒙 %𝒂𝒔𝒉) + (𝟏. 𝟎 𝒙 %𝒑𝒓𝒐𝒕𝒆𝒊𝒏) + (𝟒. 𝟏 𝒙 %𝒇𝒂𝒕) − (𝟑. 𝟓 𝒙 %𝑵𝑫𝑭)
𝑁𝐸 (𝐾𝑐𝑎𝑙/𝑘𝑔) = (0.73 𝑥 𝑀𝐸) + (1.33 𝑥 %𝑓𝑎𝑡) + (0.39 𝑥 %𝑠𝑡𝑎𝑟𝑐ℎ) − (0.62 𝑥 %𝑝𝑟𝑜𝑡𝑒𝑖𝑛) − (0.83 𝑥 %𝐴𝐷𝐹)
Horses 2007:
𝑫𝑬 (𝑴𝒄𝒂𝒍/𝒌𝒈) = 𝟒. 𝟎𝟕 − (𝟎. 𝟎𝟓𝟓 𝒙 𝑨𝑫𝑭)
Other horse equations need to be customized based on the animal’s weight, age, sex, pregnancy and or lactation status, exercise, etc.
Poultry:
Equations vary greatly depending on the species of bird and require a correction for urea excretion in the fecal material.

Rebecca J. Kern, M.S., Professional Animal Scientist Raymond C. Ward, Ph.D., Certified Professional Soil Scientist
Feed Testing › 28
Forage Quality Indexes
Relative Feed Value (RFV)
Relative feed value is an index to determine the quality of legume hays. The digestible dry matter of a feed is calculated using the ADF and the dry matter intake is calculated from the NDF of a feed. The RFV is dependent on various factors which affect the ADF and NDF fiber content of the feed including the forage or feed type, plant maturity, irrigation, time of day when harvested, and drying conditions. Relative feed value is very important when buying and selling legume hay including alfalfa.
𝐷𝑖𝑔𝑒𝑠𝑡𝑖𝑏𝑙𝑒 𝐷𝑟𝑦 𝑀𝑎𝑡𝑡𝑒𝑟 = 88.9 − (0.779 × % 𝐴𝐷𝐹) 𝐷𝑟𝑦 𝑀𝑎𝑡𝑡𝑒𝑟 𝐼𝑛𝑡𝑎𝑘𝑒 = 120/(% 𝑁𝐷𝐹)
𝑅𝐹𝑉 = 𝐷𝑖𝑔𝑒𝑠𝑡𝑖𝑏𝑙𝑒 𝐷𝑟𝑦 𝑀𝑎𝑡𝑡𝑒𝑟 × 𝐷𝑟𝑦 𝑀𝑎𝑡𝑡𝑒𝑟 𝐼𝑛𝑡𝑎𝑘𝑒 / 1.29
USDA Quality Guidelines for alfalfa hay (not more than 10% grass). Guidelines used for reporting economic data across the United States, and adapted in 2002 (2003 USDA Livestock, Hay & Grain Market News, Moses Lake, WA)
Table 6: USDA Quality Guidelines for Alfalfa
Category ADF (%) NDF (%) RFV TDN (%) CP (%)
Supreme < 27 < 34 > 180 > 62 > 22
Premium 27 – 29 34 – 36 150 – 180 60.5 – 62 20 – 22
Good 29 – 32 36 – 40 125 – 150 58 – 60 18 – 20
Fair 32 – 35 40 – 44 100 – 125 56 – 58 16 – 18
Utility > 35 > 44 < 100 < 56 < 16
All figures are expressed on a dry matter basis.
Relative Forage Quality (RFQ)
Relative forage quality is an index of both legume hay and grass hay.
𝑅𝐹𝑄 = 𝐷𝑟𝑦 𝑀𝑎𝑡𝑡𝑒𝑟 𝐼𝑛𝑡𝑎𝑘𝑒 × 𝑇𝑜𝑡𝑎𝑙 𝐷𝑖𝑔𝑒𝑠𝑡𝑖𝑏𝑙𝑒 𝑁𝑢𝑡𝑟𝑖𝑒𝑛𝑡𝑠 /1.23
Table 7: Relative Forage Quality Suggested for Different Cattle Types
Relative Forage Quality Cattle Type
100 – 200 Heifer (18 – 24 mo.). Dry Cow
140 – 160 Dairy Cow (1st 3 mo. of lactation). Dairy Calf
125 – 150 Dairy Cow (last 200 days lactation). Heifer (3 – 12 mo.) Stocker Cattle
115 – 130 Heifer (12 – 18 mo.). Beef Cow/Calf Pairs
(Adapted from: Undersander, 2003)
Grass Hay Quality
Grass hay quality is also categorized based on crude protein percentage dry matter basis.

Rebecca J. Kern, M.S., Professional Animal Scientist Raymond C. Ward, Ph.D., Certified Professional Soil Scientist
Feed Testing › 29
Table 8: Grass Hay Quality
Category Crude Protein (%)
Premium > 13
Good 9 – 13
Fair 1st 5 – 9
Low < 5
Near-Infrared Spectroscopy (NIRS)
Near-Infrared Spectroscopy (NIRS): Determines quantities of nutrients in feed based on light reflected from near-infrared wavelengths and NIRS Forage and Feed Testing Consortium calibration equations. The reflectance of a test sample is mathematically compared with the spectra of reference samples previously assayed by standardized and industry approved wet chemistry methods to determine nutrient concentrations.
NIRS follows the same principles of many wet chemistry analysis. It compares an unknown sample to a database of known samples similar to using a standard curve in other analysis. Our near infrared reflectance system is calibrated to read from 850 to 2500 nm wavelengths and determines the feed component values based on reflectance. NIRS results can be obtained in minutes, supporting a quick turn-around time, and is less than half the cost of the wet chemistry equivalent. NIRS is a secondary method of analysis which can only be as accurate as the wet chemistry it is based on. However, it can be a more repeatable method due to less sample handling steps. NIRS is an accepted method for protein, fiber, fat and other macromolecule analysis. However, NIRS has difficulty determining small molecule abundance and minerals are not accurately represented using this method. Additionally, not all feeds can be tested using NIR. Forages, legume and grass hays, ensiled feeds, and corn grain generally encompass the feeds that can be tested for nutrient values using NIRS. Utilizing NIRS for analysis instead of a simple wet chemistry crude protein and ADF can tell you more about the forage such as digestibility, water soluble carbohydrate content and more for a very similar cost. Other feeds and mixed feeds such as bunk samples and rations must be tested through wet chemistry.
Table 9: NIR Recommended and Wet Chemistry Required Tests
NIR Recommended Wet Chemistry Required
Legume Hays Any Non-Corn Grain
Grass Hays Rations and Mixed Feeds
Green Chop Seeds
Fresh Forages Minerals and Concentrated Feeds
Legume/Grass Hay Mixes Soybean Meal and other Meals
Haylages Milk and Milk Replacers
Small Grain Silages Distillers Grains and By-products
Corn Silage Liquid feeds
Earlage
Corn Grain

Rebecca J. Kern, M.S., Professional Animal Scientist Raymond C. Ward, Ph.D., Certified Professional Soil Scientist
Feed Testing › 30
Toxicity and Animal Health Related Tests
Nitrate Poisoning
Nitrate poisoning occurs when animals, most commonly cattle and horses, consume nitrates. There are two types of nitrate poisoning which depend on the physiological state of the animal and the level of nitrate exposure. Chronic nitrate toxicity occurs when animals under physiological stress, such as pregnancy, lactation or illness, consume moderate levels of nitrate for several days. The symptoms of chronic toxicity are reduced appetite, weight loss, diarrhea, or no symptoms at all. Chronic nitrate toxicity can result in abortions without warning signs. Acute nitrate toxicity is the consumption of high levels of nitrate rapidly which can result in cyanosis and sudden death. The nitrates are converted to nitrite in the rumen by the microorganisms, when the cattle belch, they inhale the nitrite which then binds to the hemoglobin in the cattle’s blood preventing the binding of oxygen to the blood cells resulting in nitrate poisoning. Nitrate accumulation in a forage is dependent on plant species, maturity, part of the plant, environmental conditions, and management factors. Species of nitrate accumulating plants include sorghums, sudan grass, millets, oats, Johnson grass, broadleaf weeds, corn, sunflowers, and very rarely, under high stress conditions, soybeans and alfalfa. Mature plants tend to accumulate less nitrates than young plants or regrowth. Additionally, nitrates tend to accumulate in the lower third of the stock of the plant, making leaves and stems less likely to contain nitrates. Stressful environmental conditions including drought and frost cause a plant to accumulate nitrates due to the inability to convert them into plant proteins. The most prevalent management practice resulting in high nitrate forages is nitrogen fertilization. Increased nitrogen in the soil may increase yields, but it will also increase the amount of nitrate uptake by the plant.
Table 10: Animal Response to Nitrate-Nitrogen Concentrations
NO3-N ppm “dry basis” Animal Response
< 1400 Safe
1400 – 2100 Marginal, use caution when feeding. Can cause reduced milk production, abortions and low rate of gain. It would be best to limit daily use to ½ of the total daily dry matter intake.
2100 – 3000 Potentially Toxic, feeds in this range should be limited to 1/3 of the total daily dry matter intake
3000 – 4000 Toxic, feeds in this range should be limited to 1/4 of the total daily dry matter intake.
4000 – 5000 Very Toxic, feeds in this range should only be 10 – 15 % of the total daily dry matter intake as a part of a well-mixed TMR.
> 5000 Do not feed – death may occur.
Feeding Forages with Nitrates
Several strategies can be adopted to use forages with high nitrate contents. Ensiling the forage can reduce nitrate levels by 40 to 60%. High nitrate forages can be grazed, however; cattle should be fed a dry roughage first to decrease and control intake levels of the high nitrate forage. If the forage has been harvested and baled, dilution with other feeds, mixed into a balanced ration, or grain supplementation can be used to decrease nitrate levels. Cattle can adapt to moderate nitrate feeds gradually through feeding limited amounts of nitrate throughout the day rather than a high amount in one meal. Never feed high nitrate feeds to cattle in a stressed physiological state.

Rebecca J. Kern, M.S., Professional Animal Scientist Raymond C. Ward, Ph.D., Certified Professional Soil Scientist
Feed Testing › 31
Prussic Acid (Cyanide, HCN)
Specific species of plants including sorghums, sudan grass, flax, birdsfoot trefoil, Johnson grass, and wild cherry or choke cherry leaves under certain growing conditions produce hydrogen cyanide (HCN), the poisonous gas responsible for prussic acid poisoning. This poisonous gas is released after plants are damaged from freezing, crushing or cutting. The crushing or cutting may include chewing action by animals. Cyanide is absorbed into the animal’s blood, binds to red blood cells and prevents oxygen from binding, and results in animal death by asphyxiation. While prussic acid poisoning works quickly resulting in sudden death, symptoms of the intoxication include excessive salivation, difficult breathing, staggering convulsions and collapse.
Growing conditions for cyanide accumulation in plants include the growth stage, plant maturity, soil fertility, and stressful growing conditions such as frost or drought. Young plants, new regrowth leaves and stems accumulate more cyanide than a mature plant. Soils high in nitrogen and low in phosphorus and potassium typically yield plants with more prussic acid accumulation than well balanced soils. Therefore, it is recommended that phosphorus and potassium levels should be maintained per recommendations provided by a soil test report. Drought stunts the growth of plants, leaving mature plants with cyanide accumulation. Freezing breaks cell walls causing the release of cyanide, which will dissipate within 3-5 days. Therefore, cattle should not graze plants listed for cyanide poisoning for at least 4 days after a frost. Additionally, regrowth after a frost or drought conditions accumulates cyanide and producers should test before grazing or harvesting under those conditions.
When feeding forages potentially high in prussic acid, animals should not be stressed or hungry to avoid over consumption of potentially hazardous feed. This is most often a concern when grazing. Selectively grazing on leaves and stems instead of consuming the entire plant can be a factor in prussic acid poisoning. Cyanide dissipates after harvest with proper storage and drying techniques. Green chop is typically safer to feed than allowing grazing because it decreases the animal’s ability to select only leaves and stems high in cyanide. It is recommended that a sorghum silage not be fed until after 3 weeks of proper storage and fermentation. Hay loses more than 75% of the cyanic acid during the drying process and is generally not the source of prussic acid poisoning.
Table 11: Animal Response to Prussic Acid
Prussic Acid (HCN) (ppm wet basis) Comment
< 200 This feed should not cause prussic acid poisoning.
200 – 600 This feed may be potentially toxic, so it should be fed at a restricted rate. If pastured, animals should be closely observed during that part of the day and removed if they show any signs of discomfort.
> 600 This feed is potentially very toxic, so it should be fed at a very restricted rate, if at all. Drying, ensiling, or allowing to mature more fully should reduce its prussic acid content.
Mold on Feeds
Mold on feeds decreases production value of the feed. The decreased digestibility of feed and reduced palatability will decrease intake and energy contents potentially up to 5%. Any spore count below 1 million spores per gram is considered relatively safe. Molds also pose a potential threat to animal and human health via the respiratory tract. This happens when released or dislodged spores are inhaled. Symptoms and irritations of spore inhalation can be more severe in individuals with allergies or asthma. Proactive measures to reduce the risk of moldy foods include: cleaning storage areas and equipment, avoid storing grains at high moisture levels (approximately higher than 12%), checking stored feeds frequently for signs of damage and deterioration due high moisture or heat, and using preservatives and microbial additives when ensiling a feed.

Rebecca J. Kern, M.S., Professional Animal Scientist Raymond C. Ward, Ph.D., Certified Professional Soil Scientist
Feed Testing › 32
Table 12: Feeding Risks at Various Mold Spore Counts
Spores per gram at 90% of Dry Matter Feeding Risks and Cautions
Under 500,000 Low Count
500,000 – 1,000,000 Relatively Safe
1,000,000 – 2,000,000 Discount Energy (95%) Feed with Caution of Health Risks
2,000,000 – 3,000,000 Discount Energy (95%) Feed with Caution of Health Risks Closely Observe Animals and Performance
3,000,0000 – 5,000,000
Discount Energy (95%) Feed with Caution of Health Risks Closely Observe Animals and Performance Dilute with Other Feeds
Over 5,000,000 Discontinue Feeding
(Adapted from: Adams, Kephart, Ishler, Hutchinson, and Roth)
Aflatoxin
Aflatoxin is a specific type of mycotoxin; mycotoxin production is often accompanied by high mold counts and under performance with no obvious explanation. Two specific strains of mold or fungi Aspergillus flavus and A. parasiticus produce aflatoxin. These molds show up as gray or olive green patches on kernels. In feeds, the toxin can reduce animal health and performance. Feeds typically affected include corn, peanuts, cottonseeds, and milo. Aflatoxin generally is not found consistently throughout a feed but is often localized to one area of the storage container. A representative sample should be taken from streaming grain when storing or moving the feed. While the consequences of aflatoxin are most often decreased feed and reproductive efficiency, it has resulted in the death of some animals. It is also a human health concern because aflatoxins in a dairy cow diet can be present in milk.
A producer can take several steps to prevent aflatoxin in feed. The first is insect control, both early in the field and during feed storage. Second, observe cereal grains for gray or green mold; early detection is advantageous to determine a solution and prevent further contamination of feeds. Take action with machinery to minimize damage to grains. An undamaged grain cell wall can resist penetration by mold spores. Always clean storage bins and equipment before and after use. Finally, if aflatoxin becomes prevalent, fungicides may be considered.
Table 13: FDA Guidelines for Acceptable Aflatoxin Level in Corn Based on Intended Use
Intended Use Aflatoxin Level (ppb)
Milk (lactating dairy feed) None detected
Unknown < 20
Feed for young animals < 20
Dairy cattle < 20
Breeding beef cattle, swine, and mature poultry < 100
Finishing swine < 200
Finishing cattle < 300

Rebecca J. Kern, M.S., Professional Animal Scientist Raymond C. Ward, Ph.D., Certified Professional Soil Scientist
Feed Testing › 33
Grain Particle Size
Grain particle size is often overlooked. Processing livestock feeds often increases digestibility by increasing the surface area, allowing greater microbes attachment locations and greater enzyme activity. However, if the grain is ground too fine and too small, it can cause gastric ulcers, which decrease daily intake, lowering production. Swine are most often affected by gastric ulcers due to particle size of the feed. The optimum particle size for a swine diet to maximize feed efficiency and minimize gastric ulcers is 700-800 microns.
Frequently Asked Questions
Q: What are the nitrate levels in my area?
A: Nitrate levels are affected by many factors including plant species, soil conditions, and production management such as irrigation and especially fertilization. Nitrate levels, even within the same field, may not be the same, and the same goes for nitrate levels in your area. If there is a potential nitrate concern, we recommend you test the feed for nitrates. Additional extension materials regarding nitrate risks can be provided, if requested, to help you make an informed decision about testing for nitrates.
Q: What are the energy values and protein levels for this year’s corn silage?
A: While an inference can be made as to the average energy values for corn silage, variance exists among producers. Additionally, our database is not searchable by feed type and records are not generated or kept for average sample statistics. If you are trying to balance a total mixed ration, it is recommended you test to avoid over feeding or underfeeding animals. Our estimate by looking through samples is not accurate for your corn silage sample.
Q: Can I add tests to my report after I have received my results?
A: Yes, we keep your samples for 30 days. For this reason, please review your results as soon as possible and call with additional requests while the sample is still available.
Q: I would like to test for something not found on the Ward Laboratories, Inc. website or listed on the Fee Schedule. What can I do?
A: We are happy to refer you to a lab that performs a test we do not offer or send your sample to another lab for a $10 fee. Some commonly requested tests we send to other labs include ionophore quantification, microbial identification, vitamin quantification and selenium levels.
Q: I am having trouble interpreting my report. What can I do?
A: We welcome your calls and emails to help you interpret your report. We have an animal scientist ([email protected]) on staff who can walk you through your results and provide additional extension materials to help you understand the results of your testing report.

Fertilizer Recommendations › 34
FERTILIZER
RECOMMENDATIONS
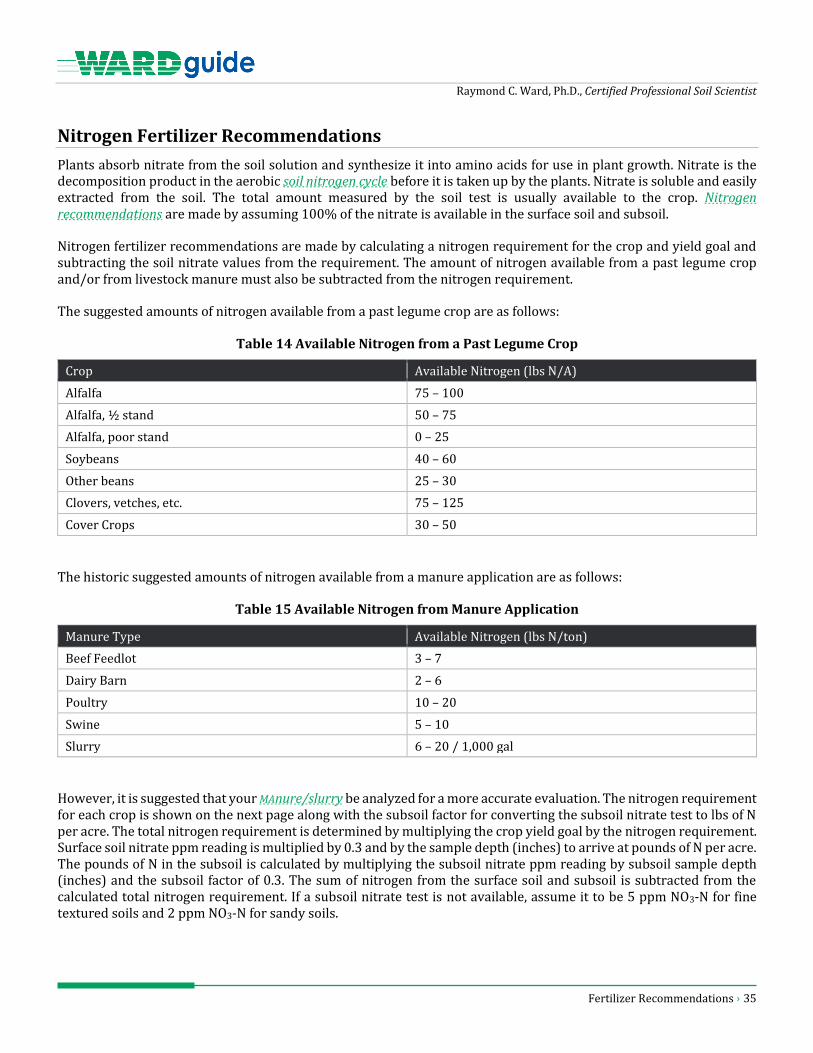
Raymond C. Ward, Ph.D., Certified Professional Soil Scientist
Fertilizer Recommendations › 35
Nitrogen Fertilizer Recommendations
Plants absorb nitrate from the soil solution and synthesize it into amino acids for use in plant growth. Nitrate is the decomposition product in the aerobic soil nitrogen cycle before it is taken up by the plants. Nitrate is soluble and easily extracted from the soil. The total amount measured by the soil test is usually available to the crop. Nitrogen recommendations are made by assuming 100% of the nitrate is available in the surface soil and subsoil.
Nitrogen fertilizer recommendations are made by calculating a nitrogen requirement for the crop and yield goal and subtracting the soil nitrate values from the requirement. The amount of nitrogen available from a past legume crop and/or from livestock manure must also be subtracted from the nitrogen requirement.
The suggested amounts of nitrogen available from a past legume crop are as follows:
Table 14 Available Nitrogen from a Past Legume Crop
Crop Available Nitrogen (lbs N/A)
Alfalfa 75 – 100
Alfalfa, ½ stand 50 – 75
Alfalfa, poor stand 0 – 25
Soybeans 40 – 60
Other beans 25 – 30
Clovers, vetches, etc. 75 – 125
Cover Crops 30 – 50
The historic suggested amounts of nitrogen available from a manure application are as follows:
Table 15 Available Nitrogen from Manure Application
Manure Type Available Nitrogen (lbs N/ton)
Beef Feedlot 3 – 7
Dairy Barn 2 – 6
Poultry 10 – 20
Swine 5 – 10
Slurry 6 – 20 / 1,000 gal
However, it is suggested that your MAnure/slurry be analyzed for a more accurate evaluation. The nitrogen requirement for each crop is shown on the next page along with the subsoil factor for converting the subsoil nitrate test to lbs of N per acre. The total nitrogen requirement is determined by multiplying the crop yield goal by the nitrogen requirement. Surface soil nitrate ppm reading is multiplied by 0.3 and by the sample depth (inches) to arrive at pounds of N per acre. The pounds of N in the subsoil is calculated by multiplying the subsoil nitrate ppm reading by subsoil sample depth (inches) and the subsoil factor of 0.3. The sum of nitrogen from the surface soil and subsoil is subtracted from the calculated total nitrogen requirement. If a subsoil nitrate test is not available, assume it to be 5 ppm NO3-N for fine textured soils and 2 ppm NO3-N for sandy soils.

Raymond C. Ward, Ph.D., Certified Professional Soil Scientist
Fertilizer Recommendations › 36
Table 16 Nitrogen Requirements and Subsoil Factors for Various Crops
Crop Nitrogen Required Subsoil Factor
Corn 1.1 lbs / bu 0.3
Milo 1.15 lbs / bu 0.3
Popcorn 1.3 lbs / bu 0.3
Seed Corn 1.4 lbs / bu 0.3
Corn Silage 9.9 lbs / ton 0.3
Sorghum Silage 8.5 lbs / ton 0.3
Feed-Hay 25 lbs / ton 0.3
Sudan Hay 27 lbs / ton 0.3
Soybeans 0 0.0
Pinto Beans 1.45 lbs / bu 0.3
Great Northern Beans 1.35 lbs / bu 0.3
Peanuts 3.0 lbs / cwt 0.3
Winter Wheat 2.4 lbs / bu 0.3
Spring Wheat 2.4 lbs / bu 0.3
Oats 1.3 lbs / bu 0.3
Rye 1.9 lbs / bu 0.3
Feed Barley 1.5 lbs / bu 0.3
Malting Barley 1.1 lbs / bu 0.3
Small Grain Silage 17 lbs / ton 0.3
Small Grain Hay 40 lbs / ton 0.3
Alfalfa 0 0.0
New Alfalfa 5 lbs / ton 0.3
Grass-Alfalfa 20 lbs / ton 0.3
Clover 0 0.0
Bromegrass 40 lbs / ton 0.3
Bermudagrass 40 lbs / ton 0.3
Fescue 35 lbs / ton 0.3
Native Grass 27 lbs / ton 0.3
Lovegrass 32 lbs / ton 0.3
Cool Grass 40 lbs / ton 0.3
Sugar Beets 8 lbs / ton 0.3
Sunflowers 0.05 lbs / lb 0.3
Potatoes 5.0 lbs / cwt 0.3
Cotton 0.1 lbs / lb 0.3
Millet 1.7 lbs / bu 0.3
Onions 0.25 lbs / cwt 0.3
Melons 14 lbs / ton 0.3
Garden 110 lbs / unit 0.3
The nitrogen rate for these legume crops is calculated on the basis of the P2O5 requirement. The N requirement is based on a 1:3 ratio (N:P2O5).

Raymond C. Ward, Ph.D., Certified Professional Soil Scientist
Fertilizer Recommendations › 37
Phosphorus Fertilizer Recommendations
Phosphorus fertilizer recommendations are developed from phosphorus soil test calibrations and crop requirements. The actual amount of phosphorus available for a growing crop is very difficult to measure. Phosphorus is held on surfaces of soil colloids as slightly soluble phosphorus compounds. Therefore, the soil test must estimate how quickly the slightly soluble phosphate will move from the colloid surfaces to the soil solution for plant uptake.
The availability of soil phosphorus is estimated from experimental data by investigating the yield response of phosphorus fertilizer applications with the phosphorus soil test value. After a number of years of experiments, a calibration curve can be drawn that shows the amount of yield response for each soil test category.
Each soil test range is an estimate of the percent sufficiency. A sufficiency of 80 % means the crop yield will only reach 80 % of its potential yield if phosphate fertilizer is not applied. Therefore, phosphate fertilizer yield response and sufficiency ranges can be estimated from the soil test ratings in Table 3-4.
Table 17: Sufficiency Ranges for Phosphorus Soil Tests
Mehlich P–3 / Bray P–1 (ppm P) Olsen – P (ppm P) % Sufficiency
0 – 5 0 – 3 25 – 50
6 – 12 4 – 8 45 – 80
13 – 25 9 – 16 70 – 95
26 – 50 17 – 31 90 – 100
51 + 32 + 100
Phosphorus fertilizer rate suggestions for many crops at a standard yield are shown in Table 3-6 on the next page. If a different yield goal is desired, the P2O5 rate is adjusted according to the value in the right-hand column of the recommendation table on the next page.
Manure application will influence the final rate of phosphate fertilizer application. The manure application rate is multiplied by the amount of P2O5 per ton for the kind of manure used. This is then subtracted from the P2O5 rates determined from the recommendation table. It is best to analyze your manure/slurry for a more accurate evaluation.
Table 18: Recommended Manure Application Rates for Phosphorus
Manure Lbs. P2O5
Feedlot 7 – 15 / ton
Dairy 5 – 10 / ton
Slurry 5 – 20 / 1,000 gal
Swine 8 – 20 / ton
Poultry 20 – 40 / ton

Raymond C. Ward, Ph.D., Certified Professional Soil Scientist
Fertilizer Recommendations › 38
Table 19: Phosphorus Fertilizer Recommendations for Various Crops
Mehlich P-3 / Bray P-1, ppm P Standard Yield
P2O5 Adjustment Rate (+/-) Crop 0 – 5 6 – 12 13 – 25 26 – 50 5 1+
Corn 70 – 100 45 – 65 25 – 40 0 – 20 0 120 2.5 lbs. / 10 bu.
Milo 60 – 80 40 – 55 15 – 35 0 – 20 0 100 2.5 lbs. / 10 bu.
Popcorn 70 – 100 45 – 65 25 – 40 0 – 20 0 100 2.5 lbs. / 10 bu.
Seed Corn 70 – 100 45 – 65 25 – 40 0 – 20 0 60 2.5 lbs. / 10 bu.
Corn Silage 70 – 100 45 – 65 25 – 40 0 – 20 0 12 1.5 lbs. / ton
Sorghum Silage 70 – 90 45 – 65 25 – 40 0 – 20 0 15 1.5 lbs. / ton
Feed - Hay 50 – 65 35 – 50 20 – 35 0 – 20 0 3 4 lbs. / ton
Sudan Hay 50 – 65 35 – 50 20 – 35 0 – 20 0 3 4 lbs. / ton
Soybeans 50 – 70 35 – 45 20 – 30 0 – 15 0 35 5 lbs. / 10 bu.
Pinto Beans 50 – 70 35 – 45 20 – 30 0 – 15 0 ALL NONE
Great Northern Beans 50 – 70 35 – 45 20 – 30 0 – 15 0 ALL NONE
Peanuts 60 – 70 50 – 60 25 – 45 0 – 30 0 ALL NONE
Winter Wheat 65 – 85 50 – 60 25 – 45 0 – 20 0 45 3.2 lbs. / 10 bu.
Spring Wheat 45 – 60 35 – 45 20 – 30 0 – 20 0 35 3.2 lbs. / 10 bu.
Oats 45 – 60 35 – 45 20 – 30 0 – 20 0 80 1.5 lbs. / 10 bu.
Rye 45 – 60 35 – 45 20 – 30 0 – 20 0 45 2.5 lbs. / 10 bu.
Feed Barley 45 – 60 35 – 45 20 – 30 0 – 20 0 60 2 lbs. / 10 bu.
Malting Barley 45 – 60 35 – 45 20 – 30 0 – 20 0 60 2 lbs. / 10 bu.
Small Grain Silage 65 – 85 50 – 60 25 – 45 0 – 20 0 8 1.5 lbs. / ton
Small Grain Hay 65 – 85 50 – 60 25 – 45 0 – 20 0 4 4 lbs. / ton
Alfalfa 90 – 120 60 – 85 30 – 55 0 – 25 0 4 6 lbs. / ton
New Alfalfa 90 – 120 60 – 85 30 – 55 0 – 25 0 3 6 lbs. / ton
Grass-Alfalfa 65 – 80 45 – 60 25 – 40 0 – 20 0 5 5 lbs. / ton
Clover 70 – 95 50 – 65 25 – 45 0 – 20 0 4 6 lbs. / ton
Bromegrass 55 – 70 40 – 55 20 – 35 0 – 20 0 3 4 lbs. / ton
Bermudagrass 50 – 65 35 – 45 20 – 30 0 – 20 0 3 4 lbs. / ton
Fescue 55 – 70 40 – 55 20 – 35 0 – 20 0 3 4 lbs. / ton
Native Grass 35 – 45 20 – 30 0 – 20 0 0 ALL NONE
Lovegrass 45 – 60 35 – 45 20 – 30 0 – 20 0 ALL NONE
Cool Grass 55 – 70 40 – 55 20 – 35 0 – 20 0 3 4 lbs. / ton
Sugar Beets 105 – 120 85 – 100 55 – 80 30 – 50 0 20 2 lbs. / ton
Sunflowers 35 – 45 30 – 35 20 – 30 0 0 1800 1.2 lbs. / 100 lbs.
Potatoes 130 – 160 100 – 125 60 – 95 20 – 55 0 350 1.5 lb. / 10 cwt
Cotton 60 – 75 50 – 60 30 – 45 0 – 30 0 500 2 lbs. / 100 lbs.
Millet 45 – 55 35 – 45 20 – 30 0 – 20 0 ALL NONE
Onions 70 – 95 50 – 65 25 – 45 0 – 25 0 ALL NONE
Melons 80 – 100 55 – 75 30 – 50 0 – 30 0 ALL NONE
Garden 130 – 160 100 – 125 60 – 95 20 – 55 0 ALL NONE
The phosphorus recommendation rate for these various crops is based on P2O5 per acre.
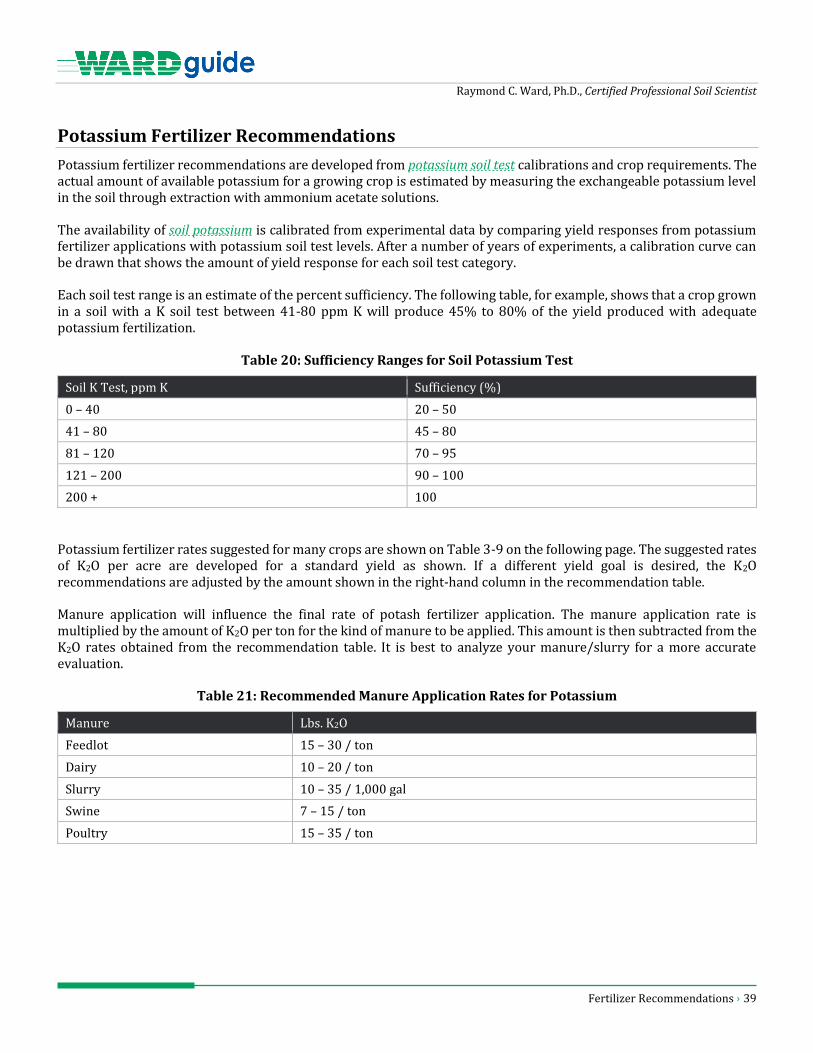
Raymond C. Ward, Ph.D., Certified Professional Soil Scientist
Fertilizer Recommendations › 39
Potassium Fertilizer Recommendations
Potassium fertilizer recommendations are developed from potassium soil test calibrations and crop requirements. The actual amount of available potassium for a growing crop is estimated by measuring the exchangeable potassium level in the soil through extraction with ammonium acetate solutions.
The availability of soil potassium is calibrated from experimental data by comparing yield responses from potassium fertilizer applications with potassium soil test levels. After a number of years of experiments, a calibration curve can be drawn that shows the amount of yield response for each soil test category.
Each soil test range is an estimate of the percent sufficiency. The following table, for example, shows that a crop grown in a soil with a K soil test between 41-80 ppm K will produce 45% to 80% of the yield produced with adequate potassium fertilization.
Table 20: Sufficiency Ranges for Soil Potassium Test
Soil K Test, ppm K Sufficiency (%)
0 – 40 20 – 50
41 – 80 45 – 80
81 – 120 70 – 95
121 – 200 90 – 100
200 + 100
Potassium fertilizer rates suggested for many crops are shown on Table 3-9 on the following page. The suggested rates of K2O per acre are developed for a standard yield as shown. If a different yield goal is desired, the K2O recommendations are adjusted by the amount shown in the right-hand column in the recommendation table.
Manure application will influence the final rate of potash fertilizer application. The manure application rate is multiplied by the amount of K2O per ton for the kind of manure to be applied. This amount is then subtracted from the K2O rates obtained from the recommendation table. It is best to analyze your manure/slurry for a more accurate evaluation.
Table 21: Recommended Manure Application Rates for Potassium
Manure Lbs. K2O
Feedlot 15 – 30 / ton
Dairy 10 – 20 / ton
Slurry 10 – 35 / 1,000 gal
Swine 7 – 15 / ton
Poultry 15 – 35 / ton

Raymond C. Ward, Ph.D., Certified Professional Soil Scientist
Fertilizer Recommendations › 40
Table 22: Potassium Fertilizer Recommendations for Various Crops
Soil K Level, ppm K Standard Yield
K2O Adjustment Rate (+/-) Crop 0 – 40 41 – 80 81 – 120 121 – 200 200 +
Corn 105 – 180 60 – 100 35 – 55 15 – 30 0 120 2 lbs. / 10 bu.
Milo 75 – 120 50 – 70 30 – 45 15 – 30 0 100 2 lbs. / 10 bu.
Popcorn 90 – 145 55 – 85 30 – 50 15 – 30 0 100 2 lbs. / 10 bu.
Seed Corn 105 – 180 60 – 100 35 – 55 15 – 30 0 60 2 lbs. / 10 bu.
Corn Silage 135 – 220 80 – 130 50 – 75 30 – 45 0 12 4 lbs. / ton
Sorghum Silage 135 – 220 80 – 130 50 – 75 30 – 45 0 15 3.5 lbs. / ton
Feed-Hay 80 – 130 50 – 75 30 – 45 0 – 25 0 3 12 lbs. / ton
Sudan Hay 80 – 130 50 – 75 30 – 45 0 – 25 0 3 12 lbs. / ton
Soybeans 90 – 145 55 – 85 30 – 50 0 – 25 0 3`5 6.5 lbs. / 10 bu.
Pinto Beans 90 – 145 55 – 85 30 – 50 0 – 25 0 ALL NONE
Great Northern Beans 90 – 145 55 – 85 30 – 50 0 – 25 0 ALL NONE
Peanuts 90 – 145 55 – 85 30 – 50 0 – 25 0 ALL NONE
W. Wheat 60 – 100 35 – 55 20 – 30 0 – 20 0 45 2.5 lbs. / 10 bu.
Sp. Wheat 60 – 100 35 – 55 20 – 30 0 – 20 0 35 3 lbs. / 10 bu.
Oats 60 – 100 35 – 55 20 – 30 0 – 20 0 80 2 lbs. / 10 bu.
Rye 60 – 100 35 – 55 20 – 30 0 – 20 0 45 2 lbs. / 10 bu.
Feed Barley 60 – 100 35 – 55 20 – 30 0 – 20 0 60 2.5 lbs. / 10 bu.
Malting Barley 60 – 100 35 – 55 20 – 30 0 – 20 0 60 2.5 lbs. / 10 bu.
Small Grain Silage 70 – 120 45 – 65 25 – 40 0 – 20 0 8 3.6 lbs. / ton
Small Grain Hay 70 – 120 45 – 65 25 – 40 0 – 20 0 4 12 lbs. / ton
Alfalfa 130 – 210 80 – 125 45 – 75 25 – 40 0 4 15 lbs. / ton
New Alfalfa 130 – 210 80 – 125 45 – 75 25 – 40 0 3 15 lbs. / ton
Grass-Alfalfa 130 – 210 80 – 125 45 – 75 25 – 40 0 5 14 lbs. / ton
Clover 130 – 210 80 – 125 45 – 75 25 – 40 0 4 15 lbs. / ton
Bromegrass 85 – 150 50 – 75 30 – 45 0 – 25 0 3 12 lbs. / ton
Bermudagrass 120 – 210 70 – 115 40 – 65 20 – 35 0 3 12 lbs. / ton
Fescue 85 – 150 50 – 75 30 – 45 0 – 25 0 3 12 lbs. / ton
Native Grass 55 – 100 30 – 50 15 – 25 0 0 ALL NONE
Lovegrass 70 – 120 40 – 65 25 – 35 0 – 20 0 ALL NONE
Cool Grass 85 – 150 50 – 75 30 – 45 0 – 25 0 3 12 lbs. / ton
Sugar Beets 130 – 210 80 – 125 45 – 75 25 – 40 0 20 5.0 lbs. / ton
Sunflowers 55 – 100 30 – 50 15 – 35 0 0 1800 12 lbs. / 1,000 lbs.
Potatoes 135 – 225 80 – 130 50 – 75 25 – 45 0 350 15 lb. / 100 cwt
Cotton 90 – 145 55 – 85 30 – 50 0 – 25 0 500 5 lbs. / 100 lbs.
Millet 60 – 100 35 – 55 20 – 30 0 – 20 0 ALL NONE
Onions 135 – 220 80 – 130 50 – 75 30 – 45 0 ALL NONE
Melons 135 – 220 80 – 130 50 – 75 30 – 45 0 ALL NONE
Garden 135 – 225 80 – 130 50 – 75 25 – 45 0 ALL NONE
Potassium recommendations are based on lbs K2O per acre.
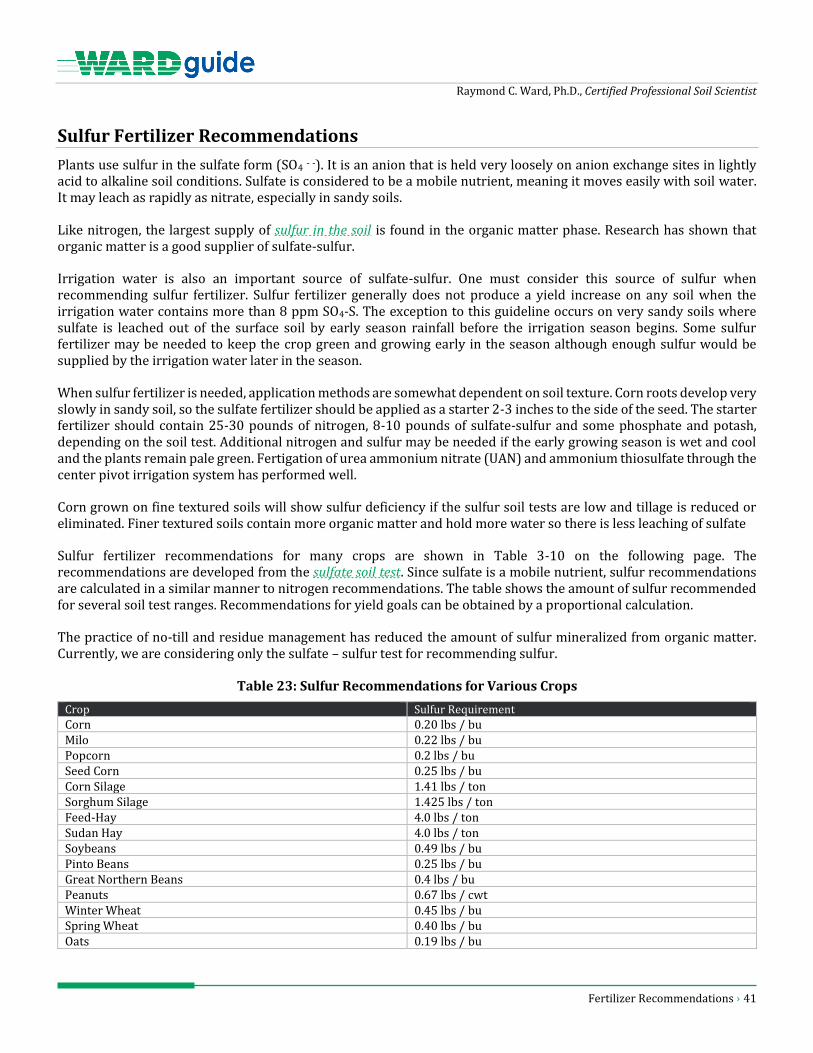
Raymond C. Ward, Ph.D., Certified Professional Soil Scientist
Fertilizer Recommendations › 41
Sulfur Fertilizer Recommendations
Plants use sulfur in the sulfate form (SO4 - -). It is an anion that is held very loosely on anion exchange sites in lightly acid to alkaline soil conditions. Sulfate is considered to be a mobile nutrient, meaning it moves easily with soil water. It may leach as rapidly as nitrate, especially in sandy soils.
Like nitrogen, the largest supply of sulfur in the soil is found in the organic matter phase. Research has shown that organic matter is a good supplier of sulfate-sulfur.
Irrigation water is also an important source of sulfate-sulfur. One must consider this source of sulfur when recommending sulfur fertilizer. Sulfur fertilizer generally does not produce a yield increase on any soil when the irrigation water contains more than 8 ppm SO4-S. The exception to this guideline occurs on very sandy soils where sulfate is leached out of the surface soil by early season rainfall before the irrigation season begins. Some sulfur fertilizer may be needed to keep the crop green and growing early in the season although enough sulfur would be supplied by the irrigation water later in the season.
When sulfur fertilizer is needed, application methods are somewhat dependent on soil texture. Corn roots develop very slowly in sandy soil, so the sulfate fertilizer should be applied as a starter 2-3 inches to the side of the seed. The starter fertilizer should contain 25-30 pounds of nitrogen, 8-10 pounds of sulfate-sulfur and some phosphate and potash, depending on the soil test. Additional nitrogen and sulfur may be needed if the early growing season is wet and cool and the plants remain pale green. Fertigation of urea ammonium nitrate (UAN) and ammonium thiosulfate through the center pivot irrigation system has performed well.
Corn grown on fine textured soils will show sulfur deficiency if the sulfur soil tests are low and tillage is reduced or eliminated. Finer textured soils contain more organic matter and hold more water so there is less leaching of sulfate
Sulfur fertilizer recommendations for many crops are shown in Table 3-10 on the following page. The recommendations are developed from the sulfate soil test. Since sulfate is a mobile nutrient, sulfur recommendations are calculated in a similar manner to nitrogen recommendations. The table shows the amount of sulfur recommended for several soil test ranges. Recommendations for yield goals can be obtained by a proportional calculation.
The practice of no-till and residue management has reduced the amount of sulfur mineralized from organic matter. Currently, we are considering only the sulfate – sulfur test for recommending sulfur.
Table 23: Sulfur Recommendations for Various Crops
Crop Sulfur Requirement
Corn 0.20 lbs / bu Milo 0.22 lbs / bu Popcorn 0.2 lbs / bu Seed Corn 0.25 lbs / bu Corn Silage 1.41 lbs / ton Sorghum Silage 1.425 lbs / ton Feed-Hay 4.0 lbs / ton Sudan Hay 4.0 lbs / ton Soybeans 0.49 lbs / bu Pinto Beans 0.25 lbs / bu Great Northern Beans 0.4 lbs / bu Peanuts 0.67 lbs / cwt Winter Wheat 0.45 lbs / bu Spring Wheat 0.40 lbs / bu Oats 0.19 lbs / bu

Raymond C. Ward, Ph.D., Certified Professional Soil Scientist
Fertilizer Recommendations › 42
Crop Sulfur Requirement
Rye 0.28 lbs / bu Feed Barley 0.22 lbs / bu Malting Barley 0.22 lbs / bu Small Grain Silage 2.5 lbs / ton Small Grain Hay 6.0 lbs / ton Alfalfa 8 lbs / ton New Alfalfa 5.5 lbs / ton Grass-Alfalfa 5.0 lbs / ton Clover 6.0 lbs / ton Bromegrass 5.0 lbs / ton Bermudagrass 6.0 lbs / ton Fescue 5.0 lbs / ton Native Grass 4.0 lbs / ton Lovegrass 4.0 lbs / ton Cool Grass 6.0 lbs / ton Sugar Beets 1.3 lbs / ton Sunflowers 0.008 lbs / lb Potatoes 7.0 lbs / cwt Cotton 0.02 lbs / lb Millet 0.25 lbs / bu Onions 0.038 lbs / cwt Melons 0.1 lbs / cwt Garden 22 lbs / unit
Zinc Fertilizer Recommendations
Zinc is a micronutrient that crops use in very small amounts compared to nitrogen, phosphorus or potassium. There is less than 0.4 lb. zinc in 200 bushels of corn. In comparison, there are about 130 pounds of nitrogen.
Some crops are more responsive to zinc fertilization than others. The recommendation table, Table 3-11, on the next page shows large differences in zinc recommendations depending on the crop. The genetic systems of crops vary enough to make some crops tolerant to zinc deficiency while others are quite susceptible to zinc deficiency.
The recommended rates of zinc will usually raise the soil test to a high level for the crop to be grown. If a crop is nonresponsive to zinc and is grown in rotation with a zinc responsive crop, the zinc recommendation will be quite different for the two crops. The zinc application rate should be made for the most responsive crop in rotation.
Zinc is an immobile nutrient in soils. It can be broadcast in no-till management systems. It may be placed in the soil as a starter or as a deep band as other effective methods of application. If a starter is used, only about one-third of the recommended rate needs to be applied in one year. The starter application should be repeated for 3 years to raise the soil test to a high level.
There are many different types of zinc compounds available for application. The recommendations shown in Table 3-11 are rates suggested for inorganic sources, such as a water-soluble zinc sulfate. If a fluid zinc compound is used, the rate should be the same as shown in the table.
Zinc fertilizer recommendations for many crops are shown in Table 3-11 on the following page. These zinc recommendations are corrective rates of zinc that will supply zinc for 6 to 10 years of cropping. Use zinc soil tests to determine when zinc is needed again.

Raymond C. Ward, Ph.D., Certified Professional Soil Scientist
Fertilizer Recommendations › 43
Table 24: Zinc Fertilizer Recommendations for Various Crops
Crop DTPA Zinc Soil Test, ppm Zn
0 – 0.25 0.26 – 0.50 0.51 – 1.00 1.01 + Corn 8 – 10 6 – 8 1 – 5 0 Milo 8 – 10 6 – 8 1 – 5 0 Popcorn 8 – 10 6 – 8 1 – 5 0 Seed Corn 8 – 10 6 – 8 1 – 5 0 Corn Silage 8 – 10 6 – 8 1 – 5 0 Sorghum Silage 6 – 8 4 – 6 0 – 3 0 Feed-Hay 5 – 7 3 – 5 0 – 3 0 Sudan Hay 5 – 7 3 – 5 0 – 2 0 Soybeans 8 – 10 6 – 8 0 – 2 0 Pinto Beans 8 – 10 6 – 8 1 – 5 0 Great Northern Beans 8 – 10 6 – 8 1 – 5 0 Peanuts 8 – 10 6 – 8 1 – 5 0 Winter Wheat 3 – 5 1 – 3 0 0 Spring Wheat 3 – 5 1 – 3 0 0 Oats 1 – 3 0 0 0 Rye 1 – 3 0 0 0 Feed Barley 1 – 3 0 0 0 Malting Barley 1 – 3 0 0 0 Small Grain Silage 1 – 3 0 0 0 Small Grain Hay 1 – 3 0 0 0 Alfalfa 1 – 3 0 0 0 New Alfalfa 1 – 3 0 0 0 Grass-Alfalfa 1 – 3 0 0 0 Clover 1 – 3 0 0 0 Bromegrass 1 – 3 0 0 0 Bermudagrass 1 – 3 0 0 0 Fescue 1 – 3 0 0 0 Native Grass 1 – 3 0 0 0 Lovegrass 1 – 3 0 0 0 Cool Grass 1 – 3 0 0 0 Sugar Beets 1 – 3 0 0 0 Sunflowers 4 – 6 2 – 4 0 – 1 0 Potatoes 8 – 10 6 – 8 1 – 5 0 Cotton 1 – 3 0 0 0 Millet 1 – 3 0 0 0 Onions 4 – 6 2 – 4 0 – 1 0 Melons 4 – 6 2 – 4 0 – 1 0 Garden 8 – 10 6 – 8 1 – 5 0
Recommendations are based on lbs Zn per acre. For soils with a pH of 7.4 or greater, increase the zinc recommendation by a factor of 1.4.
Iron Fertilizer Recommendations
Sorghums and soybeans grown on calcareous (excess free lime) soils often turn yellow early in the growing season, especially when it is wet and cool. In some cases, the leaves may turn almost white. When the plants are lacking this much chlorophyll, the plants will die. Corn and wheat will also show iron chlorosis in some circumstances
Iron availability is measured by the DTPA test. Iron chlorosis in plants occurs in soils that test low for iron. Usually the low iron tests occur in soils that have high pH, low organic matter, and high excess lime. The iron soil test ratings are:

Raymond C. Ward, Ph.D., Certified Professional Soil Scientist
Fertilizer Recommendations › 44
Table 25: Iron Soil Test Ratings
DTPA Iron Soil Test, ppm Fe Rating Comments
0 – 2.5 Low Many crops show iron chlorosis
2.6 – 4.5 Medium Iron sensitive crops (like sorghums and soybeans) show chlorosis
4.6 – 10.0 High Lawns may show iron chlorosis
10.1 + Very High Iron is adequate for all crops
Iron chlorosis symptoms appear as interveinal yellowing. Usually the veins remain green. The general appearance of the field may be a bright yellow. In severe cases, leaves develop a bleached white color before plant death. Often, plant analysis will show higher iron concentrations than normal plants.
Recent research has shown that iron is probably precipitated in the leaves in an inactive form by bicarbonate ions. In high excess lime soils, bicarbonate from lime is present and is the ion that precipitates iron in the plant tissue.
Research at the University of Nebraska has shown that sulfur (sulfate or thiosulfate) applied in the starter fertilizer has reduced iron chlorosis. The idea is that the sulfate anion competes with bicarbonate ion uptake reducing the bicarbonate level in the plant. Therefore, iron in the plant remains available for plant functions.
The most economical and responsive method of iron fertilization is foliar application. University of Nebraska research has shown that one to three pounds of ortho-ortho EDDHA iron chelate is effective in correcting iron chlorosis. This product has produced large yield responses where severe iron chlorosis was corrected by the iron treatment.
Ferrous (iron) sulfate may correct iron chlorosis at times. A foliar application of 2½% of iron sulfate solution at 15 to 30 gallons per acre is recommended. Up to three applications may be required at 10-day to 2-week intervals. Another application is 50 to 100 lbs of ferrous sulfate broadcast per acre as close to planting as possible.
Copper Fertilizer Recommendations
Copper deficiencies in the United States are less common than deficiencies of other micronutrients. Geographically, they occur infrequently and usually in localized areas. Generally, copper deficiencies are found over the Florida citrus area, in organic and very sandy soils. Most of the other reports of copper deficiency in the USA come from the eastern half of the country and from the Pacific coast states.
Copper deficiency appears most frequently on peat soils. Other soil conditions where copper may be deficient are a) acid soils, b) highly weathered soils c) sandy, alkaline soils and d) no-till soils. Recently, copper deficiency has been identified in wheat in no-till systems in the Great Plains.
A copper deficiency is corrected easily by a soil application of copper sulfate or copper oxide. Foliar treatments of copper do not appear to be as effective as soil applications. Since copper is held in the soil by colloidal organic matter and clay, one application will provide adequate copper for several years.
Suggested copper fertilizer rates are the same for all crops although some crops are more responsive than others. Copper has been found to be deficient occasionally on very sandy soils. A recommendation is made to correct the deficiency so the grower will not have to apply copper yearly.

Raymond C. Ward, Ph.D., Certified Professional Soil Scientist
Fertilizer Recommendations › 45
Table 26: Copper Fertilizer Recommendations
DTPA Copper Soil Test, ppm Cu Recommended Lbs. Cu per Acre
0 – 0.10 4 – 6
0.11 – 0.20 1 – 3
0.21 + 0
The approximate copper content of copper sulfate is 25% copper. It has a blue color and can be easily identified in most fertilizer mixes. The copper content of copper oxide ranges from 60% to 80% copper. It has a brown color. Research in Michigan has shown both products to be equally effective.
For more information on how soil copper is tested, please refer to the Soil Copper Testing section of this guide.
Manganese Fertilizer Recommendations
The amount of manganese available for crops in soils varies considerably depending on soil pH, soil drainage, organic matter level and climate. When soil manganese levels are low, manganese deficiencies are more likely to occur when soil pH is alkaline. Conversely, manganese may be too high for maximum crop production when soil pH is 5.4 or more acidic.
Waterlogged soils cause manganese to become quite soluble. As the water table drops, manganese may be leached from the surface soil causing a manganese deficiency. Very high organic matter levels (over 12%) tend to complex manganese, making it unavailable for crop use. Extended wet, cool periods have created more manganese deficiencies than more normal climactic conditions.
Manganese sulfate is the most common carrier of manganese. It is very soluble and can be used as a soil or foliar treatment. Chelated forms are effective when foliar applied, but not as effective as manganese sulfate soil applied. Manganese sulfate contains 26-28% Mn and manganese EDTA chelate contains 12% Mn. Manganese oxide (about 50% Mn) can also be used as a soil application. When making a soil application, the manganese fertilizer should be applied with other fertilizer and applied in a band near the seed.
Broadcast application of manganese can be made when deficiency symptoms appear on growing crops or where a starter fertilizer is not applied when soil tests show low manganese. Use foliar application, one pound of manganese is suggested for small plants and two pounds for medium to large plants.
Manganese is considered to be low when the soil test is below 3.0 ppm Mn by the DTPA extraction procedure. A soil test above 3.0 ppm is considered to be adequate.
Manganese fertilizer recommendations are shown on Table 3-14 on the next page. Suggested manganese fertilizer rates are based on the responsiveness of the crop and on an inorganic source of manganese applied as a starter.

Raymond C. Ward, Ph.D., Certified Professional Soil Scientist
Fertilizer Recommendations › 46
Table 27: Manganese Fertilizer Recommendations for Various Crops
Crop DTPA Manganese Soil Test, ppm Mn
0 – 3.0 3.1 +
Corn 1 – 8 0
Milo 1 – 11 0
Popcorn 1 – 8 0
Seed Corn 1 – 8 0
Corn Silage 1 – 8 0
Sorghum Silage 1 – 11 0
Feed - Hay 1 – 11 0
Sudan Hay 1 – 11 0
Soybeans 1 – 11 0
Pinto Beans 1 – 11 0
Great Northern Beans 1 – 11 0
Peanuts 1 – 11 0
Winter Wheat 1 – 11 0
Spring Wheat 1 – 11 0
Oats 1 – 11 0
Rye 1 – 8 0
Feed Barley 1 – 8 0
Malting Barley 1 – 8 0
Small Grain Silage 1 – 11 0
Small Grain Hay 1 – 8 0
Alfalfa 1 – 8 0
New Alfalfa 1 – 8 0
Grass-Alfalfa 1 – 8 0
Clover 1 – 8 0
Bromegrass 1 – 8 0
Bermudagrass 1 – 8 0
Fescue 1 – 8 0
Native Grass 1 – 8 0
Lovegrass 1 – 8 0
Cool Grass 1 – 8 0
Sugar Beets 1 – 11 0
Sunflowers 1 – 8 0
Potatoes 1 – 11 0
Cotton 1 – 8 0
Millet 1 – 8 0
Onions 1 – 11 0
Melons 1 – 11 0
Garden 1 – 11 0
Recommendations are based on lbs Mn per acre.

Raymond C. Ward, Ph.D., Certified Professional Soil Scientist
Fertilizer Recommendations › 47
Lime Recommendations
Lime is applied to soils to reduce soil acidity. Soil acidity is determined by soil pH. If soil pH is 6.5 or less, a buffer pH reading is made to determine lime requirements. The buffer pH measures the reserve acidity that is held on the soil clays and colloidal organic matter
At a given soil pH, soils higher in clay and organic matter will require higher amounts of lime to neutralize the reserve acidity. Lime recommendations are made to neutralize the reserve acidity and raise the soil pH to near 7.0. Soils having a low total acidity, or a low lime requirement, will show a more rapid soil pH decline in future years.
Liming materials differ in their neutralizing value. Two factors affect this value. One factor is the calcium carbonate equivalence (CCE), which is an expression of the purity or percent calcium carbonate. The other factor affecting the neutralizing value of lime is the fineness of grind. Limestone ground to pass a 60-mesh sieve is considered to be 100 percent effective; limestone passing through an 8-mesh sieve but held on a 60-mesh sieve is considered to be 50 percent effective. Any limestone that is held on an 8-mesh is not effective in neutralizing soil acidity.
The effectiveness of limestone in reducing soil acidity is based on its purity and fineness, which is called Effective Calcium Carbonate (ECC). Coarse lime is not effective and powdered lime is no better than its percent ECC. Fluid lime or suspension lime effectiveness must be based on its ECC value after the water has been added which is 40% to 50% of the total weight.
The rate of application of lime is determined by dividing the suggested ECC rate per acre by the percent ECC of the lime being applied. The equation is:
𝑨𝒈 𝑳𝒊𝒎𝒆 𝑨𝒑𝒑𝒍𝒊𝒄𝒂𝒕𝒊𝒐𝒏 = 𝑬𝑪𝑪/𝑨𝒄𝒓𝒆 𝑹𝒆𝒄𝒐𝒎𝒎𝒆𝒏𝒅𝒂𝒕𝒊𝒐𝒏
% 𝑬𝑪𝑪 𝒐𝒇 𝑨𝒈 𝑳𝒊𝒎𝒆 𝑿 𝟏𝟎𝟎
The lime should be applied well enough in advance of the planting season to give the lime enough time to neutralize the soil acidity. The rates of lime suggested on the soil test report are large enough to neutralize all of the soil acidity. A grower must consider this application a long-term investment of usually 6 years. The cost of the lime, interest and application should be prorated over this period of time.
The suggested rates of lime at a given buffer pH value are based on neutralizing 8 inches of soil. With reduced tillage and no-till systems being adopted by growers, lime recommendation rates should remain the same.
The lime recommendations are based on the soil pH value, buffer index value and the kind of crop.
The desired pH levels of various crops are shown in Table 3-15.

Raymond C. Ward, Ph.D., Certified Professional Soil Scientist
Fertilizer Recommendations › 48
Table 28: Desired pH Levels for Various Crops
Crop Desired pH Crop Desired pH
Corn 5.7 – 8.3 Small Grain Hay 5.5 – 8.3
Milo 5.7 – 8.0 Alfalfa 6.1 – 8.3
Popcorn 5.7 – 8.3 New Alfalfa 6.1 – 8.3
Seed Corn 5.7 – 8.3 Grass-Alfalfa 6.1 – 8.3
Corn Silage 5.7 – 8.3 Clover 6.1 – 8.3
Sorghum Silage 5.7 – 8.0 Bromegrass 5.7 – 8.5
Feed-Hay 5.7 – 8.0 Bermudagrass 5.5 – 8.5
Sudan Hay 5.7 – 8.0 Fescue 5.5 – 8.5
Soybeans 6.1 – 8.3 Native Grass 5.5 – 8.5
Pinto Beans 6.1 – 8.3 Lovegrass 5.5 – 8.5
Great Northern Beans 6.1 – 8.3 Cool Grass 5.5 – 8.5
Peanuts 6.1 – 8.3 Sugar Beets 5.7 – 8.5
Winter Wheat 5.5 – 8.3 Sunflowers 5.7 – 8.5
Spring Wheat 5.5 – 8.3 Potatoes 5.5 – 7.5
Oats 5.5 – 8.3 Cotton 5.8 – 8.5
Rye 5.5 – 8.3 Millet 5.5 – 8.5
Feed Barley 5.7 – 8.5 Onions 5.5 – 8.5
Malting Barley 5.7 – 8.5 Melons 5.5 – 8.0
Small Grain Silage 5.5 – 8.3 Garden 6.1 – 7.5
When the soil pH is less than that shown for the crops in the above table, the grower should consider liming. However, all irrigators should be aware of the calcium and magnesium content of their irrigation water. Often, there is enough "lime" in the water to satisfy the need for lime.
Table 29: Lime Recommendation Based on Buffer pH
Buffer pH Tons of ECC* Per Acre Tons of Ag Lime at 60% ECC
7.0 0.0 0.0
6.9 0.4 0.7
6.8 0.8 1.3
6.7 1.2 2.0
6.6 1.6 2.7
6.5 2.0 3.3
6.4 2.4 4.0
6.3 2.8 4.7
6.2 3.2 5.3
6.1 3.6 6.0
6.0 4.0 6.7
*This will bring the soil pH up to 6.8.

Raymond C. Ward, Ph.D., Certified Professional Soil Scientist
Fertilizer Recommendations › 49
Magnesium Fertilizer Recommendations
Most soils contain high levels of magnesium; therefore, yield responses to magnesium fertilizer application are uncommon. Great Plains soils that may show response to magnesium fertilizer are sandy soils low in exchangeable magnesium. In humid areas of the USA, magnesium deficiency may occur in acid soils that are consistently limed with calcite lime instead of dolomite lime. Magnesium deficiency is not a problem in finer-textured soils of arid and semi-arid regions of the USA. Soils of the arid and semi-arid regions contain 2:1 type clay minerals that contain large amounts of exchangeable magnesium.
Much of the research work in the United States and Europe has shown that yield response to magnesium fertilizer is unlikely if the soil test for exchangeable magnesium is greater than 50 ppm Mg. The interpretation of the magnesium soil test by many researchers is as follows:
Table 30: Magnesium Soil Test Ratings
Mg Soil Test, ppm Rating Comments
0 – 25 Low Magnesium deficiency symptoms may be general in most field crops, vegetables and fruits. Magnesium fertilization is advised.
26 – 50 Medium Magnesium deficiencies are expected in sugar beets, potatoes and fruit crops. Magnesium fertilization is strongly advised for these crops. Cereal crops would not be expected to respond consistently.
51 – 100 High Magnesium deficiency is not expected in vegetable crops. Magnesium fertilization is suggested for fruit crops. A Mg soil test in the low, medium and high ranges suggests some grass tetany problems for grazing cattle.
101 + Very High No magnesium deficiencies are expected.
Some researchers have suggested that the soil K to soil Mg ratio is important to provide adequate Mg. To have a high level of Mg, the soil test K:Mg ratio (equivalent basis) should be less than 5:1 for field crops and less than 3:1 for vegetables and sugar beets.
The soil calcium (Ca) to soil Mg ratio is not important unless the soil test Ca:Mg ratio (equivalent basis) is less than 1:1. The only soils to have magnesium levels high enough to cause a Ca:Mg ratio of less than 1 are those derived from serpentine, which is a magnesium silicate mineral. These soils have low productivity and the narrow Ca:Mg ratio should alert the producer to problems other than soil fertility.
The concepts of base exchange ratios for calcium:magnesium:potassium have been thoroughly researched the past few years. The conclusions have shown that ratios can vary widely without loss of yield. For example, in Indiana the researchers found the soil test Ca:Mg ratio could vary from 1:1 to 50:1 without affecting the yield.
Magnesium fertilizer recommendations at this point in time have not varied for different types of crops. The recommendations are based on the soil test and crop requirement for irrigated corn. The suggested rates of magnesium application are:
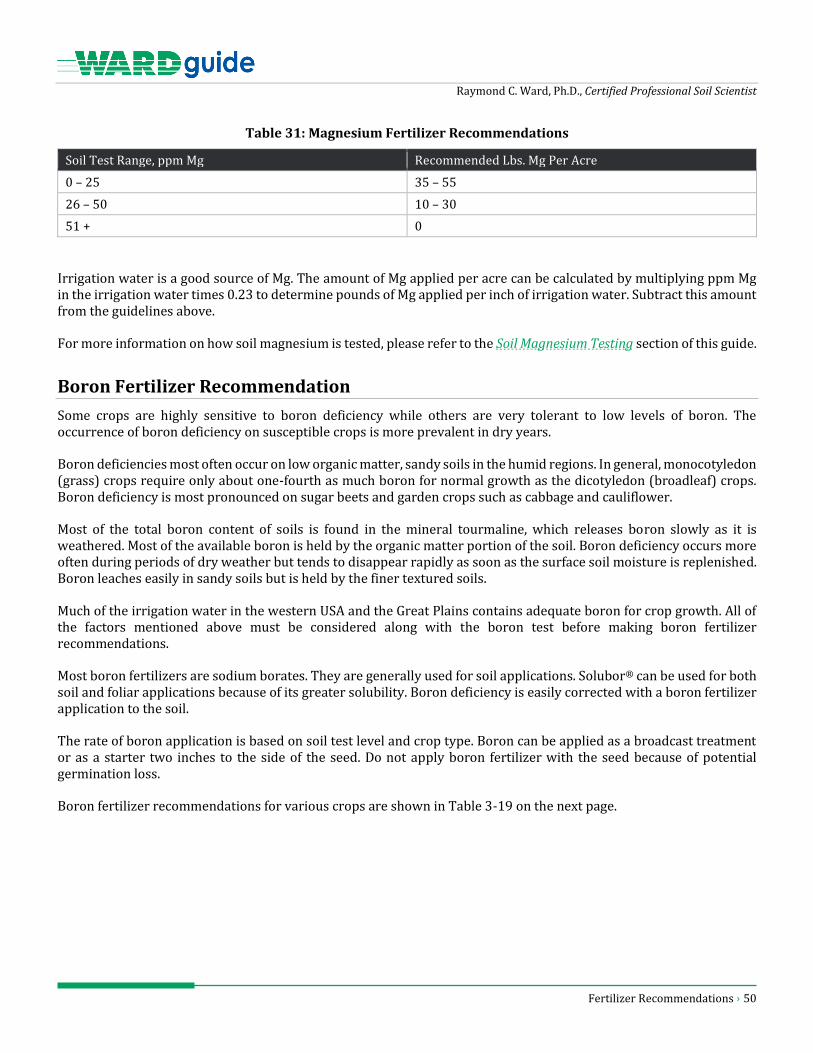
Raymond C. Ward, Ph.D., Certified Professional Soil Scientist
Fertilizer Recommendations › 50
Table 31: Magnesium Fertilizer Recommendations
Soil Test Range, ppm Mg Recommended Lbs. Mg Per Acre
0 – 25 35 – 55
26 – 50 10 – 30
51 + 0
Irrigation water is a good source of Mg. The amount of Mg applied per acre can be calculated by multiplying ppm Mg in the irrigation water times 0.23 to determine pounds of Mg applied per inch of irrigation water. Subtract this amount from the guidelines above.
For more information on how soil magnesium is tested, please refer to the Soil Magnesium Testing section of this guide.
Boron Fertilizer Recommendation
Some crops are highly sensitive to boron deficiency while others are very tolerant to low levels of boron. The occurrence of boron deficiency on susceptible crops is more prevalent in dry years.
Boron deficiencies most often occur on low organic matter, sandy soils in the humid regions. In general, monocotyledon (grass) crops require only about one-fourth as much boron for normal growth as the dicotyledon (broadleaf) crops. Boron deficiency is most pronounced on sugar beets and garden crops such as cabbage and cauliflower.
Most of the total boron content of soils is found in the mineral tourmaline, which releases boron slowly as it is weathered. Most of the available boron is held by the organic matter portion of the soil. Boron deficiency occurs more often during periods of dry weather but tends to disappear rapidly as soon as the surface soil moisture is replenished. Boron leaches easily in sandy soils but is held by the finer textured soils.
Much of the irrigation water in the western USA and the Great Plains contains adequate boron for crop growth. All of the factors mentioned above must be considered along with the boron test before making boron fertilizer recommendations.
Most boron fertilizers are sodium borates. They are generally used for soil applications. Solubor® can be used for both soil and foliar applications because of its greater solubility. Boron deficiency is easily corrected with a boron fertilizer application to the soil.
The rate of boron application is based on soil test level and crop type. Boron can be applied as a broadcast treatment or as a starter two inches to the side of the seed. Do not apply boron fertilizer with the seed because of potential germination loss.
Boron fertilizer recommendations for various crops are shown in Table 3-19 on the next page.

Raymond C. Ward, Ph.D., Certified Professional Soil Scientist
Fertilizer Recommendations › 51
Table 32: Boron Fertilizer Recommendations
Crop Boron Soil Test, ppm B
0 – 0.25 0.26 – 0.50 0.51 +
Corn 0.5 – 1.5 0 0
Milo 0.5 – 1.5 0 0
Popcorn 0.5 – 1.5 0 0
Seed Corn 0.5 – 1.5 0 0
Corn Silage 0.5 – 1.5 0 0
Sorghum Silage 0.5 – 1.5 0 0
Feed-Hay 0.5 – 1.5 0 0
Sudan Hay 0.5 – 1.5 0 0
Soybeans 0.5 – 1.5 0 0
Pinto Beans 0.5 – 1.5 0 0
Gr. No. Beans 0.5 – 1.5 0 0
Peanuts 1.5 – 3.0 0.5 – 1.5 0
W. Wheat 0.5 – 1.5 0 0
Sp. Wheat 0.5 – 1.5 0 0
Oats 0.5 – 1.5 0 0
Rye 0.5 – 1.5 0 0
Feed Barley 0.5 – 1.5 0 0
Malting Barley 0.5 – 1.5 0 0
Sm. Gr. Silage 0.5 – 1.5 0 0
Sm. Gr. Hay 0.5 – 1.5 0 0
Alfalfa 1.5 – 3.0 0.5 – 1.5 0
New Alfalfa 1.5 – 3.0 0.5 – 1.5 0
Grass-Alfalfa 1.5 – 3.0 0.5 – 1.5 0
Clover 1.5 – 3.0 0.5 – 1.5 0
Bromegrass 0.5 – 1.5 0 0
Bermudagrass 0.5 – 1.5 0 0
Fescue 0.5 – 1.5 0 0
Native Grass 0.5 – 1.5 0 0
Lovegrass 0.5 – 1.5 0 0
Cool Grass 0.5 – 1.5 0 0
Sugar Beets 1.5 – 3.0 0.5 – 1.5 0
Sunflowers 0.5 – 1.5 0 0
Potatoes 1.5 – 3.0 0.5 – 1.5 0
Cotton 1.5 – 3.0 0.5 – 1.5 0
Millet 0.5 – 1.5 0 0
Onions 0.5 – 1.5 0 0
Melons 0.5 – 1.5 0 0
Garden 0.5 – 1.5 0 0
Recommendations are based on lbs B per acre.
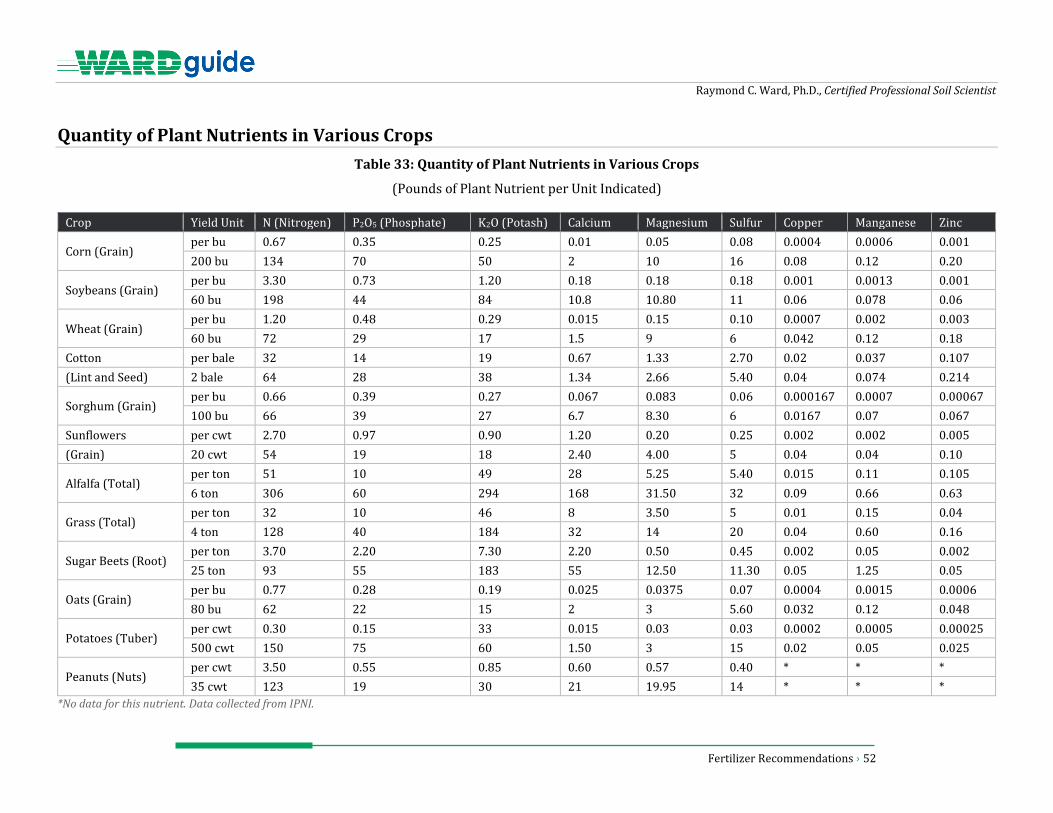
Raymond C. Ward, Ph.D., Certified Professional Soil Scientist
Fertilizer Recommendations › 52
Quantity of Plant Nutrients in Various Crops
Table 33: Quantity of Plant Nutrients in Various Crops
(Pounds of Plant Nutrient per Unit Indicated)
Crop Yield Unit N (Nitrogen) P2O5 (Phosphate) K2O (Potash) Calcium Magnesium Sulfur Copper Manganese Zinc
Corn (Grain) per bu 0.67 0.35 0.25 0.01 0.05 0.08 0.0004 0.0006 0.001
200 bu 134 70 50 2 10 16 0.08 0.12 0.20
Soybeans (Grain) per bu 3.30 0.73 1.20 0.18 0.18 0.18 0.001 0.0013 0.001
60 bu 198 44 84 10.8 10.80 11 0.06 0.078 0.06
Wheat (Grain) per bu 1.20 0.48 0.29 0.015 0.15 0.10 0.0007 0.002 0.003
60 bu 72 29 17 1.5 9 6 0.042 0.12 0.18
Cotton per bale 32 14 19 0.67 1.33 2.70 0.02 0.037 0.107
(Lint and Seed) 2 bale 64 28 38 1.34 2.66 5.40 0.04 0.074 0.214
Sorghum (Grain) per bu 0.66 0.39 0.27 0.067 0.083 0.06 0.000167 0.0007 0.00067
100 bu 66 39 27 6.7 8.30 6 0.0167 0.07 0.067
Sunflowers per cwt 2.70 0.97 0.90 1.20 0.20 0.25 0.002 0.002 0.005
(Grain) 20 cwt 54 19 18 2.40 4.00 5 0.04 0.04 0.10
Alfalfa (Total) per ton 51 10 49 28 5.25 5.40 0.015 0.11 0.105
6 ton 306 60 294 168 31.50 32 0.09 0.66 0.63
Grass (Total) per ton 32 10 46 8 3.50 5 0.01 0.15 0.04
4 ton 128 40 184 32 14 20 0.04 0.60 0.16
Sugar Beets (Root) per ton 3.70 2.20 7.30 2.20 0.50 0.45 0.002 0.05 0.002
25 ton 93 55 183 55 12.50 11.30 0.05 1.25 0.05
Oats (Grain) per bu 0.77 0.28 0.19 0.025 0.0375 0.07 0.0004 0.0015 0.0006
80 bu 62 22 15 2 3 5.60 0.032 0.12 0.048
Potatoes (Tuber) per cwt 0.30 0.15 33 0.015 0.03 0.03 0.0002 0.0005 0.00025
500 cwt 150 75 60 1.50 3 15 0.02 0.05 0.025
Peanuts (Nuts) per cwt 3.50 0.55 0.85 0.60 0.57 0.40 * * *
35 cwt 123 19 30 21 19.95 14 * * *
*No data for this nutrient. Data collected from IPNI.

Raymond C. Ward, Ph.D., Certified Professional Soil Scientist
Fertilizer Recommendations › 53
Soil Fertility Ratings
Compare your soil tests with the ratings in the tables below.
Table 34: Soil Fertility Ratings for Soil Nutrients
Nutrient Very Low Low Medium High Very High
Best Use of Soil Test ----------ppm----------
Olsen Bicarbonate, P 0 – 3 4 – 9 10 – 16 17 – 30 30 + neutral, alkaline, calcareous
Bray-1, P 0 – 5 6 – 12 13 – 25 26 – 50 50 + neutral, acidic
Mehlich-3, P 0 – 5 6 – 12 13 – 25 26 – 50 51 + wide range of soils
Chloride, Cl 0 – 1 1 – 2 2 – 4 4 – 6 6 + dryland soils
Potassium, K 0 – 40 41 – 80 81 – 120 121 – 200 200 + exchangeable cation
Sulfate, S 0 – 4 5 – 7 8 – 11 12 – 15 15 + low organic matter
Magnesium, Mg 0 – 10 11 – 20 21 – 35 36 – 50 50 + exchangeable cation
DTPA Zinc, Zn 0 – 0.25 0.26 – 0.50 0.51 – 0.75 0.76 – 1.00 1.01 + alkaline soils
DTPA Iron, Fe 0 – 1.0 1.1 – 2.0 2.1 – 4.5 4.6 – 10.0 10.1 + alkaline soils
DTPA Copper, Cu 0 – 0.10 0.11 – 0.20 0.21 – 0.30 0.31 – 0.60 0.61 +
DTPA Manganese, Mn 0 – 0.5 0.6 – 1.0 1.1 – 2.0 2.1 – 4.0 4.1 + alkaline soils
Hot Water Boron, B 0 – 0.10 0.11 – 0.25 0.26 – 0.50 0.51 – 2.00 2.10 +
KCI Exchangeable, Al 0 – 1 2 – 5 6 – 20 21 – 40 40 + for acid soils

Fertilizer Recommendations › 54
Table 35: CEC Ranges for Different Soil Textures, pH < 7.0
Sand < 6
Sandy Loam 5 – 10
Loam 9 – 18
Silt Loam 15 – 25
Clay > 22
Table 36: 1:1 pH Rating
< 5.4 Strongly acidic
5.4 – 5.7 Moderately acidic
5.8 – 6.2 Slightly acidic
6.3 – 7.3 Neutral
> 7.3 Alkaline
Table 37: Soluble Salt Ratings
mmho/cm Crop Impacts
0 – 1.0 No crop hazard
1.1 – 1.5 Yield reduction on sensitive crops
1.6 – 3.5 Moderate to severe yield reduction
3.6 + Severe yield reduction
Nitrogen and Sulfur Fertilizer Recommendation Calculations
Nitrogen Recommendations
𝑁 𝑙𝑏𝑠/𝐴 = (𝐶𝑟𝑜𝑝 𝑦𝑖𝑒𝑙𝑑 𝑥 𝑁 𝑟𝑒𝑞) − (𝑝𝑝𝑚 𝑡𝑜𝑝𝑠𝑜𝑖𝑙 𝑁𝑂3 𝑁 𝑥 0.3 𝑥 𝑑𝑒𝑝𝑡ℎ 𝑖𝑛 𝑖𝑛𝑐ℎ𝑒𝑠)− (𝑝𝑝𝑚 𝑠𝑢𝑏𝑠𝑜𝑖𝑙 𝑁𝑂3 𝑁 𝑥 0.3 𝑥 𝑑𝑒𝑝𝑡ℎ 𝑖𝑛 𝑖𝑛𝑐ℎ𝑒𝑠) − 𝑙𝑒𝑔𝑢𝑚𝑒 𝑐𝑟𝑒𝑑𝑖𝑡 −𝑚𝑎𝑛𝑢𝑟𝑒 𝑐𝑟𝑒𝑑𝑖𝑡− 𝑖𝑟𝑟𝑖𝑔𝑎𝑡𝑖𝑜𝑛 𝑤𝑎𝑡𝑒𝑟 𝑐𝑟𝑒𝑑𝑖𝑡
If no subsoil sample, assume 2 ppm NO3-N for sandy soils and 5 ppm NO3-N for loamy or heavier subsoils. For more information on how soil nitrogen is tested, please refer to the Soil Nitrate Testing section of this guide.
Sulfur Recommendations
𝑆 𝑟𝑒𝑐 =𝑆 𝑟𝑒𝑞 − 𝑆𝑜𝑖𝑙 𝑆
0.8 𝑜𝑟 1.0
divide by 0.8 for sandy soils or by 1.0 for loamy and clayey soils.
Sreq = Yield goal x S req factor Soil S = ppm S x 0.3 x depth in inches with a maximum of 8 in. For more information on how soil sulfur is tested, please refer to the Soil Sulfur Testing section of this guide.
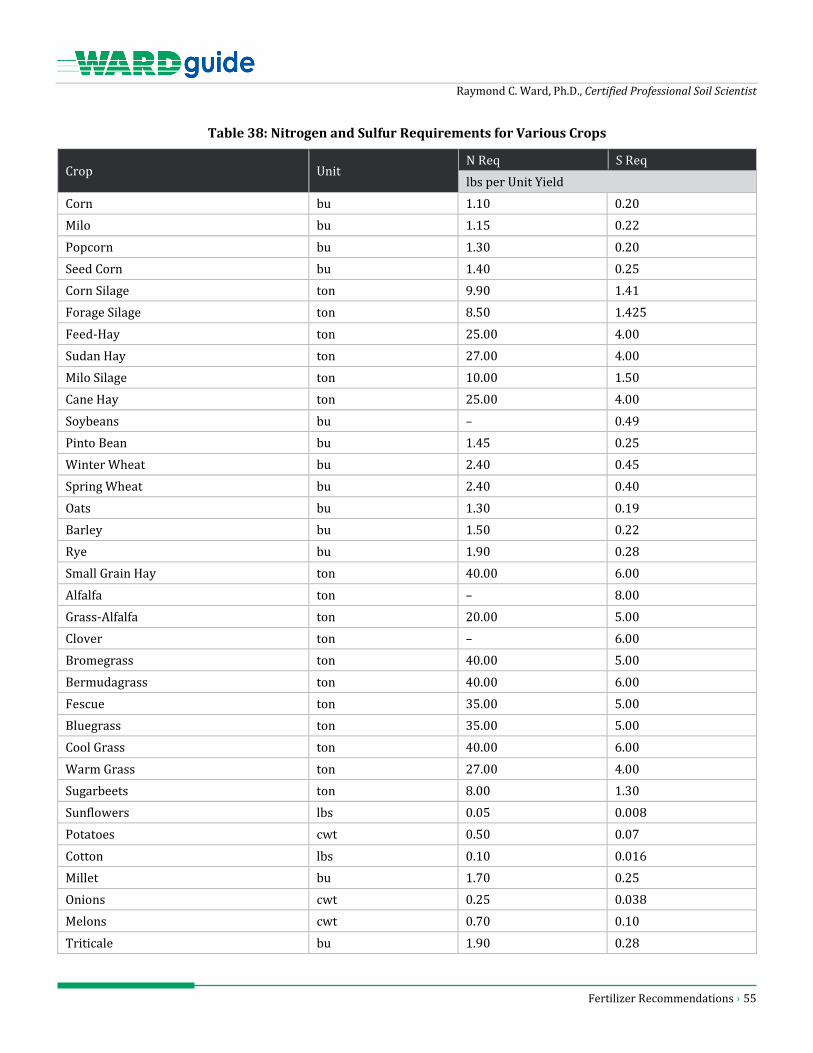
Raymond C. Ward, Ph.D., Certified Professional Soil Scientist
Fertilizer Recommendations › 55
Table 38: Nitrogen and Sulfur Requirements for Various Crops
Crop Unit N Req S Req
lbs per Unit Yield
Corn bu 1.10 0.20
Milo bu 1.15 0.22
Popcorn bu 1.30 0.20
Seed Corn bu 1.40 0.25
Corn Silage ton 9.90 1.41
Forage Silage ton 8.50 1.425
Feed-Hay ton 25.00 4.00
Sudan Hay ton 27.00 4.00
Milo Silage ton 10.00 1.50
Cane Hay ton 25.00 4.00
Soybeans bu – 0.49
Pinto Bean bu 1.45 0.25
Winter Wheat bu 2.40 0.45
Spring Wheat bu 2.40 0.40
Oats bu 1.30 0.19
Barley bu 1.50 0.22
Rye bu 1.90 0.28
Small Grain Hay ton 40.00 6.00
Alfalfa ton – 8.00
Grass-Alfalfa ton 20.00 5.00
Clover ton – 6.00
Bromegrass ton 40.00 5.00
Bermudagrass ton 40.00 6.00
Fescue ton 35.00 5.00
Bluegrass ton 35.00 5.00
Cool Grass ton 40.00 6.00
Warm Grass ton 27.00 4.00
Sugarbeets ton 8.00 1.30
Sunflowers lbs 0.05 0.008
Potatoes cwt 0.50 0.07
Cotton lbs 0.10 0.016
Millet bu 1.70 0.25
Onions cwt 0.25 0.038
Melons cwt 0.70 0.10
Triticale bu 1.90 0.28

Raymond C. Ward, Ph.D., Certified Professional Soil Scientist
Fertilizer Recommendations › 56
Phosphorus Recommendation Calculation
Phosphorus Recommendation
𝒍𝒃𝒔 𝑷𝟐𝑶𝟓/𝑨 = 𝒆𝒙𝒑 [𝒊𝒏𝒕𝒆𝒓𝒄𝒆𝒑𝒕 − (𝒔𝒍𝒐𝒑𝒆 𝒙 𝒑𝒑𝒎 𝑷) + 𝒚𝒊𝒆𝒍𝒅 𝒂𝒅𝒋.
𝐲𝐢𝐞𝐥𝐝 𝐚𝐝𝐣. = (𝐲𝐢𝐞𝐥𝐝 𝐠𝐨𝐚𝐥 − 𝐬𝐭𝐚𝐧𝐝𝐚𝐫𝐝 𝐲𝐢𝐞𝐥𝐝) 𝐱 𝐚𝐝𝐣 𝐟𝐚𝐜𝐭𝐨𝐫
Example: Mehlich P-3 = 20 ppm; yield goal = 180 bu/A irrigated corn lbs P2O5 /A = exp [4.60 – (0.064 x 20 ppm)] + ((180 bu – 120 bu) x 0.25) lbs P2O5 /A = exp [3.32] + (60 x 0.25) lbs P2O5 /A = 27.7 + 15 lbs P2O5 /A = 42.7 or 45 lbs
Table 39: Phosphorus Fertilizer Recommendations for Various Crops
Crop Intercept M – 3 / P – 1 Slope Olsen P Slope Standard Yield Adj. Factor Per Unit Yield
Corn 4.60 0.064 0.102 120 bu 0.25
Milo 4.38 0.064 0.102 100 bu 0.25
Popcorn 4.60 0.064 0.102 80 bu 0.25
Seed Corn 4.60 0.064 0.102 60 bu 0.25
Corn Silage 4.60 0.064 0.102 12 ton 1.50
Forage Silage 4.52 0.064 0.102 15 ton 1.50
Feed Hay 4.16 0.062 0.099 3 ton 4.00
Sudan Hay 4.16 0.048 0.077 3 ton 4.00
Milo Silage 4.35 0.064 0.102 12 ton 1.50
Cane Hay 4.16 0.048 0.077 3 ton 4.00
Soybeans 4.25 0.064 0.102 40 bu 0.50
Pinto Beans 4.25 0.064 0.102 All None
Winter Wheat 4.44 0.055 0.088 45 bu 0.32
Spring Wheat 4.08 0.047 0.074 35 bu 0.32
Oats 4.08 0.062 0.099 80 bu 0.15
Barley 4.44 0.047 0.074 60 bu 0.20
Rye 4.08 0.055 0.088 45 bu 0.25
Alfalfa 4.78 0.057 0.081 3 ton 6.00
Grass/Alfalfa 4.40 0.064 0.102 3 ton 5.00
Clover 4.53 0.050 0.080 3 ton 6.00
Brome 4.22 0.049 0.078 3 ton 4.00
Bermudagrass 4.17 0.050 0.078 3 ton 4.00
Fescue 4.22 0.062 0.088 3 ton 4.00
Bluegrass 4.22 0.049 0.078 All None
Warm Grass 3.85 0.071 0.114 3 ton 4.00
Sugar Beets 4.82 0.032 0.051 20 ton 2.00
Sunflowers 3.80 0.036 0.058 18 cwt 0.012
Potatoes 5.08 0.048 0.077 350 cwt 0.15
Cotton 4.32 0.060 0.096 1000 lb 0.05
Millet 4.00 0.060 0.096 All None
Onions 5.56 0.055 0.088 All None
Melons 4.61 0.064 0.102 All None
Adjustment factors are in lbs. P2O5 per acre.

Raymond C. Ward, Ph.D., Certified Professional Soil Scientist
Fertilizer Recommendations › 57
Potassium Recommendation Calculation
Potassium Recommendations
𝒍𝒃𝒔 𝑷𝟐𝑶𝟐/𝑨 = 𝒆𝒙𝒑 [𝒊𝒏𝒕𝒆𝒓𝒄𝒆𝒑𝒕 − (𝒔𝒍𝒐𝒑𝒆 𝒙 𝒑𝒑𝒎 𝑲)] + 𝒚𝒊𝒆𝒍𝒅 𝒂𝒅𝒋
yield adj. = (yield goal – standard yield) x adj factor
Example: soil test K = 120 ppm, yield goal = 180 bu/A irrigated corn lbs K2O/A = exp [5.20 – (0.014 x 120 ppm)] + ((180 bu – 120 bu) x 0.25) lbs K2O/A = exp [3.52] + (60 x 0.25) lbs K2O/A = 33.8 + 15 lbs K2O/A = 48.8 or 50 lbs
Table 40: Potassium Fertilizer Recommendations for Various Crops
Crop Intercept Slope Standard Yield Adj. Factor Unit Yield
Corn 5.00 0.0140 120 bu 0.20
Milo 4.75 0.0140 100 bu 0.20
Popcorn 5.20 0.0140 80 bu 0.20
Seed Corn 5.20 0.0140 60 bu 0.20
Corn Silage 5.40 0.0140 12 ton 4.00
Forage Silage 5.20 0.0125 15 ton 3.50
Feed Hay 4.86 0.0125 3 ton 12.00
Sudan Hay 4.86 0.0125 3 ton 12.00
Milo Silage 4.97 0.0125 12 ton 3.60
Cane Hay 4.86 0.0125 3 ton 12.00
Soybeans 4.97 0.0140 40 bu 0.65
Pinto Beans 4.97 0.0140 All None
Winter Wheat 4.59 0.0130 45 bu 0.25
Spring Wheat 4.59 0.0130 35 bu 0.30
Oats 4.59 0.0130 80 bu 0.20
Barley 4.59 0.0130 60 bu 0.25
Rye 4.59 0.0130 45 bu 0.20
Alfalfa 5.34 0.0125 3 ton 15.00
Grass/Alfalfa 5.34 0.0125 3 ton 14.00
Clover 5.34 0.0125 4 ton 15.00
Brome 5.00 0.0140 3 ton 12.00
Bermudagrass 5.34 0.0140 3 ton 12.00
Fescue 5.00 0.0140 3 ton 12.00
Bluegrass 5.00 0.0140 All None
Warm Grass 4.60 0.0140 3 ton 12.00
Sugar Beets 5.34 0.0125 20 ton 5.00
Sunflowers 4.59 0.0160 1800 lb 0.012
Potatoes 6.20 0.0150 350 cwt 0.46
Cotton 4.97 0.0125 1000 lb 0.05
Millet 4.59 0.0130 All None
Onions 5.56 0.0130 All None
Melons 5.40 0.0125 All None
Adjustments factors are in lbs. K2O.

Raymond C. Ward, Ph.D., Certified Professional Soil Scientist
Fertilizer Recommendations › 58
Micronutrient and Lime Recommendation Calculations
Zinc Recommendation
𝒍𝒃𝒔 𝒁𝒏/𝑨 = [(𝑴𝒁𝑹− 𝑪𝑹𝑨𝒅𝒋) − (𝑨𝒁𝑹 𝒙 𝒑𝒑𝒎 𝒁𝒏)] 𝒙 𝒑𝑯 𝒇𝒂𝒄𝒕𝒐𝒓
if pH is 7.3 or less, pH factor is 1.0 if pH is 7.4 or above, pH factor is 1.4
MZR: Zn recommendation at 0 ppm Zn soil test. AZR: Zinc soil test factor. CRadj: Zinc adjustment
(See Table 3-21 below for values.)
Example: Soil test Zn = 0.50 ppm, soil pH = 7.0, irrigated corn lbs Zn / A = [10 – (9 x 0.50 ppm)] x 1.4 lbs Zn / A = [10 – 4.5] x 1.4 lbs Zn / A = 5.5 or 6 lbs
Magnesium Recommendations
𝒍𝒃𝒔 𝑴𝒈 / 𝑨 = 𝑴𝑹− (𝑴𝑪𝑭 𝒙 𝑴𝒈 𝒑𝒑𝒎)
MR: Magnesium requirement at 0 ppm Mg soil test. MCF: Magnesium soil test factor.
(See Table 3-21 below for values.)
Example: Soil test Mg = 40 ppm, irrigated corn lbs Mg / A = 55 – (0.9 x 40 ppm) lbs Mg / A = 55 – 36 lbs Mg / A = 19 lbs
Manganese Recommendations
𝒍𝒃𝒔 𝑴𝒏 / 𝑨 = 𝑴𝒏𝑹− (𝑴𝒏𝑪𝑭 𝒙 𝑴𝒏 𝒑𝒑𝒎)
MnR: Manganese recommendation at 0 ppm Mn soil test. MnCF: Magnesium soil test factor.
(See Table 3-21 below for values.)
Example: Soil test Mn = 1.0 ppm, irrigated corn lbs Mn / A = 9.0 – (3.0 x 1.0 ppm) lbs Mn / A = 9 – 3 lbs Mn / A = 6 lbs
Raymond C. Ward, Ph.D., Certified Professional Soil Scientist
Fertilizer Recommendations › 59
Copper Recommendations
𝒍𝒃𝒔 𝑪𝒖 / 𝑨 = 𝑪𝒖𝑹− (𝑪𝒖𝑪𝑭 𝒙 𝑪𝒖 𝒑𝒑𝒎)
CuR: Copper recommendation at 0 ppm Cu soil test. CuCF: Copper soil test factor.
(See Table 3-21 below for values)
Example: Soil test Cu = 0.10 ppm, irrigated corn lbs Cu / A = 6 – (25 x 0.10 ppm) lbs Cu / A = 6 – 2.5 lbs Cu / A = 3.5 lbs
Boron Recommendations
𝒍𝒃𝒔 𝑩 𝑨 = 𝑩𝑹− (𝑩𝑪𝑭 𝒙 𝑩 𝒑𝒑𝒎)
BR: Boron recommendation at 0 ppm B soil test. BCF: Boron soil test factor.
(See Table 3-21 below for values)
Example: Soil test B = 0.15 ppm, alfalfa lbs B / A = 3.0 – (5 x 0.15 ppm) lbs B / A = 3 – 0.75 lbs B / A = 2.25 lbs
Chloride Recommendations
𝒍𝒃𝒔 𝑪𝒍/𝑨 = 𝑪𝒍𝑪𝑭− (𝒑𝒑𝒎 𝒕𝒐𝒑𝒔𝒐𝒊𝒍 𝑪𝒍 𝒙 𝟎. 𝟑 𝒙 𝒅𝒆𝒑𝒕𝒉 𝒊𝒏 𝒊𝒏𝒄𝒉𝒆𝒔) − (𝒑𝒑𝒎 𝒔𝒖𝒃𝒔𝒐𝒊𝒍 𝑪𝒍 𝒙 𝟎. 𝟑 𝒙 𝒅𝒆𝒑𝒕𝒉 𝒊𝒏 𝒊𝒏𝒄𝒉𝒆𝒔)
ClCF: Chloride recommendation at 0 ppm Cl soil test
Example: Soil test Cl = 12 ppm, wheat lbs Cl / A = 35.0 – (12 ppm x 0.3 x 8) lbs Cl / A = 35.0 – 28.8 lbs Cl / A = 6.2 lbs
Lime Recommendations (Effective Calcium Carbonate)
𝑬𝑬𝑪 / 𝑨 = (𝟕. 𝟎 − 𝒃𝒖𝒇𝒇𝒆𝒓 𝒑𝑯) 𝒙 𝟒
Example: Buffer pH: 6.7 EEC/A = (7.0 – 6.7) x 4 EEC/A = 0.3 x 4 EEC/A = 1.2 tons

Raymond C. Ward, Ph.D., Certified Professional Soil Scientist
Fertilizer Recommendations › 60
Table 41: Micronutrient and Lime Recommendation Factors for Various Crops
Crop Zn Mg Mn Cu B Cl Lime
MZR AZR Cradj MR MCF MnR MnCF CuR CuF BR BCF CC
Corn 10 9 0 55 0.9 9 3 6 27 1.75 5 35 2
Milo 10 9 3 55 0.9 12 4 6 27 1.75 5 35 2
Popcorn 10 9 0 55 0.9 9 3 6 27 1.75 5 35 2
Seed Corn 10 9 0 55 0.9 9 3 6 27 1.75 5 35 2
Corn Silage 10 9 0 55 0.9 9 3 6 27 1.75 5 35 2
Forage Silage 10 9 2 55 0.9 12 4 6 27 1.5 5 35 2
Feed Hay 10 9 3 55 0.9 12 4 6 27 1.5 5 35 2
Sudan Hay 10 9 3 55 0.9 12 4 6 27 1.5 5 35 2
Milo Silage 10 9 2 55 0.9 12 4 6 27 1.75 5 35 2
Cane Hay 10 9 3 55 0.9 12 4 6 27 1.5 5 35 2
Soybeans 10 9 0 55 0.9 12 4 6 27 1.5 5 18 3
Pinto Beans 10 9 0 55 0.9 12 4 6 27 1.5 5 18 3
Winter Wheat 10 9 5 55 0.9 12 4 6 27 1.5 5 35 1
Spring Wheat 10 9 7 55 0.9 12 4 6 27 1.5 5 35 1
Oats 10 9 7 55 0.9 12 4 6 27 1.5 5 35 1
Barley 10 9 7 55 0.9 9 3 6 27 1.5 5 35 2
Rye 10 9 7 55 0.9 9 3 6 27 1.5 5 35 1
Small Grain Hay 10 9 7 55 0.9 12 4 6 27 1.5 5 35 1
Alfalfa 10 9 7 55 0.9 9 3 6 27 3.0 5 18 3
Grass/Alfalfa 10 9 7 55 0.9 9 3 6 27 3.0 5 18 3
Clover 10 9 7 55 0.9 9 3 6 27 3.0 5 18 3
Brome 10 9 7 55 0.9 9 3 6 27 1.5 5 35 1
Bermuda 10 9 7 55 0.9 9 3 6 27 1.5 5 35 2
Fescue 10 9 7 55 0.9 9 3 6 27 1.5 5 35 1
Cool Grass 10 9 7 55 0.9 9 3 6 27 1.5 5 35 1
Bluegrass 10 9 7 55 0.9 9 3 6 27 1.5 5 35 2
Warm Grass 10 9 7 55 0.9 9 3 6 27 1.5 5 35 2
Sugarbeet 10 9 7 55 0.9 12 4 6 27 3.0 5 18 2
Sunflowers 10 9 4 55 0.9 9 3 6 27 1.5 5 18 2
Potatoes 10 9 0 55 0.9 12 4 6 9 3.0 5 18 1
Cotton 10 9 7 55 0.9 9 3 6 27 3.0 5 18 2
Millet 10 9 7 55 0.9 9 3 6 27 1.5 5 35 1
Onions 10 9 4 55 0.9 12 4 6 27 1.5 5 18 3
Melons 10 9 4 55 0.9 12 4 6 27 1.5 5 18 3
Triticale 10 9 7 55 0.9 12 4 6 27 1.5 5 35 1
Crop Classification (CC): 1 = lime recommended at pH 5.4 or less. 2 = lime recommended at pH 5.6 or less. 3 = lime recommended at pH 6.0 or less.

Raymond C. Ward, Ph.D., Certified Professional Soil Scientist
Fertilizer Recommendations › 61
Fertilizer Requirements for Corn Silage
Nitrogen
𝒍𝒃𝒔 𝑵/𝑨 = (𝒚𝒊𝒆𝒍𝒅 𝒈𝒐𝒂𝒍 𝒙 𝟗. 𝟗 𝒍𝒃𝒔 𝑵/𝒕𝒐𝒏) − (𝒔𝒐𝒊𝒍 𝒏𝒊𝒕𝒓𝒂𝒕𝒆 𝒕𝒐 𝟑′ ) − (𝑴𝒂𝒏𝒖𝒓𝒆 𝑵) − (𝑷𝒂𝒔𝒕 𝒄𝒓𝒐𝒑 𝑵 𝒄𝒓𝒆𝒅𝒊𝒕)− 𝑰𝒓𝒓𝒊𝒈𝒂𝒕𝒊𝒐𝒏 𝑾𝒂𝒕𝒆𝒓
Example: lbs/A = (25 tons x 9.9) – (40 soil N) – (0 Manure N) – (0 past crop N) – (15 irrigation N) = 193 lbs N/A to apply
Phosphorus
Table 42: Phosphorus Requirements for Corn Silage
M-3 Soil Test lbs P2O5/A
(ppm P) 15 ton 25 ton
0 – 5 70 – 100 85 – 115
6 – 12 45 – 65 60 – 80
13 – 25 25 – 40 40 – 55
26 – 50 0 – 20 15 – 35
51+ 0 0
Potassium
Table 43: Potassium Requirements for Corn Silage
Soil Test lbs K2O/A
(ppm K) 15 ton 25 ton
0 – 40 135 – 220 175 – 260
41 – 70 80 – 130 120 – 170
71 – 120 50 – 75 90 – 115
121 – 200 30 – 45 70 – 85
201 + 0 0
Sulfur
𝒍𝒃𝒔 𝑺/𝑨 = (𝒚𝒊𝒆𝒍𝒅 𝒈𝒐𝒂𝒍 𝒙 𝟏. 𝟒𝟏 𝒍𝒃𝒔 𝑺/𝒕𝒐𝒏) − (𝟐. 𝟒 𝒙 𝑺𝑶𝟒 − 𝑺 𝒔𝒐𝒊𝒍 𝒕𝒆𝒔𝒕)
Example: lbs S/A = (25 tons x 1.41 lbs S/ton) – (2.4 x 5) = 23 lbs S/A
For sandy soil divide by result by 0.8.

Raymond C. Ward, Ph.D., Certified Professional Soil Scientist
Fertilizer Recommendations › 62
Zinc
Table 44: Zinc Requirements for Corn Silage
Soil Test Recommendation
ppm Zn lbs Zn/A*
0 – 0.25 8 – 10
0.26 – 0.50 6 – 8
0.51 – 1.00 1 – 5
1.01 + 0
*These are corrective rates and should last 5 or more years.
Nitrogen Fertilizer – Use Wisely
Nitrogen fertilizer is usually needed to produce the most economical yields of corn, milo, wheat and other non-legume crops. The most profitable rate of nitrogen for each field is dependent on several factors including:
1. Carryover residual soil nitrate 2. the past crop 3. manure application 4. yield goal of crop to be grown 5. amount of nitrate in irrigation water 6. timeliness of the fertilizer application
Efficient use of nitrogen fertilizer is beneficial to conserving energy and protecting ground water supplies. It takes 26,600 BTU of energy to manufacture, deliver and apply one pound of nitrogen. Since there are 140,000 BTU’s of energy in one gallon of diesel fuel, one pound of nitrogen is equivalent to 0.19 gallons of diesel. In other words, 100 pounds of nitrogen applied to the soil has an energy equivalent of 19 gallons of diesel fuel. To use energy efficiently, apply the correct rate of nitrogen.
The University of Nebraska has traced nitrate movement to a depth of more than 40 feet at several locations. In one experiment, a rate of 200 Ibs of nitrogen was applied annually on a Hastings silt loam. After eight years of nitrogen application, soil samples were taken to 40 feet. The control plot contained 0.9 ppm nitrate-nitrogen in the 35-40 foot depth while the nitrogen treatment contained 2.1 ppm in the same depth. Although the nitrate concentrations are low, there is some nitrate movement to the 40-foot depth. This demonstrates that growers need to utilize all soil sources of nitrogen so that applied nitrogen is used effectively and not lost to leaching.
The nitrogen requirement for crop production depends on the crop and yield. Corn and milo require about 1.1 Ibs of nitrogen per bushel to grow the plant and produce the grain. If the grain is removed and the stalks are returned to the soil, approximately two-thirds of the nitrogen is removed from the field. Nitrogen in the stalks is returned to the soil as part of the organic nitrogen phase. Nitrate left over from the previous fertilizer application can be measured by soil test. This nitrate is used to adjust the nitrogen rate for the next crop. A nitrate soil test should be obtained from the top 8 inches of soil and from the 8-36 inch depth to properly evaluate nitrogen fertilizer carryover.

Raymond C. Ward, Ph.D., Certified Professional Soil Scientist
Fertilizer Recommendations › 63
Legumes (beans, alfalfa, clover, and cover crops) supply nitrogen for the next crop. Research from Iowa, Nebraska and Kansas has shown that the past soybean crop will supply 40 to 50 pounds of nitrogen per acre. In addition, corn and milo production will increase 10 or more bushels per acre following soybeans compared to following corn or milo. This past soybean nitrogen should be subtracted from the next crop nitrogen fertilizer recommendation. A good stand of alfalfa will supply about 100 pounds of nitrogen to the first non-legume crop. Clover will supply about 70 pounds of nitrogen that can be subtracted from the nitrogen fertilizer recommendation.
Irrigation water may be a source of nitrate-nitrogen. Irrigators should have their water checked so they can plan on utilizing this source of nitrogen.
The University of Nebraska "Hall County Project" sampled soil and water for nitrate and found that irrigated fields, on the average, contained 65 pounds of soil and water nitrate-nitrogen in 1983 and up to 90 pounds of nitrogen in 1987. In all fields compared, yields from the nitrogen management practice which include soil and water nitrate were equal to or greater than yields from the higher nitrogen rates normally used by the producer. This continues to hold true today.
Nitrate leaching occurs when water moves deeper than the crop root zone. Natural rainfall and irrigation water are the sources of leaching. Proper irrigation scheduling must be followed to prevent leaching during the growing season. Rainfall during the fall and spring causes most of the leaching problems. The amount of leaching depends on the soil water holding capacity and the amount of water that flows through the soil. Runoff water does not cause leaching.
The formula for estimating leaching losses is:
𝒅 = 𝒂/𝑷𝒗 𝑿 𝟏𝟎𝟎
Where d = depth of nitrate leaching (inches) Pv = soil field capacity a = amount of leaching water (inches).
If the field capacity of a Holdrege silt loam is 46% and a Valentine loamy fine sand is 22% and 10 inches of water moves through the root zone, nitrate leaching will be 22 inches in the Holdrege soil and 45 inches in the Valentine soil. These calculations illustrate the leaching problem in the sandy soils.
Nitrate movement is not distinct but acts like a wave. The leaching calculation predicts the peak nitrate concentration. About 50% of the nitrate will be below and 50% above this calculated point.
Nitrogen application rates must be managed for each particular field. Early spring or late fall nitrogen applications are permissible for silt loam soils but not for sandy soils. For very sandy soil, most of the nitrogen must be applied during the growing season as a sidedressing and/or through the irrigation system. A starter fertilizer placed 2-3 inches to the side of the seed should contain 20-30 pounds of nitrogen for sandy soils. Twenty to 40 pounds of nitrogen could be applied with the herbicide application.
Nitrogen fertilizer can be used efficiently if all sources of soil and water nitrogen are measured and considered. Timeliness of the nitrogen application is controlled somewhat by soil texture and operator preference.
Fertilizer Effectiveness and Starter Technology
Persistent myths coming from the low salt/orthophosphate fertilizer promoters have prompted this response to implied fertilizer advantages. Recent claims have been geared for wheat top-dressing and row crop starter uses. Look for these stories to be adjusted to accommodate foliar feeding promotions as we move into the growing season.

Raymond C. Ward, Ph.D., Certified Professional Soil Scientist
Fertilizer Recommendations › 64
Orthophosphates (ortho-P) are claimed to be agronomically superior to the polyphosphates (poly-P). Poly-P is a chain compound formed by driving water off of ortho-molecules with heat. Two orthos joined in this manner form a pyrophosphate chain; three orthos form a tri-polyphosphate chain. Most polyphosphates exist in the pyrophosphate form.
𝑯𝟑𝑷𝑶𝟒𝑶𝒓𝒕𝒉𝒐𝒑𝒉𝒐𝒔𝒑𝒉𝒂𝒕𝒆
+ 𝑯𝟑𝑷𝑶𝟒
𝑶𝒓𝒕𝒉𝒐𝒑𝒉𝒐𝒔𝒑𝒉𝒂𝒕𝒆 𝑯𝒆𝒂𝒕 →
𝑯𝟒𝑷𝟐𝑶𝟕𝑷𝒚𝒓𝒐𝒑𝒉𝒐𝒔𝒑𝒉𝒂𝒕𝒆
+ 𝑯𝟐𝑶𝑾𝒂𝒕𝒆𝒓
Following soil application, poly-P takes on soil water (hydrolysis) to convert back to ortho-P, the form taken up by plants. This hydrolysis reaction is affected primarily by soil biological activity, which is controlled by soil pH and temperature. Very acid soil conditions and cold soil temperatures slow the conversion. Growing season temperatures should allow most of the reaction to occur within two weeks after application. Remember that 30 - 40% of 10-34-0 is already in the ortho-P form and ready for plant uptake when applied. Dry phosphates (18-46-0, 11-52-0 and 0-44-0) are 100% ortho-P. Field studies have shown no difference in crop response between ortho-P and poly-P.
One advantage of poly-P is the sequestering property, which prevents natural impurities and micronutrients from precipitating. Zinc is held by electron sharing in a ring compound as shown below. The micronutrient sequestering capacity amounts to about 1.5% by weight, depending on the size of the poly-P fraction of the total phosphate.
No sequestering properties exist with the ortho-P in 9-18-9 or 6-24-6, or other ortho-P products forcing growers to use the expensive EDTA chelates for applying zinc, iron, manganese and/or copper.
The "hot mix" formulation of 9-18-9 refers to reacting anhydrous ammonia with phosphoric acid and then adding potassium hydroxide. The heat of this reaction is controlled at approximately 220°F. If the hot mix argument is used, remember that 10-34-0 polyphosphate is made by combining ammonia and phosphoric acid in a pipe reactor at 640°F. "Cold mixing" refers to combining liquid polyphosphate with nitrogen solutions and /or granular potash. Both mixing processes result in the same nutrient availability.
Fertilizer Placement Methods
For many years, fertilizer placement was done in one of two ways: surface broadcast and incorporated, or band applied near the row as "starter" with the planter. New methods such as strip, deep-band, dual placement, pop-up, dribble, and knifed-in have been developed. The terminology can be somewhat confusing at times.
Fertilizer Placement Glossary
Band: any method that applies fertilizer in narrow strips.
Broadcast: uniform application over the entire soil surface.
Deep: application of fertilizer at least 4 inches below the soil surface, usually injected with a knife or subsoiler.
Dribble or Streaming: surface application, usually in liquid form, in a narrow band.
H H

Raymond C. Ward, Ph.D., Certified Professional Soil Scientist
Fertilizer Recommendations › 65
Dual: simultaneous application of N and P (or other) involving anhydrous ammonia or N solution injected with other fluid or dry fertilizer at the same point of application.
Knifed: injected below the surface behind a knife to cut through the soil and residue make an opening for the application.
Plowdown: broadcast fertilizer incorporated by plowing – Not advocated today.
Point Injection: preplant or post-planting applications of fluid fertilizers for conventional and reduced tillage systems; this technique employs a spoked wheel to physically inject nutrients at points 8 inches apart to depths of 4-5 inches.
Pop-up: placement of fertilizer directly with the seed; same as “seed placed”.
Starter: placement in bands on one or both sides of the row; typically applied two inches beside the seed row (2 X 0); synonymous with band application.
The efficiency and benefit from a particular placement method depends on soil type, inherent soil fertility, crop, and climatic conditions. Small grains planted in narrow rows may have different responses than corn grown in rows 30 inches or wider even though both have fibrous root systems, while soybeans might respond differently due to its tap root system.
Some observations about P and K placement are:
1. Effectiveness of various placement methods for P and K is dependent upon soil test levels, soil texture, residue management programs, climate, and yield production potential.
2. Yield response to different placement methods is rare when soil tests are high. 3. When soil P and K tests are low, band placement is necessary as part of the fertilizer program for most crops. 4. Surface strip and deep band applications of nitrogen out-perform broadcast applications of nitrogen. 5. Direct placement of phosphate starter with corn seed is recommended at 6 lbs of N + K2O on sandy soils and at
8 lbs of N + K2O on silty soils and not recommended for soybeans on any soils.
Factors Influencing P Fertilizer Response
Four major factors should be remembered when making comparisons between placement methods:
1. Soil test P level of non-fertilized soil. 2. Root contact with the fertilized soil. 3. P concentration of the fertilized soil solution. 4. Mycorrhizae fungi growth in no-till/soil health systems.
P Level of Non-Fertilized Soil
The probability of a response to P fertilizer decreases as the soil test level increases. The response to P fertilization varies between soils and years. Fluctuations in the mineralization of organic phosphorus are partly responsible for these variable responses. Some subsoils that are medium to high in P can influence P response if sufficient root development takes place in the subsoil. Total root mass (relative to shoot growth) and root distribution are important factors in plant growth and response to applied P fertilizer. A plant with abundant roots relative to shoot growth will require a lower soil test value for optimal growth.
Root Contact with the Fertilized Soil
The amount of root contact with the fertilized soil is the most important factor that influences response to P fertilizer placement. Root length, volume of fertilized soil, and the location of the fertilized soil are the major factors governing root contact.

Raymond C. Ward, Ph.D., Certified Professional Soil Scientist
Fertilizer Recommendations › 66
Total root length will generally be greatest where highest yields are found. If root growth exceeds shoot growth, little P response occurs because the plant is able to obtain adequate P from the unfertilized soil. This can lead to a lack of response even on low P-testing soils. Cool, wet soils slow growth and reduce total root length and activity. This increases the response even on soils testing high for P. Root diseases, root attacking insects, soil compaction, variety, and high ammonium levels can reduce root length and activity.
The volume of fertilized soil directly influences the amount of root contact with the fertilized soil. A band application in 30" rows fertilizes only about 1% of the soil volume. However, due to root proliferation, approximately 4% of the root volume is in contact with the 1% fertilized volume, leaving 96% of the root volume unaffected.
In reduced tillage systems where bands are not disturbed by tillage, multiple bands will be present due to subsequent applications, which, along with diffusion, will increase the volume of fertilized soil.
The location of the fertilized soil is the third major factor involved in root contact. Since fertilizer P is relatively immobile, the key is to place the fertilizer in areas of major root concentration and activity. Concentration of fertilizer P in the top 2" of soil, where root growth is maximum on no-till systems, will lead to positional availability and efficient use of the fertilizer. Lack of residue (causing low soil moisture, high soil temperatures) and compaction can have detrimental effects on root growth and activity.
Phosphorus Level of the Fertilized Soil
The impact that applied phosphorus has on the P status of the soil is the third major factor that influences response to P. A low P buffering soil is one in which more P remains in soil solution as fertilizer P rates increase, allowing it to have a more immediate effect on root P uptake. The influence of applied P on soil test levels and soil solution P concentration will be minor for a soil with high P buffering potential (retention). Low soil test P, high clay content, high content of finely divided carbonates, and elevated iron or aluminum oxide contents are associated with high P buffering potentials.
Root P uptake increases rapidly with increasing solution P concentrations but gradually approaches a maximum. However, if the fertilizer in a band increases the P concentration beyond a point that roots can utilize it, uptake will plateau and the efficiency of P will decline.
Fertilizer placement studies do not always reach the same conclusions. The best placement for a given situation is one that allows for the maximum root contact and the least fertilizer reaction with the soil. The factors discussed must be kept in mind when comparing placement methods.
Mycorrhizae Fungi
Mycorrhizae fungi infect plant roots in a symbiotic relationship that receives energy from the plant in return for plant nutrients provided by the fungi. The fungal hyphae grow out into the soil 5 to 15 cm reaching further and in smaller places than root hairs can explore. The extension of the plant root system can increase nutrient and water absorption up the 10 times as the root system. Mycorrhizae enhance the ability of the plants to take up phosphorus and other nutrients that are found in low concentrations in soil solution.
Band vs. Broadcast
Should fertilizer P be broadcasted or banded? If banded, at what rate? There are no easy answers to these questions, as they depend on the specific situation involved. Four relationships between band and broadcast have been demonstrated in numerous studies in the Great Plains. They are presented on the following page.
ADDITIONAL REFERENCES:
» Fixen, P.E., and Liekam, D.F. 1988 Great Plains Soil Fertility Workshop, Denver, CO.

Raymond C. Ward, Ph.D., Certified Professional Soil Scientist
Fertilizer Recommendations › 67
» Typical Conditions
» High soil test level
» Warm moist soil
» Warm season crop
» Through incorporation
» Low soil test level
» Cold wet soil
» High P fixing soil
» Cold wet soil
» Early growth critical
» Low soil test level
» Minimal incorporation
» Dry soil surface
» Low P fixing
» Heavy residue cover
» Warm moist soil surface
» No tillage or cultivation
Figure 3: Four Relationships Between Broadcast and Band Phosphorus
Raymond C. Ward, Ph.D., Certified Professional Soil Scientist
Fertilizer Recommendations › 68
Fertilizing for Alfalfa
Table 45: Alfalfa Plant Nutrient Content
Nitrogen
= (Crude Protein) / 6.25
20 % CP/ 6.25 = 3.2 % N
= 64 lbs. N / Ton
Phosphorus 12 lbs P2O5 / Ton
Potassium 50 lbs K2O / Ton
Sulfur 5 lbs S / Ton
Table 46: Liming Soil for Alfalfa Production
pH Less than 6.0
Rate Determined by Woodruff Buffer Test
Sandy Soils Need smaller amounts of lime
Clayey Soils Need the largest amounts of lime
Table 47: Alfalfa Phosphorus Fertility
Soil Test, M-3/Bray P-1, ppm P % Sufficiency Yield (Without P2O5), Tons / Acre
0 – 5 25 – 50 2.0 – 4.0
6 – 12 45 – 80 3.6 – 6.4
13 – 25 70 – 95 5.6 – 7.6
26 – 50 90 – 100 8.0
Table 48: Yield Loss Without Phosphorus in Alfalfa
Soil Test, M-3/Bray P-1, ppm P Yield Loss, Tons / Acre Reduction, $ / Acre ($100 / Ton)
0 – 5 4.0 – 6.0 400 – 600
6 – 12 1.6 – 4.4 160 – 440
13 – 25 0.4 – 2.4 40 – 240
26 – 50 0.0 0
Table 49: P2O5 Fertilizer Rates for Alfalfa
Soil Test, M-3/Bray P-1, ppm P Lbs P2O5 Needed, (4 Ton / Acre) Lbs P2O5 Needed, (7 Ton / Acre)
0 – 5 90 – 120 110 – 140
6 – 12 60 – 85 80 – 105
13 – 25 30 – 55 60 – 75
26 – 50 0 – 25 20 – 45

Raymond C. Ward, Ph.D., Certified Professional Soil Scientist
Fertilizer Recommendations › 69
Table 50: P2O5 Fertilizer Cost and Return
Soil Test, M-3/Bray P-1, ppm P P2O5 ($0.50 / lb), $ / Acre Return, $ / Acre
0 – 5 55.00 – 70.00 245 – 530
6 – 12 40.00 – 52.50 120 – 387
13 – 25 30.00 – 37.50 10 – 202
26 – 50 10.00 – 22.50 (10) – (23)
Table 51: Alfalfa Potassium Fertility
Soil Test, ppm K % Sufficiency Yield (Without K2O) Tons / Acre
0 – 40 20 – 50 1.6 – 4.0
41 – 80 45 – 80 3.6 – 6.4
81 – 120 70 – 95 5.6 – 7.6
121 – 200 90 – 100 7.2 – 8.0
200 + 100 8.0
Table 52: Alfalfa Yield Loss Without Potassium
Soil Test, ppm K Yield Loss, Tons / Acre Reduction, $ / Acre ($100 / Ton)
0 – 40 4.0 – 6.4 400 – 640
41 – 80 1.6 – 4.4 160 – 440
81 – 120 0.4 – 2.4 40 – 240
121 – 200 0.0 – 0.8 0 – 80
200 + 0.0 0
Table 53: K2O Fertilizer Rates
Soil Test, ppm K Lbs K2O Needed, (4 Ton / Acre) Lbs K2O Needed, (8 Ton / Acre)
0 – 40 130 – 210 175 – 255
41 – 80 80 – 125 125 – 170
81 – 120 45 – 75 90 – 115
121 – 200 25 – 40 70 – 85
200 + 0 0
Table 54: K2O Fertilizer Cost and Return
Soil Test, ppm K K2O ($0.30 / lb), $ / Acre Return, $ / Acre
0 – 40 52.50 – 76.50 347 – 563
41 – 80 37.50 – 51.00 122 – 439
81 – 120 27.00 – 34.50 13 – 205
121 – 200 21.00 – 25.50 (21) – 74
200 + 0 0

Soil Testing › 70
SOIL TESTING

Alexis Hobbs, M.S., Soil Health Coordinator Raymond C. Ward, Ph.D., Certified Professional Soil Scientist
Soil Testing › 71
General Soil Properties
Soil can be defined as a dynamic natural body that occupies the earth’s surface and supports plant growth. It is the upper, biologically altered part of the unconsolidated material above the bedrock portion of the earth.
Soil is the result of climatic and biological factors on the parent material through time as modified by local topography. Parent material is the debris from weathered rock within which the soil has formed. Climate and vegetation are responsible for regional changes in soil while parent material and topography influence local soil changes.
All these different soil-forming factors contribute to differences in soil profiles, which are considered to be vertical sections from the surface down to the unaltered material below it. A soil profile is generally divided into horizons. The “A” horizon is the topsoil, the “B” horizon is subsoil, and the “C” horizon is the parent material, which does not show soil formation alteration. Depths of each horizon will vary considerably among soil types.
A sample of soil can be roughly divided into four components:
1. mineral matter, accounting for 45 – 49% 2. organic material, accounting for 1 – 5% 3. 25% pore space filled with water 4. 25% pore space filled with air
The mineral fraction is further divided into sand, silt, and clay. These determine the soil texture. The organic portion is dark-colored and is important to physical and chemical properties of the soil. Silt, clay, and organic material are the storehouses for plant nutrients.
Parent Material
Parent material mainly consists of those materials that were:
1. weathered in place, or sedentary 2. transported from their original location
Weathering processes include temperature changes (freezing and thawing); water, wind, and ice erosion; plant roots; microbes; and hydration/dehydration. These processes are responsible for primary breakdown while chemical processes act upon the formation of clay minerals.
Transported parent material includes those moved and deposited by water, wind or glaciers. The more common types of water-transported materials are alluvium, or those deposited by flooding streams, and colluvium, or those moved by gravity, frost action, soil creep, or local wash. Wind transported materials are loess (wind-blown silt-sized particles) and aeolian sands (sand-sized particles). Many land areas of the Midwest have loess deposited over bedrock, sand and gravel, or glacial deposits. The Sandhills of Nebraska are an example of aeolian-deposited sands.
Soil Texture
Soil texture is the relative amount of sand, silt and clay contained in the soil. Sand particles are those which are 0.05 millimeter (mm) or larger in diameter; silt particles measure 0.002 – 0.05 mm in diameter; and clay particles are less than 0.002 mm in diameter. Particle size is the only factor affecting soil texture of mineral soils.

Alexis Hobbs, M.S., Soil Health Coordinator Raymond C. Ward, Ph.D., Certified Professional Soil Scientist
Soil Testing › 72
Soils are divided into 12 major textural classes. Each class has a name that will give an indication of the relative proportion of sand, silt, and clay particles. For example, a soil with approximately equal amounts of sand, silt, and clay is a clay loam. Increasing the silt content would make it silt loam, increasing the clay content would make it clay, and increasing the sand content would make it sandy loam. If the approximate percentage of each particle is measured, the soil texture can be determined by the use of the soil textural triangle.
Figure 4: The Soil Texture Triangle
When pressing a wet sample of soil between your thumb and forefinger, sandy soil will feel gritty, clay soil will form a ribbon, and silty soil will feel “silky.”
Soil texture influences soil properties like water infiltration rate, water holding capacity, fertility retention, erosion potential, compaction, tilth and porosity.
Soil Aggregate Stability
The stability of soil aggregates (soil granules) is important from the standpoint of soil erosion and the movement of water and air in the soil. When aggregates are broken down by raindrop impact, the individual soil particles are more susceptible to movement by water and wind. Clay particles “seal” the surface soil macropores resulting in excessive runoff or ponding and crusting when dry.
Organic matter and microbial activity are the soil constituents that helps maintain aggregate stability. The resins and scums produced by microbes help bind particles together to form water stable aggregates. The type of clay present will also influence soil aggregate stability. Iron oxides and calcium carbonate also act as binding agents.
Farmers cannot control the types of clay or the inorganic binding agents present. However, by managing crop residue on the soil surface, using a crop rotation with a grass or legume, and by use of cover crops, water stable aggregates will increase.
Alexis Hobbs, M.S., Soil Health Coordinator Raymond C. Ward, Ph.D., Certified Professional Soil Scientist
Soil Testing › 73
Soil Density and Porosity
Soil porosity is the pore space of a soil that allows air and water to enter and be stored.
Bulk density of the soil is a measure of soil porosity, which indicates the soil structure condition. Tillage destroys soil structure, which in turn increases bulk density. High bulk density indicates compacted or restricted layers in a soil.
𝑩𝒖𝒍𝒌 𝑫𝒆𝒏𝒔𝒊𝒕𝒚 = 𝑫𝒓𝒚 𝑾𝒆𝒊𝒈𝒉𝒕 𝒐𝒇 𝑺𝒐𝒊𝒍 (𝒈)
𝑽𝒐𝒍𝒖𝒎𝒆 𝒐𝒇 𝑫𝒓𝒚 𝑺𝒐𝒊𝒍 (𝒄𝒎𝟑)
The pore space of a soil is ideally 50% (one-half filled with water). A bulk density of 1.4 is considered the upper threshold, which corresponds to approximately 46% pore space. If the pore space is less than 46%, bulk density is above 1.4 and indicates that the soil may be too compacted for good root development and plant growth.
Cation Exchange Capacity
Cation exchange is one of the most important chemical properties of soils. This involves the exchange of cations between:
1. soil solution and clay and humus surfaces 2. colloidal particles of clay or humus 3. soil solution and plant roots and 4. clay and humus colloidal particle surfaces and plant roots.
Soil clay minerals have negative charges which attract and hold cations such as H, K, Mg, Ca, NH4, Na and others. The cation exchange capacity (CEC) of soils, in our region, is largely influenced by montmorillonite type clays and humus (organic matter). CEC is directly related to the type and amount of clay, and the amount of humus in the soil.
In order for a cation to be removed from a negatively charged site it must be replaced by another cation. A simple reaction may be as such:
Figure 5: CEC Exchange Sites on a Clay Particle
Notice that one Ca++ ion with two positive charges replaces 2 H+ ions with one positive charge each. The number of charges removed must equal the number of charges added.
Effect of Soil pH
In most soils, CEC increases with pH. At very low pH levels (< 5.0), hydrogen (and perhaps aluminum) ions are held so tightly that they effectively resist replacement, resulting in a relatively lower CEC than at high pH values. As pH increases, hydrogen is ionized and is thus replaceable, releasing additional sites on the clay (or humus) particles.
Alexis Hobbs, M.S., Soil Health Coordinator Raymond C. Ward, Ph.D., Certified Professional Soil Scientist
Soil Testing › 74
CEC is measured in terms of milliequivalents (meq) per 100 grams. The “equivalent” is defined as 1 gram atomic weight of hydrogen or the amount of any other ion that will combine with or displace this amount of hydrogen. A milliequivalent is one thousandth of its atomic weight. Thus, if clay has a CEC of 1 milliequivalent per 100 grams, it is capable of exchanging 1 mg of hydrogen or its equivalent for every 100 grams of clay.
The term “equivalent” also implies that other ions may be expressed in terms of milliequivalents. Calcium (Ca++) has an atomic weight of 40 compared to 1 for hydrogen (H+). Each Ca++ ion has two positive charges and is therefore equivalent to two H+ ions. So, the amount of Ca needed to replace 1 mg of H is 40/2 = 20 mg. This is the weight of 1 meq of calcium. If 100 g of a kind of clay is capable of exchanging a total of 250 mg of Ca++, the CEC is 250/20 = 12.5 meq per 100 grams.
Factors Affecting CEC
Fine textured soils (more clay, less sand) have higher CEC values than sandy soils. Within textural classes, organic matter and the amount and kind of clay influence CEC.
Percent Base Saturation
Hydrogen and aluminum ions are the ions that make soils acid. Most of the other cations are called exchangeable bases that neutralize soil acidity. The amount of CEC occupied by the bases is called the percent base saturation. If a percent base saturation of a soil is 80, then four-fifths of the CEC is satisfied by the bases and the remainder by hydrogen and aluminum. These bases include potassium, calcium, magnesium and sodium.
As base saturation is reduced, hydrogen ions increase causing pH to become more acid or lower soil pH. In humid temperate regions, the soil base saturation may be about 25% at pH 5.0 and 75% at pH 6.0. In semi-arid regions, with a pH near 7.0, base saturation may approach 100%. Calcium tends to dominate CEC sites of soils in semi-arid regions while hydrogen and aluminum dominate CEC sites in humid regions.
Factors Influencing CEC and Availability of Plant Nutrients
Several factors may regulate the ability of soil CEC to release cationic nutrients to plants. The first is the relative amount of the CEC that is occupied by the nutrient in question. Second is the effect of other ions held in association with it. For example, magnesium availability can be decreased by adding potassium. Third, types of clay will differ in their tenacity by which ions are held. Calcium, for instance, is held more tightly by montmorillonite than by kaolinite clay.
Generally, it can be assumed that kaolinite has a CEC of about 8, illite 30, montmorillonite 100, and humus about 200 meq per 100 grams. Montmorillonite clays are the predominate clay for the Great Plains soil area.
Table 55: Common CEC Ranges in Soil Texture
Soil Texture CEC, meq/100g
Sands < 6
Fine sandy loams 5 – 10
Loams and silt loams 9 – 18
Clay loams 15 – 25
Clays > 22
ADDITIONAL REFERENCES:
» Brady, N.C. 1974. The Nature and Properties of Soils, 8th edition. Macmillan Publishing Company, Inc., New York.

Alexis Hobbs, M.S., Soil Health Coordinator Raymond C. Ward, Ph.D., Certified Professional Soil Scientist
Soil Testing › 75
Soil Water
Water is a universal solvent that strongly impacts the physical, chemical and biological status of soil. The amount of water in the soil can impact:
1. The amount of air and gas exchange in the soil 2. The pH of the soil solution 3. The nature and amount of soluble material in the soil (dissolution and precipitation) 4. The sorption and desorption of ions in the soil solution 5. The transportation of nutrients to and from plants 6. The microbial habitat and microbial access to nutrients
These characteristics strongly impact soil organisms and plants that are dependent on water for mass flow or diffusion of nutrients and oxygen. Excess water from high watering events (rainfall, irrigation, etc.) can cause nutrients to be drained (leached), increase denitrification and desulfurization processes in the soil profile, and become inaccessible to plants. Understanding how water is held in the soil and how much it can hold can help producers create efficient irrigation strategies.
Figure 6: Soil Water Potential
Soil Water Potential
Water is held by three dominant forces in the soil: adhesion, cohesion and gravity (See Figure 4-3). Water adheres and coats the surface of mineral and organic particles. This thin coating of water is inaccessible to plants as the adhesive force between the water and soil particles is great. This component is also referred to as matric potential. Water has the unique ability to stick to itself. This cohesive property, through hydrogen bonding and dipole interactions, is easily seen by the dome like structure of a drop of water on a flat surface. Water also has the tendency to be attracted to salt or move to drier areas. The combined matric and osmotic pressures are responsible for the retention of water in the soil.

Alexis Hobbs, M.S., Soil Health Coordinator Raymond C. Ward, Ph.D., Certified Professional Soil Scientist
Soil Testing › 76
When soil becomes saturated, gravity will pull excess water through the soil profile. This occurs after heavy rainfall, spring thaw and irrigation. Any water that exceeds the matric and osmotic potential for the soil is drained. This is often accomplished 3 days after a heavy rainfall event if no more water is added to the soil system.
Field capacity is the maximum amount of water the soil can hold after saturation. Wilting point is the water held tightly to the surface of soil particles and soil organic matter. This is the maximum amount of water the soil can hold that is not accessible to plants. The difference between these two measurements indicates the amount of water that can be held within the soil that is readily available for plants.
Available Water Capacity
Available water capacity is a commonly used method of measuring the amount of available water in a soil. This gravimetric process is measured using porous ceramic plates and pressure plate extractors set at -0.1 bars and -15 bars to mimic field capacity and wilting point of the soil, respectively. The difference between the water mass -15 bars and at -0.1 bars provides the available water capacity of a soil and is expressed as gram of water per gram of soil. This can be converted to inches of water per foot of soil by multiplying by 12. Available water capacity is strongly influenced by the pore size distribution and organic matter content.
ADDITIONAL REFERENCES:
» Brady, N.C. 2008. The Nature and Properties of Soils, 8th edition. Macmillan Publishing Company, Inc., New York.
Organic Matter
Organic matter (OM) influences physical and chemical properties of soils. In some soils, OM may be responsible for nearly half of the cation exchange capacity (CEC). It is also important in maintaining the stability of soil aggregates. In addition, microbes in the soil also utilize OM as a food source. The primary source of OM is decayed plants while a secondary source is decayed animals. Both plant tops and roots supply large amounts of OM as they are decomposed by microbes and become integrated into the "A" horizon of the soil. Plant tissue influences soil formation as well as being a source of OM.
Carbohydrates of various complexity, fats and oils, proteins, and lignins are the major classes of compounds present in OM. These compounds vary in their rate of decomposition. Sugars, starches, simple proteins, and complex proteins decompose the most rapidly while hemicelluloses, cellulose, lignins, and fats decompose more slowly. Waxes decompose at the slowest rate.
Three general reactions occur in soil upon addition of organic tissues:
1. Enzymatic oxidation increases 2. N, P, and S are mineralized and/or immobilized 3. Compounds resistant to degradation are formed either from compounds present in the original plant tissues or
by microbial synthesis.
Humus
Humus is defined as a complex mixture of brown or dark brown amorphous and colloidal substance that can consist of either modified original tissue or tissue synthesized by soil microbes.
The formation of humus is very complicated, but in general terms, humus formation can be described as organic tissue that is incorporated into warm, moist soil and acted upon by soil microorganisms.

Alexis Hobbs, M.S., Soil Health Coordinator Raymond C. Ward, Ph.D., Certified Professional Soil Scientist
Soil Testing › 77
As decomposition proceeds, two major kinds of organic compounds remain in the soil:
1. resistant compounds of higher plant origin (i.e. oils, fats, waxes, and lignins). 2. new compounds synthesized by microbes (i.e. polysaccharides and polyuronides).
These two groups of compounds form the basic structure of humus. As the humus forms, numerous reactions of great practical importance occur, such as those allowing N to become an integral part of the humic complex.
Humus is highly colloidal with a surface area and adsorption capacity greater than clay. It will adsorb water from a saturated atmosphere at an amount equal to 80 - 90% of its weight, compared to 15 - 20% for clay. The most evident physical features of humus are low plasticity, cohesion, and its dark color. Humus formed in semi-arid regions is generally darkest in color.
Influence of Soil Organic Matter on Soil Properties
1. Soil Color – brown or black 2. Physical properties
a. increased granulation b. increased plasticity c. increased water holding capacity
3. High cation exchange capacity a. organic matter is 2 to 30 times greater than mineral colloids b. increased cation adsorption power of mineral soils
4. Supply and availability of nutrients a. easily replaceable cations present at the adsorption sites b. organic matter is the main source N, S, P and other plant nutrients c. weathering of elements from minerals by acids developed during humus formation
Factors Affecting Soil Organic Matter and Nitrogen
1. Temperature a. decomposition of organic residue is accelerated by increased temperature; therefore, soils in cooler
climates have higher organic matter levels 2. Natural vegetation
a. organic matter is higher under grassland vegetation than under forest vegetation 3. Soil texture, drainage
a. less organic matter in sand, probably due to lower moisture content b. poorly drained soils are higher in organic matter due to retained moisture and poor aeration c. erosion removes organic matter from the soil d. vegetative cover of soils increases organic matter
4. Cropping a. Organic matter declines over time in soil from which native vegetation was cleared away. Tillage opens up
the soil allowing soil microbes to have more oxygen, which increases the decomposition rates of organic residues. Organic matter content will decline in situations where soil is more aerated and where soils lack fertility. Crop rotation with legumes helps to maintain soil organic matter because of less tillage and aeration.
Sources of Organic Matter
1. Farm manures and/or composts at 10-15 tons per acre can aid in organic matter maintenance. Crop residues and roots contribute to the maintenance of organic matter.
2. Liming and proper fertilization also contribute to organic matter maintenance through higher yields and dry matter production.

Alexis Hobbs, M.S., Soil Health Coordinator Raymond C. Ward, Ph.D., Certified Professional Soil Scientist
Soil Testing › 78
ADDITIONAL REFERENCES:
» Brady, N.C. 1974. The Nature and Properties of Soils, 8th edition. Macmillan Publishing Company, Inc., New York.
Soil Microorganisms
Soil is host to a tremendous population of living organisms, most too small to be seen without magnification. These include bacteria, actinomycetes, fungi, protozoa, algae, yeasts, worms, and insects. One gram of soil may contain as many as one billion bacteria, 15 million actinomycetes, one million fungi and protozoa, 100,000 algae and 1,000 yeasts. Added together, that makes three to five tons of living organisms per acre - foot of soil.
Nearly all microorganisms (or microbes) are found in the top three feet of soil, and most are concentrated in the top several inches. The population of bacteria, for example, may be more than four times higher in the top three inches of soil than in the 9–12 inch depth.
The majority of microbes obtain food and energy by breaking down complex organic substances provided by higher plants and animals. Without microbial activity, the waste of dead animals and plants would literally bury the earth's surface.
Various microbes grow best under different conditions:
» Bacteria – tend to respond rapidly to additions of simple sugar and starch compounds.
» Fungi and actinomycetes – tend to respond to cellulose and other more resistant compounds and to crop residues.
» Cyanobacteria – contains chlorophyll so they can photosynthesize like plants.
Most groups depend on organic matter as a food source. Some obtain energy by oxidizing inorganic elements such as sulfur and nitrogen, while their carbon source is from water soluble carbon in the soil. Some species can live in the absence of free oxygen. These are known as anaerobic microbes, while those needing oxygen are classified as aerobic.
The decomposition of organic matter completes an important cycle in the plant world. As a plant grows, it absorbs nutrients from the soil, matures, and dies; then through microbial breakdown, the nutrients are again released and made available for the next generation. Without this process, most of the carbon in our environment would be tied up in plant and animal tissue. During decomposition, certain acids are formed which react with soil minerals containing vital plant elements; this makes them more soluble and available to growing plants. Returning residues to the soil supplies the organic materials needed to keep the process continuous.
Nitrogen Immobilization
As mentioned, the microbial breakdown of crop residues releases nutrient elements for use by subsequent crops. This mineralization process increases the supply of available nutrients. However, during decomposition, a temporary tie-up of these nutrients may occur through the process of immobilization.
Plant residues, such as wheat straw, may not contain enough nitrogen to satisfy the "diets" of the microbes. In this case, they may consume the carbon in the straw and the available nitrate from the soil. Their consumption may be so great, that little is left for the crop. This is known as biological immobilization of available N and may induce or intensify deficiencies. Once the microbes die and decay, the N is mineralized into available ammonium and nitrate.
Microbes function best if the ratio of carbon to nitrogen (C:N ratio) is less than 25:1. When the ratio is larger than 25:1, microbes must borrow N from the soil to complete their task. Table 4-2 below shows the approximate C:N ratios of some crop residues.

Alexis Hobbs, M.S., Soil Health Coordinator Raymond C. Ward, Ph.D., Certified Professional Soil Scientist
Soil Testing › 79
Table 56: C:N Ratios of Organic Materials
Organic Material C:N Ratio
Sweet Clover 12 : 1
Barnyard Manure 20 : 1
Clover Residues 23 : 1
Green Rye 36 : 1
Corn Residue 50 : 1
Cane Residue 60 : 1
Wheat Straw 80 : 1
Timothy Grass 80 : 1
Sawdust 400 : 1
If a material with a C:N ratio higher than 25:1 is added to a soil low in nitrate, decomposition will take longer than if that same material was added to a soil high in nitrate. For wheat, about 20 lbs/acre of N per ton of straw is needed to balance the C:N ratio and provide rapid decomposition. On the next page is an illustration of microbial activity when a wide C:N ratio material is added to the soil.
Figure 7: Microbial Activity Response to Various C:N Ratio Material
Legume Bacteria
Legumes inoculated with the proper strain of nodule forming bacteria (Rhizobia) use atmospheric N to convert N gas into amines that can be used for growth. Thus, applying N fertilizer is not necessary. Many legumes leave substantial amounts of available N to succeeding crops. See the N fertilizer recommendation section for the suggested N credits for various legume crops.

Alexis Hobbs, M.S., Soil Health Coordinator Raymond C. Ward, Ph.D., Certified Professional Soil Scientist
Soil Testing › 80
Soil Activators
Products called soil activators or soil conditioners are often sold with the idea that they increase the numbers, or activity, of microbes present in the soil. In reality, most of these products will add less than a pound of microbes to a soil that already has 2,000 to 4,000 lbs. of microbes per acre. Be careful! These products are no substitute for good, proven farming and soil management practices.
ADDITIONAL REFERENCES:
» Soils and Soil Fertility. 1982. Kansas State University Cooperative Extension Service.
» Brady, N.C. 2008. The Nature and Properties of Soils, 8th edition. Macmillan Publishing Company, Inc., New York.
Principles of Soil pH
The acidity or alkalinity of the soil is measured by a pH meter. The meter measures the potential difference between the hydrogen (glass) electrode and the reference (calomel) electrode and converts the reading to pH. A soil pH of 6.5 to 7.2 is neutral and is acid below or alkaline above the range.
The small "p" is the math symbol for negative logarithm and the large "H" is the chemical symbol for hydrogen. So, the definition of soil pH is the negative logarithm of the hydrogen ion activity in soil solution.
Soil pH is related to the properties of the "ionic atmosphere" around soil clay particles. Clay particles are negatively charged, and thus neutralized by positively charged ions called "cations".
The thickness of the double layer depends in part on the cations dissolved, and is thicker with more water in the soil, greater hydration of the cations, and lower valance cations. When water is limited in the soil, salts are concentrated, and the double layer is much thinner. The cation concentration in the solution becomes similar to the cation concentration on the clay surface.
The effect of salts is relevant to the concept of soil pH. Hydrogen ion concentration on the soil particle surface is higher than in the solution due to the hydrogen ion concentration gradient across the double layer. In other words, the H ion is small and is held tightly on the soil particle surface. As the double layer is compacted (thinned) by adding salts or decreasing water concentration, the hydrogen ion gradient is reduced and the pH of the soil solution falls.
This means that soil pH readings can vary from time to time within a year or between years. The amount of soluble salts in the soil varies continuously depending on such factors as amount of rainfall percolating through the soil, nitrification rate, salt content of irrigation water, and residue management. So, the apparent pH of a soil is often higher in wet, cool weather than in hot, dry weather. Seasonal variations can affect soil pH readings by 1.0 pH unit or more.
By measuring pH readings in a salt solution strong enough to mask climatic changes, many of the climatic effects of soil pH variation can be reduced. The salt solution most often used is 0.01 molar calcium chloride (CaCl2). The University of Missouri uses this salt pH test for interpretation of soil pH on farmer fields. Other universities in the North Central and Southern regions of the United States determine pH in distilled water.
The pH of a soil measured in 0.01 M CaCl2 is more constant and is closer to the pH of the solution around plant roots. The salt pH is usually lower by 0.5 to 0.9 units, depending on existing climactic conditions. Our lab has measured higher water pH's after extended wet, cool periods.
The basic control factors of soil pH are
1. activity of calcium ions and 2. concentration of carbon dioxide.
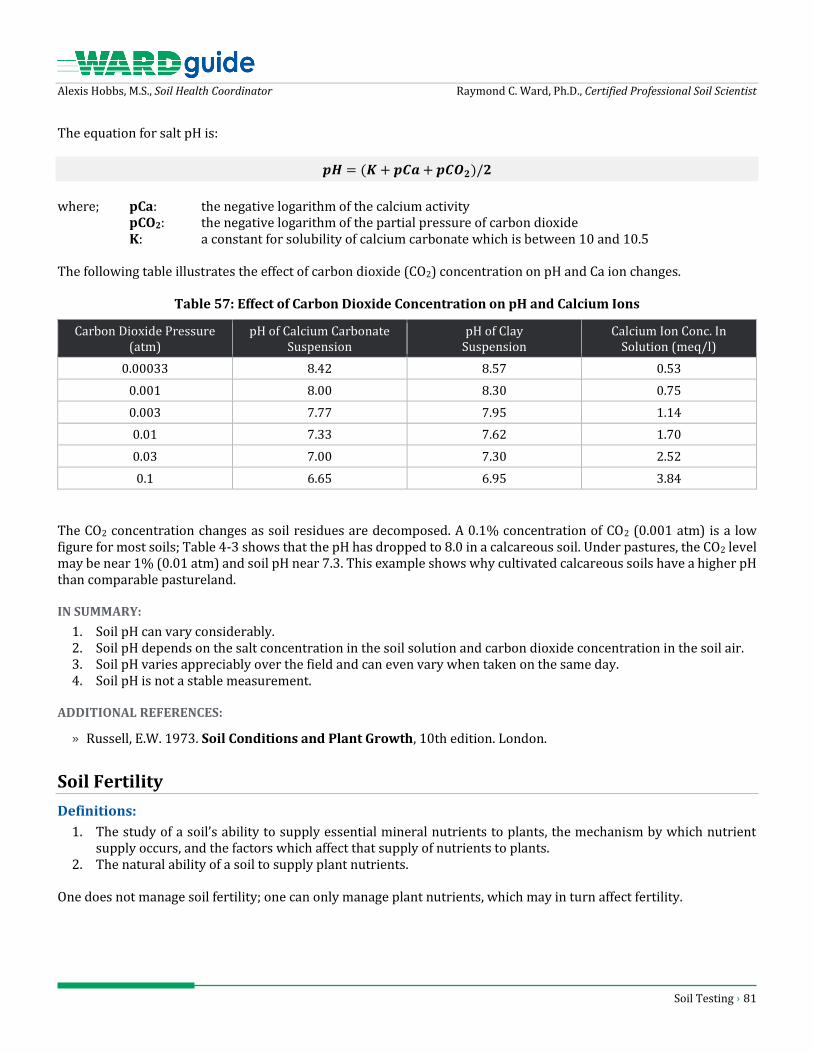
Alexis Hobbs, M.S., Soil Health Coordinator Raymond C. Ward, Ph.D., Certified Professional Soil Scientist
Soil Testing › 81
The equation for salt pH is:
𝒑𝑯 = (𝑲+ 𝒑𝑪𝒂 + 𝒑𝑪𝑶𝟐)/𝟐
where; pCa: the negative logarithm of the calcium activity pCO2: the negative logarithm of the partial pressure of carbon dioxide K: a constant for solubility of calcium carbonate which is between 10 and 10.5
The following table illustrates the effect of carbon dioxide (CO2) concentration on pH and Ca ion changes.
Table 57: Effect of Carbon Dioxide Concentration on pH and Calcium Ions
Carbon Dioxide Pressure (atm)
pH of Calcium Carbonate Suspension
pH of Clay Suspension
Calcium Ion Conc. In Solution (meq/l)
0.00033 8.42 8.57 0.53
0.001 8.00 8.30 0.75
0.003 7.77 7.95 1.14
0.01 7.33 7.62 1.70
0.03 7.00 7.30 2.52
0.1 6.65 6.95 3.84
The CO2 concentration changes as soil residues are decomposed. A 0.1% concentration of CO2 (0.001 atm) is a low figure for most soils; Table 4-3 shows that the pH has dropped to 8.0 in a calcareous soil. Under pastures, the CO2 level may be near 1% (0.01 atm) and soil pH near 7.3. This example shows why cultivated calcareous soils have a higher pH than comparable pastureland.
IN SUMMARY:
1. Soil pH can vary considerably. 2. Soil pH depends on the salt concentration in the soil solution and carbon dioxide concentration in the soil air. 3. Soil pH varies appreciably over the field and can even vary when taken on the same day. 4. Soil pH is not a stable measurement.
ADDITIONAL REFERENCES:
» Russell, E.W. 1973. Soil Conditions and Plant Growth, 10th edition. London.
Soil Fertility
Definitions:
1. The study of a soil’s ability to supply essential mineral nutrients to plants, the mechanism by which nutrient supply occurs, and the factors which affect that supply of nutrients to plants.
2. The natural ability of a soil to supply plant nutrients.
One does not manage soil fertility; one can only manage plant nutrients, which may in turn affect fertility.
Alexis Hobbs, M.S., Soil Health Coordinator Raymond C. Ward, Ph.D., Certified Professional Soil Scientist
Soil Testing › 82
Dynamics of a Soil – Plant System
If M is a nutrient element, its movement can be described as follows:
𝑴(𝒔𝒐𝒍𝒊𝒅 𝒑𝒉𝒂𝒔𝒆) →𝑴 (𝒔𝒐𝒍𝒖𝒕𝒊𝒐𝒏)
→ 𝑴(𝒑𝒍𝒂𝒏𝒕 𝒓𝒐𝒐𝒕)
→𝑴(𝒑𝒍𝒂𝒏𝒕)
Energy must be supplied by the plant for movement of nutrients into the plant.
Availability of Plant Nutrients
Plant nutrient availability has both chemical and positional components. Unavailable forms of nutrients are found in soil minerals, soil organic matter, and precipitated compounds.
Factors that affect the conversion of unavailable to available forms and vice versa are:
1. the chemical activity in its unavailable form, 2. the chemical activity of any replacing ions at the point of reaction, 3. the amount of available ion in solution, 4. microbial activity, and 5. factors that affect the transfer of available ions to the root surface.
Microbial activity is affected by moisture, aeration, nutrient supply, temperature, and soil pH. The transfer of available ions to the root surface is affected by the replaceability and the number of exchangeable ions, and by the concentration gradient present for dissolved ions.
Nutrient Mobility
Definition: the ability of a nutrient ion to move through the soil by one or several mechanisms.
The nitrate ion is the most mobile in the soil because of its high water solubility and very limited reaction with soil compounds. Sulfate is nearly as mobile as nitrate but may be restricted in soils with appreciable anion exchange capacity (highly weathered soils). Exchangeable cations are held by clay and organic matter but are in equilibrium with the soil solution. The rate of release depends on:
1. exchange types and concentrations in the soil solution, 2. the replaceability of the exchangeable cations, and 3. the rate of removal from the soil solution.
Six Essential Steps for a Successful Soil Fertility Program
1. Collecting Good Representative Soil Samples: A soil test and interpretation is only as good as the sample. 2. Proper Care of the Sample: Do not contaminate the sample. Send samples immediately for analysis. 3. Chemical Analysis at the Laboratory: Reliable test results are available since procedures are standardized and
regulated by the state. 4. Proper Interpretation of Laboratory Results: Interpretation must be based on regional land grant university
fertility and soil test calibration research. 5. Develop Recommendations Based on land grant university research in your region for your crops. 6. Refine Recommendations with Individual Grower: Should be the responsibility of the crop consultant or
Agronomist (CCA).
Alexis Hobbs, M.S., Soil Health Coordinator Raymond C. Ward, Ph.D., Certified Professional Soil Scientist
Soil Testing › 83
Soil Nitrogen
Soil nitrogen (N) is present in one of four major forms:
1. Organic - associated with soil humus 2. Amino acids 3. Ammonium N fixed by certain clay minerals 4. Exchangeable ammonium and soluble nitrate
Most soil N is associated with organic matter, being released at a rate of 2-3% per year in conventional tillage; release rate is much slower in no-till. Clay-fixed ammonium N is only slowly available to plants and microorganisms. Soluble nitrate and ammonium account for only 0.1 – 2.0 % of total nitrogen present except in cases of large applications of nitrogen fertilizer.
Six key biochemical processes make up an interlocked system known as the nitrogen cycle. These processes are:
1. Fixation 2. Immobilization 3. Ammonification 4. Nitrification 5. Denitrification 6. Leaching
Figure 4-5 shows the main portions of the nitrogen cycle. Additions to the system are through commercial fertilizers, crop residues, animal manures, and ammonium and nitrate salts brought down by rain. Certain microorganisms fix atmospheric N. Depletion is due to crop removal, drainage, erosion, and gaseous losses. Most of the N additions go through several reactions before removal can occur.
Fixation
Fixation of ammonium can occur through clay minerals or by organic matter. The negative charge of clay minerals attracts and traps the ammonium cation, making it relatively unavailable to plants or microbes. The addition of fertilizers containing free ammonia can react with soil organic matter to form compounds that resist decomposition, in a sense "fixing" the ammonia. Legume bacteria, Rhizobium, fix atmospheric nitrogen. Since the legume plants are able to use the nitrogen fixed by these bacteria, the relationship is known as symbiotic. These bacteria take free N from the soil air and synthesize it into plant useable forms. It is likely that N compounds produced within the bacterial cells are diffused out the cell wall and absorbed by the host plant.
Immobilization
When fresh plant materials or crop residues are added to the soil, microorganisms begin to decompose this material. Microbial population increases soon after the addition of the fresh plant residue. If the plant material has a carbon:nitrogen (C:N) ratio greater than 25, the microbial population will use available soil nitrogen to decompose the residue. This process is referred to as immobilization of nitrogen. On the other hand, if the C:N ratio of the fresh plant material is less than 25, the microbial population will begin releasing additional available nitrogen.

Alexis Hobbs, M.S., Soil Health Coordinator Raymond C. Ward, Ph.D., Certified Professional Soil Scientist
Soil Testing › 84
Figure 8: The Nitrogen Cycle
Mineralization
The conversion of organic nitrogen to available forms is referred to as mineralization. Mineralization is a combination of two distinct microbiological processes (1) ammonification and (2) nitrification.
Ammonification
This process occurs when organic matter is broken down, through enzymatic digestion of bacteria and fungi, into simpler amino compounds. Further reactions break these down to carbon dioxide, water, and ammonium (NH4
+). Plants can use NH4, although most N uptake is in the nitrate form. Ammonification progresses best in well-drained, aerated soils but will occur under almost any condition because of the wide variety of organisms capable of accomplishing these changes.
Nitrification
This is an oxidative process that converts ammonium (NH4) to nitrate (NO3). Two groups of bacteria, collectively called nitrobacteria, are involved. These bacteria obtain their energy by oxidizing inorganic compounds such as ammonium, sulfur, and iron while obtaining carbon from carbon dioxide (CO2). Nitrosomonas is responsible for the conversion of NH4+ to nitrite (NO2), then nitrobacter oxidizes NO2 to NO3. The second transformation follows the first so closely that little nitrite (toxic to plants) accumulates.

Alexis Hobbs, M.S., Soil Health Coordinator Raymond C. Ward, Ph.D., Certified Professional Soil Scientist
Soil Testing › 85
Nitrifying bacteria is very sensitive to their environment. Aeration, temperature, moisture, lime, fertilizer salts, and the carbon:nitrogen (C:N) ratio can all affect the vigor of these bacteria. Since nitrification is oxidative, any procedure that increases soil aeration should increase it. The temperature range for nitrification is from 30° to 125° F, with 80° to 90° F being optimum. The optimum soil moisture content for plants is also optimum for bacteria. Extremely low or high soil moisture can be detrimental; however, nitrification can proceed at or below the wilting point. Nitrification requires abundant exchangeable bases, partially accounting for low rates occurring in acid mineral soils. But acidity itself is little consequence when adequate bases are present, as peat soils of below pH 5.0 may have high nitrification rates.
Applying large quantities of NH4-N fertilizers to strongly alkaline soil can depress the nitrobacter step, possibly due to toxicity to those bacteria. Nitrosomonas are apparently not affected, leading to possible buildup of NO2 in very high pH soils. The C:N ratio is significant in the nitrification process. As the microbes decompose plant and animal residues, they incorporate inorganic nitrogen into their bodies, thus immobilizing nitrogen, and bringing nitrification to a virtual standstill. Competition between bacteria and higher plants for N is initiated. As the carbon content of residue decreases, through the loss of CO2, to a C:N ratio of about 25:1, some of the immobilized N is mineralized and ammonium compounds appear, returning favorable conditions for nitrification, releasing NO3.
NO3-N, whether added in fertilizer or nitrification, may go in four directions:
1. used by microbes 2. used by plants 3. leaching 4. denitrification
Leaching is the loss of NO3 by drainage through the root zone. Since NO3 is highly soluble and does not attach to clay particles, it leaches easily with rainfall or irrigation.
Denitrification
Denitrification occurs when NO3 is converted back to the gaseous form of N and returns to the atmosphere. Conditions encouraging denitrification are poorly drained, poorly aerated soils often found in wet springs. Anaerobic microbes are responsible for using oxygen from the NO3 for the reduction process. The trend of reactions is:
𝑵𝑶𝟑𝑵𝒊𝒕𝒓𝒂𝒕𝒆
→𝑵𝑶𝟐𝑵𝒊𝒕𝒓𝒊𝒕𝒆
→𝑵𝟐𝑶
𝑵𝒊𝒕𝒓𝒐𝒖𝒔 𝑶𝒙𝒊𝒅𝒆 →
𝑵𝟐𝑬𝒍𝒆𝒎𝒆𝒏𝒕𝒂𝒍 𝑵𝒊𝒕𝒓𝒐𝒈𝒆𝒏
Nitrous oxide and N2 are the major forms of gaseous loss.
Reactions and Fate of Nitrogen Fertilizers
Nitrogen applied in fertilizer undergoes the same reactions that are involved in the biochemical releases from plant and animal residues. Fertilizer N will be in one or more of three forms:
1. Nitrate (NO3) 2. Ammonia (NH4) 3. Urea-N (CO(NH2)
Urea-N is subject to ammonification, nitrification and utilization by microbes and plants. Ammonium fertilizers can be oxidized to nitrates, fixed by clay particles, or absorbed by plants and microbes. Nitrate fertilizers can be lost by denitrification, leaching, or absorption by plants and microbes.
Alexis Hobbs, M.S., Soil Health Coordinator Raymond C. Ward, Ph.D., Certified Professional Soil Scientist
Soil Testing › 86
ADDITIONAL REFERENCES:
» Brady, N.C. 2008. The Nature and Properties of Soils, 8th edition. Macmillan Publishing Company, Inc., New York.
Soil Phosphorus
Several conclusions have been drawn from numerous phosphorus fertilization experiments.
1. Recovery of fertilizer phosphorus by a crop planted immediately after application is low, 2. usually 10 - 30%. 3. Loss of applied phosphorus in percolating water is very small. 4. When broadcast on soils, most phosphorus not found in the harvested crop remains in the first 2 or 3 inches of
soil. Moldboard plowing incorporates P deeper but is not recommended. 5. Phosphorus remains available to plants for several years. 6. In many soils the total content of phosphorus is greater as the particle size becomes smaller. 7. Harvesting and removing crops result in depletion of soil phosphorus.
The above conclusions can be explained by looking at the reactions that occur when phosphate fertilizer is applied to soils. These reactions are valuable in explaining phosphorus availability, retention, and build-up in soils.
Phosphate Reaction in Soils
Phosphorus forms slightly soluble compounds in soils. Thus, the amount of phosphorus in solution at any one time is very small. When plants are growing, it has been shown that the soil solution must be renewed with phosphorus many times per day in order to obtain normal plant growth. The factor that limits phosphorus uptake by plants is the rate of renewal of phosphate in the soil solution near the plant roots.
The low solubility of phosphorus in soils is caused by phosphate reactions with iron, aluminum and calcium ions. Iron and aluminum ions adsorb (holds) phosphorus in acid soils and calcium ions adsorb phosphorus in alkaline soils. As phosphorus is absorbed by plant roots more phosphorus moves into the soil solution to keep supplying the plant. This process is called diffusion.
The total amount of phosphorus in soils ranges between 200 and 2000 pounds per acre in the topsoil, but the amount in the soil solution may be about 0.1 – 2.0 pounds per acre. This illustrates the low water solubility of phosphorus in soils.
Acid mineral soils contain certain levels of soluble (exchangeable) iron (Fe) and aluminum (Al). The more acid the soil, the more concentrated the iron and aluminum. Also, freshly formed Fe and Al compounds become less soluble over time. Fixation is much greater below a soil pH of 5.0. In addition to soluble and exchangeable Fe and Al, soil clays are sources of iron and aluminum that are capable of reacting with phosphate ions.
In alkaline soils high calcium activity encourages the formation of dicalcium phosphate. Although the solubility of dicalcium phosphate is greater than that of iron and aluminum phosphates, its solubility is high enough to supply plants with phosphate. In some alkaline soils there is an abundance of tiny lime (CaCO3) crystals that adsorb phosphate ions in a similar reaction.
Factors Influencing Phosphorus Retention in Soils
Phosphorus availability in soils is greatest when the soil pH is between 5.5 and 7.0 as shown below.

Alexis Hobbs, M.S., Soil Health Coordinator Raymond C. Ward, Ph.D., Certified Professional Soil Scientist
Soil Testing › 87
Figure 9: Influence of Soil pH on Phosphorus Availability
When phosphate fertilizer is added to a soil, it reacts with the appropriate compounds depending on soil pH. The initial reaction is from soil solution to adsorption on existing crystals (solid phase).
Figure 10: Fate of Added Fertilizer P in Soil
Phosphorus continues to react with the solid phase and eventually becomes part of the crystal. Solubility decreases as the phosphate becomes an integral part of the crystal. The period of time may be short or long depending on the "fixing capacity" of the soil.
Figure 11: Phosphorus Fixation in Soil
Alexis Hobbs, M.S., Soil Health Coordinator Raymond C. Ward, Ph.D., Certified Professional Soil Scientist
Soil Testing › 88
Soils with a high fixing capacity will require larger amounts of phosphorus fertilizer. Once the capacity is filled, then the rate of fertilizer can be reduced. The amount of iron, aluminum, or calcium in relation to the amount of phosphate determines P fixing capacity. The phosphorus fixing capacity of many soils has been satisfied from past phosphate fertilization. Soil testing will tell if the fixing capacity has been satisfied. We also have a buffer P test that can estimate the amount of phosphate needed to satisfy the fixing capacity.
Soil clays of the 2:1 type fix or adsorb less phosphorus than clays in highly weathered soils where 1:1 type clays predominate.
Solubility of phosphate compounds increases as temperature increases. This means that crops grown during the cooler periods of the year will show more visual response to added phosphate.
It has been estimated that 1/3 of the total phosphate in native grassland agricultural soils was organic in nature. The loss of organic matter by cultivation has no doubt reduced the organic portion. The organic phosphorus is mineralized similarly to nitrogen; once it is in the mineral form, it enters the soil solution and reacts with the mineral or solid phase as already shown. Laboratory experiments have shown that decreases in the organic P content of soil are related to increases in soil test P. Mineralization of organic P in relation to the C:N:P ratio suggests that when the C:inorganic P ratio is 200:1 or less, mineralization will occur. If that ratio is 300:1 or more, immobilization will occur.
Phosphorus Availability in Soils
The rate of dissolution and diffusion of solid phase phosphate to solution phosphate determines soil phosphate availability. It has been shown that all phosphate added to soil reacts with the solid phase. For the phosphorus to become available to the plant, it must go back into solution.
As phosphate ions (H2PO4 - and HPO4 - -) are taken out of solution by the plant root more must be released from the solid phase. The rapidity of replenishment determines the availability. The availability is determined by soil P test. Inorganic Soil P
As mentioned, plants absorb P mainly as H2PO4 - or HPO4--. The concentrations are related to soil pH levels. The H2PO4
- ion predominates in acid environments while HPO4- - occurs above pH 7.0. Phosphorus soil tests are designed to measure the portion of solid phase phosphorus that moves into the solution phase rapidly as needed by the plant. If there is not enough solid phase phosphate present to supply this solution phase need, then phosphorus fertilizer must be added.
ADDITIONAL REFERENCES:
» Brady, N.C. 2008. The Nature and Property of Soils. 8th edition. Macmillan Publishing Co., Inc., New York.
» Tisdale, S. L. and Nelson, W.L. 1966. Soil Fertility and Fertilizers. 2nd edition. Macmillan Publishing Co., Inc., New York.
Soil Potassium
Potassium (K) is an essential plant nutrient identified with overall plant vigor. Potassium is absorbed by plants in larger amounts than other plant nutrients with the exception of nitrogen and possibly calcium. The earth's crust contains about 2.40% K, compared to only 0.11% P. Content may vary from as little as a few hundred pounds to more than 50,000 pounds of K per acre furrow slice. Original sources of K are primary minerals including feldspars, muscovite, and biotite.

Alexis Hobbs, M.S., Soil Health Coordinator Raymond C. Ward, Ph.D., Certified Professional Soil Scientist
Soil Testing › 89
Potassium Equilibrium in the Soils
Soil K exists as:
1. Relatively unavailable or fixed 2. Slowly available 3. Readily available
Unavailable or fixed K occurs in the primary minerals mentioned above. As much as 98% of all soil K can be relatively unavailable. Weathering processes over time gradually break down the primary minerals to release K for plants but K ions released during weathering may also be lost to drainage, held as an exchangeable ion on clay particles, or converted to a slowly available form.
Slowly and readily available K account for 1-2% of the soil's total K content. Readily available K occurs in soil solution and on exchange sites and is absorbed by plants. Slowly available K is considered unextractable by normal procedures used in laboratory analysis for K. Over a period of time, this K becomes readily available. Equilibrium exists between exchangeable and solution K. This is of practical importance since absorption by plants causes a temporary disruption in the equilibrium, causing exchangeable K to move into solution to restore equilibrium. As water-soluble fertilizers are added to the soil, the reverse occurs. Available K, already in equilibrium in soil solution with similar cations, is in equilibrium with slowly available forms indicated by:
slowly available K exchangeable K water-soluble K
Factors Affecting Potassium Fixation in Soils
Certain factors influence the conversion of soil and fertilizer K to less soluble forms, including the type of colloid, temperature, wetting and drying, and soil pH.
Colloid Type
K fixation takes place mostly in soils containing expanding clays such as montmorillonite, illite, or vermiculite. Clays of the 1:1 type do not fix K in the manner that 2:1 clays do. Although organic matter can hold K+ in the exchangeable form, it cannot fix it. The more illite clay in the soil, the more soluble and exchangeable forms of K will be fixed by the illite.
Temperature
Alternate freezing and thawing have been found to release a fraction of fixed K to exchangeable forms in some soils.
Wetting and Drying
In situations of low to medium K content in some soils, drying of the soils can increase the amount of exchangeable K that can be extracted. If K levels are high, the opposite may be true.
Soil pH
Lime applications can sometimes increase K fixation. This can be more beneficial than detrimental. Liming increases the base saturation of the soil, therefore decreasing the loss of exchangeable K to leaching. But as calcium saturation increases so does the adsorption of K by the clay, reducing the K concentration in the soil solution.

Alexis Hobbs, M.S., Soil Health Coordinator Raymond C. Ward, Ph.D., Certified Professional Soil Scientist
Soil Testing › 90
Figure 12: A Summary of Potassium Gains and Losses
ADDITIONAL REFERENCES:
» Brady, N.C. 2008. The Nature and Property of Soils. 8th edition. Macmillan Publishing Co., Inc., New York.
» Tisdale, S. L. and Nelson, W.L. 1966. Soil Fertility and Fertilizers. 2nd edition. Macmillan Publishing Co., Inc., New York.
Soil Sulfur
Sulfur (S) is a constituent of the amino acids’ methionine and cystine, plus the vitamins, biotin and thiamine. It is essential for plant and animal growth.
The three major sources of sulfur are:
1. soil minerals 2. atmospheric gases 3. organically bound S (the largest fraction of soil sulfur)
Other sources include precipitation and irrigation water. The ratio of carbon:nitrogen:sulfur in the soil is about 100:10:1.4.
Four forms of S are present in soil and fertilizer:
1. elemental S, 2. sulfide (S-2) 3. sulfate (SO4-2) 4. organic compounds.

Alexis Hobbs, M.S., Soil Health Coordinator Raymond C. Ward, Ph.D., Certified Professional Soil Scientist
Soil Testing › 91
Figure 13: The Sulfur Cycle
Mineralization and Immobilization
Organic matter is the major source of soil sulfur. Organic forms of S must be mineralized from organic matter by soil microbes in order for the S to be in the plant-available form, SO4-2. Mineralization of SO4-2 is dependent on the same environmental factors as nitrogen mineralization and may proceed at rates of 0-2% per year. This can also be expressed as 0-2 pounds of SO4-S per acre furrow slice for every 1% organic matter. No-till systems have decreased S mineralization. As carbon/organic matter are increased so is N and S. Sulfur deficiency is more pronounced in no-till systems.
Sulfate is an anion and is therefore weakly bound to soil exchange sites and is easily leached beyond the root zone, especially in sandy soils.
Immobilization occurs when organic materials such as crop residue are added to soils low in inorganic S. The mechanism of tie up is much the same as for nitrogen. C:S ratios in excess of 300:1 can lead to immobilization. As microbial activity declines there is potential for inorganic S to appear again in the soil solution.
Oxidation and Reduction
The oxidation, or conversion of S to sulfate, in the soil is accomplished through five species of bacteria of the genus Thiobacillus. Since the tolerance of environmental factors varies widely for these species, the conversion to sulfate can occur over a wide range of soil conditions. The optimum soil temperature range is from 65° to 90°F. Oxidation can occur in the pH range of 2 to 9.

Alexis Hobbs, M.S., Soil Health Coordinator Raymond C. Ward, Ph.D., Certified Professional Soil Scientist
Soil Testing › 92
In waterlogged soils, sulfates become unstable and are reduced or converted to sulfides by bacteria. The sulfate is changed to volatile forms such as dimethyl sulfide or dimethyl disulfide and is lost to the atmosphere. Another reduced form, dihydrogen sulfide, is detected as a "rotten egg" smell.
Sulfur deficiencies most likely occur in sandy soils due to fewer exchange sites and lower organic matter content. Residue management systems have reduced the available sulfate level so all soils in no-till or reduce till systems require sulfate depending on soil test level.
ADDITIONAL REFERENCES:
» Brady, N.C. 2008. The Nature and Property of Soils. 8th edition. Macmillan Publishing Co., Inc., New York.
Soil Zinc
The earth's crust contains an average of 80 ppm of zinc (Zn), ranging from 10 to 300 ppm. Generally, zinc is evenly distributed throughout the soil root zone below the top soil and will likely be low in areas where topsoil has been removed mechanically or by erosion.
Factors Affecting Zinc Availability
Plant availability of Zn is influenced by soil pH, phosphorus level, organic matter, and adsorption to clay.
Soil pH
Zn is generally more plant-available in acid than alkaline soils. In fact, Zn activity has been found to decrease 10-fold for each unit increase in pH. The more acid soils of the Eastern U.S. generally require less zinc fertilization compared to the more arid soil of the Midwest.
Soil P Level
Many researchers have reported highly-available P-induced Zn deficiencies. This phenomenon was thought to be due to precipitation of zinc phosphate. However, more recent data suggests that P - induced zinc deficiencies occur only when zinc itself is deficient in the soil. In situations of high Zn concentrations in the soil, high P availability does not affect Zn availability.
Soil Organic Matter
Soils with high organic matter content have been found to keep Zn highly available. Mineralization of Zn from organic matter occurs; but, as with nitrogen, immobilization can also happen.
Adsorption to Clay Minerals
Zn is bound to clay minerals by isomorphous substitution (replacing one atom with another of similar size in a crystal lattice) and is held on exchange sites. Clays of 1:1 structure fix less Zn than clays of 2:1 structure. The higher the soil CEC, the more Zn is adsorbed. In general, the grassland soils of the Great Plains are naturally low in available Zn.
Additional Causes of Deficiencies
1. Restricted root zones caused by soil compaction 2. Cool, wet soil causes less root development and less mineralization 3. Lack of mycorrhizal fungi

Alexis Hobbs, M.S., Soil Health Coordinator Raymond C. Ward, Ph.D., Certified Professional Soil Scientist
Soil Testing › 93
Collecting Representative Soil Samples
The fact that a soil test is no better than the sample it was taken from cannot be over-emphasized. Soil fertility variation is an inherent soil property present in every farm field.
Table 4-4 is an illustration of variation across a field. Although the data is from North Dakota, the principle is the same for all soils. Note the range of soil test values especially for sites 3 and 4. With grid sampling we see this type of variation in most fields.
Table 58: Range and Average Soil Test Values from Four Sites in a North Dakota Field
Site 1 Site 2 Site 3 Site 4
Range Avg Range Avg Range Avg Range Avg
NO3-N 21 – 84 39 31 – 208 90 12 – 46 23 14 – 225 62
P 5 – 20 12 7 – 39 17 2 – 46 14 7 – 110 27
K 240 – 540 423 360 – 540 509 130 – 970 365 405 – 690 521
Data from Kansas State University showed that soil phosphorus varied by as much as 40% within a distance of one foot. Although these may be extreme cases, it shows that variation can be a problem even when the land has been uniformly treated over a number of years.
There are several guidelines to follow when collecting soil samples which reduce the variation problem and create a sample that more accurately reflects the fertility levels of the area from which it was taken.
Proper Sampling Equipment
Soil probes, soil augers, and spades can all be used for sampling. If using a spade, care should be taken that a uniform slice of soil is taken at each site. A clean plastic pail is recommended for use while collecting the soil samples. Never use a galvanized metal pail or any container that may be contaminated with fertilizer, manure, etc. Finally, the soil should be submitted to the lab in a clean cloth or plastic lined paper bag and sent as quickly as possible. If the soil sample cannot be sent immediately, spread out the soil on clean paper to air dry. This reduces the chances of appreciable amounts of organic nitrogen mineralization by microorganisms during the time between sample collection and drying at the lab.
Depth of Sampling
A surface sample of 0-8 inches should be collected for N-P-K and micronutrient analysis. Subsoil samples from 8-36 inches (8-24 inches minimum) should be collected for testing for residual nitrate-nitrogen.
Divide Field into Sampling Units
A single soil sample should represent no more than 40 acres. In fields that have numerous slopes, divide the field by topography. Represent side-slopes with one sample, low areas with another, hilltops with another and so on. Do not mix cores from low areas and side-slopes together; that does not give you much information. Areas of a field that have had different crops, fertilization or liming should also be sampled separately. Changes in soil color, drainage, and texture should also be sampled separately. Avoid dead furrows, old feedlots, old farm sites, terrace channels, alkali spots, or any small area in a field that is drastically different; that only serves to contaminate an otherwise good sample. Sample odd areas separately.

Alexis Hobbs, M.S., Soil Health Coordinator Raymond C. Ward, Ph.D., Certified Professional Soil Scientist
Soil Testing › 94
Number of Cores in a Composite Sample
Within a sampling area, take at least 15 cores at random. Be sure to keep top and subsoil cores separated in their respective pails. After collecting the cores, thoroughly mix and put about one pound of soil into a clean bag for each depth.
Labeling of Soil Samples
Clearly label each bag and be sure the sample identification matches that on the soil information submittal sheet that you submit along with the sample or samples. Soil sample submittal sheets can be found at www.wardlab.com/sample-submittal.php
Grid Sampling
Grid sampling is important for assessing soil nutrient variability. Each sample for a grid point should be a composite of at least 8 subsamples. It is suggested that two subsamples be taken from the left and right sides and from the front and back of the sampling vehicle. Mix the subsamples before placing in the sample bag.
Soil Test Calibration
Soil tests are used to predict the amount of plant nutrient needed to supply crops with 100% of their nutrient requirements. Some soils are very low in certain plant nutrients and consequently require high rates of fertilizers to supply crop needs. On the other hand, other nutrients are found in very high levels and no additional nutrient is required.
Definition
A soil test is a chemical means of estimating the nutrient supplying power of a soil. The test must be calibrated before it can be properly interpreted. Soil tests are calibrated by establishing fertilizer rate experiments on different soils to determine the best fertilizer rate at a given soil test level. Once a number of fertilizer experiments have been conducted, the data can be summarized, and fertilizer recommendation guides developed for each soil test level. Field research is necessary before soil test values can be used to suggest fertilizer rates. Land Grant University Agricultural Experiment Stations provide this information.
Chemical Analysis
The chemical method used to measure the available soil nutrient level is important to the extent that the method must be accurate. The extraction method must show measured increases in nutrient level as the indicated field crop response decreases.
In designing chemical methods, the question of measuring “fixed” or “reserved” chemical forms is frequently raised. For example, no fieldwork has ever shown that different levels of “fixed” K influence the yield of agronomic crops. In general, fixed forms are not available forms and should not be included in the forms extracted by a soil test method.
Correlation and Interpretation
All soil test values must be correlated with crop growth from fields of known response. The experimental site must have only the fertilizer nutrient as a variable. Variables such as plant population, planting pattern, tillage practices, variety, planting date, soil, and rainfall/irrigation are identical in time and quality. For example, when a P experiment is carried out on a P responding soil, and one plot is fully fertilized while another has everything except P, a difference in rate of growth is established that can be measured as the final yield per acre.
Alexis Hobbs, M.S., Soil Health Coordinator Raymond C. Ward, Ph.D., Certified Professional Soil Scientist
Soil Testing › 95
Fertilizer and Recommendations
The soil test indicates the nutrient level in the soil. It says nothing about the yield potential of the soil, the season, the management practices, or the amount of fertilizer needed. The accuracy of the test interpretation is based on the kind and quality of field research. Most soil testing correlation research is conducted by Agricultural Experiment Stations at the Land Grant Universities.
To determine the level of fertilization, economic considerations are important, especially the value of the expected crop increase in relation to the cost of the fertilizer. To make an economic judgment, it is necessary to estimate the yield response and its value. This is difficult to do, but the best suggestion is to use average yield responses and prices. Therefore, the final fertilizer recommendation depends on accurate soil test collection, analysis, and interpretation of the test results based on sound research and judgment.
Expression of Yield Responses
Concept of the Nature of Yield Response
1. LIEBIG'S LAW OF THE MINIMUM
Justus von Liebig proposed the “Law of the Minimum” in 1862. This law may be stated as "the yield of a plant depends on that nutrient that is found in relatively the smallest quantity in the soil, that is the minimum". When that nutrient is supplied in ample amounts, the nutrient in the next smallest relative supply becomes the limiting factor.
Based on this law, if in a particular soil, nitrogen is sufficient for 150 bu/acre, phosphorus is sufficient for 160 bu/acre, and potassium is sufficient for 170 bu/acre, the yield will be 150 bu/acre and nitrogen will be the limiting factor. If nitrogen were added to a level that is sufficient for 170 bu/acre, then phosphorus becomes the limiting factor.
2. MITSCHERLICH'S LAW OF DIMINISHING RETURNS
In 1909 a German soil scientist, E. A. Mitscherlich, developed an equation that related growth to the supply of growth factors. This concept is based on this differential equation:
𝒅𝒚
𝒅𝒙= 𝒄 (𝑨 − 𝒚)
This equation states that the increase in yield due to an increment of fertilizer is directly proportional to the difference between y, the actual yield, and A, the yield possibility. Factor quality x is the rate of fertilizer and c is a proportionality constant that depends on the nature of x. The increment of change is represented by the letter d. In theory, the greatest increase in yield (y) is from the first increment of fertilizer (x); the amount of yield increase becomes progressively smaller with each additional increment of fertilizer (x), about one - half the response from the previous increment
Mitscherlich proposed that the parameter c was constant over a wide range of conditions. Several scientists pointed out that not all sets of data had the same c value that Mitscherlich proposed. Consider two different situations in which A exists as two different yield possibilities, which may be due to weather, variety, or fertility differences. Assume the same amount of fertilizer is added in each situation. If c has the same value in both cases, then the above equation leads to:
𝒚𝟏
𝑨𝟏 = 𝒚𝟐
𝑨𝟐

Alexis Hobbs, M.S., Soil Health Coordinator Raymond C. Ward, Ph.D., Certified Professional Soil Scientist
Soil Testing › 96
This shows that different yields can be expected from the same amount of fertilizer if the yield possibilities are different. Also, a certain amount of fertilizer is sufficient for a given percentage of the yield possibility no matter what that yield possibility is. Therefore, the constant value of c has led to the "percentage sufficiency concept". This is the percent of the possible yield that is given by the nutrient if none is supplied. Another scientist, Baule, extended this concept further to say that if two nutrients were lacking the expected yield of the crop could be obtained by multiplying the percent sufficiencies for the two deficient nutrients together and multiplying their product by the yield possibility.
Example: Suppose: Yield is 80 bushel/acre if no P applied and K is adequate.
Yield is 90 bushel/acre if no K applied and P is adequate A (yield possibility) = 100 bushels/acre if both applied Percent sufficiency of P would be 80/100 = 80% Percent sufficiency of K would be 90/100 = 90% Yield = 0.80 x 0.90 x 100 = 72 bushels/acre if nothing is applied.
This can be extended to more than two nutrients by continued multiplication of percentage sufficiencies.
Comparison of the Two Concepts
Assume a given situation where nitrogen is sufficient for 70 bu/acre while phosphorus is sufficient for 90 bu/acre and the yield possibility is 100 bu/acre. According to Liebig's Law, the yield would be 70 bu/acre while the Mitscherlich-Baule formula would show 63 bu/acre. Which is correct?
Given two mobile nutrients, nitrogen and sulfur, both potentially deficient for a particular yield possibility, neither will appear to be deficient until one is nearly gone. Therefore, the actual yield is related to the supply of the nutrient rather than the yield possibility. In other words, the amount of nutrient needed in the soil to obtain a yield possibility will be different in conditions where yield possibilities are different. The percentage sufficiency concept does not apply in this case. Generally, it can be stated that Liebig's Law applies to mobile nutrients, while the Mitscherlich concept applies to immobile nutrients.
Consider immobile nutrients such as phosphorus or zinc. The amount available to the plant is dependent on root extension. Since root extension is proportional to top growth, the amount of nutrient available is closely related to plant yield. Also, since root extension may be affected by deficiencies of other nutrients, multiplying the percentage sufficiencies for the deficient nutrients is logical for immobile nutrients. Therefore, the Mitscherlich-Baule concept applies to immobile nutrients.
Bray further expanded this concept to incorporate soil test values for the nutrient into the equation. His work indicated that c is not a constant over a range of fertilizer applications but increases with the rate of application. The point of diminishing returns is much different when c is not held constant.
Soil Test Methods: Nitrate
Nitrate is the end product of the nitrogen cycle. Organic matter, crop residue, manure, anhydrous ammonia, urea, and ammonia salts are all converted eventually to nitrate. Plants can and do absorb ammonium ions but the majority of the total nitrogen is obtained from nitrate ions.
Nitrate is also unique in the nitrogen cycle because it is soluble and can be moved through and away from the root zone by percolating water. However, if it does not move out of the root zone, it remains available for plant uptake.

Alexis Hobbs, M.S., Soil Health Coordinator Raymond C. Ward, Ph.D., Certified Professional Soil Scientist
Soil Testing › 97
The nitrate soil test measures the amount of nitrate left in the soil and available for the next crop. Nitrate is water-soluble and can be easily extracted from the soil. To make a nitrogen recommendation, one must calculate a nitrogen requirement and then subtract the nitrate measured by the soil test. This gives the best estimate of the amount of nitrogen to apply.
Most labs report nitrate as ppm N. To calculate pounds of N per acre, multiply the ppm nitrate reading by 0.3 and by sample depth in inches to calculate pounds of N per acre. If the soil sample were 6 2/3 inches deep, the ppm would be multiplied by 2; if 12 inches deep, ppm would be multiplied by 3.6 (12 X 0.3) to arrive at pounds of nitrate-nitrogen per acre.
Nitrate-nitrogen is extracted from soil by water saturated with a calcium solution. Nitrate is very soluble so it can be extracted with water. Calcium is added to flocculate soil clays, so a clear filtrate can be obtained. Nitrate is analyzed in the filtrate by the cadmium reduction procedure with a flow injection analyzer (FIA). Nitrate is quantitatively reduced to nitrite when passed through a copperized cadmium column. The nitrate is then determined by diazotizing with sulfanilamide followed by coupling with N-(1-naphthyl) ethylenediamine dihydrochloride. The resulting water soluble dye has a magenta color which is read at 520 nm wavelength.
Many correlation studies have concluded that the nitrate soil test estimates nitrate carryover very well. Most researchers have found that a stronger correlation is obtained when a deep soil sample (from 8 to 36 inches) is included for nitrate analysis. The correlations have improved when nitrogen response is related to growing conditions that influence final yield. In other words, a realistic yield goal must be established to make the best use of the nitrate test.
Deep soil nitrate samples should also be taken where crop quality is very important. Sugar beets, malting barley, potatoes and cotton are examples. Excess N can lower quality and profits on the crops.
There are a few shortcomings of the nitrate test that should be mentioned:
1. The nitrate test does not measure N released by a previous legume crop. An adjustment must be made by the grower or crop consultant.
2. It does not measure ammonium-N from recent anhydrous ammonia application. It takes 2-3 weeks for most of the anhydrous ammonia to convert to nitrate in warm soil and considerably longer in cool soils.
3. Nitrogen available from manure will not be shown by the nitrate test until the manure has had a chance to mineralize in the field.
Soil Test Methods: Phosphorus
The phosphorus soil test estimates a relative amount of available phosphorus for the crops. The actual amount cannot be measured because of phosphorus reactions with soil particles. Phosphorus is an immobile nutrient, which means it is held on soil particles and does not move with soil water. It moves by diffusion. As the plant root penetrates the soil, phosphorus is absorbed by the root hairs from soil solution and then phosphorus ions move from the soil particles to soil solution. An estimate of phosphorus availability is used to make phosphate fertilizer recommendations since roots only penetrate a small portion of the total soil volume.

Alexis Hobbs, M.S., Soil Health Coordinator Raymond C. Ward, Ph.D., Certified Professional Soil Scientist
Soil Testing › 98
In our laboratory, phosphorus is extracted by the Mehlich P-3 test. This extracting solution is 0.013 N HNO3 and 0.015 N NH4F. The HNO3 adds acid to the soil to increase the solubility of calcium, aluminum and iron phosphates. A dilute acid is used to avoid dissolving very insoluble phosphate compounds. Fluoride ions precipitate soluble calcium allowing extraction of more soluble calcium phosphates (such as dicalcium phosphate). Fluoride also complexes aluminum strongly and frees phosphates bound to aluminum. This method removes the readily soluble portion of each available form of phosphorus (that portion of phosphorus of the most immediate significance to crop growth). The extract also has 0.25 N NH4 NO3 for extracting cations and 0.20 N acetic acid to buffer the extract against excess lime (CaCO3) reaction.
A blue color is developed for the measurement of phosphorus by complexing phosphate with molybdate ions and then adding a reducing agent. The reducing agent we use is ascorbic acid with potassium antimony tartrate. The color intensity is measured at a wavelength of 882 nm.
The Mehlich P-3 test does work in high excess-lime soils because of the 0.20 N acetic acid. The acetic acid keeps the extracting solution mildly acidic so the more readily available forms of phosphorus can be measured.
The availability is related to percent sufficiency or the percentage of phosphorus supplied by the soil. For a soil test with 80% sufficiency, the soil will supply 80% of the phosphorus the plant requires and added fertilizer will be needed to supply the rest. If no phosphate is added, the yield will be 80% of its yield possibility.
The percent sufficiency values are determined by a large number of field experiments that involve the measurement of response to fertilizer at various soil test levels. A soil test lab must utilize the correlation of research work conducted by the Land Grant Universities.
Ward Laboratories also analyzes P by the Olsen HCO3-P test. This test works well for soils containing free lime. The bicarbonate ion (HCO3) exchanges with the phosphate ion, and the sodium suppresses calcium activity, so phosphate stays in solution for analysis. The Olsen P test reads lower than the Mehlich P-3 test, usually by 62%.
Table 59: Phosphorus Sufficiency Levels for Mehlich P-3, Bray P-1, and Olsen P Soil Tests
Mehlich P-3 / Bray P-1, (ppm P) Olsen P, (ppm P) Rating %Sufficiency
0 – 5 0 – 3 very low 25 – 60
6 – 12 4 – 8 low 45 – 80
13 – 25 9 – 16 medium 70 – 95
26 – 50 17 – 31 high 90 –100
50 + 31 + very high 100
Sufficiency levels shown are established for the Corn Belt Western area and are based on research correlation work at these Universities.
Phosphate fertilizer applications should always be made on soils testing very low and low in phosphorus. In the medium range (13-25 ppm P) the application may be eliminated one year without significant yield loss. This is especially true when the Mehlich P-3 phosphorus soil test is above 20 ppm P. However, the producer should not skip two crops in a row. In the high (26-50 ppm P) range, only enough phosphate fertilizer is needed to maintain the soil P test level.

Alexis Hobbs, M.S., Soil Health Coordinator Raymond C. Ward, Ph.D., Certified Professional Soil Scientist
Soil Testing › 99
Farmers are often concerned about phosphate fertilizer efficiency. The fact is that most phosphate fertilizers sold in the Corn Belt have the same chemistry and availability. Any claim that one phosphate may be more available than another phosphate fertilizer is simply not true. Phosphate placed in moist soil where roots are growing is the most available.
Soil Test Methods: Potassium
Potassium is found in water-soluble and exchangeable forms. The nonexchangeable potassium may be found to be unavailable, slowly available, or readily available. The exchangeable and readily available nonexchangeable forms of potassium are important considerations for the interpretation of the potassium soil test.
Exchangeable potassium is potassium held on the surface of negatively charged clay and organic particles. The readily available nonexchangeable potassium is derived from primary minerals: K feldspars and micas; and from secondary clay minerals: illite and vermiculite.
The negative charge on the clays and organic matter is reported sometimes on the soil test report as cation exchange capacity. A higher CEC indicates more clay and/or organic matter in the soil, thus more positions for holding K and the other cations: calcium, magnesium and sodium. Often the lowest potassium soil tests are found in sandy soils and the highest tests are found in the clay or organic matter soils in a given locality.
One reason that the K soil test changes slowly is the source of nonexchangeable potassium. Research in Nebraska has shown that crops utilize large quantities of nonexchangeable potassium.
Research reports have shown good relationships between crop response to K fertilizer and the exchangeable K test. However, soils are different from region to region, and the exact nature of the response must be determined for each crop and on each soil if reliable fertilizer recommendations are to be developed. Soil differences must include organic matter content, clay content, type of clay, and kinds of soil minerals. It should be obvious that potassium fertilizer recommendations have to be developed for each particular region.
Soil particles less than 20 microns in diameter have the active cation exchange sites. This includes colloidal organic matter, a portion of the silt, and the entire clay fraction. Cation exchange capacity of organic matter varies from 50 to 250 meq/100 g. Cation exchange capacity of 2:1 type chemical structure is about 100 meq/100 g. Therefore, sandy soils will usually have a CEC between 2 and 6; silt loams 15-25; and clays 18 - 30 meq/100 g. Since the potassium is held on CEC, it is an immobile nutrient like phosphorus.
The actual amount of K availability has to be calibrated by research field plots. The percent sufficiency in several soil test categories is as follows:
Table 60: Percent Sufficiency of Soil K Tests
Soil K Test, ppm K Soil Fertility Rating % Sufficiency
0 – 40 very low 20 – 50
41 – 80 low 45 – 80
81 – 120 medium 70 – 95
121 – 160 high 90 – 100
161 + very high 100

Alexis Hobbs, M.S., Soil Health Coordinator Raymond C. Ward, Ph.D., Certified Professional Soil Scientist
Soil Testing › 100
Potassium is extracted from the soil with 1 N ammonium acetate. The ammonium ions in the extracting solution exchange with potassium on the exchange sites of clays and organic matter. There is a large excess of ammonium ions in the solution that replaces potassium and the other cations. The soil and extracting solution are mixed vigorously on a shaker for 5 minutes. The soil is separated from the liquid by filter paper. The filtrate is analyzed by inductively coupled argon plasma spectrophotometer (ICAP).
Soil Test Methods: Sulfur
Sulfur availability is more difficult to interpret than most essential elements because one must consider soil sulfur, sulfur in irrigation water, atmospheric sulfur, and sulfur in fertilizers. Any one of these sources may supply the total requirement of a crop.
The sulfur requirement is about 1/7 of the nitrogen (N) requirement. Generally, forage and row crops will remove 15 to 35 lbs of S per acre and cereal grains about 15 lbs of S per acre.
Most of the sulfur in surface soils is found in the organic form. During microbial organic matter decomposition, sulfate is released for plant uptake. The release of sulfate is similar to nitrate.
There are various sulfur compounds present in the atmosphere that are returned to the soil. Annual additions range from 1.0 to 10+ lbs. per acre annually. Therefore, sulfur responses are less around industrialized areas.
The sulfate contained in irrigation water may not be adequate to meet crop needs. When irrigation water contains more than 20 ppm SO4-S, sulfur fertilizer response is not likely. An exception to this guideline occurs on very sandy soils. Although enough sulfur could be supplied later in the irrigation season, some sulfur fertilizer may be needed to keep the crop green and growing early in the season.
There are numerous methods proposed for evaluating the sulfur status of soils. Extractants that remove soluble sulfate plus a portion of the soil-adsorbed sulfate predicts available sulfate better than other extractants. We have chosen a calcium phosphate (500 ppm P) extractant. The phosphate anion displaces the adsorbed sulfate ions and the calcium ions depress the extraction of organic matter. This extractant performs well in acid soils and also in calcareous soils as found in the Great Plains region. The soil extractant is shaken vigorously for 30 minutes to allow the phosphate time to displace adsorbed sulfate.
The sulfate concentration in the filtrate is determined by developing a barium sulfate turbidity, which is determined by flow injection analysis (FIA). The final result is reported as ppm SO4-S.
Sulfate is a mobile nutrient. Therefore, the quantity measured is an exact amount instead of a percent sufficiency. One may calculate the pounds of sulfate by multiplying the ppm reading by 0.3 and by soil depth of 8 inches. This amount of sulfate is subtracted from the sulfur requirement of the crop and desired yield. The final sulfur recommendation must evaluate the organic matter level, irrigation water sulfur concentration, soil texture and atmospheric sulfur contribution.
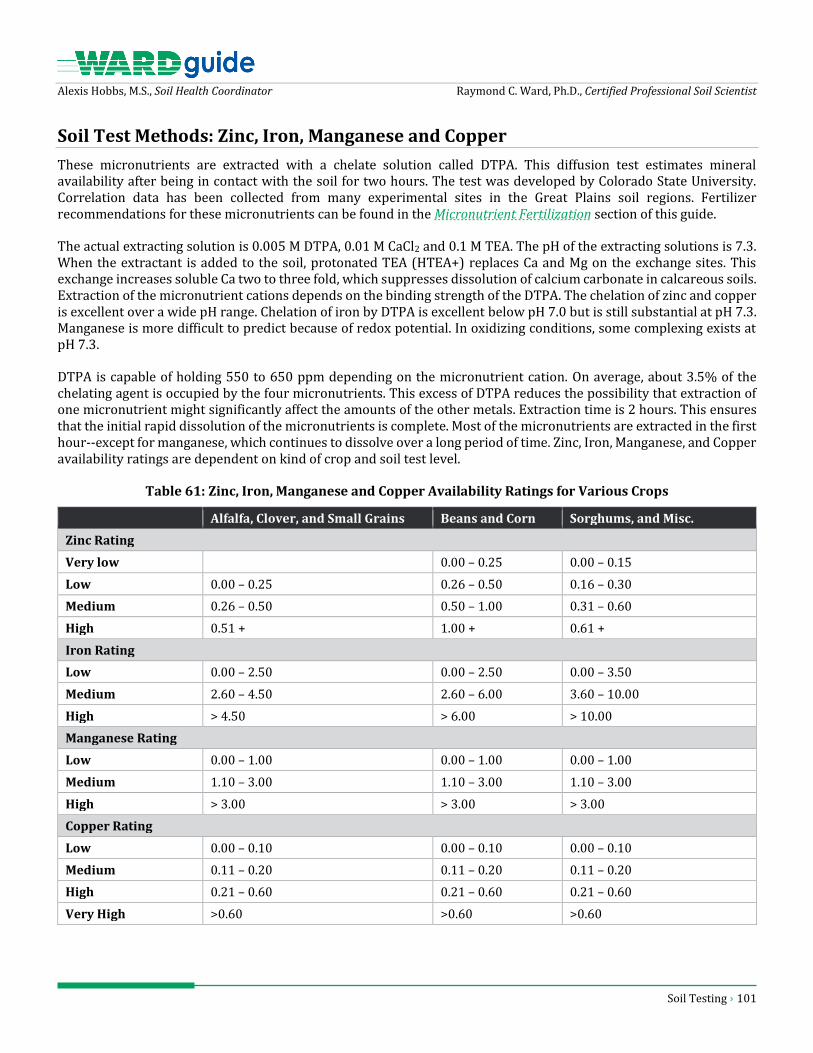
Alexis Hobbs, M.S., Soil Health Coordinator Raymond C. Ward, Ph.D., Certified Professional Soil Scientist
Soil Testing › 101
Soil Test Methods: Zinc, Iron, Manganese and Copper
These micronutrients are extracted with a chelate solution called DTPA. This diffusion test estimates mineral availability after being in contact with the soil for two hours. The test was developed by Colorado State University. Correlation data has been collected from many experimental sites in the Great Plains soil regions. Fertilizer recommendations for these micronutrients can be found in the Micronutrient Fertilization section of this guide.
The actual extracting solution is 0.005 M DTPA, 0.01 M CaCl2 and 0.1 M TEA. The pH of the extracting solutions is 7.3. When the extractant is added to the soil, protonated TEA (HTEA+) replaces Ca and Mg on the exchange sites. This exchange increases soluble Ca two to three fold, which suppresses dissolution of calcium carbonate in calcareous soils. Extraction of the micronutrient cations depends on the binding strength of the DTPA. The chelation of zinc and copper is excellent over a wide pH range. Chelation of iron by DTPA is excellent below pH 7.0 but is still substantial at pH 7.3. Manganese is more difficult to predict because of redox potential. In oxidizing conditions, some complexing exists at pH 7.3.
DTPA is capable of holding 550 to 650 ppm depending on the micronutrient cation. On average, about 3.5% of the chelating agent is occupied by the four micronutrients. This excess of DTPA reduces the possibility that extraction of one micronutrient might significantly affect the amounts of the other metals. Extraction time is 2 hours. This ensures that the initial rapid dissolution of the micronutrients is complete. Most of the micronutrients are extracted in the first hour--except for manganese, which continues to dissolve over a long period of time. Zinc, Iron, Manganese, and Copper availability ratings are dependent on kind of crop and soil test level.
Table 61: Zinc, Iron, Manganese and Copper Availability Ratings for Various Crops
Alfalfa, Clover, and Small Grains Beans and Corn Sorghums, and Misc.
Zinc Rating
Very low 0.00 – 0.25 0.00 – 0.15
Low 0.00 – 0.25 0.26 – 0.50 0.16 – 0.30
Medium 0.26 – 0.50 0.50 – 1.00 0.31 – 0.60
High 0.51 + 1.00 + 0.61 +
Iron Rating
Low 0.00 – 2.50 0.00 – 2.50 0.00 – 3.50
Medium 2.60 – 4.50 2.60 – 6.00 3.60 – 10.00
High > 4.50 > 6.00 > 10.00
Manganese Rating
Low 0.00 – 1.00 0.00 – 1.00 0.00 – 1.00
Medium 1.10 – 3.00 1.10 – 3.00 1.10 – 3.00
High > 3.00 > 3.00 > 3.00
Copper Rating
Low 0.00 – 0.10 0.00 – 0.10 0.00 – 0.10
Medium 0.11 – 0.20 0.11 – 0.20 0.11 – 0.20
High 0.21 – 0.60 0.21 – 0.60 0.21 – 0.60
Very High >0.60 >0.60 >0.60

Alexis Hobbs, M.S., Soil Health Coordinator Raymond C. Ward, Ph.D., Certified Professional Soil Scientist
Soil Testing › 102
Soil Test Methods: Calcium and Magnesium
Much of the calcium in soils is found as exchangeable calcium. The level in the soil can range from 250 to over 5,000 ppm Ca with no apparent evidence of a deficiency or excess in plants. The need for calcium as a nutrient is directly associated with soil pH. A strongly acidic soil will have enough aluminum and manganese present to reduce plant growth. The addition of carbonate as lime (CaCO3) increases soil pH, which eliminates aluminum and manganese toxicity and improves plant growth. For further information on liming recommendation and magnesium fertilizer recommendations, see the Lime Fertilization and Magnesium Fertilization section of this guide.
Magnesium content in the soil is similar to the potassium levels. Exchangeable magnesium levels are similar to exchangeable potassium levels in the Western Corn Belt and higher in the Eastern Corn Belt. Some of the total soil magnesium is found in non-exchangeable form. Therefore, the exchangeable magnesium level changes slowly with time because of the equilibrium with non-exchangeable forms.
Research has found that magnesium availability is related to the exchangeable magnesium level. Exchangeable magnesium and calcium are extracted from the soil by extracting the soil with ammonium acetate. The ammonium ions displace the calcium and magnesium on the exchange complex. Our laboratory uses ammonium acetate solution as the source of ammonium to displace the calcium and magnesium. The extracting solution is vigorously shaken with the soil for 5 minutes. After the samples are filtered, the filtrate is analyzed for calcium and magnesium by inductively coupled argon plasma (ICAP).
The 1 N ammonium acetate solution dissolves some of the limestone (CaCO3) in calcareous soils. Therefore, in alkaline soils, the calcium and magnesium soil test readings include both exchangeable and small portions of more soluble calcium and magnesium minerals.
The interpretation of the calcium test generally should be based on the soil pH value. Some agencies and laboratories have stressed a Ca/Mg ratio as being used for proper interpretation. However, a review of the literature indicates that the ratio is not much of an issue unless the Mg test exceeds the Ca test on an equivalent basis (meq/100g).
Magnesium interpretation is based on the exchangeable Mg level. Many studies in the United State have shown that Mg response may occur when the exchangeable level is less than 50 ppm. A study in Indiana compared Ca/Mg ratios ranging from 1:1 to 49:1 without affecting crop yield as long as the Mg test remained above 50 ppm.
Table 62: Interpreting Mg Soil Test Levels
Mg Soil Test, ppm Rating Comments
0 – 25 Low Magnesium deficiency symptoms may be general in most field crops, vegetables and fruits. Magnesium fertilization is advised.
26 – 50 Medium Magnesium deficiencies are expected in sugar beets, potatoes and fruit crops. Magnesium fertilization is advised for these crops especially. Cereal crops would not be expected to respond consistently.
51 – 100 High Magnesium deficiency is not expected in field or vegetable crops. Magnesium fertilization is suggested for fruit crops.
101 + Very High No magnesium deficiencies are expected.
A Mg soil test in the 0 – 100 ppm range may indicate a problem with grass tetany in cattle grazing forages grown on these soils.

Alexis Hobbs, M.S., Soil Health Coordinator Raymond C. Ward, Ph.D., Certified Professional Soil Scientist
Soil Testing › 103
The interpretation of the exchangeable calcium test is dependent on soil pH. If calcium is relatively low one must refer to soil pH to determine if lime is needed.
Legumes should be limed when pH is below 6.1, row crops when pH is below 5.7, and small grains and grasses when pH is below 5.4. These are suggested guidelines for the Western Corn Belt and may change in areas where subsoils contain large amounts of acidity.
Salt Affected Soil
Salt-affected soils are more common in arid and semi-arid regions than in humid areas. Salt-affected soil is adversely changed by the presence of soluble salts. Saline soils contain enough soluble salt to limit plant growth while sodic soils contain excessive exchangeable sodium that destroys soil structure. Saline-sodic soil is excessive in both soluble salts and exchangeable sodium and thereby interferes with normal crop growth.
Origin of Salt in Soils
The formation of salt-affected soils is a continuous geochemical process, due mainly to the weathering of primary soil minerals. Rainfall is generally great enough to transport salts out of the weathering zone as they are formed. Products of weathering may remain in the root zone because of less rainfall, high evaporation, very slow permeability, or high water table. Since salt moves with water, saline soils are generally found in low laying areas where water accumulates because of poor internal drainage conditions. Subsequent water evaporation allows the salts to accumulate in the soil.
Irrigation Water as a Source of Salt
Man-induced saline soils can be a result of irrigation. All irrigation water contains dissolved ions (salts). These salts can accumulate over time due to evaporation if internal drainage is poor. Therefore, it is important to know the salinity of irrigation water as well as permeability of the soil.
Properties of Salt Affected Soils
The types of salts present indicate the chemical and physical properties of salt-affected soils. The salts present in soil should ideally be determined under field moisture conditions. Since this is rather inconvenient, laboratory procedures have been developed to simulate the soil water under saturated conditions. This is done by adding distilled water to a soil sample until reaching the saturation point, then extracting the moisture from the soil by vacuum filtration. This extract is known as a saturation extract.
The extract is used to classify soils as normal, saline, sodic, or saline-sodic. Salinity is measured by electrical conductivity (EC) and exchangeable sodium is measured by the sodium adsorption ratio (SAR). The SAR is statistically correlated with the exchangeable sodium percentage (ESP). An SAR value of 13 roughly corresponds to an ESP of 15.
EC can be measured because cations have positive charges while anions carry negative charges, thus electrical current can be conducted. This electrical current is calibrated and given as millimhos per centimeter (mmho/cm). As the concentration of ions increase in the soil solution more electrical current is produced to give a greater EC reading.
Sodium, calcium and magnesium are determined in the saturation extract to calculate SAR.
SAR is calculated as follows:
𝑺𝑨𝑹 =𝑵𝒂(𝒎𝒆𝒒/𝑳)
𝑺𝑸𝑹𝑻 (𝑪𝒂(𝒎𝒆𝒒/𝑳) +𝑴𝒈(𝒎𝒆𝒒/𝑳))/𝟐
The limits for various classes of salt-affected soils are given in Table 4-9.

Alexis Hobbs, M.S., Soil Health Coordinator Raymond C. Ward, Ph.D., Certified Professional Soil Scientist
Soil Testing › 104
Table 63: Classification of Salt Affected Soils Based on Saturation Extracts
Criteria Normal Saline Sodic Saline-Sodic
EC (mmho/cm) < 4 > 4 < 4 > 4
SAR < 13 < 13 > 13 > 13
ESP (%) < 15 < 15 > 15 > 15
Soluble salt tests reported by soil testing laboratories are usually reported from a 1:1 soil:water suspension. For interpretation from a soil test report, please refer to Table 4-10.
Note that the 1:1 method involves the texture of the soil for proper interpretation.
Table 64: The Relationship Between Conductivity and Degree of Salinity
DEGREE OF SALINITY (1:1 Soluble Salt Measurement)
Texture Non–Saline Low Saline Moderate Saline Strong Saline Very Saline
--------------------------------------------- mmho/cm ---------------------------------------------
Coarse sand to loamy sand 0 – 1.1 1.2 – 2.4 2.5 – 4.4 4.5 – 8.9 9.0 +
Loamy fine sand to loam 0 – 1.2 1.3 – 2.4 2.5 – 4.7 4.8 – 9.4 9.5 +
Silt loam to clay loam 0 – 1.3 1.4 – 2.5 2.6 – 5.0 5.1 – 10.0 10.1 +
Silty clay loam to clay 0 – 1.4 1.5 – 2.8 2.9 – 5.7 5.8 – 11.4 11.5 +
A soil test report will show % Na of base saturation if exchangeable cations are measured in the soil. The interpretation for a sodic soil from a soil test report is an estimate of the sodium from a saturation extract as shown in Table 4-9.
General Features of Saline Soils
» May have the presence of white crust
» Soil pH is less than 8.5
» Principle cations are Ca and Mg with lesser amounts of Na
» Presence of gypsum and possibly lime
» Soil remains in flocculated condition
General Features of a Sodic Soil
» Soil is low in salinity
» High amounts of exchangeable Na
» Soil pH may be as high as 10 due to the formation of Na2CO3
» Some Ca, Mg and K present
» Principle anion is HCO3 with lesser amounts of Cl and SO4
» Soils become physically dispersed, or deflocculated, reducing entry of air and water into the soil; excessive sodium promotes the dispersion and swelling of clay minerals, restricting water movement; the soil is extremely hard when dry.
» Sodium toxicity

Alexis Hobbs, M.S., Soil Health Coordinator Raymond C. Ward, Ph.D., Certified Professional Soil Scientist
Soil Testing › 105
Characteristics of Saline-Sodic Soils
» Possesses same chemical properties of both saline and sodic soils
» Presence of excess salt maintains soil permeability and keeps soil pH below 8.5
» Reclamation requires leaching of salinity and then leaching of exchangeable Na with
» gypsum application before crop growth can be improved
Effects of Salt on Crop Growth
An increase in the salt concentration of a soil will result in water being "pulled" away from plant roots, causing a condition known as "physiological drought". This is when a crop appears to be drought-stressed even though there may be plenty of available water in the soil. The attraction of water to salt is a function of osmotic potential, which is governed by salt concentration. An increase in salt concentration causes osmotic potential to become stronger meaning plants have a more difficult time utilizing soil water. A good example of osmotic potential is when you see moisture gathering around salt pellets. The high attraction for water (negative osmotic potential) by the salt pulls water from the atmosphere, much the same as salt would pull water away from a plant root. Multiply the EC from saturation extract by 0.36 to determine the atmospheres of osmotic potential.
Salt Tolerance of Field, Forage and Vegetable Crops
Tolerance to soil salinity varies among plant species. Therefore, selection of crops is an important decision that can be used to reduce the impact of soil salinity. Crop response to soil salinity is influenced by plant growth stage, variety, irrigation method, soil moisture management, soil fertility, and climate.
Barley, wheat, and corn are most sensitive to salinity during germination and seedling stages and become more tolerant with maturity. Overall, barley is one of the most salt-tolerant field crops available. Hot, dry conditions magnify salinity problems.
Management of Saline and Sodic Soils
The most common methods used to reduce excess salts in soil are tile drainage and leaching. Salts are leached down through the root zone and drained off through the tiles. One must be sure, however, that the water being used in the leaching process has a satisfactory salt level or the effort will be self-defeating. Leaching is most effective in permeable soils that are high in calcium and magnesium. Leaching saline-sodic soils with water low in salt may intensify the sodium problem because calcium and magnesium are removed, allowing sodium saturation to increase and thereby causing formation of a sodic soil. To reclaim a saline - sodic soil, applications of gypsum (CaSO4.2H2O) or elemental sulfur for calcareous soils only may be needed to supply soluble calcium to exchange with sodium so that sodium can be leached as sodium sulfate. Exchangeable calcium allows leaching of the salts, which will improve the soil and make it more satisfactory for crop growth. Elemental sulfur is effective in calcareous soils.
As mentioned, sodium hazards can be reduced by substantial applications of gypsum. Up to several tons per acre may be needed and the gypsum should be incorporated lightly or left on the surface. Sulfur can also be used to reduce sodium hazards if the soil contains excess lime. Upon conversion to sulfuric acid, sulfur changes the lime into soluble calcium sulfate (gypsum). Calcium exchanges with sodium, which reduces sodic properties.
The charts on the following pages illustrate the tolerance of vegetable, field and forage crops have to soil salinity.

Alexis Hobbs, M.S., Soil Health Coordinator Raymond C. Ward, Ph.D., Certified Professional Soil Scientist
Soil Testing › 106
The following formulas help determine the amount of sulfur or gypsum needed to reduce sodium percentages to safe levels:
𝑁𝑎 𝑡𝑜 𝑟𝑒𝑚𝑜𝑣𝑒 𝑓𝑟𝑜𝑚 𝑠𝑜𝑖𝑙 (%) = 𝐸𝑆𝑃 − 5% (% 𝑁𝑎 𝑡𝑜 𝑟𝑒𝑚𝑜𝑣𝑒 / 100)𝑥 𝐶𝐸𝐶 = 𝑚𝑒𝑞 𝑒𝑥𝑐𝑒𝑠𝑠 𝑁𝑎/100𝑔
𝑚𝑒𝑞 𝑁𝑎 𝑥 0.32 = 𝑡𝑜𝑛𝑠 𝑠𝑢𝑙𝑓𝑢𝑟/𝐴 𝑚𝑒𝑞 𝑁𝑎 𝑥 1.7 = 𝑡𝑜𝑛𝑠 𝑔𝑦𝑝𝑠𝑢𝑚/𝐴
Figure 14: Salt Tolerance of Vegetable Crops
EC of Saturated Paste Extract (mmho/cm at 25°C)
*The indicated salt tolerances apply to the period of rapid plant growth and maturation, from the late seedling stage onward. Crops in each category are ranked in order of decreasing salt tolerance. Crosslines are placed at 10, 25, 50 and 100-percent yield reductions.
Figure 15: Salt Tolerance of Field Crops
EC of Saturated Paste Extract (mmho/cm at 25°C)

Alexis Hobbs, M.S., Soil Health Coordinator Raymond C. Ward, Ph.D., Certified Professional Soil Scientist
Soil Testing › 107
Figure 16: Salt Tolerance of Forage Crops
EC of Saturated Paste Extract (mmho/cm at 25°C)
*The indicated salt tolerances apply to the period of rapid plant growth and maturation, from the late seedling stage onward. Crops in each category are ranked in order of decreasing salt tolerance. Crosslines are placed at 10, 25, 50 and 100-percent yield reductions.
Control of soil salinity can be accomplished through careful irrigation management. Excess water is needed to leach salts below the root zone. Frequent irrigation may be necessary to keep salts diluted enough to allow normal plant growth. This is especially critical at germination and early plant growth stages. Use of salt-tolerant crops is another management tool. Temporary alleviation of saline conditions, perhaps with farm manures, may allow the establishment of less tolerant crops like alfalfa, which may maintain itself once established despite the saline conditions.
How much excess irrigation water is needed to leach salt to a tolerable level in the root zone? A leaching requirement needs to be calculated as follows:
𝑳𝒆𝒂𝒄𝒉𝒊𝒏𝒈 𝑹𝒆𝒒𝒖𝒊𝒓𝒆𝒎𝒆𝒏𝒕 (𝑳𝑹) = 𝑬𝑪 𝒐𝒇 𝒕𝒉𝒆 𝒊𝒓𝒓𝒊𝒈𝒂𝒕𝒊𝒐𝒏 𝒘𝒂𝒕𝒆𝒓
𝑬𝑪 𝒐𝒇 𝒔𝒂𝒕𝒖𝒓𝒆𝒅 𝒑𝒂𝒔𝒕𝒆 𝒆𝒙𝒕𝒓𝒂𝒄𝒕 𝒂𝒕 𝟓𝟎% 𝒚𝒊𝒆𝒍𝒅 𝒓𝒆𝒅𝒖𝒄𝒕𝒊𝒐𝒏
𝒙 𝒘𝒂𝒕𝒆𝒓 𝒉𝒐𝒍𝒅𝒊𝒏𝒈 𝒄𝒂𝒑𝒄𝒊𝒕𝒚𝒐𝒇 𝒕𝒉𝒆 𝒓𝒐𝒐𝒕 𝒛𝒐𝒏𝒆
Let’s say your soil root zone holds 10 inches of water and your irrigation water has an EC of 2.00 mmho/cm. A 50% corn yield reduction occurs at an EC saturation extract of 6.00 mmho/cm (Taken from Figure 4-6). The leaching requirement would be 2.00/6.00 x 10 = 3.33 inches. If you had estimated that 2.5 inches of water was needed to fill root zone to field capacity, 5.8 inches of water has to be applied (2.5” + 3.33).
If you estimated 2.5 inches of water was needed to fill root zone to field capacity, 5.8 inches of water has to be applied (2.5” + 3.33”).
ADDITIONAL REFERENCES:
» James, D.W., Hanks, R. J. and Jurinak, J.J. 1982. Modern Irrigation Soils, Wiley-Interscience Publication. John Wiley and Sons.
» Brady, N.C. 2008. The Nature and Property of Soils. 8th edition. Macmillan Publishing Co., Inc., New York.

Soil Health › 108
SOIL HEALTH

Alexis Hobbs, M.S., Soil Health Coordinator Raymond C. Ward, Ph.D., Certified Professional Soil Scientist
Soil Health › 109
The History
Historically, soil has been viewed as an inert medium necessary for plant root growth and to hold nutrients. As the understanding of soil microbiology continues to expand, the importance of soil biology and the influence it has on nutrient availability, soil structure, and crop yields has led to an emphasis on understanding and implementing positive soil biological practices. Integrating our understanding of physical, chemical and biology components of soil has led to the promotion of “soil health”. This holistic approach highlights the relationships between all three aspects of soil and provides a guideline for soil management and improvement.
Soil health has emerged as a concept that emphasizes the need for a holistic approach to adequately assess the biological, physical, and chemical functions of the soil, with an overall goal of guiding producers’ management decisions towards achieving increased productivity, resilience, and other agroecosystem services. Soil health indicators are especially useful when they are (i) sensitive to changes in management practices (ii) reflect important soil ecosystem functions, (iii) rapid and inexpensive and (iv) suitable for high throughput framework of commercial soil testing laboratories.
The Relationship Between Plants and Soil Microbial Life
Plants are autotrophic, meaning they produce complex organic compounds from simple substances in their environment. The ability to absorb light energy, in combination with carbon dioxide (CO2) and water, creates sugar to fuel the growth and production of the plant while releasing oxygen (O2) as a byproduct. As the roots of a plant grow and expand into the soil environment, soil roots and hairs release complex carbon compounds as to aid in defense from pests and disease, fight invasive plants and stimulate the microbial community to scavenge nutrients from the soil. The plant can release up to 40-60% of the carbohydrates created through photosynthesis to cultivate soil microbes in and around the root, known as the rhizosphere. Although research indicates that plants can release as least 90 different compounds, three major compounds have been identified: citric acid, malic acid, and oxalic acid.
Each plant releases the carbohydrates necessary to create a suitable microbial community that will scavenge and release vital nutrients necessary for the continued growth of the plant. This symbiotic relationship can continue throughout the plant’s life cycle and a healthy, established microbial community can easily adapt the next plant’s needs.
The evaluation of the physical and biological properties is often overlooked. The biological, physical, and chemical characteristics of a soil are intertwined; impacts on any of these characteristics will impact the others. Soil biological properties are related to nutrient cycling, soil aggregation stability, and soil water fate. Soil physical properties are also related to nutrient cycling, soil structure, and soil water fate. Slaking is a common problem that can cause soil structure breakdown which in turn leads to a superficial crust being formed. Slaking reduces water infiltration and enhances sediment loss by downward transportation with surface runoff water. Soil chemical properties are also related to nutrient cycling as well as optimum growth conditions for microbes.
Healthy soils are productive, high performing soils that depend on an active, diverse community of microbes to help efficiently cycle nutrients in the soil. If proper nutrients in the soil are maintained, production costs can be decreased, and profits improved. Above all, healthier soil can help produce healthier food.

Alexis Hobbs, M.S., Soil Health Coordinator Raymond C. Ward, Ph.D., Certified Professional Soil Scientist
Soil Health › 110
Principles of Soil Health
As interest in soil health continues to grow, five concepts of soil health have emerged as guiding principles to help producers improve the health of their soil.
Principle 1: Keeping the Soil Covered
The first principle of soil health focuses on keeping the topsoil in place. Continuous removal of crops, lack of a cover crop or improper rotation, overgrazing, over-use of man-made chemicals and baling crop residues exposes the surface of the soil to the sun, wind, and water. Bare soil has a dark color that can quickly absorb heat from the sun, which in turn increases soil temperature and evaporation rates. Lack of moisture allows light particles such as clay and silt to be easily suspended by the wind and carried long distances in a dust cloud. In turn, other soil particles can bounce along the surface, dislodging other surface soil particles. Larger particles roll across the surface until the wind slows or encounters a larger object.
Rain is equally as destructive. The force of a raindrop can strike the surface of the earth at speeds of 20-50 miles an hour. This force easily dislodges soil particles and destroys exposed glues that are important for soil aggregation. Loss of aggregation decreases the amount of large pore spaces and allows dislodged clay and silt particles to clog pores. As the rain strikes the earth, the smaller soil particles clog pores and seal the surface of the soil, preventing infiltration and increasing surface runoff.
By continuously providing cover or “armoring” the soil surface, the impacts of the sun, wind, and water can be lessened. The presence of plants, both living and dead, reduce the impact of rain on the soil surface and absorb energy from the wind while capturing suspended soil from the air. In addition, covering the soil prevents the sun from reaching the dark soil, maintaining a moderate range of temperatures that is beneficial for microbial life and to maintain soil moisture. Another benefit is that weed seeds have limited sunlight which is necessary for establishment. In addition, crop residues act as an important food source and habitat for microbial life. As microbes break down residues, nutrients are converted and consumed and will be released for future plant use.
Principle 2: Minimizing Soil Disturbance
Soil structure is formed through physical, chemical, and biological activities that create glues to hold soil particles together, called soil aggregation. Different arrangements of aggregates result in different sized pores, creating channels for air and water movement in the soil which ultimately influence bulk density, aeration, permeability, and water holding capacity of the soil. Soil disturbances refer to biological, chemical, and physical disturbances.
When livestock overgraze an area, plants are limited in their ability to harvest CO2 and sunlight. In addition, lack of cover results in reduced armor on the soil and reduced below ground biomass. Physical disturbance results from tillage. Tillage results in reduction and removal of pore spaces that restricts infiltration and destroys biological glues. This in turn results in water erosion, wind erosion, ponding water, crusting, and soil organic matter depletion. Finally, over-use of man-made chemicals can result in changes to the soil pH and increased pests and diseases. Minimizing soil disturbance is a good start to rebuilding soil aggregates, pore spaces, biological glue, and soil organic matter.
Principle 3: Plant Diversity
Diversity is natural is nature. Lewis and Clark documented the landscape of the northern plains as having abundant plant diversity. Multiple species were working together as a plant community to provide forage and habitats. However, settlement of the northern plains brought in agriculture and the polyculture perennial landscape was replaced with a monoculture annual landscape.

Alexis Hobbs, M.S., Soil Health Coordinator Raymond C. Ward, Ph.D., Certified Professional Soil Scientist
Soil Health › 111
Diversity above ground supports diversity below ground. The soil microbes depend on carbon root exudates from plants. In a polyculture system, the soil microbes are receiving food from multiple different species. In contrast, in a monoculture system the soil microbes are now receiving exudates from one annual plant at a time. This is equivalent to humans eating the same food for every meal every day for approximately 60-100 days. We can begin to mimic the original plant community by adding crop rotations that include all 4 crop types. Diverse crop rotations provide more biodiversity, which improves water infiltration and nutrient cycling and reduces pests and diseases.
Principle 4: Continual Live Plant/Root
Perennial grasslands consist of cool season grasses, warm season grasses, and flowering forbs. This allows for plants to grow during the cool fall and spring weather, as well as during the summer heat. A continual living plant allows for feeding carbon root exudates to the soil microbiology during the entire growing season.
Cropland systems typically grow cool or warm season annual cash crops that have a dormant period before planting and/or after harvest. Cover crops can fill in the dormant period and provide the missing root exudates, which is the primary food source for the soil microbes. Cover crops can address a number of resource concerns including: harvesting CO2 and sunlight which provides carbon root exudates to the soil microbes; building soil aggregates and pore spaces which improves water infiltration; covering the soil which controls wind and water erosion, soil temperature, and rainfall compaction; weed suppression; wildlife food, habitat, and space; and pollinator food and habitat.
Principle 5: Livestock Integration
Historically, animals, plants, and soils have played a synergistic role. However, recently animals have begun playing a reduced role due to confinement and fewer farms including livestock as part of their operation. Incorporating livestock in the fall or winter can covert high carbon crop residue into low carbon organic matter, which balances the carbon to nitrogen ratio. Utilizing livestock on annual or perennial plants in short bursts followed by long recovery periods allows plants to regrow and harvest sunlight and CO2. Integrating livestock will reduce nutrient export from cropland and hay fields, which will lead to the recycling of the majority of nutrients, minerals, vitamins, and carbon. Grazing manages weed pressure and reduces livestock waste associated with confinement which helps to manage our water quality and nutrient management concerns.
Livestock can be integrated in the winter and fall by grazing cover crops and annual crop residues. Summer grazing can be useful on a full season cover crop which allows pant recovery and potentially a second grazing during the fall or winter. Winter feeding can be done on hayland fields by rolling out bales or bale grazing.
Soil Health Testing
Traditional soil testing has primarily focused on the soil chemical composition. Recommendations generated from these tests are based on correct soil constraints related to chemical amendments. Soil health is a relatively new concept in soil management in comparison to standard soil analytical evaluations. Soil health tests should focus on soil properties that are representative of key processes that allow the soil to function properly. Specific soil processes that can be managed to improve crop quality and soil health testing aim to create a baseline of information to allow producers to monitor the impacts of management decisions.
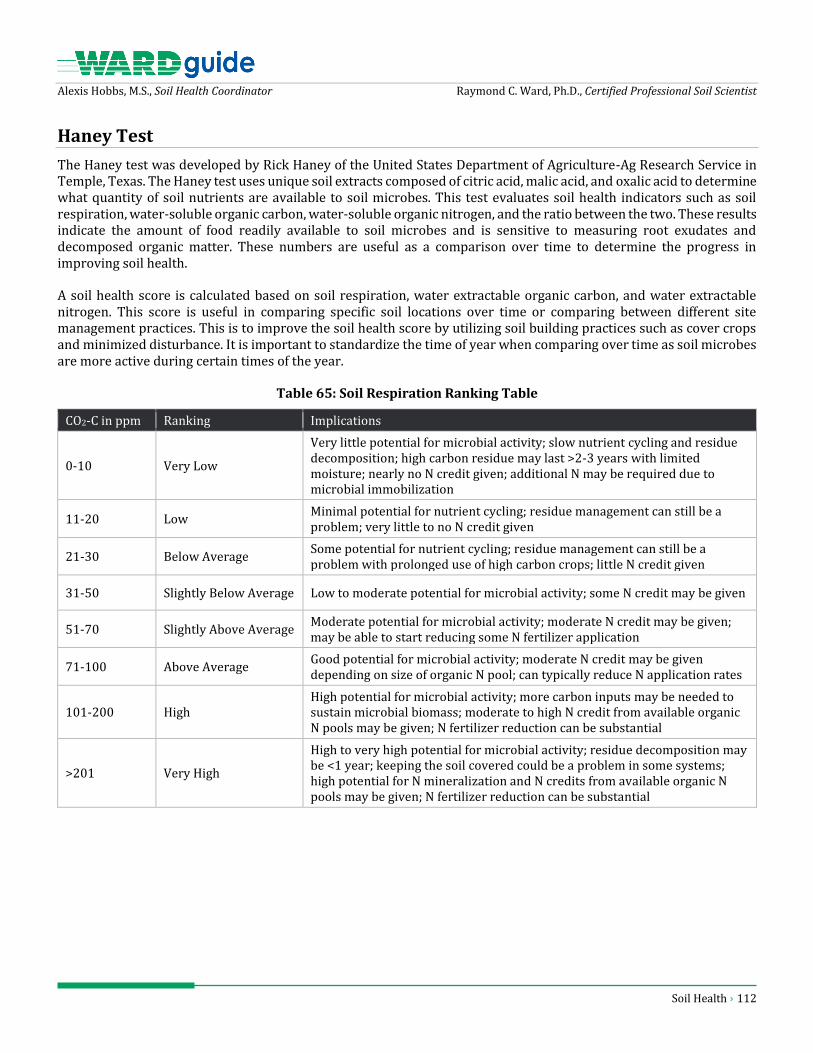
Alexis Hobbs, M.S., Soil Health Coordinator Raymond C. Ward, Ph.D., Certified Professional Soil Scientist
Soil Health › 112
Haney Test
The Haney test was developed by Rick Haney of the United States Department of Agriculture-Ag Research Service in Temple, Texas. The Haney test uses unique soil extracts composed of citric acid, malic acid, and oxalic acid to determine what quantity of soil nutrients are available to soil microbes. This test evaluates soil health indicators such as soil respiration, water-soluble organic carbon, water-soluble organic nitrogen, and the ratio between the two. These results indicate the amount of food readily available to soil microbes and is sensitive to measuring root exudates and decomposed organic matter. These numbers are useful as a comparison over time to determine the progress in improving soil health.
A soil health score is calculated based on soil respiration, water extractable organic carbon, and water extractable nitrogen. This score is useful in comparing specific soil locations over time or comparing between different site management practices. This is to improve the soil health score by utilizing soil building practices such as cover crops and minimized disturbance. It is important to standardize the time of year when comparing over time as soil microbes are more active during certain times of the year.
Table 65: Soil Respiration Ranking Table
CO2-C in ppm Ranking Implications
0-10 Very Low
Very little potential for microbial activity; slow nutrient cycling and residue decomposition; high carbon residue may last >2-3 years with limited moisture; nearly no N credit given; additional N may be required due to microbial immobilization
11-20 Low Minimal potential for nutrient cycling; residue management can still be a problem; very little to no N credit given
21-30 Below Average Some potential for nutrient cycling; residue management can still be a problem with prolonged use of high carbon crops; little N credit given
31-50 Slightly Below Average Low to moderate potential for microbial activity; some N credit may be given
51-70 Slightly Above Average Moderate potential for microbial activity; moderate N credit may be given; may be able to start reducing some N fertilizer application
71-100 Above Average Good potential for microbial activity; moderate N credit may be given depending on size of organic N pool; can typically reduce N application rates
101-200 High High potential for microbial activity; more carbon inputs may be needed to sustain microbial biomass; moderate to high N credit from available organic N pools may be given; N fertilizer reduction can be substantial
>201 Very High
High to very high potential for microbial activity; residue decomposition may be <1 year; keeping the soil covered could be a problem in some systems; high potential for N mineralization and N credits from available organic N pools may be given; N fertilizer reduction can be substantial

Alexis Hobbs, M.S., Soil Health Coordinator Raymond C. Ward, Ph.D., Certified Professional Soil Scientist
Soil Health › 113
Table 66: Soil Fertility Rating for Haney H3A Extraction Table
Nutrient Very Low Low Medium High Very High
----------------ppm------------------
PO4-P 0-4 5-11 12-22 23-45 45+
ICAP Phosphorus 0-5 6-12 13-25 26-50 51+
Potassium, K 0-18 19-36 37-53 54-89 90+
Sulfate, S 0-3 4-6 7-10 11-14 15+
Magnesium, Mg 0-6 7-11 12-20 21-29 30+
Zinc, Zn 0-0.12 0.13-0.25 0.26-0.38 0.39-0.50 0.51+
Iron, Fe 0-2.0 2.1-4.0 4.1-9.0 9.1-20.0 20.1+
Manganese, Mn 0-0.5 0.6-1.0 1.1-2.0 2.1-3.0 3.1+
Copper, Cu 0-0.03 0.04-0.07 0.08-0.1 0.11-0.20 0.21+
Table 67: Organic C:N Ration Ranking Table
Ratio Results Ranking N Implications Management Needs
>20:1 Poor; too much organic C and/or not enough organic N
N tie up by microbes: no N credit given from WEON pool
Increase legumes in rotation or covers; reduce high carbon inputs; graze longer to reduce carbon
15:1—20:1 Marginal Some N tie up; slower mineralization; lower N credit from WEON
Increase legumes in rotation or covers; reduce high carbon inputs; graze longer to reduce carbon
8:1—15:1 Good Less N tie up; greater potential for N mineralization; higher credit from WEON
Make slight adjustments if near the boundaries to keep within this range
<8:1 Poor; too little organic C and/or too much organic N
Limited energy for microbial activity; N credit may still be high if soil respiration and WEON are also high
Increase carbon inputs; graze shorter to retain carbon
PLFA
Phospholipid fatty acids (PLFAs) are found in the membranes of all active organisms. Certain fatty acids are used to indicate the bacteria, fungi, or other types of microbes. Quantifying the fatty acid content in a soil sample can indicate the size of a specific microbial group as well as the size of the entire microbial biomass. A gas chromatograph machine can measure the PLFA content of a soil sample.
The PLFA test provides a real-time snapshot of the soil microbial community. Soil microbes can affect function such as plant growth, nutrient cycling, and carbon sequestration. Altering soil by using tillage, cover crops, or manure can be detected by the soil microbe reaction analyzed by the PLFA test. Changes to the type of soil microbe and total biomass can be tracked as soil health changes over time.

Alexis Hobbs, M.S., Soil Health Coordinator Raymond C. Ward, Ph.D., Certified Professional Soil Scientist
Soil Health › 114
Enzymes
Soil enzymes increase the reaction rate at which plant residues decompose and release plant available nutrients. The substance acted upon by a soil enzyme is called a substrate. Enzymes are specific to a substrate and have active sites that bind with the substrate to form a temporary complex. The enzymatic reaction releases a product, which can be a nutrient contained in the substrate.
Sources of soil enzymes include living and dead microbes, plant roots and residues, and soil animals. Enzymes stabilized in the soil matrix accumulate or form complexes with organic matter, clay, and humus-clay complexes, but are no longer associated with viable cells. It is thought that 40-60% of enzyme activity can come from stabilized enzymes, so activity does not necessarily correlate highly with microbial biomass or respiration. Therefore, enzyme activity is the cumulative effect of long-term microbial activity and activity of the viable population at sampling.
Enzymes respond to soil management changes long before other soil quality indicator changes are detectable. Soil enzymes play an important role in organic matter decomposition and nutrient cycling. Some enzymes only facilitate the breakdown of organic matter, while others are involved in nutrient mineralization.
Absence or suppression of soil enzymes prevents or reduces processes that can affect plant nutrition. Poor enzyme activity, for example from pesticides degrading enzymes, can result in an accumulation of chemicals that are harmful to the environment and some may further inhibit soil enzyme activity.
Available Water Hold Capacity
Increased ability of the soil to allow infiltration is the first step in preventing soil erosion. Available water is the difference between field capacity, which is the maximum amount of water the soil can hold, and wilting point where the plant can no longer extract water from the soil. Water holding capacity is the total amount of water a soil can hold at field capacity.
Figure 17: Volume of Soil Water, from Kramer 1983
Farmers can improve water holding capacity by growing high residue crops, perennial sod and cover crops, reducing soil disturbance, and managing residues to protect and increase soil organic matter. For soils high in soluble salts, management activities that maintain salts below the root zone can be used, including irrigation to leach salts and promote infiltration, minimizing disturbance, managing residues, and preventing mixing of salt-laden lower soil layers with surface layers.

Plant Testing › 115
PLANT TESTING

Raymond C. Ward, Ph.D., Certified Professional Soil Scientist
Plant Testing › 116
Plant Analysis – Introduction
Plant Analysis has Two Main Applications:
1. To diagnose a suspected plant nutrient deficiency when visual symptoms are present 2. To monitor the plant nutrient status in order to determine whether each tested nutrient is in sufficient
concentration for optimum yield.
The diagnostic role of a plant analysis has been well established. A suspected deficiency should always be confirmed by a plant analysis before a corrective treatment is applied.
Care must be taken when sampling plants that are nutritionally stressed. Plants under long periods of stress tend to develop unusual nutrient contents. Therefore, samples should be obtained as soon as symptoms appear. Dead tissue or tissue showing severe symptoms should not be included in the sample.
The monitoring role of a plant analysis or a series of plant analyses offers the farmer and grower an opportunity to maintain high quality production with a minimum of nutrient deficiency problems.
Sampling each year on a regular basis and comparing analytical results from one sample to the next provide a way of noting changes in nutrient element content. Upward or downward trends should warn the grower of a potential deficiency or imbalance. Then corrective treatments can be applied before significant losses in yield or quality occur.
Many of the deficiencies and excesses occurring in most fields are self-induced due to
1. poor cultural practices 2. excessive application rates of some fertilizer elements 3. failure to apply elements according to complete soil tests
High rates of fertilizer applied each year can accumulate to eventually reach excessive proportions. High soil test P levels can induce Zn deficiency of Zn sensitive crops, such as corn. Heavy K fertilization can induce Mg deficiency. Such deficiencies and imbalances can be avoided if the grower will use soil tests and plant analysis as monitoring tools.
A record of soil tests and plant analysis should be maintained and referred to each time a lime and fertilization program is formulated. Noting upward or downward trends in pH, or levels of available nutrients, should be considered. Adjustments can be made to keep the nutrient content of the soil and plants within the sufficiency range for each tested element.
Used together, visual observation, knowledge of the site, soil tests and plant analysis effectively evaluate the nutrient element status of the soil-plant environment. However, plant analysis may not solve every problem or uncover all unseen nutrient element deficiencies or excesses. When plant analysis confirms or uncovers nutrient element deficiency, a corrective treatment may not always be applied to the sampled crop. Instead, treatments may be specified for future growing seasons or additional tissue and soil samples may be needed to fully evaluate the suspected deficiency.
A plant analysis may indicate that a plant nutrient deficiency or excess does not exist. Then the cause for poor plant growth or visual symptoms needs to be sought elsewhere.
In order to utilize the plant analysis technique effectively, considerable care must be taken when collecting, preparing, and sending plant tissue to the laboratory.

Raymond C. Ward, Ph.D., Certified Professional Soil Scientist
Plant Testing › 117
Fresh plant tissue should never be placed in “zip lock” bags or in airtight containers. Clean paper bags and/or paper envelopes are ideal plant tissue containers even for moist samples. It is not necessary to maintain the tissue sample in the fresh state for plant analysis.
Plant Analysis – Sampling
What to Sample
Proper sampling requires that a definite plant part be taken, such as a particular leaf, group of leaves, or portion of the plant. Instructions outline individual parts to sample as well as the number of plants that represent a composite sample. This will ensure that a sufficient quantity of plant tissue is submitted and that the collected sample is statistically representative of the area under study.
When no specific sampling instructions are given for a crop, the general rule of thumb is to sample the most recently mature leaves. Plants showing suspected nutrient element deficiency symptoms should be sampled at the time visual symptoms appear or shortly thereafter.
Plants that have been:
1. under a nutrient element stress for some time with dead tissue, 2. mechanically injured, 3. diseased, 4. and/or insect-damaged,
should not be included in a composite sample.
When to Sample
For the purpose of monitoring the nutrient levels in plants, the proper sampling time is at the flowering stage. The beginning of the flowering stage is easily identified. Therefore, researchers have used this growth stage for establishing interpretation guidelines. Research has found that the nutrient concentrations in plants change as plant growth develops. Testing earlier than flowering stage will show higher nutrient levels than at flowering and testing after grain formation will show lower nutrient levels than at flowering. The proper sampling technique is shown in the table on the next page.
Plant analysis may also be used to determine the cause of poor growth early in the growing season. It is recommended that similar samples be taken from the poorly growing plants and from the adjacent good growing plants. Care should be taken to ensure that the two samples are approximately the same stage of growth and have been treated similarly. The comparative samples are needed to properly interpret the analysis of the poor growth sample when sampled prior to flowering.
Removing Soil
Dusty or soil-covered leaves and plants should be avoided whenever possible. When leaves are covered with spray materials or dust, washing in a mild detergent solution (about 2%) and rinsing in running water will remove most attached substances. The washing procedure should not be prolonged. Washing and rinsing should be done briskly. If iron is of primary interest, leaves should be washed regardless of their outward appearance. Whole plants sampled shortly after emergence should be washed to remove soil particles frequently attached to the tissue.

Raymond C. Ward, Ph.D., Certified Professional Soil Scientist
Plant Testing › 118
Table 68: Procedures for Collecting Leaf and Plant Tissue for a Plant Analysis
Field Crop Stage of Growth Plant Part to Sample Number of Plants to Sample
Corn
Seedling stage (Less than 12”)
All the above ground portion 20 – 30
Prior to tasseling The top leaf with collar 15 – 25
From tasseling to early silking
The entire leaf at the ear (or immediately below it)
15 – 25
Sampling after silks brown is not recommended.
Soybeans or other beans
Seedling stage (Less than 12”)
All the above ground portion 20 – 30
Initial flowering Two or three fully developed leaves at the top of the plant
20 – 30
Sampling after pods begin to fill is not recommended.
Small Grain
Seedling stage (Less than 12”)
The above ground portion 50 – 100
Boot to heading The above ground portion 20 – 30
Sampling after heading is not recommended.
Hay, pasture or forage grasses
Just prior to seed head emergence or 4 to 6 weeks after clipping
Whole tops 20 – 30
Alfalfa Bud stage to 1st flower The upper 1/3 of the plant
15 – 25
Milo Very early heading Second leaf from top of plant 15 – 25
Interpretation of Plant Analysis: Corn
Corn leaf samples collected at silking time have traditionally been used for interpretation of plant analysis. Sampling at this stage of growth is an advantage because nutrient absorption of the corn plant is greatest just prior to tasseling and it is an easily identifiable point in the development of the plant. The disadvantage of sampling at silking is that deficiencies are impossible or difficult to correct for that growing season.
When a nutrient deficiency is observed early in the season, plant tissue should be taken at that time. For interpretation, it is helpful to have normal growing plants from an adjacent area for comparison. The advantage of this diagnostic approach is that a recommendation for correction of the deficiency can be made for that year.
The nutrient ranges are defined below:
Table 69: Nutrient Range Descriptions for Corn
Range Yield Nutrient Description
Deficient 80% or less Deficiency symptoms present
Low 80 - 95% Hidden hunger area
Sufficient 95 - 100% Normal yield
High/Excessive 100% down to 70% Abnormally high – excessive

Raymond C. Ward, Ph.D., Certified Professional Soil Scientist
Plant Testing › 119
All interpretative values are based on total analysis of dried samples. Interpretative values are given for ear leaf at silking and whole plants at the 4 to 6 leaf stage.
Table 70: Corn Nutrient Ranges for Whole Plant and Ear Leaf Silking
Range Whole Plant (3 – 5 Leaf) Ear Leaf Silking
Nitrogen, % N
Deficient < 2.90 < 2.20
Low 2.91 – 3.50 2.21 – 2.70
Sufficient 3.51 – 5.00 2.71 – 3.40
High 5.01 + 3.41 +
Phosphorus, % P
Deficient < 0.27 < 0.20
Low 0.28 – 0.34 0.25 – 0.24
Sufficient 0.35 – 0.55 0.25 – 0.35
High 0.56 + 0.36 +
Potassium, % K
Deficient < 1.90 < 1.20
Low 1.91 – 2.50 1.20 – 2.00
Sufficient 2.51 – 3.50 2.01 – 2.60
High 3.51 + 2.61 +
Sulfur, % S
Deficient < 0.13 < 0.10
Low 0.14 – 0.20 0.11 – 0.15
Sufficient 0.21 – 0.28 0.16 – 0.16
High 0.29 + 0.27 +
Calcium, % Ca
Deficient < 0.20 < 0.20
Low 0.21 – 0.25 0.20 – 0.24
Sufficient 0.26 – 0.80 0.25 – 0.80
High 0.81 + 0.81 +
Magnesium, % Mg
Deficient < 0.11 < 0.09
Low 0.11 – 0.15 0.10 – 0.15
Sufficient 0.16 – 0.40 0.15 – 0.35
High 0.41 + 0.36 +
Zinc, ppm Zn
Deficient < 15 < 13
Low 15 – 20 13 – 17

Raymond C. Ward, Ph.D., Certified Professional Soil Scientist
Plant Testing › 120
Range Whole Plant (3 – 5 Leaf) Ear Leaf Silking
Sufficient 21 – 60 18 – 60
High 61 + 61 +
Iron, ppm Fe
Deficient < 20 < 20
Low 20 – 49 20 – 29
Sufficient 50 – 300 30 – 300
High 301 + 301 +
Manganese, ppm Mn
Deficient < 20 < 15
Low 20 – 29 15 – 19
Sufficient 30 – 160 20 – 150
High 161 + 151 +
Copper, ppm Cu
Deficient < 3 < 2
Low 3 – 4 2 – 4
Sufficient 5 – 20 5 – 20
High 21 + 21 +
Boron, ppm B
Deficient < 3 < 2
Low 3 – 5 2 – 3
Sufficient 6 – 25 4 – 25
High 26 + 26 +
Chloride, % Cl
Deficient < 0.05 < 0.05
Low 0.06 – 0.10 0.06 – 0.17
Sufficient 0.11 – 0.50 0.18 – 0.50
High 0.51 + 0.51 +
Molybdenum, ppm Mo
Deficient < 0.10 < 0.05
Low 0.11 – 0.20 0.06 – 0.20
Sufficient 0.21 – 2.00 0.21 – 2.50
High 2.01 + 2.51 +

Raymond C. Ward, Ph.D., Certified Professional Soil Scientist
Plant Testing › 121
Interpretation of Plant Analysis: Soybeans
Soybean leaf analysis interpretation standards have been developed for soybean samples during the flowering stage. The uppermost fully "mature" trifoliate leaves should be collected from 30 to 50 plants at random. Mature leaves are the third or fourth set of trifoliate leaves below the growing terminals. The petioles should be removed and discarded and the leaflets saved for analysis.
The flowering stage on the northern intermediate soybean varieties begins 30 days after emergence and flowers for several weeks, therefore the interpretation values will be given for the flowering stage.
The nutrient range definitions are as follows:
Table 71: Nutrient Range Descriptions for Soybeans
Range Yield Nutrient Description
Deficient 80% or less Deficiency symptoms present
Low 80 – 95% Hidden hunger area
Sufficient 95 – 100% Normal yield
High/Excessive 100% down to 70% Abnormally high – excessive
All interpretative values are based on total analysis from wet or dry ashing procedures.
When a nutrient deficiency is observed early in the season, plant tissue should be taken at that time. For interpretation it is helpful to have normal growing plants from an adjacent area for comparison. The advantage of this diagnostic approach is that a recommendation for correction of the deficiency can be made for that year.
Table 72: Soybean Plant Analysis Interpretation - Flowering Stage
Nutrient Deficient Low Sufficient High
Nitrogen, % N < 3.50 3.51 – 4.25 4.26 – 5.50 5.51 – 6.5
Phosphorus, % P < 0.20 0.20 – 0.25 0.26 – 0.50 0.51 – 0.70
Potassium, % K < 1.70 1.70 – 1.99 2.00 – 2.80 2.81 – 4.00
Sulfur, % S < 0.14 0.14 – 0.17 0.18 – 0.30 0.31 – 0.50
Calcium, % Ca < 0.35 0.35 – 0.49 0.50 – 1.50 1.51 – 2.50
Magnesium, % Mg < 0.17 0.17 – 0.25 0.26 – 0.80 0.81 – 1.50
Zinc, ppm Zn < 15 15 – 19 20 – 50 51 – 100
Iron, ppm Fe < 30 30 – 49 50 – 300 301 – 500
Manganese, ppm Mn < 15 15 – 24 25 – 150 151 – 400
Copper, ppm Cu < 3 3 – 5 6 – 30 31 – 60
Boron, ppm B < 12 12 – 20 21 – 60 61 – 80
Chloride, % Cl < 0.02 0.03 – 0.05 0.06 – 0.10 0.11 – 0.25
Molybdenum, ppm Mo < 0.10 0.11 – 0.40 0.41 – 1.00 1.01 – 5.00

Raymond C. Ward, Ph.D., Certified Professional Soil Scientist
Plant Testing › 122
Interpretation of Plant Analysis: Milo
Milo leaf samples collected at very early heading have traditionally been used for interpretation of plant analysis. Sampling at this stage of growth is an advantage because:
» Nutrient absorption of the milo plant is greatest just prior to heading.
» It is an easily identifiable point in the development of the milo plant.
» The disadvantage of sampling at heading is that deficiencies are impossible or difficult to correct for that growing season.
When a nutrient deficiency is observed early in the season plant tissue should be taken at that time. For interpretation, it is helpful to have normal growing plants from an adjacent area for comparison. The advantage of this diagnostic approach is that a recommendation for correction of the deficiency can be made for that year.
The nutrient ranges are defined as follows:
Table 73: Nutrient Range Descriptions for Milo
Range Yield Nutrient Description
Deficient 80% or less Deficiency symptoms present
Low 80 – 95% Hidden hunger area
Sufficient 95 – 100% Normal yield
High/Excessive 100% down to 70% Abnormally high – excessive
All interpretive values are based on total analysis of dried samples. Interpretive values are given for second leaf below the head and whole plants at the 5 to 7 leaf stage.
Table 74: Milo Nutrient Ranges for Whole Plant and 2nd Leaf
Range Whole Plant (5 – 7 Leaf) 2nd Leaf Below Head
Nitrogen, % N
Deficient < 2.80 < 2.40
Low 2.80 – 3.5 2.40 – 2.99
Sufficient 3.51 – 5.0 3.00 – 5.00
High 5.01 + 5.01 +
Phosphorus, % P
Deficient < 0.24 < 0.15
Low 0.24 – 0.29 0.15 – 0.20
Sufficient 0.30 – 0.50 0.21 – 0.40
High 0.51 + 0.41 +
Potassium, % K
Deficient < 2.00 < 1.20
Low 2.00 – 2.60 1.20 – 1.69

Raymond C. Ward, Ph.D., Certified Professional Soil Scientist
Plant Testing › 123
Range Whole Plant (5 – 7 Leaf) 2nd Leaf Below Head
Sufficient 2.61 – 4.00 1.70 – 2.40
High 4.01 + 2.41 +
Range Whole Plant (5 – 7 Leaf) 2nd Leaf Below Head
Sulfur, % S
Deficient < 0.13 < 0.10
Low 0.13 – 0.15 0.11 – 0.14
Sufficient 0.16 – 0.35 0.15 – 0.26
High 0.36 + 0.26 +
Calcium, % Ca
Deficient < 0.14 < 0.17
Low 0.15 – 0.22 0.18 – 0.22
Sufficient 0.23 – 0.50 0.23 – 0.50
High 0.51 + 0.51 +
Magnesium, % Mg
Deficient < 0.11 < 0.09
Low 0.11 – 0.15 0.09 – 0.12
Sufficient 0.16 – 0.40 0.13 – 0.35
High 0.41 + 0.36 +
Zinc, ppm Zn
Deficient < 15 < 11
Low 15 – 19 11 – 15
Sufficient 20 – 60 16 – 50
High 61 + 51 +
Iron, ppm Fe
Deficient < 20 < 20
Low 20 – 39 20 – 29
Sufficient 40 – 300 30 – 300
High 301 + 301 +
Manganese, ppm Mn
Deficient < 20 < 5
Low 20 – 29 5 – 9
Sufficient 30 – 150 10 – 150
High 151 + 151 +
Copper, ppm Cu
Deficient < 3 < 2
Low 3 – 4 2 – 3

Raymond C. Ward, Ph.D., Certified Professional Soil Scientist
Plant Testing › 124
Range Whole Plant (5 – 7 Leaf) 2nd Leaf Below Head
Sufficient 5 – 20 4 – 20
High 21 + 21 +
Boron, ppm B
Deficient < 2 < 1
Low 2 – 3 1– 2
Sufficient 4 – 25 2 – 25
High 26 + 26 +
Interpretation of Plant Analysis: Wheat
Plant analysis sufficiency levels have been established for wheat just as the head emerges from the boot and when wheat is in the full tiller stage.
Some nutrient levels change sharply during wheat plant development. Therefore, it is desirable to collect a sample from normal plants adjacent to abnormal plants when diagnosing a nutrient disorder in wheat before heading. The nutrient ranges are defined as follows:
Table 75: Nutrient Range Descriptions for Wheat
Range Yield Nutrient Description
Deficient 80% or less Deficiency symptoms present
Low 80 – 95% Hidden hunger area
Sufficient 95 – 100% Normal yield
High/Excessive 100% down to 70% Abnormally high – excessive
All interpretative values are based on total analysis of dried samples. Interpretation ranges are given for analysis of whole plants at full tiller and at heading.
Table 76: Wheat Nutrient Deficiency Ranges for Full Tiller and Head Emergence Stages
Range Whole Plant at Full Tiller Whole Plant at Head Emergence
Nitrogen, % N
Deficient < 3.20 < 1.25
Low 3.21 – 4.19 1.25 – 1.75
Sufficient 4.20 – 5.20 1.76 – 3.00
High 5.21 + 3.01 +
Phosphorus, % P
Deficient < 0.25 < 0.15
Low 0.26 – 0.35 0.15 – 0.19
Sufficient 0.36 – 0.70 0.20 – 0.40
High 0.71 + 0.41 +

Raymond C. Ward, Ph.D., Certified Professional Soil Scientist
Plant Testing › 125
Range Whole Plant at Full Tiller Whole Plant at Head Emergence
Potassium, % K
Deficient < 1.70 < 1.25
Low 1.70 – 2.40 1.25 – 1.49
Sufficient 2.41 – 3.50 1.50 – 2.50
High 3.51 + 2.51 +
Sulfur, % S
Deficient < 0.10 < 0.10
Low 0.10 – 0.19 0.10 – 0.14
Sufficient 0.20 – 0.35 0.15 – 0.30
High 0.36 + 0.31 +
Calcium, % Ca
Deficient < 0.15 < 0.15
Low 0.15 – 0.25 0.15 – 0.29
Sufficient 0.26 – 0.65 0.30 – 0.50
High 0.66 + 0.51 +
Magnesium, % Mg
Deficient < 0.12 < 0.10
Low 0.12 – 0.15 0.10 – 0.14
Sufficient 0.16 – 0.40 0.15 – 0.40
High 0.41 + 0.41 +
Zinc, ppm Zn
Deficient < 10 < 10
Low 11 – 20 10 – 20
Sufficient 21 – 70 21 – 40
High 71 + 41 +
Iron, ppm Fe
Deficient < 15 < 10
Low 15 – 35 10 – 29
Sufficient 36 – 300 30 – 200
High 301 + 201 +
Manganese, ppm Mn
Deficient < 8 < 5
Low 8 – 24 5 – 24
Sufficient 25 – 100 25 – 100
High 101 + 101 +
Copper, ppm Cu

Raymond C. Ward, Ph.D., Certified Professional Soil Scientist
Plant Testing › 126
Range Whole Plant at Full Tiller Whole Plant at Head Emergence
Deficient < 3.0 < 3.0
Low 3.1 – 4.9 3.1 – 4.9
Sufficient 5.0 – 10.0 5.1 – 10.0
High 10.1 + 10.1 +
Boron, ppm B
Deficient < 3 < 1.5
Low 3 – 5 1.6 – 3
Sufficient 6 – 10 3.1 – 6
High 11 + 6.1 +
Chloride, % Cl
Deficient < 0.15 < 0.05
Low 0.16 – 0.40 0.06 – 0.09
Sufficient 0.41 – 1.00 0.10 – 0.50
High 1.01 + 0.51 +
Molybdenum, ppm Mo
Deficient < 0.05 < 0.05
Low 0.06 – 0.20 0.06 – 0.20
Sufficient 0.21 – 4.00 0.21 – 4.00
High 4.01 + 4.01 +
Interpretation of Plant Analysis: Alfalfa
Interpretation of alfalfa plant analysis is based on samples collected at or near early bloom. When given the stage of growth at which samples are collected, an experienced agronomist can interpret the plant’s nutritional status. For diagnostic purposes, analysis of normal plants should be compared to analysis of abnormal plants for interpretation.
The nutrient ranges are defined as follows:
Table 77: Nutrient Range Descriptions for Alfalfa
Range Yield Nutrient Description
Deficient 80% or less Deficiency symptoms present
Low 80 – 95% Hidden hunger area
Sufficient 95 – 100% Normal yield
High/Excessive 100% down to 70% Abnormally high – excessive
All interpretative values are based on total analysis of dried samples. Interpretation of the ranges are given for the top 1/3 and for the whole plant.

Raymond C. Ward, Ph.D., Certified Professional Soil Scientist
Plant Testing › 127
Table 78: Alfalfa Nutrient Ranges for the Top 1/3 and Whole Plant
Range Top 1/3 Whole Plant
Nitrogen, % N
Deficient < 3.70 < 3.20
Low 3.71 – 4.10 3.21 – 3.80
Sufficient 4.11 – 5.00 3.81 – 4.60
High 5.01 + 4.61 +
Phosphorus, % P
Deficient < 0.20 < 0.20
Low 0.20 – 0.25 0.20 – 0.23
Sufficient 0.26 – 0.70 0.24 – 0.40
High 0.71 + 0.41 +
Potassium, % K
Deficient < 1.80 < 1.70
Low 1.81 – 2.10 1.71 – 2.10
Sufficient 2.11 – 4.00 2.11 – 3.60
High 4.01 + 3.61 +
Range Top 1/3 Whole Plant
Sulfur, % S
Deficient < 0.17 < 0.14
Low 0.17 – 0.24 0.14 – 0.19
Sufficient 0.25 – 0.40 0.20 – 0.30
High 0.41 + 0.31 +
Calcium, % Ca
Deficient < 0.70 < 0.50
Low 0.70 – 1.20 0.50 – 1.10
Sufficient 1.21 – 3.00 1.11 – 2.60
High 3.01 + 2.61 +
Magnesium, % Mg
Deficient < 0.20 < 0.15
Low 0.20 – 0.29 0.15 – 0.25
Sufficient 0.30 – 0.80 0.26 – 0.70
High 0.81 + 0.71 +
Zinc, ppm Zn
Deficient < 12 < 10
Low 12 – 18 10 – 15
Sufficient 19 – 70 16 – 70

Raymond C. Ward, Ph.D., Certified Professional Soil Scientist
Plant Testing › 128
Range Top 1/3 Whole Plant
High 71 + 70 +
Iron, ppm Fe
Deficient < 20 < 25
Low 20 – 30 25 – 35
Sufficient 31 – 200 36 – 300
High 200 + 300 +
Manganese, ppm Mn
Deficient < 15 < 20
Low 15 – 25 20 – 30
Sufficient 26 – 120 31 – 150
High 121 + 151 +
Copper, ppm Cu
Deficient < 4 < 3
Low 4 – 5 3 – 4
Sufficient 6 – 20 5 – 15
High 21 + 16 +
Boron, ppm B
Deficient < 15 < 10
Low 15 – 25 10 – 20
Sufficient 26 – 80 21 – 50
High 81 + 51 +
Potato Tissue Analysis
A Guide to Nitrogen Fertilization of Potatoes
Maximum yield of high quality potatoes requires adequate nitrogen nutrition throughout the growth period. A good fertilizer program will supply enough nitrogen to meet the plant's needs - but not excessive nitrogen.
Unnecessarily high nitrogen fertilizer rates promote late-season vegetative growth, delayed tuber maturity, increase production costs, and may reduce tuber quality.
Plant tissue analysis is a technique that offers the potential for controlling nitrogen nutrition to obtain maximum potato yield with the least amount of nitrogen fertilizer. This tool will detect nitrogen shortage in potato plants before visual symptoms appear and before yield has been reduced.
Sampling
Plant tissue samples must be taken carefully and properly to be useful in judging the nitrogen nutritional status of potatoes.
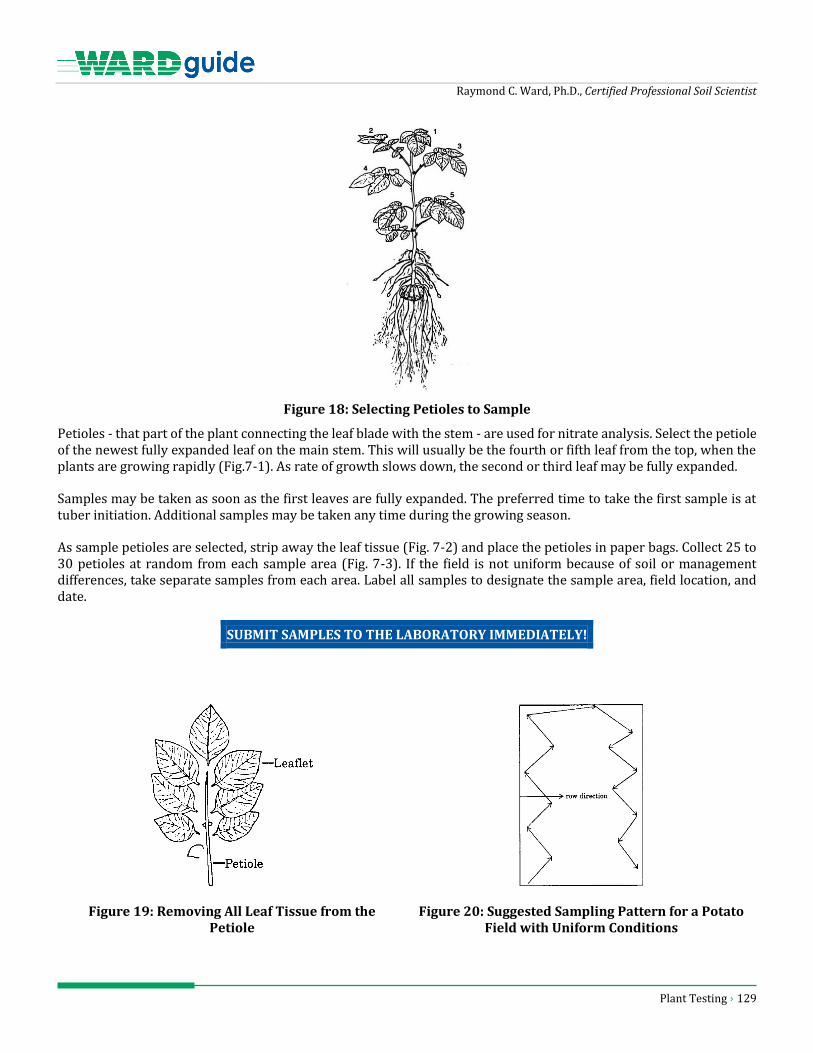
Raymond C. Ward, Ph.D., Certified Professional Soil Scientist
Plant Testing › 129
Figure 18: Selecting Petioles to Sample
Petioles - that part of the plant connecting the leaf blade with the stem - are used for nitrate analysis. Select the petiole of the newest fully expanded leaf on the main stem. This will usually be the fourth or fifth leaf from the top, when the plants are growing rapidly (Fig.7-1). As rate of growth slows down, the second or third leaf may be fully expanded.
Samples may be taken as soon as the first leaves are fully expanded. The preferred time to take the first sample is at tuber initiation. Additional samples may be taken any time during the growing season.
As sample petioles are selected, strip away the leaf tissue (Fig. 7-2) and place the petioles in paper bags. Collect 25 to 30 petioles at random from each sample area (Fig. 7-3). If the field is not uniform because of soil or management differences, take separate samples from each area. Label all samples to designate the sample area, field location, and date.
SUBMIT SAMPLES TO THE LABORATORY IMMEDIATELY!
Figure 19: Removing All Leaf Tissue from the Petiole
Figure 20: Suggested Sampling Pattern for a Potato Field with Uniform Conditions

Raymond C. Ward, Ph.D., Certified Professional Soil Scientist
Plant Testing › 130
Potato Nitrate Tissue Analysis
The level of nitrate-nitrogen in potato petioles must be interpreted in relation to the stage of plant development. With an adequate supply of nitrate-nitrogen in the soil, the level in the petiole will be much higher in early season than later when plants are larger, more mature and the soil nitrogen supply has been reduced.
Research results show that the proper use of seasonal N applications has the potential to optimize potato yields and quality by encouraging earlier tuber growth and by maintaining maximum tuber growth rates until harvest or vine kill.
Nitrogen fertilizer applications should be scheduled to supplement the N available from soil sources according to the crop's N requirements during different growth stages. The potato plant's growth cycle can be divided into four growth stages based on top and tuber growth and nutrient uptake (Table 7-12).
Table 6-13 gives the recommended soil and petiole NO3-N concentrations to use in scheduling seasonal N fertilizer applications during the different plant growth stages. Maintenance of these NO3-N concentrations during growth has been shown to be adequate for maximum tuber yields.
Table 79: Potato Plant Growth Stages
Growth Stage Description
I VEGETATIVE – describes plant development from planting until the start or tuber initiation.
II TUBERIZATION – lasts 10 to 14 days with tubers being formed at the tips of the stolons but not appreciably enlarging. The plant may have a few open flowers at the end of this stage.
III TUBER GROWTH – the phase where tuber growth is linear if all growth conditions are optimum.
IV MATURATION – the period during which the vines start to yellow, leaf loss is evident, and tuber dry weight increases, mainly from translocation of materials from the tops and roots into the tubers.
Table 80: Recommended Soil and Petiole NO3-N Concentration
For Use in Scheduling Seasonal Nitrogen Applications During Various Potato Growth Stages
NO3-N Concentrations (ppm)
Growth Stage I II III IV
Soil 15* 15 – 10 10 10
Petiole (4th) - 15,000 15,000 10,000
*NO3-N concentration at the end of Growth Stage I.
Manure › 131
MANURE

Raymond C. Ward, Ph.D., Certified Professional Soil Scientist
Manure › 132
The Role of Manure in Soil Nutrient Cycling
Manure has a rich history of use as a valuable fertilizer and is a well-known amendment that can improve the soil’s chemical, physical and biological properties through the addition of valuable nutrients and organic matter. As the waste products of animal metabolism, manure contains a wide variety of nutrients which can be beneficial additions to soil. Animals are a part of the natural nutrient cycle. Livestock species consume organic matter to fulfill their nutrient and energy requirements for maintenance and production. Excess nutrients and metabolic wastes are excreted as manure.
Manure samples often contain the waste manure of the animal, bedding, feed waste, water, hair and soil from the animal’s environment. This leads to a high variation of nutrient contents between manure samples. In addition to variations in sampling material, nutrient content of manure varies greatly with animal diet, species, production stage, management and care. For example, feeding strategies for beef cattle differ by production stage and season. During the last third of gestation and peak lactation, protein requirements for the cow increase. Most producers attempt to match the forage protein content with those increase requirements, thus producers aim to calve in the spring when young grasses are highest in protein content. However, some producers may over supplement or under feed, resulting in higher nitrogen content of the resulting manure or lower nitrogen content respectively. This concept is true of other nutrients that may be found in mineral supplements; higher mineral intake produces higher mineral manure concentrations.
Analyzing manure and compost samples is the best way to ensure the proper application of the soil amendment to meet crop production needs. This is extremely important for proper nutrient management planning. A combination of manure or compost testing, soil testing and calibrating the manure spreader ensures proper nutrients are being applied. Although table and book values are available, these should only serve as a starting point for planning purposes. These values are based on an averaged value from a large data set of common manure or compost types. Often, these values will not represent the actual nutrient content of your soil amendment. Manures and composts can vary in composition and nutrient content. In addition, the various management practices associated with handling, storage, duration, weather, application amount and technique can all dramatically impact your soil amendment. Testing manure and compost samples is the only way to get farm specific nutrient content and will reduce chances for misapplication while maximizing the efficiency of your soil amendment. Proper application of manure can provide short - and long - term benefits to the soil.
What is Compost?
Compost is the process of converting organic material into a stable, humus-like product through microbial activity. By controlling the temperature, moisture, pH, organic inputs and oxygen of a compost pile, microbial decomposition can be accelerated to create a high-quality soil amendment that can provide numerous soil benefits. Applying organic matter in the form of compost can enhance aggregate stability, water holding capacity, increase soil nutrients and provide a strengthened, diverse microbial community. Increased microbial diversity in the soil supports the greater chance of the soil containing beneficial microbes that can help suppress the growth of pathogens and better cycle a wider variety of nutrients in the soil. In addition, properly composted material contains less volume and weight, making transportation easier and more cost effective.

Raymond C. Ward, Ph.D., Certified Professional Soil Scientist
Manure › 133
Compost is often created from a mixture of manure and plant material. This provides an inoculation of microorganisms from manure to kickstart a fast decomposition process, under ideal levels of moisture and oxygen. The quality of compost is dependent on the manure type, organic material input, C:N ratio, and management factors such as temperature and moisture. A high-quality compost begins by using high quality organic inputs that are free from pollutants and other undesirable material such as plastics or glass. The starting mixture of a compost should ideally have a C:N ratio between 25:1 and 35:1.
Compost maturity influences the type and characteristics of the compost, which ultimately impacts nutrients available for plant growth and soil fertility. Young compost frequently contains high levels of ammonium (NH4-N). However, if input material is high in complex carbon compounds (lignin), it can immobilize available nitrogen in the soil for a period requiring additional N fertilizer amendments. Young plant material compost can still contain phytotoxic chemicals, that could be poisonous to plants. Applying young compost should be done sparingly and with the understanding of the potential impacts of the compost. Mature compost contains fully decomposed products (except for some woody fragments) and has a crumbly appearance. Inorganic nitrogen is mostly present in this compost as nitrate (NO3-N) and can be successfully used in large quantities in nutrient management planning or as a component of growing media.
Composting and vermicomposting should not be confused, although both are often referred to as ‘compost’. Vermicomposting includes the addition of specific earthworm species to help fragment organic material and increase surface area of the organic material, allowing more microbial action to occur. Even with the addition of earthworms, decomposition is still achieved by microbes, although this may take place in the earthworm gut and castings. Earthworm species are selected based on their ability to quickly digest organic matter, withstand the compost temperature conditions, reproduce quickly, and their ease of handling. For vermicomposting, two phases (compared to the four phases discussed below) are common: 1) active phase, where earthworm activity is responsible for ingestion and processing organic material while microbes begin the decomposition process and 2) maturation, when the earthworms move to areas of undigested organic material and microbes complete the decomposition process. Vermicomposting most notably differs from compost in temperatures. Vermicomposting does not reach the high temperature values that composting does because earthworms cannot tolerate the higher temperatures. Inability to reach these temperatures in vermicomposting increases the chance of pathogenic microbes surviving and potentially transferring to the soil.
Role of Microorganisms in Composting
Microorganisms are critical components in a proper composting system. Temperature, an important factor in composting, influences the presence and activity of individual microbes who, in turn, shape the soil microbial community. Thus, microbial community compositions and activities change as temperature changes, allowing successful decomposition of a wide variety of organic materials. There are typically four phases to composting: 1) the mesophilic stage, 2) the thermophilic phase, 3) the cooling phase and 4) the curing phase (See Figure 7-1 below).

Raymond C. Ward, Ph.D., Certified Professional Soil Scientist
Manure › 134
Figure 21: Phases of Composting
Mesophilic Phase
Once physically chopped organic material has been added to the system, a group of organisms, known as mesophiles, begin consuming easily accessible nutrients such as sugars and starches. Mesophilic organisms operate best at temperatures ranging from 68 to113°F (20 to 45°C). As these microbes continue breaking down the organic material, heat is release as a by-product and the compost pile begins to heat rapidly.
Thermophilic Phase
As temperature continues to increase, the microbial community shifts from mesophilic to thermophilic microorganisms. This transition begins at 105°F and temperatures continue rapidly increasing to 130 to150°F, often within the first 24 to 72 hours. This stage is sometimes referred to as the active phase because the greatest amount of decomposition occurs during this phase. High temperatures cause proteins to denature (or breakdown), cell walls to melt, and convert toxic compounds into harmless products; killing pathogens, weed seeds and phytotoxic compounds that can exist in compost. This phase is maintained until the bulk of the organic material has been transformed. It is important to monitor temperatures closely as temperature greater than 160°F can kill thermophilic microorganisms and excessive heat can cause a fire.
Cooling Phase
Decomposition of other residues will continue but as activity declines, temperature will begin decreasing. As the compost pile begins to cool, turning or mixing the pile can result in a temperature spike due to redistribution of undecomposed material and a replenished oxygen supply within the pile. Once no temperature spikes occur after mixing, the compost will continue to cool.
(Image Adapted from Fischer 2012)

Raymond C. Ward, Ph.D., Certified Professional Soil Scientist
Manure › 135
Curing Phase
As temperatures continue declining, mesophilic microorganisms begin to recolonize the compost pile. As the pile matures, decomposition and transformation of organic matter continues to create more stable nutrients suitable for plant use.
Mature compost piles often have C:N ratios of 25:1 to 40:1. The nutrient content and time to curing are dependent on the composting style and input material used. Lignin rich material, such as woody materials, are harder to breakdown and are less nutrient rich than non-lignin material, such as plant tissue. Thus, nutrient content in compost can vary greatly and will need to be tested prior to application to ensure nutrients are balanced for your intended crops. For most commercial composting, compost cures within 1 to 4 months. For homemade compost piles, compost curing can take as long as 6 to 12 months.
Immature compost can have high C:N ratios, extreme pH values, high salt and high organic acids concentrations. Applying immature compost can be harmful to plants. Mixtures with unsuitable C:N materials, lack of oxygen and improper moisture contents can make temperature control difficult. If compost temperatures become too high, microorganism diversity will be limited, and decomposition rates will decrease.
Nitrogen in Composting
Nitrogen in compost is normally in an organic form, which is inaccessible to plants. Mineralization, or the transformation of organic N to inorganic N, requires the action of microbes to convert organic N into the three dominant forms of inorganic N in compost - ammonium (NH4-N), nitrite (NO2-N) and nitrate (NO3-N). Initial organic matter decomposition releases NH4-N, which is soluble in water or, in low moisture situations, can be lost as a gas (NH3). During the curing phase of composting, the conversion of NH4-N to NO2-N to NO3-N is occurring through nitrification. If oxygen becomes limited during this phase, microorganisms can access the oxygen in NO3-N, transforming it back into nitrite (NO2-N), which is toxic for plants, or nitrous gas (N2O). Denitrification, or the reduction of NO3-N, can occur at the final stages of curing if enough air is not supplied to the compost.
A compost with no inorganic N can be caused by using a large quantity of C rich material or mismanagement of the compost pile. Immobilization of N is caused by microbial uptake, making the N inaccessible to plants. Insufficient N in compost can disrupt proper composting. If compost that is N deficient is applied to a field, other forms of N need to be applied to meet the plants requirements. Table 7-1 below highlights the interpretation and recommendations for compost use based on N mineralized relationships.
Table 81: Interpreting N Mineralization in Compost
NH4-N NO2-N NO3-N Interpretation
- - - No available N. Mixture too rich in carbon, or all NH4-N was lost because of lack of moisture. If the compost is carbon: risk of nitrogen immobilization in the field. Recommendation: mix N-rich material to the mixture (digestate, chicken litter, etc.)
++ / +++ - - Young compost (or digestate). Nitrification has still not started. Recommendation: keep the mixture moist enough to avoid NH4-N losses and allow nitrification
++ / +++ ++ + / ++ Nitrification process starting. Recommendation: keep the mixture sufficiently moist to avoid NH4-N losses; make sure that the oxygen supply to the mixture is constantly sufficient.
+ + / ++ ++ / +++ Nitrification process is progressing. Recommendation: make sure that the oxygen supply to the mixture is constantly sufficient.
- - ++ / +++ Nitrification process achieved. Recommendation: make sure that the oxygen supply in the mixture is constantly sufficient. Compost is mature and ready to be used
- ++ / +++
++ Oxygen starvation problem. Recommendation: improve aeration of the compost
-: none (< 10 mg N/kg DM) +++: high quantity (> 200 mg N/ kg DM) +: low quantity (10-50 mg N/kg DM) (Table from Fuchs 2016) ++: medium quantity (50 – 200 mg N/kg DM)

Raymond C. Ward, Ph.D., Certified Professional Soil Scientist
Manure › 136
Collecting Representative Samples
Collecting a representative manure or compost sample for laboratory analysis is the single most important factor that impacts the accuracy of your results. Differences in manure type, handling strategies, storage and application method can cause difficulty in collecting a representative sample of your manure. Generalized guidelines for collecting representative manure samples with lower variation is outlined below.
Sample Type
In general, sampling directly from bedded packs or unagitated liquid manure storage facilities is not recommended. Proper manure nutrient management based on poorly sampled systems will be detrimental to the accuracy of your results and can be unfavorable for your manure program.
Solid Manure - Dairy, Beef, Swine, Poultry
Because manure compositions can vary greatly between piles due to several factors (cattle type, bedding time, age of manure, etc.), select piles that are most representative of your sample. Take several subsamples to minimize variability. We suggest a minimum of 8 subsamples for a composite sample. Samples can be taken from 0-12” at several spots throughout the pile or collected randomly while loading spreaders. At minimum, one pound, or two generous cups, of sample should be sent to the lab for analysis.
Other methods of sampling manure include:
1. Taking multiple samples while loading several spreader loads. 2. Sampling while spreading. 3. Sampling poultry litter in the chicken house - make sure to collect samples to the depth of litter removal
throughout the chicken house. 4. Sampling stockpiled litter.
Liquid Manure/ Slurry
Liquid manure and slurry samples taken from liquid storages or lagoons need to be properly agitated prior to sampling. Well agitated systems greatly reduce variability. According to research, manure that has been agitated for 2 to 4 hours prior to sampling and application has higher consistency of nutrients and solid concentrations. This can be attributed to nutrient stratification that can occur in these systems. Mobile nutrients, such as nitrogen and potassium, are concentrated in the top liquid layer while immobile nutrients, such as phosphorus, are more concentrated in the bottom solids. Collection of slurry samples can be difficult. Sampling liquid manure is easiest during land application but if analysis prior to application is desired, samples can be taken from the liquid storage facilities using a probe or tube method during or immediately after agitation.
Compost
A properly composted pile has undergone a lengthy decomposition process that ultimately yields stable, humus-like end products. Sampling compost piles should include samples taken at a depth of 0-12” at six locations throughout the compost pile. The sample from a compost pile should be uniform.

Raymond C. Ward, Ph.D., Certified Professional Soil Scientist
Manure › 137
Sample Timing
For best results, manure sampling and analysis should be done as close to land application as possible to ensure proper nutrient application rates are being met. This will also help ensure that samples are well mixed and representative. If this is not feasible for your operation, samples can be taken prior to application with the understanding that the nutrient concentration of the manure may have changed due to storage and handling losses depending on the amount of time between the sampling event and application. Timing is more important for manure than compost because of the volatile organic compounds and ammonium that may be present in manure. Compost piles have already undergone many decomposition processes and, thus, contain more stable compounds that are less likely to change significantly over weeks or even months. Manure sampling should occur 1 to 2 weeks prior to application while compost sampling may be tested 1 to 2 months prior to application.
Storage and Shipping
All solid manure, liquid manure and compost samples should be representative of at least eight sampling. These subsamples should be well mixed and placed in a one-gallon, heavy-duty plastic bag. Squeeze excess air out if possible. Close and seal the sample. Place sealed samples in a second or even a third plastic bag to prevent spillage and odor. If submitting a liquid sample, be sure the sampling containers are never more than three quarters full to allow room for gas expansion. Be sure to securely tape the top of the container and place in a Ziploc bag to prevent sample loss during transport. Keep manure samples cool (not frozen) until the samples can be delivered to the laboratory. Clearly mark the bags with a waterproof pen. The use of felt-tip pens or pencils can smear if exposed to water or during shipping.
Labeling Manure Samples
When submitting samples, fill out our manure submittal sheet with your full name, address, phone number, desired analysis, and if you would like your results emailed to you, include your email address. Clearly label each bag and be sure the sample identification matches that on the manure information submittal sheet that you submit along with the sample or samples. Manure sample submittal sheets can be found at www.wardlab.com.
Understanding Your Results
Nutrients in Manure
The rate at which decomposition occurs in the soil is dependent on manure characteristics such as quality, composition, the microbial community structure, and environmental factors such as precipitation, temperature and time. This rate causes manure to act like a slow release fertilizer, ensuring all the nutrients are not lost during initial application or shortly after. For instance, through nitrogen mineralization in the soil, organic nitrogen in the manure must be converted to nitrate through microbial action. This process can take three to four years to convert all organic nitrogen to plant available forms.
Manure Conversions
A manure analysis report often provides a “First Year Availability” value to help you understand and apply the correct quantity of nutrients needed for your crop. These manure mineralization approximated values are calculated based on similar mineralization rates found in research for each manure type. If you like to apply manure in the fall but are concerned about potentially losing nutrients due to soil moisture and microbial activity, consider incorporating cover crops into your rotation to help cycle nutrients in the soil. As they breakdown in the winter and spring, they will release the nutrients consumed from your manure application while supporting a healthy, thriving soil microbial community.
For your convenience, each manure sample report includes four reporting values: analysis on a dry basis, lbs/ton on a dry basis, lbs/ton on an “as is” basis and lbs/ton of the nutrient available in the first year. Although these values are automatically calculated for you, the calculations are based on the following equations:

Raymond C. Ward, Ph.D., Certified Professional Soil Scientist
Manure › 138
𝑁𝑢𝑡𝑟𝑖𝑒𝑛𝑡, "as is" 𝑏𝑎𝑠𝑖𝑠 = 𝑁𝑢𝑡𝑟𝑖𝑒𝑛𝑡 ′𝑑𝑟𝑦 𝑏𝑎𝑠𝑖𝑠′ 𝑥 (𝐷𝑟𝑦 𝑀𝑎𝑡𝑡𝑒𝑟/100) 𝑝𝑝𝑚 𝑡𝑜 𝑙𝑏𝑠/𝑡𝑜𝑛 = 𝑝𝑝𝑚 𝑥 0.002
𝑁𝑢𝑡𝑟𝑖𝑒𝑛𝑡 % 𝑡𝑜 𝑙𝑏𝑠/𝑡𝑜𝑛 = 𝑁𝑢𝑡𝑟𝑖𝑒𝑛𝑡 % 𝑥 20 𝐹𝑖𝑟𝑠𝑡 𝑌𝑒𝑎𝑟 𝑁𝑢𝑡𝑟𝑖𝑒𝑛𝑡 𝐴𝑣𝑎𝑖𝑙𝑎𝑏𝑖𝑙𝑖𝑡𝑦, 𝑙𝑏𝑠/𝑡𝑜𝑛 = 𝑙𝑏𝑠/𝑡𝑜𝑛 𝑥 (𝑁𝑢𝑡𝑟𝑖𝑒𝑛𝑡 𝐹𝑎𝑐𝑡𝑜𝑟/100)
See Table 7-2 and Table 7-3 for manure nutrient conversion factors.
Table 82: Organic N Conversion Factor for Various Manure Sources
Manure Source Organic N Conversion Factor
Swine 50
Beef 25
Poultry 35
Compost 20
Dairy 35
Table 83: Conversion Factors for Manure Nutrients
Nutrient Factor
Ammonium 95
Nitrate 100
Phosphorus 70
Potassium 90
Sulfur 40
Calcium 70
Magnesium 70
Sodium 100
Zinc 70
Iron 70
Manganese 70
Copper 70
Soluble Salts 100
Boron 100
Chloride 100
Aluminum 70
Carbon 100
Molybdenum 70

Raymond C. Ward, Ph.D., Certified Professional Soil Scientist
Manure › 139
ADDITIONAL RESOURCES:
» Wagner, T., Schmitt, M., Clanton, C., and Bergsrua, F. 1994. Manure sampling and testing. University of Minnesota, Extension Service. FE-6523-B.
» Martin, J. and Beegle, D. Manure sampling for nutrient management planning. Penn State Extension Service. AF-69.
» Moore, A., de Haro-Marti, M., and Chen, L. 2015. Sampling dairy manure and compost for nutrient analysis. Pacific Northwest Extension Publication. PNW 673.
» Chen,L., de Haro-Marti, M., Moore, A., and Falen, C. 2011 . The composting process. University of Idaho Extension. CIS 1179.
» Fuchs, J. G., Janmaat, L., and Raviv, M. 2016. What control measures do we need for compost production and use. In Handbook for composting and compost use in organic horticulture. BioGreenhouse COST Action FA 1105.
» Fischer, D. and Glaser, B. 2012. Synergisms between Compost and Biochar for Sustainable Soil Amelioration. In Management of Organic Waste.
Table 84: Average Nutrient Content of Swine Manure
Analysis Dry Basis Lbs/Ton Dry Basis Lbs/Ton as Is Basis First Year Nutrient Availability, lbs/Ton
Median CI 95% Median CI 95% Median CI 95% Median CI 95%
Organic Nitrogen, % N 1.47 0 – 5.64 29.45 0 – 112.90 14.10 0 – 53.68 7.00 0 – 26.84
Ammonium, % N 0.04 0 – 3.45 0.75 0 – 69.24 0.40 0 – 6.16 0.40 0 – 5.85
Nitrate, ppm N 0.00 0 – 0.42 0.02 0 – 8.30 0.02 0 – 7.24 0.02 0 – 7.24
Total N (TKN), % N 1.61 0 – 8.94 32.02 0 – 178.63 15.72 0 – 60.22 8.71 0 – 34.2
Phosphorus, % P2O5 2.35 0 – 16.80 46.90 0 – 335.98 33.20 0 – 162.33 23.20 0 – 113.62
Potassium, % K2O 0.80 0 – 4.21 15.90 0 – 84.24 9.70 0 – 39.74 8.70 0 – 35.77
Sulfur, % S 0.45 0 – 1.21 9.00 0 – 24.17 6.00 0 – 13.66 2.40 0 – 5.46
Calcium, % Ca 3.06 0 – 13.78 61.10 0 – 275.65 35.75 0 – 151.88 25.00 0 – 106.32
Magnesium, % Mg 0.73 0 – 2.05 14.60 0 – 41.01 9.90 0 – 21.13 6.95 0 – 14.79
Sodium, % Na 0.17 0 – 0.83 3.40 0 – 16.50 1.80 0 – 7.74 1.80 0 – 7.74
Zinc, ppm 289.25 0 – 2742.25 0.60 0 – 5.49 0.40 0 – 2.51 0.30 0 – 1.75
Iron, ppm 6684.10 0 – 17673.55 13.40 0 – 35.35 6.30 0 – 21.67 4.40 0 – 15.17
Manganese, ppm 367.55 0 – 2.05 0.70 0 – 2.59 0.40 0 – 1.39 0.30 0 – 0.98
Copper, ppm 58.45 0 – 1290.50 0.12 0 – 1.68 0.10 0 – 0.60 0.10 0 – 0.44
Boron, ppm 13.95 0 – 47.83 0.03 0.05 – 0.10 0.02 0 – 0.06 0.02 0 – 0.06
Soluble Salts, mmho/cm
16.99 0 – 301.94
pH 7.40 5.56 – 9.39
Dry Matter % 61.83 12.12 – 100
Moisture, % 38.18 0 – 87.88
Medians based on over 342 samples processed between 2013 – 2017. Confidence Intervals (CI) are expressed as two standard deviations from the mean.

Raymond C. Ward, Ph.D., Certified Professional Soil Scientist
Manure › 140
Table 85: Average Nutrient Content for Beef Manure
Analysis Dry Basis Lbs/Ton Dry Basis Lbs/Ton as Is Basis Lbs Available/Ton First Year Availability
Median CI 95% Median CI 95% Median CI 95% Median CI 95%
Organic Nitrogen, % N 1.15 0 – 2.77 23.00 0 – 55.40 13.20 0 – 33.55 3.30 0 – 8.39
Ammonium, % N 0.05 0 – 0.66 1.00 0 – 13.10 0.60 0 – 5.82 0.60 0 – 5.53
Nitrate, ppm N 0.00 0 – 0.14 0.00 0 – 2.84 0.00 0 – 1.70 0.00 0 – 1.70
Total N (TKN), % N 1.24 0 – 3.16 24.90 0 – 63.13 14.30 0 – 37.23 4.20 0 – 12.73
Phosphorus, % P2O5 1.73 0 – 6.09 34.70 0 – 121.80 20.90 0 – 71.27 14.60 0 – 49.89
Potassium, % K2O 1.60 0 – 3.50 31.90 0 – 69.92 19.30 0 – 46.00 17.30 0 – 41.40
Sulfur, % S 0.44 0 – 1.07 8.80 0 – 21.40 5.30 0 – 15.16 2.10 0 – 6.06
Calcium, % Ca 2.02 0 – 6.85 40.40 0 – 137.00 24.00 0 – 86.74 16.80 0 – 60.72
Magnesium, % Mg 0.67 0.08 – 1.29 13.40 1.62 – 25.71 8.00 0.98 – 15.63 5.60 0 – 10.94
Sodium, % Na 0.24 0 – 0.64 4.80 0 – 12.82 2.90 0 – 7.75 2.90 0 – 7.75
Zinc, ppm 215.40 0 – 1057.62 0.43 0 – 2.11 0.26 0 – 1.17 0.18 0 – 0.82
Iron, ppm 7746.55 0 – 17650.87 15.48 0 – 35.30 9.55 0 – 23.16 6.69 0 – 16.21
Manganese, ppm 350.7 0 – 969.20 0.70 0 – 1.94 0.43 0 – 1.22 0.30 0 – 0.85
Copper, ppm 42.10 0 – 298.99 0.09 0 – 0.60 0.05 0 – 0.27 0.03 0 – 0.19
Boron, ppm 13.60 0 – 53.35 0.03 0 – 0.11 0.02 0 – 0.09 0.09 0 – 0.09
Soluble Salts, mmho/cm
24.85 0 – 78.56
pH 7.50 5.84 – 9.17
Dry Matter % 64.47 27.64 – 96.30
Moisture, % 35.52 3.74 – 72.28
Medians based on over 10,516 samples processed between 2013 – 2017. Data analyzed by E. Shafto, 2018 Confidence Intervals (CI) are expressed as two standard deviations from the mean.

Raymond C. Ward, Ph.D., Certified Professional Soil Scientist
Manure › 141
Table 86: Average Nutrient Content for Poultry Manure
Analysis Dry Basis Lbs/Ton Dry Basis Lbs/Ton as Is Basis Lbs Available/Ton First Year Availability
Median CI 95% Median CI 95% Median CI 95% Median CI 95%
Organic Nitrogen, % N 3.50 1.03 – 6.18 70.00 20.60 – 123.63 43.70 0.72 – 88.80 15.30 0.25 – 31.08
Ammonium, % N 0.37 0 – 0.97 7.40 0 – 19.45 4.20 0 – 13.02 4.00 0 – 12.37
Nitrate, ppm N 0.00 0 – 0.23 0.02 0 – 4.64 0.01 0 – 3.96 0.01 0 – 3.96
Total N (TKN), % N 3.96 1.12 – 6.95 79.20 22.31 – 139.52 48.1 0 – 100.12 19.51 0 – 43.08
Phosphorus, % P2O5 4.16 1.30 – 7.47 83.15 26.05 – 149.45 54.60 6.48 – 102.18 38.20 4.54 – 71.53
Potassium, % K2O 3.47 1.21 – 5.89 69.40 24.15 – 117.89 44.75 4.36 – 84.88 40.30 3.92 – 76.39
Sulfur, % S 0.89 0.18 – 1.79 17.7 3.54 – 35.79 11.20 0 – 26.77 4.50 0 – 10.71
Calcium, % Ca 7.31 0 – 19.18 146.15 0 – 383.51 64.45 0 – 248.08 45.10 0 – 173.65
Magnesium, % Mg 0.71 0.19 – 1.32 14.20 3.71 – 26.42 9.40 1.39 – 17.22 6.60 0.97 – 12.06
Sodium, % Na 0.55 0 – 1.31 11.00 0 – 26.29 6.80 0 – 19.43 6.80 0 – 19.43
Zinc, ppm 500.65 0 – 1186.70 1.00 0 – 2.37 0.70 0 – 1.50 0.50 0 – 1.05
Iron, ppm 1114.85 0 – 5247.96 2.20 0 – 10.49 1.40 0 – 6.75 1.00 0 – 4.72
Manganese, ppm 509.45 52.23 – 1069.78 1.00 0.11 – 2.14 0.70 0 – 1.51 0.50 0 – 1.06
Copper, ppm 78.10 0 – 635.22 0.16 0 – 1.28 0.10 0 – 0.83 0.09 0 – 0.58
Boron, ppm 43.55 0 – 132.92 0.09 0 – 0.27 0.06 0 – 0.19 0.06 0 – 0.19
Soluble Salts, mmho/cm 65.32 20.78 – 108.99
pH 6.60 5.46 – 7.98
Dry Matter % 66.10 25.72 – 98.83
Moisture, % 33.90 1.17 – 74.28
Medians based on over 858 samples processed between 2013-2017. Data analyzed by E. Shafto, 2018 Confidence Intervals (CI) are expressed as two standard deviations from the mean.

Raymond C. Ward, Ph.D., Certified Professional Soil Scientist
Manure › 142
Table 87: Average Nutrient Content of Compost
Analysis Dry Basis Lbs/Ton Dry Basis Lbs/Ton as Is Basis Lbs Available/Ton First Year Availability
Median CI 95% Median CI 95% Median CI 95% Median CI 95%
Organic Nitrogen, % N 1.14 0 – 3.90 22.90 0 – 78.07 16.40 0 – 61.61 3.30 0 – 12.33
Ammonium, % N 0.04 0 – 1.38 0.70 0 – 27.67 0.50 0 – 26.56 0.50 0 – 25.24
Nitrate, ppm N 0.00 0 – 1.24 0.04 0 – 24.85 0.03 0 – 21.59 0.03 0 – 21.59
Total N (TKN), % N 1.22 0 – 4.85 24.32 0 – 96.98 17.52 0 – 79.49 4.28 0 – 42.58
Phosphorus, % P2O5 1.67 0 – 8.60 33.40 0 – 171.98 25.90 0 – 156.42 18.10 0 – 109.52
Potassium, % K2O 1.75 0 – 6.56 35.10 0 – 131.13 26.30 0 – 115.40 23.65 0 – 103.86
Sulfur, % S 0.47 0 – 2.70 9.50 0 – 53.93 7.20 0 – 45.15 2.90 0 – 18.06
Calcium, % Ca 2.07 0 – 9.21 41.45 0 – 184.11 28.50 0 – 153.80 20.00 0 – 107.66
Magnesium, % Mg 0.55 0 – 2.00 10.90 0 – 40.08 8.30 0 – 31.34 5.80 0 – 21.94
Sodium, % Na 0.24 0 – 1.06 4.90 0 – 21.21 3.70 0 – 17.00 3.70 0 – 17.00
Zinc, ppm 168.30 0 – 705.53 0.30 0 – 1.42 0.30 0 – 1.12 0.20 0 – 0.79
Iron, ppm 5404.90 0 – 13435.05 10.80 0 – 26.87 8.10 0 – 18.78 5.70 0 – 13.15
Manganese, ppm 195.90 0 – 974.98 0.40 0 – 1.97 0.30 0 – 1.49 0.20 0 – 1.05
Copper, ppm 32.50 0 – 260.38 0.07 0 – 0.52 0.05 0 – 0.30 0.10 0 – 0.21
Boron, ppm 15.10 0 – 53.43 0.03 0 – 0.11 0.02 0 – 0.08 0.10 0 – 0.08
Soluble Salts, mmho/cm 28.89 0 – 133.79
pH 7.40 5.41 – 9.42
Dry Matter % 75.23 42.57 – 100.00
Moisture, % 24.77 0 – 57.41
Medians based on over 2,327 samples processed between 2013-2017. Data analyzed by E. Shafto, 2018 Confidence Intervals (CI) are expressed as two standard deviations from the mean.

Raymond C. Ward, Ph.D., Certified Professional Soil Scientist
Manure › 143
Table 88: Average Nutrient Content of Dairy Manure
Analysis Dry Basis Lbs/Ton Dry Basis Lbs/Ton as Is Basis Lbs Available/Ton First Year as Is Basis
Median CI 95% Median CI 95% Median CI 95% Median CI 95%
Organic Nitrogen, % N 1.38 0 – 2.89 27.60 0 – 57.81 8.80 0 – 27.04 3.10 0 – 9.47
Ammonium, % N 0.02 0 – 0.25 0.40 0 – 5.02 0.10 0 – 1.26 0.10 0 – 1.19
Nitrate, ppm N 0.00 0 – 0.05 0.02 0 – 1.00 0.01 0 – 0.60 0.01 0 – 0.60
Total N (TKN), % N 1.44 0 – 3.00 28.70 0 – 59.90 9.00 0 – 27.69 3.30 0 – 10.15
Phosphorus, % P2O5 0.90 0 – 2.86 17.95 0 – 57.14 6.30 0 – 25.41 4.40 0 – 17.79
Potassium, % K2O 1.58 0 – 4.28 31.45 0 – 85.49 10.35 0 – 43.56 9.35 0 – 39.21
Sulfur, % S 0.34 0 – 0.81 6.80 0 – 16.22 2.10 0 – 8.40 0.80 0 – 3.36
Calcium, % Ca 1.72 0 – 5.18 34.30 0 – 103.50 11.60 0 – 55.44 8.10 0 – 38.81
Magnesium, % Mg 0.56 0 – 1.46 11.05 0 – 29.10 3.70 0 – 15.59 2.60 0 – 10.91
Sodium, % Na 0.30 0 – 0.97 6.00 0 – 19.31 1.85 0 – 11.21 1.85 0 – 11.21
Zinc, ppm 122.75 0 – 530.97 0.24 0 – 1.06 0.10 0 – 0.43 0.10 0 – 0.31
Iron, ppm 3448.10 0 – 12216.37 6.90 0 – 24.43 3.15 0 – 13.11 2.20 0 – 9.17
Manganese, ppm 195.05 0 – 766.28 0.40 0 – 1.53 0.20 0 – 0.80 0.10 0 – 0.56
Copper, ppm 35.75 0 – 401.34 0.07 0 – 0.80 0.03 0 – 0.22 0.02 0 – 0.15
Boron, ppm 18.20 0 – 43.56 0.04 0 – 0.09 0.01 0 – 0.05 0.01 0 – 0.05
Soluble Salts, mmho/cm
27.59 0 – 78.72
pH 8.40 6.33 – 10.14
Dry Matter % 39.08 1.10 – 86.68
Moisture % 60.46 13.16 – 98.91
Medians based on over 344 samples processed in 2013-2017. Data analyzed by E. Shafto, 2018 Confidence Intervals (CI) are expressed as two standard deviations from the mean.

Water › 144
WATER

Raymond C. Ward, Ph.D., Certified Professional Soil Scientist
Water › 145
Irrigation Water Quality and Interpretation
Irrigation water quality is dependent on its chemical composition. The concentration of mineral constituents in the water varies depending on the number of soluble ions encountered by the water. These soluble constituents are called soluble salts. If soluble salts are high, they may be detrimental to plants. The most common soluble salts are the cations: sodium (Na), calcium (Ca), magnesium (Mg) and potassium (K), and the anions: carbonate (CO3), bicarbonate (HCO3), chloride (Cl), sulfate (SO4) and nitrate (NO3).
The total soluble salt level is determined by the electrical conductivity reading. Since cations are positively charged and anions are negatively charged, they will conduct an electric current. The more ions present the more readily it will conduct an electric current which is calibrated to give soluble salt readings in millimhos per centimeter (mmho/cm).
The higher the electrical conductivity reading the higher the salinity hazard. The salinity hazard interpretation can be found in Table 9-1 below.
Table 89: Salinity Hazard Interpretation Guide
Electrical Conductivity (mmho/cm) Interpretation
< 0.75 No problems - little chance for increased salinity.
0.76 – 1.50 There may be some detrimental effects on crops such as field beans, lettuce, bell pepper, onion and carrots
1.51 – 3.00 Water may have adverse effects on many crops. Salinity will increase without adequate leaching.
3.00 – 7.50 Water can be used for salt tolerant crops on permeable soils. High leaching requirement is necessary.
In addition to the soluble salts, one must analyze the sodium level in the water. The presence of high sodium can reduce water infiltration into the soil. The sodium hazard of irrigation water is estimated by calculating the sodium adsorption ratio (SAR).
If sodium is the predominant cation in the irrigation water, continual use of the water will adversely affect the physical condition of the soil. Sodium replaces exchangeable calcium and magnesium, causing dispersion of the clay. This dispersion destroys soil aggregates, so the soil appears slick when wet and very hard when dry. In addition to reduced permeability other problems are slow seed germination, less soil aeration and more difficult disease and weed control due to surface water ponding and stagnation.
Permeability problems are also related to the carbonate and bicarbonate content of the irrigation water. When soils dry, part of the calcium and magnesium is precipitated as Ca-Mg carbonates (lime). This removes Ca and Mg from the soil water and increases the sodium hazard. Recent research has developed a method for evaluating the carbonate-bicarbonate effect on the sodium hazard. The new procedure employs a modification of the SAR and is called the adjusted SAR (adj SAR).

Raymond C. Ward, Ph.D., Certified Professional Soil Scientist
Water › 146
Table 90: Interpretation of Adjusted SAR for Various Soil Types
Soil Clay Type Adjusted SAR Permeability Interpretation
Montmorillonite < 6 No problem
Illite – Vermiculite < 8
Montmorillonite 6 – 9 Increasing problem. Special cropping practices may be necessary for long term production. Sodium levels in soil should be monitored by soil test. Illite – Vermiculite 8 – 16
Montmorillonite > 9 Severe problem. Special cropping practices will have to be followed for long term productivity. Soil amendments may have to be used or water supply changed. Illite – Vermiculite > 16
In addition to the salinity and sodium hazards of irrigation water, chloride, bicarbonate and boron are potential hazards.
Table 91: Potential Hazards to Irrigation Water Quality
Potential Hazards Content Interpretation
Chloride (ppm Cl)
< 140 No Problem
140 – 350 Increasing Problem
> 350 Severe problem
Bicarbonate (ppm HCO3)
< 180 No Problem
180 – 520 Increasing Problem
> 520 Severe Problem
Boron (ppm B)
< 0.75 No Problem
0.75 – 2.0 Increasing Problem
> 2.0 Severe Problem
Livestock Water Quality
A clean, plentiful supply of livestock water important to achieve optimum animal performance and health. Water quality is difficult to visualize and requires laboratory analysis. There are several measures of water quality which could result in poor animal health or decreased animal production performance. These parameters are total dissolved solids (TDS), electric conductivity (EC), hardness, sodium, pH, nitrates, sulfates, toxic nutrients or contaminants, and coliform bacteria.
Total Dissolved Solids (TDS) is the measure of all inorganic constituents or minerals which are dissolved in the water. The most common soluble salts found in water are combinations of sodium, calcium, and magnesium ions with sulfate, chloride and bicarbonate ions. High salinity waters can affect animal health resulting in diarrhea, excessive water intake, mineral intake imbalances, and decreased production performance.
Electrical Conductivity (EC) estimates TDS, the EC of water is related to the cations and anions dissolved in the water source. Common cations in water include calcium, magnesium, and sodium. Anions include chloride, sulfate and bicarbonate. Higher salinity water has higher EC. Animals tend to consume more high salinity water because it creates an electrolyte imbalance which is displayed through symptoms including dehydration, diarrhea, fever, decreased production such as decreased weight gains and lower pregnancy rates.

Raymond C. Ward, Ph.D., Certified Professional Soil Scientist
Water › 147
Table 92: Use of Water Containing Total Dissolved Solids
Total Dissolved Solids (EC) Comments
<1000 ppm (<1.68 mmho/cm)
Safe for all livestock classes.
1000 – 2999 ppm (1.68 – 5.0 mmho/cm)
Satisfactory for most livestock. Swine and cattle unacclimated to higher TDS water may exhibit temporary diarrhea. May cause decreased gain or death with poultry.
3000 – 4999 ppm (5.0 – 8.33 mmho/cm)
Satisfactory for some livestock. Swine and cattle may refuse water and exhibit diarrhea temporarily. May cause decreased gain or death with poultry.
5000 – 6000 ppm (5.0 – 10.0 mmho/cm)
Reasonable for some livestock. Do not use for pregnant or lactating livestock. Do not expect optimum performance Unacceptable for poultry.
>6000 ppm (>10.0 mmho/cm)
Reasonable for some livestock Diarrhea and increased water intake in swine Do not use for pregnant or lactating livestock Do not expect optimum performance Unacceptable for poultry.
>7000 ppm (>11.7 mmho/cm)
Unacceptable for all livestock use.
(NRC 1974, 2001)
Hardness is expressed as the total calcium and magnesium ions in water reported as the calcium carbonate (CaCO3). While hardness itself is not a contributing factor in animal performance and health issues, hard water can result in excessive intake of calcium and/or magnesium which results in issues with mineral imbalances when combined with a balances diet or ration.
Table 93: Water Hardness Guidelines
Category Hardness ppm
Soft 0 – 60
Moderately Hard 61 – 120
Hard 121 – 180
Very Hard > 180
(Beef Cattle NRC 2016)
Sodium, in high concentrations in an animal’s water source, can have a diuretic effect. This leaves the animal thirsty, drinking more of the toxic water, and becoming dehydrated. Sodium also interacts with sulfates posing a greater risk if water is high in sodium sulfate. When adjusting a ration or diet to accommodate for high sodium water, a chloride deficiency may be an unintended result. Water with sodium levels greater than 50 ppm with an equivalent sulfate level should not be used for poultry. Salt in swine diets should be reduced if the sodium level in the water is greater than 400 ppm. In beef and dairy cattle, salt intake should be reduced if the water sodium concentration is greater than 800 ppm.
pH has not been well defined in livestock species, however the current NRC recommendations for beef cattle and swine is to keep pH between 6.5 – 8.5.

Raymond C. Ward, Ph.D., Certified Professional Soil Scientist
Water › 148
Nitrates are found in most all forages and occasionally in water. Nitrate itself is not toxic, but during digestion, gut bacteria reduce nitrate to nitrite, which then enters the blood stream. There, the nitrite converts the red pigment hemoglobin, which carries oxygen from lungs to tissue, to methemoglobin, a dark brown pigment which cannot carry oxygen. Nitrate poisoning is usually more of a problem in pregnant and young, especially newborn animals. Older animals seem able to tolerate higher nitrate levels. For more on animal health and nitrates refer to the Feed Testing section of the Ward Guide. High nitrate water levels are often caused by shallow water tables, leaching of nitrate from sandy soils, or under heavy N fertilization.
Table 94: Use of Water Containing Nitrates
NO3-N ppm Comments
0 – 10 Safe for consumption by all livestock species.
11 – 20 Safe in all livestock species. Ensure diet low in nitrates for ruminant animals.
21 – 40 Safe for most livestock species. Can be harmful to ruminant species over long periods of time.
41 – 100 Safe for most livestock species. Ruminants at risk; feed with very low nitrate diet. Death possible.
> 100 Safe for non-ruminant livestock species. Unsafe for ruminant livestock (cattle, goats, sheep). Death possible. Do not use as water source for affected species.
> 300 Unsafe for all livestock species. Do not use as water source.
(NRC Beef 2016, Swine 2012)
Sulfates include sodium sulfate, magnesium sulfate and calcium sulfate. These compounds have a laxative effect on animals. Waters high in sulfates pose animal health issues including diarrhea, poor average daily gains, and potential to develop a neurological disorder known as Polioencephalomalacia (PEM).
Table 95: Use of Water Containing Sulfate
SO4-S ppm Comments
< 50 Safe for all livestock species
< 500 Safe for most livestock species Not recommended for poultry
500 – 1000 Safe for most livestock species Not recommended for poultry Not recommended for young ruminants such as baby calves
1000 – 6999 Unsafe for ruminants and poultry Acceptable for swine
> 7000 Toxic to all livestock species
(NRC Beef 2016, Swine 2012, Interpretation of Water Analysis for Livestock Suitability, SDSU 2008)
Contaminants or other nutrients present in water at toxic levels may include: Aluminum, Arsenic, Beryllium, Boron, Cadmium, Cobalt, Copper, Fluorine, Lead, Manganese, Mercury, Molybdenum, Nickel, Selenium, Vanadium, and Zinc.
Coliform Bacteria are indicator organisms that illness causing microorganisms may be present in water. The Bureau of National Affairs (1973) recommends that livestock water contain less than 5,000 coliforms forming units/100ml. Coliforms such as E.coli are more commonly found in surface water.

Raymond C. Ward, Ph.D., Certified Professional Soil Scientist
Water › 149
Drinking Water Suitability
Table 8-8 below outlines common drinking water standards and the EPA’s drinking water standards. Maximum contaminant level (MCL) is defined as the level of a contaminant that is allowed in drinking water. National Secondary Drinking Water Regulations (NSDWRs) are also highlighted in the table below. These standards are non-mandatory water quality standards and are not enforced but encouraged when managing drinking water for aesthetics such as taste, color and odors. These contaminants are not considered a risk to human health.
Table 96: Drinking Water Standards
Limits Comment EPA Drinking Water Standards (MCL in mg/L)
pH 5.0 – 9.0 Safe 6.5 – 8.5*
Total Dissolved Solids 30 – 900 ppm Safe 500*
Electrical Conductivity 0.05 – 1.5 mmho/cm Safe N/A
Magnesium < 400 ppm Safe N/A
Total Hardness (ppm CaCO3)
0 – 75 Soft Water
N/A 75 – 150 Moderately Hard Water
150 – 300 Hard Water
300 + Very Hard Water
Chloride < 250 ppm Safe 250*
Total Alkalinity < 500 ppm CaCO3 No Problem N/A
Coliform Bacteria No Colonies per 100 mL Safe 0
Iron < 0.3 ppm Safe 0.3*
Manganese < 0.05 ppm Safe 0.05*
Copper < 1.0 ppm Safe 1.3
Lead < 0.015 ppm Safe 0.015
Cadmium < 0.02 ppm Safe 0.005
Fluoride 0.75 – 1.50 ppm Optimum Level for Proper Dental Care
4.0
Sulfate – Sulfur < 93 ppm SO4 – S Desirable 250*
Nitrate – Nitrogen < 10 ppm NO3 – N Safe 10
If the nitrate level is above 10 ppm there is a cause for concern. A safe alternate source of water should be found for infants under six months of age and pregnant mothers because of the danger of prenatal methemoglobinemia. This level is less critical if only adults and older children will be drinking the water. You may wish to consult with your personal physician or a health care professional before deciding on a course of action.
Boiling water will not reduce the nitrate levels.
Note: ppm is the same as mg/L Maximum Contaminant Level (MCL) * Indicates National Secondary Drinking Water Regulations (NSDWRs) NA: Not available. No EPA Drinking Water Standards are set for this contaminant.
Raymond C. Ward, Ph.D., Certified Professional Soil Scientist
Water › 150
Drinking Water: Bacteriological Testing
Total coliform analysis is the test most commonly used for the acceptance of drinking water purity. Coliforms are used to assess water quality because their detection is more reliable. Coliform bacteria are indicator organisms in water microbiological analysis. Coliforms are a group of bacteria that are readily found in soil, decaying vegetation, animal feces, and raw surface water. They are not normally present in deep groundwater and treated surface water. These indicator organisms may be accompanied by pathogens (i.e., disease-causing organisms), but do not normally cause disease in healthy individuals.
However, individuals with compromised immune systems should be considered at risk. Pathogens appear in smaller numbers than coliforms, so are less likely to be isolated. Drinking water found to contain coliforms is considered biologically contaminated.
Coliform or other bacteria in drinking or swimming water will not necessarily make you ill. However, since these organisms are present, other disease-causing organisms are more likely to be present. Health symptoms related to drinking or swallowing water contaminated with bacteria generally range from no ill effects to cramps and diarrhea (gastrointestinal distress).
Coliform Test Report Methods
The IDEXX Quanti-Tray/2000 is a semi-automated quantification method based on the Standard Methods Most Probable Number (MPN) model. The Quanti-Tray® Sealer automatically distributes the sample/reagent mixture into separate wells. After incubation, the number of positive wells is converted to an MPN using a table. Quanti-Tray/2000 counts accurately from one to 2,419 colonies/100 ml.
A. Coliform Density per 100 ml
The density per 100 ml must be 0. Samples that contain any coliform bacteria per 100 ml do not meet the bacteriological standard for purity. Coliform bacteria must be absent in a 100 ml volume sample.
B. (TNTC) Too Numerous to Count
“Too Numerous to Count” may be reported if the calculated MPN (Most Probable Number) is greater than 2,419 MPN. A replacement sample may be requested if a more accurate count is required.
For a more detailed explanation and answers to specific questions regarding the analysis itself, test results or additional microbiological questions contact Ward Laboratories, Inc.
ADDITIONAL RESOURCES:
» US EPA 9221C Standard Methods for the Examination of Water and Wastewater Surface Water Treatment, 18th Edition. Rule (40 CFR 141.74 (a) (2))
Proper Disinfection of Water Wells
The well should first be cleaned of any foreign debris. The method for accomplishing this will vary with the type of well (dug, drilled, etc.). Upon cleaning, the well should be pumped until the water yielded appears clean; then the complete water system should be disinfected.
A universal disinfecting agent used in water is chlorine. It is available in many forms; however, the two most commonly used forms are dry chlorine (calcium hypochlorite) and liquid sodium hypochlorite, commonly referred to as "household bleach", which contains approximately 5.25 % available chlorine.

Raymond C. Ward, Ph.D., Certified Professional Soil Scientist
Water › 151
Ingenuity must be used in introducing the chlorine into the well, reservoir, and piping systems, to assure proper distribution and disinfection of all parts of the water system.
One convenient way of chlorinating the water supply is to add the chlorine directly into the well. An effective hypochlorite solution can be made by adding the required amount of bleaching liquid; refer to Table 8-8. This chlorinated water should be poured into the well, washing the walls, casing, drop pipe and other equipment in the process. A hose attached to a nearby faucet should be directed back into the well, and the pump started, thereby enabling the recirculated chlorine water to contact the casing, drop pipe, etc., to assure complete disinfection of the well itself. If after a reasonable period (approximately 10 minutes) a chlorine odor is not evident, repeat the procedure until a chlorine odor is present.
After the recirculation process, the components of the well should be reassembled and the well left idle for approximately two hours. The well pump should then be started and all taps opened and flushed until a chlorine odor is evident, thus allowing for complete disinfection of the distribution system. The taps should then be closed and the remainder of the chlorinated water flushed to waste through an outdoor tap (to avoid any possible damage or overloading of the septic tank) until all traces of chlorine are gone. Once you are sure the water supply is chlorine-free, you may resample. Traces of chlorine residual will interfere with the laboratory results.
Shallow wells may remain contaminated for some time after flooding because of surface seepage; therefore, for at least two weeks after the ground has dried up, the water should be boiled or chlorinated before use. Boiling for three minutes or adding two drops of household bleach per quart to water has been found satisfactory.
Table 8-8 below outlines the quantities of liquid household bleach (5.25 percent sodium hypochlorite) or dry chlorine (65 percent calcium hypochlorite) required for water well disinfection.
Table 97: Well Water Disinfection Guidelines
For each ten feet of water depth in well.
Well Diameter (inches) 65% Hypochlorite (oz.) % Bleach (Pints)
2 – 8 1 1
10 – 14 3 3
16 – 20 7 7
22 – 26 12 12
28 – 30 16 16
36 24 24
ADDITIONAL RESOURCES:
» Recommended Water Supply Practices. Nebraska Department of Health, Division of Drinking Water and Environmental Sanitation, Lincoln, NE.

Raymond C. Ward, Ph.D., Certified Professional Soil Scientist
Water › 152
Drinking Water Sampling Procedures
Water samples should not be collected from outside hydrants, leaky faucets, or faucets with aerators or faucet filters still attached, since these may produce positive samples when the well water is actually safe.
"Flaming" of the water taps is not necessary but should be provided when practical, especially following the removal of an aerator or filter.
Containers for submitting water samples for bacterial and/or nitrate analysis and other minerals may be obtained from Ward Laboratories, Inc. Instructions for collecting water samples are included in each container. Special containers are required for biological testing. Please contact the lab for more information.
A "satisfactory" bacteriological water analysis is not a guarantee that the water supply system will continue to be safe. Water quality depends on many variables: proper well construction and location, groundwater table, soil formation, flooding, etc. It is recommended that you have your water analyzed at least annually, when repairs or alterations are made to the water supply system, or if you suspect possible contaminations of your water well.
ADDITIONAL RESOURCES:
» Recommended Water Supply Practices. Nebraska Department of Health, Division of Drinking Water and Environmental Sanitation, Lincoln, NE.

Water › 153
September 2020
Related Documents