GuideMark ® Funds GuidePath ® Funds Investment Advisor AssetMark, Inc. ANNUAL REPORT March 31, 2021 GUIDEMARK ® LARGE CAP CORE FUND GUIDEMARK ® EMERGING MARKETS FUND GUIDEMARK ® SMALL/MID CAP CORE FUND GUIDEMARK ® WORLD EX-US FUND GUIDEMARK ® CORE FIXED INCOME FUND GUIDEPATH ® GROWTH ALLOCATION FUND GUIDEPATH ® CONSERVATIVE ALLOCATION FUND GUIDEPATH ® TACTICAL ALLOCATION FUND GUIDEPATH ® ABSOLUTE RETURN ALLOCATION FUND GUIDEPATH ® MULTI-ASSET INCOME ALLOCATION FUND GUIDEPATH ® FLEXIBLE INCOME ALLOCATION FUND GUIDEPATH ® MANAGED FUTURES STRATEGY FUND GUIDEPATH ® CONSERVATIVE INCOME FUND GUIDEPATH ® INCOME FUND GUIDEPATH ® GROWTH AND INCOME FUND

Welcome message from author
This document is posted to help you gain knowledge. Please leave a comment to let me know what you think about it! Share it to your friends and learn new things together.
Transcript

GuideMark® FundsGuidePath® Funds
Investment AdvisorAssetMark, Inc.
ANNUAL REPORT
March 31, 2021
GUIDEMARK® LARGE CAP CORE FUND
GUIDEMARK® EMERGING MARKETS FUND
GUIDEMARK® SMALL/MID CAP CORE FUND
GUIDEMARK® WORLD EX-US FUND
GUIDEMARK® CORE FIXED INCOME FUND
GUIDEPATH® GROWTH ALLOCATION FUND
GUIDEPATH® CONSERVATIVE ALLOCATION FUND
GUIDEPATH® TACTICAL ALLOCATION FUND
GUIDEPATH® ABSOLUTE RETURN ALLOCATION FUND
GUIDEPATH® MULTI-ASSET INCOME ALLOCATION FUND
GUIDEPATH® FLEXIBLE INCOME ALLOCATION FUND
GUIDEPATH® MANAGED FUTURES STRATEGY FUND
GUIDEPATH® CONSERVATIVE INCOME FUND
GUIDEPATH® INCOME FUND
GUIDEPATH® GROWTH AND INCOME FUND

May 28, 2021
Dear Shareholder:
Enclosed is the Annual Report for the GuideMark® and GuidePath® Funds covering the period from April 1, 2020 to March 31, 2021.
Market Review
The 12-month reporting period covered quite an extraordinary market environment. Following the bottom of the market crash on March 23, 2020, forthe 12-month period ended March 31, 2021, the S&P 500® Index (the “S&P 500®”) saw a return of 56.4%, which ranked in the top five 12-monthreturns for the index since 1925.1 During the reporting period, the US equity market was strengthened by extensive support from the Federal Reserveand fiscal stimulus measures along with the economy starting to reopen with the development of COVID-19 vaccines. Emerging markets posted thestrongest returns for the one-year period at 58.9%, benefiting from a weaker US dollar and the pickup in economic activity.2 International developedmarkets lagged behind US and emerging markets, returning 45.2% for the year due to slower economic activity in light of ongoing headwinds from thepandemic.3
While gains across many economic sectors helped lift the returns of the S&P 500® over the one year period, returns were very uneven and included asignificant rotation half way through the year in terms of market leadership. For the first six months of the reporting period, a handful of technologystocks were the major drivers of the returns of the US equity market. The group of companies that has been coined ‘FANAMA’ – Facebook, Amazon,Netflix, Apple, Microsoft and Alphabet (Google’s parent company) – comprised over 20% of the S&P 500® but contributed over 30% to its returnduring the six-month period.4 For the last six months of the period, however, market leadership broadened as economically sensitive sectors andindustries that had fallen the most in the pandemic-related market crash started to rally strongly. Market leadership rotated into the energy and financialsectors during the six months ended March 31, 2021. Energy and financials returned 67.2% and 42.9% respectively over the six-month period endingMarch 31, 2021, compared to the S&P 500® return of 19.1%, with first half market leaders technology and consumer discretionary returning 14.0%and 11.4% respectively for the same period.5
Not only did we see the shift in market leadership from growth to value in the second half of the reporting period, we also saw a shift in market favorfrom large-caps to small-caps. Value outperformed growth by over 13 percentage points for the last six months of the period, having trailed growth byover 20 percentage points in the first six months of the period.6 Small-caps trailed large caps by 5 percentage points in the six months endedSeptember 30, 2020 but outperformed by over 35 percentage points in the six months ended March 31, 2021.7 The wide margin between small capsand large caps in the six months ended March 31, 2021 was the largest on record since 1994.8
Real Estate Investment Trusts (REITs) struggled for much of the period relative to the broad US market, but rallied strongly in the first quarter of2021, returning 8.3% compared to the 6.2% return of the S&P 500® for the same period.9 The rapid rise in interest rates helped lift the returns of thisbond-proxy sector for the quarter. Commodities outperformed the bond markets over the one-year period, with a return of 35.0%, but trailed the equitymarket.10 Along with energy and petroleum, metals were a large driver of commodities returns for the year, with precious metals leading the way in thefirst six-months of the period as the US dollar weakened and industrial metals leading the way in the second six-month period as economic recoverypicked up speed and investors left the yieldless, perceived safe haven of gold.
The bond market started 2021 with one of its worst first quarter returns on record. The rise in bond yields, especially in longer durations, led tonegative returns across most bond sectors. The Bloomberg Barclays US Aggregate Bond Index (the “US Aggregate Bond Index”) returned -3.4% forthe first quarter of 2021, driven by longer maturity Treasuries, which fell 13.5% for the quarter.11 The first quarter of 2021 marked the worst firstquarter for both the US Aggregate Bond Index and long-term Treasuries since 1980. For the full one-year period ending March 31, 2021, the US bondmarket was just positive with a return of 0.7%, while long Treasuries returned -15.8%. Treasuries and mortgage-backed securities generally weighedon the returns of the US bond market, with a return of -4.4% and -0.1% respectively, while investment-grade corporate bonds returned 8.7% for theone year period.12 Higher returns were found in the less interest-rate sensitive sectors of high-yield corporate bonds and leveraged loans which returned23.7% and 20.7% respectively for the year.13
1 US equities represented by S&P 500® Index.2 Emerging markets represented by MSCI Emerging Markets Index.3 International developed markets represented by the MSCI EAFE Index.4 Source: Standard & Poor’s, Zephyr Style Advisor, AssetMark.5 Consumer discretionary sector represented by S&P 500® Consumer Discretionary (Sector) Index; technology sector represented by S&P 500® Information
Technology (Sector) Index; energy sector represented by S&P 500® Energy (Sector) Index; financials sector represented by S&P 500® Financials (Sector) Index.6 Large-cap growth stocks represented by S&P 500® Growth Index; large-cap value stocks represented by S&P 500® Value Index.7 US small cap equities represented by S&P 600® Index; US large cap represented by S&P 500® Index.8 Source: Zephyr Style Advisor9 REITS represented by FTSE NAREIT All Equity REITS.10 Commodities represented by Bloomberg Commodity Index.11 US bonds represented by Bloomberg Barclays US Aggregate Bond Index; long-term US Treasuries represented by Bloomberg Barclays US Long Treasury Index.12 Mortgage backed securities (MBS) represented by Bloomberg Barclays US MBS Index; US Treasuries represented by Bloomberg Barclays US Treasury Index;
investment grade bonds represented by Bloomberg Barclays US Corporate Bond Index.13 High-yield corporate bonds represented by Bloomberg Barclays US Corporate High Yield Bond Index; leveraged loans represented by S&P/LSTA Leveraged Loan
100 Index.
1

Fund Review
Looking across the fund family, 12 of the 15 funds outperformed their benchmarks over the twelve-month period.
Most of the GuideMark® funds outperformed their respective benchmarks during the reporting period. Only two funds trailed their benchmarks. TheGuideMark® Large Cap Core Fund and GuideMark® Small/Mid Cap Core Funds both outperformed by fairly wide margins, helped by all threeinvestment factors at different times during the period. The quality and momentum factors benefitted Fund returns in the six months endedSeptember 30, 2020, while the value factor contributed to gains in the six months ended March 31, 2021. The GuideMark® World ex-US Fund andGuideMark® Emerging Markets Fund trailed their respective benchmarks for the period due to the impact of the quality factor. The GuideMark® CoreFixed Income Fund benefited from an underweight allocation to Treasuries relative to its benchmark, favoring corporate bonds and active creditselection, which led to the Fund’s relative outperformance for the period.
All of the GuidePath® allocation funds outperformed their respective benchmarks for the twelve-month period. The funds outperformed generally dueexposure to higher-risk assets which rebounded and rallied strongly from the market bottom. GuidePath® Growth Allocation Fund tilted toward small-caps and larger-cap growth while the GuidePath® Conservative Allocation Fund, GuidePath® Flexible Income Fund and GuidePath® Absolute ReturnFund all benefited from exposure to credit, especially high-yield, investment-grade, and emerging markets. The GuidePath® Multi-Asset IncomeAllocation Fund made up significant ground in 2021 from exposure to the highest paying dividend securities and REITs as they rallied. TheGuidePath® Tactical Allocation Fund benefited from higher equity exposure relative to its benchmark. The GuidePath® Managed Futures StrategyFund uses derivatives to implement its investment strategy, specifically futures contracts. Positioning across most asset classes benefitted the Fund’sperformance during the year. Long futures positioning within bonds during the first half of the reporting period followed by a shift to a short positionby the end of the period coupled with the Fund’s long futures positioning in equities, energy and metals contributed positively to the Fund’s returns forthe period.
Of the three GuidePath® income focused funds, only the GuidePath® Growth and Income Fund trailed its benchmark for the reporting period, due tothe Fund’s lower risk exposure during the market rally. Emphasis on credit risk and inflation-linked exposure within the GuidePath® ConservativeIncome and GuidePath® Income Funds benefited returns as interest rates rose over the period, pushing Treasury returns negative and increasinginflation fears .
Looking Ahead
Faster-than-expected-progress vaccinating Americans and $1.9 trillion in COVID-19 relief on top of the already unprecedented relief spendingapproved by Congress in 2020 further bolstered investor optimism for the rebound of the US economy, which in turn has provided a tailwind for riskassets like equities and a headwind for safe-haven assets like Treasury bonds and gold. Investor anxiety has quickly pivoted from anxiety aboutdeflation to anxiety about inflation. Investors have not really worried about inflation since 2011 and as a result, investors’ expectations for inflationtend be based on the experiences of the late 1970s and early ‘80s. We think today’s circumstances are quite different from those and that any inflationwe might experience this time is likely to be short-lived, also known as “transitory”, as it was in 2011. One of investors’ key concerns about inflation isthat it will ultimately lead to rising interest rates when the Fed decides it needs to slow growth in order to pre-empt inflation and that rising rates willhurt stock prices. We believe expectations of higher rates to be reasonable, but history suggests that the stock market has a surprising capacity toabsorb interest rate increases and still deliver above-average returns.
Please contact your financial advisor to discuss any questions about your investment strategy or changes in your financial goals. We thank you forincluding the funds in your portfolio and appreciate the trust you have placed in us.
Sincerely,
Carrie E. HansenTrustee, Chairperson and President of the Funds
Important Information
All index returns are sourced from Morningstar and Bloomberg. It is not possible to invest directly in any index.
Past performance is no guarantee of future results.
The AssetMark platform provides fee-based investment advisory programs. Investors are advised to refer to the appropriate Disclosure Brochure,which can be obtained from your financial advisor, for a full description of services provided, including all applicable fees.
The prospectus includes additional information about the GuideMark® and GuidePath® Funds including investment objectives, risk factors, fees andcharges as well as other important information that should be carefully read and considered before investing. You may obtain a prospectus bycontacting your registered representative.
AssetMark, Inc. is an investment advisor registered with the Securities and Exchange Commission. The Principal Underwriter for the GuideMark® andGuidePath® Funds is AssetMark Brokerage™, LLC, a member of the Financial Industry Regulatory Authority, Inc. AssetMark Brokerage™, LLC is anaffiliate of AssetMark, Inc. and shares its address. ©2021 AssetMark, Inc. All rights reserved.
Investment Terms
Market Capitalization or Market Cap refers to the total value of an issuer’s outstanding shares of stock. It is calculated by multiplying the price of astock by its total number of outstanding shares.
2
Small Cap stocks generally refer to shares of companies with a market cap between $300 million and $2 billion.
Mid Cap stocks generally refer to shares of companies with a market cap between $2 billion and $10 billion.
Large Cap stocks generally refer to shares of companies with a market cap of $10 billion or greater.
Mega Cap stocks generally refer to shares of companies with market caps well above the rest of the market, generally $200 billion and greater.
Investment Factors:
Value refers to how attractively a stock is priced relative to its “fundamentals,” such as book value and free cash flow.
Momentum refers to whether a company’s share price is trending up or down.
Quality refers to profitability.
Volatility is a statistical measure of the dispersion of returns for a given security, market index or portfolio over a period of time. Low volatility meansthat the value of a security, market index or portfolio stays relatively stable. High volatility means that the value of a security, market index or portfolioexperiences rapid increases and dramatic falls and may move erratically.
Inflation is the measure of average prices of a ‘basket’ of consumer goods over time.
Risk refers to the price volatility of an investment, and typically refers to equities or credit-based investments. “Risking” or “de-risking” a portfoliorefers to increasing or decreasing the amount of these assets.
Index Definitions
Bloomberg Barclays US Aggregate Bond Index is a broad-based index that measures the investment-grade, US dollar-denominated, fixed ratetaxable bond market. The index includes Treasuries, government-related and corporate securities, mortgage-backed securities (agency fixed-rate pass-throughs), asset-backed securities and commercial mortgage-backed securities (agency and non-agency).
Bloomberg Barclays US Corporate High Yield Bond Index measures the US dollar denominated, high yield, fixed-rate corporate bond market.Securities are classified as high yield if the middle rating of Moody’s, Fitch and S&P is Ba1/BB+/BB+ or below. Bonds from issuers with an emergingmarkets country of risk, based on Barclays’ emerging market country definition, are excluded.
Bloomberg Barclays US Corporate Bond Index measures the performance of the investment-grade, fixed-rate, taxable corporate bond market. Itincludes US dollar-denominated securities publicly issued by US and non-US industrial, utility and financial issuers.
Bloomberg Barclays US MBS Index tracks fixed-rate agency mortgage backed pass-through securities guaranteed by Ginnie Mae (GNMA), FannieMae (FNMA), and Freddie Mac (FHLMC). The index is constructed by grouping individual “to-be-announced” deliverable mortgage-backed securitypools into aggregates or generics based on program, coupon and vintage.
Bloomberg Barclays US Treasury Index measures US dollar-denominated, fixed-rate, nominal debt issued by the US Treasury. Treasury bills areexcluded by the maturity constraint.
Bloomberg Barclays US Long Treasury Index measures US dollar-denominated, fixed-rate, nominal debt issued by the US Treasury with 10 yearsor more to maturity.
Bloomberg Commodity Index is calculated on an excess return basis and reflects commodity futures price movements.
FTSE NAREIT All Equity REITs Index is a free-float adjusted, market capitalization-weighted index of US equity REITs. Constituents of the indexinclude all tax-qualified REITs with more than 50 percent of total assets in qualifying real estate assets other than mortgages secured by real property.
MSCI EAFE (Europe, Australasia, Far East) Index is an equity index which captures large and mid-cap representation across developed marketscountries around the world, excluding the US and Canada.
MSCI Emerging Markets Index captures large and mid-cap representation across twenty-six emerging markets countries.
S&P 500® Index focuses on the large-cap segment of the US equity market. It includes 500 leading companies in leading industries of the USeconomy, capturing approximately 75% coverage of US equities.
S&P 500® Energy (Sector) Index comprises those companies included in the S&P 500® Index that are classified as members of the GICS® energysector.
S&P 500® Financials (Sector) Index comprises those companies included in the S&P 500® Index that are classified as members of theGICS® financials sector.
S&P 500® Information Technology (Sector) Index comprises those companies included in the S&P 500® Index that are classified as members of theGICS® information technology sector.
S&P 500® Consumer Discretionary (Sector) Index comprises those companies included in the S&P 500® Index that are classified as members of theGICS® consumer discretionary sector.
S&P 500® Growth Index measures growth stocks using three factors: sales growth, the ratio of earnings change to price, and momentum.Constituents are drawn from the S&P 500® Index.
3

S&P 500® Value Index measures value stocks using three factors: the ratios of book value, earnings, and sales to price. Constituents are drawn fromthe S&P 500® Index.
S&P 600® Index measures the performance of 600 small-sized companies in the U.S. Constituents generally have a market-cap between $400 millionand $1.8 billion and meet criteria designed to ensure they are liquid and financially viable.
S&P/LSTA Leveraged Loan 100 Index is designed to reflect the performance of the largest facilities in the leveraged loan market.
4

GuideMark® Large Cap Core FundMANAGER’S DISCUSSION OF FUND PERFORMANCE (Unaudited)
TOTAL RETURN BASED ON A $10,000 INVESTMENT
$0
$10,000
$30,000
$20,000
$60,000
$50,672
$33,041$40,000
$50,000
3/31/11 3/31/12 3/31/13 3/31/14 3/31/15 3/31/16 3/31/17 3/31/18 3/31/19 3/31/20 3/31/21
GuideMark® Large Cap Core Fund - Service SharesRussell 1000® Index
This chart assumes an initial gross investment of $10,000 made on March 31, 2011. Returns shown include the reinvestment of all dividends. Returnsshown do not reflect the deduction of taxes that a shareholder would pay on Fund distributions or the redemption of Fund shares. In the absence of feewaivers and reimbursements, when they are necessary to keep expenses at the expense cap, total return would be reduced. Past performance is notpredictive of future performance. Investment return and principal value will fluctuate so that your shares, when redeemed, may be worth more or lessthan the original cost. Index returns do not reflect the effects of fees or expenses. It is not possible to invest directly in an index.
RUSSELL 1000® INDEX – The Russell 1000® Index measures the performance of the large-cap segment of the U.S. equity universe. As of May 8,2020, the market capitalization of the companies in the Russell 1000® Index ranged from $1.8 billion to $1.4 trillion.
AVERAGE ANNUAL TOTAL RETURN (for periods ended March 31)
One Year Five Year Ten Year Since Inception(1)
GuideMark® Large Cap Core FundService Shares . . . . . . . . . . . . . . . . . . . . . . . . . . . . . . . . . . . . . . . . . . . . . . . . . . . . . 65.69% 15.04% 11.85% 6.24%Institutional Shares . . . . . . . . . . . . . . . . . . . . . . . . . . . . . . . . . . . . . . . . . . . . . . . . . 66.66% 15.71% N/A 12.24%
Russell 1000® Index . . . . . . . . . . . . . . . . . . . . . . . . . . . . . . . . . . . . . . . . . . . . . . . . . . 60.59% 16.66% 13.97% 8.56%(2)
(1) Inception date is 6/29/01 for Service Shares and 4/29/11 for Institutional Shares.
(2) The return shown for the Russell 1000® Index is from the inception date of the Service Shares. The Russell 1000® Index return from the inception date of theInstitutional Shares is 13.75%.
5
GuideMark® Large Cap Core FundMANAGER’S DISCUSSION OF FUND PERFORMANCE (Continued) (Unaudited)
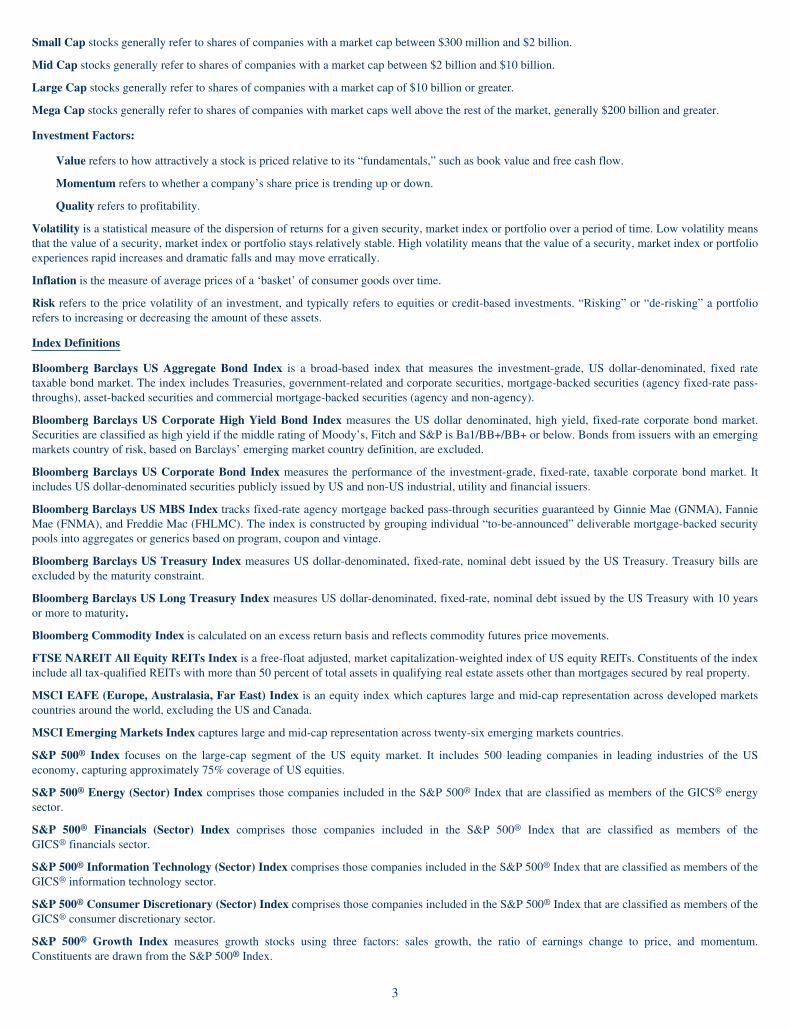
‰ For the 12 months ended March 31, 2021, the Fund’s Service Shares returned 65.7%, outperforming the Russell 1000® Index at 60.6%.
‰ As part of the Fund’s equal weighted three-factor investment approach, the Fund’s dedicated allocation to the value factor was a contributor to Fundperformance as cheaper stocks significantly outperformed during the latter half of the 12-month period.
‰ The Fund saw positive contributions from the quality factor, as well as favorable sector weightings including an overweight allocation to thetechnology and consumer discretionary sectors and underweight exposure to the energy and financial sectors relative to the benchmark.
‰ The momentum factor detracted from Fund results for the period.
Components of Portfolio Holdings*
Materials 2%ConsumerDiscretionary 18%
CommunicationServices 3%
Real Estate 1%
ConsumerStaples 7%
Health Care 13%Industrials 8%
InformationTechnology 35% Energy 1%
Financials 10%
Utilities 2%
Short TermInvestments <1%
* Pie chart represents percentages of total portfolio, less securities lending collateral.
Top Ten Holdings
Rank Security/Holding% of Net
Assets
1 Apple, Inc. 5.07%
2 Microsoft Corp. 4.55%
3 Amazon.com, Inc. 3.37%
4 Vanguard S&P 500 ETF 2.38%
5 Facebook, Inc. – Class A 1.84%
6 Alphabet, Inc. – Class C 1.55%
7 Alphabet, Inc. – Class A 1.54%
8 Johnson & Johnson 1.04%
9 UnitedHealth Group, Inc. 0.92%
10 Intel Corp. 0.84%
The Global Industry Classification Standard (“GICS®”) was developed by and/or is the exclusive property of MSCI, Inc. (“MSCI”) and Standard &Poor’s Financial Services LLC (“S&P”). GICS is a service mark of MSCI and S&P, and has been licensed for use by U.S. Bancorp Fund Services,LLC.
6

GuideMark® Emerging Markets FundMANAGER’S DISCUSSION OF FUND PERFORMANCE (Unaudited)
TOTAL RETURN BASED ON A $10,000 INVESTMENT
$0
$10,000
$20,000
$30,000
$40,000
$80,000
$69,290
$28,970
$50,000
$60,000
$70,000
GuideMark® Emerging Markets Fund - Service SharesMSCI Emerging Markets Index
3/31/11 3/31/12 3/31/13 3/31/14 3/31/15 3/31/16 3/31/17 3/31/18 3/31/19 3/31/20 3/31/21
This chart assumes an initial gross investment of $10,000 made on March 31, 2011. Returns shown include the reinvestment of all dividends. Returnsshown do not reflect the deduction of taxes that a shareholder would pay on Fund distributions or the redemption of Fund shares. In the absence of feewaivers and reimbursements, when they are necessary to keep expenses at the expense cap, total return would be reduced. Past performance is notpredictive of future performance. Investment return and principal value will fluctuate so that your shares, when redeemed, may be worth more or lessthan the original cost. Index returns do not reflect the effects of fees or expenses. It is not possible to invest directly in an index.
MSCI EMERGING MARKETS INDEX – The MSCI Emerging Markets Index measures the equity market performance of countries considered torepresent emerging markets. The emerging market country indices included are: Argentina, Brazil, Chile, China, Colombia, Czech Republic, Egypt,Greece, Hungary, India, Indonesia, Korea, Kuwait, Malaysia, Mexico, Pakistan, Peru, Philippines, Poland, Russia, Qatar, Saudi Arabia, South Africa,Taiwan, Thailand, Turkey and the United Arab Emirates.
AVERAGE ANNUAL TOTAL RETURN (for periods ended March 31)
One Year Five Year Ten Year Since Inception(1)
GuideMark® Emerging Markets FundService Shares . . . . . . . . . . . . . . . . . . . . . . . . . . . . . . . . . . . . . . . . . . . . . . . . . . . . . 57.85%(2) 11.43% 9.67% 5.53%
MSCI Emerging Markets Index . . . . . . . . . . . . . . . . . . . . . . . . . . . . . . . . . . . . . . . . . 58.92% 12.48% 4.02% 10.30%(1) Inception date is 6/29/01.
(2) The returns reflect the actual performance for each period and do not include the impact of any adjustments made for financial reporting required by GenerallyAccepted Accounting Principles (GAAP).
7

GuideMark® Emerging Markets FundMANAGER’S DISCUSSION OF FUND PERFORMANCE (Continued) (Unaudited)
‰ For the 12 months ended March 31, 2021, the Fund’s Service Shares returned 57.9%, underperforming the MSCI Emerging Markets Index at 58.9%.
‰ As part of the Fund’s equal weighted three-factor investment approach, the Fund’s dedicated allocation to the quality factor was a detractor fromFund results for the period.
‰ The Fund saw positive contributions from the value and momentum factors, as well as favorable sector weightings including an underweightallocation to the financial sector relative to the benchmark.
‰ The Fund’s underweight allocation to the momentum factor relative to the benchmark detracted from Fund performance for the period.
Components of Portfolio Holdings*
Short TermInvestments 1% Developed
Asia 7%
Africa & MiddleEast 2%
DevelopedEurope <1%
EmergingMarkets 90%
* Pie chart represents percentages of total portfolio, less securities lending collateral.
Top Ten Holdings
Rank Security/Holding% of Net
Assets
1 Taiwan Semiconductor Manufacturing Co., Ltd. 5.83%
2 Tencent Holdings, Ltd. 4.92%
3 iShares Core MSCI Emerging Markets ETF 4.84%
4 KraneShares Bosera MSCI China ETF – Class A 4.52%
5 Alibaba Group Holding, Ltd. 4.48%
6 Samsung Electronics Co., Ltd. 3.82%
7 iShares MSCI Saudi Arabia ETF 1.88%
8 Meituan 1.24%
9 Infosys Ltd. 1.11%
10 Vale SA 0.89%
8
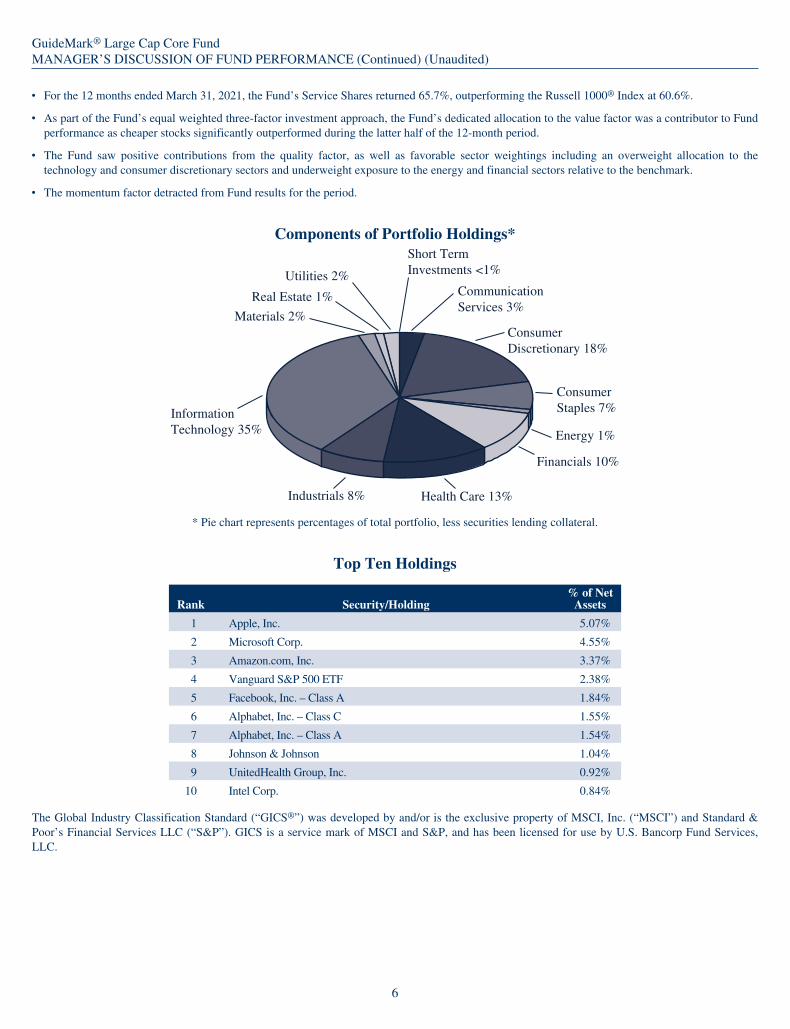
GuideMark® Small/Mid Cap Core FundMANAGER’S DISCUSSION OF FUND PERFORMANCE (Unaudited)
TOTAL RETURN BASED ON A $10,000 INVESTMENT
$0
$10,000
$20,000
$30,000
$70,000
$50,000
$40,000
$64,941
$52,321
$60,000
GuideMarkRussell 2500TM Index
® Small/Mid Cap Core Fund - Service Shares
3/31/11 3/31/12 3/31/13 3/31/14 3/31/15 3/31/16 3/31/17 3/31/18 3/31/19 3/31/20 3/31/21
This chart assumes an initial gross investment of $10,000 made on March 31, 2011. Returns shown include the reinvestment of all dividends. Returnsshown do not reflect the deduction of taxes that a shareholder would pay on Fund distributions or the redemption of Fund shares. In the absence of feewaivers and reimbursements, when they are necessary to keep expenses at the expense cap, total return would be reduced. Past performance is notpredictive of future performance. Investment return and principal value will fluctuate so that your shares, when redeemed, may be worth more or lessthan the original cost. Index returns do not reflect the effects of fees or expenses. It is not possible to invest directly in an index.
RUSSELL 2500TM INDEX – The Russell 2500TM Index measures the performance of the small- to mid-cap segment of the U.S. equity universe,commonly referred to as “smid” cap. It includes approximately 2,500 of the smallest securities based on a combination of their market cap and currentindex membership. As of May 10, 2020, the market capitalization of the companies in the Russell 2500TM Index ranged from $95 million to$11.5 billion.
AVERAGE ANNUAL TOTAL RETURN (for periods ended March 31)
One Year Five Year Ten Year Since Inception(1)
GuideMark® Small/Mid Cap Core FundService Shares . . . . . . . . . . . . . . . . . . . . . . . . . . . . . . . . . . . . . . . . . . . . . . . . . . . . . 99.76% 16.02% 11.54% 8.74%
Russell 2500TM Index . . . . . . . . . . . . . . . . . . . . . . . . . . . . . . . . . . . . . . . . . . . . . . . . . 89.40% 15.93% 12.20% 9.93%(1) Inception date is 6/29/01.
9

GuideMark® Small/Mid Cap Core FundMANAGER’S DISCUSSION OF FUND PERFORMANCE (Continued) (Unaudited)
‰ For the 12 months ended March 31, 2021, the Fund’s Service Shares returned 99.8%, outperforming the Russell 2500™ Index at 89.4%.
‰ As part of the Fund’s equal weighted three-factor investment approach, the Fund’s dedicated allocation to the quality factor was a contributor toFund performance for the period.
‰ The Fund saw positive contributions from the value factor, as well as favorable sector weightings including an overweight allocation to theconsumer discretionary sector and underweight exposure to the financial and real estate sectors relative to the benchmark.
‰ The momentum factor detracted from Fund results for the period.
Components of Portfolio Holdings*
Utilities 1%
Short TermInvestments 1%
ConsumerDiscretionary 18%
CommunicationServices 3%
ConsumerStaples 4%
Energy 1%
Financials 15%
Health Care 16%
Industrials 15%
InformationTechnology 18%
Materials 4%Real Estate 4%
* Pie chart represents percentages of total portfolio, less securities lending collateral.
Top Ten Holdings
Rank Security/Holding% of Net
Assets
1 Vanguard Extended Market ETF 3.52%
2 Teradyne, Inc. 0.34%
3 Horizon Therapeutics Plc 0.33%
4 Etsy, Inc. 0.32%
5 Monolithic Power Systems, Inc. 0.29%
6 Molina Healthcare, Inc. 0.27%
7 Enphase Energy, Inc. 0.26%
8 Gamestop Corp. – Class A 0.25%
9 HubSpot, Inc. 0.25%
10 Williams Sonoma, Inc. 0.25%
10

GuideMark® World ex-US FundMANAGER’S DISCUSSION OF FUND PERFORMANCE (Unaudited)
TOTAL RETURN BASED ON A $10,000 INVESTMENT
$5,000
$10,000
$15,000
$35,000
$20,000
$25,000
$30,000
3/31/213/31/20
GuideMark® World ex-US Fund - Service SharesMSCI World ex-USA Index
$32,703
$19,209
3/31/193/31/183/31/173/31/163/31/153/31/143/31/133/31/123/31/11
This chart assumes an initial gross investment of $10,000 made on March 31, 2011. Returns shown include the reinvestment of all dividends. Returnsshown do not reflect the deduction of taxes that a shareholder would pay on Fund distributions or the redemption of Fund shares. In the absence of feewaivers and reimbursements, when they are necessary to keep expenses at the expense cap, total return would be reduced. Past performance is notpredictive of future performance. Investment return and principal value will fluctuate so that your shares, when redeemed, may be worth more or lessthan the original cost. Index returns do not reflect the effects of fees or expenses. It is not possible to invest directly in an index.
MSCI WORLD EX-USA INDEX – The MSCI World ex-USA Index captures large and mid-cap representation across 22 of 23 developed marketscountries excluding the U.S. The developed market country indices included are: Australia, Austria, Belgium, Canada, Denmark, Finland, France,Germany, Hong Kong, Ireland, Israel, Italy, Japan, Netherlands, New Zealand, Norway, Portugal, Singapore, Spain, Sweden, Switzerland and theUnited Kingdom.
AVERAGE ANNUAL TOTAL RETURN (for periods ended March 31)
One Year Five Year Ten Year Since Inception(1)
GuideMark® World ex-US FundService Shares . . . . . . . . . . . . . . . . . . . . . . . . . . . . . . . . . . . . . . . . . . . . . . . . . . . . . 45.89% 8.23% 3.83% 3.36%Institutional Shares(2) . . . . . . . . . . . . . . . . . . . . . . . . . . . . . . . . . . . . . . . . . . . . . . . . 46.72% 9.04% N/A 4.09%
MSCI World ex-USA Index . . . . . . . . . . . . . . . . . . . . . . . . . . . . . . . . . . . . . . . . . . . . 46.51% 9.48% 5.73% 6.18%(3)
(1) Inception date is 6/29/01 for Service Shares and 4/29/11 for Institutional Shares.
(2) During the period August 3, 2017 through September 5, 2017, there were no Institutional Shares of the Fund outstanding. Performance information provided for theInstitutional Shares during that period reflects the last calculated net asset value of the Institutional Shares on August 2, 2017, without any adjustments. Had there beenInstitutional Shares outstanding during the period August 3, 2017 through September 5, 2017, their annual returns would have been substantially similar to those of theService Shares of the Fund because they would have been invested in the same portfolio securities, but would have differed to the extent that the classes have differentexpenses. Because the Service Shares have higher expenses than the Institutional Shares, the returns of the Service Shares would have been lower than the returns ofthe Institutional Shares during the same period.
(3) The return shown for the MSCI World ex-USA Index is from the inception date of the Service Shares. The MSCI World ex-USA Index return from the inception dateof the Institutional Shares is 5.20%.
11

GuideMark® World ex-US FundMANAGER’S DISCUSSION OF FUND PERFORMANCE (Continued) (Unaudited)
‰ For the 12 months ended March 31, 2021, the Fund’s Service Shares returned 45.9%, underperforming the MSCI World ex-USA Index at 46.5%.
‰ As part of the Fund’s equal weighted three-factor investment approach, the Fund’s dedicated allocation to the momentum factor was a detractorfrom Fund performance for the period.
‰ The Fund saw positive contributions from the value factor, as well as favorable sector weightings including overweight allocations to the consumerdiscretionary sector relative to the benchmark.
‰ The quality factor detracted from Fund results for the period, as did an underweight allocation to market sensitive stocks relative to the benchmark.
Components of Portfolio Holdings*Short TermInvestments 1%
DevelopedAsia 35%
Developed Europe 55%
North America 9%EmergingMarkets <1%
* Pie chart represents percentages of total portfolio, less securities lending collateral.
Top Ten Holdings
Rank Security/Holding% of Net
Assets
1 iShares MSCI EAFE ETF 3.03%
2 Nestle SA 1.56%
3 Roche Holdings AG 1.40%
4 ASML Holding NV 1.03%
5 LVMH Moet Hennessy Louis Vuitton SE 1.00%
6 Novartis AG 0.88%
7 WSP Global, Inc. 0.70%
8 Novo Nordisk AS – Series B 0.69%
9 L’Oreal SA 0.65%
10 AstraZeneca PLC 0.64%
12

GuideMark® Core Fixed Income FundMANAGER’S DISCUSSION OF FUND PERFORMANCE (Unaudited)
TOTAL RETURN BASED ON A $10,000 INVESTMENT
$5,000
$10,000
$15,000
$30,000
$20,000
$23,968
$20,855
$25,000
GuideMarkBloomberg Barclays U.S. Aggregate Bond Index
® Core Fixed Income Fund - Service Shares
3/31/11 3/31/12 3/31/13 3/31/14 3/31/15 3/31/16 3/31/17 3/31/18 3/31/19 3/31/20 3/31/21
This chart assumes an initial gross investment of $10,000 made on March 31, 2011. Returns shown include the reinvestment of all dividends. Returnsshown do not reflect the deduction of taxes that a shareholder would pay on Fund distributions or the redemption of Fund shares. In the absence of feewaivers and reimbursements, when they are necessary to keep expenses at the expense cap, total return would be reduced. Past performance is notpredictive of future performance. Investment return and principal value will fluctuate so that your shares, when redeemed, may be worth more or lessthan the original cost. Index returns do not reflect the effects of fees or expenses. It is not possible to invest directly in an index.
BLOOMBERG BARCLAYS U.S. AGGREGATE BOND INDEX – The Bloomberg Barclays U.S. Aggregate Bond Index is a broad-based benchmarkthat measures the investment-grade, U.S. dollar-denominated, fixed-rate taxable bond market, including Treasuries, government-related and corporatedebt securities, mortgage- and asset-backed securities. All securities contained in the Bloomberg Barclays U.S. Aggregate Bond Index have aminimum term to maturity of one year.
AVERAGE ANNUAL TOTAL RETURN (for periods ended March 31)
One Year Five Year Ten Year Since Inception(1)
GuideMark® Core Fixed Income FundService Shares . . . . . . . . . . . . . . . . . . . . . . . . . . . . . . . . . . . . . . . . . . . . . . . . . . . . . 2.47% 2.68% 2.75% 3.79%
Bloomberg Barclays U.S. Aggregate Bond Index . . . . . . . . . . . . . . . . . . . . . . . . . . . 0.71% 3.10% 3.44% 4.52%(1) Inception date is 6/29/01.
13

GuideMark® Core Fixed Income FundMANAGER’S DISCUSSION OF FUND PERFORMANCE (Continued) (Unaudited)
‰ For the 12 months ended March 31, 2021, the Fund’s Service Shares returned 2.5%, outperforming the Bloomberg Barclays U.S. Aggregate BondIndex at 0.7%.
‰ The Fund’s overweight allocation to investment grade corporate credit as well as favorable sector weightings, including overweight exposure to thecommunications, consumer non-cyclicals and technology sectors, relative to the benchmark benefitted Fund returns for the 12-month period.
‰ Exposure to the securitized credit sector including non-agency residential mortgage-backed securities, collateralized loan obligations, andcommercial mortgage-backed securities had a positive impact on returns.
‰ While positioning within US Treasuries, including exposure to Treasury Inflation-Protected Securities (TIPS), was additive over the period theFund’s tactical duration positioning, especially in the first half of the period hurt returns.
Components of Portfolio Holdings*
CorporateObligations 25%
U.S. Treasury &Government Related 24%
Asset-BackedSecurities 12%
Mortgage-BackedSecurities 31%
Other 2%Short TermInvestments 6%
* Pie chart represents percentages of total portfolio, less securities lending collateral.Percentages expressed exclude derivative instruments, such as futures and swap contracts.
Top Ten Holdings
Rank Security/Holding% of Net
Assets
1 Federal National Mortgage Association, 2.000%, 5/15/2050 5.03%
2 U.S. Treasury Note, 1.375%, 8/31/2023 4.49%
3 U.S. Treasury Note, 2.875%, 7/31/2025 4.20%
4 Government National Mortgage Association, 2.500%, 9/20/2049 2.35%
5 Federal National Mortgage Association, 2.500%, 5/15/2051 2.33%
6 Federal National Mortgage Association, 2.000%, 9/25/2050 2.22%
7 U.S. Treasury Note, 1.625%, 8/15/2029 1.91%
8 Federal National Mortgage Association, 2.000%, 4/15/2036 1.75%
9 Federal National Mortgage Association, 3.000%, 4/1/2051 1.73%
10 U.S. Treasury Note, 0.125%, 8/31/2022 1.70%
14

GuidePath® Growth Allocation FundMANAGER’S DISCUSSION OF FUND PERFORMANCE (Unaudited)
TOTAL RETURN BASED ON A $10,000 INVESTMENT
$5,000
$10,000
$15,000
$25,000
$20,000
$23,861
$21,176
4/29/11 3/31/12 3/31/13 3/31/14 3/31/15 3/31/213/31/203/31/193/31/183/31/173/31/16
GuidePath® Growth Allocation Fund - Service SharesS&P® Target Risk Aggressive Index
This chart assumes an initial gross investment of $10,000 made on April 29, 2011 (commencement of the Fund’s Service Shares operations). Returnsshown include the reinvestment of all dividends. Returns shown do not reflect the deduction of taxes that a shareholder would pay on Funddistributions or the redemption of Fund shares. In the absence of fee waivers and reimbursements, when they are necessary to keep expenses at theexpense cap, total return would be reduced. Past performance is not predictive of future performance. Investment return and principal value willfluctuate so that your shares, when redeemed, may be worth more or less than the original cost. Index returns do not reflect the effects of fees orexpenses. It is not possible to invest directly in an index.
S&P® TARGET RISK AGGRESSIVE INDEX – The S&P® Target Risk Aggressive Index is designed to measure the performance of an investmentbenchmark strategy which seeks to emphasize exposure to equity securities, maximizing opportunities for long-term capital accumulation, while alsoallocating a portion of exposure to fixed income to enhance portfolio efficiency.
AVERAGE ANNUAL TOTAL RETURN (for periods ended March 31)
One Year Five Year Since Inception(1)
GuidePath® Growth Allocation FundService Shares . . . . . . . . . . . . . . . . . . . . . . . . . . . . . . . . . . . . . . . . . . . . . . . . . . . . . . . . . . . . . . . . . 58.23% 12.95% 7.85%Institutional Shares . . . . . . . . . . . . . . . . . . . . . . . . . . . . . . . . . . . . . . . . . . . . . . . . . . . . . . . . . . . . . 59.19% 13.62% 10.17%
S&P® Target Risk Aggressive Index . . . . . . . . . . . . . . . . . . . . . . . . . . . . . . . . . . . . . . . . . . . . . . . . . 43.88% 11.65% 9.16%(2)
(1) Inception date is 4/29/11 for Service Shares and 9/13/12 for Institutional Shares.
(2) The return shown for the S&P® Target Risk Aggressive Index is annualized from the inception date of the Service Shares. The S&P® Target Risk Aggressive Indexaverage annual return from the inception date of the Institutional Shares is 10.19%.
15
GuidePath® Growth Allocation FundMANAGER’S DISCUSSION OF FUND PERFORMANCE (Continued) (Unaudited)
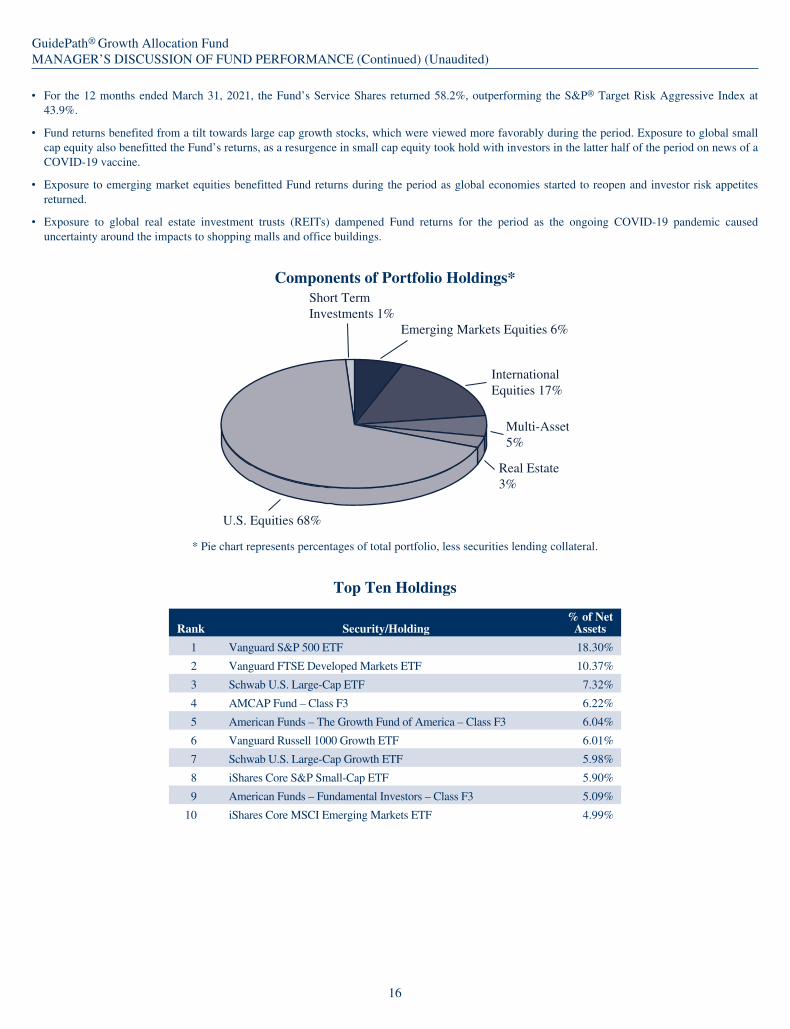
‰ For the 12 months ended March 31, 2021, the Fund’s Service Shares returned 58.2%, outperforming the S&P® Target Risk Aggressive Index at43.9%.
‰ Fund returns benefited from a tilt towards large cap growth stocks, which were viewed more favorably during the period. Exposure to global smallcap equity also benefitted the Fund’s returns, as a resurgence in small cap equity took hold with investors in the latter half of the period on news of aCOVID-19 vaccine.
‰ Exposure to emerging market equities benefitted Fund returns during the period as global economies started to reopen and investor risk appetitesreturned.
‰ Exposure to global real estate investment trusts (REITs) dampened Fund returns for the period as the ongoing COVID-19 pandemic causeduncertainty around the impacts to shopping malls and office buildings.
Components of Portfolio Holdings*Short TermInvestments 1%
Emerging Markets Equities 6%
InternationalEquities 17%
Real Estate3%
U.S. Equities 68%
Multi-Asset5%
* Pie chart represents percentages of total portfolio, less securities lending collateral.
Top Ten Holdings
Rank Security/Holding% of Net
Assets
1 Vanguard S&P 500 ETF 18.30%
2 Vanguard FTSE Developed Markets ETF 10.37%
3 Schwab U.S. Large-Cap ETF 7.32%
4 AMCAP Fund – Class F3 6.22%
5 American Funds – The Growth Fund of America – Class F3 6.04%
6 Vanguard Russell 1000 Growth ETF 6.01%
7 Schwab U.S. Large-Cap Growth ETF 5.98%
8 iShares Core S&P Small-Cap ETF 5.90%
9 American Funds – Fundamental Investors – Class F3 5.09%
10 iShares Core MSCI Emerging Markets ETF 4.99%
16
GuidePath® Conservative Allocation FundMANAGER’S DISCUSSION OF FUND PERFORMANCE (Unaudited)
TOTAL RETURN BASED ON A $10,000 INVESTMENT
$5,000
$10,000
$20,000
$15,000
$16,953$16,033
4/29/11 3/31/12
GuidePath® Conservative Allocation Fund - Service SharesS&P® Target Risk Conservative Index
3/31/13 3/31/14 3/31/15 3/31/16 3/31/17 3/31/18 3/31/19 3/31/20 3/31/21
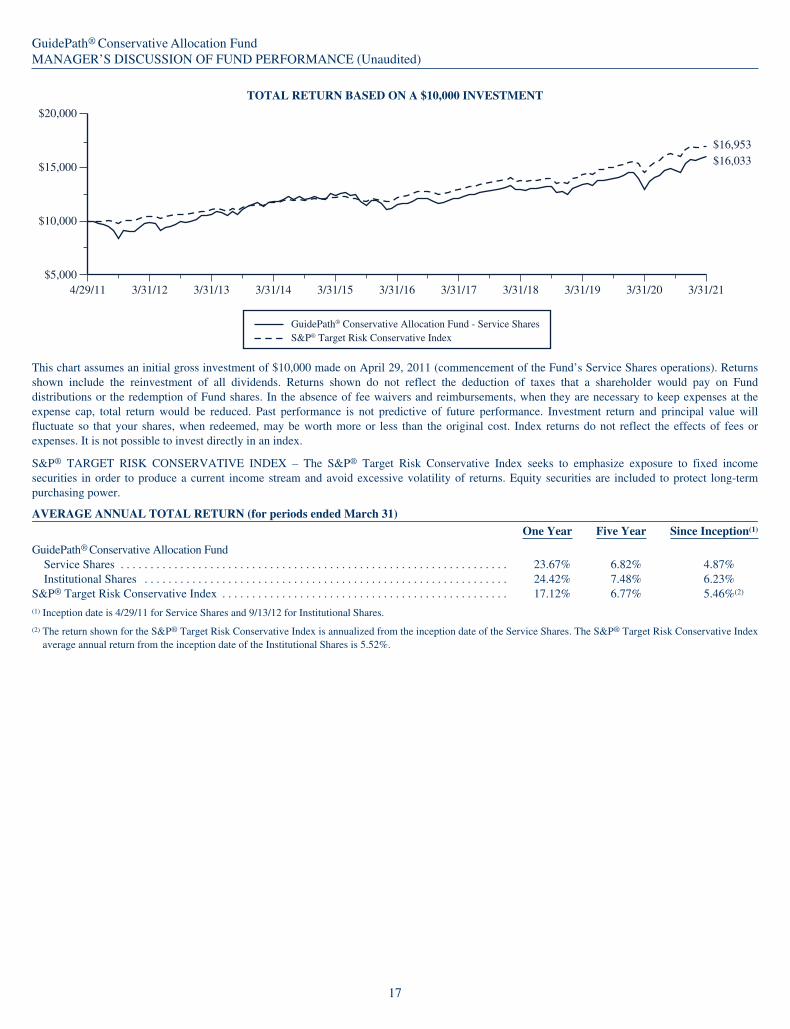
This chart assumes an initial gross investment of $10,000 made on April 29, 2011 (commencement of the Fund’s Service Shares operations). Returnsshown include the reinvestment of all dividends. Returns shown do not reflect the deduction of taxes that a shareholder would pay on Funddistributions or the redemption of Fund shares. In the absence of fee waivers and reimbursements, when they are necessary to keep expenses at theexpense cap, total return would be reduced. Past performance is not predictive of future performance. Investment return and principal value willfluctuate so that your shares, when redeemed, may be worth more or less than the original cost. Index returns do not reflect the effects of fees orexpenses. It is not possible to invest directly in an index.
S&P® TARGET RISK CONSERVATIVE INDEX – The S&P® Target Risk Conservative Index seeks to emphasize exposure to fixed incomesecurities in order to produce a current income stream and avoid excessive volatility of returns. Equity securities are included to protect long-termpurchasing power.
AVERAGE ANNUAL TOTAL RETURN (for periods ended March 31)
One Year Five Year Since Inception(1)
GuidePath® Conservative Allocation FundService Shares . . . . . . . . . . . . . . . . . . . . . . . . . . . . . . . . . . . . . . . . . . . . . . . . . . . . . . . . . . . . . . . . . 23.67% 6.82% 4.87%Institutional Shares . . . . . . . . . . . . . . . . . . . . . . . . . . . . . . . . . . . . . . . . . . . . . . . . . . . . . . . . . . . . . 24.42% 7.48% 6.23%
S&P® Target Risk Conservative Index . . . . . . . . . . . . . . . . . . . . . . . . . . . . . . . . . . . . . . . . . . . . . . . . 17.12% 6.77% 5.46%(2)
(1) Inception date is 4/29/11 for Service Shares and 9/13/12 for Institutional Shares.
(2) The return shown for the S&P® Target Risk Conservative Index is annualized from the inception date of the Service Shares. The S&P® Target Risk Conservative Indexaverage annual return from the inception date of the Institutional Shares is 5.52%.
17
GuidePath® Conservative Allocation FundMANAGER’S DISCUSSION OF FUND PERFORMANCE (Continued) (Unaudited)
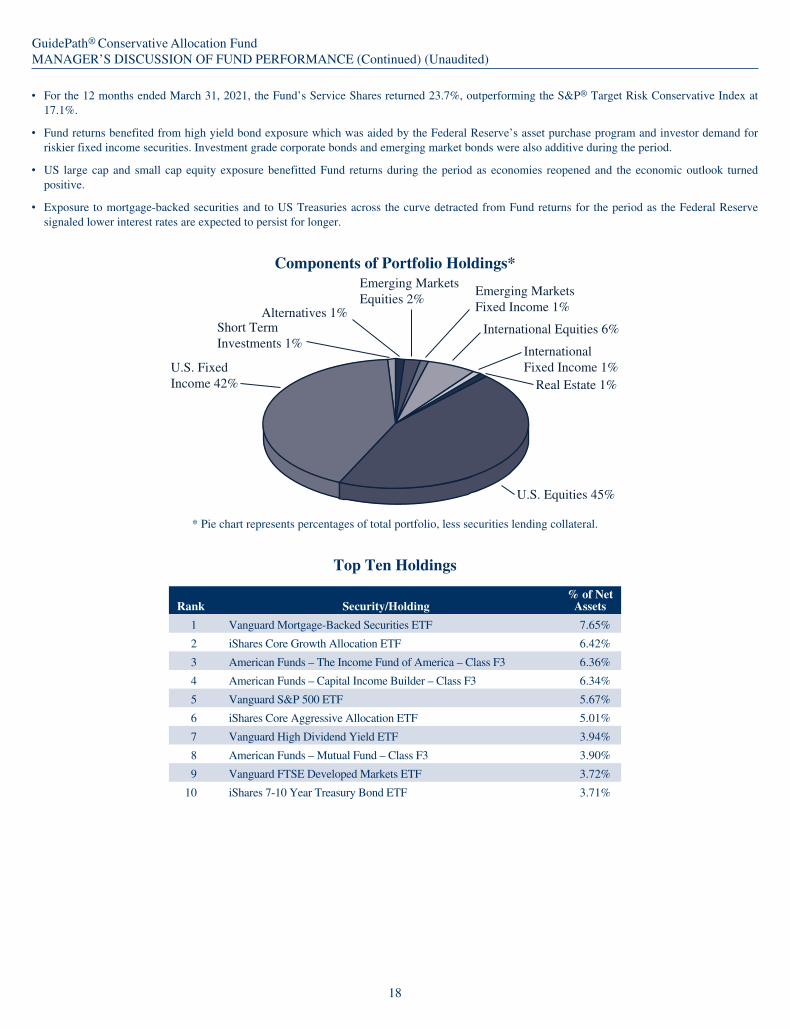
‰ For the 12 months ended March 31, 2021, the Fund’s Service Shares returned 23.7%, outperforming the S&P® Target Risk Conservative Index at17.1%.
‰ Fund returns benefited from high yield bond exposure which was aided by the Federal Reserve’s asset purchase program and investor demand forriskier fixed income securities. Investment grade corporate bonds and emerging market bonds were also additive during the period.
‰ US large cap and small cap equity exposure benefitted Fund returns during the period as economies reopened and the economic outlook turnedpositive.
‰ Exposure to mortgage-backed securities and to US Treasuries across the curve detracted from Fund returns for the period as the Federal Reservesignaled lower interest rates are expected to persist for longer.
Components of Portfolio Holdings*
International Equities 6%
U.S. Equities 45%
U.S. FixedIncome 42%
Emerging MarketsEquities 2%
Emerging MarketsFixed Income 1%
Real Estate 1%
InternationalFixed Income 1%
Alternatives 1%Short TermInvestments 1%
* Pie chart represents percentages of total portfolio, less securities lending collateral.
Top Ten Holdings
Rank Security/Holding% of Net
Assets
1 Vanguard Mortgage-Backed Securities ETF 7.65%
2 iShares Core Growth Allocation ETF 6.42%
3 American Funds – The Income Fund of America – Class F3 6.36%
4 American Funds – Capital Income Builder – Class F3 6.34%
5 Vanguard S&P 500 ETF 5.67%
6 iShares Core Aggressive Allocation ETF 5.01%
7 Vanguard High Dividend Yield ETF 3.94%
8 American Funds – Mutual Fund – Class F3 3.90%
9 Vanguard FTSE Developed Markets ETF 3.72%
10 iShares 7-10 Year Treasury Bond ETF 3.71%
18
GuidePath® Tactical Allocation FundMANAGER’S DISCUSSION OF FUND PERFORMANCE (Unaudited)
TOTAL RETURN BASED ON A $10,000 INVESTMENT
$5,000
$10,000
$15,000
$25,000
$20,000
3/31/213/31/20
GuidePath® Tactical Allocation Fund - Service SharesS&P 500® Daily Risk Control 10% Index
$21,677
$15,481
3/31/193/31/183/31/173/31/163/31/153/31/143/31/133/31/124/29/11
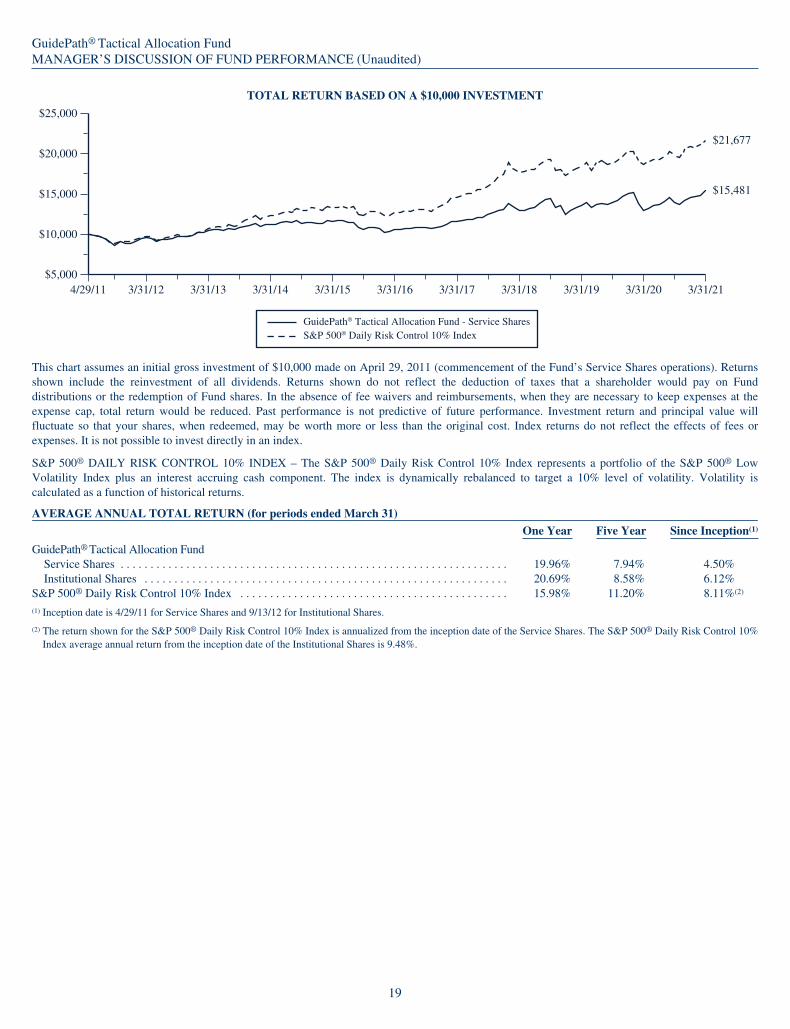
This chart assumes an initial gross investment of $10,000 made on April 29, 2011 (commencement of the Fund’s Service Shares operations). Returnsshown include the reinvestment of all dividends. Returns shown do not reflect the deduction of taxes that a shareholder would pay on Funddistributions or the redemption of Fund shares. In the absence of fee waivers and reimbursements, when they are necessary to keep expenses at theexpense cap, total return would be reduced. Past performance is not predictive of future performance. Investment return and principal value willfluctuate so that your shares, when redeemed, may be worth more or less than the original cost. Index returns do not reflect the effects of fees orexpenses. It is not possible to invest directly in an index.
S&P 500® DAILY RISK CONTROL 10% INDEX – The S&P 500® Daily Risk Control 10% Index represents a portfolio of the S&P 500® LowVolatility Index plus an interest accruing cash component. The index is dynamically rebalanced to target a 10% level of volatility. Volatility iscalculated as a function of historical returns.
AVERAGE ANNUAL TOTAL RETURN (for periods ended March 31)
One Year Five Year Since Inception(1)
GuidePath® Tactical Allocation FundService Shares . . . . . . . . . . . . . . . . . . . . . . . . . . . . . . . . . . . . . . . . . . . . . . . . . . . . . . . . . . . . . . . . . 19.96% 7.94% 4.50%Institutional Shares . . . . . . . . . . . . . . . . . . . . . . . . . . . . . . . . . . . . . . . . . . . . . . . . . . . . . . . . . . . . . 20.69% 8.58% 6.12%
S&P 500® Daily Risk Control 10% Index . . . . . . . . . . . . . . . . . . . . . . . . . . . . . . . . . . . . . . . . . . . . . 15.98% 11.20% 8.11%(2)
(1) Inception date is 4/29/11 for Service Shares and 9/13/12 for Institutional Shares.
(2) The return shown for the S&P 500® Daily Risk Control 10% Index is annualized from the inception date of the Service Shares. The S&P 500® Daily Risk Control 10%Index average annual return from the inception date of the Institutional Shares is 9.48%.
19

GuidePath® Tactical Allocation FundMANAGER’S DISCUSSION OF FUND PERFORMANCE (Continued) (Unaudited)
‰ For the 12 months ended March 31, 2021, the Fund’s Service Shares returned 20.0%, outperforming the S&P® 500 Daily Risk Control 10% Index at16.0%.
‰ Overweight equity positioning relative to the benchmark during the period contributed positively to returns. In the market rally, the Fund added backequity exposure at a faster pace when compared to its benchmark.
‰ Construction related themes within the industrials sector benefitted Fund returns. Residential homebuilder industry exposure contributed to gains asa result of strong housing demand amidst a low interest rate environment.
‰ Overweight exposure to the utilities and consumer staples sectors which were the bottom two performing sectors during the period dampened Fundreturns. Exposure to the insurance industry and financial ratings agencies also detracted from the Fund’s results for the period.
Components of Portfolio Holdings*
U.S. Equities 80%
Short TermInvestments 20%
* Pie chart represents percentages of total portfolio, less securities lending collateral.
Top Ten Holdings
Rank Security/Holding% of Net
Assets
1 Vanguard S&P 500 ETF 8.91%
2 Target Corp. 7.62%
3 Apple, Inc. 4.12%
4 Cognizant Technology Solutions Corp. 3.71%
5 CVS Health Corp. 3.28%
6 Cadence Design Systems, Inc. 2.95%
7 Aflac, Inc. 2.91%
8 Clorox Co. 2.77%
9 Newmont Corp. 2.75%
10 Bio-Rad Laboratories, Inc. 2.64%
20

GuidePath® Absolute Return Allocation FundMANAGER’S DISCUSSION OF FUND PERFORMANCE (Unaudited)
TOTAL RETURN BASED ON A $10,000 INVESTMENT
$5,000
$10,000
$15,000
3/31/213/31/20
GuidePath® Absolute Return Allocation Fund - Service SharesFTSE 3-Month Treasury Bill Index
$12,966
$10,618
3/31/193/31/183/31/173/31/163/31/153/31/143/31/133/31/124/29/11
This chart assumes an initial gross investment of $10,000 made on April 29, 2011 (commencement of the Fund’s Service Shares operations). Returnsshown include the reinvestment of all dividends. Returns shown do not reflect the deduction of taxes that a shareholder would pay on Funddistributions or the redemption of Fund shares. In the absence of fee waivers and reimbursements, when they are necessary to keep expenses at theexpense cap, total return would be reduced. Past performance is not predictive of future performance. Investment return and principal value willfluctuate so that your shares, when redeemed, may be worth more or less than the original cost. Index returns do not reflect the effects of fees orexpenses. It is not possible to invest directly in an index.
FTSE 3-MONTH TREASURY BILL INDEX – The FTSE 3-Month Treasury Bill Index tracks the performance of U.S. Treasury Bills with aremaining maturity of three months.
AVERAGE ANNUAL TOTAL RETURN (for periods ended March 31)
One Year Five Year Since Inception(1)
GuidePath® Absolute Return Allocation FundService Shares . . . . . . . . . . . . . . . . . . . . . . . . . . . . . . . . . . . . . . . . . . . . . . . . . . . . . . . . . . . . . . . . . 8.26% 4.01% 2.65%Institutional Shares . . . . . . . . . . . . . . . . . . . . . . . . . . . . . . . . . . . . . . . . . . . . . . . . . . . . . . . . . . . . . 8.92% 4.62% 3.41%
FTSE 3-Month Treasury Bill Index . . . . . . . . . . . . . . . . . . . . . . . . . . . . . . . . . . . . . . . . . . . . . . . . . . 0.21% 1.15% 0.61%(2)
(1) Inception date is 4/29/11 for Service Shares and 9/13/12 for Institutional Shares.
(2) The return shown for the FTSE 3-Month Treasury Bill Index is annualized from the inception date of the Service Shares. The FTSE 3-Month Treasury Bill Indexaverage annual return from the inception date of the Institutional Shares is 0.69%.
21

GuidePath® Absolute Return Allocation FundMANAGER’S DISCUSSION OF FUND PERFORMANCE (Continued) (Unaudited)
‰ For the 12 months ended March 31, 2021, the Fund’s Service Shares returned 8.3%, outperforming the FTSE 3-Month Treasury Bill Index at 0.2%.
‰ Exposure to high yield bonds, emerging market government bonds, low duration bonds and investment grade corporate bonds helped drive theFund’s relative outperformance during the period.
‰ Returns from a small exposure to global equities benefitted Fund returns during the period, as global economies reopened and the economic outlookturned positive.
‰ Exposure to mortgage-backed securities and to US Treasuries across the curve detracted from Fund returns for the period as the Federal Reservesignaled lower interest rates are expected to persist for longer.
Components of Portfolio Holdings*Emerging MarketsEquities <1%
U.S. FixedIncome 74%
Alternatives 9%
InternationalEquities <1%
U.S. Equities 3%
Emerging MarketsFixed Income 12%
Short TermInvestments 2%
* Pie chart represents percentages of total portfolio, less securities lending collateral.
Top Ten Holdings
Rank Security/Holding% of Net
Assets
1 Vanguard Mortgage-Backed Securities ETF 13.13%
2 Vanguard Emerging Markets Government Bond ETF 11.90%
3 DoubleLine Total Return Bond Fund – Institutional Shares 10.40%
4 ProShares Investment Grade-Interest Rate Hedged ETF 8.63%
5 DoubleLine Flexible Income Fund – Institutional Shares 7.47%
6 BlackRock Low Duration Bond Portfolio – Institutional Shares 7.24%
7 DoubleLine Low Duration Bond Fund – Institutional Shares 7.23%
8 SPDR Bloomberg Barclays High Yield Bond ETF 6.52%
9 Xtrackers USD High Yield Corporate Bond ETF 6.52%
10 Schwab Short-Term U.S. Treasury ETF 4.97%
22

GuidePath® Multi-Asset Income Allocation FundMANAGER’S DISCUSSION OF FUND PERFORMANCE (Unaudited)
TOTAL RETURN BASED ON A $10,000 INVESTMENT
$5,000
$10,000
$20,000
$15,000
3/31/213/31/20
GuidePath® Multi-Asset Income Allocation Fund - Service SharesMorningstar Multi-Asset High Income Index
$15,032$13,881
3/31/193/31/183/31/173/31/163/31/153/31/143/31/138/31/12
This chart assumes an initial gross investment of $10,000 made on August 31, 2012 (commencement of the Fund’s operations). Returns shown includethe reinvestment of all dividends. Returns shown do not reflect the deduction of taxes that a shareholder would pay on Fund distributions or theredemption of Fund shares. In the absence of fee waivers and reimbursements, when they are necessary to keep expenses at the expense cap, totalreturn would be reduced. Past performance is not predictive of future performance. Investment return and principal value will fluctuate so that yourshares, when redeemed, may be worth more or less than the original cost. Index returns do not reflect the effects of fees or expenses. It is not possibleto invest directly in an index.
MORNINGSTAR MULTI-ASSET HIGH INCOME INDEX – The Morningstar Multi-Asset High Income Index is a broadly diversified index thatseeks to deliver high current income while maintaining long-term capital appreciation.
AVERAGE ANNUAL TOTAL RETURN (for periods ended March 31)
One Year Five Years Since Inception(1)
GuidePath® Multi-Asset Income Allocation FundService Shares . . . . . . . . . . . . . . . . . . . . . . . . . . . . . . . . . . . . . . . . . . . . . . . . . . . . . . . . . . . . . . . . 28.42% 5.67% 4.86%
Morningstar Multi-Asset High Income Index . . . . . . . . . . . . . . . . . . . . . . . . . . . . . . . . . . . . . . . . . . 22.71% 4.60% 3.90%(1) Inception date is 8/31/12.
23

GuidePath® Multi-Asset Income Allocation FundMANAGER’S DISCUSSION OF FUND PERFORMANCE (Continued) (Unaudited)
‰ For the 12 months ended March 31, 2021, the Fund’s Service Shares returned 28.4%, outperforming the Morningstar Multi-Asset High IncomeIndex at 22.7%.
‰ Exposure to global dividend and US small cap dividend equity securities was the primary driver of the Fund’s returns for the period as globaleconomies started to reopen and the economic outlook turned positive. Global REITs and global infrastructure equity exposures also benefitted Fundperformance, specifically in the latter part of the period.
‰ The Fund’s returns were boosted by high yield bond exposure which was aided by the Federal Reserve’s asset purchase program and investordemand for riskier fixed income securities. Floating rate notes and emerging market bonds were also additive to the Fund’s performance.
‰ Exposure to mortgage-backed securities and to US Treasuries across the curve detracted from Fund returns as the Federal Reserve signaled lowerinterest rates are expected to persist for longer.
Components of Portfolio Holdings*
Emerging MarketsFixed Income 2%
U.S. Equities 35%
U.S. FixedIncome 34%
Short TermInvestments 1%
Emerging MarketsEquities 5%
InternationalEquities 11%
Multi-Asset 5%
Real Estate 5%
Opportunistic FixedIncome 2%
* Pie chart represents percentages of total portfolio, less securities lending collateral.
Top Ten Holdings
Rank Security/Holding% of Net
Assets
1 Global X U.S. Preferred ETF 6.85%
2 Vanguard High-Yield Corporate Fund – Admiral Shares 6.48%
3 Vanguard High Dividend Yield ETF 5.90%
4 Schwab U.S. Dividend Equity ETF 5.27%
5 Vanguard Long-Term Treasury ETF 5.17%
6 Loomis Sayles Global Allocation Fund – Class Y 5.00%
7 iShares 0-5 Year High Yield Corporate Bond ETF 4.95%
8 WisdomTree U.S. Large Cap Dividend Fund 4.93%
9 iShares Select Dividend ETF 4.82%
10 iShares International Select Dividend ETF 4.21%
24

GuidePath® Flexible Income Allocation FundMANAGER’S DISCUSSION OF FUND PERFORMANCE (Unaudited)
TOTAL RETURN BASED ON A $10,000 INVESTMENT
$9,000
$10,000
$11,000
$12,000
$14,000
$13,000 $13,050$12,576
8/31/12 3/31/13 3/31/14 3/31/15 3/31/16 3/31/17 3/31/18 3/31/19 3/31/20 3/31/21
GuidePath® Flexible Income Allocation Fund - Service SharesBloomberg Barclays U.S. Aggregate Bond Index
This chart assumes an initial gross investment of $10,000 made on August 31, 2012 (commencement of the Fund’s Service Shares operations). Returnsshown include the reinvestment of all dividends. Returns shown do not reflect the deduction of taxes that a shareholder would pay on Funddistributions or the redemption of Fund shares. In the absence of fee waivers and reimbursements, when they are necessary to keep expenses at theexpense cap, total return would be reduced. Past performance is not predictive of future performance. Investment return and principal value willfluctuate so that your shares, when redeemed, may be worth more or less than the original cost. Index returns do not reflect the effects of fees orexpenses. It is not possible to invest directly in an index.
BLOOMBERG BARCLAYS U.S. AGGREGATE BOND INDEX – The Bloomberg Barclays U.S. Aggregate Bond Index is a broad-based benchmarkthat measures the investment-grade, U.S. dollar-denominated, fixed-rate taxable bond market, including Treasuries, government-related and corporatedebt securities, mortgage- and asset-backed securities. All securities contained in the Bloomberg Barclays U.S. Aggregate Bond Index have aminimum term to maturity of one year.
AVERAGE ANNUAL TOTAL RETURN (for periods ended March 31)
One Year Five Years Since Inception(1)
GuidePath® Flexible Income Allocation FundService Shares . . . . . . . . . . . . . . . . . . . . . . . . . . . . . . . . . . . . . . . . . . . . . . . . . . . . . . . . . . . . . . . . 15.38% 5.13% 3.15%Institutional Shares . . . . . . . . . . . . . . . . . . . . . . . . . . . . . . . . . . . . . . . . . . . . . . . . . . . . . . . . . . . . . 16.10% 5.74% 3.85%
Bloomberg Barclays U.S. Aggregate Bond Index . . . . . . . . . . . . . . . . . . . . . . . . . . . . . . . . . . . . . . . 0.71% 3.10% 2.71%(2)
(1) Inception date is 8/31/12 for Service Shares and 9/13/12 for Institutional Shares.
(2) The return shown for the Bloomberg Barclays U.S. Aggregate Bond Index is from the inception date of the Service Shares. The Bloomberg Barclays U.S. AggregateBond Index return from the inception date of the Institutional Shares is 2.77%.
25

GuidePath® Flexible Income Allocation FundMANAGER’S DISCUSSION OF FUND PERFORMANCE (Continued) (Unaudited)
‰ For the 12 months ended March 31, 2021, the Fund’s Service Shares returned 15.4%, outperforming the Bloomberg Barclays U.S. Aggregate BondIndex at 0.7%.
‰ Positioning in high yield bonds, convertible bonds, emerging market government bonds and Treasury Inflation-Protected Securities (TIPS) resultedin strong returns and was the main driver of the Fund’s outperformance relative to the benchmark for the 12 month period.
‰ A small allocation to equity, specifically technology industries, added to the Fund’s returns as the technology sector saw strong returns during theperiod.
‰ Exposure to US Treasuries across the curve detracted from Fund returns as the Federal Reserve signaled lower interest rates are expected to persistfor longer.
Components of Portfolio Holdings*
U.S. FixedIncome 93%
Short TermInvestments <1%
InternationalEquities 7%
* Pie chart represents percentages of total portfolio, less securities lending collateral.
Top Ten Holdings
Rank Security/Holding% of Net
Assets
1 BlackRock High Yield Portfolio – Institutional Shares 13.39%
2 Xtrackers USD High Yield Corporate Bond ETF 8.15%
3 Schwab Short-Term U.S. Treasury ETF 7.98%
4 Vanguard Short-Term Treasury ETF 7.98%
5 SPDR Portfolio Short Term Treasury ETF 7.42%
6 Vanguard High-Yield Corporate Fund – Admiral Shares 6.76%
7 SPDR Portfolio Aggregate Bond ETF 6.56%
8 Schwab U.S. TIPS ETF 6.30%
9 iShares Convertible Bond ETF 4.99%
10 SPDR Bloomberg Barclays High Yield Bond ETF 4.75%
26

GuidePath® Managed Futures Strategy FundMANAGER’S DISCUSSION OF FUND PERFORMANCE (Unaudited)
TOTAL RETURN BASED ON A $10,000 INVESTMENT
$5,000
$10,000
$15,000
3/31/213/31/20
GuidePath® Managed Futures Strategy Fund - Service SharesFTSE 3-Month Treasury Bill IndexSG Trend Index
$10,183$10,594
$10,068
3/31/173/31/16 3/31/18 3/31/191/19/16
This chart assumes an initial gross investment of $10,000 made on January 19, 2016 (commencement of the Fund’s operations). Returns shown includethe reinvestment of all dividends. Returns shown do not reflect the deduction of taxes that a shareholder would pay on Fund distributions or theredemption of Fund shares. In the absence of fee waivers and reimbursements, when they are necessary to keep expenses at the expense cap, totalreturn would be reduced. Past performance is not predictive of future performance. Investment return and principal value will fluctuate so that yourshares, when redeemed, may be worth more or less than the original cost. Index returns do not reflect the effects of fees or expenses. It is not possibleto invest directly in an index.
FTSE 3-MONTH TREASURY BILL INDEX – The FTSE 3-Month Treasury Bill Index tracks the performance of U.S. Treasury Bills with aremaining maturity of three months.
SG TREND INDEX – The SG Trend Index is designed to track the 10 largest (by AUM) trend following commodity trading advisors and berepresentative of the trend followers in the managed futures space. Managers must meet the following criteria: must be open to new investment, mustreport returns on a daily basis, must be an industry recognized trend follower as determined at the discretion of the SG Index Committee, and mustexhibit significant correlation to trend following peers and the SG Trend Indicator. Currently, one of the ten managers whose performance is trackedby the index is AlphaSimplex Group LLC, sub-advisor to the GuidePath® Managed Futures Strategy Fund.
AVERAGE ANNUAL TOTAL RETURN (for periods ended March 31)
One Year Five Years Since Inception(1)
GuidePath® Managed Futures Strategy FundService Shares . . . . . . . . . . . . . . . . . . . . . . . . . . . . . . . . . . . . . . . . . . . . . . . . . . . . . . . . . . . . . . . . 10.84% 0.91% 0.35%Institutional Shares . . . . . . . . . . . . . . . . . . . . . . . . . . . . . . . . . . . . . . . . . . . . . . . . . . . . . . . . . . . . . 11.46% 1.49% 0.94%
FTSE 3-Month Treasury Bill Index . . . . . . . . . . . . . . . . . . . . . . . . . . . . . . . . . . . . . . . . . . . . . . . . . . 0.21% 1.15% 1.12%SG Trend Index . . . . . . . . . . . . . . . . . . . . . . . . . . . . . . . . . . . . . . . . . . . . . . . . . . . . . . . . . . . . . . . . . 8.02% 0.62% 0.17%(1) Inception date is 1/19/16 for Service Shares and Institutional Shares.
27

GuidePath® Managed Futures Strategy FundMANAGER’S DISCUSSION OF FUND PERFORMANCE (Continued) (Unaudited)
‰ For the 12 months ended March 31, 2021, the Fund’s Service Shares returned 10.8%, outperforming the SG Trend Index at 8.0%.
‰ Long exposures to global equities were a significant driver of the Fund’s returns as equity markets consistently trended higher during the 12 monthperiod.
‰ Long exposures to precious metals and grain commodities, along with net short US dollar exposure were positive contributors to the Fund’s returnsfor the period, as the US dollar weakened amid unprecedented monetary and fiscal policy interventions in response to the COVID-19 pandemic.
‰ Long exposures to global bonds were a headwind to Fund returns as interest rates rose during the period due to inflationary forces and strongerglobal growth.
Components of Portfolio Holdings*Short Term Investments - Certificate of Deposit 34%
Short Term Investments -Money Market Fund 7%
Short Term Investments -U.S. Treasury Bill 59%
* Pie chart represents percentages of total portfolio.Percentages expressed exclude derivative instruments, such as futures and forward currency contracts.
Top Ten Holdings
Rank Security/Holding% of Net
Assets
The GuidePath® Managed Futures Strategy Fund did not hold any long terminvestments as of March 31, 2021.
28
GuidePath® Conservative Income FundMANAGER’S DISCUSSION OF FUND PERFORMANCE (Unaudited)
TOTAL RETURN BASED ON A $10,000 INVESTMENT
$5,000
$10,000
$15,000
3/31/213/31/20
GuidePath® Conservative Income FundBloomberg Barclays U.S. 1-3 Year Treasury Bond Index
9/30/19 9/30/20
$10,884$10,296
3/31/199/30/184/30/18
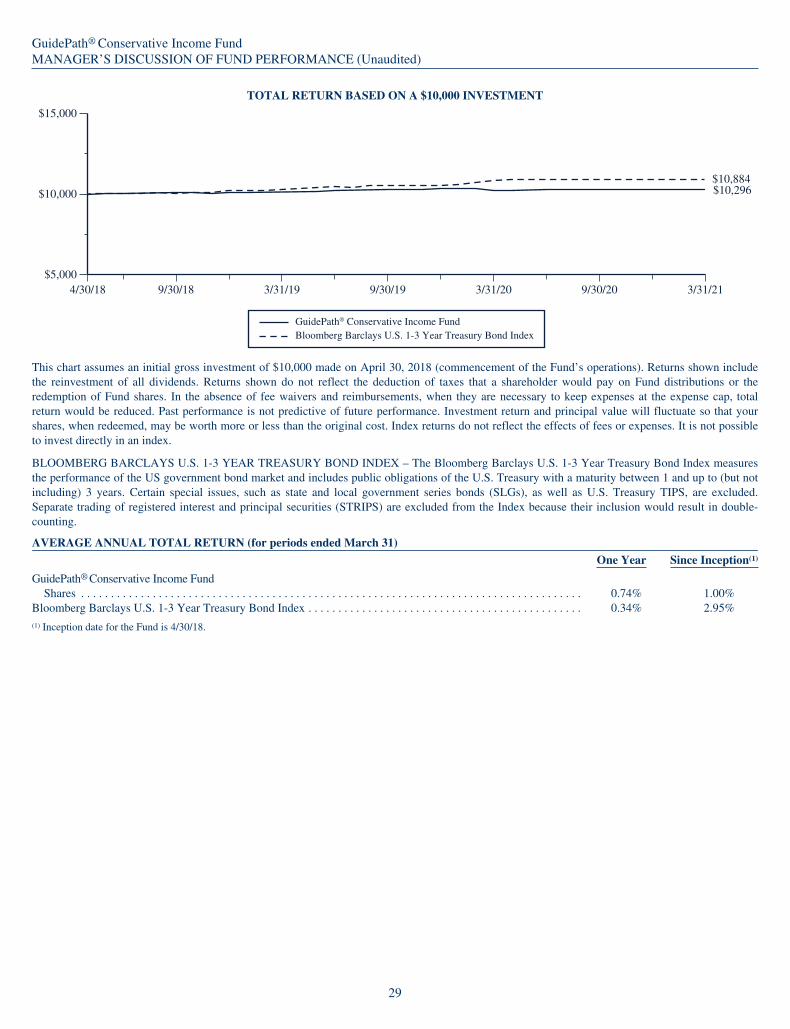
This chart assumes an initial gross investment of $10,000 made on April 30, 2018 (commencement of the Fund’s operations). Returns shown includethe reinvestment of all dividends. Returns shown do not reflect the deduction of taxes that a shareholder would pay on Fund distributions or theredemption of Fund shares. In the absence of fee waivers and reimbursements, when they are necessary to keep expenses at the expense cap, totalreturn would be reduced. Past performance is not predictive of future performance. Investment return and principal value will fluctuate so that yourshares, when redeemed, may be worth more or less than the original cost. Index returns do not reflect the effects of fees or expenses. It is not possibleto invest directly in an index.
BLOOMBERG BARCLAYS U.S. 1-3 YEAR TREASURY BOND INDEX – The Bloomberg Barclays U.S. 1-3 Year Treasury Bond Index measuresthe performance of the US government bond market and includes public obligations of the U.S. Treasury with a maturity between 1 and up to (but notincluding) 3 years. Certain special issues, such as state and local government series bonds (SLGs), as well as U.S. Treasury TIPS, are excluded.Separate trading of registered interest and principal securities (STRIPS) are excluded from the Index because their inclusion would result in double-counting.
AVERAGE ANNUAL TOTAL RETURN (for periods ended March 31)
One Year Since Inception(1)
GuidePath® Conservative Income FundShares . . . . . . . . . . . . . . . . . . . . . . . . . . . . . . . . . . . . . . . . . . . . . . . . . . . . . . . . . . . . . . . . . . . . . . . . . . . . . . . . . . . . 0.74% 1.00%
Bloomberg Barclays U.S. 1-3 Year Treasury Bond Index . . . . . . . . . . . . . . . . . . . . . . . . . . . . . . . . . . . . . . . . . . . . . . 0.34% 2.95%(1) Inception date for the Fund is 4/30/18.
29

GuidePath® Conservative Income FundMANAGER’S DISCUSSION OF FUND PERFORMANCE (Continued) (Unaudited)
‰ For the 12 months ended March 31, 2021, the Fund returned 0.7%, outperforming the Bloomberg Barclays U.S. 1-3 Year Treasury Bond Index at0.3%.
‰ Exposure to high yield credit and inflation-linked bonds boosted Fund returns for the period as risk assets continued to price in a strengtheningglobal economic rebound.
‰ A target allocation of 50% to cash equivalents dampened the Fund’s returns for the period, as the Federal Reserve signaled the intention to keepshort-term rates lower for longer.
Components of Portfolio Holdings*
U.S. FixedIncome 52%
Short Term Investments 48%
* Pie chart represents percentages of total portfolio, less securities lending collateral.
Top Ten Holdings
Rank Security/Holding% of Net
Assets
1 iShares 0-5 Year Investment Grade Corporate Bond ETF 20.79%
2 iShares 0-5 Year TIPS Bond ETF 10.52%
3 iShares 0-5 Year High Yield Corporate Bond ETF 7.86%
4 Schwab Short-Term U.S. Treasury ETF 7.77%
5 SPDR Bloomberg Barclays Investment Grade Floating Rate ETF 5.10%
30

GuidePath® Income FundMANAGER’S DISCUSSION OF FUND PERFORMANCE (Unaudited)
TOTAL RETURN BASED ON A $10,000 INVESTMENT
$9,000
$10,000
$11,000
$13,000
$12,000
$11,548
$10,624
GuidePath® Income FundBloomberg Barclays U.S. Aggregate Bond Index
4/30/18 9/30/18 3/31/19 9/30/19 9/30/209/30/203/31/20
This chart assumes an initial gross investment of $10,000 made on April 30, 2018 (commencement of the Fund’s operations). Returns shown includethe reinvestment of all dividends. Returns shown do not reflect the deduction of taxes that a shareholder would pay on Fund distributions or theredemption of Fund shares. In the absence of fee waivers and reimbursements, when they are necessary to keep expenses at the expense cap, totalreturn would be reduced. Past performance is not predictive of future performance. Investment return and principal value will fluctuate so that yourshares, when redeemed, may be worth more or less than the original cost. Index returns do not reflect the effects of fees or expenses. It is not possibleto invest directly in an index.
BLOOMBERG BARCLAYS U.S. AGGREGATE BOND INDEX – The Bloomberg Barclays U.S. Aggregate Bond Index is a broad-based benchmarkthat measures the investment-grade, U.S. dollar-denominated, fixed-rate taxable bond market, including Treasuries, government-related and corporatedebt securities, mortgage- and asset-backed securities. All securities contained in the Bloomberg Barclays U.S. Aggregate Bond Index have aminimum term to maturity of one year.
AVERAGE ANNUAL TOTAL RETURN (for periods ended March 31)
One Year Since Inception(1)
GuidePath® Income FundShares . . . . . . . . . . . . . . . . . . . . . . . . . . . . . . . . . . . . . . . . . . . . . . . . . . . . . . . . . . . . . . . . . . . . . . . . . . . . . . . . . . . . 2.79% 2.10%
Bloomberg Barclays U.S. Aggregate Bond Index . . . . . . . . . . . . . . . . . . . . . . . . . . . . . . . . . . . . . . . . . . . . . . . . . . . . 0.71% 5.06%(1) Inception date for the Fund is 4/30/18.
31

GuidePath® Income FundMANAGER’S DISCUSSION OF FUND PERFORMANCE (Continued) (Unaudited)
‰ For the 12 months ended March 31, 2021, the Fund returned 2.8%, outperforming the Bloomberg Barclays U.S. Aggregate Bond Index at 0.7%.
‰ Exposure to high yield credit (both domestic and emerging market) and inflation-linked bonds boosted Fund returns for the period as risk assetscontinued to price in a strengthening global economic rebound.
‰ Exposure to US Treasuries through holding core bond ETFs detracted from the Fund’s returns as interest rose during the period, signaling a globaleconomic rebound.
Components of Portfolio Holdings*
U.S. FixedIncome 78%
Short TermInvestments 2%
Emerging MarketsFixed Income 15%
U.S. Equities 5%
* Pie chart represents percentages of total portfolio, less securities lending collateral.
Top Ten Holdings
Rank Security/Holding% of Net
Assets
1 iShares Core U.S. Aggregate Bond ETF 43.38%
2 SPDR Bloomberg Barclays High Yield Bond ETF 19.18%
3 VanEck Vectors Emerging Markets High Yield Bond ETF 15.57%
4 Schwab U.S. TIPS ETF 9.97%
5 Vanguard Total Bond Market ETF 5.82%
6 iShares Preferred & Income Securities ETF 4.93%
32

GuidePath® Growth and Income FundMANAGER’S DISCUSSION OF FUND PERFORMANCE (Unaudited)
TOTAL RETURN BASED ON A $10,000 INVESTMENT
$5,000
$10,000
$15,000
3/31/213/31/20
GuidePath® Growth and Income FundMSCI USA High Dividend Yield Index
9/30/19 9/30/20
$13,456
$12,301
3/31/199/30/184/30/18
This chart assumes an initial gross investment of $10,000 made on April 30, 2018 (commencement of the Fund’s operations). Returns shown includethe reinvestment of all dividends. Returns shown do not reflect the deduction of taxes that a shareholder would pay on Fund distributions or theredemption of Fund shares. In the absence of fee waivers and reimbursements, when they are necessary to keep expenses at the expense cap, totalreturn would be reduced. Past performance is not predictive of future performance. Investment return and principal value will fluctuate so that yourshares, when redeemed, may be worth more or less than the original cost. Index returns do not reflect the effects of fees or expenses. It is not possibleto invest directly in an index.
MSCI USA HIGH DIVIDEND YIELD INDEX – The MSCI USA High Dividend Yield Index is based on the MSCI USA Index, its parent index, andincludes large and mid cap stocks. The index is designed to reflect the performance of equities in the parent index (excluding REITs) with higherdividend income and quality characteristics than average dividend yields that are both sustainable and persistent. The index also applies quality screensand reviews 12-month past performance to omit stocks with potentially deteriorating fundamentals that could force them to cut or reduce dividends.
AVERAGE ANNUAL TOTAL RETURN (for periods ended March 31)
One Year Since Inception(1)
GuidePath® Growth and Income FundShares . . . . . . . . . . . . . . . . . . . . . . . . . . . . . . . . . . . . . . . . . . . . . . . . . . . . . . . . . . . . . . . . . . . . . . . . . . . . . . . . . . . . 35.67% 7.36%
MSCI USA High Dividend Yield Index . . . . . . . . . . . . . . . . . . . . . . . . . . . . . . . . . . . . . . . . . . . . . . . . . . . . . . . . . . . 39.22% 10.71%(1) Inception date for the Fund is 4/30/18.
33

GuidePath® Growth and Income FundMANAGER’S DISCUSSION OF FUND PERFORMANCE (Continued) (Unaudited)
‰ For the 12 months ended March 31, 2021, the Fund returned 35.7%, trailing the MSCI USA High Dividend Yield Index at 39.2%.
‰ Exposure to S&P 500® Index component stocks boosted Fund returns, as dividend-oriented stocks generally lagged their core and growthcounterparts during the period.
‰ The Fund’s put-write strategy was a slight detractor from returns during the period, as put-write strategies tend to lag the broader equity market instrongly rising market conditions.
‰ The Fund’s volatility targeting component detracted from returns as volatility receded at a much slower pace than the equity market advanced.
Components of Portfolio Holdings*ConsumerDiscretionary 5%
ConsumerStaples 12%
Financials 9%
Health Care 14%
Industrials 9%Materials 1%
CommunicationServices 4%
Short TermInvestments 32%
InformationTechnology 9%
Utilities 5%
* Pie chart represents percentages of total portfolio, less securities lending collateral.Percentages expressed exclude derivative instruments, such as futures and written options.
Top Ten Holdings
Rank Security/Holding% of Net
Assets
1 Vanguard High Dividend Yield ETF 30.02%
2 Global X MLP ETF 4.88%
3 U.S. Treasury Note, 1.750%, 11/30/2021 3.49%
4 U.S. Treasury Note, 1.125%, 9/30/2021 3.47%
5 U.S. Treasury Note, 1.125%, 6/30/2021 3.46%
6 Johnson & Johnson 1.50%
7 Home Depot, Inc. 1.34%
8 Procter & Gamble Co. 1.23%
9 Intel Corp. 1.13%
10 Verizon Communications, Inc. 1.09%
34

GuideMark® Funds & GuidePath® FundsEXPENSE EXAMPLE (Unaudited)March 31, 2021
As a shareholder of the GuideMark® & GuidePath® Funds (the “Funds”), you incur ongoing costs, including management fees, distribution and/orservice fees, and other Fund expenses. The Expense Example shown in this section is intended to help you understand your ongoing costs (in dollars)of investing in the Funds and to compare these costs with the ongoing costs of investing in other mutual funds.
The Expense Examples are based on an investment of $1,000 invested at the beginning of a six-month period and held for the entire period, which forall Funds is from October 1, 2020 to March 31, 2021.
Actual Expenses
The first line of the Expense Example table provides information about actual account values and actual expenses. You may use the information in thisline, together with the amount you invested, to estimate the expenses that you paid over the period. Simply divide your account value by $1,000 (forexample, an $8,600 account value divided by $1,000 = 8.6), then multiply the result by the number in the first line under the heading entitled“Expenses Paid During Period” to estimate the expenses you paid on your account during this period.
The example includes, but is not limited to, management fees, shareholder servicing fees, distribution fees, fund accounting fees, custody fees andtransfer agent fees. However, the example below does not include portfolio trading commissions and related expenses, interest expense or dividends onshort positions taken by a Fund and other extraordinary expenses as determined under U.S. generally accepted accounting principles. To the extent thata Fund invests in shares of other investment companies as part of its investment strategy, you will indirectly bear your proportionate share of any feesand expenses charged by the underlying funds in which a Fund invests in addition to the expenses of the Fund. Actual expenses of the underlying fundsare expected to vary among the various underlying funds. These expenses are not included in the example below.
Hypothetical Example for Comparison Purposes
The second line of the table below provides information about hypothetical account values and hypothetical expenses based on each Fund’s actualexpenses ratios and an assumed rate of return of 5% per year before expenses, which is not the Fund’s actual return. The hypothetical account valuesand expenses may not be used to estimate the actual ending account balance or expenses you paid for the period. You may use this information tocompare the ongoing costs of investing in the Funds and other funds. To do so, compare this 5% hypothetical example with the 5% hypotheticalexamples that appear in the shareholder reports of the other funds.
Fund
BeginningAccount ValueOctober 1, 2020
EndingAccount ValueMarch 31, 2021
AnnualizedExpense Ratio1
based on the periodOctober 1, 2020 –March 31, 2021
Expenses PaidDuring Period2
October 1, 2020 –March 31, 2021
INSTITUTIONAL SHARES
GuideMark® Large CapCore Fund
Actual $1,000.00 $1,227.40 0.56% $3.11Hypothetical3 $1,000.00 $1,022.14 0.56% $2.82
GuideMark® Worldex-US Fund
Actual $1,000.00 $1,183.00 0.79% $4.30Hypothetical3 $1,000.00 $1,020.99 0.79% $3.98
GuidePath® GrowthAllocation Fund
Actual $1,000.00 $1,211.70 0.33% $1.82Hypothetical3 $1,000.00 $1,023.29 0.33% $1.66
GuidePath® ConservativeAllocation Fund
Actual $1,000.00 $1,093.60 0.16% $0.84Hypothetical3 $1,000.00 $1,024.13 0.16% $0.81
GuidePath® TacticalAllocation Fund
Actual $1,000.00 $1,114.10 0.47% $2.48Hypothetical3 $1,000.00 $1,022.59 0.47% $2.37
GuidePath® Absolute ReturnAllocation Fund
Actual $1,000.00 $1,022.70 0.26% $1.31Hypothetical3 $1,000.00 $1,023.64 0.26% $1.31
GuidePath® Flexible IncomeAllocation Fund
Actual $1,000.00 $1,040.20 0.26% $1.32Hypothetical3 $1,000.00 $1,023.64 0.26% $1.31
GuidePath® Managed FuturesStrategy Fund
Actual $1,000.00 $1,127.40 1.28% $6.79Hypothetical3 $1,000.00 $1,018.55 1.28% $6.44
1 The expense ratio excludes the securities lending credit.
2 Expenses (net of waivers, if applicable) are equal to the Fund’s annualized expense ratio, multiplied by the average account value over the period, multiplied by182/365 to reflect the one-half year period.
3 5% annualized return before expenses.
35
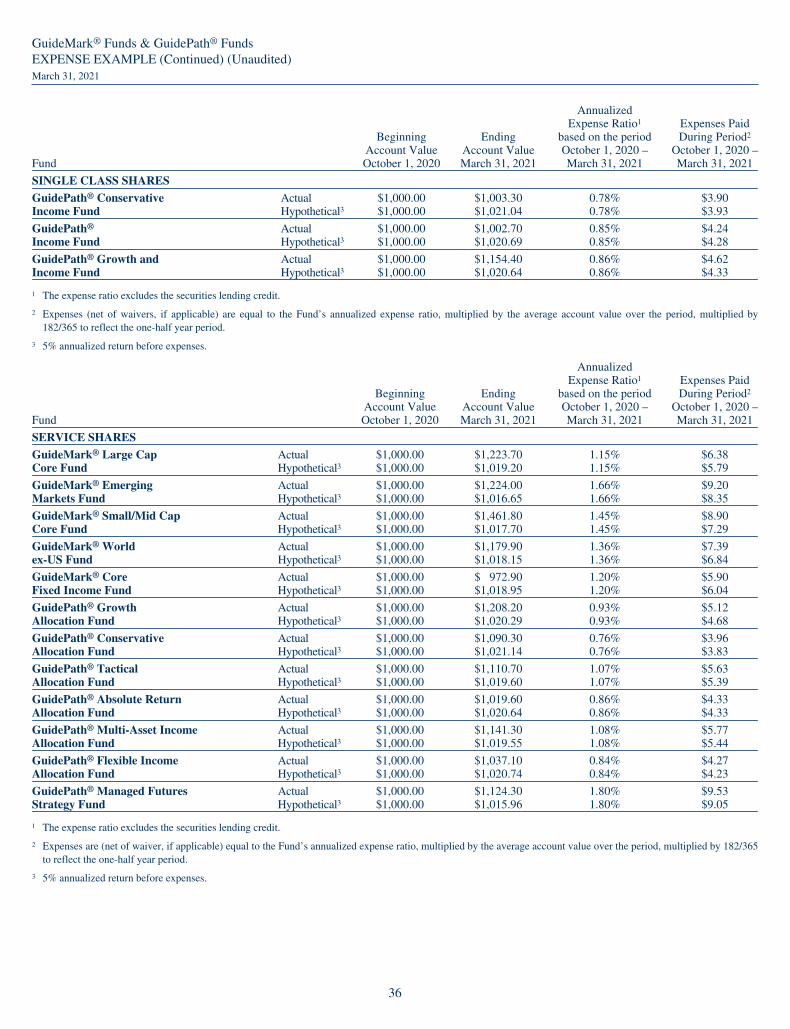
GuideMark® Funds & GuidePath® FundsEXPENSE EXAMPLE (Continued) (Unaudited)March 31, 2021
Fund
BeginningAccount ValueOctober 1, 2020
EndingAccount ValueMarch 31, 2021
AnnualizedExpense Ratio1
based on the periodOctober 1, 2020 –March 31, 2021
Expenses PaidDuring Period2
October 1, 2020 –March 31, 2021
SINGLE CLASS SHARES
GuidePath® ConservativeIncome Fund
Actual $1,000.00 $1,003.30 0.78% $3.90Hypothetical3 $1,000.00 $1,021.04 0.78% $3.93
GuidePath®
Income FundActual $1,000.00 $1,002.70 0.85% $4.24Hypothetical3 $1,000.00 $1,020.69 0.85% $4.28
GuidePath® Growth andIncome Fund
Actual $1,000.00 $1,154.40 0.86% $4.62Hypothetical3 $1,000.00 $1,020.64 0.86% $4.33
1 The expense ratio excludes the securities lending credit.
2 Expenses (net of waivers, if applicable) are equal to the Fund’s annualized expense ratio, multiplied by the average account value over the period, multiplied by182/365 to reflect the one-half year period.
3 5% annualized return before expenses.
Fund
BeginningAccount ValueOctober 1, 2020
EndingAccount ValueMarch 31, 2021
AnnualizedExpense Ratio1
based on the periodOctober 1, 2020 –March 31, 2021
Expenses PaidDuring Period2
October 1, 2020 –March 31, 2021
SERVICE SHARES
GuideMark® Large CapCore Fund
Actual $1,000.00 $1,223.70 1.15% $6.38Hypothetical3 $1,000.00 $1,019.20 1.15% $5.79
GuideMark® EmergingMarkets Fund
Actual $1,000.00 $1,224.00 1.66% $9.20Hypothetical3 $1,000.00 $1,016.65 1.66% $8.35
GuideMark® Small/Mid CapCore Fund
Actual $1,000.00 $1,461.80 1.45% $8.90Hypothetical3 $1,000.00 $1,017.70 1.45% $7.29
GuideMark® Worldex-US Fund
Actual $1,000.00 $1,179.90 1.36% $7.39Hypothetical3 $1,000.00 $1,018.15 1.36% $6.84
GuideMark® CoreFixed Income Fund
Actual $1,000.00 $ 972.90 1.20% $5.90Hypothetical3 $1,000.00 $1,018.95 1.20% $6.04
GuidePath® GrowthAllocation Fund
Actual $1,000.00 $1,208.20 0.93% $5.12Hypothetical3 $1,000.00 $1,020.29 0.93% $4.68
GuidePath® ConservativeAllocation Fund
Actual $1,000.00 $1,090.30 0.76% $3.96Hypothetical3 $1,000.00 $1,021.14 0.76% $3.83
GuidePath® TacticalAllocation Fund
Actual $1,000.00 $1,110.70 1.07% $5.63Hypothetical3 $1,000.00 $1,019.60 1.07% $5.39
GuidePath® Absolute ReturnAllocation Fund
Actual $1,000.00 $1,019.60 0.86% $4.33Hypothetical3 $1,000.00 $1,020.64 0.86% $4.33
GuidePath® Multi-Asset IncomeAllocation Fund
Actual $1,000.00 $1,141.30 1.08% $5.77Hypothetical3 $1,000.00 $1,019.55 1.08% $5.44
GuidePath® Flexible IncomeAllocation Fund
Actual $1,000.00 $1,037.10 0.84% $4.27Hypothetical3 $1,000.00 $1,020.74 0.84% $4.23
GuidePath® Managed FuturesStrategy Fund
Actual $1,000.00 $1,124.30 1.80% $9.53Hypothetical3 $1,000.00 $1,015.96 1.80% $9.05
1 The expense ratio excludes the securities lending credit.
2 Expenses are (net of waiver, if applicable) equal to the Fund’s annualized expense ratio, multiplied by the average account value over the period, multiplied by 182/365to reflect the one-half year period.
3 5% annualized return before expenses.
36
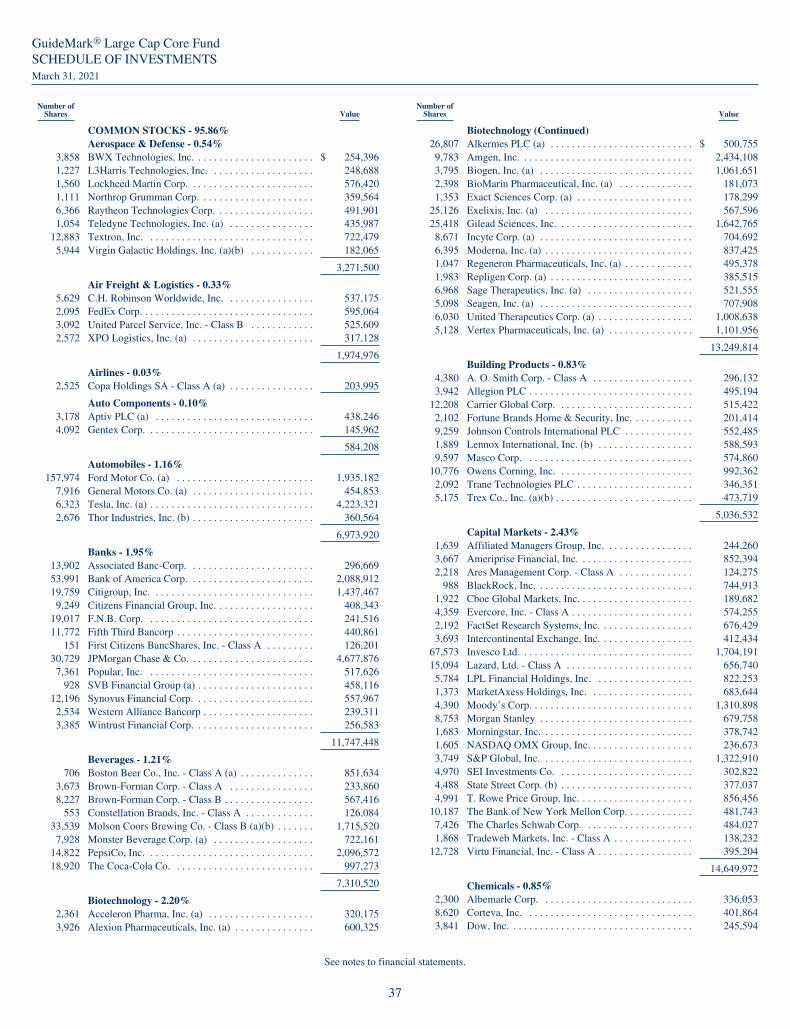
GuideMark® Large Cap Core FundSCHEDULE OF INVESTMENTSMarch 31, 2021
Number ofShares Value
COMMON STOCKS - 95.86%Aerospace & Defense - 0.54%
3,858 BWX Technologies, Inc. . . . . . . . . . . . . . . . . . . . . . . $ 254,3961,227 L3Harris Technologies, Inc. . . . . . . . . . . . . . . . . . . . 248,6881,560 Lockheed Martin Corp. . . . . . . . . . . . . . . . . . . . . . . . 576,4201,111 Northrop Grumman Corp. . . . . . . . . . . . . . . . . . . . . . 359,5646,366 Raytheon Technologies Corp. . . . . . . . . . . . . . . . . . . 491,9011,054 Teledyne Technologies, Inc. (a) . . . . . . . . . . . . . . . . 435,987
12,883 Textron, Inc. . . . . . . . . . . . . . . . . . . . . . . . . . . . . . . . 722,4795,944 Virgin Galactic Holdings, Inc. (a)(b) . . . . . . . . . . . . 182,065
3,271,500
Air Freight & Logistics - 0.33%5,629 C.H. Robinson Worldwide, Inc. . . . . . . . . . . . . . . . . 537,1752,095 FedEx Corp. . . . . . . . . . . . . . . . . . . . . . . . . . . . . . . . . 595,0643,092 United Parcel Service, Inc. - Class B . . . . . . . . . . . . 525,6092,572 XPO Logistics, Inc. (a) . . . . . . . . . . . . . . . . . . . . . . . 317,128
1,974,976
Airlines - 0.03%2,525 Copa Holdings SA - Class A (a) . . . . . . . . . . . . . . . . 203,995
Auto Components - 0.10%3,178 Aptiv PLC (a) . . . . . . . . . . . . . . . . . . . . . . . . . . . . . . 438,2464,092 Gentex Corp. . . . . . . . . . . . . . . . . . . . . . . . . . . . . . . . 145,962
584,208
Automobiles - 1.16%157,974 Ford Motor Co. (a) . . . . . . . . . . . . . . . . . . . . . . . . . . 1,935,182
7,916 General Motors Co. (a) . . . . . . . . . . . . . . . . . . . . . . . 454,8536,323 Tesla, Inc. (a) . . . . . . . . . . . . . . . . . . . . . . . . . . . . . . . 4,223,3212,676 Thor Industries, Inc. (b) . . . . . . . . . . . . . . . . . . . . . . . 360,564
6,973,920
Banks - 1.95%13,902 Associated Banc-Corp. . . . . . . . . . . . . . . . . . . . . . . . 296,66953,991 Bank of America Corp. . . . . . . . . . . . . . . . . . . . . . . . 2,088,91219,759 Citigroup, Inc. . . . . . . . . . . . . . . . . . . . . . . . . . . . . . . 1,437,4679,249 Citizens Financial Group, Inc. . . . . . . . . . . . . . . . . . . 408,343
19,017 F.N.B. Corp. . . . . . . . . . . . . . . . . . . . . . . . . . . . . . . . 241,51611,772 Fifth Third Bancorp . . . . . . . . . . . . . . . . . . . . . . . . . . 440,861
151 First Citizens BancShares, Inc. - Class A . . . . . . . . . 126,20130,729 JPMorgan Chase & Co. . . . . . . . . . . . . . . . . . . . . . . . 4,677,8767,361 Popular, Inc. . . . . . . . . . . . . . . . . . . . . . . . . . . . . . . . 517,626
928 SVB Financial Group (a) . . . . . . . . . . . . . . . . . . . . . . 458,11612,196 Synovus Financial Corp. . . . . . . . . . . . . . . . . . . . . . . 557,9672,534 Western Alliance Bancorp . . . . . . . . . . . . . . . . . . . . . 239,3113,385 Wintrust Financial Corp. . . . . . . . . . . . . . . . . . . . . . . 256,583
11,747,448
Beverages - 1.21%706 Boston Beer Co., Inc. - Class A (a) . . . . . . . . . . . . . . 851,634
3,673 Brown-Forman Corp. - Class A . . . . . . . . . . . . . . . . 233,8608,227 Brown-Forman Corp. - Class B . . . . . . . . . . . . . . . . . 567,416
553 Constellation Brands, Inc. - Class A . . . . . . . . . . . . . 126,08433,539 Molson Coors Brewing Co. - Class B (a)(b) . . . . . . . 1,715,5207,928 Monster Beverage Corp. (a) . . . . . . . . . . . . . . . . . . . 722,161
14,822 PepsiCo, Inc. . . . . . . . . . . . . . . . . . . . . . . . . . . . . . . . 2,096,57218,920 The Coca-Cola Co. . . . . . . . . . . . . . . . . . . . . . . . . . . 997,273
7,310,520
Biotechnology - 2.20%2,361 Acceleron Pharma, Inc. (a) . . . . . . . . . . . . . . . . . . . . 320,1753,926 Alexion Pharmaceuticals, Inc. (a) . . . . . . . . . . . . . . . 600,325
Number ofShares Value
Biotechnology (Continued)26,807 Alkermes PLC (a) . . . . . . . . . . . . . . . . . . . . . . . . . . . $ 500,7559,783 Amgen, Inc. . . . . . . . . . . . . . . . . . . . . . . . . . . . . . . . . 2,434,1083,795 Biogen, Inc. (a) . . . . . . . . . . . . . . . . . . . . . . . . . . . . . 1,061,6512,398 BioMarin Pharmaceutical, Inc. (a) . . . . . . . . . . . . . . 181,0731,353 Exact Sciences Corp. (a) . . . . . . . . . . . . . . . . . . . . . . 178,299
25,126 Exelixis, Inc. (a) . . . . . . . . . . . . . . . . . . . . . . . . . . . . 567,59625,418 Gilead Sciences, Inc. . . . . . . . . . . . . . . . . . . . . . . . . . 1,642,7658,671 Incyte Corp. (a) . . . . . . . . . . . . . . . . . . . . . . . . . . . . . 704,6926,395 Moderna, Inc. (a) . . . . . . . . . . . . . . . . . . . . . . . . . . . . 837,4251,047 Regeneron Pharmaceuticals, Inc. (a) . . . . . . . . . . . . . 495,3781,983 Repligen Corp. (a) . . . . . . . . . . . . . . . . . . . . . . . . . . . 385,5156,968 Sage Therapeutics, Inc. (a) . . . . . . . . . . . . . . . . . . . . 521,5555,098 Seagen, Inc. (a) . . . . . . . . . . . . . . . . . . . . . . . . . . . . . 707,9086,030 United Therapeutics Corp. (a) . . . . . . . . . . . . . . . . . . 1,008,6385,128 Vertex Pharmaceuticals, Inc. (a) . . . . . . . . . . . . . . . . 1,101,956
13,249,814
Building Products - 0.83%4,380 A. O. Smith Corp. - Class A . . . . . . . . . . . . . . . . . . . 296,1323,942 Allegion PLC . . . . . . . . . . . . . . . . . . . . . . . . . . . . . . . 495,194
12,208 Carrier Global Corp. . . . . . . . . . . . . . . . . . . . . . . . . . 515,4222,102 Fortune Brands Home & Security, Inc. . . . . . . . . . . . 201,4149,259 Johnson Controls International PLC . . . . . . . . . . . . . 552,4851,889 Lennox International, Inc. (b) . . . . . . . . . . . . . . . . . . 588,5939,597 Masco Corp. . . . . . . . . . . . . . . . . . . . . . . . . . . . . . . . 574,860
10,776 Owens Corning, Inc. . . . . . . . . . . . . . . . . . . . . . . . . . 992,3622,092 Trane Technologies PLC . . . . . . . . . . . . . . . . . . . . . . 346,3515,175 Trex Co., Inc. (a)(b) . . . . . . . . . . . . . . . . . . . . . . . . . . 473,719
5,036,532
Capital Markets - 2.43%1,639 Affiliated Managers Group, Inc. . . . . . . . . . . . . . . . . 244,2603,667 Ameriprise Financial, Inc. . . . . . . . . . . . . . . . . . . . . . 852,3942,218 Ares Management Corp. - Class A . . . . . . . . . . . . . . 124,275
988 BlackRock, Inc. . . . . . . . . . . . . . . . . . . . . . . . . . . . . . 744,9131,922 Cboe Global Markets, Inc. . . . . . . . . . . . . . . . . . . . . . 189,6824,359 Evercore, Inc. - Class A . . . . . . . . . . . . . . . . . . . . . . . 574,2552,192 FactSet Research Systems, Inc. . . . . . . . . . . . . . . . . . 676,4293,693 Intercontinental Exchange, Inc. . . . . . . . . . . . . . . . . . 412,434
67,573 Invesco Ltd. . . . . . . . . . . . . . . . . . . . . . . . . . . . . . . . . 1,704,19115,094 Lazard, Ltd. - Class A . . . . . . . . . . . . . . . . . . . . . . . . 656,7405,784 LPL Financial Holdings, Inc. . . . . . . . . . . . . . . . . . . 822,2531,373 MarketAxess Holdings, Inc. . . . . . . . . . . . . . . . . . . . 683,6444,390 Moody’s Corp. . . . . . . . . . . . . . . . . . . . . . . . . . . . . . . 1,310,8988,753 Morgan Stanley . . . . . . . . . . . . . . . . . . . . . . . . . . . . . 679,7581,683 Morningstar, Inc. . . . . . . . . . . . . . . . . . . . . . . . . . . . . 378,7421,605 NASDAQ OMX Group, Inc. . . . . . . . . . . . . . . . . . . . 236,6733,749 S&P Global, Inc. . . . . . . . . . . . . . . . . . . . . . . . . . . . . 1,322,9104,970 SEI Investments Co. . . . . . . . . . . . . . . . . . . . . . . . . . 302,8224,488 State Street Corp. (b) . . . . . . . . . . . . . . . . . . . . . . . . . 377,0374,991 T. Rowe Price Group, Inc. . . . . . . . . . . . . . . . . . . . . . 856,456
10,187 The Bank of New York Mellon Corp. . . . . . . . . . . . . 481,7437,426 The Charles Schwab Corp. . . . . . . . . . . . . . . . . . . . . 484,0271,868 Tradeweb Markets, Inc. - Class A . . . . . . . . . . . . . . . 138,232
12,728 Virtu Financial, Inc. - Class A . . . . . . . . . . . . . . . . . . 395,204
14,649,972
Chemicals - 0.85%2,300 Albemarle Corp. . . . . . . . . . . . . . . . . . . . . . . . . . . . . 336,0538,620 Corteva, Inc. . . . . . . . . . . . . . . . . . . . . . . . . . . . . . . . 401,8643,841 Dow, Inc. . . . . . . . . . . . . . . . . . . . . . . . . . . . . . . . . . . 245,594
See notes to financial statements.
37

GuideMark® Large Cap Core FundSCHEDULE OF INVESTMENTS (Continued)March 31, 2021
Number ofShares Value
COMMON STOCKS (Continued)Chemicals (Continued)
2,359 DuPont de Nemours, Inc. . . . . . . . . . . . . . . . . . . . . . $ 182,3044,564 Eastman Chemical Co. . . . . . . . . . . . . . . . . . . . . . . . 502,5881,932 Ecolab, Inc. . . . . . . . . . . . . . . . . . . . . . . . . . . . . . . . . 413,583
18,197 Element Solutions, Inc. . . . . . . . . . . . . . . . . . . . . . . . 332,823709 Linde PLC . . . . . . . . . . . . . . . . . . . . . . . . . . . . . . . . . 198,619
6,458 Olin Corp. . . . . . . . . . . . . . . . . . . . . . . . . . . . . . . . . . 245,2101,175 PPG Industries, Inc. . . . . . . . . . . . . . . . . . . . . . . . . . . 176,5557,229 RPM International, Inc. . . . . . . . . . . . . . . . . . . . . . . . 663,984
20,777 The Mosaic Co. . . . . . . . . . . . . . . . . . . . . . . . . . . . . . 656,7612,271 The Scotts Miracle-Gro Co. - Class A . . . . . . . . . . . . 556,3279,304 Valvoline, Inc. . . . . . . . . . . . . . . . . . . . . . . . . . . . . . . 242,555
5,154,820
Commercial Services & Supplies - 0.43%41,703 ADT, Inc. (b) . . . . . . . . . . . . . . . . . . . . . . . . . . . . . . . 351,9732,336 Cintas Corp. . . . . . . . . . . . . . . . . . . . . . . . . . . . . . . . . 797,3004,760 Copart, Inc. (a) . . . . . . . . . . . . . . . . . . . . . . . . . . . . . . 516,9842,661 IAA, Inc. (a) . . . . . . . . . . . . . . . . . . . . . . . . . . . . . . . 146,728
23,682 Rollins, Inc. (b) . . . . . . . . . . . . . . . . . . . . . . . . . . . . . 815,134
2,628,119
Communications Equipment - 1.34%1,159 Arista Networks, Inc. (a) . . . . . . . . . . . . . . . . . . . . . . 349,8913,923 Ciena Corp. (a) . . . . . . . . . . . . . . . . . . . . . . . . . . . . . 214,667
30,925 Cisco Systems, Inc. . . . . . . . . . . . . . . . . . . . . . . . . . . 1,599,1322,681 F5 Networks, Inc. (a) . . . . . . . . . . . . . . . . . . . . . . . . . 559,3101,915 Lumentum Holdings, Inc. (a) . . . . . . . . . . . . . . . . . . 174,9352,542 Motorola Solutions, Inc. . . . . . . . . . . . . . . . . . . . . . . 478,0232,141 Palo Alto Networks, Inc. (a) . . . . . . . . . . . . . . . . . . . 689,530
21,695 Qualcomm, Inc. . . . . . . . . . . . . . . . . . . . . . . . . . . . . . 2,876,5403,785 Ubiquiti, Inc. . . . . . . . . . . . . . . . . . . . . . . . . . . . . . . . 1,129,065
8,071,093
Construction & Engineering - 0.52%20,908 AECOM (a) . . . . . . . . . . . . . . . . . . . . . . . . . . . . . . . . 1,340,41220,301 Quanta Services, Inc. . . . . . . . . . . . . . . . . . . . . . . . . . 1,786,082
3,126,494
Construction Materials - 0.02%955 Eagle Materials, Inc. (a) . . . . . . . . . . . . . . . . . . . . . . 128,362
Consumer Finance - 0.87%29,160 Ally Financial, Inc. . . . . . . . . . . . . . . . . . . . . . . . . . . 1,318,3245,033 American Express Co. . . . . . . . . . . . . . . . . . . . . . . . . 711,867
647 Credit Acceptance Corp. (a)(b) . . . . . . . . . . . . . . . . . 233,0692,636 Discover Financial Services . . . . . . . . . . . . . . . . . . . 250,394
22,077 OneMain Holdings, Inc. . . . . . . . . . . . . . . . . . . . . . . 1,185,97623,148 Santander Consumer USA Holdings, Inc. (b) . . . . . . 626,38522,008 Synchrony Financial . . . . . . . . . . . . . . . . . . . . . . . . . 894,845
5,220,860
Containers & Packaging - 0.45%9,556 Berry Plastics Group, Inc. (a) . . . . . . . . . . . . . . . . . . 586,7384,339 Crown Holdings, Inc. . . . . . . . . . . . . . . . . . . . . . . . . 421,0575,931 International Paper Co. . . . . . . . . . . . . . . . . . . . . . . . 320,6894,403 Silgan Holdings, Inc. . . . . . . . . . . . . . . . . . . . . . . . . . 185,058
22,658 WestRock Co. . . . . . . . . . . . . . . . . . . . . . . . . . . . . . . 1,179,349
2,692,891
Distributors - 0.24%3,321 Genuine Parts Co. . . . . . . . . . . . . . . . . . . . . . . . . . . . 383,875
25,404 LKQ Corp. (a) . . . . . . . . . . . . . . . . . . . . . . . . . . . . . . 1,075,351
1,459,226
Number ofShares Value
Diversified Consumer Services - 0.57%4,417 Chegg, Inc. (a)(b) . . . . . . . . . . . . . . . . . . . . . . . . . . . $ 378,3609,636 frontdoor, Inc. (a) . . . . . . . . . . . . . . . . . . . . . . . . . . . 517,9353,099 Graham Holdings Co. - Class B . . . . . . . . . . . . . . . . 1,743,002
11,429 H&R Block, Inc. . . . . . . . . . . . . . . . . . . . . . . . . . . . . 249,1525,099 Service Corp. International . . . . . . . . . . . . . . . . . . . . 260,3046,502 Terminix Global Holdings, Inc. (a) . . . . . . . . . . . . . . 309,950
3,458,703
Diversified Financial Services - 0.20%41,055 Jefferies Financial Group, Inc. . . . . . . . . . . . . . . . . . 1,235,756
Diversified Telecommunication Services - 0.75%50,933 AT&T, Inc. . . . . . . . . . . . . . . . . . . . . . . . . . . . . . . . . 1,541,74276,268 Lumen Technologies, Inc. . . . . . . . . . . . . . . . . . . . . . 1,018,17833,725 Verizon Communications, Inc. . . . . . . . . . . . . . . . . . 1,961,108
4,521,028
Electric Utilities - 0.54%1,909 American Electric Power Co., Inc. . . . . . . . . . . . . . . 161,6924,834 Duke Energy Corp. . . . . . . . . . . . . . . . . . . . . . . . . . . 466,6262,500 Edison International . . . . . . . . . . . . . . . . . . . . . . . . . . 146,5004,459 Evergy, Inc. . . . . . . . . . . . . . . . . . . . . . . . . . . . . . . . . 265,4448,917 Exelon Corp. . . . . . . . . . . . . . . . . . . . . . . . . . . . . . . . 390,0305,118 Hawaiian Electric Industries, Inc. . . . . . . . . . . . . . . . 227,3939,411 NextEra Energy, Inc. . . . . . . . . . . . . . . . . . . . . . . . . . 711,566
25,639 PG&E Corp. (a) . . . . . . . . . . . . . . . . . . . . . . . . . . . . . 300,2331,712 Pinnacle West Capital Corp. . . . . . . . . . . . . . . . . . . . 139,2714,855 PPL Corp. . . . . . . . . . . . . . . . . . . . . . . . . . . . . . . . . . 140,0184,590 The Southern Co. . . . . . . . . . . . . . . . . . . . . . . . . . . . . 285,314
3,234,087
Electrical Equipment - 1.14%5,718 Acuity Brands, Inc. (b) . . . . . . . . . . . . . . . . . . . . . . . 943,4702,439 Agilent Technologies, Inc. . . . . . . . . . . . . . . . . . . . . 310,094
995 AMETEK, Inc. . . . . . . . . . . . . . . . . . . . . . . . . . . . . . 127,0911,760 Eaton Corp. PLC . . . . . . . . . . . . . . . . . . . . . . . . . . . . 243,3736,553 Emerson Electric Co. . . . . . . . . . . . . . . . . . . . . . . . . . 591,2125,101 Enphase Energy, Inc. (a) . . . . . . . . . . . . . . . . . . . . . . 827,1782,355 Generac Holdings, Inc. (a) . . . . . . . . . . . . . . . . . . . . . 771,145
66,298 GrafTech International, Ltd. . . . . . . . . . . . . . . . . . . . 810,8249,165 nVent Electric PLC . . . . . . . . . . . . . . . . . . . . . . . . . . 255,7954,694 Regal Beloit Corp. (b) . . . . . . . . . . . . . . . . . . . . . . . . 669,7403,472 Rockwell Automation, Inc. . . . . . . . . . . . . . . . . . . . . 921,608
20,284 Vertiv Holdings Co. . . . . . . . . . . . . . . . . . . . . . . . . . 405,680
6,877,210
Electronic Equipment, Instruments & Components - 1.36%14,716 Arrow Electronics, Inc. (a) . . . . . . . . . . . . . . . . . . . . 1,630,82737,240 Avnet, Inc. . . . . . . . . . . . . . . . . . . . . . . . . . . . . . . . . . 1,545,8333,815 CDW Corp. . . . . . . . . . . . . . . . . . . . . . . . . . . . . . . . . 632,3362,117 Cognex Corp. . . . . . . . . . . . . . . . . . . . . . . . . . . . . . . . 175,6902,181 Dolby Laboratories, Inc. - Class A . . . . . . . . . . . . . . 215,3084,428 Keysight Technologies, Inc. (a) . . . . . . . . . . . . . . . . . 634,975
14,111 National Instruments Corp. . . . . . . . . . . . . . . . . . . . . 609,38411,617 SYNNEX Corp. . . . . . . . . . . . . . . . . . . . . . . . . . . . . . 1,334,0962,031 Trimble, Inc. (a) . . . . . . . . . . . . . . . . . . . . . . . . . . . . . 157,9922,629 Zebra Technologies Corp. - Class A (a) . . . . . . . . . . 1,275,538
8,211,979
Energy Equipment & Services - 0.40%12,574 Baker Hughes Co. . . . . . . . . . . . . . . . . . . . . . . . . . . . 271,72419,368 Halliburton Co. . . . . . . . . . . . . . . . . . . . . . . . . . . . . . 415,63713,034 Helmerich & Payne, Inc. . . . . . . . . . . . . . . . . . . . . . . 351,397
See notes to financial statements.
38
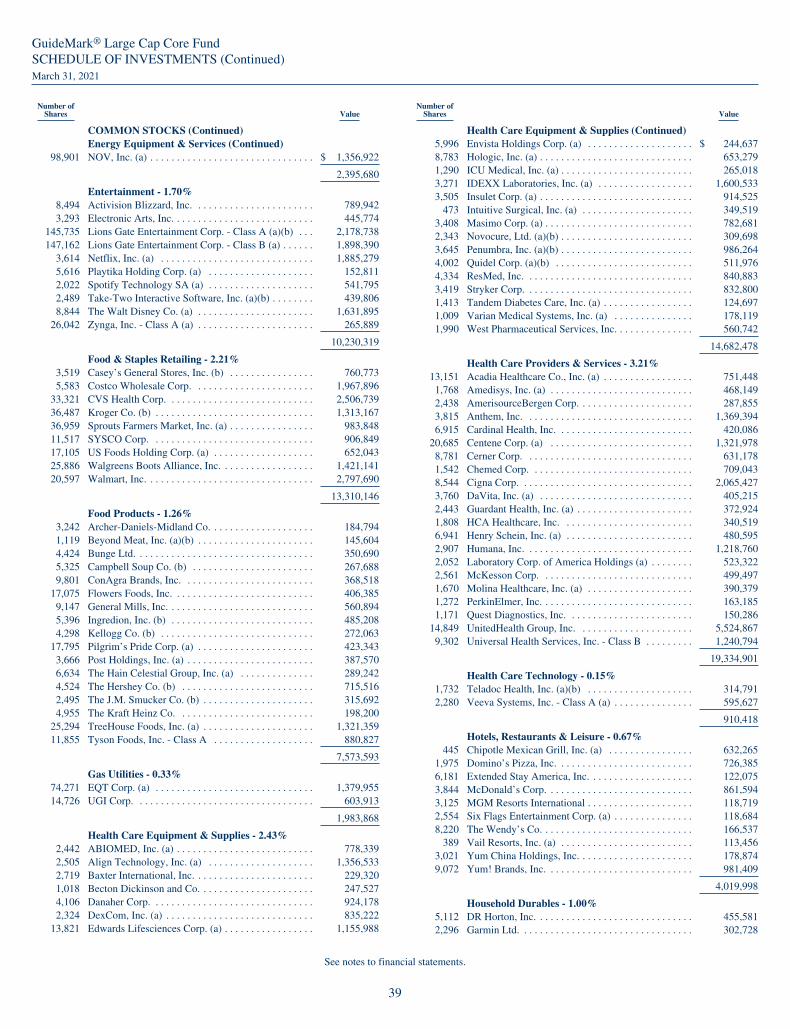
GuideMark® Large Cap Core FundSCHEDULE OF INVESTMENTS (Continued)March 31, 2021
Number ofShares Value
COMMON STOCKS (Continued)Energy Equipment & Services (Continued)
98,901 NOV, Inc. (a) . . . . . . . . . . . . . . . . . . . . . . . . . . . . . . . $ 1,356,922
2,395,680
Entertainment - 1.70%8,494 Activision Blizzard, Inc. . . . . . . . . . . . . . . . . . . . . . . 789,9423,293 Electronic Arts, Inc. . . . . . . . . . . . . . . . . . . . . . . . . . . 445,774
145,735 Lions Gate Entertainment Corp. - Class A (a)(b) . . . 2,178,738147,162 Lions Gate Entertainment Corp. - Class B (a) . . . . . . 1,898,390
3,614 Netflix, Inc. (a) . . . . . . . . . . . . . . . . . . . . . . . . . . . . . 1,885,2795,616 Playtika Holding Corp. (a) . . . . . . . . . . . . . . . . . . . . 152,8112,022 Spotify Technology SA (a) . . . . . . . . . . . . . . . . . . . . 541,7952,489 Take-Two Interactive Software, Inc. (a)(b) . . . . . . . . 439,8068,844 The Walt Disney Co. (a) . . . . . . . . . . . . . . . . . . . . . . 1,631,895
26,042 Zynga, Inc. - Class A (a) . . . . . . . . . . . . . . . . . . . . . . 265,889
10,230,319
Food & Staples Retailing - 2.21%3,519 Casey’s General Stores, Inc. (b) . . . . . . . . . . . . . . . . 760,7735,583 Costco Wholesale Corp. . . . . . . . . . . . . . . . . . . . . . . 1,967,896
33,321 CVS Health Corp. . . . . . . . . . . . . . . . . . . . . . . . . . . . 2,506,73936,487 Kroger Co. (b) . . . . . . . . . . . . . . . . . . . . . . . . . . . . . . 1,313,16736,959 Sprouts Farmers Market, Inc. (a) . . . . . . . . . . . . . . . . 983,84811,517 SYSCO Corp. . . . . . . . . . . . . . . . . . . . . . . . . . . . . . . 906,84917,105 US Foods Holding Corp. (a) . . . . . . . . . . . . . . . . . . . 652,04325,886 Walgreens Boots Alliance, Inc. . . . . . . . . . . . . . . . . . 1,421,14120,597 Walmart, Inc. . . . . . . . . . . . . . . . . . . . . . . . . . . . . . . . 2,797,690
13,310,146
Food Products - 1.26%3,242 Archer-Daniels-Midland Co. . . . . . . . . . . . . . . . . . . . 184,7941,119 Beyond Meat, Inc. (a)(b) . . . . . . . . . . . . . . . . . . . . . . 145,6044,424 Bunge Ltd. . . . . . . . . . . . . . . . . . . . . . . . . . . . . . . . . . 350,6905,325 Campbell Soup Co. (b) . . . . . . . . . . . . . . . . . . . . . . . 267,6889,801 ConAgra Brands, Inc. . . . . . . . . . . . . . . . . . . . . . . . . 368,518
17,075 Flowers Foods, Inc. . . . . . . . . . . . . . . . . . . . . . . . . . . 406,3859,147 General Mills, Inc. . . . . . . . . . . . . . . . . . . . . . . . . . . . 560,8945,396 Ingredion, Inc. (b) . . . . . . . . . . . . . . . . . . . . . . . . . . . 485,2084,298 Kellogg Co. (b) . . . . . . . . . . . . . . . . . . . . . . . . . . . . . 272,063
17,795 Pilgrim’s Pride Corp. (a) . . . . . . . . . . . . . . . . . . . . . . 423,3433,666 Post Holdings, Inc. (a) . . . . . . . . . . . . . . . . . . . . . . . . 387,5706,634 The Hain Celestial Group, Inc. (a) . . . . . . . . . . . . . . 289,2424,524 The Hershey Co. (b) . . . . . . . . . . . . . . . . . . . . . . . . . 715,5162,495 The J.M. Smucker Co. (b) . . . . . . . . . . . . . . . . . . . . . 315,6924,955 The Kraft Heinz Co. . . . . . . . . . . . . . . . . . . . . . . . . . 198,200
25,294 TreeHouse Foods, Inc. (a) . . . . . . . . . . . . . . . . . . . . . 1,321,35911,855 Tyson Foods, Inc. - Class A . . . . . . . . . . . . . . . . . . . 880,827
7,573,593
Gas Utilities - 0.33%74,271 EQT Corp. (a) . . . . . . . . . . . . . . . . . . . . . . . . . . . . . . 1,379,95514,726 UGI Corp. . . . . . . . . . . . . . . . . . . . . . . . . . . . . . . . . . 603,913
1,983,868
Health Care Equipment & Supplies - 2.43%2,442 ABIOMED, Inc. (a) . . . . . . . . . . . . . . . . . . . . . . . . . . 778,3392,505 Align Technology, Inc. (a) . . . . . . . . . . . . . . . . . . . . 1,356,5332,719 Baxter International, Inc. . . . . . . . . . . . . . . . . . . . . . . 229,3201,018 Becton Dickinson and Co. . . . . . . . . . . . . . . . . . . . . . 247,5274,106 Danaher Corp. . . . . . . . . . . . . . . . . . . . . . . . . . . . . . . 924,1782,324 DexCom, Inc. (a) . . . . . . . . . . . . . . . . . . . . . . . . . . . . 835,222
13,821 Edwards Lifesciences Corp. (a) . . . . . . . . . . . . . . . . . 1,155,988
Number ofShares Value
Health Care Equipment & Supplies (Continued)5,996 Envista Holdings Corp. (a) . . . . . . . . . . . . . . . . . . . . $ 244,6378,783 Hologic, Inc. (a) . . . . . . . . . . . . . . . . . . . . . . . . . . . . . 653,2791,290 ICU Medical, Inc. (a) . . . . . . . . . . . . . . . . . . . . . . . . . 265,0183,271 IDEXX Laboratories, Inc. (a) . . . . . . . . . . . . . . . . . . 1,600,5333,505 Insulet Corp. (a) . . . . . . . . . . . . . . . . . . . . . . . . . . . . . 914,525
473 Intuitive Surgical, Inc. (a) . . . . . . . . . . . . . . . . . . . . . 349,5193,408 Masimo Corp. (a) . . . . . . . . . . . . . . . . . . . . . . . . . . . . 782,6812,343 Novocure, Ltd. (a)(b) . . . . . . . . . . . . . . . . . . . . . . . . . 309,6983,645 Penumbra, Inc. (a)(b) . . . . . . . . . . . . . . . . . . . . . . . . . 986,2644,002 Quidel Corp. (a)(b) . . . . . . . . . . . . . . . . . . . . . . . . . . 511,9764,334 ResMed, Inc. . . . . . . . . . . . . . . . . . . . . . . . . . . . . . . . 840,8833,419 Stryker Corp. . . . . . . . . . . . . . . . . . . . . . . . . . . . . . . . 832,8001,413 Tandem Diabetes Care, Inc. (a) . . . . . . . . . . . . . . . . . 124,6971,009 Varian Medical Systems, Inc. (a) . . . . . . . . . . . . . . . 178,1191,990 West Pharmaceutical Services, Inc. . . . . . . . . . . . . . . 560,742
14,682,478
Health Care Providers & Services - 3.21%13,151 Acadia Healthcare Co., Inc. (a) . . . . . . . . . . . . . . . . . 751,4481,768 Amedisys, Inc. (a) . . . . . . . . . . . . . . . . . . . . . . . . . . . 468,1492,438 AmerisourceBergen Corp. . . . . . . . . . . . . . . . . . . . . . 287,8553,815 Anthem, Inc. . . . . . . . . . . . . . . . . . . . . . . . . . . . . . . . 1,369,3946,915 Cardinal Health, Inc. . . . . . . . . . . . . . . . . . . . . . . . . . 420,086
20,685 Centene Corp. (a) . . . . . . . . . . . . . . . . . . . . . . . . . . . 1,321,9788,781 Cerner Corp. . . . . . . . . . . . . . . . . . . . . . . . . . . . . . . . 631,1781,542 Chemed Corp. . . . . . . . . . . . . . . . . . . . . . . . . . . . . . . 709,0438,544 Cigna Corp. . . . . . . . . . . . . . . . . . . . . . . . . . . . . . . . . 2,065,4273,760 DaVita, Inc. (a) . . . . . . . . . . . . . . . . . . . . . . . . . . . . . 405,2152,443 Guardant Health, Inc. (a) . . . . . . . . . . . . . . . . . . . . . . 372,9241,808 HCA Healthcare, Inc. . . . . . . . . . . . . . . . . . . . . . . . . 340,5196,941 Henry Schein, Inc. (a) . . . . . . . . . . . . . . . . . . . . . . . . 480,5952,907 Humana, Inc. . . . . . . . . . . . . . . . . . . . . . . . . . . . . . . . 1,218,7602,052 Laboratory Corp. of America Holdings (a) . . . . . . . . 523,3222,561 McKesson Corp. . . . . . . . . . . . . . . . . . . . . . . . . . . . . 499,4971,670 Molina Healthcare, Inc. (a) . . . . . . . . . . . . . . . . . . . . 390,3791,272 PerkinElmer, Inc. . . . . . . . . . . . . . . . . . . . . . . . . . . . . 163,1851,171 Quest Diagnostics, Inc. . . . . . . . . . . . . . . . . . . . . . . . 150,286
14,849 UnitedHealth Group, Inc. . . . . . . . . . . . . . . . . . . . . . 5,524,8679,302 Universal Health Services, Inc. - Class B . . . . . . . . . 1,240,794
19,334,901
Health Care Technology - 0.15%1,732 Teladoc Health, Inc. (a)(b) . . . . . . . . . . . . . . . . . . . . 314,7912,280 Veeva Systems, Inc. - Class A (a) . . . . . . . . . . . . . . . 595,627
910,418
Hotels, Restaurants & Leisure - 0.67%445 Chipotle Mexican Grill, Inc. (a) . . . . . . . . . . . . . . . . 632,265
1,975 Domino’s Pizza, Inc. . . . . . . . . . . . . . . . . . . . . . . . . . 726,3856,181 Extended Stay America, Inc. . . . . . . . . . . . . . . . . . . . 122,0753,844 McDonald’s Corp. . . . . . . . . . . . . . . . . . . . . . . . . . . . 861,5943,125 MGM Resorts International . . . . . . . . . . . . . . . . . . . . 118,7192,554 Six Flags Entertainment Corp. (a) . . . . . . . . . . . . . . . 118,6848,220 The Wendy’s Co. . . . . . . . . . . . . . . . . . . . . . . . . . . . . 166,537
389 Vail Resorts, Inc. (a) . . . . . . . . . . . . . . . . . . . . . . . . . 113,4563,021 Yum China Holdings, Inc. . . . . . . . . . . . . . . . . . . . . . 178,8749,072 Yum! Brands, Inc. . . . . . . . . . . . . . . . . . . . . . . . . . . . 981,409
4,019,998
Household Durables - 1.00%5,112 DR Horton, Inc. . . . . . . . . . . . . . . . . . . . . . . . . . . . . . 455,5812,296 Garmin Ltd. . . . . . . . . . . . . . . . . . . . . . . . . . . . . . . . . 302,728
See notes to financial statements.
39

GuideMark® Large Cap Core FundSCHEDULE OF INVESTMENTS (Continued)March 31, 2021
Number ofShares Value
COMMON STOCKS (Continued)Household Durables (Continued)
7,612 Lennar Corp. - Class A . . . . . . . . . . . . . . . . . . . . . . . $ 770,5637,934 Lennar Corp. - Class B . . . . . . . . . . . . . . . . . . . . . . . 653,2852,885 Mohawk Industries, Inc. (a) . . . . . . . . . . . . . . . . . . . . 554,814
88 NVR, Inc. (a) . . . . . . . . . . . . . . . . . . . . . . . . . . . . . . . 414,5623,320 PulteGroup, Inc. . . . . . . . . . . . . . . . . . . . . . . . . . . . . 174,1013,701 Roku, Inc. (a) . . . . . . . . . . . . . . . . . . . . . . . . . . . . . . . 1,205,675
17,220 Tempur Sealy International, Inc. . . . . . . . . . . . . . . . . 629,5639,245 Toll Brothers, Inc. . . . . . . . . . . . . . . . . . . . . . . . . . . . 524,4691,526 Whirlpool Corp. . . . . . . . . . . . . . . . . . . . . . . . . . . . . . 336,254
6,021,595
Household Products - 1.38%4,244 Church & Dwight, Inc. . . . . . . . . . . . . . . . . . . . . . . . 370,7133,274 Clorox Co. . . . . . . . . . . . . . . . . . . . . . . . . . . . . . . . . . 631,489
12,247 Colgate-Palmolive Co. . . . . . . . . . . . . . . . . . . . . . . . 965,4315,589 Kimberly-Clark Corp. . . . . . . . . . . . . . . . . . . . . . . . . 777,151
15,233 Spectrum Brands Holdings, Inc. . . . . . . . . . . . . . . . . 1,294,80531,546 The Procter & Gamble Co. . . . . . . . . . . . . . . . . . . . . 4,272,275
8,311,864
Independent Power and Renewable ElectricityProducers - 0.60%
15,849 AES Corp. . . . . . . . . . . . . . . . . . . . . . . . . . . . . . . . . . 424,91225,009 NRG Energy, Inc. . . . . . . . . . . . . . . . . . . . . . . . . . . . 943,589
125,459 Vistra Energy Corp. . . . . . . . . . . . . . . . . . . . . . . . . . . 2,218,115
3,586,616
Industrial Conglomerates - 0.27%3,394 3M Co. . . . . . . . . . . . . . . . . . . . . . . . . . . . . . . . . . . . . 653,956
43,743 General Electric Co. . . . . . . . . . . . . . . . . . . . . . . . . . 574,3451,825 Honeywell International, Inc. . . . . . . . . . . . . . . . . . . 396,153
1,624,454
Insurance - 1.81%5,074 Aon PLC - Class A (b) . . . . . . . . . . . . . . . . . . . . . . . 1,167,5782,582 Arthur J. Gallagher & Co. . . . . . . . . . . . . . . . . . . . . . 322,156
18,166 Berkshire Hathaway, Inc. - Class B (a) . . . . . . . . . . . 4,640,8684,940 Brown & Brown, Inc. . . . . . . . . . . . . . . . . . . . . . . . . 225,8071,183 Erie Indemnity Co. - Class A (b) . . . . . . . . . . . . . . . . 261,3376,142 Fidelity National Financial, Inc. . . . . . . . . . . . . . . . . 249,7345,187 First American Financial Corp. . . . . . . . . . . . . . . . . . 293,8443,585 Hartford Financial Services Group, Inc. . . . . . . . . . . 239,4424,804 Marsh & McLennan Cos., Inc. . . . . . . . . . . . . . . . . . 585,127
13,584 MetLife, Inc. . . . . . . . . . . . . . . . . . . . . . . . . . . . . . . . 825,7713,650 Principal Financial Group, Inc. . . . . . . . . . . . . . . . . . 218,8541,564 Reinsurance Group of America, Inc. . . . . . . . . . . . . . 197,1422,544 The Allstate Corp. . . . . . . . . . . . . . . . . . . . . . . . . . . . 292,3065,567 The Progressive Corp. . . . . . . . . . . . . . . . . . . . . . . . . 532,261
21,269 Unum Group . . . . . . . . . . . . . . . . . . . . . . . . . . . . . . . 591,9161,086 Willis Towers Watson PLC . . . . . . . . . . . . . . . . . . . . 248,564
10,892,707
Interactive Media & Services - 5.59%4,511 Alphabet, Inc. - Class A (a) . . . . . . . . . . . . . . . . . . . . 9,304,0284,506 Alphabet, Inc. - Class C (a) . . . . . . . . . . . . . . . . . . . . 9,321,247
37,632 Facebook, Inc. - Class A (a) . . . . . . . . . . . . . . . . . . . 11,083,7539,261 Match Group, Inc. (a) . . . . . . . . . . . . . . . . . . . . . . . . 1,272,2769,384 Pinterest, Inc. - Class A (a) . . . . . . . . . . . . . . . . . . . . 694,6979,350 TripAdvisor, Inc. - Class A (a)(b) . . . . . . . . . . . . . . . 502,9369,655 Twitter, Inc. (a) . . . . . . . . . . . . . . . . . . . . . . . . . . . . . 614,3483,053 Zillow Group, Inc. - Class A (a)(b) . . . . . . . . . . . . . . 401,103
Number ofShares Value
Interactive Media & Services (Continued)3,793 Zillow Group, Inc. - Class C (a) . . . . . . . . . . . . . . . . $ 491,725
33,686,113
Internet & Direct Marketing Retail - 4.59%6,557 Amazon.com, Inc. (a) . . . . . . . . . . . . . . . . . . . . . . . . 20,287,882
440 Booking Holdings, Inc. (a) . . . . . . . . . . . . . . . . . . . . 1,025,13012,078 eBay, Inc. . . . . . . . . . . . . . . . . . . . . . . . . . . . . . . . . . . 739,6574,795 Etsy, Inc. (a) . . . . . . . . . . . . . . . . . . . . . . . . . . . . . . . 967,0082,712 Expedia Group, Inc. - Class A (a) . . . . . . . . . . . . . . . 466,7892,390 GrubHub, Inc. (a)(b) . . . . . . . . . . . . . . . . . . . . . . . . . 143,400
178,286 Qurate Retail, Inc. - Series A . . . . . . . . . . . . . . . . . . . 2,096,6436,165 Wayfair, Inc. - Class A (a)(b) . . . . . . . . . . . . . . . . . . 1,940,434
27,666,943
IT Services - 4.74%9,809 Accenture PLC - Class A . . . . . . . . . . . . . . . . . . . . . 2,709,7362,745 Akamai Technologies, Inc. (a) . . . . . . . . . . . . . . . . . 279,715
17,879 Alliance Data Systems Corp. . . . . . . . . . . . . . . . . . . . 2,004,0575,871 Amdocs Ltd. . . . . . . . . . . . . . . . . . . . . . . . . . . . . . . . 411,8514,085 Black Knight, Inc. (a) . . . . . . . . . . . . . . . . . . . . . . . . 302,2494,386 Booz Allen Hamilton Holding Corp. - Class A . . . . . 353,2051,036 Broadridge Financial Solutions, Inc. . . . . . . . . . . . . . 158,6123,214 CACI International, Inc. - Class A (a) . . . . . . . . . . . . 792,765
12,604 Cognizant Technology Solutions Corp. - Class A . . . 984,6245,504 Concentrix Corp. (a) . . . . . . . . . . . . . . . . . . . . . . . . . 824,0596,780 CoreLogic, Inc. . . . . . . . . . . . . . . . . . . . . . . . . . . . . . 537,315
59,246 DXC Technology Co. (a) . . . . . . . . . . . . . . . . . . . . . 1,852,0301,029 EPAM Systems, Inc. (a) . . . . . . . . . . . . . . . . . . . . . . 408,1943,677 Euronet Worldwide, Inc. (a) . . . . . . . . . . . . . . . . . . . 508,5295,286 Fastly, Inc. - Class A (a)(b) . . . . . . . . . . . . . . . . . . . . 355,6425,441 Fidelity National Information Services, Inc. . . . . . . . 765,0598,576 Fiserv, Inc. (a) . . . . . . . . . . . . . . . . . . . . . . . . . . . . . . 1,020,887
556 FleetCor Technologies, Inc. (a) . . . . . . . . . . . . . . . . . 149,3581,795 Gartner, Inc. (a) . . . . . . . . . . . . . . . . . . . . . . . . . . . . . 327,6778,668 Genpact, Ltd. . . . . . . . . . . . . . . . . . . . . . . . . . . . . . . . 371,1642,241 Global Payments, Inc. . . . . . . . . . . . . . . . . . . . . . . . . 451,7413,004 GoDaddy, Inc. - Class A (a) . . . . . . . . . . . . . . . . . . . 233,1708,795 MasterCard, Inc. - Class A . . . . . . . . . . . . . . . . . . . . 3,131,4601,546 MongoDB, Inc. (a) . . . . . . . . . . . . . . . . . . . . . . . . . . 413,4472,162 Okta, Inc. - Class A (a) . . . . . . . . . . . . . . . . . . . . . . . 476,5709,614 PayPal Holdings, Inc. (a) . . . . . . . . . . . . . . . . . . . . . . 2,334,6645,737 Science Applications International Corp. . . . . . . . . . 479,5565,041 Square, Inc. - Class A (a) . . . . . . . . . . . . . . . . . . . . . . 1,144,559
12,400 The Western Union Co. (b) . . . . . . . . . . . . . . . . . . . . 305,7841,906 Twilio, Inc. - Class A (a) . . . . . . . . . . . . . . . . . . . . . . 649,4892,820 VeriSign, Inc. (a) . . . . . . . . . . . . . . . . . . . . . . . . . . . . 560,503
13,119 Visa, Inc. - Class A . . . . . . . . . . . . . . . . . . . . . . . . . . 2,777,6862,473 WEX, Inc. (a) . . . . . . . . . . . . . . . . . . . . . . . . . . . . . . 517,401
28,592,758
Leisure Products - 0.48%2,462 Brunswick Corp. . . . . . . . . . . . . . . . . . . . . . . . . . . . . 234,801
32,649 Mattel, Inc. (a) . . . . . . . . . . . . . . . . . . . . . . . . . . . . . . 650,3685,834 Peloton Interactive, Inc. - Class A (a) . . . . . . . . . . . . 655,9752,175 Polaris Industries, Inc. . . . . . . . . . . . . . . . . . . . . . . . . 290,3633,080 Pool Corp. . . . . . . . . . . . . . . . . . . . . . . . . . . . . . . . . . 1,063,339
2,894,846
Life Sciences Tools & Services - 1.23%2,919 10X Genomics, Inc. - Class A (a) . . . . . . . . . . . . . . . 528,3394,264 Adaptive Biotechnologies Corp. (a) . . . . . . . . . . . . . 171,669
See notes to financial statements.
40
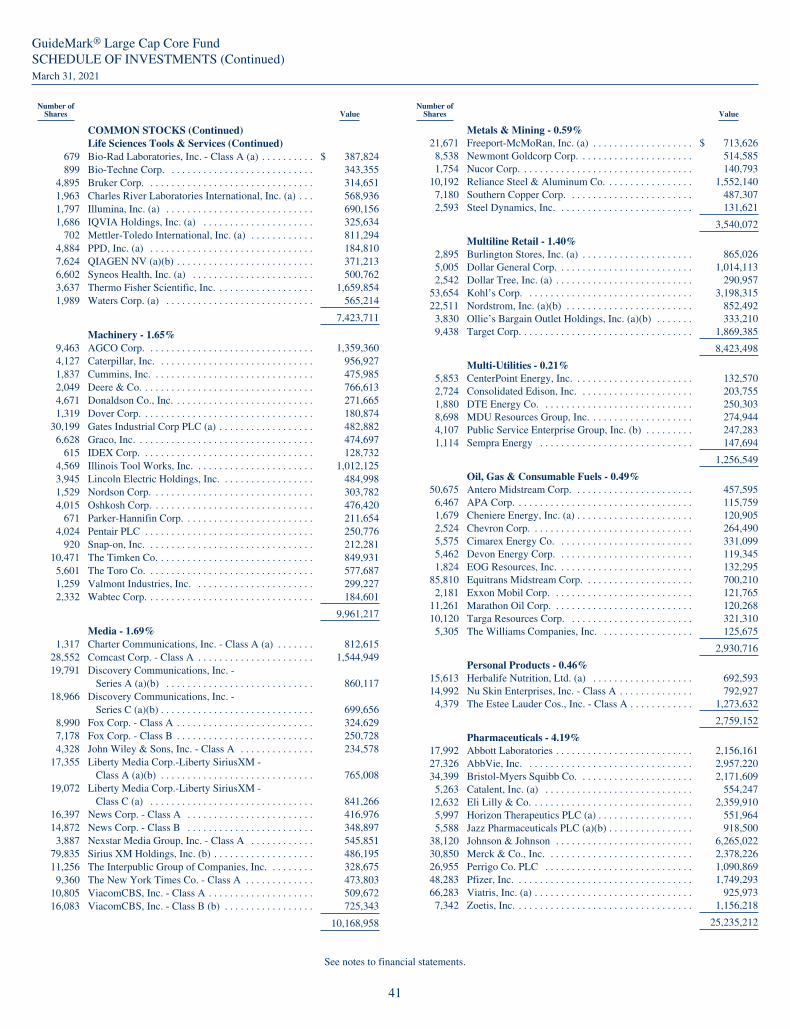
GuideMark® Large Cap Core FundSCHEDULE OF INVESTMENTS (Continued)March 31, 2021
Number ofShares Value
COMMON STOCKS (Continued)Life Sciences Tools & Services (Continued)
679 Bio-Rad Laboratories, Inc. - Class A (a) . . . . . . . . . . $ 387,824899 Bio-Techne Corp. . . . . . . . . . . . . . . . . . . . . . . . . . . . 343,355
4,895 Bruker Corp. . . . . . . . . . . . . . . . . . . . . . . . . . . . . . . . 314,6511,963 Charles River Laboratories International, Inc. (a) . . . 568,9361,797 Illumina, Inc. (a) . . . . . . . . . . . . . . . . . . . . . . . . . . . . 690,1561,686 IQVIA Holdings, Inc. (a) . . . . . . . . . . . . . . . . . . . . . 325,634
702 Mettler-Toledo International, Inc. (a) . . . . . . . . . . . . 811,2944,884 PPD, Inc. (a) . . . . . . . . . . . . . . . . . . . . . . . . . . . . . . . 184,8107,624 QIAGEN NV (a)(b) . . . . . . . . . . . . . . . . . . . . . . . . . . 371,2136,602 Syneos Health, Inc. (a) . . . . . . . . . . . . . . . . . . . . . . . 500,7623,637 Thermo Fisher Scientific, Inc. . . . . . . . . . . . . . . . . . . 1,659,8541,989 Waters Corp. (a) . . . . . . . . . . . . . . . . . . . . . . . . . . . . 565,214
7,423,711
Machinery - 1.65%9,463 AGCO Corp. . . . . . . . . . . . . . . . . . . . . . . . . . . . . . . . 1,359,3604,127 Caterpillar, Inc. . . . . . . . . . . . . . . . . . . . . . . . . . . . . . 956,9271,837 Cummins, Inc. . . . . . . . . . . . . . . . . . . . . . . . . . . . . . . 475,9852,049 Deere & Co. . . . . . . . . . . . . . . . . . . . . . . . . . . . . . . . . 766,6134,671 Donaldson Co., Inc. . . . . . . . . . . . . . . . . . . . . . . . . . . 271,6651,319 Dover Corp. . . . . . . . . . . . . . . . . . . . . . . . . . . . . . . . . 180,874
30,199 Gates Industrial Corp PLC (a) . . . . . . . . . . . . . . . . . . 482,8826,628 Graco, Inc. . . . . . . . . . . . . . . . . . . . . . . . . . . . . . . . . . 474,697
615 IDEX Corp. . . . . . . . . . . . . . . . . . . . . . . . . . . . . . . . . 128,7324,569 Illinois Tool Works, Inc. . . . . . . . . . . . . . . . . . . . . . . 1,012,1253,945 Lincoln Electric Holdings, Inc. . . . . . . . . . . . . . . . . . 484,9981,529 Nordson Corp. . . . . . . . . . . . . . . . . . . . . . . . . . . . . . . 303,7824,015 Oshkosh Corp. . . . . . . . . . . . . . . . . . . . . . . . . . . . . . . 476,420
671 Parker-Hannifin Corp. . . . . . . . . . . . . . . . . . . . . . . . . 211,6544,024 Pentair PLC . . . . . . . . . . . . . . . . . . . . . . . . . . . . . . . . 250,776
920 Snap-on, Inc. . . . . . . . . . . . . . . . . . . . . . . . . . . . . . . . 212,28110,471 The Timken Co. . . . . . . . . . . . . . . . . . . . . . . . . . . . . . 849,9315,601 The Toro Co. . . . . . . . . . . . . . . . . . . . . . . . . . . . . . . . 577,6871,259 Valmont Industries, Inc. . . . . . . . . . . . . . . . . . . . . . . 299,2272,332 Wabtec Corp. . . . . . . . . . . . . . . . . . . . . . . . . . . . . . . . 184,601
9,961,217
Media - 1.69%1,317 Charter Communications, Inc. - Class A (a) . . . . . . . 812,615
28,552 Comcast Corp. - Class A . . . . . . . . . . . . . . . . . . . . . . 1,544,94919,791 Discovery Communications, Inc. -
Series A (a)(b) . . . . . . . . . . . . . . . . . . . . . . . . . . . . 860,11718,966 Discovery Communications, Inc. -
Series C (a)(b) . . . . . . . . . . . . . . . . . . . . . . . . . . . . . 699,6568,990 Fox Corp. - Class A . . . . . . . . . . . . . . . . . . . . . . . . . . 324,6297,178 Fox Corp. - Class B . . . . . . . . . . . . . . . . . . . . . . . . . . 250,7284,328 John Wiley & Sons, Inc. - Class A . . . . . . . . . . . . . . 234,578
17,355 Liberty Media Corp.-Liberty SiriusXM -Class A (a)(b) . . . . . . . . . . . . . . . . . . . . . . . . . . . . . 765,008
19,072 Liberty Media Corp.-Liberty SiriusXM -Class C (a) . . . . . . . . . . . . . . . . . . . . . . . . . . . . . . . 841,266
16,397 News Corp. - Class A . . . . . . . . . . . . . . . . . . . . . . . . 416,97614,872 News Corp. - Class B . . . . . . . . . . . . . . . . . . . . . . . . 348,8973,887 Nexstar Media Group, Inc. - Class A . . . . . . . . . . . . 545,851
79,835 Sirius XM Holdings, Inc. (b) . . . . . . . . . . . . . . . . . . . 486,19511,256 The Interpublic Group of Companies, Inc. . . . . . . . . 328,6759,360 The New York Times Co. - Class A . . . . . . . . . . . . . 473,803
10,805 ViacomCBS, Inc. - Class A . . . . . . . . . . . . . . . . . . . . 509,67216,083 ViacomCBS, Inc. - Class B (b) . . . . . . . . . . . . . . . . . 725,343
10,168,958
Number ofShares Value
Metals & Mining - 0.59%21,671 Freeport-McMoRan, Inc. (a) . . . . . . . . . . . . . . . . . . . $ 713,6268,538 Newmont Goldcorp Corp. . . . . . . . . . . . . . . . . . . . . . 514,5851,754 Nucor Corp. . . . . . . . . . . . . . . . . . . . . . . . . . . . . . . . . 140,793
10,192 Reliance Steel & Aluminum Co. . . . . . . . . . . . . . . . . 1,552,1407,180 Southern Copper Corp. . . . . . . . . . . . . . . . . . . . . . . . 487,3072,593 Steel Dynamics, Inc. . . . . . . . . . . . . . . . . . . . . . . . . . 131,621
3,540,072
Multiline Retail - 1.40%2,895 Burlington Stores, Inc. (a) . . . . . . . . . . . . . . . . . . . . . 865,0265,005 Dollar General Corp. . . . . . . . . . . . . . . . . . . . . . . . . . 1,014,1132,542 Dollar Tree, Inc. (a) . . . . . . . . . . . . . . . . . . . . . . . . . . 290,957
53,654 Kohl’s Corp. . . . . . . . . . . . . . . . . . . . . . . . . . . . . . . . 3,198,31522,511 Nordstrom, Inc. (a)(b) . . . . . . . . . . . . . . . . . . . . . . . . 852,4923,830 Ollie’s Bargain Outlet Holdings, Inc. (a)(b) . . . . . . . 333,2109,438 Target Corp. . . . . . . . . . . . . . . . . . . . . . . . . . . . . . . . . 1,869,385
8,423,498
Multi-Utilities - 0.21%5,853 CenterPoint Energy, Inc. . . . . . . . . . . . . . . . . . . . . . . 132,5702,724 Consolidated Edison, Inc. . . . . . . . . . . . . . . . . . . . . . 203,7551,880 DTE Energy Co. . . . . . . . . . . . . . . . . . . . . . . . . . . . . 250,3038,698 MDU Resources Group, Inc. . . . . . . . . . . . . . . . . . . . 274,9444,107 Public Service Enterprise Group, Inc. (b) . . . . . . . . . 247,2831,114 Sempra Energy . . . . . . . . . . . . . . . . . . . . . . . . . . . . . 147,694
1,256,549
Oil, Gas & Consumable Fuels - 0.49%50,675 Antero Midstream Corp. . . . . . . . . . . . . . . . . . . . . . . 457,5956,467 APA Corp. . . . . . . . . . . . . . . . . . . . . . . . . . . . . . . . . . 115,7591,679 Cheniere Energy, Inc. (a) . . . . . . . . . . . . . . . . . . . . . . 120,9052,524 Chevron Corp. . . . . . . . . . . . . . . . . . . . . . . . . . . . . . . 264,4905,575 Cimarex Energy Co. . . . . . . . . . . . . . . . . . . . . . . . . . 331,0995,462 Devon Energy Corp. . . . . . . . . . . . . . . . . . . . . . . . . . 119,3451,824 EOG Resources, Inc. . . . . . . . . . . . . . . . . . . . . . . . . . 132,295
85,810 Equitrans Midstream Corp. . . . . . . . . . . . . . . . . . . . . 700,2102,181 Exxon Mobil Corp. . . . . . . . . . . . . . . . . . . . . . . . . . . 121,765
11,261 Marathon Oil Corp. . . . . . . . . . . . . . . . . . . . . . . . . . . 120,26810,120 Targa Resources Corp. . . . . . . . . . . . . . . . . . . . . . . . 321,3105,305 The Williams Companies, Inc. . . . . . . . . . . . . . . . . . 125,675
2,930,716
Personal Products - 0.46%15,613 Herbalife Nutrition, Ltd. (a) . . . . . . . . . . . . . . . . . . . 692,59314,992 Nu Skin Enterprises, Inc. - Class A . . . . . . . . . . . . . . 792,9274,379 The Estee Lauder Cos., Inc. - Class A . . . . . . . . . . . . 1,273,632
2,759,152
Pharmaceuticals - 4.19%17,992 Abbott Laboratories . . . . . . . . . . . . . . . . . . . . . . . . . . 2,156,16127,326 AbbVie, Inc. . . . . . . . . . . . . . . . . . . . . . . . . . . . . . . . 2,957,22034,399 Bristol-Myers Squibb Co. . . . . . . . . . . . . . . . . . . . . . 2,171,6095,263 Catalent, Inc. (a) . . . . . . . . . . . . . . . . . . . . . . . . . . . . 554,247
12,632 Eli Lilly & Co. . . . . . . . . . . . . . . . . . . . . . . . . . . . . . . 2,359,9105,997 Horizon Therapeutics PLC (a) . . . . . . . . . . . . . . . . . . 551,9645,588 Jazz Pharmaceuticals PLC (a)(b) . . . . . . . . . . . . . . . . 918,500
38,120 Johnson & Johnson . . . . . . . . . . . . . . . . . . . . . . . . . . 6,265,02230,850 Merck & Co., Inc. . . . . . . . . . . . . . . . . . . . . . . . . . . . 2,378,22626,955 Perrigo Co. PLC . . . . . . . . . . . . . . . . . . . . . . . . . . . . 1,090,86948,283 Pfizer, Inc. . . . . . . . . . . . . . . . . . . . . . . . . . . . . . . . . . 1,749,29366,283 Viatris, Inc. (a) . . . . . . . . . . . . . . . . . . . . . . . . . . . . . . 925,9737,342 Zoetis, Inc. . . . . . . . . . . . . . . . . . . . . . . . . . . . . . . . . . 1,156,218
25,235,212
See notes to financial statements.
41
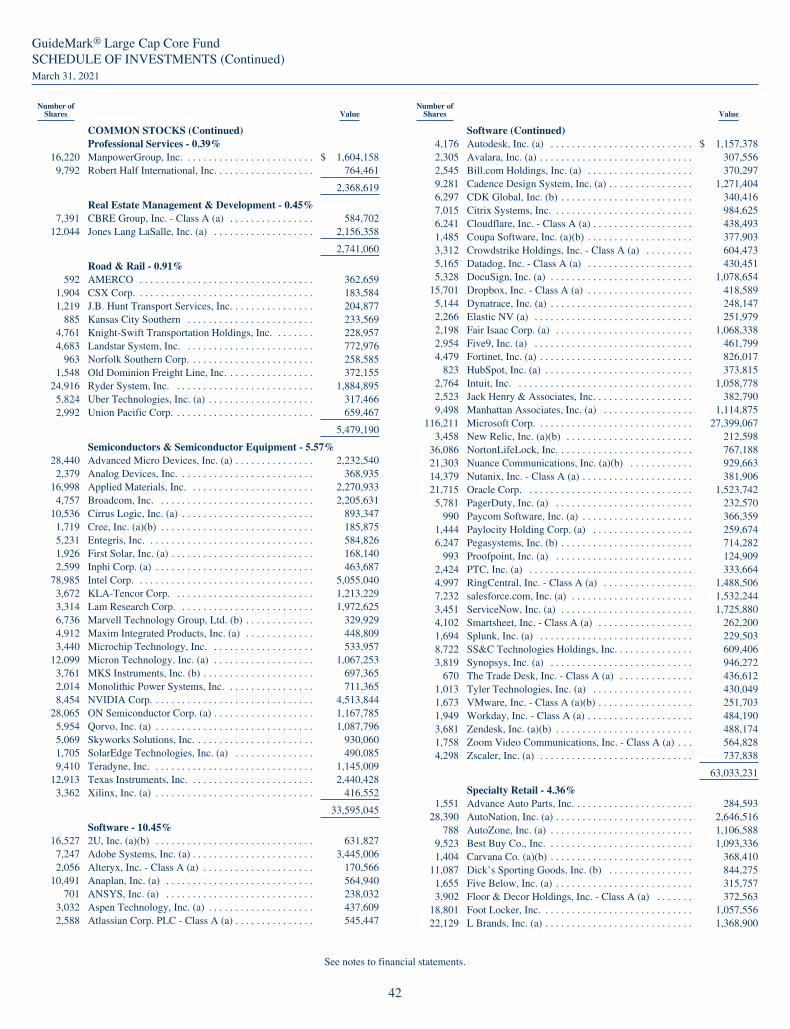
GuideMark® Large Cap Core FundSCHEDULE OF INVESTMENTS (Continued)March 31, 2021
Number ofShares Value
COMMON STOCKS (Continued)Professional Services - 0.39%
16,220 ManpowerGroup, Inc. . . . . . . . . . . . . . . . . . . . . . . . . $ 1,604,1589,792 Robert Half International, Inc. . . . . . . . . . . . . . . . . . . 764,461
2,368,619
Real Estate Management & Development - 0.45%7,391 CBRE Group, Inc. - Class A (a) . . . . . . . . . . . . . . . . 584,702
12,044 Jones Lang LaSalle, Inc. (a) . . . . . . . . . . . . . . . . . . . 2,156,358
2,741,060
Road & Rail - 0.91%592 AMERCO . . . . . . . . . . . . . . . . . . . . . . . . . . . . . . . . . 362,659
1,904 CSX Corp. . . . . . . . . . . . . . . . . . . . . . . . . . . . . . . . . . 183,5841,219 J.B. Hunt Transport Services, Inc. . . . . . . . . . . . . . . . 204,877
885 Kansas City Southern . . . . . . . . . . . . . . . . . . . . . . . . 233,5694,761 Knight-Swift Transportation Holdings, Inc. . . . . . . . 228,9574,683 Landstar System, Inc. . . . . . . . . . . . . . . . . . . . . . . . . 772,976
963 Norfolk Southern Corp. . . . . . . . . . . . . . . . . . . . . . . . 258,5851,548 Old Dominion Freight Line, Inc. . . . . . . . . . . . . . . . . 372,155
24,916 Ryder System, Inc. . . . . . . . . . . . . . . . . . . . . . . . . . . 1,884,8955,824 Uber Technologies, Inc. (a) . . . . . . . . . . . . . . . . . . . . 317,4662,992 Union Pacific Corp. . . . . . . . . . . . . . . . . . . . . . . . . . . 659,467
5,479,190
Semiconductors & Semiconductor Equipment - 5.57%28,440 Advanced Micro Devices, Inc. (a) . . . . . . . . . . . . . . . 2,232,5402,379 Analog Devices, Inc. . . . . . . . . . . . . . . . . . . . . . . . . . 368,935
16,998 Applied Materials, Inc. . . . . . . . . . . . . . . . . . . . . . . . 2,270,9334,757 Broadcom, Inc. . . . . . . . . . . . . . . . . . . . . . . . . . . . . . 2,205,631
10,536 Cirrus Logic, Inc. (a) . . . . . . . . . . . . . . . . . . . . . . . . . 893,3471,719 Cree, Inc. (a)(b) . . . . . . . . . . . . . . . . . . . . . . . . . . . . . 185,8755,231 Entegris, Inc. . . . . . . . . . . . . . . . . . . . . . . . . . . . . . . . 584,8261,926 First Solar, Inc. (a) . . . . . . . . . . . . . . . . . . . . . . . . . . . 168,1402,599 Inphi Corp. (a) . . . . . . . . . . . . . . . . . . . . . . . . . . . . . . 463,687
78,985 Intel Corp. . . . . . . . . . . . . . . . . . . . . . . . . . . . . . . . . . 5,055,0403,672 KLA-Tencor Corp. . . . . . . . . . . . . . . . . . . . . . . . . . . 1,213,2293,314 Lam Research Corp. . . . . . . . . . . . . . . . . . . . . . . . . . 1,972,6256,736 Marvell Technology Group, Ltd. (b) . . . . . . . . . . . . . 329,9294,912 Maxim Integrated Products, Inc. (a) . . . . . . . . . . . . . 448,8093,440 Microchip Technology, Inc. . . . . . . . . . . . . . . . . . . . 533,957
12,099 Micron Technology, Inc. (a) . . . . . . . . . . . . . . . . . . . 1,067,2533,761 MKS Instruments, Inc. (b) . . . . . . . . . . . . . . . . . . . . . 697,3652,014 Monolithic Power Systems, Inc. . . . . . . . . . . . . . . . . 711,3658,454 NVIDIA Corp. . . . . . . . . . . . . . . . . . . . . . . . . . . . . . . 4,513,844
28,065 ON Semiconductor Corp. (a) . . . . . . . . . . . . . . . . . . . 1,167,7855,954 Qorvo, Inc. (a) . . . . . . . . . . . . . . . . . . . . . . . . . . . . . . 1,087,7965,069 Skyworks Solutions, Inc. . . . . . . . . . . . . . . . . . . . . . . 930,0601,705 SolarEdge Technologies, Inc. (a) . . . . . . . . . . . . . . . 490,0859,410 Teradyne, Inc. . . . . . . . . . . . . . . . . . . . . . . . . . . . . . . 1,145,009
12,913 Texas Instruments, Inc. . . . . . . . . . . . . . . . . . . . . . . . 2,440,4283,362 Xilinx, Inc. (a) . . . . . . . . . . . . . . . . . . . . . . . . . . . . . . 416,552
33,595,045
Software - 10.45%16,527 2U, Inc. (a)(b) . . . . . . . . . . . . . . . . . . . . . . . . . . . . . . 631,8277,247 Adobe Systems, Inc. (a) . . . . . . . . . . . . . . . . . . . . . . . 3,445,0062,056 Alteryx, Inc. - Class A (a) . . . . . . . . . . . . . . . . . . . . . 170,566
10,491 Anaplan, Inc. (a) . . . . . . . . . . . . . . . . . . . . . . . . . . . . 564,940701 ANSYS, Inc. (a) . . . . . . . . . . . . . . . . . . . . . . . . . . . . 238,032
3,032 Aspen Technology, Inc. (a) . . . . . . . . . . . . . . . . . . . . 437,6092,588 Atlassian Corp. PLC - Class A (a) . . . . . . . . . . . . . . . 545,447
Number ofShares Value
Software (Continued)4,176 Autodesk, Inc. (a) . . . . . . . . . . . . . . . . . . . . . . . . . . . $ 1,157,3782,305 Avalara, Inc. (a) . . . . . . . . . . . . . . . . . . . . . . . . . . . . . 307,5562,545 Bill.com Holdings, Inc. (a) . . . . . . . . . . . . . . . . . . . . 370,2979,281 Cadence Design System, Inc. (a) . . . . . . . . . . . . . . . . 1,271,4046,297 CDK Global, Inc. (b) . . . . . . . . . . . . . . . . . . . . . . . . . 340,4167,015 Citrix Systems, Inc. . . . . . . . . . . . . . . . . . . . . . . . . . . 984,6256,241 Cloudflare, Inc. - Class A (a) . . . . . . . . . . . . . . . . . . . 438,4931,485 Coupa Software, Inc. (a)(b) . . . . . . . . . . . . . . . . . . . . 377,9033,312 Crowdstrike Holdings, Inc. - Class A (a) . . . . . . . . . 604,4735,165 Datadog, Inc. - Class A (a) . . . . . . . . . . . . . . . . . . . . 430,4515,328 DocuSign, Inc. (a) . . . . . . . . . . . . . . . . . . . . . . . . . . . 1,078,654
15,701 Dropbox, Inc. - Class A (a) . . . . . . . . . . . . . . . . . . . . 418,5895,144 Dynatrace, Inc. (a) . . . . . . . . . . . . . . . . . . . . . . . . . . . 248,1472,266 Elastic NV (a) . . . . . . . . . . . . . . . . . . . . . . . . . . . . . . 251,9792,198 Fair Isaac Corp. (a) . . . . . . . . . . . . . . . . . . . . . . . . . . 1,068,3382,954 Five9, Inc. (a) . . . . . . . . . . . . . . . . . . . . . . . . . . . . . . 461,7994,479 Fortinet, Inc. (a) . . . . . . . . . . . . . . . . . . . . . . . . . . . . . 826,017
823 HubSpot, Inc. (a) . . . . . . . . . . . . . . . . . . . . . . . . . . . . 373,8152,764 Intuit, Inc. . . . . . . . . . . . . . . . . . . . . . . . . . . . . . . . . . 1,058,7782,523 Jack Henry & Associates, Inc. . . . . . . . . . . . . . . . . . . 382,7909,498 Manhattan Associates, Inc. (a) . . . . . . . . . . . . . . . . . 1,114,875
116,211 Microsoft Corp. . . . . . . . . . . . . . . . . . . . . . . . . . . . . . 27,399,0673,458 New Relic, Inc. (a)(b) . . . . . . . . . . . . . . . . . . . . . . . . 212,598
36,086 NortonLifeLock, Inc. . . . . . . . . . . . . . . . . . . . . . . . . . 767,18821,303 Nuance Communications, Inc. (a)(b) . . . . . . . . . . . . 929,66314,379 Nutanix, Inc. - Class A (a) . . . . . . . . . . . . . . . . . . . . . 381,90621,715 Oracle Corp. . . . . . . . . . . . . . . . . . . . . . . . . . . . . . . . 1,523,7425,781 PagerDuty, Inc. (a) . . . . . . . . . . . . . . . . . . . . . . . . . . 232,570
990 Paycom Software, Inc. (a) . . . . . . . . . . . . . . . . . . . . . 366,3591,444 Paylocity Holding Corp. (a) . . . . . . . . . . . . . . . . . . . 259,6746,247 Pegasystems, Inc. (b) . . . . . . . . . . . . . . . . . . . . . . . . . 714,282
993 Proofpoint, Inc. (a) . . . . . . . . . . . . . . . . . . . . . . . . . . 124,9092,424 PTC, Inc. (a) . . . . . . . . . . . . . . . . . . . . . . . . . . . . . . . 333,6644,997 RingCentral, Inc. - Class A (a) . . . . . . . . . . . . . . . . . 1,488,5067,232 salesforce.com, Inc. (a) . . . . . . . . . . . . . . . . . . . . . . . 1,532,2443,451 ServiceNow, Inc. (a) . . . . . . . . . . . . . . . . . . . . . . . . . 1,725,8804,102 Smartsheet, Inc. - Class A (a) . . . . . . . . . . . . . . . . . . 262,2001,694 Splunk, Inc. (a) . . . . . . . . . . . . . . . . . . . . . . . . . . . . . 229,5038,722 SS&C Technologies Holdings, Inc. . . . . . . . . . . . . . . 609,4063,819 Synopsys, Inc. (a) . . . . . . . . . . . . . . . . . . . . . . . . . . . 946,272
670 The Trade Desk, Inc. - Class A (a) . . . . . . . . . . . . . . 436,6121,013 Tyler Technologies, Inc. (a) . . . . . . . . . . . . . . . . . . . 430,0491,673 VMware, Inc. - Class A (a)(b) . . . . . . . . . . . . . . . . . . 251,7031,949 Workday, Inc. - Class A (a) . . . . . . . . . . . . . . . . . . . . 484,1903,681 Zendesk, Inc. (a)(b) . . . . . . . . . . . . . . . . . . . . . . . . . . 488,1741,758 Zoom Video Communications, Inc. - Class A (a) . . . 564,8284,298 Zscaler, Inc. (a) . . . . . . . . . . . . . . . . . . . . . . . . . . . . . 737,838
63,033,231
Specialty Retail - 4.36%1,551 Advance Auto Parts, Inc. . . . . . . . . . . . . . . . . . . . . . . 284,593
28,390 AutoNation, Inc. (a) . . . . . . . . . . . . . . . . . . . . . . . . . . 2,646,516788 AutoZone, Inc. (a) . . . . . . . . . . . . . . . . . . . . . . . . . . . 1,106,588
9,523 Best Buy Co., Inc. . . . . . . . . . . . . . . . . . . . . . . . . . . . 1,093,3361,404 Carvana Co. (a)(b) . . . . . . . . . . . . . . . . . . . . . . . . . . . 368,410
11,087 Dick’s Sporting Goods, Inc. (b) . . . . . . . . . . . . . . . . 844,2751,655 Five Below, Inc. (a) . . . . . . . . . . . . . . . . . . . . . . . . . . 315,7573,902 Floor & Decor Holdings, Inc. - Class A (a) . . . . . . . 372,563
18,801 Foot Locker, Inc. . . . . . . . . . . . . . . . . . . . . . . . . . . . . 1,057,55622,129 L Brands, Inc. (a) . . . . . . . . . . . . . . . . . . . . . . . . . . . . 1,368,900
See notes to financial statements.
42

GuideMark® Large Cap Core FundSCHEDULE OF INVESTMENTS (Continued)March 31, 2021
Number ofShares Value
COMMON STOCKS (Continued)Specialty Retail (Continued)
13,483 Lowe’s Cos., Inc. . . . . . . . . . . . . . . . . . . . . . . . . . . . . $ 2,564,1971,882 O’Reilly Automotive, Inc. (a) . . . . . . . . . . . . . . . . . . 954,645
25,619 Penske Automotive Group, Inc. . . . . . . . . . . . . . . . . 2,055,6692,275 Ross Stores, Inc. . . . . . . . . . . . . . . . . . . . . . . . . . . . . 272,7951,651 Sherwin-Williams Co. . . . . . . . . . . . . . . . . . . . . . . . . 1,218,455
31,864 The Gap, Inc. (a)(b) . . . . . . . . . . . . . . . . . . . . . . . . . . 948,91016,294 The Home Depot, Inc. . . . . . . . . . . . . . . . . . . . . . . . . 4,973,74311,603 The TJX Cos., Inc. . . . . . . . . . . . . . . . . . . . . . . . . . . . 767,5384,976 Tractor Supply Co. . . . . . . . . . . . . . . . . . . . . . . . . . . 881,1502,472 Ulta Beauty, Inc. (a) . . . . . . . . . . . . . . . . . . . . . . . . . 764,2683,282 Vroom, Inc. (a) . . . . . . . . . . . . . . . . . . . . . . . . . . . . . 127,9657,145 Williams Sonoma, Inc. (b) . . . . . . . . . . . . . . . . . . . . . 1,280,384
26,268,213
Technology Hardware, Storage & Peripherals - 5.79%250,359 Apple, Inc. . . . . . . . . . . . . . . . . . . . . . . . . . . . . . . . . . 30,581,352
1,396 Dell Technologies, Inc. - Class C (a) . . . . . . . . . . . . 123,05812,136 HP, Inc. . . . . . . . . . . . . . . . . . . . . . . . . . . . . . . . . . . . 385,3187,548 International Business Machines Corp. . . . . . . . . . . . 1,005,847
17,492 NCR Corp. (a) . . . . . . . . . . . . . . . . . . . . . . . . . . . . . . 663,8219,717 NetApp, Inc. . . . . . . . . . . . . . . . . . . . . . . . . . . . . . . . 706,134
26,967 Pure Storage, Inc. - Class A (a)(b) . . . . . . . . . . . . . . 580,86918,643 Teradata Corp. (a)(b) . . . . . . . . . . . . . . . . . . . . . . . . . 718,5017,254 Xerox Holdings Corp. (b) . . . . . . . . . . . . . . . . . . . . . 176,055
34,940,955
Textiles, Apparel & Luxury Goods - 1.94%19,525 Capri Holdings, Ltd. (a) . . . . . . . . . . . . . . . . . . . . . . . 995,7754,409 Carter’s, Inc. (a) . . . . . . . . . . . . . . . . . . . . . . . . . . . . . 392,0925,320 Columbia Sportswear Co. . . . . . . . . . . . . . . . . . . . . . 561,9525,044 lululemon athletica, Inc. (a)(b) . . . . . . . . . . . . . . . . . 1,547,045
17,729 NIKE, Inc. - Class B . . . . . . . . . . . . . . . . . . . . . . . . . 2,356,00714,843 PVH Corp. (a) . . . . . . . . . . . . . . . . . . . . . . . . . . . . . . 1,568,9054,096 Ralph Lauren Corp. - Class A (a) . . . . . . . . . . . . . . . 504,463
11,450 Skechers U.S.A., Inc. - Class A (a) . . . . . . . . . . . . . . 477,58029,781 Tapestry, Inc. (a) . . . . . . . . . . . . . . . . . . . . . . . . . . . . 1,227,27541,942 Under Armour, Inc. - Class A (a)(b) . . . . . . . . . . . . . 929,43526,607 Under Armour, Inc. - Class C (a)(b) . . . . . . . . . . . . . 491,1658,220 VF Corp. . . . . . . . . . . . . . . . . . . . . . . . . . . . . . . . . . . 656,942
11,708,636
Tobacco - 0.37%3,774 Altria Group, Inc. . . . . . . . . . . . . . . . . . . . . . . . . . . . 193,078
22,856 Philip Morris International, Inc. . . . . . . . . . . . . . . . . 2,028,241
2,221,319
Trading Companies & Distributors - 0.74%16,968 Fastenal Co. . . . . . . . . . . . . . . . . . . . . . . . . . . . . . . . . 853,1517,154 MSC Industrial Direct Co., Inc. - Class A . . . . . . . . . 645,2191,317 United Rentals, Inc. (a) . . . . . . . . . . . . . . . . . . . . . . . 433,701
58,513 Univar, Inc. (a) . . . . . . . . . . . . . . . . . . . . . . . . . . . . . 1,260,3702,021 W.W. Grainger, Inc. . . . . . . . . . . . . . . . . . . . . . . . . . 810,2801,774 Watsco, Inc. - Class A (b) . . . . . . . . . . . . . . . . . . . . . 462,571
4,465,292
Transportation Infrastructure - 0.05%8,570 Macquarie Infrastructure Corp. . . . . . . . . . . . . . . . . . 272,612
Wireless Telecommunication Services - 0.05%8,252 United States Cellular Corp. (a) . . . . . . . . . . . . . . . . 301,033
Total Common Stocks(Cost $322,011,736) . . . . . . . . . . . . . . . . . . . . . . . . 577,837,100
Number ofShares Value
INVESTMENT COMPANIES - 2.38%Exchange Traded Funds - 2.38%
39,377 Vanguard S&P 500 ETF . . . . . . . . . . . . . . . . . . . . . . $ 14,345,041
Total Investment Companies(Cost $10,165,054) . . . . . . . . . . . . . . . . . . . . . . . . . 14,345,041
REAL ESTATE INVESTMENT TRUSTS - 0.96%Real Estate Investment Trusts - 0.96%
8,245 American Homes 4 Rent - Class A . . . . . . . . . . . . . . 274,888314,505 Apartment Investment and Management Co. -
Class A . . . . . . . . . . . . . . . . . . . . . . . . . . . . . . . . . . 1,931,06111,647 Brandywine Realty Trust . . . . . . . . . . . . . . . . . . . . . . 150,36313,667 Brixmor Property Group, Inc. . . . . . . . . . . . . . . . . . . 276,48311,366 Brookfield Property REIT, Inc. - Class A . . . . . . . . . 204,0202,446 Camden Property Trust . . . . . . . . . . . . . . . . . . . . . . . 268,8406,200 Corporate Office Properties Trust . . . . . . . . . . . . . . . 163,2463,292 CubeSmart . . . . . . . . . . . . . . . . . . . . . . . . . . . . . . . . . 124,5362,815 Digital Realty Trust, Inc. . . . . . . . . . . . . . . . . . . . . . . 396,465
81,102 Empire State Realty Trust, Inc. - Class A (a)(b) . . . . 902,665952 Extra Space Storage, Inc. . . . . . . . . . . . . . . . . . . . . . . 126,188
3,666 Highwoods Properties, Inc. . . . . . . . . . . . . . . . . . . . . 157,4182,141 Life Storage, Inc. . . . . . . . . . . . . . . . . . . . . . . . . . . . . 184,019
53,033 Paramount Group, Inc. . . . . . . . . . . . . . . . . . . . . . . . 537,2244,429 VICI Properties, Inc. . . . . . . . . . . . . . . . . . . . . . . . . . 125,075
Total Real Estate Investment Trusts(Cost $4,804,071) . . . . . . . . . . . . . . . . . . . . . . . . . . 5,822,491
SHORT TERM INVESTMENTS - 0.72%Money Market Funds - 0.72%
4,347,830 DWS Government Money Market Series -Institutional SharesEffective Yield, 0.04% (c) . . . . . . . . . . . . . . . . . . . 4,347,830
Total Short Term Investments(Cost $4,347,830) . . . . . . . . . . . . . . . . . . . . . . . . . . 4,347,830
Number ofUnits
INVESTMENTS PURCHASED WITH PROCEEDS FROMSECURITIES LENDING COLLATERAL - 5.63%
33,919,804 Mount Vernon Liquid Assets Portfolio, LLCEffective Yield, 0.11% (c) . . . . . . . . . . . . . . . . . . . 33,919,804
Total Investments Purchased with Proceeds fromSecurities Lending Collateral(Cost $33,919,804) . . . . . . . . . . . . . . . . . . . . . . . . . 33,919,804
Total Investments(Cost $375,248,495) - 105.55% . . . . . . . . . . . . . . 636,272,266
Liabilities in Excess ofOther Assets - (5.55)% . . . . . . . . . . . . . . . . . . . . . (33,482,969)
TOTAL NET ASSETS - 100.00% . . . . . . . . . . . . . $602,789,297
Percentages are stated as a percent of net assets.(a) Non-income producing security.(b) All or portion of this security is on loan.(c) Seven-day yield as of March 31, 2021.
See notes to financial statements.
43

GuideMark® Emerging Markets FundSCHEDULE OF INVESTMENTSMarch 31, 2021
Number ofShares Value
COMMON STOCKS - 85.62%Argentina - 0.31%
932 Globant SA - ADR (a) . . . . . . . . . . . . . . . . . . . . . . . . . $ 193,49226,700 YPF SA - ADR (a) . . . . . . . . . . . . . . . . . . . . . . . . . . . 109,737
303,229
Brazil - 4.33%43,485 Ambev SA . . . . . . . . . . . . . . . . . . . . . . . . . . . . . . . . . . 118,35713,415 B3 SA - Brasil Bolsa Balcao . . . . . . . . . . . . . . . . . . . . 130,29718,352 Banco do Brasil SA . . . . . . . . . . . . . . . . . . . . . . . . . . . 99,5423,149 Banco Inter SA . . . . . . . . . . . . . . . . . . . . . . . . . . . . . . 87,455
31,060 BB Seguridade Participacoes SA . . . . . . . . . . . . . . . . 133,81615,268 Cia de Saneamento Basico do Estado de Sao Paulo . . 111,13323,742 Cia Siderurgica Nacional SA . . . . . . . . . . . . . . . . . . . . 159,14744,925 Hapvida Participacoes e Investimentos SA . . . . . . . . . 118,52549,607 JBS SA . . . . . . . . . . . . . . . . . . . . . . . . . . . . . . . . . . . . 265,28020,630 Klabin SA (a) . . . . . . . . . . . . . . . . . . . . . . . . . . . . . . . . 100,86620,096 Lojas Renner SA . . . . . . . . . . . . . . . . . . . . . . . . . . . . . 151,77493,870 Magazine Luiza SA . . . . . . . . . . . . . . . . . . . . . . . . . . . 334,87813,627 Natura & Co., Holding SA (a) . . . . . . . . . . . . . . . . . . . 116,28111,648 Notre Dame Intermedica Participacoes SA . . . . . . . . . 171,55454,732 Petroleo Brasileiro SA . . . . . . . . . . . . . . . . . . . . . . . . . 233,08063,055 Raia Drogasil SA . . . . . . . . . . . . . . . . . . . . . . . . . . . . . 281,85522,560 Sul America SA . . . . . . . . . . . . . . . . . . . . . . . . . . . . . . 137,3989,594 Suzano SA (a) . . . . . . . . . . . . . . . . . . . . . . . . . . . . . . . 117,286
49,899 Vale SA . . . . . . . . . . . . . . . . . . . . . . . . . . . . . . . . . . . . 864,62151,477 Via Varejo SA (a) . . . . . . . . . . . . . . . . . . . . . . . . . . . . 110,20427,710 WEG SA . . . . . . . . . . . . . . . . . . . . . . . . . . . . . . . . . . . 368,686
4,212,035
Chile - 0.37%96,093 Cencosud SA . . . . . . . . . . . . . . . . . . . . . . . . . . . . . . . . 205,40034,490 Falabella SA . . . . . . . . . . . . . . . . . . . . . . . . . . . . . . . . 156,647
362,047
China - 25.51%373,865 Agricultural Bank of China, Ltd. - Series H . . . . . . . . 149,868
6,516 Airtac International Group . . . . . . . . . . . . . . . . . . . . . 232,42619,218 Alibaba Group Holding, Ltd. - ADR (a) . . . . . . . . . . . 4,357,29725,182 Anhui Conch Cement Co., Ltd. - Series H . . . . . . . . . 164,44414,532 ANTA Sports Products, Ltd. . . . . . . . . . . . . . . . . . . . . 238,3521,070 Autohome, Inc. - ADR (b) . . . . . . . . . . . . . . . . . . . . . . 99,7992,593 Baidu, Inc. - ADR (a) . . . . . . . . . . . . . . . . . . . . . . . . . 564,107
877,670 Bank of China, Ltd. - Series H . . . . . . . . . . . . . . . . . . 334,773246,960 Bank of Communications Co., Ltd. - Series H . . . . . . 157,472
4,540 Baozun, Inc. - ADR (a)(b) . . . . . . . . . . . . . . . . . . . . . . 173,156287 BeiGene, Ltd. - ADR (a) . . . . . . . . . . . . . . . . . . . . . . . 99,899
1,961 Bilibili, Inc. - ADR (a) . . . . . . . . . . . . . . . . . . . . . . . . 209,9455,713 BYD Co., Ltd. - Series H . . . . . . . . . . . . . . . . . . . . . . 123,611
19,947 BYD Electronic International Co., Ltd. . . . . . . . . . . . . 117,5833,241 CanSino Biologics, Inc. - Series H (a) . . . . . . . . . . . . 122,974
569,672 China Cinda Asset Management Co., Ltd. -Series H . . . . . . . . . . . . . . . . . . . . . . . . . . . . . . . . . . 118,837
268,528 China CITIC Bank Corp., Ltd. - Series H . . . . . . . . . . 136,575205,203 China Communications Services Corp., Ltd. -
Series H . . . . . . . . . . . . . . . . . . . . . . . . . . . . . . . . . . 92,443780,597 China Construction Bank Corp. - Series H . . . . . . . . . 657,978347,000 China Everbright Bank Co., Ltd. - Series H . . . . . . . . 151,571185,323 China Hongqiao Group, Ltd. . . . . . . . . . . . . . . . . . . . . 247,86226,659 China Meidong Auto Holdings, Ltd. . . . . . . . . . . . . . . 123,80826,705 China Merchants Bank Co., Ltd. - Series H . . . . . . . . 204,592
230,247 China Minsheng Banking Corp., Ltd. - Series H . . . . 133,688
Number ofShares Value
China (Continued)170,617 China National Building Material Co., Ltd. -
Series H . . . . . . . . . . . . . . . . . . . . . . . . . . . . . . . . . . $ 247,175346,614 China Resources Pharmaceutical Group, Ltd. . . . . . . . 216,381169,767 China Southern Airlines Co., Ltd. - Series H (a) . . . . . 126,026125,120 COSCO SHIPPING Holdings Co., Ltd. -
Series H (a) . . . . . . . . . . . . . . . . . . . . . . . . . . . . . . . . 161,94119,609 Country Garden Services Holdings Co., Ltd. . . . . . . . 199,864
177,622 CSPC Pharmaceutical Group, Ltd. . . . . . . . . . . . . . . . 215,9541,293 Daqo New Energy Corp. - ADR (a) . . . . . . . . . . . . . . 97,622
99,027 Dongfeng Motor Group Co., Ltd. - Series H . . . . . . . . 92,37950,659 Great Wall Motor Co., Ltd. - Series H . . . . . . . . . . . . 141,6473,349 GSX Techedu, Inc. - ADR (a)(b) . . . . . . . . . . . . . . . . 113,464
21,462 Haidilao International Holding, Ltd. . . . . . . . . . . . . . . 147,199500,755 Industrial & Commercial Bank of China Ltd. -
Series H . . . . . . . . . . . . . . . . . . . . . . . . . . . . . . . . . . 360,19312,914 Innovent Biologics, Inc. (a) . . . . . . . . . . . . . . . . . . . . . 132,0748,785 JD.com, Inc. - ADR (a)(b) . . . . . . . . . . . . . . . . . . . . . . 740,8391,555 JOYY, Inc. - ADR . . . . . . . . . . . . . . . . . . . . . . . . . . . . 145,750
199,859 Kaisa Group Holdings, Ltd. . . . . . . . . . . . . . . . . . . . . 99,08854,570 Kingdee International Software Group Co., Ltd. . . . . 171,131
158,377 Lenovo Group, Ltd. . . . . . . . . . . . . . . . . . . . . . . . . . . . 226,03547,695 Li Ning Co., Ltd. . . . . . . . . . . . . . . . . . . . . . . . . . . . . . 312,02018,881 Longfor Properties Co., Ltd. . . . . . . . . . . . . . . . . . . . . 125,23030,920 Meituan - Class B (a) . . . . . . . . . . . . . . . . . . . . . . . . . . 1,206,62820,351 Microport Scientific Corp. . . . . . . . . . . . . . . . . . . . . . . 115,5365,955 Momo, Inc. - ADR . . . . . . . . . . . . . . . . . . . . . . . . . . . 87,7774,590 NetEase, Inc. - ADR (b) . . . . . . . . . . . . . . . . . . . . . . . 473,9637,339 NIO, Inc. - ADR (a) . . . . . . . . . . . . . . . . . . . . . . . . . . . 286,074
172,318 PICC Property & Casualty Co., Ltd. - Series H . . . . . 149,9343,123 Pinduoduo, Inc. - ADR (a) . . . . . . . . . . . . . . . . . . . . . 418,107
52,932 Ping An Insurance Group Co. of China, Ltd. -Series H . . . . . . . . . . . . . . . . . . . . . . . . . . . . . . . . . . 633,139
94,865 Seazen Group, Ltd. . . . . . . . . . . . . . . . . . . . . . . . . . . . 116,58757,018 Shanghai Pharmaceuticals Holding Co., Ltd. -
Series H . . . . . . . . . . . . . . . . . . . . . . . . . . . . . . . . . . 112,0733,167 Silergy Corp. . . . . . . . . . . . . . . . . . . . . . . . . . . . . . . . . 261,2195,944 Sunny Optical Technology Group Co., Ltd. . . . . . . . . 136,5581,402 TAL Education Group - ADR (a) . . . . . . . . . . . . . . . . 75,498
59,941 Tencent Holdings, Ltd. . . . . . . . . . . . . . . . . . . . . . . . . 4,783,745136,824 Tingyi Cayman Islands Holding Corp. . . . . . . . . . . . . 251,58276,974 Topsports International Holdings, Ltd. . . . . . . . . . . . . 114,778
100,731 Uni-President China Holdings, Ltd. . . . . . . . . . . . . . . 122,56214,454 Vipshop Holdings, Ltd. - ADR (a) . . . . . . . . . . . . . . . 431,59623,457 Wuxi Biologics Cayman, Inc. (a) . . . . . . . . . . . . . . . . 295,81162,913 Xiaomi Corp. (a) . . . . . . . . . . . . . . . . . . . . . . . . . . . . . 210,13686,748 Xinyi Solar Holdings, Ltd. . . . . . . . . . . . . . . . . . . . . . 143,78972,489 Yadea Group Holdings, Ltd. . . . . . . . . . . . . . . . . . . . . 161,482
120,761 Yanzhou Coal Mining Co., Ltd. - Series H . . . . . . . . . 143,21020,942 Yihai International Holding, Ltd. . . . . . . . . . . . . . . . . 218,4956,045 Yum China Holdings, Inc. . . . . . . . . . . . . . . . . . . . . . . 357,9251,416 Zai Lab Ltd. - ADR (a) . . . . . . . . . . . . . . . . . . . . . . . . 188,937
20,376 Zhongsheng Group Holdings, Ltd. . . . . . . . . . . . . . . . 144,34974,293 Zijin Mining Group Co., Ltd. - Series H . . . . . . . . . . . 91,879
24,818,441
Cyprus - 0.10%1,703 TCS Group Holding PLC (d) . . . . . . . . . . . . . . . . . . . 98,700
Egypt - 0.21%54,211 Commercial International Bank Egypt SAE . . . . . . . . 199,339
See notes to financial statements.
44

GuideMark® Emerging Markets FundSCHEDULE OF INVESTMENTS (Continued)March 31, 2021
Number ofShares Value
COMMON STOCKS (Continued)Hong Kong - 2.11%
34,569 Beijing Enterprises Holdings, Ltd. . . . . . . . . . . . . . . . $ 122,354332,982 Bosideng International Holdings, Ltd. . . . . . . . . . . . . 150,372399,513 China Youzan, Ltd. (a) . . . . . . . . . . . . . . . . . . . . . . . . 131,658243,638 China Jinmao Holdings Group, Ltd. . . . . . . . . . . . . . . 98,05340,216 China Mengniu Dairy Co., Ltd. . . . . . . . . . . . . . . . . . . 231,67515,171 China Resources Beer Holdings Co., Ltd. . . . . . . . . . . 119,57489,903 China Resources Cement Holdings, Ltd. . . . . . . . . . . 101,41263,200 China Taiping Insurance Holdings Co., Ltd. . . . . . . . . 129,25239,664 Hopson Development Holdings, Ltd. . . . . . . . . . . . . . 143,02743,417 Kingboard Chemical Holdings, Ltd. . . . . . . . . . . . . . . 234,990
195,089 Kunlun Energy Co., Ltd. . . . . . . . . . . . . . . . . . . . . . . . 205,82233,223 Shimao Property Holdings, Ltd. . . . . . . . . . . . . . . . . . 104,905
134,762 Sino Biopharmaceutical, Ltd. . . . . . . . . . . . . . . . . . . . 135,280612,961 Yuexiu Property Co., Ltd. . . . . . . . . . . . . . . . . . . . . . . 139,106
2,047,480
Hungary - 0.29%16,022 MOL Hungarian Oil & Gas Plc (a) . . . . . . . . . . . . . . . 115,9875,750 Richter Gedeon Nyrt . . . . . . . . . . . . . . . . . . . . . . . . . . 169,528
285,515
India - 9.42%14,887 Adani Green Energy, Ltd. (a) . . . . . . . . . . . . . . . . . . . 225,8829,436 Adani Port & Special Economic Zone, Ltd. (a) . . . . . 90,8602,929 Apollo Hospitals Enterprise, Ltd. . . . . . . . . . . . . . . . . 116,5506,122 Asian Paints, Ltd. . . . . . . . . . . . . . . . . . . . . . . . . . . . . 213,002
12,157 Aurobindo Pharma, Ltd. . . . . . . . . . . . . . . . . . . . . . . . 146,9149,076 Cipla, Ltd. (a) . . . . . . . . . . . . . . . . . . . . . . . . . . . . . . . 101,4007,870 Colgate-Palmolive India, Ltd. . . . . . . . . . . . . . . . . . . . 168,178
15,965 Dabur India, Ltd. . . . . . . . . . . . . . . . . . . . . . . . . . . . . . 118,2185,602 Divi’s Laboratories, Ltd. (a) . . . . . . . . . . . . . . . . . . . . 278,0324,115 Dr. Reddy’s Laboratories, Ltd. . . . . . . . . . . . . . . . . . . 254,576
14,668 Grasim Industries, Ltd. . . . . . . . . . . . . . . . . . . . . . . . . 291,7696,692 Havells India, Ltd. . . . . . . . . . . . . . . . . . . . . . . . . . . . . 96,379
36,488 HCL Technologies, Ltd. . . . . . . . . . . . . . . . . . . . . . . . 491,7915,869 HDFC Asset Management Co., Ltd. . . . . . . . . . . . . . . 235,024
11,862 HDFC Life Insurance Co., Ltd. (a) . . . . . . . . . . . . . . . 113,20745,384 Hindalco Industries, Ltd. . . . . . . . . . . . . . . . . . . . . . . . 204,1474,109 Hindustan Unilever, Ltd. . . . . . . . . . . . . . . . . . . . . . . . 137,046
12,978 Housing Development Finance Corp., Ltd. . . . . . . . . . 445,91625,648 ICICI Bank, Ltd. (a) . . . . . . . . . . . . . . . . . . . . . . . . . . 205,1695,071 ICICI Lombard General Insurance Co., Ltd. . . . . . . . . 99,679
57,688 Infosys, Ltd. . . . . . . . . . . . . . . . . . . . . . . . . . . . . . . . . . 1,082,4694,904 Ipca Laboratories, Ltd. . . . . . . . . . . . . . . . . . . . . . . . . 127,8364,646 Larsen & Toubro Infotech, Ltd. . . . . . . . . . . . . . . . . . 258,307
19,797 Marico, Ltd. . . . . . . . . . . . . . . . . . . . . . . . . . . . . . . . . . 111,6405,758 Muthoot Finance, Ltd. (a) . . . . . . . . . . . . . . . . . . . . . . 95,0351,127 Nestle India, Ltd. . . . . . . . . . . . . . . . . . . . . . . . . . . . . . 265,054
142,033 Oil & Natural Gas Corp., Ltd. . . . . . . . . . . . . . . . . . . . 199,098370 Page Industries, Ltd. . . . . . . . . . . . . . . . . . . . . . . . . . . 153,794
4,322 Pidilite Industries, Ltd. (a) . . . . . . . . . . . . . . . . . . . . . . 107,232125,009 REC, Ltd. . . . . . . . . . . . . . . . . . . . . . . . . . . . . . . . . . . . 225,16818,913 Reliance Industries, Ltd. . . . . . . . . . . . . . . . . . . . . . . . 520,03610,654 Tata Consultancy Services, Ltd. . . . . . . . . . . . . . . . . . 464,21516,464 Tata Consumer Products, Ltd. . . . . . . . . . . . . . . . . . . . 144,24145,516 Tata Motors, Ltd. (a) . . . . . . . . . . . . . . . . . . . . . . . . . . 189,16117,088 Tata Steel, Ltd. . . . . . . . . . . . . . . . . . . . . . . . . . . . . . . 190,6439,079 Tech Mahindra, Ltd. . . . . . . . . . . . . . . . . . . . . . . . . . . 123,4723,068 Torrent Pharmaceuticals, Ltd. . . . . . . . . . . . . . . . . . . . 106,925
139,798 Vedanta, Ltd. . . . . . . . . . . . . . . . . . . . . . . . . . . . . . . . . 439,121
Number ofShares Value
India (Continued)40,542 Wipro, Ltd. . . . . . . . . . . . . . . . . . . . . . . . . . . . . . . . . . $ 230,08935,514 Zee Entertainment Enterprises, Ltd. . . . . . . . . . . . . . . 99,145
9,166,420
Indonesia - 1.00%637,700 Aneka Tambang Tbk . . . . . . . . . . . . . . . . . . . . . . . . . . 99,41344,748 Bank Central Asia Tbk PT . . . . . . . . . . . . . . . . . . . . . 95,832
233,522 Indah Kiat Pulp & Paper Corp. Tbk PT . . . . . . . . . . . 168,409296,654 Indofood Sukses Makmur Tbk PT . . . . . . . . . . . . . . . 135,117
1,215,482 Kalbe Farma Tbk PT . . . . . . . . . . . . . . . . . . . . . . . . . . 131,381764,160 Merdeka Copper Gold Tbk PT (a) . . . . . . . . . . . . . . . 113,667463,270 Telekomunikasi Indonesia Persero Tbk PT . . . . . . . . . 109,349260,065 Unilever Indonesia Tbk PT . . . . . . . . . . . . . . . . . . . . . 117,813
970,981
Mexico - 1.65%400,485 America Movil SAB de CV - Series L . . . . . . . . . . . . 272,94070,120 Becle SAB de CV . . . . . . . . . . . . . . . . . . . . . . . . . . . . 159,935
484,811 Cemex SAB de CV (a) . . . . . . . . . . . . . . . . . . . . . . . . 340,8479,053 Gruma SAB de CV - Series B . . . . . . . . . . . . . . . . . . . 107,186
70,159 Grupo Bimbo SAB de CV - Series A . . . . . . . . . . . . . 147,25553,835 Grupo Mexico SAB de CV - Series B . . . . . . . . . . . . . 283,77393,130 Wal-Mart de Mexico SAB de CV . . . . . . . . . . . . . . . . 294,114
1,606,050
Philippines - 0.47%5,802 Globe Telecom, Inc. . . . . . . . . . . . . . . . . . . . . . . . . . . 224,977
1,399,258 Metro Pacific Investments Corp. . . . . . . . . . . . . . . . . . 107,9904,771 PLDT, Inc. . . . . . . . . . . . . . . . . . . . . . . . . . . . . . . . . . . 120,693
453,660
Poland - 0.62%4,277 Dino Polska SA (a) . . . . . . . . . . . . . . . . . . . . . . . . . . . 281,953
62,574 Orange Polska SA (a) . . . . . . . . . . . . . . . . . . . . . . . . . 104,18262,689 PGE Polska Grupa Energetyczna SA (a) . . . . . . . . . . 107,77769,306 Polskie Gornictwo Naftowe i Gazownictwo SA . . . . . 105,387
599,299
Peru - 0.10%1,412 Southern Copper Corp. . . . . . . . . . . . . . . . . . . . . . . . . 95,832
Qatar - 0.77%91,205 Masraf Al Rayan QSC . . . . . . . . . . . . . . . . . . . . . . . . . 107,495
137,960 Ooredoo QPSC . . . . . . . . . . . . . . . . . . . . . . . . . . . . . . 268,34027,710 Qatar Islamic Bank SAQ . . . . . . . . . . . . . . . . . . . . . . . 125,31350,280 Qatar National Bank QPSC . . . . . . . . . . . . . . . . . . . . . 248,521
749,669
Republic of Korea - 14.28%1,950 Alteogen, Inc. (a) . . . . . . . . . . . . . . . . . . . . . . . . . . . . . 155,134
925 Amorepacific Corp. . . . . . . . . . . . . . . . . . . . . . . . . . . . 212,4371,113 Celltrion Healthcare Co., Ltd. (a) . . . . . . . . . . . . . . . . 134,314
913 Celltrion Pharm, Inc. (a) . . . . . . . . . . . . . . . . . . . . . . . 121,736512 Celltrion, Inc. (a) . . . . . . . . . . . . . . . . . . . . . . . . . . . . . 147,579
8,743 Cheil Worldwide, Inc. . . . . . . . . . . . . . . . . . . . . . . . . . 164,672467 CJ CheilJedang Corp. . . . . . . . . . . . . . . . . . . . . . . . . . 169,923
1,860 CJ Corp. . . . . . . . . . . . . . . . . . . . . . . . . . . . . . . . . . . . . 155,121791 CJ ENM Co., Ltd. . . . . . . . . . . . . . . . . . . . . . . . . . . . . 99,944
3,929 DB Insurance Co., Ltd. . . . . . . . . . . . . . . . . . . . . . . . . 164,2966,073 GS Engineering & Construction Corp. . . . . . . . . . . . . 231,9885,093 GS Holdings Corp. . . . . . . . . . . . . . . . . . . . . . . . . . . . 176,7193,062 GS Retail Co., Ltd. . . . . . . . . . . . . . . . . . . . . . . . . . . . 103,5835,533 Hana Financial Group, Inc. . . . . . . . . . . . . . . . . . . . . . 209,275
See notes to financial statements.
45

GuideMark® Emerging Markets FundSCHEDULE OF INVESTMENTS (Continued)March 31, 2021
Number ofShares Value
COMMON STOCKS (Continued)Republic of Korea (Continued)
4,323 Hankook Tire Co., Ltd. . . . . . . . . . . . . . . . . . . . . . . . . $ 188,1632,458 Hanwha Chemical Corp. (a) . . . . . . . . . . . . . . . . . . . . 109,8885,513 Hanwha Corp. . . . . . . . . . . . . . . . . . . . . . . . . . . . . . . . 156,1394,188 Hyundai Engineering & Construction Co., Ltd. . . . . . 163,7461,003 Hyundai Glovis Co., Ltd. . . . . . . . . . . . . . . . . . . . . . . 167,1065,096 Hyundai Marine & Fire Insurance Co., Ltd. . . . . . . . . 110,410
441 Hyundai Mobis Co., Ltd. . . . . . . . . . . . . . . . . . . . . . . . 114,392562 Hyundai Motor Co. . . . . . . . . . . . . . . . . . . . . . . . . . . . 108,920
16,741 Industrial Bank of Korea . . . . . . . . . . . . . . . . . . . . . . . 135,609713 Kakao Corp. . . . . . . . . . . . . . . . . . . . . . . . . . . . . . . . . . 314,704
4,354 KB Financial Group, Inc. . . . . . . . . . . . . . . . . . . . . . . 214,5985,113 Kia Motors Corp. . . . . . . . . . . . . . . . . . . . . . . . . . . . . . 375,8274,064 Korea Gas Corp. (a) . . . . . . . . . . . . . . . . . . . . . . . . . . . 121,4191,180 Korea Investment Holdings Co., Ltd. . . . . . . . . . . . . . 89,651
467 Kumho Petrochemical Co., Ltd. . . . . . . . . . . . . . . . . . 109,471342 LG Chemical, Ltd. . . . . . . . . . . . . . . . . . . . . . . . . . . . . 244,743
2,269 LG Electronics, Inc. . . . . . . . . . . . . . . . . . . . . . . . . . . . 302,923236 LG Household & Health Care, Ltd. . . . . . . . . . . . . . . 327,480
15,796 LG Uplus Corp. . . . . . . . . . . . . . . . . . . . . . . . . . . . . . . 171,4003,233 Lotte Corp. . . . . . . . . . . . . . . . . . . . . . . . . . . . . . . . . . . 97,3781,482 Lotte Shopping Co., Ltd. . . . . . . . . . . . . . . . . . . . . . . . 165,764
46,426 Meritz Securities Co., Ltd. . . . . . . . . . . . . . . . . . . . . . 189,60811,298 Mirae Asset Daewoo Co., Ltd. . . . . . . . . . . . . . . . . . . 98,8321,116 Naver Corp. . . . . . . . . . . . . . . . . . . . . . . . . . . . . . . . . . 373,639
449 NCSoft Corp. . . . . . . . . . . . . . . . . . . . . . . . . . . . . . . . . 347,0529,686 NH Investment & Securities Co., Ltd. . . . . . . . . . . . . 100,1061,006 Orion Corp. . . . . . . . . . . . . . . . . . . . . . . . . . . . . . . . . . 116,682
681 Pearl Abyss Corp. (a) . . . . . . . . . . . . . . . . . . . . . . . . . 186,1861,183 POSCO . . . . . . . . . . . . . . . . . . . . . . . . . . . . . . . . . . . . 335,210
818 POSCO Chemical Co., Ltd. . . . . . . . . . . . . . . . . . . . . . 113,081721 Samsung Electro-Mechanics Co., Ltd. . . . . . . . . . . . . 120,347
51,401 Samsung Electronics Co., Ltd. . . . . . . . . . . . . . . . . . . 3,718,586463 Samsung SDI Co., Ltd. . . . . . . . . . . . . . . . . . . . . . . . . 272,254
2,897 Samsung Securities Co., Ltd. . . . . . . . . . . . . . . . . . . . 101,4091,777 Seegene, Inc. . . . . . . . . . . . . . . . . . . . . . . . . . . . . . . . . 204,7141,866 Shin Poong Pharmaceutical Co., Ltd. . . . . . . . . . . . . . 141,5827,430 Shinhan Financial Group Co., Ltd. . . . . . . . . . . . . . . . 246,765
529 Shinsegae, Inc. . . . . . . . . . . . . . . . . . . . . . . . . . . . . . . . 132,012453 SK Chemicals Co., Ltd. . . . . . . . . . . . . . . . . . . . . . . . . 100,767
5,371 SK Hynix, Inc. . . . . . . . . . . . . . . . . . . . . . . . . . . . . . . . 634,1103,601 Woongjin Coway Co., Ltd. . . . . . . . . . . . . . . . . . . . . . 209,213
12,323 Woori Financial Group Inc. . . . . . . . . . . . . . . . . . . . . . 109,991
13,888,598
Russian Federation - 2.58%4,630 LUKOIL PJSC - ADR . . . . . . . . . . . . . . . . . . . . . . . . . 374,0589,067 Magnit PJSC - ADR (d) . . . . . . . . . . . . . . . . . . . . . . . 135,9277,479 MMC Norilsk Nickel PJSC - ADR (b) . . . . . . . . . . . . 234,018
12,192 Mobile TeleSystems PJSC - ADR . . . . . . . . . . . . . . . . 101,6813,627 Novolipetsk Steel PJSC - GDR . . . . . . . . . . . . . . . . . . 115,5922,567 Polyus PJSC - GDR (d) . . . . . . . . . . . . . . . . . . . . . . . . 236,184
30,029 Sberbank of Russia PJSC - ADR . . . . . . . . . . . . . . . . 462,7479,904 Severstal PJSC - GDR (d) . . . . . . . . . . . . . . . . . . . . . . 199,776
36,200 Surgutneftegas OJSC - ADR . . . . . . . . . . . . . . . . . . . . 163,8054,243 Tatneft PJSC - ADR (b) . . . . . . . . . . . . . . . . . . . . . . . 198,7003,865 X5 Retail Group NV - GDR (d) . . . . . . . . . . . . . . . . . 124,5952,515 Yandex NV - Class A - ADR (a) . . . . . . . . . . . . . . . . . 161,111
2,508,194
Number ofShares Value
South Africa - 4.01%21,809 Absa Group, Ltd. . . . . . . . . . . . . . . . . . . . . . . . . . . . . . $ 186,3085,915 African Rainbow Minerals, Ltd. . . . . . . . . . . . . . . . . . 111,0931,408 Anglo American Platinum, Ltd. . . . . . . . . . . . . . . . . . 205,3515,801 AngloGold Ashanti, Ltd. . . . . . . . . . . . . . . . . . . . . . . . 126,270
20,362 Aspen Pharmacare Holdings, Ltd. (a) . . . . . . . . . . . . . 198,9607,292 Bid Corp., Ltd. (a) . . . . . . . . . . . . . . . . . . . . . . . . . . . . 141,3587,902 Clicks Group, Ltd. . . . . . . . . . . . . . . . . . . . . . . . . . . . . 128,702
50,165 FirstRand, Ltd. . . . . . . . . . . . . . . . . . . . . . . . . . . . . . . . 175,31217,627 Gold Fields, Ltd. . . . . . . . . . . . . . . . . . . . . . . . . . . . . . 165,67319,194 Impala Platinum Holdings, Ltd. . . . . . . . . . . . . . . . . . 354,3514,843 Kumba Iron Ore, Ltd. . . . . . . . . . . . . . . . . . . . . . . . . . 199,445
13,842 Mr. Price Group, Ltd. . . . . . . . . . . . . . . . . . . . . . . . . . 181,31019,943 MTN Group, Ltd. . . . . . . . . . . . . . . . . . . . . . . . . . . . . 117,13519,305 MultiChoice Group, Ltd. . . . . . . . . . . . . . . . . . . . . . . . 168,1212,263 Naspers, Ltd. - N Shares . . . . . . . . . . . . . . . . . . . . . . . 542,012
21,482 Nedbank Group, Ltd. . . . . . . . . . . . . . . . . . . . . . . . . . . 203,6597,473 Northam Platinum, Ltd. (a) . . . . . . . . . . . . . . . . . . . . . 129,8386,791 Sasol, Ltd. (a) . . . . . . . . . . . . . . . . . . . . . . . . . . . . . . . 98,126
27,370 Sibanye Stillwater, Ltd. . . . . . . . . . . . . . . . . . . . . . . . . 121,84617,604 Standard Bank Group, Ltd. . . . . . . . . . . . . . . . . . . . . . 149,45457,566 Woolworths Holdings, Ltd. (a) . . . . . . . . . . . . . . . . . . 192,811
3,897,135
Taiwan, Province of China - 14.97%28,514 Accton Technology Corp. . . . . . . . . . . . . . . . . . . . . . . 277,218
102,617 Acer, Inc. . . . . . . . . . . . . . . . . . . . . . . . . . . . . . . . . . . . 113,56220,761 Advantech Co., Ltd. . . . . . . . . . . . . . . . . . . . . . . . . . . 258,9783,175 ASMedia Technology, Inc. . . . . . . . . . . . . . . . . . . . . . 167,598
138,815 AU Optronics Corp. (a) . . . . . . . . . . . . . . . . . . . . . . . . 103,55869,121 Cathay Financial Holding Co., Ltd. . . . . . . . . . . . . . . . 116,39232,975 Chailease Holding Co., Ltd. . . . . . . . . . . . . . . . . . . . . 228,22643,026 Chicony Electronics Co., Ltd. . . . . . . . . . . . . . . . . . . . 153,589
191,655 China Life Insurance Co., Ltd. . . . . . . . . . . . . . . . . . . 173,196187,746 Compal Electronics, Inc. . . . . . . . . . . . . . . . . . . . . . . . 176,27619,794 Delta Electronics, Inc. - NVDR . . . . . . . . . . . . . . . . . . 201,87111,065 Eclat Textile Co., Ltd. . . . . . . . . . . . . . . . . . . . . . . . . . 186,489
161,701 Evergreen Marine Corp. Taiwan, Ltd. (a) . . . . . . . . . . 259,54498,235 Far Eastern New Century Corp. . . . . . . . . . . . . . . . . . 104,28836,956 Feng TAY Enterprise Co., Ltd. . . . . . . . . . . . . . . . . . . 253,241
103,394 Fubon Financial Holding Co., Ltd. . . . . . . . . . . . . . . . 206,3256,782 Globalwafers Co., Ltd. . . . . . . . . . . . . . . . . . . . . . . . . 179,805
127,951 Hon Hai Precision Industry Co., Ltd. . . . . . . . . . . . . . 561,285144,294 Innolux Corp. . . . . . . . . . . . . . . . . . . . . . . . . . . . . . . . . 107,687
1,054 Largan Precision Co., Ltd. . . . . . . . . . . . . . . . . . . . . . . 119,20856,679 Lite-On Technology Corp. . . . . . . . . . . . . . . . . . . . . . 125,69919,435 MediaTek, Inc. . . . . . . . . . . . . . . . . . . . . . . . . . . . . . . 668,50234,179 Micro-Star International Co., Ltd. . . . . . . . . . . . . . . . . 210,00910,617 Nan Ya Printed Circuit Board Corp. . . . . . . . . . . . . . . 132,76722,253 Nien Made Enterprise Co., Ltd. . . . . . . . . . . . . . . . . . . 311,17413,853 Novatek Microelectronics Corp. . . . . . . . . . . . . . . . . . 282,19024,045 Oneness Biotech Co., Ltd. (a) . . . . . . . . . . . . . . . . . . . 223,495
107,426 Pou Chen Corp. . . . . . . . . . . . . . . . . . . . . . . . . . . . . . . 124,68033,661 Powertech Technology, Inc. . . . . . . . . . . . . . . . . . . . . 124,94226,608 President Chain Store Corp. . . . . . . . . . . . . . . . . . . . . 254,45936,197 Quanta Computer, Inc. . . . . . . . . . . . . . . . . . . . . . . . . 124,84523,737 Realtek Semiconductor Corp. . . . . . . . . . . . . . . . . . . . 414,38060,655 Ruentex Development Co., Ltd. . . . . . . . . . . . . . . . . . 105,466
427,176 Shin Kong Financial Holding Co., Ltd. . . . . . . . . . . . . 137,37059,629 Synnex Technology International Corp. . . . . . . . . . . . 114,27333,743 Taiwan Mobile Co., Ltd. . . . . . . . . . . . . . . . . . . . . . . . 116,131
See notes to financial statements.
46

GuideMark® Emerging Markets FundSCHEDULE OF INVESTMENTS (Continued)March 31, 2021
Number ofShares Value
COMMON STOCKS (Continued)Taiwan, Province of China (Continued)
269,519 Taiwan Semiconductor Manufacturing Co., Ltd. . . . . $ 5,675,85834,512 Unimicron Technology Corp. . . . . . . . . . . . . . . . . . . . 111,578
138,249 Uni-President Enterprises Corp. . . . . . . . . . . . . . . . . . 355,012356,601 United Microelectronics Corp. . . . . . . . . . . . . . . . . . . 639,62132,634 Vanguard International Semiconductor Corp. . . . . . . . 124,4669,815 Win Semiconductors Corp. . . . . . . . . . . . . . . . . . . . . . 135,538
61,274 WPG Holdings, Ltd. . . . . . . . . . . . . . . . . . . . . . . . . . . 105,085
14,565,876
Thailand - 1.47%20,684 Advanced Info Service PCL - NVDR . . . . . . . . . . . . . 115,039
121,550 Charoen Pokphand Foods PCL - NVDR . . . . . . . . . . . 115,00461,152 CP ALL PCL - NVDR . . . . . . . . . . . . . . . . . . . . . . . . 135,67936,443 Delta Electronics Thailand PCL - NVDR . . . . . . . . . . 340,063
253,363 Home Product Center PCL - NVDR . . . . . . . . . . . . . . 120,38638,578 Krungthai Card PCL - NVDR . . . . . . . . . . . . . . . . . . . 97,83979,676 Muangthai Capital PCL - NVDR . . . . . . . . . . . . . . . . 180,726
125,548 Osotspa PCL - NVDR . . . . . . . . . . . . . . . . . . . . . . . . . 141,81968,680 Srisawad Corp. PCL - NVDR . . . . . . . . . . . . . . . . . . . 187,586
1,434,141
Turkey - 0.93%176,271 Akbank Turk AS . . . . . . . . . . . . . . . . . . . . . . . . . . . . . 100,59025,776 BIM Birlesik Magazalar AS . . . . . . . . . . . . . . . . . . . . 220,7743,603 Ford Otomotiv Sanayi AS . . . . . . . . . . . . . . . . . . . . . . 84,345
115,676 Haci Omer Sabanci Holding AS . . . . . . . . . . . . . . . . . 120,82431,107 KOC Holding AS . . . . . . . . . . . . . . . . . . . . . . . . . . . . 73,354
106,286 Turkiye Garanti Bankasi AS . . . . . . . . . . . . . . . . . . . . 86,163235,956 Turkiye Is Bankasi - Series C . . . . . . . . . . . . . . . . . . . 138,115315,645 Yapi ve Kredi Bankasi AS . . . . . . . . . . . . . . . . . . . . . 84,327
908,492
United Arab Emirates - 0.12%19,902 Emirates Telecommunications Group Co. PJSC . . . . . 117,251
Total Common Stocks(Cost $51,763,488) . . . . . . . . . . . . . . . . . . . . . . . . . . 83,288,384
INVESTMENT COMPANIES - 11.24%China - 9.36%
73,173 iShares Core MSCI Emerging Markets ETF . . . . . . . . 4,709,41499,416 KraneShares Bosera MSCI China ETF -
Class A (b) . . . . . . . . . . . . . . . . . . . . . . . . . . . . . . . . 4,398,164
9,107,578
Saudi Arabia - 1.88%50,796 iShares MSCI Saudi Arabia ETF (b) . . . . . . . . . . . . . . 1,825,100
Total Investment Companies(Cost $9,188,235) . . . . . . . . . . . . . . . . . . . . . . . . . . . 10,932,678
PREFERRED STOCKS - 2.27%Brazil - 1.09%
42,605 Banco Bradesco SA . . . . . . . . . . . . . . . . . . . . . . . . . . . 201,64656,982 Cia Energetica de Minas Gerais . . . . . . . . . . . . . . . . . 131,80987,760 Cia Paranaense de Energia - Series B . . . . . . . . . . . . . 111,32522,680 Gerdau SA . . . . . . . . . . . . . . . . . . . . . . . . . . . . . . . . . . 121,28547,999 Itau Unibanco Holding SA . . . . . . . . . . . . . . . . . . . . . 238,34758,108 Petroleo Brasileiro SA . . . . . . . . . . . . . . . . . . . . . . . . . 249,728
1,054,140
Chile - 0.11%2,030 Sociedad Quimica y Minera de Chile SA - Class B . . 108,248
Number ofShares Value
Republic of Korea - 1.07%285 LG Chem, Ltd. . . . . . . . . . . . . . . . . . . . . . . . . . . . . . . . $ 97,503393 LG Household & Health Care, Ltd. . . . . . . . . . . . . . . 238,185
10,895 Samsung Electronics Co., Ltd. . . . . . . . . . . . . . . . . . . 705,650
1,041,338
Total Preferred Stocks(Cost $1,459,595) . . . . . . . . . . . . . . . . . . . . . . . . . . . 2,203,726
RIGHTS - 0.00% (e)Chile - 0.00% (e)
378 Sociedad Quimica y Minera de Chile SA (a) . . . . . . . 1,512
Total Rights(Cost $0) . . . . . . . . . . . . . . . . . . . . . . . . . . . . . . . . . . 1,512
SHORT TERM INVESTMENTS - 0.70%Money Market Funds - 0.70%
684,992 DWS Government Money Market Series -Institutional SharesEffective Yield, 0.04% (c) . . . . . . . . . . . . . . . . . . . . 684,992
Total Short Term Investments(Cost $684,992) . . . . . . . . . . . . . . . . . . . . . . . . . . . . 684,992
Number ofUnits
INVESTMENTS PURCHASED WITH PROCEEDS FROMSECURITIES LENDING COLLATERAL - 4.77%
4,637,812 Mount Vernon Liquid Assets Portfolio, LLCEffective Yield, 0.11% (c) . . . . . . . . . . . . . . . . . . . . 4,637,812
Total Investments Purchased with Proceeds fromSecurities Lending Collateral(Cost $4,637,812) . . . . . . . . . . . . . . . . . . . . . . . . . . . 4,637,812
Total Investments(Cost $67,734,122) - 104.60% . . . . . . . . . . . . . . . . 101,749,104
Liabilities in Excess ofOther Assets - (4.60)% . . . . . . . . . . . . . . . . . . . . . . (4,853,241)
TOTAL NET ASSETS - 100.00% . . . . . . . . . . . . . . $ 96,895,863
Percentages are stated as a percent of net assets.(a) Non-income producing security.(b) All or portion of this security is on loan.(c) Seven-day yield as of March 31, 2021.(d) Regulation S securities, as defined under the Securities Act of 1933. Such
securities are treated as liquid according to the Fund’s liquidity guidelines.The value of these securities total $795,182, which represents 0.82% of totalnet assets.
(e) Less than 0.01%.
Glossary of TermsADR - American Depositary ReceiptGDR - Global Depositary ReceiptNVDR - Non-Voting Depositary Receipt
See notes to financial statements.
47

GuideMark® Emerging Markets FundSCHEDULE OF INVESTMENTS BY INDUSTRYMarch 31, 2021
COMMON STOCKSAir Freight & Logistics 0.17%Airlines 0.13%Auto Components 0.31%Automobiles 1.61%Banks 6.05%Beverages 0.55%Biotechnology 0.95%Capital Markets 1.09%Chemicals 0.91%Commercial Services & Supplies 0.21%Communications Equipment 0.41%Construction & Engineering 0.41%Construction Materials 1.29%Consumer Finance 0.58%Containers & Packaging 0.10%Diversified Consumer Services 0.19%Diversified Financial Services 0.88%Diversified Telecommunication Services 0.89%Electric Utilities 0.11%Electrical Equipment 0.48%Electronic Equipment, Instruments & Components 2.74%Entertainment 0.89%Food & Staples Retailing 2.37%Food Products 2.72%Gas Utilities 0.25%Health Care Equipment & Supplies 0.12%Health Care Providers & Services 0.67%Hotels, Restaurants & Leisure 0.52%Household Durables 0.97%Household Products 0.48%Independent Power and Renewable Electricity Producers 0.23%Industrial Conglomerates 0.60%Insurance 2.37%Interactive Media & Services 1.25%Internet & Direct Marketing Retail 7.64%IT Services 8.20%Life Sciences Tools & Services 0.59%Machinery 0.24%Marine 0.43%Media 1.00%Metals & Mining 5.47%Multiline Retail 1.17%Oil, Gas & Consumable Fuels 2.72%Paper & Forest Products 0.29%Personal Products 0.75%
Pharmaceuticals 2.48%Real Estate Management & Development 0.96%Semiconductors & Semiconductor Equipment 13.63%Software 0.87%Specialty Retail 0.82%Technology Hardware, Storage & Peripherals 1.64%Textiles, Apparel & Luxury Goods 1.46%Thrifts & Mortgage Finance 0.46%Transportation Infrastructure 0.09%Water Utilities 0.11%Wireless Telecommunication Services 1.10%
TOTAL COMMON STOCKS 85.62%
INVESTMENT COMPANIESExchange Traded Funds 11.24%
TOTAL INVESTMENT COMPANIES 11.24%
PREFERRED STOCKSBanks 0.45%Chemicals 0.21%Electric Utilities 0.25%Metals & Mining 0.12%Oil, Gas & Consumable Fuels 0.26%Personal Products 0.24%Semiconductors & Semiconductor Equipment 0.74%
TOTAL PREFERRED STOCKS 2.27%
RIGHTSChemicals 0.00%
TOTAL RIGHTS 0.00%
SHORT TERM INVESTMENTSMoney Market Funds 0.70%
TOTAL SHORT TERM INVESTMENTS 0.70%
INVESTMENTS PURCHASED WITH PROCEEDS FROMSECURITIES LENDING COLLATERAL
Private Investment Fund 4.77%
TOTAL INVESTMENTS PURCHASED WITH PROCEEDSFROM SECURITIES LENDING COLLATERAL 4.77%
TOTAL INVESTMENTS 104.60%Liabilities in Excess of Other Assets (4.60)%
TOTAL NET ASSETS 100.00%
Percentages are stated as a percent of net assets.
See notes to financial statements.
48
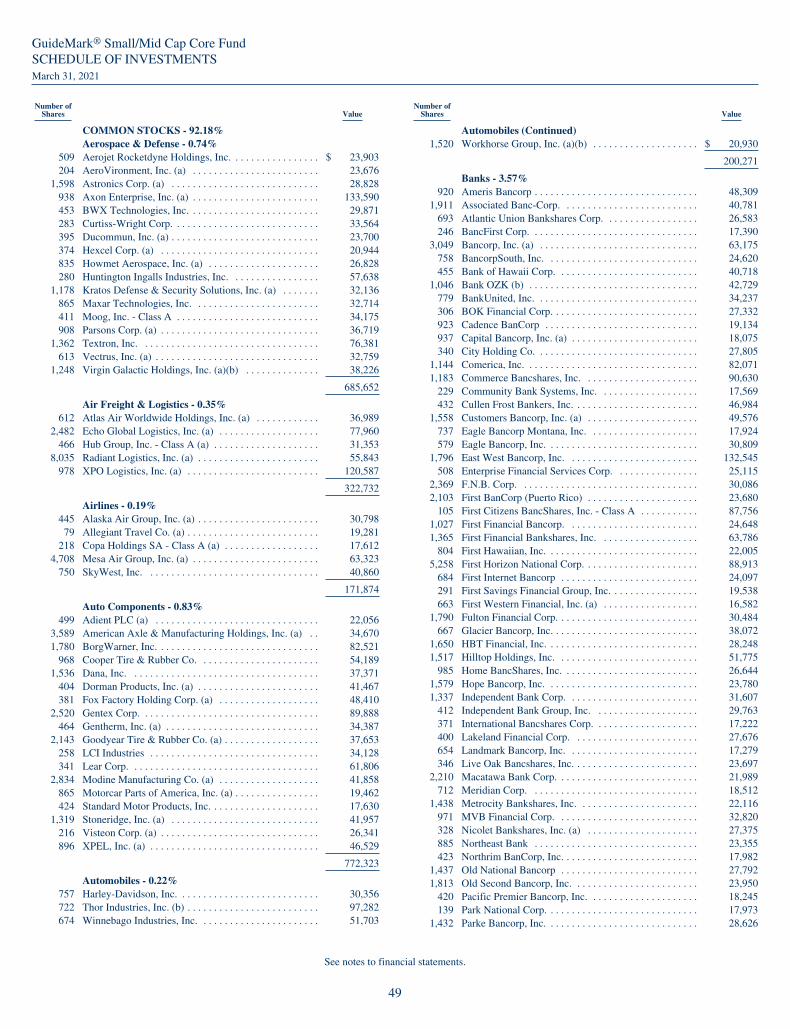
GuideMark® Small/Mid Cap Core FundSCHEDULE OF INVESTMENTSMarch 31, 2021
Number ofShares Value
COMMON STOCKS - 92.18%Aerospace & Defense - 0.74%
509 Aerojet Rocketdyne Holdings, Inc. . . . . . . . . . . . . . . . . $ 23,903204 AeroVironment, Inc. (a) . . . . . . . . . . . . . . . . . . . . . . . . 23,676
1,598 Astronics Corp. (a) . . . . . . . . . . . . . . . . . . . . . . . . . . . . 28,828938 Axon Enterprise, Inc. (a) . . . . . . . . . . . . . . . . . . . . . . . . 133,590453 BWX Technologies, Inc. . . . . . . . . . . . . . . . . . . . . . . . . 29,871283 Curtiss-Wright Corp. . . . . . . . . . . . . . . . . . . . . . . . . . . . 33,564395 Ducommun, Inc. (a) . . . . . . . . . . . . . . . . . . . . . . . . . . . . 23,700374 Hexcel Corp. (a) . . . . . . . . . . . . . . . . . . . . . . . . . . . . . . 20,944835 Howmet Aerospace, Inc. (a) . . . . . . . . . . . . . . . . . . . . . 26,828280 Huntington Ingalls Industries, Inc. . . . . . . . . . . . . . . . . 57,638
1,178 Kratos Defense & Security Solutions, Inc. (a) . . . . . . . 32,136865 Maxar Technologies, Inc. . . . . . . . . . . . . . . . . . . . . . . . 32,714411 Moog, Inc. - Class A . . . . . . . . . . . . . . . . . . . . . . . . . . . 34,175908 Parsons Corp. (a) . . . . . . . . . . . . . . . . . . . . . . . . . . . . . . 36,719
1,362 Textron, Inc. . . . . . . . . . . . . . . . . . . . . . . . . . . . . . . . . . 76,381613 Vectrus, Inc. (a) . . . . . . . . . . . . . . . . . . . . . . . . . . . . . . . 32,759
1,248 Virgin Galactic Holdings, Inc. (a)(b) . . . . . . . . . . . . . . 38,226
685,652
Air Freight & Logistics - 0.35%612 Atlas Air Worldwide Holdings, Inc. (a) . . . . . . . . . . . . 36,989
2,482 Echo Global Logistics, Inc. (a) . . . . . . . . . . . . . . . . . . . 77,960466 Hub Group, Inc. - Class A (a) . . . . . . . . . . . . . . . . . . . . 31,353
8,035 Radiant Logistics, Inc. (a) . . . . . . . . . . . . . . . . . . . . . . . 55,843978 XPO Logistics, Inc. (a) . . . . . . . . . . . . . . . . . . . . . . . . . 120,587
322,732
Airlines - 0.19%445 Alaska Air Group, Inc. (a) . . . . . . . . . . . . . . . . . . . . . . . 30,79879 Allegiant Travel Co. (a) . . . . . . . . . . . . . . . . . . . . . . . . . 19,281
218 Copa Holdings SA - Class A (a) . . . . . . . . . . . . . . . . . . 17,6124,708 Mesa Air Group, Inc. (a) . . . . . . . . . . . . . . . . . . . . . . . . 63,323
750 SkyWest, Inc. . . . . . . . . . . . . . . . . . . . . . . . . . . . . . . . . 40,860
171,874
Auto Components - 0.83%499 Adient PLC (a) . . . . . . . . . . . . . . . . . . . . . . . . . . . . . . . 22,056
3,589 American Axle & Manufacturing Holdings, Inc. (a) . . 34,6701,780 BorgWarner, Inc. . . . . . . . . . . . . . . . . . . . . . . . . . . . . . . 82,521
968 Cooper Tire & Rubber Co. . . . . . . . . . . . . . . . . . . . . . . 54,1891,536 Dana, Inc. . . . . . . . . . . . . . . . . . . . . . . . . . . . . . . . . . . . 37,371
404 Dorman Products, Inc. (a) . . . . . . . . . . . . . . . . . . . . . . . 41,467381 Fox Factory Holding Corp. (a) . . . . . . . . . . . . . . . . . . . 48,410
2,520 Gentex Corp. . . . . . . . . . . . . . . . . . . . . . . . . . . . . . . . . . 89,888464 Gentherm, Inc. (a) . . . . . . . . . . . . . . . . . . . . . . . . . . . . . 34,387
2,143 Goodyear Tire & Rubber Co. (a) . . . . . . . . . . . . . . . . . . 37,653258 LCI Industries . . . . . . . . . . . . . . . . . . . . . . . . . . . . . . . . 34,128341 Lear Corp. . . . . . . . . . . . . . . . . . . . . . . . . . . . . . . . . . . . 61,806
2,834 Modine Manufacturing Co. (a) . . . . . . . . . . . . . . . . . . . 41,858865 Motorcar Parts of America, Inc. (a) . . . . . . . . . . . . . . . . 19,462424 Standard Motor Products, Inc. . . . . . . . . . . . . . . . . . . . . 17,630
1,319 Stoneridge, Inc. (a) . . . . . . . . . . . . . . . . . . . . . . . . . . . . 41,957216 Visteon Corp. (a) . . . . . . . . . . . . . . . . . . . . . . . . . . . . . . 26,341896 XPEL, Inc. (a) . . . . . . . . . . . . . . . . . . . . . . . . . . . . . . . . 46,529
772,323
Automobiles - 0.22%757 Harley-Davidson, Inc. . . . . . . . . . . . . . . . . . . . . . . . . . . 30,356722 Thor Industries, Inc. (b) . . . . . . . . . . . . . . . . . . . . . . . . . 97,282674 Winnebago Industries, Inc. . . . . . . . . . . . . . . . . . . . . . . 51,703
Number ofShares Value
Automobiles (Continued)1,520 Workhorse Group, Inc. (a)(b) . . . . . . . . . . . . . . . . . . . . $ 20,930
200,271
Banks - 3.57%920 Ameris Bancorp . . . . . . . . . . . . . . . . . . . . . . . . . . . . . . . 48,309
1,911 Associated Banc-Corp. . . . . . . . . . . . . . . . . . . . . . . . . . 40,781693 Atlantic Union Bankshares Corp. . . . . . . . . . . . . . . . . . 26,583246 BancFirst Corp. . . . . . . . . . . . . . . . . . . . . . . . . . . . . . . . 17,390
3,049 Bancorp, Inc. (a) . . . . . . . . . . . . . . . . . . . . . . . . . . . . . . 63,175758 BancorpSouth, Inc. . . . . . . . . . . . . . . . . . . . . . . . . . . . . 24,620455 Bank of Hawaii Corp. . . . . . . . . . . . . . . . . . . . . . . . . . . 40,718
1,046 Bank OZK (b) . . . . . . . . . . . . . . . . . . . . . . . . . . . . . . . . 42,729779 BankUnited, Inc. . . . . . . . . . . . . . . . . . . . . . . . . . . . . . . 34,237306 BOK Financial Corp. . . . . . . . . . . . . . . . . . . . . . . . . . . . 27,332923 Cadence BanCorp . . . . . . . . . . . . . . . . . . . . . . . . . . . . . 19,134937 Capital Bancorp, Inc. (a) . . . . . . . . . . . . . . . . . . . . . . . . 18,075340 City Holding Co. . . . . . . . . . . . . . . . . . . . . . . . . . . . . . . 27,805
1,144 Comerica, Inc. . . . . . . . . . . . . . . . . . . . . . . . . . . . . . . . . 82,0711,183 Commerce Bancshares, Inc. . . . . . . . . . . . . . . . . . . . . . 90,630
229 Community Bank Systems, Inc. . . . . . . . . . . . . . . . . . . 17,569432 Cullen Frost Bankers, Inc. . . . . . . . . . . . . . . . . . . . . . . . 46,984
1,558 Customers Bancorp, Inc. (a) . . . . . . . . . . . . . . . . . . . . . 49,576737 Eagle Bancorp Montana, Inc. . . . . . . . . . . . . . . . . . . . . 17,924579 Eagle Bancorp, Inc. . . . . . . . . . . . . . . . . . . . . . . . . . . . . 30,809
1,796 East West Bancorp, Inc. . . . . . . . . . . . . . . . . . . . . . . . . 132,545508 Enterprise Financial Services Corp. . . . . . . . . . . . . . . . 25,115
2,369 F.N.B. Corp. . . . . . . . . . . . . . . . . . . . . . . . . . . . . . . . . . 30,0862,103 First BanCorp (Puerto Rico) . . . . . . . . . . . . . . . . . . . . . 23,680
105 First Citizens BancShares, Inc. - Class A . . . . . . . . . . . 87,7561,027 First Financial Bancorp. . . . . . . . . . . . . . . . . . . . . . . . . 24,6481,365 First Financial Bankshares, Inc. . . . . . . . . . . . . . . . . . . 63,786
804 First Hawaiian, Inc. . . . . . . . . . . . . . . . . . . . . . . . . . . . . 22,0055,258 First Horizon National Corp. . . . . . . . . . . . . . . . . . . . . . 88,913
684 First Internet Bancorp . . . . . . . . . . . . . . . . . . . . . . . . . . 24,097291 First Savings Financial Group, Inc. . . . . . . . . . . . . . . . . 19,538663 First Western Financial, Inc. (a) . . . . . . . . . . . . . . . . . . 16,582
1,790 Fulton Financial Corp. . . . . . . . . . . . . . . . . . . . . . . . . . . 30,484667 Glacier Bancorp, Inc. . . . . . . . . . . . . . . . . . . . . . . . . . . . 38,072
1,650 HBT Financial, Inc. . . . . . . . . . . . . . . . . . . . . . . . . . . . . 28,2481,517 Hilltop Holdings, Inc. . . . . . . . . . . . . . . . . . . . . . . . . . . 51,775
985 Home BancShares, Inc. . . . . . . . . . . . . . . . . . . . . . . . . . 26,6441,579 Hope Bancorp, Inc. . . . . . . . . . . . . . . . . . . . . . . . . . . . . 23,7801,337 Independent Bank Corp. . . . . . . . . . . . . . . . . . . . . . . . . 31,607
412 Independent Bank Group, Inc. . . . . . . . . . . . . . . . . . . . 29,763371 International Bancshares Corp. . . . . . . . . . . . . . . . . . . . 17,222400 Lakeland Financial Corp. . . . . . . . . . . . . . . . . . . . . . . . 27,676654 Landmark Bancorp, Inc. . . . . . . . . . . . . . . . . . . . . . . . . 17,279346 Live Oak Bancshares, Inc. . . . . . . . . . . . . . . . . . . . . . . . 23,697
2,210 Macatawa Bank Corp. . . . . . . . . . . . . . . . . . . . . . . . . . . 21,989712 Meridian Corp. . . . . . . . . . . . . . . . . . . . . . . . . . . . . . . . 18,512
1,438 Metrocity Bankshares, Inc. . . . . . . . . . . . . . . . . . . . . . . 22,116971 MVB Financial Corp. . . . . . . . . . . . . . . . . . . . . . . . . . . 32,820328 Nicolet Bankshares, Inc. (a) . . . . . . . . . . . . . . . . . . . . . 27,375885 Northeast Bank . . . . . . . . . . . . . . . . . . . . . . . . . . . . . . . 23,355423 Northrim BanCorp, Inc. . . . . . . . . . . . . . . . . . . . . . . . . . 17,982
1,437 Old National Bancorp . . . . . . . . . . . . . . . . . . . . . . . . . . 27,7921,813 Old Second Bancorp, Inc. . . . . . . . . . . . . . . . . . . . . . . . 23,950
420 Pacific Premier Bancorp, Inc. . . . . . . . . . . . . . . . . . . . . 18,245139 Park National Corp. . . . . . . . . . . . . . . . . . . . . . . . . . . . . 17,973
1,432 Parke Bancorp, Inc. . . . . . . . . . . . . . . . . . . . . . . . . . . . . 28,626
See notes to financial statements.
49

GuideMark® Small/Mid Cap Core FundSCHEDULE OF INVESTMENTS (Continued)March 31, 2021
Number ofShares Value
COMMON STOCKS (Continued)Banks (Continued)
503 Pinnacle Financial Partners, Inc. . . . . . . . . . . . . . . . . . . $ 44,596607 Plumas Bancorp . . . . . . . . . . . . . . . . . . . . . . . . . . . . . . . 17,755
1,178 Popular, Inc. . . . . . . . . . . . . . . . . . . . . . . . . . . . . . . . . . 82,837551 Preferred Bank . . . . . . . . . . . . . . . . . . . . . . . . . . . . . . . . 35,088700 Prosperity Bancshares, Inc. . . . . . . . . . . . . . . . . . . . . . . 52,423452 Sandy Spring Bancorp, Inc. . . . . . . . . . . . . . . . . . . . . . . 19,630838 ServisFirst Bancshares, Inc. . . . . . . . . . . . . . . . . . . . . . 51,394
1,465 Shore Bancshares, Inc. . . . . . . . . . . . . . . . . . . . . . . . . . 24,934634 Signature Bank . . . . . . . . . . . . . . . . . . . . . . . . . . . . . . . 143,347307 Silvergate Capital Corp. - Class A (a) . . . . . . . . . . . . . . 43,646919 Simmons First National Corp. - Class A . . . . . . . . . . . . 27,267
1,393 Sterling Bancorp . . . . . . . . . . . . . . . . . . . . . . . . . . . . . . 32,067558 Stock Yards Bancorp, Inc. . . . . . . . . . . . . . . . . . . . . . . . 28,491
2,082 Synovus Financial Corp. . . . . . . . . . . . . . . . . . . . . . . . . 95,251649 TCF Financial Corp. . . . . . . . . . . . . . . . . . . . . . . . . . . . 30,153496 Texas Capital Bancshares, Inc. (a) . . . . . . . . . . . . . . . . 35,176
1,000 The Bank of N.T. Butterfield & Son, Ltd. . . . . . . . . . . . 38,2201,271 TriState Capital Holdings, Inc. (a) . . . . . . . . . . . . . . . . 29,309
234 Triumph Bancorp, Inc. (a) . . . . . . . . . . . . . . . . . . . . . . . 18,109342 UMB Financial Corp. . . . . . . . . . . . . . . . . . . . . . . . . . . 31,577
1,263 Unity Bancorp, Inc. . . . . . . . . . . . . . . . . . . . . . . . . . . . . 27,7863,562 Valley National Bancorp . . . . . . . . . . . . . . . . . . . . . . . . 48,942
527 Washington Trust Bancorp, Inc. . . . . . . . . . . . . . . . . . . 27,209976 Webster Financial Corp. . . . . . . . . . . . . . . . . . . . . . . . . 53,787548 WesBanco, Inc. (b) . . . . . . . . . . . . . . . . . . . . . . . . . . . . 19,761901 West Bancorporation, Inc. . . . . . . . . . . . . . . . . . . . . . . . 21,705
1,599 Western Alliance Bancorp . . . . . . . . . . . . . . . . . . . . . . . 151,010737 Wintrust Financial Corp. . . . . . . . . . . . . . . . . . . . . . . . . 55,865
1,363 Zions Bancorporation . . . . . . . . . . . . . . . . . . . . . . . . . . 74,910
3,314,429
Beverages - 0.58%171 Boston Beer Co., Inc. - Class A (a) . . . . . . . . . . . . . . . . 206,274
2,211 Celsius Holdings, Inc. (a) . . . . . . . . . . . . . . . . . . . . . . . 106,238197 Coca-Cola Consolidated, Inc. . . . . . . . . . . . . . . . . . . . . 56,890316 MGP Ingredients, Inc. . . . . . . . . . . . . . . . . . . . . . . . . . . 18,691
1,104 National Beverage Corp. . . . . . . . . . . . . . . . . . . . . . . . . 53,99712,037 NewAge, Inc. (a) . . . . . . . . . . . . . . . . . . . . . . . . . . . . . . 34,4263,800 Primo Water Corp. . . . . . . . . . . . . . . . . . . . . . . . . . . . . . 61,788
538,304
Biotechnology - 4.51%1,553 ACADIA Pharmaceuticals, Inc. (a) . . . . . . . . . . . . . . . . 40,067
317 Acceleron Pharma, Inc. (a) . . . . . . . . . . . . . . . . . . . . . . 42,9884,854 Achillion Pharmaceuticals, Inc. (a)(c)(d)(f) . . . . . . . . . 2,2331,181 Aduro Biotech, Inc. (a)(c)(d)(f) . . . . . . . . . . . . . . . . . . . —4,880 Affimed NV (a) . . . . . . . . . . . . . . . . . . . . . . . . . . . . . . . 38,601
561 Agios Pharmaceuticals, Inc. (a) . . . . . . . . . . . . . . . . . . . 28,9707,738 Akebia Therapeutics, Inc. (a) . . . . . . . . . . . . . . . . . . . . 26,1932,352 Alkermes PLC (a) . . . . . . . . . . . . . . . . . . . . . . . . . . . . . 43,935
203 Allakos, Inc. (a) . . . . . . . . . . . . . . . . . . . . . . . . . . . . . . . 23,3001,911 Amicus Therapeutics, Inc. (a) . . . . . . . . . . . . . . . . . . . . 18,8812,672 Anavex Life Sciences Corp. (a) . . . . . . . . . . . . . . . . . . . 39,946
511 Apellis Pharmaceuticals, Inc. (a) . . . . . . . . . . . . . . . . . . 21,927445 Arcturus Therapeutics Holdings, Inc. (a)(b) . . . . . . . . . 18,378
1,167 Arcus Biosciences, Inc. (a) . . . . . . . . . . . . . . . . . . . . . . 32,769672 Arena Pharmaceuticals, Inc. (a) . . . . . . . . . . . . . . . . . . . 46,630697 Arrowhead Pharmaceuticals, Inc. (a) . . . . . . . . . . . . . . 46,218
2,170 Avid Bioservices, Inc. (a) . . . . . . . . . . . . . . . . . . . . . . . 39,559299 Beam Therapeutics, Inc. (a)(b) . . . . . . . . . . . . . . . . . . . 23,932
Number ofShares Value
Biotechnology (Continued)4,465 BioCryst Pharmaceuticals, Inc. (a) . . . . . . . . . . . . . . . . $ 45,409
311 Biohaven Pharmaceutical Holding Co., Ltd. (a)(b) . . . . 21,257655 Blueprint Medicines Corp. (a) . . . . . . . . . . . . . . . . . . . . 63,686
4,802 BrainStorm Cell Therapeutics, Inc. (a) . . . . . . . . . . . . . 18,392883 Bridgebio Pharma, Inc. (a)(b) . . . . . . . . . . . . . . . . . . . . 54,393620 CareDx, Inc. (a) . . . . . . . . . . . . . . . . . . . . . . . . . . . . . . . 42,216994 Cassava Sciences, Inc. (a)(b) . . . . . . . . . . . . . . . . . . . . . 44,680531 Castle Biosciences, Inc. (a) . . . . . . . . . . . . . . . . . . . . . . 36,352
16,439 Catalyst Pharmaceuticals, Inc. (a) . . . . . . . . . . . . . . . . . 75,7841,436 CEL-SCI Corp. (a)(b) . . . . . . . . . . . . . . . . . . . . . . . . . . 21,842
374 ChemoCentryx, Inc. (a) . . . . . . . . . . . . . . . . . . . . . . . . . 19,1642,064 Chimerix, Inc. (a) . . . . . . . . . . . . . . . . . . . . . . . . . . . . . 19,8972,622 Coherus Biosciences, Inc. (a) . . . . . . . . . . . . . . . . . . . . 38,307
874 Cytokinetics, Inc. (a) . . . . . . . . . . . . . . . . . . . . . . . . . . . 20,329701 Denali Therapeutics, Inc. (a)(b) . . . . . . . . . . . . . . . . . . . 40,027815 DermTech, Inc. (a)(b) . . . . . . . . . . . . . . . . . . . . . . . . . . 41,394
1,812 Dicerna Pharmaceuticals, Inc. (a) . . . . . . . . . . . . . . . . . 46,3331,526 Eagle Pharmaceuticals, Inc. (a) . . . . . . . . . . . . . . . . . . . 63,695
445 Editas Medicine, Inc. (a)(b) . . . . . . . . . . . . . . . . . . . . . . 18,6901,097 Emergent BioSolutions, Inc. (a) . . . . . . . . . . . . . . . . . . 101,9226,253 Exelixis, Inc. (a) . . . . . . . . . . . . . . . . . . . . . . . . . . . . . . 141,255
451 Fate Therapeutics, Inc. (a) . . . . . . . . . . . . . . . . . . . . . . . 37,185520 Five Prime Therapeutics, Inc. (a) . . . . . . . . . . . . . . . . . 19,588
4,893 Fortress Biotech, Inc. (a) . . . . . . . . . . . . . . . . . . . . . . . . 17,2721,156 Halozyme Therapeutics, Inc. (a) . . . . . . . . . . . . . . . . . . 48,1942,876 Ideaya Biosciences, Inc. (a) . . . . . . . . . . . . . . . . . . . . . . 67,5861,372 ImmunityBio, Inc. (a)(b) . . . . . . . . . . . . . . . . . . . . . . . . 32,5714,239 ImmunoGen, Inc. (a) . . . . . . . . . . . . . . . . . . . . . . . . . . . 34,3361,153 Immunovant, Inc. (a) . . . . . . . . . . . . . . . . . . . . . . . . . . . 18,4942,823 Inovio Pharmaceuticals, Inc. (a)(b) . . . . . . . . . . . . . . . . 26,197
756 Insmed, Inc. (a) . . . . . . . . . . . . . . . . . . . . . . . . . . . . . . . 25,749627 Intellia Therapeutics, Inc. (a) . . . . . . . . . . . . . . . . . . . . . 50,320965 Invitae Corp. (a)(b) . . . . . . . . . . . . . . . . . . . . . . . . . . . . 36,873399 Ionis Pharmaceuticals, Inc. (a) . . . . . . . . . . . . . . . . . . . 17,939852 Iovance Biotherapeutics, Inc. (a)(b) . . . . . . . . . . . . . . . 26,974
4,300 Ironwood Pharmaceuticals, Inc. - Class A (a) . . . . . . . . 48,074204 Karuna Therapeutics, Inc. (a) . . . . . . . . . . . . . . . . . . . . 24,527307 Keros Therapeutics, Inc. (a) . . . . . . . . . . . . . . . . . . . . . 18,896330 Kodiak Sciences, Inc. (a) . . . . . . . . . . . . . . . . . . . . . . . . 37,419255 Krystal Biotech, Inc. (a) . . . . . . . . . . . . . . . . . . . . . . . . 19,645826 Kura Oncology, Inc. (a) . . . . . . . . . . . . . . . . . . . . . . . . . 23,351
7,439 MannKind Corp. (a) . . . . . . . . . . . . . . . . . . . . . . . . . . . 29,161382 Mirati Therapeutics, Inc. (a) . . . . . . . . . . . . . . . . . . . . . 65,437299 Morphic Holding, Inc. (a) . . . . . . . . . . . . . . . . . . . . . . . 18,921
1,419 Myriad Genetics, Inc. (a) . . . . . . . . . . . . . . . . . . . . . . . . 43,209805 Natera, Inc. (a)(b) . . . . . . . . . . . . . . . . . . . . . . . . . . . . . 81,740832 Neurocrine Biosciences, Inc. (a) . . . . . . . . . . . . . . . . . . 80,912602 NGM Biopharmaceuticals, Inc. (a) . . . . . . . . . . . . . . . . 17,500407 Novavax, Inc. (a)(b) . . . . . . . . . . . . . . . . . . . . . . . . . . . 73,793
4,189 Oncocyte Corp. (a) . . . . . . . . . . . . . . . . . . . . . . . . . . . . 21,7416,633 OPKO Health, Inc. (a) . . . . . . . . . . . . . . . . . . . . . . . . . . 28,4562,715 Organogenesis Holdings, Inc. (a) . . . . . . . . . . . . . . . . . 49,467
738 Protagonist Therapeutics, Inc. (a) . . . . . . . . . . . . . . . . . 19,114491 PTC Therapeutics, Inc. (a) . . . . . . . . . . . . . . . . . . . . . . . 23,249
7,223 Puma Biotechnology, Inc. (a)(b) . . . . . . . . . . . . . . . . . . 70,2082,675 Radius Health, Inc. (a) . . . . . . . . . . . . . . . . . . . . . . . . . . 55,800
379 Repligen Corp. (a) . . . . . . . . . . . . . . . . . . . . . . . . . . . . . 73,681808 Replimune Group, Inc. (a) . . . . . . . . . . . . . . . . . . . . . . . 24,652610 Rocket Pharmaceuticals, Inc. (a) . . . . . . . . . . . . . . . . . . 27,066
1,150 Sage Therapeutics, Inc. (a) . . . . . . . . . . . . . . . . . . . . . . 86,078
See notes to financial statements.
50

GuideMark® Small/Mid Cap Core FundSCHEDULE OF INVESTMENTS (Continued)March 31, 2021
Number ofShares Value
COMMON STOCKS (Continued)Biotechnology (Continued)
2,070 Sangamo Therapeutics, Inc. (a) . . . . . . . . . . . . . . . . . . . $ 25,937590 Sarepta Therapeutics, Inc. (a) . . . . . . . . . . . . . . . . . . . . 43,973348 Scholar Rock Holding Corp. (a) . . . . . . . . . . . . . . . . . . 17,630
7,262 Selecta Biosciences, Inc. (a) . . . . . . . . . . . . . . . . . . . . . 32,861904 Seres Therapeutics, Inc. (a) . . . . . . . . . . . . . . . . . . . . . . 18,613
2,671 Sorrento Therapeutics, Inc. (a) . . . . . . . . . . . . . . . . . . . 22,089339 SpringWorks Therapeutics, Inc. (a) . . . . . . . . . . . . . . . . 24,940
6,964 Stereotaxis, Inc. (a) . . . . . . . . . . . . . . . . . . . . . . . . . . . . 46,798454 Stoke Therapeutics, Inc. (a) . . . . . . . . . . . . . . . . . . . . . . 17,633871 Syndax Pharmaceuticals, Inc. (a) . . . . . . . . . . . . . . . . . 19,476869 TCR2 Therapeutics, Inc. (a) . . . . . . . . . . . . . . . . . . . . . 19,188
1,046 TG Therapeutics, Inc. (a) . . . . . . . . . . . . . . . . . . . . . . . . 50,4172,725 Translate Bio, Inc. (a)(b) . . . . . . . . . . . . . . . . . . . . . . . . 44,9351,087 Travere Therapeutics, Inc. (a) . . . . . . . . . . . . . . . . . . . . 27,142
231 Turning Point Therapeutics, Inc. (a) . . . . . . . . . . . . . . . 21,850316 Twist Bioscience Corp. (a) . . . . . . . . . . . . . . . . . . . . . . 39,140423 Ultragenyx Pharmaceutical, Inc. (a) . . . . . . . . . . . . . . . 48,163
1,170 United Therapeutics Corp. (a) . . . . . . . . . . . . . . . . . . . . 195,7062,876 UNITY Biotechnology, Inc. (a) . . . . . . . . . . . . . . . . . . 17,2566,125 Vanda Pharmaceuticals, Inc. (a) . . . . . . . . . . . . . . . . . . 91,9983,910 Vaxart, Inc. (a)(b) . . . . . . . . . . . . . . . . . . . . . . . . . . . . . 23,6566,795 VBI Vaccines, Inc. (a) . . . . . . . . . . . . . . . . . . . . . . . . . . 21,132
840 Veracyte, Inc. (a) . . . . . . . . . . . . . . . . . . . . . . . . . . . . . . 45,1502,767 Vericel Corp. (a)(b) . . . . . . . . . . . . . . . . . . . . . . . . . . . . 153,707
832 Vir Biotechnology, Inc. (a) . . . . . . . . . . . . . . . . . . . . . . 42,6571,277 XBiotech, Inc. (a) . . . . . . . . . . . . . . . . . . . . . . . . . . . . . 21,926
460 Xencor, Inc. (a) . . . . . . . . . . . . . . . . . . . . . . . . . . . . . . . 19,808
4,184,707
Building Products - 1.98%1,860 A. O. Smith Corp. - Class A . . . . . . . . . . . . . . . . . . . . . 125,755
727 AAON, Inc. . . . . . . . . . . . . . . . . . . . . . . . . . . . . . . . . . . 50,897599 Advanced Drainage Systems, Inc. . . . . . . . . . . . . . . . . . 61,931782 Allegion PLC . . . . . . . . . . . . . . . . . . . . . . . . . . . . . . . . . 98,235
4,158 Alpha Pro Tech, Ltd. (a)(b) . . . . . . . . . . . . . . . . . . . . . . 40,582363 American Woodmark Corp. (a) . . . . . . . . . . . . . . . . . . . 35,785897 Apogee Enterprises, Inc. . . . . . . . . . . . . . . . . . . . . . . . . 36,669199 Armstrong World Industries, Inc. . . . . . . . . . . . . . . . . . 17,928
3,987 Builders FirstSource, Inc. (a) . . . . . . . . . . . . . . . . . . . . . 184,8771,959 Caesarstone, Ltd. . . . . . . . . . . . . . . . . . . . . . . . . . . . . . . 26,8972,905 Cornerstone Building Brands, Inc. (a) . . . . . . . . . . . . . . 40,757
224 CSW Industrials, Inc. . . . . . . . . . . . . . . . . . . . . . . . . . . 30,2401,905 Fortune Brands Home & Security, Inc. . . . . . . . . . . . . . 182,5371,017 Griffon Corp. . . . . . . . . . . . . . . . . . . . . . . . . . . . . . . . . . 27,632
765 Insteel Industries, Inc. . . . . . . . . . . . . . . . . . . . . . . . . . . 23,5931,681 JELD-WEN Holding, Inc. (a) . . . . . . . . . . . . . . . . . . . . 46,547
443 Lennox International, Inc. (b) . . . . . . . . . . . . . . . . . . . . 138,034353 Masonite International Corp. (a) . . . . . . . . . . . . . . . . . . 40,680
1,261 Owens Corning, Inc. . . . . . . . . . . . . . . . . . . . . . . . . . . . 116,125485 Patrick Industries, Inc. . . . . . . . . . . . . . . . . . . . . . . . . . . 41,225
1,608 PGT Innovations, Inc. (a) . . . . . . . . . . . . . . . . . . . . . . . 40,6021,328 Quanex Building Products Corp. . . . . . . . . . . . . . . . . . . 34,8331,857 Resideo Technologies, Inc. (a) . . . . . . . . . . . . . . . . . . . 52,460
749 Simpson Manufacturing Co., Inc. . . . . . . . . . . . . . . . . . 77,6941,851 Trex Co., Inc. (a)(b) . . . . . . . . . . . . . . . . . . . . . . . . . . . . 169,4411,254 UFP Industries, Inc. . . . . . . . . . . . . . . . . . . . . . . . . . . . . 95,103
1,837,059
Capital Markets - 2.41%287 Affiliated Managers Group, Inc. . . . . . . . . . . . . . . . . . . 42,772
Number ofShares Value
Capital Markets (Continued)1,462 Ares Management Corp. - Class A . . . . . . . . . . . . . . . . $ 81,9161,629 Artisan Partners Asset Management, Inc. - Class A . . . 84,9851,168 B. Riley Financial, Inc. . . . . . . . . . . . . . . . . . . . . . . . . . 65,8524,399 Brightsphere Investment Group, Inc. . . . . . . . . . . . . . . 89,652
733 Cohen & Steers, Inc. . . . . . . . . . . . . . . . . . . . . . . . . . . . 47,8872,109 Cowen Group, Inc. - Class A . . . . . . . . . . . . . . . . . . . . 74,131
214 Diamond Hill Investment Group, Inc. . . . . . . . . . . . . . . 33,3861,614 Donnelley Financial Solutions, Inc. (a) . . . . . . . . . . . . . 44,918
762 Evercore, Inc. - Class A . . . . . . . . . . . . . . . . . . . . . . . . . 100,386351 FactSet Research Systems, Inc. . . . . . . . . . . . . . . . . . . . 108,315
1,946 Federated Investors, Inc. - Class B . . . . . . . . . . . . . . . . 60,910681 Focus Financial Partners, Inc. - Class A (a) . . . . . . . . . 28,343
2,298 GAMCO Investors, Inc. - Class A . . . . . . . . . . . . . . . . 42,6281,677 Greenhill & Co., Inc. . . . . . . . . . . . . . . . . . . . . . . . . . . . 27,637
733 Hamilton Lane, Inc. - Class A . . . . . . . . . . . . . . . . . . . . 64,914748 Houlihan Lokey, Inc. . . . . . . . . . . . . . . . . . . . . . . . . . . . 49,749
3,479 Invesco, Ltd. . . . . . . . . . . . . . . . . . . . . . . . . . . . . . . . . . 87,7401,871 Lazard, Ltd. - Class A . . . . . . . . . . . . . . . . . . . . . . . . . . 81,4071,383 LPL Financial Holdings, Inc. . . . . . . . . . . . . . . . . . . . . 196,6071,150 Moelis & Co. - Class A . . . . . . . . . . . . . . . . . . . . . . . . . 63,112
478 Morningstar, Inc. . . . . . . . . . . . . . . . . . . . . . . . . . . . . . . 107,569705 Oppenheimer Holdings, Inc. - Class A . . . . . . . . . . . . . 28,235324 Piper Jaffray Cos. . . . . . . . . . . . . . . . . . . . . . . . . . . . . . 35,527874 PJT Partners, Inc. - Class A . . . . . . . . . . . . . . . . . . . . . . 59,126
3,100 Pzena Investment Management, Inc. - Class A . . . . . . . 32,6431,551 SEI Investments Co. . . . . . . . . . . . . . . . . . . . . . . . . . . . 94,5021,765 Silvercrest Asset Management Group, Inc. -
Class A . . . . . . . . . . . . . . . . . . . . . . . . . . . . . . . . . . . . 25,3811,148 StepStone Group, Inc. - Class A . . . . . . . . . . . . . . . . . . 40,4901,617 Stifel Financial Corp. . . . . . . . . . . . . . . . . . . . . . . . . . . . 103,585
655 StoneX Group, Inc. (a) . . . . . . . . . . . . . . . . . . . . . . . . . 42,824623 The Carlyle Group Inc . . . . . . . . . . . . . . . . . . . . . . . . . . 22,901
2,138 Virtu Financial, Inc. - Class A . . . . . . . . . . . . . . . . . . . . 66,385241 Virtus Investment Partners, Inc. . . . . . . . . . . . . . . . . . . 56,756
1,577 Waddell & Reed Financial, Inc. - Class A . . . . . . . . . . 39,504
2,232,675
Chemicals - 1.70%4,602 Advanced Emissions Solutions, Inc. (a) . . . . . . . . . . . . 25,311
690 AdvanSix, Inc. (a) . . . . . . . . . . . . . . . . . . . . . . . . . . . . . 18,506602 Albemarle Corp. . . . . . . . . . . . . . . . . . . . . . . . . . . . . . . 87,958358 Ashland Global Holdings, Inc. . . . . . . . . . . . . . . . . . . . 31,780799 Avient Corp. . . . . . . . . . . . . . . . . . . . . . . . . . . . . . . . . . 37,769
1,344 Axalta Coating Systems, Ltd. (a) . . . . . . . . . . . . . . . . . 39,756373 Cabot Corp. . . . . . . . . . . . . . . . . . . . . . . . . . . . . . . . . . . 19,560
1,971 CF Industries Holdings, Inc. . . . . . . . . . . . . . . . . . . . . . 89,444222 Chase Corp. . . . . . . . . . . . . . . . . . . . . . . . . . . . . . . . . . . 25,839
2,064 Element Solutions, Inc. . . . . . . . . . . . . . . . . . . . . . . . . . 37,7511,455 FutureFuel Corp. . . . . . . . . . . . . . . . . . . . . . . . . . . . . . . 21,141
431 H.B. Fuller Co. . . . . . . . . . . . . . . . . . . . . . . . . . . . . . . . 27,114948 Hawkins, Inc. . . . . . . . . . . . . . . . . . . . . . . . . . . . . . . . . . 31,777641 Huntsman Corp. . . . . . . . . . . . . . . . . . . . . . . . . . . . . . . . 18,480304 Ingevity Corp. (a) . . . . . . . . . . . . . . . . . . . . . . . . . . . . . 22,961223 Innospec, Inc. . . . . . . . . . . . . . . . . . . . . . . . . . . . . . . . . 22,900
1,373 Intrepid Potash, Inc. (a) . . . . . . . . . . . . . . . . . . . . . . . . . 44,7051,084 Koppers Holdings, Inc. (a) . . . . . . . . . . . . . . . . . . . . . . 37,6801,489 Kraton Corp. (a) . . . . . . . . . . . . . . . . . . . . . . . . . . . . . . 54,4822,242 Livent Corp. (a) . . . . . . . . . . . . . . . . . . . . . . . . . . . . . . . 38,831
304 Minerals Technologies, Inc. . . . . . . . . . . . . . . . . . . . . . 22,89781 NewMarket Corp. . . . . . . . . . . . . . . . . . . . . . . . . . . . . . 30,793
See notes to financial statements.
51

GuideMark® Small/Mid Cap Core FundSCHEDULE OF INVESTMENTS (Continued)March 31, 2021
Number ofShares Value
COMMON STOCKS (Continued)Chemicals (Continued)
1,503 Olin Corp. . . . . . . . . . . . . . . . . . . . . . . . . . . . . . . . . . . . $ 57,069911 Orion Engineered Carbons SA (a) . . . . . . . . . . . . . . . . . 17,965
1,415 PQ Group Holdings, Inc. . . . . . . . . . . . . . . . . . . . . . . . . 23,630119 Quaker Chemical Corp. . . . . . . . . . . . . . . . . . . . . . . . . . 29,009
3,015 Rayonier Advanced Materials, Inc. (a) . . . . . . . . . . . . . 27,3461,372 RPM International, Inc. . . . . . . . . . . . . . . . . . . . . . . . . . 126,018
298 Sensient Technologies Corp. . . . . . . . . . . . . . . . . . . . . . 23,244138 Stepan Co. . . . . . . . . . . . . . . . . . . . . . . . . . . . . . . . . . . . 17,541
1,666 The Chemours Co. . . . . . . . . . . . . . . . . . . . . . . . . . . . . . 46,4983,473 The Mosaic Co. . . . . . . . . . . . . . . . . . . . . . . . . . . . . . . . 109,782
515 The Scotts Miracle-Gro Co. - Class A . . . . . . . . . . . . . . 126,1603,209 Trecora Resources (a) . . . . . . . . . . . . . . . . . . . . . . . . . . 24,934
292 Trinseo SA . . . . . . . . . . . . . . . . . . . . . . . . . . . . . . . . . . . 18,5922,871 Tronox Holdings PLC - Class A . . . . . . . . . . . . . . . . . . 52,5392,407 Valvoline, Inc. . . . . . . . . . . . . . . . . . . . . . . . . . . . . . . . . 62,750
285 Westlake Chemical Corp. . . . . . . . . . . . . . . . . . . . . . . . 25,305
1,575,817
Commercial Services & Supplies - 1.50%595 ABM Industries, Inc. . . . . . . . . . . . . . . . . . . . . . . . . . . . 30,351
2,731 ACCO Brands Corp. . . . . . . . . . . . . . . . . . . . . . . . . . . . 23,0502,505 ADT, Inc. . . . . . . . . . . . . . . . . . . . . . . . . . . . . . . . . . . . . 21,142
858 Avery Dennison Corp. . . . . . . . . . . . . . . . . . . . . . . . . . . 157,5721,573 BrightView Holdings, Inc. (a) . . . . . . . . . . . . . . . . . . . . 26,537
470 Cimpress PLC (a) . . . . . . . . . . . . . . . . . . . . . . . . . . . . . 47,061319 Clean Harbors, Inc. (a) . . . . . . . . . . . . . . . . . . . . . . . . . 26,815759 Comfort Systems USA, Inc. . . . . . . . . . . . . . . . . . . . . . 56,750
1,550 Deluxe Corp. . . . . . . . . . . . . . . . . . . . . . . . . . . . . . . . . . 65,038642 Healthcare Services Group, Inc. . . . . . . . . . . . . . . . . . . 17,995
1,750 Herman Miller, Inc. . . . . . . . . . . . . . . . . . . . . . . . . . . . . 72,0121,219 HNI Corp. . . . . . . . . . . . . . . . . . . . . . . . . . . . . . . . . . . . 48,2241,008 IAA, Inc. (a) . . . . . . . . . . . . . . . . . . . . . . . . . . . . . . . . . 55,5813,635 Interface, Inc. . . . . . . . . . . . . . . . . . . . . . . . . . . . . . . . . . 45,3651,536 KAR Auction Services, Inc. (a) . . . . . . . . . . . . . . . . . . . 23,0404,551 Kimball International, Inc. - Class B . . . . . . . . . . . . . . . 63,7141,639 Knoll, Inc. . . . . . . . . . . . . . . . . . . . . . . . . . . . . . . . . . . . 27,060
476 MSA Safety, Inc. (b) . . . . . . . . . . . . . . . . . . . . . . . . . . . 71,4103,990 NL Industries, Inc. . . . . . . . . . . . . . . . . . . . . . . . . . . . . . 29,725
10,793 Orion Energy Systems, Inc. (a) . . . . . . . . . . . . . . . . . . . 75,1195,960 Pitney Bowes, Inc. . . . . . . . . . . . . . . . . . . . . . . . . . . . . . 49,1106,136 Quad/Graphics, Inc. (a) . . . . . . . . . . . . . . . . . . . . . . . . . 21,660
530 SP Plus Corp. (a) . . . . . . . . . . . . . . . . . . . . . . . . . . . . . . 17,3792,956 Steelcase, Inc. - Class A . . . . . . . . . . . . . . . . . . . . . . . . 42,537
500 Stericycle, Inc. (a) . . . . . . . . . . . . . . . . . . . . . . . . . . . . . 33,7552,235 Sykes Enterprises, Inc. (a) . . . . . . . . . . . . . . . . . . . . . . . 98,5195,171 Team, Inc. (a) . . . . . . . . . . . . . . . . . . . . . . . . . . . . . . . . 59,622
500 Tetra Tech, Inc. . . . . . . . . . . . . . . . . . . . . . . . . . . . . . . . 67,860228 The Brinks Co. . . . . . . . . . . . . . . . . . . . . . . . . . . . . . . . 18,064
1,392,067
Communications Equipment - 1.30%1,732 ADTRAN, Inc. . . . . . . . . . . . . . . . . . . . . . . . . . . . . . . . 28,8902,860 Calix, Inc. (a) . . . . . . . . . . . . . . . . . . . . . . . . . . . . . . . . . 99,1282,972 Cambium Networks Corp. (a) . . . . . . . . . . . . . . . . . . . . 138,8524,257 Casa Systems, Inc. (a) . . . . . . . . . . . . . . . . . . . . . . . . . . 40,5692,543 Ciena Corp. (a) . . . . . . . . . . . . . . . . . . . . . . . . . . . . . . . 139,1531,147 Clearfield, Inc. (a) . . . . . . . . . . . . . . . . . . . . . . . . . . . . . 34,5592,581 CommScope Holding Co., Inc. (a) . . . . . . . . . . . . . . . . 39,6441,468 Digi International, Inc. (a) . . . . . . . . . . . . . . . . . . . . . . . 27,8771,541 DZS, Inc. (a) . . . . . . . . . . . . . . . . . . . . . . . . . . . . . . . . . 23,963
Number ofShares Value
Communications Equipment (Continued)11,381 Extreme Networks, Inc. (a) . . . . . . . . . . . . . . . . . . . . . . $ 99,5843,420 Harmonic, Inc. (a) . . . . . . . . . . . . . . . . . . . . . . . . . . . . . 26,8133,666 Inseego Corp. (a) . . . . . . . . . . . . . . . . . . . . . . . . . . . . . . 36,6601,466 KVH Industries, Inc. (a) . . . . . . . . . . . . . . . . . . . . . . . . 18,589
464 Loral Space & Communications Ltd. . . . . . . . . . . . . . . 17,479734 Lumentum Holdings, Inc. (a) . . . . . . . . . . . . . . . . . . . . 67,051
1,017 NETGEAR, Inc. (a) . . . . . . . . . . . . . . . . . . . . . . . . . . . . 41,7991,520 NetScout Systems, Inc. (a) . . . . . . . . . . . . . . . . . . . . . . 42,8034,950 PCTEL, Inc. . . . . . . . . . . . . . . . . . . . . . . . . . . . . . . . . . . 34,4021,522 Plantronics, Inc. (a) . . . . . . . . . . . . . . . . . . . . . . . . . . . . 59,2214,312 Resonant, Inc. (a) . . . . . . . . . . . . . . . . . . . . . . . . . . . . . . 18,283
10,376 Ribbon Communications, Inc. (a) . . . . . . . . . . . . . . . . . 85,18727,188 Seachange International, Inc. (a) . . . . . . . . . . . . . . . . . . 42,1412,605 Viavi Solutions, Inc. (a) . . . . . . . . . . . . . . . . . . . . . . . . . 40,898
1,203,545
Computers & Peripherals - 0.04%2,670 Diebold Nixdorf, Inc. (a) . . . . . . . . . . . . . . . . . . . . . . . . 37,727
Construction & Engineering - 1.41%1,904 AECOM (a) . . . . . . . . . . . . . . . . . . . . . . . . . . . . . . . . . . 122,0661,248 Aegion Corp. (a) . . . . . . . . . . . . . . . . . . . . . . . . . . . . . . 35,8801,005 Ameresco, Inc. - Class A (a) . . . . . . . . . . . . . . . . . . . . . 48,8731,053 API Group Corp. (a) . . . . . . . . . . . . . . . . . . . . . . . . . . . 21,776
660 Arcosa, Inc. . . . . . . . . . . . . . . . . . . . . . . . . . . . . . . . . . . 42,9591,006 Construction Partners, Inc. - Class A (a) . . . . . . . . . . . . 30,059
504 Dycom Industries, Inc. (a) . . . . . . . . . . . . . . . . . . . . . . . 46,796681 EMCOR Group, Inc. . . . . . . . . . . . . . . . . . . . . . . . . . . . 76,381494 Granite Construction, Inc. (b) . . . . . . . . . . . . . . . . . . . . 19,884
2,947 Great Lakes Dredge & Dock Corp. (a) . . . . . . . . . . . . . 42,9675,921 HC2 Holdings, Inc. (a) . . . . . . . . . . . . . . . . . . . . . . . . . 23,3291,189 IES Holdings, Inc. (a) . . . . . . . . . . . . . . . . . . . . . . . . . . 59,9381,211 Jacobs Engineering Group, Inc. . . . . . . . . . . . . . . . . . . . 156,5461,567 KBR, Inc. . . . . . . . . . . . . . . . . . . . . . . . . . . . . . . . . . . . . 60,157
789 MasTec, Inc. (a) . . . . . . . . . . . . . . . . . . . . . . . . . . . . . . . 73,929437 MYR Group, Inc. (a) . . . . . . . . . . . . . . . . . . . . . . . . . . . 31,320707 Northwest Pipe Co. (a) . . . . . . . . . . . . . . . . . . . . . . . . . 23,628500 NV5 Global, Inc. (a) . . . . . . . . . . . . . . . . . . . . . . . . . . . 48,285
1,178 Primoris Services Corp. . . . . . . . . . . . . . . . . . . . . . . . . . 39,0271,717 Quanta Services, Inc. . . . . . . . . . . . . . . . . . . . . . . . . . . . 151,0621,820 Sterling Construction Co., Inc. (a) . . . . . . . . . . . . . . . . . 42,2244,119 Tutor Perini Corp. (a) . . . . . . . . . . . . . . . . . . . . . . . . . . 78,0551,215 WillScot Mobile Mini Holdings Corp. (a) . . . . . . . . . . 33,716
1,308,857
Construction Materials - 0.21%211 Eagle Materials, Inc. . . . . . . . . . . . . . . . . . . . . . . . . . . . 28,361
2,510 Forterra, Inc. (a) . . . . . . . . . . . . . . . . . . . . . . . . . . . . . . . 58,3581,257 Summit Materials, Inc. - Class A (a) . . . . . . . . . . . . . . . 35,221
976 US Concrete, Inc. (a) . . . . . . . . . . . . . . . . . . . . . . . . . . . 71,560
193,500
Consumer Finance - 1.08%3,457 Ally Financial, Inc. . . . . . . . . . . . . . . . . . . . . . . . . . . . . 156,2912,036 Atlanticus Holdings Corp. (a) . . . . . . . . . . . . . . . . . . . . 61,752
203 Credit Acceptance Corp. (a)(b) . . . . . . . . . . . . . . . . . . . 73,1274,960 Curo Group Holdings Corp. . . . . . . . . . . . . . . . . . . . . . 72,3662,599 Enova International, Inc. (a) . . . . . . . . . . . . . . . . . . . . . 92,213
395 FirstCash, Inc. . . . . . . . . . . . . . . . . . . . . . . . . . . . . . . . . 25,940661 Green Dot Corp. - Class A (a) . . . . . . . . . . . . . . . . . . . . 30,267
6,122 Navient Corp. . . . . . . . . . . . . . . . . . . . . . . . . . . . . . . . . 87,606510 Nelnet, Inc. - Class A . . . . . . . . . . . . . . . . . . . . . . . . . . 37,097
See notes to financial statements.
52

GuideMark® Small/Mid Cap Core FundSCHEDULE OF INVESTMENTS (Continued)March 31, 2021
Number ofShares Value
COMMON STOCKS (Continued)Consumer Finance (Continued)
2,326 OneMain Holdings, Inc. . . . . . . . . . . . . . . . . . . . . . . . . $ 124,953648 PRA Group, Inc. (a) . . . . . . . . . . . . . . . . . . . . . . . . . . . 24,021572 PROG Holdings, Inc. . . . . . . . . . . . . . . . . . . . . . . . . . . . 24,762
1,248 Regional Management Corp. . . . . . . . . . . . . . . . . . . . . . 43,2562,055 Santander Consumer USA Holdings, Inc. . . . . . . . . . . . 55,6085,225 SLM Corp. . . . . . . . . . . . . . . . . . . . . . . . . . . . . . . . . . . . 93,893
1,003,152
Containers & Packaging - 0.78%414 AptarGroup, Inc. . . . . . . . . . . . . . . . . . . . . . . . . . . . . . . 58,651
1,518 Berry Plastics Group, Inc. (a) . . . . . . . . . . . . . . . . . . . . 93,2051,242 Crown Holdings, Inc. . . . . . . . . . . . . . . . . . . . . . . . . . . 120,5241,198 Graphic Packaging Holding Co. . . . . . . . . . . . . . . . . . . 21,756
518 Greif, Inc. - Class A . . . . . . . . . . . . . . . . . . . . . . . . . . . . 29,526436 Greif, Inc. - Class B . . . . . . . . . . . . . . . . . . . . . . . . . . . . 24,957
2,215 Myers Industries, Inc. . . . . . . . . . . . . . . . . . . . . . . . . . . 43,7681,663 O-I Glass, Inc. (a) . . . . . . . . . . . . . . . . . . . . . . . . . . . . . 24,512
883 Packaging Corp. of America . . . . . . . . . . . . . . . . . . . . . 118,7461,954 Ranpak Holdings Corp. (a) . . . . . . . . . . . . . . . . . . . . . . 39,1971,563 Sealed Air Corp. . . . . . . . . . . . . . . . . . . . . . . . . . . . . . . 71,617
990 Silgan Holdings, Inc. . . . . . . . . . . . . . . . . . . . . . . . . . . . 41,610538 Sonoco Products Co. . . . . . . . . . . . . . . . . . . . . . . . . . . . 34,055
722,124
Distributors - 0.18%1,251 Core-Mark Holding Co., Inc. . . . . . . . . . . . . . . . . . . . . 48,4012,813 Funko, Inc. (a) . . . . . . . . . . . . . . . . . . . . . . . . . . . . . . . . 55,3604,850 Greenlane Holdings, Inc. - Class A (a) . . . . . . . . . . . . . 25,7292,185 VOXX International Corp. (a) . . . . . . . . . . . . . . . . . . . . 41,646
171,136
Diversified Consumer Services - 1.25%1,613 Adtalem Global Education, Inc. (a) . . . . . . . . . . . . . . . . 63,7781,527 American Public Education, Inc. (a) . . . . . . . . . . . . . . . 54,4072,909 Aspen Group, Inc. (a) . . . . . . . . . . . . . . . . . . . . . . . . . . 17,454
250 Bright Horizons Family Solutions, Inc. (a) . . . . . . . . . . 42,8631,028 Carriage Services, Inc. . . . . . . . . . . . . . . . . . . . . . . . . . . 36,175
693 Chegg, Inc. (a)(b) . . . . . . . . . . . . . . . . . . . . . . . . . . . . . 59,3627,799 Envela Corp. (a) . . . . . . . . . . . . . . . . . . . . . . . . . . . . . . 39,151
794 Franchise Group, Inc. . . . . . . . . . . . . . . . . . . . . . . . . . . 28,6711,340 frontdoor, Inc. (a) . . . . . . . . . . . . . . . . . . . . . . . . . . . . . 72,025
80 Graham Holdings Co. - Class B . . . . . . . . . . . . . . . . . . 44,995410 Grand Canyon Education, Inc. (a) . . . . . . . . . . . . . . . . . 43,911
2,442 H&R Block, Inc. . . . . . . . . . . . . . . . . . . . . . . . . . . . . . . 53,2361,493 Hillenbrand, Inc. . . . . . . . . . . . . . . . . . . . . . . . . . . . . . . 71,231
14,858 Houghton Mifflin Harcourt Co. (a) . . . . . . . . . . . . . . . . 113,2183,032 Laureate Education, Inc. - Class A (a) . . . . . . . . . . . . . 41,205
841 Matthews International Corp. - Class A . . . . . . . . . . . . 33,2624,836 Perdoceo Education Corp. (a) . . . . . . . . . . . . . . . . . . . . 57,8391,362 Service Corp. International . . . . . . . . . . . . . . . . . . . . . . 69,530
197 Strategic Education, Inc. . . . . . . . . . . . . . . . . . . . . . . . . 18,1062,317 Stride, Inc. (a) . . . . . . . . . . . . . . . . . . . . . . . . . . . . . . . . 69,7651,069 Terminix Global Holdings, Inc. (a) . . . . . . . . . . . . . . . . 50,9593,050 Universal Technical Institute, Inc. (a) . . . . . . . . . . . . . . 17,8122,012 WW International, Inc. (a) . . . . . . . . . . . . . . . . . . . . . . . 62,935
1,161,890
Diversified Financial Services - 0.38%578 Alerus Financial Corp. . . . . . . . . . . . . . . . . . . . . . . . . . . 17,213946 A-Mark Precious Metals, Inc. . . . . . . . . . . . . . . . . . . . . 34,056
Number ofShares Value
Diversified Financial Services (Continued)1,942 Cannae Holdings, Inc. (a) . . . . . . . . . . . . . . . . . . . . . . . $ 76,942
898 Encore Capital Group, Inc. (a)(b) . . . . . . . . . . . . . . . . . 36,1272,954 Jefferies Financial Group, Inc. . . . . . . . . . . . . . . . . . . . 88,915
851 Voya Financial, Inc. . . . . . . . . . . . . . . . . . . . . . . . . . . . 54,158361 World Acceptance Corp. (a)(b) . . . . . . . . . . . . . . . . . . . 46,843
354,254
Diversified Telecommunication Services - 0.48%7,599 Alaska Communications Systems Group, Inc. . . . . . . . 24,697
270 Bandwidth, Inc. - Class A (a)(b) . . . . . . . . . . . . . . . . . . 34,220558 Cogent Communications Holdings, Inc. . . . . . . . . . . . . 38,368
3,839 Consolidated Communications Holdings, Inc. (a) . . . . 27,6413,765 Genasys, Inc. (a) . . . . . . . . . . . . . . . . . . . . . . . . . . . . . . 25,1883,834 IDT Corp. - Class B (a) . . . . . . . . . . . . . . . . . . . . . . . . . 86,878
658 Iridium Communications, Inc. (a) . . . . . . . . . . . . . . . . . 27,1423,341 Ooma, Inc. (a) . . . . . . . . . . . . . . . . . . . . . . . . . . . . . . . . 52,9556,631 ORBCOMM, Inc. (a) . . . . . . . . . . . . . . . . . . . . . . . . . . . 50,5956,705 Vonage Holdings Corp. (a) . . . . . . . . . . . . . . . . . . . . . . 79,253
446,937
Electric Utilities - 0.31%6,794 Genie Energy Ltd. - Class B . . . . . . . . . . . . . . . . . . . . . 43,074
614 Hawaiian Electric Industries, Inc. . . . . . . . . . . . . . . . . . 27,280176 IDACORP, Inc. . . . . . . . . . . . . . . . . . . . . . . . . . . . . . . . 17,595539 OGE Energy Corp. . . . . . . . . . . . . . . . . . . . . . . . . . . . . 17,442
3,524 PG&E Corp. (a) . . . . . . . . . . . . . . . . . . . . . . . . . . . . . . . 41,266306 Pinnacle West Capital Corp. . . . . . . . . . . . . . . . . . . . . . 24,893415 PNM Resources, Inc. . . . . . . . . . . . . . . . . . . . . . . . . . . . 20,356369 Portland General Electric Co. . . . . . . . . . . . . . . . . . . . . 17,516
7,364 Spark Energy, Inc. - Class A . . . . . . . . . . . . . . . . . . . . . 78,648
288,070
Electrical Equipment - 1.97%677 Acuity Brands, Inc. (b) . . . . . . . . . . . . . . . . . . . . . . . . . 111,705510 Allied Motion Technologies, Inc. . . . . . . . . . . . . . . . . . 26,178
1,166 American Superconductor Corp. (a) . . . . . . . . . . . . . . . 22,1071,079 Atkore International Group, Inc. (a) . . . . . . . . . . . . . . . 77,580
417 AZZ, Inc. . . . . . . . . . . . . . . . . . . . . . . . . . . . . . . . . . . . . 20,996462 Belden, Inc. . . . . . . . . . . . . . . . . . . . . . . . . . . . . . . . . . . 20,499838 Bloom Energy Corp. - Class A (a) . . . . . . . . . . . . . . . . 22,668926 Brady Corp. - Class A . . . . . . . . . . . . . . . . . . . . . . . . . . 49,495327 EnerSys . . . . . . . . . . . . . . . . . . . . . . . . . . . . . . . . . . . . . 29,692
1,498 Enphase Energy, Inc. (a) . . . . . . . . . . . . . . . . . . . . . . . . 242,916656 Franklin Electric Co., Inc. . . . . . . . . . . . . . . . . . . . . . . . 51,785
4,625 FuelCell Energy, Inc. (a) . . . . . . . . . . . . . . . . . . . . . . . . 66,646678 Generac Holdings, Inc. (a) . . . . . . . . . . . . . . . . . . . . . . . 222,011
3,356 GrafTech International, Ltd. . . . . . . . . . . . . . . . . . . . . . 41,044582 Hubbell, Inc. (b) . . . . . . . . . . . . . . . . . . . . . . . . . . . . . . 108,770795 II-VI, Inc. (a)(b) . . . . . . . . . . . . . . . . . . . . . . . . . . . . . . . 54,354
7,184 LSI Industries, Inc. . . . . . . . . . . . . . . . . . . . . . . . . . . . . 61,2791,048 nVent Electric PLC . . . . . . . . . . . . . . . . . . . . . . . . . . . . 29,2503,132 Plug Power, Inc. (a)(b) . . . . . . . . . . . . . . . . . . . . . . . . . 112,251
746 Powell Industries, Inc. . . . . . . . . . . . . . . . . . . . . . . . . . . 25,267272 Preformed Line Products Co. . . . . . . . . . . . . . . . . . . . . 18,700526 Regal Beloit Corp. (b) . . . . . . . . . . . . . . . . . . . . . . . . . . 75,050919 Sensata Technologies Holding PLC (a) . . . . . . . . . . . . 53,256
1,369 Sunrun, Inc. (a)(b) . . . . . . . . . . . . . . . . . . . . . . . . . . . . . 82,797923 Thermon Group Holdings, Inc. (a) . . . . . . . . . . . . . . . . 17,989542 TPI Composites, Inc. (a) . . . . . . . . . . . . . . . . . . . . . . . . 30,585
2,041 Vertiv Holdings Co. . . . . . . . . . . . . . . . . . . . . . . . . . . . 40,820849 Vicor Corp. (a) . . . . . . . . . . . . . . . . . . . . . . . . . . . . . . . 72,190
See notes to financial statements.
53

GuideMark® Small/Mid Cap Core FundSCHEDULE OF INVESTMENTS (Continued)March 31, 2021
Number ofShares Value
COMMON STOCKS (Continued)Electrical Equipment (Continued)
362 Woodward Governor Co. . . . . . . . . . . . . . . . . . . . . . . . $ 43,668
1,831,548
Electronic Equipment, Instruments & Components - 2.07%400 908 Devices, Inc. (a) . . . . . . . . . . . . . . . . . . . . . . . . . . . 19,400
1,418 Akoustis Technologies, Inc. (a) . . . . . . . . . . . . . . . . . . . 18,9162,584 Arlo Technologies, Inc. (a) . . . . . . . . . . . . . . . . . . . . . . 16,227
863 Arrow Electronics, Inc. (a) . . . . . . . . . . . . . . . . . . . . . . 95,6381,197 Avnet, Inc. . . . . . . . . . . . . . . . . . . . . . . . . . . . . . . . . . . . 49,6871,530 Bel Fuse, Inc. - Class B . . . . . . . . . . . . . . . . . . . . . . . . . 30,4321,066 Benchmark Electronics, Inc. . . . . . . . . . . . . . . . . . . . . . 32,9611,665 Cognex Corp. . . . . . . . . . . . . . . . . . . . . . . . . . . . . . . . . . 138,178
208 Coherent, Inc. (a) . . . . . . . . . . . . . . . . . . . . . . . . . . . . . . 52,6013,905 Daktronics, Inc. (a) . . . . . . . . . . . . . . . . . . . . . . . . . . . . 24,484
764 Dolby Laboratories, Inc. - Class A . . . . . . . . . . . . . . . . 75,422549 Fabrinet (a) . . . . . . . . . . . . . . . . . . . . . . . . . . . . . . . . . . 49,624394 FARO Technologies, Inc. (a) . . . . . . . . . . . . . . . . . . . . 34,109
1,161 FLIR Systems, Inc. . . . . . . . . . . . . . . . . . . . . . . . . . . . . 65,562832 Insight Enterprises, Inc. (a) . . . . . . . . . . . . . . . . . . . . . . 79,389
5,229 Iteris, Inc. (a) . . . . . . . . . . . . . . . . . . . . . . . . . . . . . . . . . 32,263206 Itron, Inc. (a) . . . . . . . . . . . . . . . . . . . . . . . . . . . . . . . . . 18,262963 Jabil, Inc. . . . . . . . . . . . . . . . . . . . . . . . . . . . . . . . . . . . . 50,230
1,595 Kimball Electronics, Inc. (a) . . . . . . . . . . . . . . . . . . . . . 41,1511,326 Knowles Corp. (a)(b) . . . . . . . . . . . . . . . . . . . . . . . . . . . 27,740
107 Littelfuse, Inc. . . . . . . . . . . . . . . . . . . . . . . . . . . . . . . . . 28,2954,507 Luna Innovations, Inc. (a) . . . . . . . . . . . . . . . . . . . . . . . 47,459
788 Methode Electronics, Inc. . . . . . . . . . . . . . . . . . . . . . . . 33,0801,714 Napco Security Technologies, Inc. (a)(b) . . . . . . . . . . . 59,6992,025 National Instruments Corp. . . . . . . . . . . . . . . . . . . . . . . 87,450
609 nLight, Inc. (a) . . . . . . . . . . . . . . . . . . . . . . . . . . . . . . . . 19,732501 Novanta, Inc. (a) . . . . . . . . . . . . . . . . . . . . . . . . . . . . . . 66,077244 OSI Systems, Inc. (a) . . . . . . . . . . . . . . . . . . . . . . . . . . . 23,448572 PAR Technology Corp. (a)(b) . . . . . . . . . . . . . . . . . . . . 37,415926 PC Connection, Inc. . . . . . . . . . . . . . . . . . . . . . . . . . . . . 42,957272 Plexus Corp. (a) . . . . . . . . . . . . . . . . . . . . . . . . . . . . . . . 24,980166 Rogers Corp. (a) . . . . . . . . . . . . . . . . . . . . . . . . . . . . . . 31,243
1,129 Sanmina Corp. (a) . . . . . . . . . . . . . . . . . . . . . . . . . . . . . 46,7181,282 ScanSource, Inc. (a) . . . . . . . . . . . . . . . . . . . . . . . . . . . . 38,396
672 SYNNEX Corp. . . . . . . . . . . . . . . . . . . . . . . . . . . . . . . . 77,1722,532 Trimble, Inc. (a) . . . . . . . . . . . . . . . . . . . . . . . . . . . . . . . 196,9641,874 TTM Technologies, Inc. (a) . . . . . . . . . . . . . . . . . . . . . . 27,173
227 Universal Display Corp. . . . . . . . . . . . . . . . . . . . . . . . . 53,7471,208 Vishay Intertechnology, Inc. . . . . . . . . . . . . . . . . . . . . . 29,089
1,923,370
Energy Equipment & Services - 0.38%1,895 Archrock, Inc. . . . . . . . . . . . . . . . . . . . . . . . . . . . . . . . . 17,9841,986 Aspen Aerogels, Inc. (a) . . . . . . . . . . . . . . . . . . . . . . . . 40,395
888 ChampionX Corp. (a) . . . . . . . . . . . . . . . . . . . . . . . . . . 19,296956 Helmerich & Payne, Inc. . . . . . . . . . . . . . . . . . . . . . . . . 25,774
11,309 Newpark Resources, Inc. (a) . . . . . . . . . . . . . . . . . . . . . 35,5106,490 NexTier Oilfield Solutions, Inc. (a) . . . . . . . . . . . . . . . . 24,1432,111 NOV, Inc. (a) . . . . . . . . . . . . . . . . . . . . . . . . . . . . . . . . . 28,9634,821 Oil States International, Inc. (a) . . . . . . . . . . . . . . . . . . 29,0714,342 Patterson-UTI Energy, Inc. . . . . . . . . . . . . . . . . . . . . . . 30,9584,112 ProPetro Holding Corp. (a) . . . . . . . . . . . . . . . . . . . . . . 43,834
496 Seacor Holdings, Inc. (a) . . . . . . . . . . . . . . . . . . . . . . . . 20,2124,260 Select Energy Services, Inc. - Class A (a) . . . . . . . . . . . 21,2151,584 US Silica Holdings, Inc. (a) . . . . . . . . . . . . . . . . . . . . . . 19,467
356,822
Number ofShares Value
Entertainment - 0.35%1,659 AMC Entertainment Holdings, Inc. - Class A (a) . . . . . $ 16,9385,123 Glu Mobile, Inc. (a) . . . . . . . . . . . . . . . . . . . . . . . . . . . . 63,9351,223 Liberty Media Corp. - Liberty Formula One -
Class C (a) . . . . . . . . . . . . . . . . . . . . . . . . . . . . . . . . . 52,9442,092 Lions Gate Entertainment Corp. - Class A (a)(b) . . . . . 31,2762,917 Lions Gate Entertainment Corp. - Class B (a) . . . . . . . . 37,6293,041 LiveXLive Media, Inc. (a) . . . . . . . . . . . . . . . . . . . . . . . 13,198
493 World Wrestling Entertainment, Inc. - Class A . . . . . . . 26,7507,616 Zynga, Inc. - Class A (a) . . . . . . . . . . . . . . . . . . . . . . . . 77,759
320,429
Food & Staples Retailing - 1.24%2,391 Albertsons Cos., Inc. . . . . . . . . . . . . . . . . . . . . . . . . . . . 45,5962,426 BJ’s Wholesale Club Holdings, Inc. (a)(b) . . . . . . . . . . 108,830
532 Casey’s General Stores, Inc. (b) . . . . . . . . . . . . . . . . . . 115,0131,065 Grocery Outlet Holding Corp. (a) . . . . . . . . . . . . . . . . . 39,2881,090 Ingles Markets, Inc. - Class A . . . . . . . . . . . . . . . . . . . . 67,1992,198 Natural Grocers by Vitamin Cottage, Inc. . . . . . . . . . . . 38,5752,705 Performance Food Group Co. (a) . . . . . . . . . . . . . . . . . 155,835
396 PriceSmart, Inc. . . . . . . . . . . . . . . . . . . . . . . . . . . . . . . . 38,3132,111 Rite Aid Corp. (a)(b) . . . . . . . . . . . . . . . . . . . . . . . . . . . 43,1912,533 SpartanNash Co. . . . . . . . . . . . . . . . . . . . . . . . . . . . . . . 49,7232,724 Sprouts Farmers Market, Inc. (a) . . . . . . . . . . . . . . . . . . 72,513
709 The Chefs’ Warehouse, Inc. (a)(b) . . . . . . . . . . . . . . . . 21,5963,654 United Natural Foods, Inc. (a) . . . . . . . . . . . . . . . . . . . . 120,3633,862 US Foods Holding Corp. (a) . . . . . . . . . . . . . . . . . . . . . 147,2201,158 Village Super Market, Inc. - Class A . . . . . . . . . . . . . . 27,2941,093 Weis Markets, Inc. (b) . . . . . . . . . . . . . . . . . . . . . . . . . . 61,776
1,152,325
Food Products - 1.17%1,325 B&G Foods, Inc. (b) . . . . . . . . . . . . . . . . . . . . . . . . . . . 41,154
445 Beyond Meat, Inc. (a)(b) . . . . . . . . . . . . . . . . . . . . . . . . 57,903724 Bunge, Ltd. . . . . . . . . . . . . . . . . . . . . . . . . . . . . . . . . . . 57,391
1,576 Darling International, Inc. (a) . . . . . . . . . . . . . . . . . . . . 115,9623,405 Farmer Brothers Co. (a) . . . . . . . . . . . . . . . . . . . . . . . . . 35,5483,135 Flowers Foods, Inc. . . . . . . . . . . . . . . . . . . . . . . . . . . . . 74,6131,120 Fresh Del Monte Produce, Inc. . . . . . . . . . . . . . . . . . . . 32,0661,109 Freshpet, Inc. (a) . . . . . . . . . . . . . . . . . . . . . . . . . . . . . . 176,1202,081 Hostess Brands, Inc. (a) . . . . . . . . . . . . . . . . . . . . . . . . . 29,842
696 Ingredion, Inc. (b) . . . . . . . . . . . . . . . . . . . . . . . . . . . . . 62,584160 J&J Snack Foods Corp. (b) . . . . . . . . . . . . . . . . . . . . . . 25,125272 John B. Sanfilippo & Son, Inc. . . . . . . . . . . . . . . . . . . . 24,581535 Lamb Weston Holdings, Inc. . . . . . . . . . . . . . . . . . . . . . 41,452242 Lancaster Colony Corp. (b) . . . . . . . . . . . . . . . . . . . . . . 42,437
1,107 Pilgrim’s Pride Corp. (a) . . . . . . . . . . . . . . . . . . . . . . . . 26,335544 Post Holdings, Inc. (a) . . . . . . . . . . . . . . . . . . . . . . . . . . 57,512142 Sanderson Farms, Inc. . . . . . . . . . . . . . . . . . . . . . . . . . . 22,121912 Seneca Foods Corp. - Class A (a) . . . . . . . . . . . . . . . . . 42,946618 Simply Good Foods Co. (a) . . . . . . . . . . . . . . . . . . . . . . 18,800764 The Hain Celestial Group, Inc. (a) . . . . . . . . . . . . . . . . 33,310965 TreeHouse Foods, Inc. (a) . . . . . . . . . . . . . . . . . . . . . . . 50,412850 Vital Farms, Inc. (a) . . . . . . . . . . . . . . . . . . . . . . . . . . . . 18,564
1,086,778
Gas Utilities - 0.23%728 Brookfield Infrastructure Corp. - Class A . . . . . . . . . . . 55,597
2,615 EQT Corp. (a) . . . . . . . . . . . . . . . . . . . . . . . . . . . . . . . . 48,587289 Spire, Inc. (b) . . . . . . . . . . . . . . . . . . . . . . . . . . . . . . . . . 21,354
2,110 UGI Corp. . . . . . . . . . . . . . . . . . . . . . . . . . . . . . . . . . . . 86,531
212,069
See notes to financial statements.
54

GuideMark® Small/Mid Cap Core FundSCHEDULE OF INVESTMENTS (Continued)March 31, 2021
Number ofShares Value
COMMON STOCKS (Continued)Health Care Equipment & Supplies - 3.28%
6,304 Accuray, Inc. (a) . . . . . . . . . . . . . . . . . . . . . . . . . . . . . . $ 31,2054,890 Alphatec Holdings, Inc. (a) . . . . . . . . . . . . . . . . . . . . . . 77,2131,314 AngioDynamics, Inc. (a) . . . . . . . . . . . . . . . . . . . . . . . . 30,7481,178 Anika Therapeutics, Inc. (a) . . . . . . . . . . . . . . . . . . . . . 48,051
10,317 Antares Pharma, Inc. (a) . . . . . . . . . . . . . . . . . . . . . . . . 42,4035,033 Aspira Womens Health, Inc. (a) . . . . . . . . . . . . . . . . . . 33,973
743 AtriCure, Inc. (a) . . . . . . . . . . . . . . . . . . . . . . . . . . . . . . 48,68127 Atrion Corp. . . . . . . . . . . . . . . . . . . . . . . . . . . . . . . . . . . 17,315
1,301 AxoGen, Inc. (a) . . . . . . . . . . . . . . . . . . . . . . . . . . . . . . 26,358390 Axonics Modulation Technologies, Inc. (a) . . . . . . . . . 23,357490 Cantel Medical Corp. (a) . . . . . . . . . . . . . . . . . . . . . . . . 39,122
1,253 Cardiovascular Systems, Inc. (a) . . . . . . . . . . . . . . . . . . 48,0404,802 Chembio Diagnostics, Inc. (a) . . . . . . . . . . . . . . . . . . . . 16,8552,931 Co-Diagnostics, Inc. (a)(b) . . . . . . . . . . . . . . . . . . . . . . 27,962
304 CONMED Corp. . . . . . . . . . . . . . . . . . . . . . . . . . . . . . . 39,699920 CryoPort, Inc. (a) . . . . . . . . . . . . . . . . . . . . . . . . . . . . . . 47,849
2,317 Cutera, Inc. (a) . . . . . . . . . . . . . . . . . . . . . . . . . . . . . . . . 69,6264,203 CytoSorbents Corp. (a) . . . . . . . . . . . . . . . . . . . . . . . . . 36,4823,220 Electromed, Inc. (a) . . . . . . . . . . . . . . . . . . . . . . . . . . . . 33,9391,578 Envista Holdings Corp. (a) . . . . . . . . . . . . . . . . . . . . . . 64,3821,219 FONAR Corp. (a) . . . . . . . . . . . . . . . . . . . . . . . . . . . . . 22,0522,359 GenMark Diagnostics, Inc. (a) . . . . . . . . . . . . . . . . . . . 56,380
232 Glaukos Corp. (a) . . . . . . . . . . . . . . . . . . . . . . . . . . . . . 19,472921 Globus Medical, Inc. - Class A (a) . . . . . . . . . . . . . . . . 56,798626 Haemonetics Corp. (a) . . . . . . . . . . . . . . . . . . . . . . . . . . 69,492216 Heska Corp. (a) . . . . . . . . . . . . . . . . . . . . . . . . . . . . . . . 36,387974 Hill-Rom Holdings, Inc. . . . . . . . . . . . . . . . . . . . . . . . . 107,608177 ICU Medical, Inc. (a) . . . . . . . . . . . . . . . . . . . . . . . . . . . 36,363346 Inari Medical, Inc. (a) . . . . . . . . . . . . . . . . . . . . . . . . . . 37,022510 Inogen, Inc. (a) . . . . . . . . . . . . . . . . . . . . . . . . . . . . . . . 26,785479 Integer Holdings Corp. (a) . . . . . . . . . . . . . . . . . . . . . . . 44,116593 Integra LifeSciences Holdings Corp. (a) . . . . . . . . . . . . 40,970
3,443 Invacare Corp. . . . . . . . . . . . . . . . . . . . . . . . . . . . . . . . . 27,613901 iRadimed Corp. (a) . . . . . . . . . . . . . . . . . . . . . . . . . . . . 23,219580 iRhythm Technologies, Inc. (a) . . . . . . . . . . . . . . . . . . . 80,539
1,238 LeMaitre Vascular, Inc. . . . . . . . . . . . . . . . . . . . . . . . . . 60,390258 LivaNova PLC (a) . . . . . . . . . . . . . . . . . . . . . . . . . . . . . 19,022
4,094 Meridian Bioscience, Inc. (a)(b) . . . . . . . . . . . . . . . . . . 107,467534 Merit Medical Systems, Inc. (a) . . . . . . . . . . . . . . . . . . 31,976
2,157 Natus Medical, Inc. (a)(b) . . . . . . . . . . . . . . . . . . . . . . . 55,241203 Neogen Corp. (a) . . . . . . . . . . . . . . . . . . . . . . . . . . . . . . 18,045
1,245 Novocure, Ltd. (a)(b) . . . . . . . . . . . . . . . . . . . . . . . . . . . 164,564556 NuVasive, Inc. (a) . . . . . . . . . . . . . . . . . . . . . . . . . . . . . 36,451
1,567 Ocular Therapeutix, Inc. (a) . . . . . . . . . . . . . . . . . . . . . 25,7141,924 OraSure Technologies, Inc. (a) . . . . . . . . . . . . . . . . . . . 22,4531,490 Orthofix Medical, Inc. (a)(b) . . . . . . . . . . . . . . . . . . . . . 64,5924,385 PAVmed, Inc. (a) . . . . . . . . . . . . . . . . . . . . . . . . . . . . . . 19,469
474 Penumbra, Inc. (a)(b) . . . . . . . . . . . . . . . . . . . . . . . . . . . 128,255818 Pulse Biosciences, Inc. (a) . . . . . . . . . . . . . . . . . . . . . . . 19,370708 Quidel Corp. (a) . . . . . . . . . . . . . . . . . . . . . . . . . . . . . . . 90,574
3,947 Retractable Technologies, Inc. (a)(b) . . . . . . . . . . . . . . 50,6012,448 SeaSpine Holdings Corp. (a) . . . . . . . . . . . . . . . . . . . . . 42,595
200 Shockwave Medical, Inc. (a) . . . . . . . . . . . . . . . . . . . . . 26,052603 SI-BONE, Inc. (a) . . . . . . . . . . . . . . . . . . . . . . . . . . . . . 19,181567 Silk Road Medical, Inc. (a) . . . . . . . . . . . . . . . . . . . . . . 28,719
1,258 STAAR Surgical Co. (a) . . . . . . . . . . . . . . . . . . . . . . . . 132,6069,095 Surgalign Holdings, Inc. (a) . . . . . . . . . . . . . . . . . . . . . 19,827
721 SurModics, Inc. (a) . . . . . . . . . . . . . . . . . . . . . . . . . . . . 40,4261,301 Tactile Systems Technology, Inc. (a) . . . . . . . . . . . . . . 70,891
Number ofShares Value
Health Care Equipment & Supplies (Continued)1,260 Tandem Diabetes Care, Inc. (a) . . . . . . . . . . . . . . . . . . . $ 111,1951,414 Tela Bio, Inc. (a) . . . . . . . . . . . . . . . . . . . . . . . . . . . . . . 21,069
438 TransMedics Group, Inc. (a) . . . . . . . . . . . . . . . . . . . . . 18,173882 Vapotherm, Inc. (a) . . . . . . . . . . . . . . . . . . . . . . . . . . . . 21,186
1,071 Varex Imaging Corp. (a) . . . . . . . . . . . . . . . . . . . . . . . . 21,945877 Wright Medical Group NV (a)(c)(d)(f) . . . . . . . . . . . . . —
4,160 Zynex, Inc. (a)(b) . . . . . . . . . . . . . . . . . . . . . . . . . . . . . . 63,523
3,039,648
Health Care Providers & Services - 3.43%659 1Life Healthcare, Inc. (a) . . . . . . . . . . . . . . . . . . . . . . . . 25,754
1,893 Acadia Healthcare Co., Inc. (a) . . . . . . . . . . . . . . . . . . . 108,166638 AdaptHealth Corp. (a) . . . . . . . . . . . . . . . . . . . . . . . . . . 23,453435 Addus HomeCare Corp. (a) . . . . . . . . . . . . . . . . . . . . . . 45,497641 Amedisys, Inc. (a) . . . . . . . . . . . . . . . . . . . . . . . . . . . . . 169,730
1,206 AMN Healthcare Services, Inc. (a) . . . . . . . . . . . . . . . . 88,8827,745 Brookdale Senior Living, Inc. (a) . . . . . . . . . . . . . . . . . 46,857
234 Chemed Corp. . . . . . . . . . . . . . . . . . . . . . . . . . . . . . . . . 107,5984,836 Community Health Systems, Inc. (a) . . . . . . . . . . . . . . 65,383
275 CorVel Corp. (a) . . . . . . . . . . . . . . . . . . . . . . . . . . . . . . 28,2122,025 Covetrus, Inc. (a) . . . . . . . . . . . . . . . . . . . . . . . . . . . . . . 60,6897,393 Cross Country Healthcare, Inc. (a) . . . . . . . . . . . . . . . . 92,339
582 Encompass Health Corp. . . . . . . . . . . . . . . . . . . . . . . . . 47,6662,904 Five Star Senior Living, Inc. (a) . . . . . . . . . . . . . . . . . . 17,772
795 Fulgent Genetics, Inc. (a)(b) . . . . . . . . . . . . . . . . . . . . . 76,813421 Guardant Health, Inc. (a) . . . . . . . . . . . . . . . . . . . . . . . . 64,266
1,119 Hanger Orthopedic Group, Inc. (a) . . . . . . . . . . . . . . . . 25,536492 HMS Holdings Corp. (a) . . . . . . . . . . . . . . . . . . . . . . . . 18,192
3,300 InfuSystem Holdings, Inc. (a)(b) . . . . . . . . . . . . . . . . . . 67,188437 LHC Group, Inc. (a) . . . . . . . . . . . . . . . . . . . . . . . . . . . 83,559854 Magellan Health Services, Inc. (a) . . . . . . . . . . . . . . . . 79,627
2,983 MEDNAX, Inc. (a)(b) . . . . . . . . . . . . . . . . . . . . . . . . . . 75,977491 ModivCare, Inc. (a) . . . . . . . . . . . . . . . . . . . . . . . . . . . . 72,727
1,059 Molina Healthcare, Inc. (a) . . . . . . . . . . . . . . . . . . . . . . 247,552414 National HealthCare Corp. . . . . . . . . . . . . . . . . . . . . . . 32,255
1,573 National Research Corp. - Class A . . . . . . . . . . . . . . . . 73,6641,295 Ontrak, Inc. (a) . . . . . . . . . . . . . . . . . . . . . . . . . . . . . . . 42,1652,095 Option Care Health, Inc. (a) . . . . . . . . . . . . . . . . . . . . . 37,1654,302 Owens & Minor, Inc. . . . . . . . . . . . . . . . . . . . . . . . . . . . 161,7122,306 Patterson Cos., Inc. (b) . . . . . . . . . . . . . . . . . . . . . . . . . 73,6771,463 PerkinElmer, Inc. . . . . . . . . . . . . . . . . . . . . . . . . . . . . . . 187,688
556 PetIQ, Inc. (a) . . . . . . . . . . . . . . . . . . . . . . . . . . . . . . . . 19,605848 Premier, Inc. - Class A . . . . . . . . . . . . . . . . . . . . . . . . . 28,705
2,564 R1 RCM, Inc. (a) . . . . . . . . . . . . . . . . . . . . . . . . . . . . . . 63,2792,634 RadNet, Inc. (a) . . . . . . . . . . . . . . . . . . . . . . . . . . . . . . . 57,2891,810 Select Medical Holdings Corp. (a) . . . . . . . . . . . . . . . . 61,7212,703 Sharps Compliance Corp. (a) . . . . . . . . . . . . . . . . . . . . 38,8421,512 Surgery Partners, Inc. (a) . . . . . . . . . . . . . . . . . . . . . . . . 66,9211,777 Tenet Healthcare Corp. (a) . . . . . . . . . . . . . . . . . . . . . . 92,404
898 The Ensign Group, Inc. . . . . . . . . . . . . . . . . . . . . . . . . . 84,2682,113 The Joint Corp (a) . . . . . . . . . . . . . . . . . . . . . . . . . . . . . 102,2063,610 Tivity Health, Inc. (a) . . . . . . . . . . . . . . . . . . . . . . . . . . 80,5752,225 Triple-S Management Corp. - Class B (a) . . . . . . . . . . . 57,917
330 Trupanion, Inc. (a) . . . . . . . . . . . . . . . . . . . . . . . . . . . . . 25,1495,787 Viemed Healthcare, Inc. (a) . . . . . . . . . . . . . . . . . . . . . . 58,564
3,185,206
Health Care Technology - 0.80%2,147 Allscripts Healthcare Solutions, Inc. (a) . . . . . . . . . . . . 32,237
825 BioLife Solutions, Inc. (a) . . . . . . . . . . . . . . . . . . . . . . . 29,700
See notes to financial statements.
55

GuideMark® Small/Mid Cap Core FundSCHEDULE OF INVESTMENTS (Continued)March 31, 2021
Number ofShares Value
COMMON STOCKS (Continued)Health Care Technology (Continued)
1,687 Change Healthcare, Inc. (a) . . . . . . . . . . . . . . . . . . . . . . $ 37,2831,866 Computer Programs & Systems, Inc. . . . . . . . . . . . . . . 57,1001,968 Evolent Health, Inc. - Class A (a)(b) . . . . . . . . . . . . . . . 39,754
450 Health Catalyst, Inc. (a) . . . . . . . . . . . . . . . . . . . . . . . . . 21,0463,414 iCAD, Inc. (a) . . . . . . . . . . . . . . . . . . . . . . . . . . . . . . . . 72,4451,016 Inovalon Holdings, Inc. - Class A (a) . . . . . . . . . . . . . . 29,240
477 Inspire Medical Systems, Inc. (a) . . . . . . . . . . . . . . . . . 98,7346,097 NextGen Healthcare, Inc. (a) . . . . . . . . . . . . . . . . . . . . . 110,356
419 Omnicell, Inc. (a) . . . . . . . . . . . . . . . . . . . . . . . . . . . . . . 54,416775 OptimizeRx Corp. (a) . . . . . . . . . . . . . . . . . . . . . . . . . . 37,781503 Phreesia, Inc. (a) . . . . . . . . . . . . . . . . . . . . . . . . . . . . . . 26,206331 Schrodinger, Inc. (a)(b) . . . . . . . . . . . . . . . . . . . . . . . . . 25,252592 Simulations Plus, Inc. . . . . . . . . . . . . . . . . . . . . . . . . . . 37,438958 Vocera Communications, Inc. (a) . . . . . . . . . . . . . . . . . 36,845
745,833
Hotels, Restaurants & Leisure - 1.95%1,237 Aramark . . . . . . . . . . . . . . . . . . . . . . . . . . . . . . . . . . . . . 46,734
285 Bally’s Corp. (a) . . . . . . . . . . . . . . . . . . . . . . . . . . . . . . 18,51934 Biglari Holdings, Inc. - Class A (a) . . . . . . . . . . . . . . . . 22,968
327 Biglari Holdings, Inc. - Class B (a) . . . . . . . . . . . . . . . . 43,412731 BJ’s Restaurants, Inc. (a) . . . . . . . . . . . . . . . . . . . . . . . . 42,456
3,651 Bluegreen Vacations Corp. . . . . . . . . . . . . . . . . . . . . . . 39,3582,006 Bluegreen Vacations Holding Corp. (a) . . . . . . . . . . . . 37,1911,048 Boyd Gaming Corp. (a) . . . . . . . . . . . . . . . . . . . . . . . . . 61,790
729 Brinker International, Inc. (a) . . . . . . . . . . . . . . . . . . . . 51,8031,270 Caesars Entertainment, Inc. (a) . . . . . . . . . . . . . . . . . . . 111,0613,135 Callaway Golf Co. . . . . . . . . . . . . . . . . . . . . . . . . . . . . . 83,861
305 Cheesecake Factory, Inc. (a) . . . . . . . . . . . . . . . . . . . . . 17,846231 Churchill Downs, Inc. . . . . . . . . . . . . . . . . . . . . . . . . . . 52,534
1,016 Chuy’s Holdings, Inc. (a) . . . . . . . . . . . . . . . . . . . . . . . 45,0295,046 Del Taco Restaurants, Inc. . . . . . . . . . . . . . . . . . . . . . . . 48,341
210 Dine Brands Global, Inc. (a) . . . . . . . . . . . . . . . . . . . . . 18,9061,638 El Pollo Loco Holdings, Inc. (a) . . . . . . . . . . . . . . . . . . 26,4051,453 Everi Holdings, Inc. (a) . . . . . . . . . . . . . . . . . . . . . . . . . 20,502
996 Extended Stay America, Inc. . . . . . . . . . . . . . . . . . . . . . 19,6713,939 Fiesta Restaurant Group, Inc. (a)(b) . . . . . . . . . . . . . . . 49,592
785 GAN Ltd. (a) . . . . . . . . . . . . . . . . . . . . . . . . . . . . . . . . . 14,287477 Hilton Grand Vacations, Inc. (a) . . . . . . . . . . . . . . . . . . 17,883
3,100 International Game Technology PLC (a) . . . . . . . . . . . 49,755252 Jack in the Box, Inc. . . . . . . . . . . . . . . . . . . . . . . . . . . . 27,665503 Marriott Vacations Worldwide Corp. (a) . . . . . . . . . . . 87,613405 Monarch Casino & Resort, Inc. (a) . . . . . . . . . . . . . . . . 24,551267 Nathan’s Famous, Inc. . . . . . . . . . . . . . . . . . . . . . . . . . . 16,845686 Norwegian Cruise Line Holdings, Ltd. (a)(b) . . . . . . . . 18,927618 Papa John’s International, Inc. (b) . . . . . . . . . . . . . . . . . 54,780
1,491 Penn National Gaming, Inc. (a) . . . . . . . . . . . . . . . . . . . 156,3166,904 PlayAGS, Inc. (a) . . . . . . . . . . . . . . . . . . . . . . . . . . . . . 55,784
623 RCI Hospitality Holdings, Inc. . . . . . . . . . . . . . . . . . . . 39,6171,433 Scientific Games Corp. - Class A (a)(b) . . . . . . . . . . . . 55,199
354 SeaWorld Entertainment, Inc. (a) . . . . . . . . . . . . . . . . . 17,583192 Shake Shack, Inc. - Class A (a) . . . . . . . . . . . . . . . . . . . 21,652411 Six Flags Entertainment Corp. (a) . . . . . . . . . . . . . . . . . 19,099
16,049 Target Hospitality Corp. (a) . . . . . . . . . . . . . . . . . . . . . 40,283293 Texas Roadhouse, Inc. (a) . . . . . . . . . . . . . . . . . . . . . . . 28,110
1,114 The Wendy’s Co. . . . . . . . . . . . . . . . . . . . . . . . . . . . . . . 22,570409 Travel + Leisure Co. . . . . . . . . . . . . . . . . . . . . . . . . . . . 25,014193 Vail Resorts, Inc. (a) . . . . . . . . . . . . . . . . . . . . . . . . . . . 56,290614 Wingstop, Inc. . . . . . . . . . . . . . . . . . . . . . . . . . . . . . . . . 78,082
Number ofShares Value
Hotels, Restaurants & Leisure (Continued)260 Wyndham Hotels & Resorts Inc. . . . . . . . . . . . . . . . . . . $ 18,143
1,804,027
Household Durables - 2.61%1,900 Beazer Homes USA, Inc. (a) . . . . . . . . . . . . . . . . . . . . . 39,7484,771 Casper Sleep, Inc. (a) . . . . . . . . . . . . . . . . . . . . . . . . . . . 34,542
114 Cavco Industries, Inc. (a) . . . . . . . . . . . . . . . . . . . . . . . . 25,720692 Century Communities, Inc. (a) . . . . . . . . . . . . . . . . . . . 41,741
2,485 Ethan Allen Interiors, Inc. . . . . . . . . . . . . . . . . . . . . . . . 68,6116,318 GoPro, Inc. - Class A (a) . . . . . . . . . . . . . . . . . . . . . . . . 73,5422,156 Green Brick Partners, Inc. (a) . . . . . . . . . . . . . . . . . . . . 48,8981,654 Hamilton Beach Brands Holding Co. - Class A . . . . . . 29,987
358 Helen of Troy, Ltd. (a)(b) . . . . . . . . . . . . . . . . . . . . . . . 75,416690 Hooker Furniture Corp. . . . . . . . . . . . . . . . . . . . . . . . . . 25,157549 Installed Building Products, Inc. (b) . . . . . . . . . . . . . . . 60,873689 iRobot Corp. (a) . . . . . . . . . . . . . . . . . . . . . . . . . . . . . . . 84,182
1,517 KB Home . . . . . . . . . . . . . . . . . . . . . . . . . . . . . . . . . . . . 70,5861,375 La-Z-Boy, Inc. . . . . . . . . . . . . . . . . . . . . . . . . . . . . . . . . 58,410
716 Leggett & Platt, Inc. . . . . . . . . . . . . . . . . . . . . . . . . . . . 32,685233 LGI Homes, Inc. (a) . . . . . . . . . . . . . . . . . . . . . . . . . . . 34,789
2,883 Lifetime Brands, Inc. . . . . . . . . . . . . . . . . . . . . . . . . . . . 42,3511,726 Lovesac Co. (a) . . . . . . . . . . . . . . . . . . . . . . . . . . . . . . . 97,692
434 M.D.C Holdings, Inc. . . . . . . . . . . . . . . . . . . . . . . . . . . 25,780840 M/I Homes, Inc. (a) . . . . . . . . . . . . . . . . . . . . . . . . . . . . 49,619563 Meritage Homes Corp. (a) . . . . . . . . . . . . . . . . . . . . . . . 51,751485 Mohawk Industries, Inc. (a) . . . . . . . . . . . . . . . . . . . . . . 93,270
2,946 Newell Rubbermaid, Inc. . . . . . . . . . . . . . . . . . . . . . . . . 78,89440 NVR, Inc. (a) . . . . . . . . . . . . . . . . . . . . . . . . . . . . . . . . . 188,437
2,867 PulteGroup, Inc. . . . . . . . . . . . . . . . . . . . . . . . . . . . . . . 150,3462,913 Purple Innovation, Inc. (a) . . . . . . . . . . . . . . . . . . . . . . . 92,1961,203 Skyline Champion Corp. (a) . . . . . . . . . . . . . . . . . . . . . 54,4482,422 Sonos, Inc. (a) . . . . . . . . . . . . . . . . . . . . . . . . . . . . . . . . 90,7521,783 Taylor Morrison Home Corp. - Class A (a) . . . . . . . . . 54,9343,064 Tempur Sealy International, Inc. . . . . . . . . . . . . . . . . . . 112,0201,872 Toll Brothers, Inc. . . . . . . . . . . . . . . . . . . . . . . . . . . . . . 106,199
329 TopBuild Corp. (a) . . . . . . . . . . . . . . . . . . . . . . . . . . . . 68,9032,754 TRI Pointe Group, Inc. (a) . . . . . . . . . . . . . . . . . . . . . . . 56,0714,591 Tupperware Brands Corp. (a) . . . . . . . . . . . . . . . . . . . . 121,2482,153 Turtle Beach Corp. (a) . . . . . . . . . . . . . . . . . . . . . . . . . . 57,421
400 Universal Electronics, Inc. (a) . . . . . . . . . . . . . . . . . . . . 21,988
2,419,207
Household Products - 0.32%537 Central Garden & Pet Co. (a) . . . . . . . . . . . . . . . . . . . . 31,151890 Central Garden & Pet Co. - Class A (a) . . . . . . . . . . . . 46,182656 Oil-Dri Corp. of America . . . . . . . . . . . . . . . . . . . . . . . 22,593747 Spectrum Brands Holdings, Inc. . . . . . . . . . . . . . . . . . . 63,495438 WD-40 Co. . . . . . . . . . . . . . . . . . . . . . . . . . . . . . . . . . . 134,107
297,528
Independent Power and Renewable ElectricityProducers - 0.60%
21,080 Atlantic Power Corp. (a) . . . . . . . . . . . . . . . . . . . . . . . . 60,9211,367 Brookfield Renewable Corp. - Class A . . . . . . . . . . . . . 63,9762,339 Clearway Energy, Inc. - Class A . . . . . . . . . . . . . . . . . . 62,0072,842 Clearway Energy, Inc. - Class C . . . . . . . . . . . . . . . . . . 79,9743,648 NRG Energy, Inc. . . . . . . . . . . . . . . . . . . . . . . . . . . . . . 137,639
575 Sunnova Energy International, Inc. (a) . . . . . . . . . . . . . 23,4717,317 Vistra Energy Corp. . . . . . . . . . . . . . . . . . . . . . . . . . . . . 129,365
557,353
See notes to financial statements.
56

GuideMark® Small/Mid Cap Core FundSCHEDULE OF INVESTMENTS (Continued)March 31, 2021
Number ofShares Value
COMMON STOCKS (Continued)Industrial Conglomerates - 0.10%
535 Carlisle Companies, Inc. . . . . . . . . . . . . . . . . . . . . . . . . $ 88,050
Insurance - 2.28%81 Alleghany Corp. (a) . . . . . . . . . . . . . . . . . . . . . . . . . . . . 50,729
2,136 American Equity Investment Life Holding Co. (b) . . . . 67,348733 American Financial Group, Inc. . . . . . . . . . . . . . . . . . . 83,635245 American National Group, Inc. . . . . . . . . . . . . . . . . . . . 26,428619 AMERISAFE, Inc. . . . . . . . . . . . . . . . . . . . . . . . . . . . . 39,616427 Assurant, Inc. . . . . . . . . . . . . . . . . . . . . . . . . . . . . . . . . . 60,536
1,105 Assured Guaranty, Ltd. . . . . . . . . . . . . . . . . . . . . . . . . . 46,719642 Athene Holding, Ltd. - Class A (a) . . . . . . . . . . . . . . . . 32,357342 Axis Capital Holdings, Ltd. . . . . . . . . . . . . . . . . . . . . . . 16,953
3,370 Brown & Brown, Inc. . . . . . . . . . . . . . . . . . . . . . . . . . . 154,0431,532 CNO Financial Group, Inc. . . . . . . . . . . . . . . . . . . . . . . 37,212
662 Employers Holdings, Inc. . . . . . . . . . . . . . . . . . . . . . . . 28,506159 Enstar Group Ltd. (a) . . . . . . . . . . . . . . . . . . . . . . . . . . . 39,230419 Erie Indemnity Co. - Class A (b) . . . . . . . . . . . . . . . . . . 92,561249 Everest Re Group, Ltd. . . . . . . . . . . . . . . . . . . . . . . . . . 61,705461 FBL Financial Group, Inc. - Class A . . . . . . . . . . . . . . . 25,779
1,905 First American Financial Corp. . . . . . . . . . . . . . . . . . . . 107,9186,765 Genworth Financial, Inc. - Class A (a) . . . . . . . . . . . . . 22,460
969 Globe Life, Inc. . . . . . . . . . . . . . . . . . . . . . . . . . . . . . . . 93,634211 Goosehead Insurance, Inc. - Class A . . . . . . . . . . . . . . . 22,615424 HCI Group, Inc. . . . . . . . . . . . . . . . . . . . . . . . . . . . . . . . 32,572600 Horace Mann Educators Corp. . . . . . . . . . . . . . . . . . . . 25,926124 Investors Title Co. . . . . . . . . . . . . . . . . . . . . . . . . . . . . . 20,584826 Kemper Corp. . . . . . . . . . . . . . . . . . . . . . . . . . . . . . . . . 65,849338 Kinsale Capital Group, Inc. . . . . . . . . . . . . . . . . . . . . . . 55,702560 Mercury General Corp. . . . . . . . . . . . . . . . . . . . . . . . . . 34,05485 National Western Life Group, Inc. - Class A . . . . . . . . 21,165
2,234 Old Republic International Corp. . . . . . . . . . . . . . . . . . 48,791626 Primerica, Inc. . . . . . . . . . . . . . . . . . . . . . . . . . . . . . . . . 92,535476 Reinsurance Group of America, Inc. . . . . . . . . . . . . . . . 60,000623 RenaissanceRe Holdings, Ltd. . . . . . . . . . . . . . . . . . . . . 99,836294 RLI Corp. (b) . . . . . . . . . . . . . . . . . . . . . . . . . . . . . . . . . 32,802215 Safety Insurance Group, Inc. . . . . . . . . . . . . . . . . . . . . . 18,114
3,127 Security National Financial Corp. - Class A (a) . . . . . . 29,237612 Selective Insurance Group, Inc. . . . . . . . . . . . . . . . . . . . 44,394507 Stewart Information Services Corp. . . . . . . . . . . . . . . . 26,379633 The Hanover Insurance Group, Inc. . . . . . . . . . . . . . . . 81,948
1,058 Trean Insurance Group, Inc. (a) . . . . . . . . . . . . . . . . . . 17,0872,048 Unum Group . . . . . . . . . . . . . . . . . . . . . . . . . . . . . . . . . 56,9961,540 W.R. Berkley Corp. . . . . . . . . . . . . . . . . . . . . . . . . . . . . 116,039
23 White Mountains Insurance Group, Ltd. . . . . . . . . . . . . 25,643
2,115,637
Interactive Media & Services - 0.67%1,727 Cargurus, Inc. (a) . . . . . . . . . . . . . . . . . . . . . . . . . . . . . . 41,1544,373 Cars.com, Inc. (a) . . . . . . . . . . . . . . . . . . . . . . . . . . . . . 56,6749,148 DHI Group, Inc. (a) . . . . . . . . . . . . . . . . . . . . . . . . . . . . 30,6461,970 EverQuote, Inc. - Class A (a) . . . . . . . . . . . . . . . . . . . . 71,4911,981 QuinStreet, Inc. (a) . . . . . . . . . . . . . . . . . . . . . . . . . . . . 40,2141,536 TripAdvisor, Inc. - Class A (a) . . . . . . . . . . . . . . . . . . . 82,622
12,005 TrueCar, Inc. (a) . . . . . . . . . . . . . . . . . . . . . . . . . . . . . . 57,4441,972 Yelp, Inc. - Class A (a) . . . . . . . . . . . . . . . . . . . . . . . . . 76,908
442 Zillow Group, Inc. - Class A (a)(b) . . . . . . . . . . . . . . . . 58,070840 Zillow Group, Inc. - Class C (a) . . . . . . . . . . . . . . . . . . 108,898
624,121
Number ofShares Value
Internet & Direct Marketing Retail - 1.41%3,202 1-800-Flowers.com, Inc. - Class A (a) . . . . . . . . . . . . . $ 88,4074,468 CarParts.com, Inc. (a)(b) . . . . . . . . . . . . . . . . . . . . . . . . 63,8034,411 Duluth Holdings, Inc. - Class B (a) . . . . . . . . . . . . . . . . 74,7221,482 Etsy, Inc. (a) . . . . . . . . . . . . . . . . . . . . . . . . . . . . . . . . . 298,8751,645 Groupon, Inc. (a) . . . . . . . . . . . . . . . . . . . . . . . . . . . . . . 83,147
558 GrubHub, Inc. (a)(b) . . . . . . . . . . . . . . . . . . . . . . . . . . . 33,4802,840 Lands’ End, Inc. (a) . . . . . . . . . . . . . . . . . . . . . . . . . . . . 70,460
665 Magnite, Inc. (a) . . . . . . . . . . . . . . . . . . . . . . . . . . . . . . 27,6711,348 PetMed Express, Inc. . . . . . . . . . . . . . . . . . . . . . . . . . . . 47,4161,231 Quotient Technology, Inc. (a) . . . . . . . . . . . . . . . . . . . . 20,1154,874 Qurate Retail, Inc. - Series A . . . . . . . . . . . . . . . . . . . . . 57,318
931 Shutterstock, Inc. . . . . . . . . . . . . . . . . . . . . . . . . . . . . . . 82,896575 Stamps.com, Inc. (a) . . . . . . . . . . . . . . . . . . . . . . . . . . . 114,718
1,901 Stitch Fix, Inc. - Class A (a) . . . . . . . . . . . . . . . . . . . . . 94,1762,011 The RealReal, Inc. (a)(b) . . . . . . . . . . . . . . . . . . . . . . . . 45,509
34,443 Waitr Holdings, Inc. (a)(b) . . . . . . . . . . . . . . . . . . . . . . 100,918
1,303,631
IT Services - 3.18%1,038 Alliance Data Systems Corp. . . . . . . . . . . . . . . . . . . . . . 116,3491,662 Amdocs, Ltd. . . . . . . . . . . . . . . . . . . . . . . . . . . . . . . . . . 116,5891,843 Benefitfocus, Inc. (a) . . . . . . . . . . . . . . . . . . . . . . . . . . . 25,4521,286 Black Knight, Inc. (a) . . . . . . . . . . . . . . . . . . . . . . . . . . 95,151
239 BM Technologies, Inc. (a) . . . . . . . . . . . . . . . . . . . . . . . 2,7842,269 Booz Allen Hamilton Holding Corp. - Class A . . . . . . . 182,7233,529 Brightcove, Inc. (a) . . . . . . . . . . . . . . . . . . . . . . . . . . . . 71,004
529 CACI International, Inc. - Class A (a) . . . . . . . . . . . . . . 130,4831,873 Cardtronics PLC - Class A (a) . . . . . . . . . . . . . . . . . . . . 72,672
516 Cass Information Systems, Inc. . . . . . . . . . . . . . . . . . . . 23,875583 Concentrix Corp. (a) . . . . . . . . . . . . . . . . . . . . . . . . . . . 87,287
13,016 Conduent, Inc. (a) . . . . . . . . . . . . . . . . . . . . . . . . . . . . . 86,687898 CoreLogic, Inc. . . . . . . . . . . . . . . . . . . . . . . . . . . . . . . . 71,167
1,294 CSG Systems International, Inc. . . . . . . . . . . . . . . . . . . 58,0883,911 DXC Technology Co. (a) . . . . . . . . . . . . . . . . . . . . . . . 122,258
314 Euronet Worldwide, Inc. (a) . . . . . . . . . . . . . . . . . . . . . 43,4261,046 EVERTEC, Inc. . . . . . . . . . . . . . . . . . . . . . . . . . . . . . . . 38,932
644 ExlService Holdings, Inc. (a) . . . . . . . . . . . . . . . . . . . . 58,063893 Fastly, Inc. - Class A (a)(b) . . . . . . . . . . . . . . . . . . . . . . 60,081
2,720 Genpact, Ltd. . . . . . . . . . . . . . . . . . . . . . . . . . . . . . . . . . 116,4701,822 Gogo, Inc. (a) . . . . . . . . . . . . . . . . . . . . . . . . . . . . . . . . . 17,6001,144 Grid Dynamics Holdings, Inc. (a) . . . . . . . . . . . . . . . . . 18,224
29,973 GTT Communications, Inc. (a)(b) . . . . . . . . . . . . . . . . . 54,851755 I3 Verticals, Inc. - Class A (a) . . . . . . . . . . . . . . . . . . . . 23,499
2,322 IBEX Holdings, Ltd. (a) . . . . . . . . . . . . . . . . . . . . . . . . 51,08414,832 Information Services Group, Inc. (a) . . . . . . . . . . . . . . . 65,2612,412 International Money Express, Inc. (a) . . . . . . . . . . . . . . 36,2046,579 Limelight Networks, Inc. (a) . . . . . . . . . . . . . . . . . . . . . 23,4871,057 Liquidity Services, Inc. (a) . . . . . . . . . . . . . . . . . . . . . . 19,639
483 LiveRamp Holdings, Inc. (a) . . . . . . . . . . . . . . . . . . . . . 25,058203 ManTech International Corp. - Class A . . . . . . . . . . . . 17,651
1,785 Maximus, Inc. . . . . . . . . . . . . . . . . . . . . . . . . . . . . . . . . 158,936459 MongoDB, Inc. (a) . . . . . . . . . . . . . . . . . . . . . . . . . . . . 122,750
2,271 NIC, Inc. . . . . . . . . . . . . . . . . . . . . . . . . . . . . . . . . . . . . 77,0551,704 Perficient, Inc. (a) . . . . . . . . . . . . . . . . . . . . . . . . . . . . . 100,0593,120 Perspecta, Inc. . . . . . . . . . . . . . . . . . . . . . . . . . . . . . . . . 90,6364,780 PFSweb, Inc. (a) . . . . . . . . . . . . . . . . . . . . . . . . . . . . . . 32,2652,388 Priority Technology Holdings, Inc. (a) . . . . . . . . . . . . . 16,573
458 Science Applications International Corp. . . . . . . . . . . . 38,28415,694 ServiceSource International, Inc. (a) . . . . . . . . . . . . . . . 23,0701,603 StoneCo, Ltd. - Class A (a) . . . . . . . . . . . . . . . . . . . . . . 98,136
See notes to financial statements.
57

GuideMark® Small/Mid Cap Core FundSCHEDULE OF INVESTMENTS (Continued)March 31, 2021
Number ofShares Value
COMMON STOCKS (Continued)IT Services (Continued)
3,658 The Hackett Group, Inc. . . . . . . . . . . . . . . . . . . . . . . . . $ 59,955840 TTEC Holdings, Inc. . . . . . . . . . . . . . . . . . . . . . . . . . . . 84,378722 Unisys Corp. (a) . . . . . . . . . . . . . . . . . . . . . . . . . . . . . . 18,353430 WEX, Inc. (a) . . . . . . . . . . . . . . . . . . . . . . . . . . . . . . . . 89,965
2,942,514
Leisure Products - 1.28%1,131 Acushnet Holdings Corp. . . . . . . . . . . . . . . . . . . . . . . . 46,7441,036 American Outdoor Brands, Inc. (a) . . . . . . . . . . . . . . . . 26,107
963 Brunswick Corp. . . . . . . . . . . . . . . . . . . . . . . . . . . . . . . 91,8411,230 Clarus Corp. . . . . . . . . . . . . . . . . . . . . . . . . . . . . . . . . . . 20,972
876 Escalade, Inc. . . . . . . . . . . . . . . . . . . . . . . . . . . . . . . . . . 18,317509 Johnson Outdoors, Inc. - Class A . . . . . . . . . . . . . . . . . 72,660633 Malibu Boats, Inc. - Class A (a) . . . . . . . . . . . . . . . . . . 50,437
1,817 Marine Products Corp. . . . . . . . . . . . . . . . . . . . . . . . . . . 29,5632,894 MasterCraft Boat Holdings, Inc. (a) . . . . . . . . . . . . . . . 76,9524,397 Mattel, Inc. (a) . . . . . . . . . . . . . . . . . . . . . . . . . . . . . . . . 87,5884,591 Nautilus, Inc. (a)(b) . . . . . . . . . . . . . . . . . . . . . . . . . . . . 71,803
852 Polaris Industries, Inc. . . . . . . . . . . . . . . . . . . . . . . . . . . 113,742611 Pool Corp. . . . . . . . . . . . . . . . . . . . . . . . . . . . . . . . . . . . 210,942
3,283 Smith & Wesson Brands, Inc. . . . . . . . . . . . . . . . . . . . . 57,288635 Sturm, Ruger & Co., Inc. . . . . . . . . . . . . . . . . . . . . . . . . 41,955
2,090 Vista Outdoor, Inc. (a) . . . . . . . . . . . . . . . . . . . . . . . . . . 67,0261,459 YETI Holdings, Inc. (a) . . . . . . . . . . . . . . . . . . . . . . . . . 105,354
1,189,291
Life Sciences Tools & Services - 1.59%656 10X Genomics, Inc. - Class A (a) . . . . . . . . . . . . . . . . . 118,736663 Adaptive Biotechnologies Corp. (a) . . . . . . . . . . . . . . . 26,692349 Bio-Techne Corp. . . . . . . . . . . . . . . . . . . . . . . . . . . . . . 133,294
1,583 Bruker Corp. . . . . . . . . . . . . . . . . . . . . . . . . . . . . . . . . . 101,755614 Charles River Laboratories International, Inc. (a) . . . . . 177,956
6,109 ChromaDex Corp. (a) . . . . . . . . . . . . . . . . . . . . . . . . . . 57,05822,010 Harvard Bioscience, Inc. (a) . . . . . . . . . . . . . . . . . . . . . 120,1751,706 Luminex Corp. . . . . . . . . . . . . . . . . . . . . . . . . . . . . . . . . 54,421
517 Medpace holdings, Inc. (a) . . . . . . . . . . . . . . . . . . . . . . 84,814778 NanoString Technologies, Inc. (a) . . . . . . . . . . . . . . . . . 51,122
1,170 NeoGenomics, Inc. (a) . . . . . . . . . . . . . . . . . . . . . . . . . . 56,4291,777 Pacific Biosciences of California, Inc. (a) . . . . . . . . . . . 59,192
981 Personalis, Inc. (a) . . . . . . . . . . . . . . . . . . . . . . . . . . . . . 24,142996 PPD, Inc. (a) . . . . . . . . . . . . . . . . . . . . . . . . . . . . . . . . . 37,689791 PRA Health Sciences, Inc. (a) . . . . . . . . . . . . . . . . . . . . 121,284
2,299 QIAGEN NV (a)(b) . . . . . . . . . . . . . . . . . . . . . . . . . . . . 111,938426 Quanterix Corp. (a) . . . . . . . . . . . . . . . . . . . . . . . . . . . . 24,908
1,463 Syneos Health, Inc. (a) . . . . . . . . . . . . . . . . . . . . . . . . . 110,969
1,472,574
Machinery - 3.20%696 AGCO Corp. . . . . . . . . . . . . . . . . . . . . . . . . . . . . . . . . . 99,980225 Alamo Group, Inc. . . . . . . . . . . . . . . . . . . . . . . . . . . . . . 35,134270 Albany International Corp. - Class A (b) . . . . . . . . . . . 22,537977 Allison Transmission Holdings, Inc. . . . . . . . . . . . . . . . 39,891
1,361 Altra Industrial Motion Corp. . . . . . . . . . . . . . . . . . . . . 75,291506 Astec Industries, Inc. . . . . . . . . . . . . . . . . . . . . . . . . . . . 38,163525 Badger Meter, Inc. . . . . . . . . . . . . . . . . . . . . . . . . . . . . . 48,862583 Barnes Group, Inc. . . . . . . . . . . . . . . . . . . . . . . . . . . . . . 28,882
1,214 Blue Bird Corp. (a) . . . . . . . . . . . . . . . . . . . . . . . . . . . . 30,386423 Chart Industries, Inc. (a) . . . . . . . . . . . . . . . . . . . . . . . . 60,214763 Colfax Corp. (a) . . . . . . . . . . . . . . . . . . . . . . . . . . . . . . . 33,427617 Columbus McKinnon Corp. . . . . . . . . . . . . . . . . . . . . . 32,553
Number ofShares Value
Machinery (Continued)406 Crane Co. . . . . . . . . . . . . . . . . . . . . . . . . . . . . . . . . . . . . $ 38,127646 DMC Global, Inc. . . . . . . . . . . . . . . . . . . . . . . . . . . . . . 35,052
1,525 Donaldson Co., Inc. . . . . . . . . . . . . . . . . . . . . . . . . . . . . 88,6942,190 Energy Recovery, Inc. (a) . . . . . . . . . . . . . . . . . . . . . . . 40,165
208 EnPro Industries, Inc. . . . . . . . . . . . . . . . . . . . . . . . . . . 17,7361,477 Evoqua Water Technologies Corp. (a) . . . . . . . . . . . . . 38,845
753 Federal Signal Corp. . . . . . . . . . . . . . . . . . . . . . . . . . . . 28,840743 Flowserve Corp. (b) . . . . . . . . . . . . . . . . . . . . . . . . . . . . 28,836
1,670 Gates Industrial Corp PLC (a) . . . . . . . . . . . . . . . . . . . . 26,7032,035 Graco, Inc. . . . . . . . . . . . . . . . . . . . . . . . . . . . . . . . . . . . 145,747
357 Hyster-Yale Materials Handling, Inc. . . . . . . . . . . . . . . 31,102640 ITT, Inc. . . . . . . . . . . . . . . . . . . . . . . . . . . . . . . . . . . . . . 58,182449 John Bean Technologies Corp. . . . . . . . . . . . . . . . . . . . 59,870241 Kadant, Inc. . . . . . . . . . . . . . . . . . . . . . . . . . . . . . . . . . . 44,587781 Lincoln Electric Holdings, Inc. . . . . . . . . . . . . . . . . . . . 96,016154 Lindsay Corp. . . . . . . . . . . . . . . . . . . . . . . . . . . . . . . . . 25,659
1,944 Lydall, Inc. (a) . . . . . . . . . . . . . . . . . . . . . . . . . . . . . . . . 65,5911,403 Meritor, Inc. (a) . . . . . . . . . . . . . . . . . . . . . . . . . . . . . . . 41,276
710 Mueller Industries, Inc. . . . . . . . . . . . . . . . . . . . . . . . . . 29,3591,838 Mueller Water Products, Inc. - Class A . . . . . . . . . . . . . 25,530
446 Navistar International Corp. (a) . . . . . . . . . . . . . . . . . . . 19,637617 Nordson Corp. . . . . . . . . . . . . . . . . . . . . . . . . . . . . . . . . 122,586577 Omega Flex, Inc. . . . . . . . . . . . . . . . . . . . . . . . . . . . . . . 91,097697 Oshkosh Corp. . . . . . . . . . . . . . . . . . . . . . . . . . . . . . . . . 82,706968 Park-Ohio Holdings Corp. . . . . . . . . . . . . . . . . . . . . . . . 30,482
1,549 Pentair PLC . . . . . . . . . . . . . . . . . . . . . . . . . . . . . . . . . . 96,534376 Proto Labs, Inc. (a) . . . . . . . . . . . . . . . . . . . . . . . . . . . . 45,778
2,677 REV Group, Inc. . . . . . . . . . . . . . . . . . . . . . . . . . . . . . . 51,291452 Rexnord Corp. . . . . . . . . . . . . . . . . . . . . . . . . . . . . . . . . 21,285748 Snap-on, Inc. . . . . . . . . . . . . . . . . . . . . . . . . . . . . . . . . . 172,594414 SPX Corp. (a) . . . . . . . . . . . . . . . . . . . . . . . . . . . . . . . . 24,124586 SPX FLOW, Inc. . . . . . . . . . . . . . . . . . . . . . . . . . . . . . . 37,111456 Tennant Co. . . . . . . . . . . . . . . . . . . . . . . . . . . . . . . . . . . 36,430
1,043 Terex Corp. . . . . . . . . . . . . . . . . . . . . . . . . . . . . . . . . . . 48,051929 The Eastern Co. . . . . . . . . . . . . . . . . . . . . . . . . . . . . . . . 24,897603 The ExOne Company (a) . . . . . . . . . . . . . . . . . . . . . . . . 18,910615 The Greenbrier Companies, Inc. . . . . . . . . . . . . . . . . . . 29,040350 The Middleby Corp. (a)(b) . . . . . . . . . . . . . . . . . . . . . . 58,012931 The Shyft Group Inc . . . . . . . . . . . . . . . . . . . . . . . . . . . 34,633859 The Timken Co. . . . . . . . . . . . . . . . . . . . . . . . . . . . . . . . 69,725
1,416 The Toro Co. . . . . . . . . . . . . . . . . . . . . . . . . . . . . . . . . . 146,0461,035 TriMas Corp. (a) . . . . . . . . . . . . . . . . . . . . . . . . . . . . . . 31,3811,020 Trinity Industries, Inc. . . . . . . . . . . . . . . . . . . . . . . . . . . 29,060
204 Valmont Industries, Inc. . . . . . . . . . . . . . . . . . . . . . . . . 48,4852,327 Wabash National Corp. . . . . . . . . . . . . . . . . . . . . . . . . . 43,748
361 Watts Water Technologies, Inc. - Class A . . . . . . . . . . 42,890
2,967,770
Marine - 0.08%3,394 Costamere, Inc. . . . . . . . . . . . . . . . . . . . . . . . . . . . . . . . 32,650
396 Kirby Corp. (a) . . . . . . . . . . . . . . . . . . . . . . . . . . . . . . . 23,8715,837 Pangaea Logistics Solutions Ltd. . . . . . . . . . . . . . . . . . 18,445
74,966
Media - 1.19%722 AMC Networks, Inc. - Class A (a)(b) . . . . . . . . . . . . . . 38,382505 Boston Omaha Corp. - Class A (a) . . . . . . . . . . . . . . . . 14,92829 Cable One, Inc. . . . . . . . . . . . . . . . . . . . . . . . . . . . . . . . 53,022
397 Cardlytics, Inc. (a) . . . . . . . . . . . . . . . . . . . . . . . . . . . . . 43,55112,915 Entercom Communications Corp. - Class A (a) . . . . . . 67,8048,066 Fluent, Inc. (a) . . . . . . . . . . . . . . . . . . . . . . . . . . . . . . . . 33,071
See notes to financial statements.
58

GuideMark® Small/Mid Cap Core FundSCHEDULE OF INVESTMENTS (Continued)March 31, 2021
Number ofShares Value
COMMON STOCKS (Continued)Media (Continued)
3,444 Gannett Co, Inc. (a) . . . . . . . . . . . . . . . . . . . . . . . . . . . . $ 18,5291,370 Gray Television, Inc. . . . . . . . . . . . . . . . . . . . . . . . . . . . 25,2082,219 iHeartMedia, Inc. - Class A (a)(b) . . . . . . . . . . . . . . . . . 40,275
870 John Wiley & Sons, Inc. - Class A . . . . . . . . . . . . . . . . 47,1541,853 Liberty Latin America Ltd. - Class A (a) . . . . . . . . . . . 23,7742,759 Liberty Latin America, Ltd. - Class C (a)(b) . . . . . . . . . 35,8121,625 Meredith Corp. (a) . . . . . . . . . . . . . . . . . . . . . . . . . . . . . 48,3921,733 MSG Networks, Inc. - Class A (a)(b) . . . . . . . . . . . . . . 26,0643,711 News Corp. - Class A . . . . . . . . . . . . . . . . . . . . . . . . . . 94,371
990 News Corp. - Class B . . . . . . . . . . . . . . . . . . . . . . . . . . 23,225468 Nexstar Media Group, Inc. - Class A . . . . . . . . . . . . . . 65,721
1,227 Sinclair Broadcast Group, Inc. - Class A (b) . . . . . . . . . 35,902726 TechTarget, Inc. (a) . . . . . . . . . . . . . . . . . . . . . . . . . . . . 50,421
2,414 TEGNA, Inc. . . . . . . . . . . . . . . . . . . . . . . . . . . . . . . . . . 45,456915 The E.W. Scripps Co. - Class A . . . . . . . . . . . . . . . . . . 17,632
2,701 The Interpublic Group of Companies, Inc. . . . . . . . . . . 78,8692,099 The New York Times Co. - Class A . . . . . . . . . . . . . . . 106,2511,051 Tribune Publishing Co. (a) . . . . . . . . . . . . . . . . . . . . . . 18,9071,007 Value Line, Inc. . . . . . . . . . . . . . . . . . . . . . . . . . . . . . . . 28,3871,312 WideOpenWest, Inc. (a) . . . . . . . . . . . . . . . . . . . . . . . . 17,830
1,098,938
Metals & Mining - 1.22%2,495 Alcoa Corp. (a) . . . . . . . . . . . . . . . . . . . . . . . . . . . . . . . 81,0632,128 Allegheny Technologies, Inc. (a)(b) . . . . . . . . . . . . . . . 44,816
941 Arconic Corp. (a) . . . . . . . . . . . . . . . . . . . . . . . . . . . . . . 23,892467 Carpenter Technology Corp. . . . . . . . . . . . . . . . . . . . . . 19,217
2,355 Century Aluminum Co. (a) . . . . . . . . . . . . . . . . . . . . . . 41,5892,476 Cleveland-Cliffs, Inc. . . . . . . . . . . . . . . . . . . . . . . . . . . 49,7922,826 Coeur Mining, Inc. (a) . . . . . . . . . . . . . . . . . . . . . . . . . . 25,5191,823 Commercial Metals Co. . . . . . . . . . . . . . . . . . . . . . . . . . 56,221
503 Gibraltar Industries, Inc. (a) . . . . . . . . . . . . . . . . . . . . . 46,0305,106 Hecla Mining Co. . . . . . . . . . . . . . . . . . . . . . . . . . . . . . 29,053
262 Kaiser Aluminum Corp. . . . . . . . . . . . . . . . . . . . . . . . . 28,951540 Materion Corp. . . . . . . . . . . . . . . . . . . . . . . . . . . . . . . . 35,770
2,390 Olympic Steel, Inc. . . . . . . . . . . . . . . . . . . . . . . . . . . . . 70,385947 Reliance Steel & Aluminum Co. . . . . . . . . . . . . . . . . . . 144,219361 Royal Gold, Inc. . . . . . . . . . . . . . . . . . . . . . . . . . . . . . . 38,851
4,713 Ryerson Holding Corp. (a) . . . . . . . . . . . . . . . . . . . . . . 80,3091,101 Schnitzer Steel Industries, Inc. - Class A . . . . . . . . . . . 46,0111,602 Steel Dynamics, Inc. . . . . . . . . . . . . . . . . . . . . . . . . . . . 81,3186,980 SunCoke Energy, Inc. . . . . . . . . . . . . . . . . . . . . . . . . . . 48,9304,206 TimkenSteel Corp. (a) . . . . . . . . . . . . . . . . . . . . . . . . . . 49,420
998 United States Steel Corp. . . . . . . . . . . . . . . . . . . . . . . . . 26,1181,872 Warrior Met Coal, Inc. . . . . . . . . . . . . . . . . . . . . . . . . . 32,067
483 Worthington Industries, Inc. . . . . . . . . . . . . . . . . . . . . . 32,404
1,131,945
Multiline Retail - 0.66%1,391 Big Lots, Inc. . . . . . . . . . . . . . . . . . . . . . . . . . . . . . . . . . 95,0051,118 Dillard’s, Inc. - Class A (b) . . . . . . . . . . . . . . . . . . . . . . 107,9652,778 Kohl’s Corp. . . . . . . . . . . . . . . . . . . . . . . . . . . . . . . . . . 165,5978,172 Macy’s, Inc. (a) . . . . . . . . . . . . . . . . . . . . . . . . . . . . . . . 132,3051,569 Nordstrom, Inc. (a)(b) . . . . . . . . . . . . . . . . . . . . . . . . . . 59,418
645 Ollie’s Bargain Outlet Holdings, Inc. (a)(b) . . . . . . . . . 56,115
616,405
Multi-Utilities - 0.09%2,100 MDU Resources Group, Inc. . . . . . . . . . . . . . . . . . . . . . 66,381
Number ofShares Value
Multi-Utilities (Continued)326 NorthWestern Corp. . . . . . . . . . . . . . . . . . . . . . . . . . . . $ 21,255
87,636
Oil, Gas & Consumable Fuels - 0.97%1,826 Amyris, Inc. (a) . . . . . . . . . . . . . . . . . . . . . . . . . . . . . . . 34,8772,675 Antero Midstream Corp. . . . . . . . . . . . . . . . . . . . . . . . . 24,1553,141 Antero Resources Corp. (a)(b) . . . . . . . . . . . . . . . . . . . 32,0382,028 APA Corp. . . . . . . . . . . . . . . . . . . . . . . . . . . . . . . . . . . . 36,301
491 Cimarex Energy Co. . . . . . . . . . . . . . . . . . . . . . . . . . . . 29,1601,334 Clean Energy Fuels Corp. (a) . . . . . . . . . . . . . . . . . . . . 18,3292,335 CNX Resources Corp. (a) . . . . . . . . . . . . . . . . . . . . . . . 34,3242,530 Devon Energy Corp. . . . . . . . . . . . . . . . . . . . . . . . . . . . 55,2804,203 DHT Holdings, Inc. . . . . . . . . . . . . . . . . . . . . . . . . . . . . 24,924
669 Diamondback Energy, Inc. . . . . . . . . . . . . . . . . . . . . . . 49,1652,527 Dorian LPG, Ltd. (a) . . . . . . . . . . . . . . . . . . . . . . . . . . . 33,1803,179 Energy Fuels, Inc. (a) . . . . . . . . . . . . . . . . . . . . . . . . . . 18,0572,390 Equitrans Midstream Corp. . . . . . . . . . . . . . . . . . . . . . . 19,502
759 Green Plains, Inc. (a) . . . . . . . . . . . . . . . . . . . . . . . . . . . 20,546583 HollyFrontier Corp. . . . . . . . . . . . . . . . . . . . . . . . . . . . . 20,860
1,239 International Seaways, Inc. (b) . . . . . . . . . . . . . . . . . . . 24,0124,225 Marathon Oil Corp. . . . . . . . . . . . . . . . . . . . . . . . . . . . . 45,123
836 Matador Resources Co. . . . . . . . . . . . . . . . . . . . . . . . . . 19,6046,499 Nordic American Tankers, Ltd. . . . . . . . . . . . . . . . . . . . 21,1221,454 Ovintiv, Inc. . . . . . . . . . . . . . . . . . . . . . . . . . . . . . . . . . . 34,634
581 PDC Energy, Inc. (a) . . . . . . . . . . . . . . . . . . . . . . . . . . . 19,9863,105 Range Resources Corp. (a) . . . . . . . . . . . . . . . . . . . . . . 32,0751,306 Renewable Energy Group, Inc. (a) . . . . . . . . . . . . . . . . 86,2481,159 SM Energy Co. . . . . . . . . . . . . . . . . . . . . . . . . . . . . . . . 18,9738,310 Southwestern Energy Co. (a) . . . . . . . . . . . . . . . . . . . . . 38,6421,437 Targa Resources Corp. . . . . . . . . . . . . . . . . . . . . . . . . . 45,6257,303 Uranium Energy Corp. (a) . . . . . . . . . . . . . . . . . . . . . . . 20,8871,111 World Fuel Services Corp. . . . . . . . . . . . . . . . . . . . . . . 39,107
896,736
Paper & Forest Products - 0.27%1,083 Boise Cascade Co. . . . . . . . . . . . . . . . . . . . . . . . . . . . . . 64,796
775 Clearwater Paper Corp. (a) . . . . . . . . . . . . . . . . . . . . . . 29,155749 Domtar Corp. . . . . . . . . . . . . . . . . . . . . . . . . . . . . . . . . . 27,676
1,385 Glatfelter Corp. . . . . . . . . . . . . . . . . . . . . . . . . . . . . . . . 23,7531,496 Louisiana-Pacific Corp. . . . . . . . . . . . . . . . . . . . . . . . . . 82,968
530 Schweitzer-Mauduit International, Inc. . . . . . . . . . . . . . 25,954
254,302
Personal Products - 0.78%1,684 BellRing Brands, Inc. - Class A (a) . . . . . . . . . . . . . . . . 39,759
994 Edgewell Personal Care Co. (b) . . . . . . . . . . . . . . . . . . 39,3631,430 elf Beauty, Inc. (a) . . . . . . . . . . . . . . . . . . . . . . . . . . . . . 38,3672,012 Herbalife Nutrition, Ltd. (a) . . . . . . . . . . . . . . . . . . . . . 89,252
537 Inter Parfums, Inc. . . . . . . . . . . . . . . . . . . . . . . . . . . . . . 38,0903,935 Lifevantage Corp. (a) . . . . . . . . . . . . . . . . . . . . . . . . . . . 36,792
546 Medifast, Inc. . . . . . . . . . . . . . . . . . . . . . . . . . . . . . . . . . 115,6544,728 Nature’s Sunshine Products, Inc. . . . . . . . . . . . . . . . . . . 94,3711,975 Nu Skin Enterprises, Inc. - Class A . . . . . . . . . . . . . . . . 104,4583,010 Revlon, Inc. - Class A (a)(b) . . . . . . . . . . . . . . . . . . . . . 37,113
929 USANA Health Sciences, Inc. (a) . . . . . . . . . . . . . . . . . 90,670
723,889
Pharmaceuticals - 2.25%12,151 Amneal Pharmaceuticals, Inc. (a) . . . . . . . . . . . . . . . . . 81,7761,014 Amphastar Pharmaceuticals, Inc. (a) . . . . . . . . . . . . . . . 18,5761,640 ANI Pharmaceuticals, Inc. (a) . . . . . . . . . . . . . . . . . . . . 59,270
See notes to financial statements.
59

GuideMark® Small/Mid Cap Core FundSCHEDULE OF INVESTMENTS (Continued)March 31, 2021
Number ofShares Value
COMMON STOCKS (Continued)Pharmaceuticals (Continued)
8,417 Aquestive Therapeutics, Inc. (a) . . . . . . . . . . . . . . . . . . $ 43,76814,411 BioDelivery Sciences International, Inc. (a) . . . . . . . . . 56,3471,356 Catalent, Inc. (a) . . . . . . . . . . . . . . . . . . . . . . . . . . . . . . 142,8002,866 Champions Oncology, Inc. (a) . . . . . . . . . . . . . . . . . . . . 32,3864,933 Collegium Pharmaceutical, Inc. (a) . . . . . . . . . . . . . . . . 116,9125,510 Corcept Therapeutics, Inc. (a)(b) . . . . . . . . . . . . . . . . . . 131,0832,040 CorMedix, Inc. (a) . . . . . . . . . . . . . . . . . . . . . . . . . . . . . 20,380
13,061 Durect Corp. (a) . . . . . . . . . . . . . . . . . . . . . . . . . . . . . . . 25,86114,660 Endo International PLC (a)(b) . . . . . . . . . . . . . . . . . . . . 108,6315,066 Harrow Health, Inc. (a) . . . . . . . . . . . . . . . . . . . . . . . . . 34,1953,348 Horizon Therapeutics PLC (a) . . . . . . . . . . . . . . . . . . . . 308,1505,750 Innoviva, Inc. (a) . . . . . . . . . . . . . . . . . . . . . . . . . . . . . . 68,7121,645 Intersect ENT, Inc. (a) . . . . . . . . . . . . . . . . . . . . . . . . . . 34,3481,054 Jazz Pharmaceuticals PLC (a) . . . . . . . . . . . . . . . . . . . . 173,246
11,735 Lannett Co., Inc. (a)(b) . . . . . . . . . . . . . . . . . . . . . . . . . 61,9612,178 Ligand Pharmaceuticals (a)(c)(d)(f) . . . . . . . . . . . . . . . 1,6339,183 MEI Pharma, Inc. (a) . . . . . . . . . . . . . . . . . . . . . . . . . . . 31,498
10,683 Milestone Scientific, Inc. (a) . . . . . . . . . . . . . . . . . . . . . 38,13813,676 Osmotica Pharmaceuticals, PLC (a)(b) . . . . . . . . . . . . . 44,584
676 Pacira Pharmaceuticals, Inc. (a) . . . . . . . . . . . . . . . . . . 47,3812,246 Perrigo Co. PLC . . . . . . . . . . . . . . . . . . . . . . . . . . . . . . 90,8961,033 Phibro Animal Health Corp. - Class A . . . . . . . . . . . . . 25,2051,992 Prestige Consumer Healthcare, Inc. (a) . . . . . . . . . . . . . 87,8072,673 SIGA Technologies, Inc. (a) . . . . . . . . . . . . . . . . . . . . . 17,3756,536 Strongbridge Biopharma PLC (a) . . . . . . . . . . . . . . . . . 18,0392,950 Supernus Pharmaceuticals, Inc. (a) . . . . . . . . . . . . . . . . 77,2316,468 Veru, Inc. (a) . . . . . . . . . . . . . . . . . . . . . . . . . . . . . . . . . 69,6934,192 Xeris Pharmaceuticals, Inc. (a) . . . . . . . . . . . . . . . . . . . 18,906
2,086,788
Professional Services - 1.39%3,347 Acacia Research Corp. (a) . . . . . . . . . . . . . . . . . . . . . . . 22,257
965 ASGN, Inc. (a) . . . . . . . . . . . . . . . . . . . . . . . . . . . . . . . . 92,1003,417 BGSF, Inc. . . . . . . . . . . . . . . . . . . . . . . . . . . . . . . . . . . . 47,838
732 CBIZ, Inc. (a) . . . . . . . . . . . . . . . . . . . . . . . . . . . . . . . . 23,907422 CRA International, Inc. . . . . . . . . . . . . . . . . . . . . . . . . . 31,498540 Forrester Research, Inc. (a) . . . . . . . . . . . . . . . . . . . . . . 22,939
1,236 Franklin Covey Co. (a) . . . . . . . . . . . . . . . . . . . . . . . . . 34,966504 FTI Consulting, Inc. (a) . . . . . . . . . . . . . . . . . . . . . . . . . 70,615
2,148 GP Strategies Corp. (a) . . . . . . . . . . . . . . . . . . . . . . . . . 37,483428 Huron Consulting Group, Inc. (a) . . . . . . . . . . . . . . . . . 21,563520 ICF International, Inc. . . . . . . . . . . . . . . . . . . . . . . . . . . 45,448705 Insperity, Inc. . . . . . . . . . . . . . . . . . . . . . . . . . . . . . . . . . 59,037
1,821 Kelly Services, Inc. - Class A (a) . . . . . . . . . . . . . . . . . 40,5541,318 Kforce, Inc. . . . . . . . . . . . . . . . . . . . . . . . . . . . . . . . . . . 70,645
507 Korn Ferry International . . . . . . . . . . . . . . . . . . . . . . . . 31,622903 ManpowerGroup, Inc. . . . . . . . . . . . . . . . . . . . . . . . . . . 89,307
1,726 Mastech Digital, Inc. (a) . . . . . . . . . . . . . . . . . . . . . . . . 30,3954,857 Mistras Group, Inc. (a) . . . . . . . . . . . . . . . . . . . . . . . . . 55,4181,828 Nielsen Holdings PLC (b) . . . . . . . . . . . . . . . . . . . . . . . 45,9741,610 Red Violet, Inc. (a)(b) . . . . . . . . . . . . . . . . . . . . . . . . . . 29,6562,235 Resources Connection, Inc. . . . . . . . . . . . . . . . . . . . . . . 30,2622,013 Robert Half International, Inc. . . . . . . . . . . . . . . . . . . . . 157,155
349 TriNet Group, Inc. (a) . . . . . . . . . . . . . . . . . . . . . . . . . . 27,2082,352 TrueBlue, Inc. (a) . . . . . . . . . . . . . . . . . . . . . . . . . . . . . 51,7911,365 Upwork, Inc. (a) . . . . . . . . . . . . . . . . . . . . . . . . . . . . . . 61,111
609 VSE Corp. . . . . . . . . . . . . . . . . . . . . . . . . . . . . . . . . . . . 24,055837 Willdan Group, Inc. (a) . . . . . . . . . . . . . . . . . . . . . . . . . 34,359
1,289,163
Number ofShares Value
Real Estate Management & Development - 0.70%4,149 Altisource Portfolio Solutions SA (a) . . . . . . . . . . . . . . $ 38,1292,380 eXp World Holdings, Inc. (a) . . . . . . . . . . . . . . . . . . . . 108,409
502 FRP Holdings, Inc. (a) . . . . . . . . . . . . . . . . . . . . . . . . . . 24,708378 Indus Realty Trust, Inc. . . . . . . . . . . . . . . . . . . . . . . . . . 22,741619 Jones Lang LaSalle, Inc. (a) . . . . . . . . . . . . . . . . . . . . . 110,826
1,593 Marcus & Millichap, Inc. (a) . . . . . . . . . . . . . . . . . . . . . 53,684419 Rafael Holdings, Inc. (a) . . . . . . . . . . . . . . . . . . . . . . . . 16,727580 RE/MAX Holdings, Inc. - Class A . . . . . . . . . . . . . . . . 22,846
7,456 Realogy Holdings Corp. (a) . . . . . . . . . . . . . . . . . . . . . . 112,809647 Redfin Corp. (a)(b) . . . . . . . . . . . . . . . . . . . . . . . . . . . . 43,084567 The RMR Group, Inc. - Class A . . . . . . . . . . . . . . . . . . 23,139938 The St. Joe Co. . . . . . . . . . . . . . . . . . . . . . . . . . . . . . . . 40,240
5,386 VirnetX Holding Corp. . . . . . . . . . . . . . . . . . . . . . . . . . 30,000
647,342
Road & Rail - 0.52%54 AMERCO . . . . . . . . . . . . . . . . . . . . . . . . . . . . . . . . . . . 33,080
1,081 ArcBest Corp. . . . . . . . . . . . . . . . . . . . . . . . . . . . . . . . . 76,070700 Avis Budget Group, Inc. (a) . . . . . . . . . . . . . . . . . . . . . 50,778
5,512 Daseke, Inc. (a) . . . . . . . . . . . . . . . . . . . . . . . . . . . . . . . 46,797958 Knight-Swift Transportation Holdings, Inc. . . . . . . . . . 46,070643 Landstar System, Inc. . . . . . . . . . . . . . . . . . . . . . . . . . . 106,134531 Ryder System, Inc. . . . . . . . . . . . . . . . . . . . . . . . . . . . . 40,170255 Saia, Inc. (a) . . . . . . . . . . . . . . . . . . . . . . . . . . . . . . . . . . 58,798447 Werner Enterprises, Inc. (b) . . . . . . . . . . . . . . . . . . . . . 21,085
478,982
Semiconductors & Semiconductor Equipment - 3.61%514 Advanced Energy Industries, Inc. . . . . . . . . . . . . . . . . . 56,113
1,115 Allegro MicroSystems, Inc. (a) . . . . . . . . . . . . . . . . . . . 28,2651,427 Alpha & Omega Semiconductor, Ltd. (a) . . . . . . . . . . . 46,663
346 Ambarella, Inc. (a) . . . . . . . . . . . . . . . . . . . . . . . . . . . . . 34,7354,307 Amkor Technology, Inc. . . . . . . . . . . . . . . . . . . . . . . . . 102,1191,645 Atomera, Inc. (a) . . . . . . . . . . . . . . . . . . . . . . . . . . . . . . 40,3031,199 Axcelis Technologies, Inc. (a) . . . . . . . . . . . . . . . . . . . . 49,2672,938 AXT, Inc. (a) . . . . . . . . . . . . . . . . . . . . . . . . . . . . . . . . . 34,257
856 Brooks Automation, Inc. . . . . . . . . . . . . . . . . . . . . . . . . 69,893561 CEVA, Inc. (a) . . . . . . . . . . . . . . . . . . . . . . . . . . . . . . . . 31,500
1,474 Cirrus Logic, Inc. (a) . . . . . . . . . . . . . . . . . . . . . . . . . . . 124,981168 CMC Materials, Inc. . . . . . . . . . . . . . . . . . . . . . . . . . . . 29,701
1,246 Cohu, Inc. (a) . . . . . . . . . . . . . . . . . . . . . . . . . . . . . . . . . 52,133543 Cree, Inc. (a)(b) . . . . . . . . . . . . . . . . . . . . . . . . . . . . . . . 58,715739 CyberOptics Corp. (a) . . . . . . . . . . . . . . . . . . . . . . . . . . 19,192957 Diodes, Inc. (a) . . . . . . . . . . . . . . . . . . . . . . . . . . . . . . . 76,407
1,364 DSP Group, Inc. (a) . . . . . . . . . . . . . . . . . . . . . . . . . . . . 19,4371,539 Entegris, Inc. . . . . . . . . . . . . . . . . . . . . . . . . . . . . . . . . . 172,060
663 First Solar, Inc. (a) . . . . . . . . . . . . . . . . . . . . . . . . . . . . . 57,8801,653 FormFactor, Inc. (a) . . . . . . . . . . . . . . . . . . . . . . . . . . . . 74,567
927 Ichor Holdings, Ltd. (a) . . . . . . . . . . . . . . . . . . . . . . . . . 49,873728 Impinj, Inc. (a) . . . . . . . . . . . . . . . . . . . . . . . . . . . . . . . . 41,401610 Inphi Corp. (a) . . . . . . . . . . . . . . . . . . . . . . . . . . . . . . . . 108,830
1,890 Lattice Semiconductor Corp. (a) . . . . . . . . . . . . . . . . . . 85,088612 MACOM Technology Solutions Holdings, Inc. (a) . . . 35,508
1,192 MaxLinear, Inc. - Class A (a) . . . . . . . . . . . . . . . . . . . . 40,623689 MKS Instruments, Inc. . . . . . . . . . . . . . . . . . . . . . . . . . 127,754759 Monolithic Power Systems, Inc. . . . . . . . . . . . . . . . . . . 268,087
7,724 NeoPhotonics Corp. (a) . . . . . . . . . . . . . . . . . . . . . . . . . 92,3025,271 ON Semiconductor Corp. (a) . . . . . . . . . . . . . . . . . . . . . 219,3261,115 Onto Innovation, Inc. (a) . . . . . . . . . . . . . . . . . . . . . . . . 73,2674,214 Photronics, Inc. (a) . . . . . . . . . . . . . . . . . . . . . . . . . . . . 54,192
10,085 Pixelworks, Inc. (a) . . . . . . . . . . . . . . . . . . . . . . . . . . . . 33,381
See notes to financial statements.
60

GuideMark® Small/Mid Cap Core FundSCHEDULE OF INVESTMENTS (Continued)March 31, 2021
Number ofShares Value
COMMON STOCKS (Continued)Semiconductors & Semiconductor Equipment (Continued)
963 Power Integrations, Inc. . . . . . . . . . . . . . . . . . . . . . . . . . $ 78,4652,869 Rambus, Inc. (a) . . . . . . . . . . . . . . . . . . . . . . . . . . . . . . 55,773
751 Semtech Corp. (a) . . . . . . . . . . . . . . . . . . . . . . . . . . . . . 51,819319 Silicon Laboratories, Inc. (a) . . . . . . . . . . . . . . . . . . . . . 45,001450 SiTime Corp. (a) . . . . . . . . . . . . . . . . . . . . . . . . . . . . . . 44,370
1,665 SMART Global Holdings, Inc. (a) . . . . . . . . . . . . . . . . 76,623427 SolarEdge Technologies, Inc. (a) . . . . . . . . . . . . . . . . . 122,737630 SunPower Corp. (a)(b) . . . . . . . . . . . . . . . . . . . . . . . . . 21,074
2,618 Teradyne, Inc. . . . . . . . . . . . . . . . . . . . . . . . . . . . . . . . . 318,5581,734 Ultra Clean Holdings, Inc. (a) . . . . . . . . . . . . . . . . . . . . 100,6411,191 Veeco Instruments, Inc. (a) . . . . . . . . . . . . . . . . . . . . . . 24,701
3,347,582
Software - 6.95%1,438 2U, Inc. (a)(b) . . . . . . . . . . . . . . . . . . . . . . . . . . . . . . . . 54,9752,527 8x8, Inc. (a) . . . . . . . . . . . . . . . . . . . . . . . . . . . . . . . . . . 81,9765,059 A10 Networks, Inc. (a) . . . . . . . . . . . . . . . . . . . . . . . . . 48,6171,447 ACI Worldwide, Inc. (a) . . . . . . . . . . . . . . . . . . . . . . . . 55,0581,402 Agilysys, Inc. (a) . . . . . . . . . . . . . . . . . . . . . . . . . . . . . . 67,240
959 Alarm.com Holdings, Inc. (a) . . . . . . . . . . . . . . . . . . . . 82,8381,157 Altair Engineering, Inc. - Class A (a) . . . . . . . . . . . . . . 72,394
651 Alteryx, Inc. - Class A (a) . . . . . . . . . . . . . . . . . . . . . . . 54,0072,127 American Software, Inc. - Class A . . . . . . . . . . . . . . . . 44,0291,821 Anaplan, Inc. (a) . . . . . . . . . . . . . . . . . . . . . . . . . . . . . . 98,061
601 Appfolio, Inc. - Class A (a)(b) . . . . . . . . . . . . . . . . . . . . 84,987877 Appian Corp. (a)(b) . . . . . . . . . . . . . . . . . . . . . . . . . . . . 116,597819 Aspen Technology, Inc. (a) . . . . . . . . . . . . . . . . . . . . . . 118,206674 Avalara, Inc. (a) . . . . . . . . . . . . . . . . . . . . . . . . . . . . . . . 89,932
4,488 Avaya Holdings Corp. (a) . . . . . . . . . . . . . . . . . . . . . . . 125,799380 Bill.com Holdings, Inc. (a) . . . . . . . . . . . . . . . . . . . . . . 55,290425 Blackbaud, Inc. (a) . . . . . . . . . . . . . . . . . . . . . . . . . . . . 30,209364 Blackline, Inc. (a) . . . . . . . . . . . . . . . . . . . . . . . . . . . . . 39,458633 Bottomline Technologies, Inc. (a) . . . . . . . . . . . . . . . . . 28,643
2,645 Box, Inc. - Class A (a) . . . . . . . . . . . . . . . . . . . . . . . . . . 60,7291,363 CDK Global, Inc. . . . . . . . . . . . . . . . . . . . . . . . . . . . . . . 73,684
579 Cerence, Inc. (a) . . . . . . . . . . . . . . . . . . . . . . . . . . . . . . 51,867616 Ceridian HCM Holding, Inc. (a) . . . . . . . . . . . . . . . . . . 51,910
6,151 ChannelAdvisor Corp. (a) . . . . . . . . . . . . . . . . . . . . . . . 144,8562,343 Cloudera, Inc. (a) . . . . . . . . . . . . . . . . . . . . . . . . . . . . . . 28,5141,087 Cloudflare, Inc. - Class A (a) . . . . . . . . . . . . . . . . . . . . . 76,3731,130 Cognyte Software, Ltd. (a) . . . . . . . . . . . . . . . . . . . . . . 31,4251,135 CommVault Systems, Inc. (a) . . . . . . . . . . . . . . . . . . . . 73,208
546 Cornerstone OnDemand, Inc. (a) . . . . . . . . . . . . . . . . . . 23,7952,476 Digital Turbine, Inc. (a) . . . . . . . . . . . . . . . . . . . . . . . . . 198,9711,736 Domo, Inc. - Class B (a) . . . . . . . . . . . . . . . . . . . . . . . . 97,719
445 Duck Creek Technologies, Inc. (a) . . . . . . . . . . . . . . . . 20,0871,107 Dynatrace, Inc. (a) . . . . . . . . . . . . . . . . . . . . . . . . . . . . . 53,4022,204 Ebix, Inc. . . . . . . . . . . . . . . . . . . . . . . . . . . . . . . . . . . . . 70,5944,503 eGain Corp. (a) . . . . . . . . . . . . . . . . . . . . . . . . . . . . . . . 42,733
819 Elastic NV (a) . . . . . . . . . . . . . . . . . . . . . . . . . . . . . . . . 91,073373 Envestnet, Inc. (a) . . . . . . . . . . . . . . . . . . . . . . . . . . . . . 26,942325 ePlus, Inc. (a) . . . . . . . . . . . . . . . . . . . . . . . . . . . . . . . . . 32,383326 Everbridge, Inc. (a) . . . . . . . . . . . . . . . . . . . . . . . . . . . . 39,505380 Fair Isaac Corp. (a) . . . . . . . . . . . . . . . . . . . . . . . . . . . . 184,699878 FireEye, Inc. (a) . . . . . . . . . . . . . . . . . . . . . . . . . . . . . . . 17,182723 Five9, Inc. (a) . . . . . . . . . . . . . . . . . . . . . . . . . . . . . . . . 113,027352 Globant SA (a) . . . . . . . . . . . . . . . . . . . . . . . . . . . . . . . . 73,079406 Guidewire Software, Inc. (a) . . . . . . . . . . . . . . . . . . . . . 41,262515 HubSpot, Inc. (a) . . . . . . . . . . . . . . . . . . . . . . . . . . . . . . 233,918
Number ofShares Value
Software (Continued)3,432 Intellicheck, Inc. (a) . . . . . . . . . . . . . . . . . . . . . . . . . . . . $ 28,760
664 Intelligent Systems Corp. (a) . . . . . . . . . . . . . . . . . . . . . 27,164958 j2 Global, Inc. (a)(b) . . . . . . . . . . . . . . . . . . . . . . . . . . . 114,826
1,991 LivePerson, Inc. (a)(b) . . . . . . . . . . . . . . . . . . . . . . . . . . 105,0051,209 Manhattan Associates, Inc. (a) . . . . . . . . . . . . . . . . . . . 141,912
824 McAfee Corp. . . . . . . . . . . . . . . . . . . . . . . . . . . . . . . . . 18,738980 Medallia, Inc. (a) . . . . . . . . . . . . . . . . . . . . . . . . . . . . . . 27,332128 MicroStrategy, Inc. - Class A (a)(b) . . . . . . . . . . . . . . . 86,886703 Mimecast, Ltd. (a) . . . . . . . . . . . . . . . . . . . . . . . . . . . . . 28,268
4,010 Mitek Systems, Inc. (a) . . . . . . . . . . . . . . . . . . . . . . . . . 58,4661,181 Model N, Inc. (a) . . . . . . . . . . . . . . . . . . . . . . . . . . . . . . 41,607
290 nCino, Inc. (a) . . . . . . . . . . . . . . . . . . . . . . . . . . . . . . . . 19,349804 New Relic, Inc. (a) . . . . . . . . . . . . . . . . . . . . . . . . . . . . 49,430
3,180 Nuance Communications, Inc. (a) . . . . . . . . . . . . . . . . . 138,7752,755 Nutanix, Inc. - Class A (a) . . . . . . . . . . . . . . . . . . . . . . . 73,1732,018 OneSpan, Inc. (a) . . . . . . . . . . . . . . . . . . . . . . . . . . . . . . 49,441
618 PagerDuty, Inc. (a) . . . . . . . . . . . . . . . . . . . . . . . . . . . . 24,862229 Paylocity Holding Corp. (a) . . . . . . . . . . . . . . . . . . . . . 41,181854 Pegasystems, Inc. (b) . . . . . . . . . . . . . . . . . . . . . . . . . . . 97,646
1,164 Pluralsight, Inc. - Class A (a) . . . . . . . . . . . . . . . . . . . . 26,0041,970 Progress Software Corp. . . . . . . . . . . . . . . . . . . . . . . . . 86,798
608 Proofpoint, Inc. (a) . . . . . . . . . . . . . . . . . . . . . . . . . . . . 76,480571 PROS Holdings, Inc. (a) . . . . . . . . . . . . . . . . . . . . . . . . 24,268
1,250 PTC, Inc. (a) . . . . . . . . . . . . . . . . . . . . . . . . . . . . . . . . . 172,063430 Q2 Holdings, Inc. (a)(b) . . . . . . . . . . . . . . . . . . . . . . . . 43,086927 QAD, Inc. - Class A . . . . . . . . . . . . . . . . . . . . . . . . . . . 61,720518 Qualys, Inc. (a)(b) . . . . . . . . . . . . . . . . . . . . . . . . . . . . . 54,276
1,025 Rapid7, Inc. (a) . . . . . . . . . . . . . . . . . . . . . . . . . . . . . . . 76,475772 RealPage, Inc. (a) . . . . . . . . . . . . . . . . . . . . . . . . . . . . . 67,318
9,325 Rimini Street Inc. (a) . . . . . . . . . . . . . . . . . . . . . . . . . . . 83,645955 SailPoint Technologies Holding Inc. (a) . . . . . . . . . . . . 48,361706 Sapiens International Corp NV . . . . . . . . . . . . . . . . . . . 22,444
2,585 SecureWorks Corp. - Class A (a) . . . . . . . . . . . . . . . . . 34,587881 ShotSpotter, Inc. (a) . . . . . . . . . . . . . . . . . . . . . . . . . . . . 30,897
1,209 Smartsheet, Inc. - Class A (a) . . . . . . . . . . . . . . . . . . . . 77,27910,816 Smith Micro Software, Inc. (a) . . . . . . . . . . . . . . . . . . . 59,542
762 SPS Commerce, Inc. (a) . . . . . . . . . . . . . . . . . . . . . . . . 75,6741,365 SVMK, Inc. (a) . . . . . . . . . . . . . . . . . . . . . . . . . . . . . . . 25,007
11,621 Synchronoss Technologies, Inc. (a) . . . . . . . . . . . . . . . . 41,4871,362 Tenable Holdings, Inc. (a) . . . . . . . . . . . . . . . . . . . . . . . 49,2842,370 Varonis Systems, Inc. (a) . . . . . . . . . . . . . . . . . . . . . . . . 121,6761,333 Verint Systems, Inc. (a) . . . . . . . . . . . . . . . . . . . . . . . . . 60,6381,502 Veritone, Inc. (a) . . . . . . . . . . . . . . . . . . . . . . . . . . . . . . 36,0181,122 Workiva, Inc. (a) . . . . . . . . . . . . . . . . . . . . . . . . . . . . . . 99,0283,708 Xperi Holding Corp. . . . . . . . . . . . . . . . . . . . . . . . . . . . 80,7232,651 Yext, Inc. (a) . . . . . . . . . . . . . . . . . . . . . . . . . . . . . . . . . 38,3861,285 Zendesk, Inc. (a)(b) . . . . . . . . . . . . . . . . . . . . . . . . . . . . 170,417
586 Zscaler, Inc. (a) . . . . . . . . . . . . . . . . . . . . . . . . . . . . . . . 100,5991,961 Zuora, Inc. - Class A (a) . . . . . . . . . . . . . . . . . . . . . . . . 29,023
6,447,277
Specialty Retail - 5.32%1,425 Aaron’s Co., Inc. . . . . . . . . . . . . . . . . . . . . . . . . . . . . . . 36,5943,108 Abercrombie & Fitch Co. - Class A (a) . . . . . . . . . . . . . 106,636
759 Academy Sports & Outdoors, Inc. (a)(b) . . . . . . . . . . . 20,4852,873 American Eagle Outfitters, Inc. . . . . . . . . . . . . . . . . . . . 84,007
773 America’s Car-Mart, Inc. (a) . . . . . . . . . . . . . . . . . . . . . 117,782461 Asbury Automotive Group, Inc. (a) . . . . . . . . . . . . . . . 90,587
1,526 At Home Group, Inc. (a) . . . . . . . . . . . . . . . . . . . . . . . . 43,7961,252 AutoNation, Inc. (a) . . . . . . . . . . . . . . . . . . . . . . . . . . . . 116,711
See notes to financial statements.
61
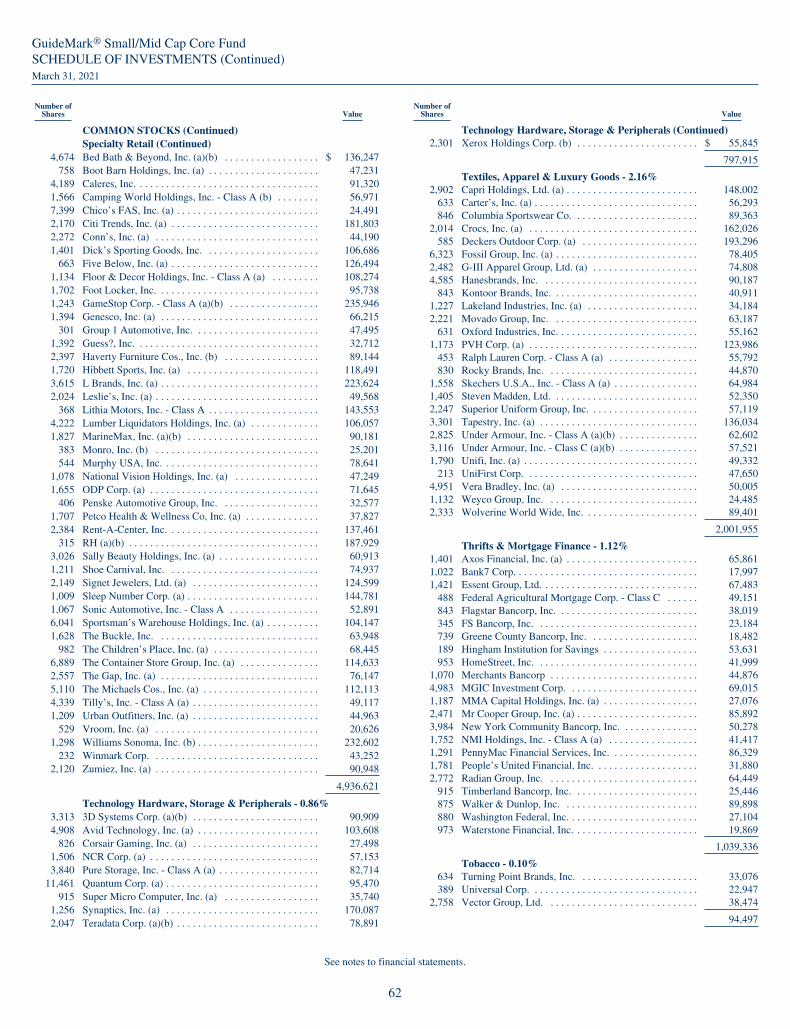
GuideMark® Small/Mid Cap Core FundSCHEDULE OF INVESTMENTS (Continued)March 31, 2021
Number ofShares Value
COMMON STOCKS (Continued)Specialty Retail (Continued)
4,674 Bed Bath & Beyond, Inc. (a)(b) . . . . . . . . . . . . . . . . . . $ 136,247758 Boot Barn Holdings, Inc. (a) . . . . . . . . . . . . . . . . . . . . . 47,231
4,189 Caleres, Inc. . . . . . . . . . . . . . . . . . . . . . . . . . . . . . . . . . . 91,3201,566 Camping World Holdings, Inc. - Class A (b) . . . . . . . . 56,9717,399 Chico’s FAS, Inc. (a) . . . . . . . . . . . . . . . . . . . . . . . . . . . 24,4912,170 Citi Trends, Inc. (a) . . . . . . . . . . . . . . . . . . . . . . . . . . . . 181,8032,272 Conn’s, Inc. (a) . . . . . . . . . . . . . . . . . . . . . . . . . . . . . . . 44,1901,401 Dick’s Sporting Goods, Inc. . . . . . . . . . . . . . . . . . . . . . 106,686
663 Five Below, Inc. (a) . . . . . . . . . . . . . . . . . . . . . . . . . . . . 126,4941,134 Floor & Decor Holdings, Inc. - Class A (a) . . . . . . . . . 108,2741,702 Foot Locker, Inc. . . . . . . . . . . . . . . . . . . . . . . . . . . . . . . 95,7381,243 GameStop Corp. - Class A (a)(b) . . . . . . . . . . . . . . . . . 235,9461,394 Genesco, Inc. (a) . . . . . . . . . . . . . . . . . . . . . . . . . . . . . . 66,215
301 Group 1 Automotive, Inc. . . . . . . . . . . . . . . . . . . . . . . . 47,4951,392 Guess?, Inc. . . . . . . . . . . . . . . . . . . . . . . . . . . . . . . . . . . 32,7122,397 Haverty Furniture Cos., Inc. (b) . . . . . . . . . . . . . . . . . . 89,1441,720 Hibbett Sports, Inc. (a) . . . . . . . . . . . . . . . . . . . . . . . . . 118,4913,615 L Brands, Inc. (a) . . . . . . . . . . . . . . . . . . . . . . . . . . . . . . 223,6242,024 Leslie’s, Inc. (a) . . . . . . . . . . . . . . . . . . . . . . . . . . . . . . . 49,568
368 Lithia Motors, Inc. - Class A . . . . . . . . . . . . . . . . . . . . . 143,5534,222 Lumber Liquidators Holdings, Inc. (a) . . . . . . . . . . . . . 106,0571,827 MarineMax, Inc. (a)(b) . . . . . . . . . . . . . . . . . . . . . . . . . 90,181
383 Monro, Inc. (b) . . . . . . . . . . . . . . . . . . . . . . . . . . . . . . . 25,201544 Murphy USA, Inc. . . . . . . . . . . . . . . . . . . . . . . . . . . . . . 78,641
1,078 National Vision Holdings, Inc. (a) . . . . . . . . . . . . . . . . 47,2491,655 ODP Corp. (a) . . . . . . . . . . . . . . . . . . . . . . . . . . . . . . . . 71,645
406 Penske Automotive Group, Inc. . . . . . . . . . . . . . . . . . . 32,5771,707 Petco Health & Wellness Co, Inc. (a) . . . . . . . . . . . . . . 37,8272,384 Rent-A-Center, Inc. . . . . . . . . . . . . . . . . . . . . . . . . . . . . 137,461
315 RH (a)(b) . . . . . . . . . . . . . . . . . . . . . . . . . . . . . . . . . . . . 187,9293,026 Sally Beauty Holdings, Inc. (a) . . . . . . . . . . . . . . . . . . . 60,9131,211 Shoe Carnival, Inc. . . . . . . . . . . . . . . . . . . . . . . . . . . . . 74,9372,149 Signet Jewelers, Ltd. (a) . . . . . . . . . . . . . . . . . . . . . . . . 124,5991,009 Sleep Number Corp. (a) . . . . . . . . . . . . . . . . . . . . . . . . . 144,7811,067 Sonic Automotive, Inc. - Class A . . . . . . . . . . . . . . . . . 52,8916,041 Sportsman’s Warehouse Holdings, Inc. (a) . . . . . . . . . . 104,1471,628 The Buckle, Inc. . . . . . . . . . . . . . . . . . . . . . . . . . . . . . . 63,948
982 The Children’s Place, Inc. (a) . . . . . . . . . . . . . . . . . . . . 68,4456,889 The Container Store Group, Inc. (a) . . . . . . . . . . . . . . . 114,6332,557 The Gap, Inc. (a) . . . . . . . . . . . . . . . . . . . . . . . . . . . . . . 76,1475,110 The Michaels Cos., Inc. (a) . . . . . . . . . . . . . . . . . . . . . . 112,1134,339 Tilly’s, Inc. - Class A (a) . . . . . . . . . . . . . . . . . . . . . . . . 49,1171,209 Urban Outfitters, Inc. (a) . . . . . . . . . . . . . . . . . . . . . . . . 44,963
529 Vroom, Inc. (a) . . . . . . . . . . . . . . . . . . . . . . . . . . . . . . . 20,6261,298 Williams Sonoma, Inc. (b) . . . . . . . . . . . . . . . . . . . . . . . 232,602
232 Winmark Corp. . . . . . . . . . . . . . . . . . . . . . . . . . . . . . . . 43,2522,120 Zumiez, Inc. (a) . . . . . . . . . . . . . . . . . . . . . . . . . . . . . . . 90,948
4,936,621
Technology Hardware, Storage & Peripherals - 0.86%3,313 3D Systems Corp. (a)(b) . . . . . . . . . . . . . . . . . . . . . . . . 90,9094,908 Avid Technology, Inc. (a) . . . . . . . . . . . . . . . . . . . . . . . 103,608
826 Corsair Gaming, Inc. (a) . . . . . . . . . . . . . . . . . . . . . . . . 27,4981,506 NCR Corp. (a) . . . . . . . . . . . . . . . . . . . . . . . . . . . . . . . . 57,1533,840 Pure Storage, Inc. - Class A (a) . . . . . . . . . . . . . . . . . . . 82,714
11,461 Quantum Corp. (a) . . . . . . . . . . . . . . . . . . . . . . . . . . . . . 95,470915 Super Micro Computer, Inc. (a) . . . . . . . . . . . . . . . . . . 35,740
1,256 Synaptics, Inc. (a) . . . . . . . . . . . . . . . . . . . . . . . . . . . . . 170,0872,047 Teradata Corp. (a)(b) . . . . . . . . . . . . . . . . . . . . . . . . . . . 78,891
Number ofShares Value
Technology Hardware, Storage & Peripherals (Continued)2,301 Xerox Holdings Corp. (b) . . . . . . . . . . . . . . . . . . . . . . . $ 55,845
797,915
Textiles, Apparel & Luxury Goods - 2.16%2,902 Capri Holdings, Ltd. (a) . . . . . . . . . . . . . . . . . . . . . . . . . 148,002
633 Carter’s, Inc. (a) . . . . . . . . . . . . . . . . . . . . . . . . . . . . . . . 56,293846 Columbia Sportswear Co. . . . . . . . . . . . . . . . . . . . . . . . 89,363
2,014 Crocs, Inc. (a) . . . . . . . . . . . . . . . . . . . . . . . . . . . . . . . . 162,026585 Deckers Outdoor Corp. (a) . . . . . . . . . . . . . . . . . . . . . . 193,296
6,323 Fossil Group, Inc. (a) . . . . . . . . . . . . . . . . . . . . . . . . . . . 78,4052,482 G-III Apparel Group, Ltd. (a) . . . . . . . . . . . . . . . . . . . . 74,8084,585 Hanesbrands, Inc. . . . . . . . . . . . . . . . . . . . . . . . . . . . . . 90,187
843 Kontoor Brands, Inc. . . . . . . . . . . . . . . . . . . . . . . . . . . . 40,9111,227 Lakeland Industries, Inc. (a) . . . . . . . . . . . . . . . . . . . . . 34,1842,221 Movado Group, Inc. . . . . . . . . . . . . . . . . . . . . . . . . . . . 63,187
631 Oxford Industries, Inc. . . . . . . . . . . . . . . . . . . . . . . . . . . 55,1621,173 PVH Corp. (a) . . . . . . . . . . . . . . . . . . . . . . . . . . . . . . . . 123,986
453 Ralph Lauren Corp. - Class A (a) . . . . . . . . . . . . . . . . . 55,792830 Rocky Brands, Inc. . . . . . . . . . . . . . . . . . . . . . . . . . . . . 44,870
1,558 Skechers U.S.A., Inc. - Class A (a) . . . . . . . . . . . . . . . . 64,9841,405 Steven Madden, Ltd. . . . . . . . . . . . . . . . . . . . . . . . . . . . 52,3502,247 Superior Uniform Group, Inc. . . . . . . . . . . . . . . . . . . . . 57,1193,301 Tapestry, Inc. (a) . . . . . . . . . . . . . . . . . . . . . . . . . . . . . . 136,0342,825 Under Armour, Inc. - Class A (a)(b) . . . . . . . . . . . . . . . 62,6023,116 Under Armour, Inc. - Class C (a)(b) . . . . . . . . . . . . . . . 57,5211,790 Unifi, Inc. (a) . . . . . . . . . . . . . . . . . . . . . . . . . . . . . . . . . 49,332
213 UniFirst Corp. . . . . . . . . . . . . . . . . . . . . . . . . . . . . . . . . 47,6504,951 Vera Bradley, Inc. (a) . . . . . . . . . . . . . . . . . . . . . . . . . . 50,0051,132 Weyco Group, Inc. . . . . . . . . . . . . . . . . . . . . . . . . . . . . 24,4852,333 Wolverine World Wide, Inc. . . . . . . . . . . . . . . . . . . . . . 89,401
2,001,955
Thrifts & Mortgage Finance - 1.12%1,401 Axos Financial, Inc. (a) . . . . . . . . . . . . . . . . . . . . . . . . . 65,8611,022 Bank7 Corp. . . . . . . . . . . . . . . . . . . . . . . . . . . . . . . . . . . 17,9971,421 Essent Group, Ltd. . . . . . . . . . . . . . . . . . . . . . . . . . . . . . 67,483
488 Federal Agricultural Mortgage Corp. - Class C . . . . . . 49,151843 Flagstar Bancorp, Inc. . . . . . . . . . . . . . . . . . . . . . . . . . . 38,019345 FS Bancorp, Inc. . . . . . . . . . . . . . . . . . . . . . . . . . . . . . . 23,184739 Greene County Bancorp, Inc. . . . . . . . . . . . . . . . . . . . . 18,482189 Hingham Institution for Savings . . . . . . . . . . . . . . . . . . 53,631953 HomeStreet, Inc. . . . . . . . . . . . . . . . . . . . . . . . . . . . . . . 41,999
1,070 Merchants Bancorp . . . . . . . . . . . . . . . . . . . . . . . . . . . . 44,8764,983 MGIC Investment Corp. . . . . . . . . . . . . . . . . . . . . . . . . 69,0151,187 MMA Capital Holdings, Inc. (a) . . . . . . . . . . . . . . . . . . 27,0762,471 Mr Cooper Group, Inc. (a) . . . . . . . . . . . . . . . . . . . . . . . 85,8923,984 New York Community Bancorp, Inc. . . . . . . . . . . . . . . 50,2781,752 NMI Holdings, Inc. - Class A (a) . . . . . . . . . . . . . . . . . 41,4171,291 PennyMac Financial Services, Inc. . . . . . . . . . . . . . . . . 86,3291,781 People’s United Financial, Inc. . . . . . . . . . . . . . . . . . . . 31,8802,772 Radian Group, Inc. . . . . . . . . . . . . . . . . . . . . . . . . . . . . 64,449
915 Timberland Bancorp, Inc. . . . . . . . . . . . . . . . . . . . . . . . 25,446875 Walker & Dunlop, Inc. . . . . . . . . . . . . . . . . . . . . . . . . . 89,898880 Washington Federal, Inc. . . . . . . . . . . . . . . . . . . . . . . . . 27,104973 Waterstone Financial, Inc. . . . . . . . . . . . . . . . . . . . . . . . 19,869
1,039,336
Tobacco - 0.10%634 Turning Point Brands, Inc. . . . . . . . . . . . . . . . . . . . . . . 33,076389 Universal Corp. . . . . . . . . . . . . . . . . . . . . . . . . . . . . . . . 22,947
2,758 Vector Group, Ltd. . . . . . . . . . . . . . . . . . . . . . . . . . . . . 38,474
94,497
See notes to financial statements.
62

GuideMark® Small/Mid Cap Core FundSCHEDULE OF INVESTMENTS (Continued)March 31, 2021
Number ofShares Value
COMMON STOCKS (Continued)Trading Companies & Distributors - 1.66%
897 Applied Industrial Technologies, Inc. . . . . . . . . . . . . . . $ 81,7791,387 Beacon Roofing Supply, Inc. (a) . . . . . . . . . . . . . . . . . . 72,568
811 CAI International, Inc. . . . . . . . . . . . . . . . . . . . . . . . . . . 36,9172,035 DXP Enterprises, Inc. (a) . . . . . . . . . . . . . . . . . . . . . . . . 61,396
853 EVI Industries, Inc. (a) . . . . . . . . . . . . . . . . . . . . . . . . . 24,5412,276 GMS, Inc. (a) . . . . . . . . . . . . . . . . . . . . . . . . . . . . . . . . . 95,0231,102 H&E Equipment Services, Inc. . . . . . . . . . . . . . . . . . . . 41,876
200 Herc Holdings, Inc. (a) . . . . . . . . . . . . . . . . . . . . . . . . . 20,2661,339 Lawson Products, Inc. (a) . . . . . . . . . . . . . . . . . . . . . . . 69,4414,114 MRC Global, Inc. (a) . . . . . . . . . . . . . . . . . . . . . . . . . . . 37,149
844 MSC Industrial Direct Co., Inc. - Class A . . . . . . . . . . . 76,1206,286 NOW, Inc. (a) . . . . . . . . . . . . . . . . . . . . . . . . . . . . . . . . 63,4261,008 Rush Enterprises, Inc. - Class A . . . . . . . . . . . . . . . . . . 50,229
882 Rush Enterprises, Inc. - Class B . . . . . . . . . . . . . . . . . . 39,769941 SiteOne Landscape Supply, Inc. (a) . . . . . . . . . . . . . . . 160,666
1,668 Systemax, Inc. . . . . . . . . . . . . . . . . . . . . . . . . . . . . . . . . 68,5881,587 Textainer Group Holdings, Ltd. (a) . . . . . . . . . . . . . . . . 45,4681,940 Titan Machinery, Inc. (a) . . . . . . . . . . . . . . . . . . . . . . . . 49,470
650 Transcat, Inc. (a) . . . . . . . . . . . . . . . . . . . . . . . . . . . . . . 31,902954 Triton International, Ltd. . . . . . . . . . . . . . . . . . . . . . . . . 52,460
2,437 Univar, Inc. (a) . . . . . . . . . . . . . . . . . . . . . . . . . . . . . . . 52,4932,644 Veritiv Corp. (a) . . . . . . . . . . . . . . . . . . . . . . . . . . . . . . 112,476
435 Watsco, Inc. - Class A (b) . . . . . . . . . . . . . . . . . . . . . . . 113,426988 WESCO International, Inc. (a) . . . . . . . . . . . . . . . . . . . 85,492
1,542,941
Transportation Infrastructure - 0.03%733 Macquarie Infrastructure Corp. . . . . . . . . . . . . . . . . . . . 23,317
Water Utilities - 0.05%1,705 Consolidated Water Co., Ltd. - Ordinary Shares . . . . . . 22,932
512 Essential Utilities, Inc. . . . . . . . . . . . . . . . . . . . . . . . . . . 22,912
45,844
Wireless Telecommunication Services - 0.09%412 Shenandoah Telecommunications Co. . . . . . . . . . . . . . 20,110
1,576 Telephone & Data Systems, Inc. . . . . . . . . . . . . . . . . . . 36,185716 United States Cellular Corp. (a) . . . . . . . . . . . . . . . . . . 26,119
82,414
Total Common Stocks(Cost $45,802,032) . . . . . . . . . . . . . . . . . . . . . . . . . . . 85,501,624
INVESTMENT COMPANIES - 3.52%Exchange Traded Funds - 3.52%
18,459 Vanguard Extended Market ETF . . . . . . . . . . . . . . . . . 3,265,582
Total Investment Companies(Cost $2,803,829) . . . . . . . . . . . . . . . . . . . . . . . . . . . . 3,265,582
REAL ESTATE INVESTMENT TRUSTS - 3.52%Real Estate Investment Trusts - 3.52%
1,751 Acadia Realty Trust . . . . . . . . . . . . . . . . . . . . . . . . . . . . 33,2164,627 AGNC Investment Corp. . . . . . . . . . . . . . . . . . . . . . . . . 77,549
344 Agree Realty Corp. . . . . . . . . . . . . . . . . . . . . . . . . . . . . 23,1552,320 Alexander & Baldwin, Inc. . . . . . . . . . . . . . . . . . . . . . . 38,953
677 American Assets Trust, Inc. . . . . . . . . . . . . . . . . . . . . . 21,962702 American Campus Communities, Inc. . . . . . . . . . . . . . . 30,305
2,911 American Homes 4 Rent - Class A . . . . . . . . . . . . . . . . 97,0531,052 Americold Realty Trust . . . . . . . . . . . . . . . . . . . . . . . . . 40,470
396 Apartment Income REIT Corp. . . . . . . . . . . . . . . . . . . . 16,9336,603 Apartment Investment and Management Co. -
Class A . . . . . . . . . . . . . . . . . . . . . . . . . . . . . . . . . . . . 40,542
Number ofShares Value
Real Estate Investment Trusts (Continued)1,662 Apollo Commercial Real Estate Finance, Inc. . . . . . . . $ 23,2181,483 Apple Hospitality REIT, Inc. (a) . . . . . . . . . . . . . . . . . . 21,6071,671 Arbor Realty Trust, Inc. . . . . . . . . . . . . . . . . . . . . . . . . . 26,5691,648 Armada Hoffler Properties, Inc. . . . . . . . . . . . . . . . . . . 20,666
847 Blackstone Mortgage Trust, Inc. . . . . . . . . . . . . . . . . . . 26,2571,670 Brandywine Realty Trust . . . . . . . . . . . . . . . . . . . . . . . . 21,5602,889 Brixmor Property Group, Inc. . . . . . . . . . . . . . . . . . . . . 58,444
735 Camden Property Trust . . . . . . . . . . . . . . . . . . . . . . . . . 80,784849 CareTrust REIT, Inc. . . . . . . . . . . . . . . . . . . . . . . . . . . . 19,769358 Centerspace . . . . . . . . . . . . . . . . . . . . . . . . . . . . . . . . . . 24,344
1,759 City Office REIT, Inc. . . . . . . . . . . . . . . . . . . . . . . . . . . 18,6815,770 Colony Capital, Inc. - Class A (b) . . . . . . . . . . . . . . . . . 37,3901,357 Columbia Property Trust, Inc. . . . . . . . . . . . . . . . . . . . . 23,2053,277 CoreCivic, Inc. . . . . . . . . . . . . . . . . . . . . . . . . . . . . . . . 29,6571,988 CorePoint Lodging, Inc. . . . . . . . . . . . . . . . . . . . . . . . . 17,952
239 CoreSite Realty Corp. . . . . . . . . . . . . . . . . . . . . . . . . . . 28,6441,170 Corporate Office Properties Trust . . . . . . . . . . . . . . . . . 30,8061,543 Cousins Properties, Inc. . . . . . . . . . . . . . . . . . . . . . . . . . 54,545
926 CubeSmart . . . . . . . . . . . . . . . . . . . . . . . . . . . . . . . . . . . 35,031569 CyrusOne, Inc. . . . . . . . . . . . . . . . . . . . . . . . . . . . . . . . . 38,533
12,768 Diversified Healthcare Trust . . . . . . . . . . . . . . . . . . . . . 61,0311,010 Douglas Emmett, Inc. . . . . . . . . . . . . . . . . . . . . . . . . . . 31,7142,218 Dynex Capital, Inc. . . . . . . . . . . . . . . . . . . . . . . . . . . . . 41,9871,084 Easterly Government Properties, Inc. . . . . . . . . . . . . . . 22,4714,558 Empire State Realty Trust, Inc. - Class A . . . . . . . . . . . 50,731
536 Equity LifeStyle Properties, Inc. . . . . . . . . . . . . . . . . . . 34,1112,660 Farmland Partners, Inc. . . . . . . . . . . . . . . . . . . . . . . . . . 29,819
453 First Industrial Realty Trust, Inc. . . . . . . . . . . . . . . . . . 20,7438,957 Franklin Street Properties Corp. . . . . . . . . . . . . . . . . . . 48,8161,257 Gaming and Leisure Properties, Inc. . . . . . . . . . . . . . . . 53,3351,216 Gladstone Commercial Corp. . . . . . . . . . . . . . . . . . . . . 23,7851,311 Gladstone Land Corp. . . . . . . . . . . . . . . . . . . . . . . . . . . 23,9911,967 Great Ajax Corp. . . . . . . . . . . . . . . . . . . . . . . . . . . . . . . 21,440
744 Hannon Armstrong Sustainable Infrastructure Capital,Inc. . . . . . . . . . . . . . . . . . . . . . . . . . . . . . . . . . . . . . . . 41,738
817 Healthcare Realty Trust, Inc. . . . . . . . . . . . . . . . . . . . . . 24,771835 Healthcare Trust of America, Inc. - Class A (b) . . . . . . 23,029865 Highwoods Properties, Inc. . . . . . . . . . . . . . . . . . . . . . . 37,143853 Hudson Pacific Properties, Inc. (b) . . . . . . . . . . . . . . . . 23,142915 Industrial Logistics Properties Trust . . . . . . . . . . . . . . . 21,164211 Innovative Industrial Properties, Inc. (b) . . . . . . . . . . . . 38,014
1,029 Iron Mountain, Inc. . . . . . . . . . . . . . . . . . . . . . . . . . . . . 38,0831,610 iStar Financial, Inc. . . . . . . . . . . . . . . . . . . . . . . . . . . . . 28,626
780 JBG SMITH Properties . . . . . . . . . . . . . . . . . . . . . . . . . 24,796675 Kilroy Realty Corp. . . . . . . . . . . . . . . . . . . . . . . . . . . . . 44,300
2,823 Kimco Realty Corp. . . . . . . . . . . . . . . . . . . . . . . . . . . . . 52,9312,067 Kite Realty Group Trust . . . . . . . . . . . . . . . . . . . . . . . . 39,872
323 Lamar Advertising Co. - Class A . . . . . . . . . . . . . . . . . 30,336438 Life Storage, Inc. . . . . . . . . . . . . . . . . . . . . . . . . . . . . . . 37,646
2,003 Mack-Cali Realty Corp. . . . . . . . . . . . . . . . . . . . . . . . . . 31,0061,956 Medical Properties Trust, Inc. . . . . . . . . . . . . . . . . . . . . 41,624
474 National Retail Properties, Inc. . . . . . . . . . . . . . . . . . . . 20,889925 National Storage Affiliates Trust . . . . . . . . . . . . . . . . . . 36,935
7,098 New Senior Investment Group, Inc. . . . . . . . . . . . . . . . 44,2211,395 Office Properties Income Trust . . . . . . . . . . . . . . . . . . . 38,390
707 Omega Healthcare Investors, Inc. . . . . . . . . . . . . . . . . . 25,8973,424 Paramount Group, Inc. . . . . . . . . . . . . . . . . . . . . . . . . . 34,6851,431 Physicians Realty Trust . . . . . . . . . . . . . . . . . . . . . . . . . 25,2861,695 Piedmont Office Realty Trust, Inc. - Class A . . . . . . . . 29,442
352 PotlatchDeltic Corp. . . . . . . . . . . . . . . . . . . . . . . . . . . . 18,628
See notes to financial statements.
63

GuideMark® Small/Mid Cap Core FundSCHEDULE OF INVESTMENTS (Continued)March 31, 2021
Number ofShares Value
REAL ESTATE INVESTMENT TRUSTS (Continued)Real Estate Investment Trusts (Continued)
576 QTS Realty Trust, Inc. - Class A . . . . . . . . . . . . . . . . . . $ 35,735862 Regency Centers Corp. . . . . . . . . . . . . . . . . . . . . . . . . . 48,884
2,042 Retail Opportunity Investments Corp. . . . . . . . . . . . . . . 32,4074,388 Retail Properties of America, Inc. - Class A . . . . . . . . . 45,9863,281 Retail Value, Inc. . . . . . . . . . . . . . . . . . . . . . . . . . . . . . . 61,388
341 Rexford Industrial Realty, Inc. . . . . . . . . . . . . . . . . . . . 17,1861,923 RPT Realty . . . . . . . . . . . . . . . . . . . . . . . . . . . . . . . . . . 21,9412,054 Sabra Health Care REIT, Inc. . . . . . . . . . . . . . . . . . . . . 35,6572,081 Service Properties Trust . . . . . . . . . . . . . . . . . . . . . . . . 24,6812,624 SITE Centers Corp. . . . . . . . . . . . . . . . . . . . . . . . . . . . . 35,581
346 SL Green Realty Corp. (b) . . . . . . . . . . . . . . . . . . . . . . 24,217460 Spirit Realty Capital, Inc. . . . . . . . . . . . . . . . . . . . . . . . 19,550520 STAG Industrial, Inc. . . . . . . . . . . . . . . . . . . . . . . . . . . 17,477
2,766 Starwood Property Trust, Inc. . . . . . . . . . . . . . . . . . . . . 68,4311,017 STORE Capital Corp. . . . . . . . . . . . . . . . . . . . . . . . . . . 34,0703,216 Tanger Factory Outlet Centers, Inc. . . . . . . . . . . . . . . . 48,6583,846 The Geo Group, Inc. . . . . . . . . . . . . . . . . . . . . . . . . . . . 29,8453,728 Uniti Group, Inc. . . . . . . . . . . . . . . . . . . . . . . . . . . . . . . 41,1201,406 Urban Edge Properties . . . . . . . . . . . . . . . . . . . . . . . . . . 23,2271,582 Urstadt Biddle Properties, Inc. - Class A . . . . . . . . . . . 26,3401,175 VEREIT, Inc. . . . . . . . . . . . . . . . . . . . . . . . . . . . . . . . . . 45,3783,365 VICI Properties, Inc. . . . . . . . . . . . . . . . . . . . . . . . . . . . 95,028
653 Weingarten Realty Investors . . . . . . . . . . . . . . . . . . . . . 17,5723,491 Whitestone . . . . . . . . . . . . . . . . . . . . . . . . . . . . . . . . . . . 33,863
Total Real Estate Investment Trusts(Cost $2,764,080) . . . . . . . . . . . . . . . . . . . . . . . . . . . . 3,258,590
SHORT TERM INVESTMENTS - 0.74%Money Market Funds - 0.74%
689,166 DWS Government Money Market Series -Institutional SharesEffective Yield, 0.04% (e) . . . . . . . . . . . . . . . . . . . . . 689,166
Total Short Term Investments(Cost $689,166) . . . . . . . . . . . . . . . . . . . . . . . . . . . . . 689,166
Number ofUnits Value
INVESTMENTS PURCHASED WITH PROCEEDS FROMSECURITIES LENDING COLLATERAL - 7.09%
6,578,455 Mount Vernon Liquid Assets Portfolio, LLCEffective Yield, 0.11% (e) . . . . . . . . . . . . . . . . . . . . . $ 6,578,455
Total Investments Purchased with Proceeds fromSecurities Lending Collateral(Cost $6,578,455) . . . . . . . . . . . . . . . . . . . . . . . . . . . . 6,578,455
Total Investments(Cost $58,637,562) - 107.05% . . . . . . . . . . . . . . . . . 99,293,417
Liabilities in Excess ofOther Assets - (7.05)% . . . . . . . . . . . . . . . . . . . . . . . (6,537,067)
TOTAL NET ASSETS - 100.00% . . . . . . . . . . . . . . . $92,756,350
Percentages are stated as a percent of net assets.(a) Non-income producing security.(b) All or portion of this security is on loan.(c) Value determined using significant unobservable inputs. Classified as Level 3
in the fair value hierarchy.(d) As of March 31, 2021, the Valuation Committee has fair valued this security.
The value of these securities were $3,866, which represents less than 0.01%of total net assets.
(e) Seven-day yield as of March 31, 2021.(f) These securities have been deemed illiquid according to the Fund’s liquidity
guidelines. The value of these securities total $3,866, which represents lessthan 0.01% of total net assets.
See notes to financial statements.
64

GuideMark® World ex-US FundSCHEDULE OF INVESTMENTSMarch 31, 2021
Number ofShares Value
COMMON STOCKS - 94.02%Australia - 3.96%
2,547 Afterpay, Ltd. (a) . . . . . . . . . . . . . . . . . . . . . . . . . . . . . . $ 198,93117,514 AGL Energy, Ltd. . . . . . . . . . . . . . . . . . . . . . . . . . . . . . 128,750
638 ASX, Ltd. . . . . . . . . . . . . . . . . . . . . . . . . . . . . . . . . . . . . 34,53512,006 Australia & New Zealand Banking Group, Ltd. . . . . . . 257,7746,700 BHP Group, Ltd. . . . . . . . . . . . . . . . . . . . . . . . . . . . . . . 232,419
20,160 BlueScope Steel, Ltd. . . . . . . . . . . . . . . . . . . . . . . . . . . 297,4964,127 Coca-Cola Amatil, Ltd. . . . . . . . . . . . . . . . . . . . . . . . . . 42,2031,204 Cochlear, Ltd. . . . . . . . . . . . . . . . . . . . . . . . . . . . . . . . . 193,669
42,802 Coles Group, Ltd. . . . . . . . . . . . . . . . . . . . . . . . . . . . . . 521,9516,172 Commonwealth Bank of Australia . . . . . . . . . . . . . . . . 404,9742,190 CSL, Ltd. . . . . . . . . . . . . . . . . . . . . . . . . . . . . . . . . . . . . 442,607
23,835 Fortescue Metals Group, Ltd. . . . . . . . . . . . . . . . . . . . . 363,260477 Macquarie Group, Ltd. . . . . . . . . . . . . . . . . . . . . . . . . . 55,608
8,717 Magellan Financial Group, Ltd. . . . . . . . . . . . . . . . . . . 300,87335,968 Medibank Private, Ltd. . . . . . . . . . . . . . . . . . . . . . . . . . 76,666
9,139 National Australia Bank, Ltd. . . . . . . . . . . . . . . . . . . . . 181,0662,064 Newcrest Mining, Ltd. . . . . . . . . . . . . . . . . . . . . . . . . . . 38,9934,152 Northern Star Resources, Ltd. . . . . . . . . . . . . . . . . . . . . 30,0762,762 REA Group, Ltd. . . . . . . . . . . . . . . . . . . . . . . . . . . . . . . 298,886
842 Rio Tinto, Ltd. . . . . . . . . . . . . . . . . . . . . . . . . . . . . . . . . 71,1631,326 SEEK, Ltd. (a) . . . . . . . . . . . . . . . . . . . . . . . . . . . . . . . . 28,9031,891 Sonic Healthcare, Ltd. . . . . . . . . . . . . . . . . . . . . . . . . . . 50,568
42,422 South32, Ltd. . . . . . . . . . . . . . . . . . . . . . . . . . . . . . . . . . 91,0449,926 Suncorp Group, Ltd. . . . . . . . . . . . . . . . . . . . . . . . . . . . 74,784
12,878 Telstra Corp., Ltd. . . . . . . . . . . . . . . . . . . . . . . . . . . . . . 33,3461,747 Washington H Soul Pattinson & Co., Ltd. . . . . . . . . . . 42,0578,803 Wesfarmers, Ltd. . . . . . . . . . . . . . . . . . . . . . . . . . . . . . . 353,5167,753 Westpac Banking Corp. . . . . . . . . . . . . . . . . . . . . . . . . . 143,8101,155 WiseTech Global, Ltd. . . . . . . . . . . . . . . . . . . . . . . . . . 25,701
14,478 Woolworths, Ltd. . . . . . . . . . . . . . . . . . . . . . . . . . . . . . . 450,906
5,466,535
Austria - 0.70%1,125 Erste Group Bank AG . . . . . . . . . . . . . . . . . . . . . . . . . . 38,1132,506 OMV AG . . . . . . . . . . . . . . . . . . . . . . . . . . . . . . . . . . . . 126,998
13,423 Raiffeisen Bank International AG . . . . . . . . . . . . . . . . . 294,674695 Verbund AG . . . . . . . . . . . . . . . . . . . . . . . . . . . . . . . . . 50,484
10,845 voestalpine AG . . . . . . . . . . . . . . . . . . . . . . . . . . . . . . . 449,123
959,392
Belgium - 0.54%4,843 Ageas SA . . . . . . . . . . . . . . . . . . . . . . . . . . . . . . . . . . . . 292,451
801 Anheuser-Busch InBev SA . . . . . . . . . . . . . . . . . . . . . . 50,353487 Sofina SA . . . . . . . . . . . . . . . . . . . . . . . . . . . . . . . . . . . . 164,647
2,497 UCB SA . . . . . . . . . . . . . . . . . . . . . . . . . . . . . . . . . . . . . 237,376
744,827
Canada - 8.44%2,206 Agnico Eagle Mines, Ltd. . . . . . . . . . . . . . . . . . . . . . . . 127,5297,200 Alimentation Couche-Tard, Inc. - Series B . . . . . . . . . . 232,1513,399 AltaGas, Ltd. . . . . . . . . . . . . . . . . . . . . . . . . . . . . . . . . . 56,636
21,483 B2Gold Corp. . . . . . . . . . . . . . . . . . . . . . . . . . . . . . . . . 92,4835,093 Ballard Power Systems, Inc. (a) . . . . . . . . . . . . . . . . . . 124,2154,031 Bank of Montreal . . . . . . . . . . . . . . . . . . . . . . . . . . . . . . 359,316
10,568 Barrick Gold Corp. . . . . . . . . . . . . . . . . . . . . . . . . . . . . 209,6442,085 Bausch Health Cos., Inc. . . . . . . . . . . . . . . . . . . . . . . . . 66,149
13,791 BlackBerry, Ltd. (a) . . . . . . . . . . . . . . . . . . . . . . . . . . . . 115,6666,069 Cameco Corp. . . . . . . . . . . . . . . . . . . . . . . . . . . . . . . . . 100,6432,109 Canadian Imperial Bank of Commerce . . . . . . . . . . . . . 206,5031,495 Canadian National Railway Co. . . . . . . . . . . . . . . . . . . 173,495
Number ofShares Value
Canada (Continued)5,684 Canadian Natural Resources, Ltd. . . . . . . . . . . . . . . . . . $ 175,717
558 Canadian Pacific Railway, Ltd. . . . . . . . . . . . . . . . . . . . 213,130451 Canadian Tire Corp., Ltd. - Class A . . . . . . . . . . . . . . . 63,998
1,487 Canopy Growth Corp. (a) . . . . . . . . . . . . . . . . . . . . . . . 47,756788 CCL Industries, Inc. - Class B . . . . . . . . . . . . . . . . . . . . 43,592
5,048 Cenovus Energy, Inc. . . . . . . . . . . . . . . . . . . . . . . . . . . 37,919985 CGI, Inc. (a) . . . . . . . . . . . . . . . . . . . . . . . . . . . . . . . . . . 82,048525 Constellation Software, Inc. . . . . . . . . . . . . . . . . . . . . . 733,187
4,819 Dollarama, Inc. . . . . . . . . . . . . . . . . . . . . . . . . . . . . . . . 212,90018,226 Empire Co., Ltd. - Series A . . . . . . . . . . . . . . . . . . . . . . 568,2302,243 First Quantum Minerals, Ltd. . . . . . . . . . . . . . . . . . . . . 42,747
667 FirstService Corp. . . . . . . . . . . . . . . . . . . . . . . . . . . . . . 99,007898 Franco-Nevada Corp. . . . . . . . . . . . . . . . . . . . . . . . . . . 112,538
3,090 George Weston, Ltd. . . . . . . . . . . . . . . . . . . . . . . . . . . . 273,6182,869 GFL Environmental, Inc. . . . . . . . . . . . . . . . . . . . . . . . . 100,2225,010 Great-West Lifeco, Inc. . . . . . . . . . . . . . . . . . . . . . . . . . 133,3135,011 iA Financial Corp., Inc. . . . . . . . . . . . . . . . . . . . . . . . . . 272,461
244 Intact Financial Corp. . . . . . . . . . . . . . . . . . . . . . . . . . . 29,90117,938 Kinross Gold Corp. . . . . . . . . . . . . . . . . . . . . . . . . . . . . 119,4721,691 Kirkland Lake Gold, Ltd. . . . . . . . . . . . . . . . . . . . . . . . 57,1077,543 Loblaw Cos., Ltd. . . . . . . . . . . . . . . . . . . . . . . . . . . . . . 421,3562,271 Lundin Mining Corp. . . . . . . . . . . . . . . . . . . . . . . . . . . . 23,3663,179 Magna International, Inc. . . . . . . . . . . . . . . . . . . . . . . . . 279,981
25,276 Manulife Financial Corp. . . . . . . . . . . . . . . . . . . . . . . . . 543,6542,573 Metro, Inc. . . . . . . . . . . . . . . . . . . . . . . . . . . . . . . . . . . . 117,3792,357 National Bank of Canada . . . . . . . . . . . . . . . . . . . . . . . . 160,1153,695 Northland Power, Inc. . . . . . . . . . . . . . . . . . . . . . . . . . . 133,9282,433 Nutrien, Ltd. . . . . . . . . . . . . . . . . . . . . . . . . . . . . . . . . . 131,0692,808 Pan American Silver Corp. . . . . . . . . . . . . . . . . . . . . . . 84,2387,942 Power Corp. of Canada . . . . . . . . . . . . . . . . . . . . . . . . . 208,7411,968 Ritchie Bros Auctioneers, Inc. . . . . . . . . . . . . . . . . . . . . 115,2279,264 Royal Bank of Canada . . . . . . . . . . . . . . . . . . . . . . . . . . 854,1571,602 Saputo, Inc. . . . . . . . . . . . . . . . . . . . . . . . . . . . . . . . . . . 48,173
613 Shopify, Inc. - Class A (a) . . . . . . . . . . . . . . . . . . . . . . . 676,7681,709 Sun Life Financial, Inc. . . . . . . . . . . . . . . . . . . . . . . . . . 86,3682,398 Teck Resources, Ltd. - Class B . . . . . . . . . . . . . . . . . . . 45,9302,044 TELUS Corp. . . . . . . . . . . . . . . . . . . . . . . . . . . . . . . . . . 40,7114,974 The Bank of Nova Scotia . . . . . . . . . . . . . . . . . . . . . . . 311,177
10,374 The Toronto-Dominion Bank . . . . . . . . . . . . . . . . . . . . 676,576439 Thomson Reuters Corp. . . . . . . . . . . . . . . . . . . . . . . . . . 38,457862 Toromont Industries, Ltd. . . . . . . . . . . . . . . . . . . . . . . . 65,979
1,433 West Fraser Timber Co., Ltd. . . . . . . . . . . . . . . . . . . . . 103,0933,622 Wheaton Precious Metals Corp. . . . . . . . . . . . . . . . . . . 138,343
10,106 WSP Global, Inc. . . . . . . . . . . . . . . . . . . . . . . . . . . . . . . 961,46524,961 Yamana Gold, Inc. . . . . . . . . . . . . . . . . . . . . . . . . . . . . . 108,448
11,657,992
Chile - 0.12%7,073 Antofagasta PLC . . . . . . . . . . . . . . . . . . . . . . . . . . . . . . 164,753
Denmark - 2.60%160 A.P. Moeller - Maersk AS - Class A . . . . . . . . . . . . . . . 348,171165 A.P. Moeller - Maersk AS - Class B . . . . . . . . . . . . . . . 383,050
2,617 Ambu AS - Class B . . . . . . . . . . . . . . . . . . . . . . . . . . . . 122,901230 Carlsberg AS - Series B . . . . . . . . . . . . . . . . . . . . . . . . . 35,273
2,222 Coloplast AS - Series B . . . . . . . . . . . . . . . . . . . . . . . . . 334,0717,614 Danske Bank AS . . . . . . . . . . . . . . . . . . . . . . . . . . . . . . 142,4381,050 DSV PANALPINA AS . . . . . . . . . . . . . . . . . . . . . . . . . 205,951
566 Genmab AS (a) . . . . . . . . . . . . . . . . . . . . . . . . . . . . . . . 186,154350 GN Store Nord AS . . . . . . . . . . . . . . . . . . . . . . . . . . . . . 27,548
14,192 Novo Nordisk AS - Series B . . . . . . . . . . . . . . . . . . . . . 956,309
See notes to financial statements.
65

GuideMark® World ex-US FundSCHEDULE OF INVESTMENTS (Continued)March 31, 2021
Number ofShares Value
COMMON STOCKS (Continued)Denmark (Continued)
1,508 Orsted AS . . . . . . . . . . . . . . . . . . . . . . . . . . . . . . . . . . . $ 243,4903,470 Pandora AS (a) . . . . . . . . . . . . . . . . . . . . . . . . . . . . . . . 371,114
144 ROCKWOOL International AS - B Shares . . . . . . . . . . 60,609852 Vestas Wind Systems AS . . . . . . . . . . . . . . . . . . . . . . . 175,756
3,592,835
Finland - 0.65%499 Elisa OYJ . . . . . . . . . . . . . . . . . . . . . . . . . . . . . . . . . . . . 29,932
4,430 Kesko OYJ - Class B . . . . . . . . . . . . . . . . . . . . . . . . . . . 135,4801,254 Kone OYJ - Series B . . . . . . . . . . . . . . . . . . . . . . . . . . . 102,4972,519 Neste OYJ . . . . . . . . . . . . . . . . . . . . . . . . . . . . . . . . . . . 133,774
18,329 Nokia OYJ (a) . . . . . . . . . . . . . . . . . . . . . . . . . . . . . . . . 73,20010,599 Orion OYJ - Class B . . . . . . . . . . . . . . . . . . . . . . . . . . . 424,669
899,552
France - 9.64%2,209 Air Liquide SA . . . . . . . . . . . . . . . . . . . . . . . . . . . . . . . 360,678
335 Arkema SA . . . . . . . . . . . . . . . . . . . . . . . . . . . . . . . . . . 40,5706,890 Atos SE (a) . . . . . . . . . . . . . . . . . . . . . . . . . . . . . . . . . . 537,1793,572 AXA SA . . . . . . . . . . . . . . . . . . . . . . . . . . . . . . . . . . . . 95,8883,075 BioMerieux . . . . . . . . . . . . . . . . . . . . . . . . . . . . . . . . . . 391,1997,222 BNP Paribas SA . . . . . . . . . . . . . . . . . . . . . . . . . . . . . . 440,033
90,143 Bollore SA . . . . . . . . . . . . . . . . . . . . . . . . . . . . . . . . . . . 435,0225,605 Bouygues SA . . . . . . . . . . . . . . . . . . . . . . . . . . . . . . . . . 224,507
840 Capgemini SE . . . . . . . . . . . . . . . . . . . . . . . . . . . . . . . . 142,82316,429 Carrefour SA . . . . . . . . . . . . . . . . . . . . . . . . . . . . . . . . . 297,4588,316 Cie de Saint-Gobain . . . . . . . . . . . . . . . . . . . . . . . . . . . 491,074
328 Cie Generale des Etablissements Michelin SCA . . . . . . 49,12520,289 CNP Assurances . . . . . . . . . . . . . . . . . . . . . . . . . . . . . . 384,82115,602 Credit Agricole SA . . . . . . . . . . . . . . . . . . . . . . . . . . . . 225,9523,625 Danone SA . . . . . . . . . . . . . . . . . . . . . . . . . . . . . . . . . . . 248,125
175 Dassault Systemes SE . . . . . . . . . . . . . . . . . . . . . . . . . . 37,4042,670 Eiffage SA . . . . . . . . . . . . . . . . . . . . . . . . . . . . . . . . . . . 266,9715,417 Engie SA . . . . . . . . . . . . . . . . . . . . . . . . . . . . . . . . . . . . 76,951
874 EssilorLuxottica SA . . . . . . . . . . . . . . . . . . . . . . . . . . . . 142,381565 Hermes International . . . . . . . . . . . . . . . . . . . . . . . . . . . 624,891379 Iliad SA . . . . . . . . . . . . . . . . . . . . . . . . . . . . . . . . . . . . . 71,993
4,852 Ipsen SA . . . . . . . . . . . . . . . . . . . . . . . . . . . . . . . . . . . . 415,938471 Kering SA . . . . . . . . . . . . . . . . . . . . . . . . . . . . . . . . . . . 325,018
10,225 La Francaise des Jeux SAEM . . . . . . . . . . . . . . . . . . . . 464,647901 Legrand SA . . . . . . . . . . . . . . . . . . . . . . . . . . . . . . . . . . 83,711
2,346 L’Oreal SA . . . . . . . . . . . . . . . . . . . . . . . . . . . . . . . . . . 898,7122,073 LVMH Moet Hennessy Louis Vuitton SE . . . . . . . . . . 1,384,6694,181 Orange SA . . . . . . . . . . . . . . . . . . . . . . . . . . . . . . . . . . . 51,4516,193 Publicis Groupe SA . . . . . . . . . . . . . . . . . . . . . . . . . . . . 377,665
893 Remy Cointreau SA . . . . . . . . . . . . . . . . . . . . . . . . . . . . 164,842655 Safran SA (a) . . . . . . . . . . . . . . . . . . . . . . . . . . . . . . . . . 89,098
8,167 Sanofi . . . . . . . . . . . . . . . . . . . . . . . . . . . . . . . . . . . . . . . 807,5901,403 Sartorius Stedim Biotech . . . . . . . . . . . . . . . . . . . . . . . . 577,4042,818 Schneider Electric SE . . . . . . . . . . . . . . . . . . . . . . . . . . 429,2821,955 SEB SA . . . . . . . . . . . . . . . . . . . . . . . . . . . . . . . . . . . . . 344,4128,682 Suez Environnement Co. SA . . . . . . . . . . . . . . . . . . . . . 183,877
413 Teleperformance . . . . . . . . . . . . . . . . . . . . . . . . . . . . . . 150,5787,590 Total SA . . . . . . . . . . . . . . . . . . . . . . . . . . . . . . . . . . . . . 353,8451,065 Ubisoft Entertainment SA (a) . . . . . . . . . . . . . . . . . . . . 80,9465,204 Veolia Environnement SA . . . . . . . . . . . . . . . . . . . . . . . 133,5073,062 Vinci SA . . . . . . . . . . . . . . . . . . . . . . . . . . . . . . . . . . . . 313,617
766 Vivendi SA . . . . . . . . . . . . . . . . . . . . . . . . . . . . . . . . . . 25,143879 Worldline SA (a) . . . . . . . . . . . . . . . . . . . . . . . . . . . . . . 73,587
13,314,584
Number ofShares Value
Germany - 7.69%1,696 adidas AG . . . . . . . . . . . . . . . . . . . . . . . . . . . . . . . . . . . $ 529,8171,937 Allianz SE . . . . . . . . . . . . . . . . . . . . . . . . . . . . . . . . . . . 492,6886,417 Bayer AG . . . . . . . . . . . . . . . . . . . . . . . . . . . . . . . . . . . . 406,6661,932 Bayerische Motoren Werke AG . . . . . . . . . . . . . . . . . . 200,4972,051 Beiersdorf AG . . . . . . . . . . . . . . . . . . . . . . . . . . . . . . . . 216,7112,052 Brenntag AG . . . . . . . . . . . . . . . . . . . . . . . . . . . . . . . . . 175,3011,040 Carl Zeiss Meditec AG . . . . . . . . . . . . . . . . . . . . . . . . . 156,7641,501 Covestro AG . . . . . . . . . . . . . . . . . . . . . . . . . . . . . . . . . 100,9896,826 Daimler AG . . . . . . . . . . . . . . . . . . . . . . . . . . . . . . . . . . 609,2211,660 Delivery Hero SE (a) . . . . . . . . . . . . . . . . . . . . . . . . . . . 215,1651,085 Deutsche Boerse AG . . . . . . . . . . . . . . . . . . . . . . . . . . . 180,294
12,788 Deutsche Post AG . . . . . . . . . . . . . . . . . . . . . . . . . . . . . 701,56311,027 Deutsche Telekom AG . . . . . . . . . . . . . . . . . . . . . . . . . 222,2331,560 Deutsche Wohnen SE . . . . . . . . . . . . . . . . . . . . . . . . . . 72,7721,391 Fresenius Medical Care AG & Co. KGaA . . . . . . . . . . 102,4645,861 Fresenius SE & Co. KGaA . . . . . . . . . . . . . . . . . . . . . . 261,1691,008 GEA Group AG . . . . . . . . . . . . . . . . . . . . . . . . . . . . . . . 41,3445,655 HeidelbergCement AG . . . . . . . . . . . . . . . . . . . . . . . . . 513,8047,203 HelloFresh SE (a) . . . . . . . . . . . . . . . . . . . . . . . . . . . . . 536,682
879 HOCHTIEF AG . . . . . . . . . . . . . . . . . . . . . . . . . . . . . . 78,6956,239 Infineon Technologies AG . . . . . . . . . . . . . . . . . . . . . . 265,4551,592 KION Group AG . . . . . . . . . . . . . . . . . . . . . . . . . . . . . . 157,2992,052 Knorr-Bremse AG . . . . . . . . . . . . . . . . . . . . . . . . . . . . . 256,0751,822 Merck KGaA . . . . . . . . . . . . . . . . . . . . . . . . . . . . . . . . . 311,6623,765 Nemetschek SE . . . . . . . . . . . . . . . . . . . . . . . . . . . . . . . 240,3364,227 Puma SE . . . . . . . . . . . . . . . . . . . . . . . . . . . . . . . . . . . . 414,423
253 Rational AG . . . . . . . . . . . . . . . . . . . . . . . . . . . . . . . . . . 196,5323,296 RWE AG . . . . . . . . . . . . . . . . . . . . . . . . . . . . . . . . . . . . 129,3414,888 SAP SE . . . . . . . . . . . . . . . . . . . . . . . . . . . . . . . . . . . . . 599,5482,057 Siemens AG . . . . . . . . . . . . . . . . . . . . . . . . . . . . . . . . . . 337,9905,185 Siemens Energy AG (a) . . . . . . . . . . . . . . . . . . . . . . . . . 186,191
550 Symrise AG . . . . . . . . . . . . . . . . . . . . . . . . . . . . . . . . . . 66,733790 TeamViewer AG (a) . . . . . . . . . . . . . . . . . . . . . . . . . . . 33,785
9,320 Uniper SE . . . . . . . . . . . . . . . . . . . . . . . . . . . . . . . . . . . 337,6013,148 United Internet AG . . . . . . . . . . . . . . . . . . . . . . . . . . . . 126,3801,379 Volkswagen AG . . . . . . . . . . . . . . . . . . . . . . . . . . . . . . 500,2851,374 Vonovia SE . . . . . . . . . . . . . . . . . . . . . . . . . . . . . . . . . . 89,7905,731 Zalando SE (a) . . . . . . . . . . . . . . . . . . . . . . . . . . . . . . . . 561,569
10,625,834
Hong Kong - 2.78%72,146 AIA Group, Ltd. . . . . . . . . . . . . . . . . . . . . . . . . . . . . . . 882,83429,999 BOC Hong Kong Holdings, Ltd. . . . . . . . . . . . . . . . . . . 104,94827,576 CK Asset Holdings, Ltd. . . . . . . . . . . . . . . . . . . . . . . . . 167,87152,531 CK Hutchison Holdings, Ltd. . . . . . . . . . . . . . . . . . . . . 419,6871,758 Hang Seng Bank, Ltd. . . . . . . . . . . . . . . . . . . . . . . . . . . 34,137
11,939 Hong Kong Exchange & Clearing, Ltd. . . . . . . . . . . . . 708,2922,811 Jardine Matheson Holdings, Ltd. . . . . . . . . . . . . . . . . . . 184,168
11,846 Jardine Strategic Holdings, Ltd. . . . . . . . . . . . . . . . . . . 391,407155,130 PCCW, Ltd. . . . . . . . . . . . . . . . . . . . . . . . . . . . . . . . . . . 87,607
8,517 Swire Pacific, Ltd. - Class A . . . . . . . . . . . . . . . . . . . . . 64,15822,687 Techtronic Industries Co., Ltd. . . . . . . . . . . . . . . . . . . . 388,942
258,702 WH Group, Ltd. . . . . . . . . . . . . . . . . . . . . . . . . . . . . . . . 210,17756,720 Xinyi Glass Holdings, Ltd. . . . . . . . . . . . . . . . . . . . . . . 186,330
3,830,558
Ireland - 0.53%1,417 CRH PLC . . . . . . . . . . . . . . . . . . . . . . . . . . . . . . . . . . . 66,311
559 DCC PLC . . . . . . . . . . . . . . . . . . . . . . . . . . . . . . . . . . . 48,488876 Flutter Entertainment PLC (a) . . . . . . . . . . . . . . . . . . . . 187,910
5,189 James Hardie Industries PLC - CDI . . . . . . . . . . . . . . . 156,830
See notes to financial statements.
66
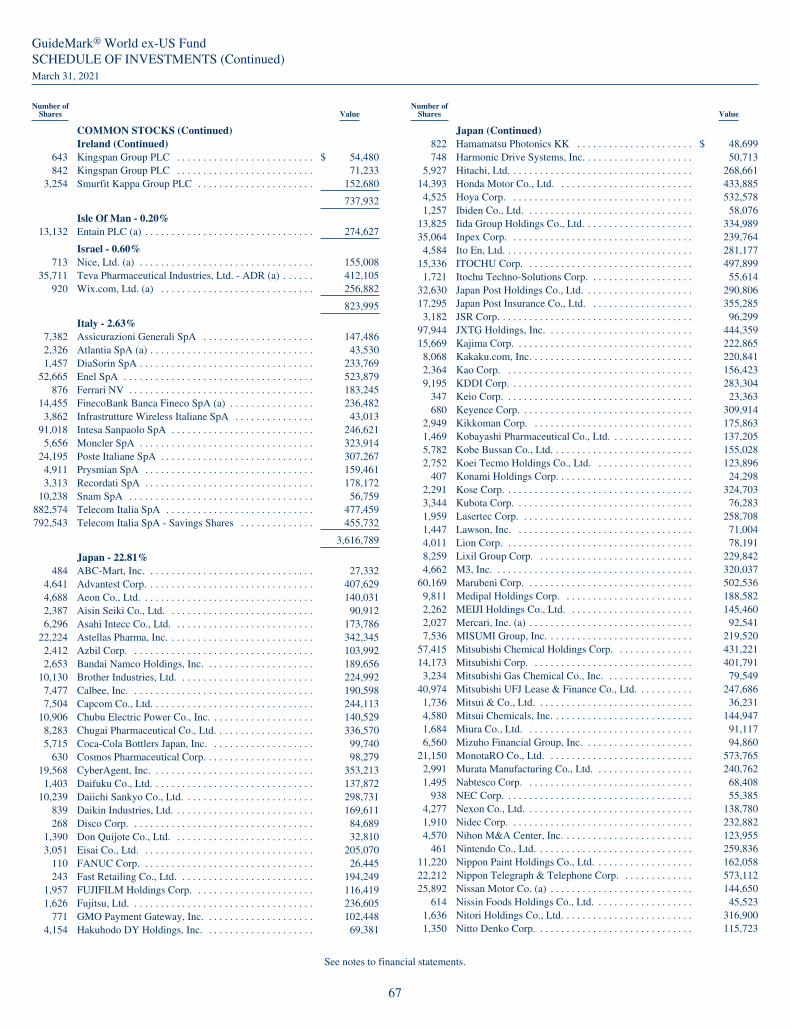
GuideMark® World ex-US FundSCHEDULE OF INVESTMENTS (Continued)March 31, 2021
Number ofShares Value
COMMON STOCKS (Continued)Ireland (Continued)
643 Kingspan Group PLC . . . . . . . . . . . . . . . . . . . . . . . . . . $ 54,480842 Kingspan Group PLC . . . . . . . . . . . . . . . . . . . . . . . . . . 71,233
3,254 Smurfit Kappa Group PLC . . . . . . . . . . . . . . . . . . . . . . 152,680
737,932
Isle Of Man - 0.20%13,132 Entain PLC (a) . . . . . . . . . . . . . . . . . . . . . . . . . . . . . . . . 274,627
Israel - 0.60%713 Nice, Ltd. (a) . . . . . . . . . . . . . . . . . . . . . . . . . . . . . . . . . 155,008
35,711 Teva Pharmaceutical Industries, Ltd. - ADR (a) . . . . . . 412,105920 Wix.com, Ltd. (a) . . . . . . . . . . . . . . . . . . . . . . . . . . . . . 256,882
823,995
Italy - 2.63%7,382 Assicurazioni Generali SpA . . . . . . . . . . . . . . . . . . . . . 147,4862,326 Atlantia SpA (a) . . . . . . . . . . . . . . . . . . . . . . . . . . . . . . . 43,5301,457 DiaSorin SpA . . . . . . . . . . . . . . . . . . . . . . . . . . . . . . . . . 233,769
52,665 Enel SpA . . . . . . . . . . . . . . . . . . . . . . . . . . . . . . . . . . . . 523,879876 Ferrari NV . . . . . . . . . . . . . . . . . . . . . . . . . . . . . . . . . . . 183,245
14,455 FinecoBank Banca Fineco SpA (a) . . . . . . . . . . . . . . . . 236,4823,862 Infrastrutture Wireless Italiane SpA . . . . . . . . . . . . . . . 43,013
91,018 Intesa Sanpaolo SpA . . . . . . . . . . . . . . . . . . . . . . . . . . . 246,6215,656 Moncler SpA . . . . . . . . . . . . . . . . . . . . . . . . . . . . . . . . . 323,914
24,195 Poste Italiane SpA . . . . . . . . . . . . . . . . . . . . . . . . . . . . . 307,2674,911 Prysmian SpA . . . . . . . . . . . . . . . . . . . . . . . . . . . . . . . . 159,4613,313 Recordati SpA . . . . . . . . . . . . . . . . . . . . . . . . . . . . . . . . 178,172
10,238 Snam SpA . . . . . . . . . . . . . . . . . . . . . . . . . . . . . . . . . . . 56,759882,574 Telecom Italia SpA . . . . . . . . . . . . . . . . . . . . . . . . . . . . 477,459792,543 Telecom Italia SpA - Savings Shares . . . . . . . . . . . . . . 455,732
3,616,789
Japan - 22.81%484 ABC-Mart, Inc. . . . . . . . . . . . . . . . . . . . . . . . . . . . . . . . 27,332
4,641 Advantest Corp. . . . . . . . . . . . . . . . . . . . . . . . . . . . . . . . 407,6294,688 Aeon Co., Ltd. . . . . . . . . . . . . . . . . . . . . . . . . . . . . . . . . 140,0312,387 Aisin Seiki Co., Ltd. . . . . . . . . . . . . . . . . . . . . . . . . . . . 90,9126,296 Asahi Intecc Co., Ltd. . . . . . . . . . . . . . . . . . . . . . . . . . . 173,786
22,224 Astellas Pharma, Inc. . . . . . . . . . . . . . . . . . . . . . . . . . . . 342,3452,412 Azbil Corp. . . . . . . . . . . . . . . . . . . . . . . . . . . . . . . . . . . 103,9922,653 Bandai Namco Holdings, Inc. . . . . . . . . . . . . . . . . . . . . 189,656
10,130 Brother Industries, Ltd. . . . . . . . . . . . . . . . . . . . . . . . . . 224,9927,477 Calbee, Inc. . . . . . . . . . . . . . . . . . . . . . . . . . . . . . . . . . . 190,5987,504 Capcom Co., Ltd. . . . . . . . . . . . . . . . . . . . . . . . . . . . . . . 244,113
10,906 Chubu Electric Power Co., Inc. . . . . . . . . . . . . . . . . . . . 140,5298,283 Chugai Pharmaceutical Co., Ltd. . . . . . . . . . . . . . . . . . . 336,5705,715 Coca-Cola Bottlers Japan, Inc. . . . . . . . . . . . . . . . . . . . 99,740
630 Cosmos Pharmaceutical Corp. . . . . . . . . . . . . . . . . . . . . 98,27919,568 CyberAgent, Inc. . . . . . . . . . . . . . . . . . . . . . . . . . . . . . . 353,2131,403 Daifuku Co., Ltd. . . . . . . . . . . . . . . . . . . . . . . . . . . . . . . 137,872
10,239 Daiichi Sankyo Co., Ltd. . . . . . . . . . . . . . . . . . . . . . . . . 298,731839 Daikin Industries, Ltd. . . . . . . . . . . . . . . . . . . . . . . . . . . 169,611268 Disco Corp. . . . . . . . . . . . . . . . . . . . . . . . . . . . . . . . . . . 84,689
1,390 Don Quijote Co., Ltd. . . . . . . . . . . . . . . . . . . . . . . . . . . 32,8103,051 Eisai Co., Ltd. . . . . . . . . . . . . . . . . . . . . . . . . . . . . . . . . 205,070
110 FANUC Corp. . . . . . . . . . . . . . . . . . . . . . . . . . . . . . . . . 26,445243 Fast Retailing Co., Ltd. . . . . . . . . . . . . . . . . . . . . . . . . . 194,249
1,957 FUJIFILM Holdings Corp. . . . . . . . . . . . . . . . . . . . . . . 116,4191,626 Fujitsu, Ltd. . . . . . . . . . . . . . . . . . . . . . . . . . . . . . . . . . . 236,605
771 GMO Payment Gateway, Inc. . . . . . . . . . . . . . . . . . . . . 102,4484,154 Hakuhodo DY Holdings, Inc. . . . . . . . . . . . . . . . . . . . . 69,381
Number ofShares Value
Japan (Continued)822 Hamamatsu Photonics KK . . . . . . . . . . . . . . . . . . . . . . $ 48,699748 Harmonic Drive Systems, Inc. . . . . . . . . . . . . . . . . . . . . 50,713
5,927 Hitachi, Ltd. . . . . . . . . . . . . . . . . . . . . . . . . . . . . . . . . . . 268,66114,393 Honda Motor Co., Ltd. . . . . . . . . . . . . . . . . . . . . . . . . . 433,8854,525 Hoya Corp. . . . . . . . . . . . . . . . . . . . . . . . . . . . . . . . . . . 532,5781,257 Ibiden Co., Ltd. . . . . . . . . . . . . . . . . . . . . . . . . . . . . . . . 58,076
13,825 Iida Group Holdings Co., Ltd. . . . . . . . . . . . . . . . . . . . . 334,98935,064 Inpex Corp. . . . . . . . . . . . . . . . . . . . . . . . . . . . . . . . . . . 239,7644,584 Ito En, Ltd. . . . . . . . . . . . . . . . . . . . . . . . . . . . . . . . . . . . 281,177
15,336 ITOCHU Corp. . . . . . . . . . . . . . . . . . . . . . . . . . . . . . . . 497,8991,721 Itochu Techno-Solutions Corp. . . . . . . . . . . . . . . . . . . . 55,614
32,630 Japan Post Holdings Co., Ltd. . . . . . . . . . . . . . . . . . . . . 290,80617,295 Japan Post Insurance Co., Ltd. . . . . . . . . . . . . . . . . . . . 355,2853,182 JSR Corp. . . . . . . . . . . . . . . . . . . . . . . . . . . . . . . . . . . . . 96,299
97,944 JXTG Holdings, Inc. . . . . . . . . . . . . . . . . . . . . . . . . . . . 444,35915,669 Kajima Corp. . . . . . . . . . . . . . . . . . . . . . . . . . . . . . . . . . 222,8658,068 Kakaku.com, Inc. . . . . . . . . . . . . . . . . . . . . . . . . . . . . . . 220,8412,364 Kao Corp. . . . . . . . . . . . . . . . . . . . . . . . . . . . . . . . . . . . 156,4239,195 KDDI Corp. . . . . . . . . . . . . . . . . . . . . . . . . . . . . . . . . . . 283,304
347 Keio Corp. . . . . . . . . . . . . . . . . . . . . . . . . . . . . . . . . . . . 23,363680 Keyence Corp. . . . . . . . . . . . . . . . . . . . . . . . . . . . . . . . . 309,914
2,949 Kikkoman Corp. . . . . . . . . . . . . . . . . . . . . . . . . . . . . . . 175,8631,469 Kobayashi Pharmaceutical Co., Ltd. . . . . . . . . . . . . . . . 137,2055,782 Kobe Bussan Co., Ltd. . . . . . . . . . . . . . . . . . . . . . . . . . . 155,0282,752 Koei Tecmo Holdings Co., Ltd. . . . . . . . . . . . . . . . . . . 123,896
407 Konami Holdings Corp. . . . . . . . . . . . . . . . . . . . . . . . . . 24,2982,291 Kose Corp. . . . . . . . . . . . . . . . . . . . . . . . . . . . . . . . . . . . 324,7033,344 Kubota Corp. . . . . . . . . . . . . . . . . . . . . . . . . . . . . . . . . . 76,2831,959 Lasertec Corp. . . . . . . . . . . . . . . . . . . . . . . . . . . . . . . . . 258,7081,447 Lawson, Inc. . . . . . . . . . . . . . . . . . . . . . . . . . . . . . . . . . 71,0044,011 Lion Corp. . . . . . . . . . . . . . . . . . . . . . . . . . . . . . . . . . . . 78,1918,259 Lixil Group Corp. . . . . . . . . . . . . . . . . . . . . . . . . . . . . . 229,8424,662 M3, Inc. . . . . . . . . . . . . . . . . . . . . . . . . . . . . . . . . . . . . . 320,037
60,169 Marubeni Corp. . . . . . . . . . . . . . . . . . . . . . . . . . . . . . . . 502,5369,811 Medipal Holdings Corp. . . . . . . . . . . . . . . . . . . . . . . . . 188,5822,262 MEIJI Holdings Co., Ltd. . . . . . . . . . . . . . . . . . . . . . . . 145,4602,027 Mercari, Inc. (a) . . . . . . . . . . . . . . . . . . . . . . . . . . . . . . . 92,5417,536 MISUMI Group, Inc. . . . . . . . . . . . . . . . . . . . . . . . . . . . 219,520
57,415 Mitsubishi Chemical Holdings Corp. . . . . . . . . . . . . . . 431,22114,173 Mitsubishi Corp. . . . . . . . . . . . . . . . . . . . . . . . . . . . . . . 401,7913,234 Mitsubishi Gas Chemical Co., Inc. . . . . . . . . . . . . . . . . 79,549
40,974 Mitsubishi UFJ Lease & Finance Co., Ltd. . . . . . . . . . . 247,6861,736 Mitsui & Co., Ltd. . . . . . . . . . . . . . . . . . . . . . . . . . . . . . 36,2314,580 Mitsui Chemicals, Inc. . . . . . . . . . . . . . . . . . . . . . . . . . . 144,9471,684 Miura Co., Ltd. . . . . . . . . . . . . . . . . . . . . . . . . . . . . . . . 91,1176,560 Mizuho Financial Group, Inc. . . . . . . . . . . . . . . . . . . . . 94,860
21,150 MonotaRO Co., Ltd. . . . . . . . . . . . . . . . . . . . . . . . . . . . 573,7652,991 Murata Manufacturing Co., Ltd. . . . . . . . . . . . . . . . . . . 240,7621,495 Nabtesco Corp. . . . . . . . . . . . . . . . . . . . . . . . . . . . . . . . 68,408
938 NEC Corp. . . . . . . . . . . . . . . . . . . . . . . . . . . . . . . . . . . . 55,3854,277 Nexon Co., Ltd. . . . . . . . . . . . . . . . . . . . . . . . . . . . . . . . 138,7801,910 Nidec Corp. . . . . . . . . . . . . . . . . . . . . . . . . . . . . . . . . . . 232,8824,570 Nihon M&A Center, Inc. . . . . . . . . . . . . . . . . . . . . . . . . 123,955
461 Nintendo Co., Ltd. . . . . . . . . . . . . . . . . . . . . . . . . . . . . . 259,83611,220 Nippon Paint Holdings Co., Ltd. . . . . . . . . . . . . . . . . . . 162,05822,212 Nippon Telegraph & Telephone Corp. . . . . . . . . . . . . . 573,11225,892 Nissan Motor Co. (a) . . . . . . . . . . . . . . . . . . . . . . . . . . . 144,650
614 Nissin Foods Holdings Co., Ltd. . . . . . . . . . . . . . . . . . . 45,5231,636 Nitori Holdings Co., Ltd. . . . . . . . . . . . . . . . . . . . . . . . . 316,9001,350 Nitto Denko Corp. . . . . . . . . . . . . . . . . . . . . . . . . . . . . . 115,723
See notes to financial statements.
67

GuideMark® World ex-US FundSCHEDULE OF INVESTMENTS (Continued)March 31, 2021
Number ofShares Value
COMMON STOCKS (Continued)Japan (Continued)
31,686 Nomura Holdings, Inc. . . . . . . . . . . . . . . . . . . . . . . . . . $ 167,8875,232 Nomura Research Institute, Ltd. . . . . . . . . . . . . . . . . . . 162,547
17,264 Obayashi Corp. . . . . . . . . . . . . . . . . . . . . . . . . . . . . . . . 158,466471 Obic Co., Ltd. . . . . . . . . . . . . . . . . . . . . . . . . . . . . . . . . 86,425
32,055 Oji Holdings Corp. . . . . . . . . . . . . . . . . . . . . . . . . . . . . 207,84416,119 Olympus Corp. . . . . . . . . . . . . . . . . . . . . . . . . . . . . . . . 334,3713,329 Omron Corp. . . . . . . . . . . . . . . . . . . . . . . . . . . . . . . . . . 260,7694,253 Ono Pharmaceutical Co., Ltd. . . . . . . . . . . . . . . . . . . . . 111,226
455 Oracle Corp. . . . . . . . . . . . . . . . . . . . . . . . . . . . . . . . . . 44,54210,871 ORIX Corp. . . . . . . . . . . . . . . . . . . . . . . . . . . . . . . . . . . 183,8593,368 Osaka Securities Exchange Co., Ltd. . . . . . . . . . . . . . . 79,1162,529 Otsuka Holdings Co., Ltd. . . . . . . . . . . . . . . . . . . . . . . . 107,252
14,250 Persol Holdings Co., Ltd. . . . . . . . . . . . . . . . . . . . . . . . 280,1034,912 Pigeon Corp. . . . . . . . . . . . . . . . . . . . . . . . . . . . . . . . . . 186,259
15,072 Pola Orbis Holdings, Inc. . . . . . . . . . . . . . . . . . . . . . . . 363,5008,678 Rakuten, Inc. . . . . . . . . . . . . . . . . . . . . . . . . . . . . . . . . . 103,675
11,724 Recruit Holdings Co., Ltd. . . . . . . . . . . . . . . . . . . . . . . 575,7212,415 Renesas Electronics Corp. (a) . . . . . . . . . . . . . . . . . . . . 26,441
42,166 Resona Holdings, Inc. . . . . . . . . . . . . . . . . . . . . . . . . . . 177,11925,688 Ricoh Co., Ltd. . . . . . . . . . . . . . . . . . . . . . . . . . . . . . . . 261,842
582 Rinnai Corp. . . . . . . . . . . . . . . . . . . . . . . . . . . . . . . . . . 65,27810,894 Ryohin Keikaku Co., Ltd. . . . . . . . . . . . . . . . . . . . . . . . 258,5834,071 Seiko Epson Corp. . . . . . . . . . . . . . . . . . . . . . . . . . . . . . 66,459
18,161 Sekisui House, Ltd. . . . . . . . . . . . . . . . . . . . . . . . . . . . . 390,6463,693 Seven & I Holdings Co., Ltd. - Series A . . . . . . . . . . . . 149,1294,920 SG Holdings Co., Ltd. . . . . . . . . . . . . . . . . . . . . . . . . . . 112,960
755 Shimadzu Corp. . . . . . . . . . . . . . . . . . . . . . . . . . . . . . . . 27,3771,080 Shimamura Co., Ltd. . . . . . . . . . . . . . . . . . . . . . . . . . . . 124,800
456 Shimano, Inc. . . . . . . . . . . . . . . . . . . . . . . . . . . . . . . . . . 108,9111,337 Shin-Etsu Chemical Co., Ltd. . . . . . . . . . . . . . . . . . . . . 226,4883,325 Shinsei Bank, Ltd. . . . . . . . . . . . . . . . . . . . . . . . . . . . . . 53,7365,821 Shiseido Co., Ltd. . . . . . . . . . . . . . . . . . . . . . . . . . . . . . 391,487
271 SMC Corp. . . . . . . . . . . . . . . . . . . . . . . . . . . . . . . . . . . . 157,8254,581 SoftBank Group Corp. . . . . . . . . . . . . . . . . . . . . . . . . . . 390,0167,541 Sony Corp. . . . . . . . . . . . . . . . . . . . . . . . . . . . . . . . . . . . 798,090
981 Square Enix Holdings Co., Ltd. . . . . . . . . . . . . . . . . . . . 54,5624,768 Subaru Corp. . . . . . . . . . . . . . . . . . . . . . . . . . . . . . . . . . 95,296
52,314 Sumitomo Chemical Co., Ltd. . . . . . . . . . . . . . . . . . . . . 271,42017,884 Sumitomo Corp. . . . . . . . . . . . . . . . . . . . . . . . . . . . . . . 255,95010,968 Sumitomo Dainippon Pharma Co., Ltd. . . . . . . . . . . . . 191,3271,579 Sumitomo Metal Mining Co., Ltd. . . . . . . . . . . . . . . . . 68,4268,670 Sumitomo Mitsui Financial Group, Inc. . . . . . . . . . . . . 314,2644,758 Sumitomo Mitsui Trust Holdings, Inc. . . . . . . . . . . . . . 166,0047,070 Sundrug Co., Ltd. . . . . . . . . . . . . . . . . . . . . . . . . . . . . . 259,0203,549 Suzuken Co., Ltd. . . . . . . . . . . . . . . . . . . . . . . . . . . . . . 138,8522,855 Sysmex Corp. . . . . . . . . . . . . . . . . . . . . . . . . . . . . . . . . 308,1798,800 T&D Holdings, Inc. . . . . . . . . . . . . . . . . . . . . . . . . . . . . 113,2358,006 Taiheiyo Cement Corp. . . . . . . . . . . . . . . . . . . . . . . . . . 210,954
795 Taisho Pharmaceutical Holdings Co., Ltd. . . . . . . . . . . 51,3745,406 Takeda Pharmaceutical Co., Ltd. . . . . . . . . . . . . . . . . . 197,060
515 TDK Corp. . . . . . . . . . . . . . . . . . . . . . . . . . . . . . . . . . . . 71,6921,499 Toho Gas Co., Ltd. . . . . . . . . . . . . . . . . . . . . . . . . . . . . 92,501
851 Tokyo Century Corp. . . . . . . . . . . . . . . . . . . . . . . . . . . . 57,340997 Tokyo Electron, Ltd. . . . . . . . . . . . . . . . . . . . . . . . . . . . 433,330
6,897 Tokyo Gas Co., Ltd. . . . . . . . . . . . . . . . . . . . . . . . . . . . 153,65637,272 Toray Industries, Inc. . . . . . . . . . . . . . . . . . . . . . . . . . . . 240,6361,424 Toyo Suisan Kaisha, Ltd. . . . . . . . . . . . . . . . . . . . . . . . 59,764
310 Toyota Industries Corp. . . . . . . . . . . . . . . . . . . . . . . . . . 27,7014,207 Toyota Motor Corp. . . . . . . . . . . . . . . . . . . . . . . . . . . . . 327,389
Number ofShares Value
Japan (Continued)8,962 Toyota Tsusho Corp. . . . . . . . . . . . . . . . . . . . . . . . . . . . $ 377,3941,343 Trend Micro, Inc. . . . . . . . . . . . . . . . . . . . . . . . . . . . . . . 67,4161,819 Tsuruha Holdings, Inc. . . . . . . . . . . . . . . . . . . . . . . . . . 234,7202,478 Unicharm Corp. . . . . . . . . . . . . . . . . . . . . . . . . . . . . . . . 104,053
11,512 Welcia Holdings Co., Ltd. . . . . . . . . . . . . . . . . . . . . . . . 394,97560,098 Yamada Denki Co., Ltd. . . . . . . . . . . . . . . . . . . . . . . . . 324,7833,184 Yamato Holdings Co., Ltd. . . . . . . . . . . . . . . . . . . . . . . 87,437
14,269 Yamazaki Baking Co., Ltd. . . . . . . . . . . . . . . . . . . . . . . 230,546530 Yaskawa Electric Corp. . . . . . . . . . . . . . . . . . . . . . . . . . 26,480
20,486 Z Holdings Corp. . . . . . . . . . . . . . . . . . . . . . . . . . . . . . . 102,18815,136 ZOZO, Inc. . . . . . . . . . . . . . . . . . . . . . . . . . . . . . . . . . . 448,395
31,505,467
Jersey - 0.80%5,660 Ferguson PLC . . . . . . . . . . . . . . . . . . . . . . . . . . . . . . . . 676,119
62,698 Glencore PLC . . . . . . . . . . . . . . . . . . . . . . . . . . . . . . . . 246,17914,671 WPP PLC . . . . . . . . . . . . . . . . . . . . . . . . . . . . . . . . . . . . 186,961
1,109,259
Luxembourg - 0.41%1,961 Eurofins Scientific SE (a) . . . . . . . . . . . . . . . . . . . . . . . 187,434
10,917 SES SA . . . . . . . . . . . . . . . . . . . . . . . . . . . . . . . . . . . . . 86,60525,615 Tenaris SA . . . . . . . . . . . . . . . . . . . . . . . . . . . . . . . . . . . 289,654
563,693
Mexico - 0.08%9,784 Fresnillo PLC . . . . . . . . . . . . . . . . . . . . . . . . . . . . . . . . . 116,535
Netherlands - 4.38%108 Adyen NV (a) . . . . . . . . . . . . . . . . . . . . . . . . . . . . . . . . 240,993566 Akzo Nobel NV . . . . . . . . . . . . . . . . . . . . . . . . . . . . . . . 63,192
26,793 ArcelorMittal (a) . . . . . . . . . . . . . . . . . . . . . . . . . . . . . . 771,144263 Argenx SE (a) . . . . . . . . . . . . . . . . . . . . . . . . . . . . . . . . 72,318377 ASM International NV . . . . . . . . . . . . . . . . . . . . . . . . . 109,309
2,308 ASML Holding NV . . . . . . . . . . . . . . . . . . . . . . . . . . . . 1,416,12328,833 ING Groep NV . . . . . . . . . . . . . . . . . . . . . . . . . . . . . . . 352,17022,273 Koninklijke Ahold Delhaize NV . . . . . . . . . . . . . . . . . . 621,2601,334 Koninklijke DSM NV . . . . . . . . . . . . . . . . . . . . . . . . . . 225,5245,910 Koninklijke Philips NV . . . . . . . . . . . . . . . . . . . . . . . . . 337,0218,411 NN Group NV . . . . . . . . . . . . . . . . . . . . . . . . . . . . . . . . 410,3021,695 Prosus NV . . . . . . . . . . . . . . . . . . . . . . . . . . . . . . . . . . . 188,6182,437 QIAGEN NV (a) . . . . . . . . . . . . . . . . . . . . . . . . . . . . . . 117,9495,342 Randstad Holding NV . . . . . . . . . . . . . . . . . . . . . . . . . . 374,9839,706 STMicroelectronics NV . . . . . . . . . . . . . . . . . . . . . . . . . 370,8234,488 Wolters Kluwer NV . . . . . . . . . . . . . . . . . . . . . . . . . . . . 389,806
6,061,535
New Zealand - 0.42%6,669 a2 Milk Co., Ltd. (a) . . . . . . . . . . . . . . . . . . . . . . . . . . . 40,2597,064 Fisher & Paykel Healthcare Corp., Ltd. . . . . . . . . . . . . 158,605
15,343 Meridian Energy, Ltd. . . . . . . . . . . . . . . . . . . . . . . . . . . 57,84117,409 Spark New Zealand, Ltd. . . . . . . . . . . . . . . . . . . . . . . . . 54,5282,732 Xero, Ltd. (a) . . . . . . . . . . . . . . . . . . . . . . . . . . . . . . . . . 264,419
575,652
Norway - 0.57%4,603 Adevinta ASA (a) . . . . . . . . . . . . . . . . . . . . . . . . . . . . . 67,8225,590 Gjensidige Forsikring ASA . . . . . . . . . . . . . . . . . . . . . . 131,098
48,035 Norsk Hydro ASA . . . . . . . . . . . . . . . . . . . . . . . . . . . . . 308,5279,998 Orkla ASA . . . . . . . . . . . . . . . . . . . . . . . . . . . . . . . . . . . 98,0512,091 Schibsted ASA - Class A . . . . . . . . . . . . . . . . . . . . . . . . 87,887
See notes to financial statements.
68

GuideMark® World ex-US FundSCHEDULE OF INVESTMENTS (Continued)March 31, 2021
Number ofShares Value
COMMON STOCKS (Continued)Norway (Continued)
2,795 Schibsted ASA - Class B . . . . . . . . . . . . . . . . . . . . . . . . $ 100,180
793,565
Portugal - 0.32%27,515 EDP - Energias de Portugal SA . . . . . . . . . . . . . . . . . . . 157,15716,910 Jeronimo Martins SGPS SA . . . . . . . . . . . . . . . . . . . . . 284,283
441,440
Singapore - 1.17%12,484 DBS Group Holdings, Ltd. . . . . . . . . . . . . . . . . . . . . . . 267,67426,845 Oversea-Chinese Banking Corp., Ltd. . . . . . . . . . . . . . . 234,86778,960 Singapore Exchange, Ltd. . . . . . . . . . . . . . . . . . . . . . . . 585,62515,474 United Overseas Bank, Ltd. . . . . . . . . . . . . . . . . . . . . . . 298,3703,725 Venture Corp., Ltd. . . . . . . . . . . . . . . . . . . . . . . . . . . . . 55,623
44,277 Wilmar International, Ltd. . . . . . . . . . . . . . . . . . . . . . . . 178,819
1,620,978
Spain - 1.59%19,460 ACS, Actividades de Construccion y Servicios SA . . . 646,76747,053 CaixaBank SA . . . . . . . . . . . . . . . . . . . . . . . . . . . . . . . . 146,0902,345 Cellnex Telecom SA . . . . . . . . . . . . . . . . . . . . . . . . . . . 135,1852,125 Enagas SA . . . . . . . . . . . . . . . . . . . . . . . . . . . . . . . . . . . 46,2633,702 Endesa SA . . . . . . . . . . . . . . . . . . . . . . . . . . . . . . . . . . . 98,1121,762 Grifols SA . . . . . . . . . . . . . . . . . . . . . . . . . . . . . . . . . . . 46,115
21,976 Iberdrola SA . . . . . . . . . . . . . . . . . . . . . . . . . . . . . . . . . 283,64413,470 Industria de Diseno Textil SA . . . . . . . . . . . . . . . . . . . . 445,0506,082 Siemens Gamesa Renewable Energy SA . . . . . . . . . . . 235,888
26,193 Telefonica SA . . . . . . . . . . . . . . . . . . . . . . . . . . . . . . . . 117,761
2,200,875
Sweden - 2.95%1,290 Assa Abloy AB - Class B . . . . . . . . . . . . . . . . . . . . . . . 37,1273,759 Atlas Copco AB - Class A . . . . . . . . . . . . . . . . . . . . . . . 229,1762,654 Atlas Copco AB - Class B . . . . . . . . . . . . . . . . . . . . . . . 138,320
669 Boliden AB . . . . . . . . . . . . . . . . . . . . . . . . . . . . . . . . . . 24,8221,307 Electrolux AB - Series B (a)(b) . . . . . . . . . . . . . . . . . . . 36,3362,834 Epiroc AB - Class A . . . . . . . . . . . . . . . . . . . . . . . . . . . 64,2024,137 Epiroc AB - Class B . . . . . . . . . . . . . . . . . . . . . . . . . . . 86,1806,090 EQT AB . . . . . . . . . . . . . . . . . . . . . . . . . . . . . . . . . . . . . 200,5062,515 Evolution Gaming Group AB . . . . . . . . . . . . . . . . . . . . 370,372
15,091 Hennes & Mauritz AB - Series B (a) . . . . . . . . . . . . . . . 340,098798 Hexagon AB - Class B . . . . . . . . . . . . . . . . . . . . . . . . . 73,662
9,979 Husqvarna AB - Class B . . . . . . . . . . . . . . . . . . . . . . . . 143,8631,010 ICA Gruppen AB . . . . . . . . . . . . . . . . . . . . . . . . . . . . . . 49,3904,512 Investment AB Latour - B Shares . . . . . . . . . . . . . . . . . 116,9144,173 Investor AB - B Shares . . . . . . . . . . . . . . . . . . . . . . . . . 332,9637,217 Kinnevik AB - B Shares (a) . . . . . . . . . . . . . . . . . . . . . . 350,7617,130 Nibe Industrier AB - B Shares . . . . . . . . . . . . . . . . . . . . 221,125
11,856 Skanska AB - B Shares (b) . . . . . . . . . . . . . . . . . . . . . . 297,3442,274 SKF AB - B Shares . . . . . . . . . . . . . . . . . . . . . . . . . . . . 64,7068,135 Svenska Cellulosa AB - Series B . . . . . . . . . . . . . . . . . 143,9906,600 Swedish Match AB . . . . . . . . . . . . . . . . . . . . . . . . . . . . 514,874
13,828 Telefonaktiebolaget LM Ericsson - B Shares . . . . . . . . 183,2942,218 Volvo AB - Class B (b) . . . . . . . . . . . . . . . . . . . . . . . . . 56,171
4,076,196
Switzerland - 7.37%4,775 ABB, Ltd. . . . . . . . . . . . . . . . . . . . . . . . . . . . . . . . . . . . 145,2632,066 Adecco Group AG . . . . . . . . . . . . . . . . . . . . . . . . . . . . . 139,356
637 Banque Cantonale Vaudoise . . . . . . . . . . . . . . . . . . . . . 62,154426 Cie Financiere Richemont SA . . . . . . . . . . . . . . . . . . . . 40,906
Number ofShares Value
Switzerland (Continued)1,669 Coca-Cola HBC AG . . . . . . . . . . . . . . . . . . . . . . . . . . . $ 53,048
33,072 Credit Suisse Group AG . . . . . . . . . . . . . . . . . . . . . . . . 349,881148 EMS-Chemie Holding AG . . . . . . . . . . . . . . . . . . . . . . 132,211
62 Givaudan SA . . . . . . . . . . . . . . . . . . . . . . . . . . . . . . . . . 239,1492,024 Kuehne & Nagel International AG . . . . . . . . . . . . . . . . 578,1074,060 LafargeHolcim, Ltd. . . . . . . . . . . . . . . . . . . . . . . . . . . . 238,7484,029 Logitech International SA . . . . . . . . . . . . . . . . . . . . . . . 422,538
429 Lonza Group AG . . . . . . . . . . . . . . . . . . . . . . . . . . . . . . 239,93919,336 Nestle SA . . . . . . . . . . . . . . . . . . . . . . . . . . . . . . . . . . . . 2,155,50714,290 Novartis AG . . . . . . . . . . . . . . . . . . . . . . . . . . . . . . . . . . 1,221,519
438 Partners Group Holding AG . . . . . . . . . . . . . . . . . . . . . 559,732375 Roche Holding AG - BR . . . . . . . . . . . . . . . . . . . . . . . . 128,466
5,984 Roche Holding AG - GENUS . . . . . . . . . . . . . . . . . . . 1,938,477121 SGS SA . . . . . . . . . . . . . . . . . . . . . . . . . . . . . . . . . . . . . 343,809635 Sika AG . . . . . . . . . . . . . . . . . . . . . . . . . . . . . . . . . . . . . 181,581110 Sonova Holding AG (a) . . . . . . . . . . . . . . . . . . . . . . . . . 29,158221 Straumann Holding AG . . . . . . . . . . . . . . . . . . . . . . . . . 275,923
96 Swiss Life Holding AG . . . . . . . . . . . . . . . . . . . . . . . . . 47,178559 The Swatch Group AG - Group I . . . . . . . . . . . . . . . . . 160,958
2,516 The Swatch Group AG - Group N . . . . . . . . . . . . . . . . . 140,29316,125 UBS Group AG . . . . . . . . . . . . . . . . . . . . . . . . . . . . . . . 249,478
239 Zurich Insurance Group AG . . . . . . . . . . . . . . . . . . . . . 101,731
10,175,110
United Kingdom - 10.07%15,937 Admiral Group PLC . . . . . . . . . . . . . . . . . . . . . . . . . . . 681,1654,830 Anglo American PLC . . . . . . . . . . . . . . . . . . . . . . . . . . 189,1824,729 Ashtead Group PLC . . . . . . . . . . . . . . . . . . . . . . . . . . . 282,3023,495 Associated British Foods PLC (a) . . . . . . . . . . . . . . . . . 116,1178,918 AstraZeneca PLC . . . . . . . . . . . . . . . . . . . . . . . . . . . . . . 890,097
55,535 Auto Trader Group PLC (a) . . . . . . . . . . . . . . . . . . . . . 424,624663 AVEVA Group PLC . . . . . . . . . . . . . . . . . . . . . . . . . . . 31,275
76,040 Aviva PLC . . . . . . . . . . . . . . . . . . . . . . . . . . . . . . . . . . . 428,61689,497 Barclays PLC . . . . . . . . . . . . . . . . . . . . . . . . . . . . . . . . . 229,1965,708 Barratt Developments PLC . . . . . . . . . . . . . . . . . . . . . . 58,7138,596 BHP Group PLC . . . . . . . . . . . . . . . . . . . . . . . . . . . . . . 247,498
19,034 BP PLC . . . . . . . . . . . . . . . . . . . . . . . . . . . . . . . . . . . . . 77,31614,115 British American Tobacco PLC . . . . . . . . . . . . . . . . . . 536,52055,570 BT Group PLC (a) . . . . . . . . . . . . . . . . . . . . . . . . . . . . . 118,5493,603 Bunzl PLC . . . . . . . . . . . . . . . . . . . . . . . . . . . . . . . . . . . 115,324
13,587 Burberry Group PLC (a) . . . . . . . . . . . . . . . . . . . . . . . . 355,4352,237 Coca-Cola European Partners PLC . . . . . . . . . . . . . . . . 116,6821,709 Croda International PLC . . . . . . . . . . . . . . . . . . . . . . . . 149,5323,700 Diageo PLC . . . . . . . . . . . . . . . . . . . . . . . . . . . . . . . . . . 152,002
44,173 Evraz PLC . . . . . . . . . . . . . . . . . . . . . . . . . . . . . . . . . . . 351,78732,875 GlaxoSmithKline PLC . . . . . . . . . . . . . . . . . . . . . . . . . . 581,9834,288 Halma PLC . . . . . . . . . . . . . . . . . . . . . . . . . . . . . . . . . . 140,290
20,564 Hargreaves Lansdown PLC . . . . . . . . . . . . . . . . . . . . . . 436,9395,512 Hikma Pharmaceuticals PLC . . . . . . . . . . . . . . . . . . . . . 172,9117,300 HSBC Holdings PLC . . . . . . . . . . . . . . . . . . . . . . . . . . . 42,5503,972 Imperial Brands PLC . . . . . . . . . . . . . . . . . . . . . . . . . . . 81,430
156,242 J. Sainsbury PLC . . . . . . . . . . . . . . . . . . . . . . . . . . . . . . 522,47440,986 JD Sports Fashion PLC (a) . . . . . . . . . . . . . . . . . . . . . . 465,9225,056 Johnson Matthey PLC . . . . . . . . . . . . . . . . . . . . . . . . . . 210,027
89,378 Kingfisher PLC . . . . . . . . . . . . . . . . . . . . . . . . . . . . . . . 391,74956,220 Legal & General Group PLC . . . . . . . . . . . . . . . . . . . . . 215,8592,456 London Stock Exchange Group PLC . . . . . . . . . . . . . . 234,794
183,237 M&G PLC . . . . . . . . . . . . . . . . . . . . . . . . . . . . . . . . . . . 523,6332,722 Next PLC (a) . . . . . . . . . . . . . . . . . . . . . . . . . . . . . . . . . 295,0189,077 Ocado Group PLC (a) . . . . . . . . . . . . . . . . . . . . . . . . . . 254,495
See notes to financial statements.
69
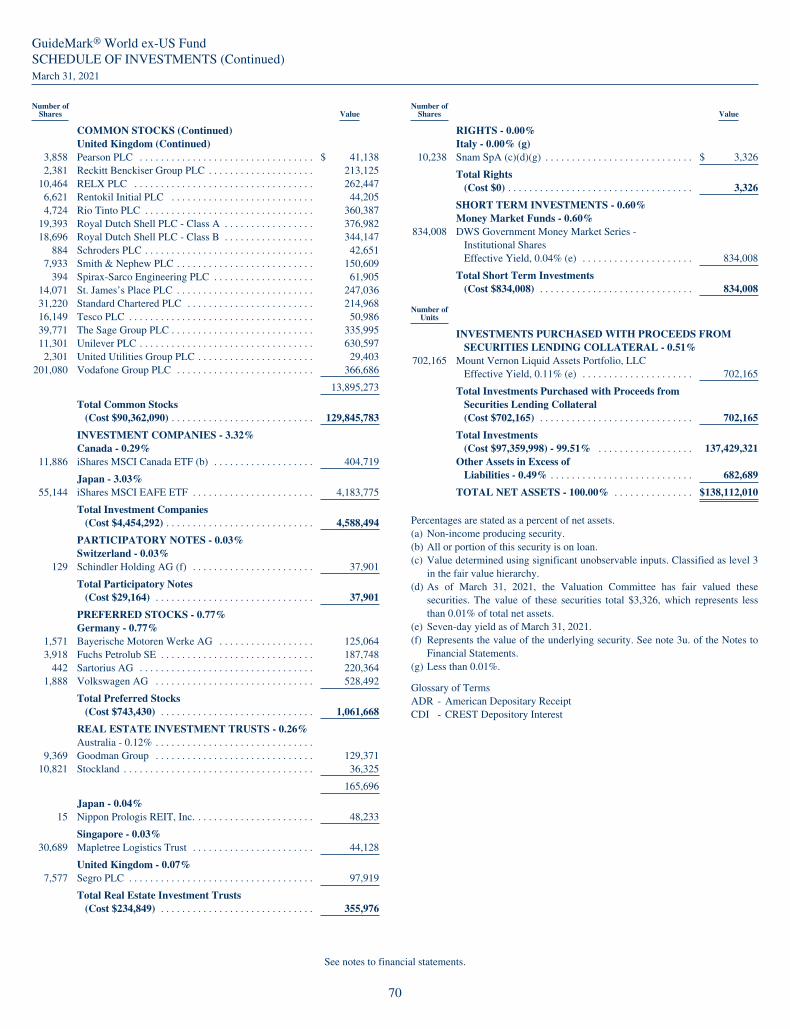
GuideMark® World ex-US FundSCHEDULE OF INVESTMENTS (Continued)March 31, 2021
Number ofShares Value
COMMON STOCKS (Continued)United Kingdom (Continued)
3,858 Pearson PLC . . . . . . . . . . . . . . . . . . . . . . . . . . . . . . . . . $ 41,1382,381 Reckitt Benckiser Group PLC . . . . . . . . . . . . . . . . . . . . 213,125
10,464 RELX PLC . . . . . . . . . . . . . . . . . . . . . . . . . . . . . . . . . . 262,4476,621 Rentokil Initial PLC . . . . . . . . . . . . . . . . . . . . . . . . . . . 44,2054,724 Rio Tinto PLC . . . . . . . . . . . . . . . . . . . . . . . . . . . . . . . . 360,387
19,393 Royal Dutch Shell PLC - Class A . . . . . . . . . . . . . . . . . 376,98218,696 Royal Dutch Shell PLC - Class B . . . . . . . . . . . . . . . . . 344,147
884 Schroders PLC . . . . . . . . . . . . . . . . . . . . . . . . . . . . . . . . 42,6517,933 Smith & Nephew PLC . . . . . . . . . . . . . . . . . . . . . . . . . . 150,609
394 Spirax-Sarco Engineering PLC . . . . . . . . . . . . . . . . . . . 61,90514,071 St. James’s Place PLC . . . . . . . . . . . . . . . . . . . . . . . . . . 247,03631,220 Standard Chartered PLC . . . . . . . . . . . . . . . . . . . . . . . . 214,96816,149 Tesco PLC . . . . . . . . . . . . . . . . . . . . . . . . . . . . . . . . . . . 50,98639,771 The Sage Group PLC . . . . . . . . . . . . . . . . . . . . . . . . . . . 335,99511,301 Unilever PLC . . . . . . . . . . . . . . . . . . . . . . . . . . . . . . . . . 630,5972,301 United Utilities Group PLC . . . . . . . . . . . . . . . . . . . . . . 29,403
201,080 Vodafone Group PLC . . . . . . . . . . . . . . . . . . . . . . . . . . 366,686
13,895,273
Total Common Stocks(Cost $90,362,090) . . . . . . . . . . . . . . . . . . . . . . . . . . . 129,845,783
INVESTMENT COMPANIES - 3.32%Canada - 0.29%
11,886 iShares MSCI Canada ETF (b) . . . . . . . . . . . . . . . . . . . 404,719
Japan - 3.03%55,144 iShares MSCI EAFE ETF . . . . . . . . . . . . . . . . . . . . . . . 4,183,775
Total Investment Companies(Cost $4,454,292) . . . . . . . . . . . . . . . . . . . . . . . . . . . . 4,588,494
PARTICIPATORY NOTES - 0.03%Switzerland - 0.03%
129 Schindler Holding AG (f) . . . . . . . . . . . . . . . . . . . . . . . 37,901
Total Participatory Notes(Cost $29,164) . . . . . . . . . . . . . . . . . . . . . . . . . . . . . . 37,901
PREFERRED STOCKS - 0.77%Germany - 0.77%
1,571 Bayerische Motoren Werke AG . . . . . . . . . . . . . . . . . . 125,0643,918 Fuchs Petrolub SE . . . . . . . . . . . . . . . . . . . . . . . . . . . . . 187,748
442 Sartorius AG . . . . . . . . . . . . . . . . . . . . . . . . . . . . . . . . . 220,3641,888 Volkswagen AG . . . . . . . . . . . . . . . . . . . . . . . . . . . . . . 528,492
Total Preferred Stocks(Cost $743,430) . . . . . . . . . . . . . . . . . . . . . . . . . . . . . 1,061,668
REAL ESTATE INVESTMENT TRUSTS - 0.26%Australia - 0.12% . . . . . . . . . . . . . . . . . . . . . . . . . . . . . .
9,369 Goodman Group . . . . . . . . . . . . . . . . . . . . . . . . . . . . . . 129,37110,821 Stockland . . . . . . . . . . . . . . . . . . . . . . . . . . . . . . . . . . . . 36,325
165,696
Japan - 0.04%15 Nippon Prologis REIT, Inc. . . . . . . . . . . . . . . . . . . . . . . 48,233
Singapore - 0.03%30,689 Mapletree Logistics Trust . . . . . . . . . . . . . . . . . . . . . . . 44,128
United Kingdom - 0.07%7,577 Segro PLC . . . . . . . . . . . . . . . . . . . . . . . . . . . . . . . . . . . 97,919
Total Real Estate Investment Trusts(Cost $234,849) . . . . . . . . . . . . . . . . . . . . . . . . . . . . . 355,976
Number ofShares Value
RIGHTS - 0.00%Italy - 0.00% (g)
10,238 Snam SpA (c)(d)(g) . . . . . . . . . . . . . . . . . . . . . . . . . . . . $ 3,326
Total Rights(Cost $0) . . . . . . . . . . . . . . . . . . . . . . . . . . . . . . . . . . . 3,326
SHORT TERM INVESTMENTS - 0.60%Money Market Funds - 0.60%
834,008 DWS Government Money Market Series -Institutional SharesEffective Yield, 0.04% (e) . . . . . . . . . . . . . . . . . . . . . 834,008
Total Short Term Investments(Cost $834,008) . . . . . . . . . . . . . . . . . . . . . . . . . . . . . 834,008
Number ofUnits
INVESTMENTS PURCHASED WITH PROCEEDS FROMSECURITIES LENDING COLLATERAL - 0.51%
702,165 Mount Vernon Liquid Assets Portfolio, LLCEffective Yield, 0.11% (e) . . . . . . . . . . . . . . . . . . . . . 702,165
Total Investments Purchased with Proceeds fromSecurities Lending Collateral(Cost $702,165) . . . . . . . . . . . . . . . . . . . . . . . . . . . . . 702,165
Total Investments(Cost $97,359,998) - 99.51% . . . . . . . . . . . . . . . . . . 137,429,321
Other Assets in Excess ofLiabilities - 0.49% . . . . . . . . . . . . . . . . . . . . . . . . . . . 682,689
TOTAL NET ASSETS - 100.00% . . . . . . . . . . . . . . . $138,112,010
Percentages are stated as a percent of net assets.(a) Non-income producing security.(b) All or portion of this security is on loan.(c) Value determined using significant unobservable inputs. Classified as level 3
in the fair value hierarchy.(d) As of March 31, 2021, the Valuation Committee has fair valued these
securities. The value of these securities total $3,326, which represents lessthan 0.01% of total net assets.
(e) Seven-day yield as of March 31, 2021.(f) Represents the value of the underlying security. See note 3u. of the Notes to
Financial Statements.(g) Less than 0.01%.
Glossary of TermsADR - American Depositary ReceiptCDI - CREST Depository Interest
See notes to financial statements.
70

GuideMark® World ex-US FundSCHEDULE OF INVESTMENTS BY INDUSTRYMarch 31, 2021
COMMON STOCKSAerospace & Defense 0.06%Air Freight & Logistics 0.97%Auto Components 0.32%Automobiles 1.81%Banks 5.77%Beverages 0.72%Biotechnology 0.54%Building Products 1.10%Capital Markets 3.21%Chemicals 2.66%Commercial Services & Supplies 0.19%Communications Equipment 0.19%Construction & Engineering 2.30%Construction Materials 0.86%Containers & Packaging 0.14%Diversified Financial Services 1.35%Diversified Telecommunication Services 2.12%Electric Utilities 1.22%Electrical Equipment 1.15%Electronic Equipment, Instruments & Components 1.22%Energy Equipment & Services 0.21%Entertainment 0.44%Food & Staples Retailing 4.38%Food Products 3.24%Gas Utilities 0.22%Health Care Equipment & Supplies 2.72%Health Care Providers & Services 0.54%Health Care Technology 0.23%Hotels, Restaurants & Leisure 0.94%Household Durables 1.85%Household Products 0.53%Independent Power and Renewable Electricity Producers 0.38%Industrial Conglomerates 1.16%Insurance 4.93%Interactive Media & Services 0.73%Internet & Direct Marketing Retail 1.74%IT Services 2.14%Leisure Products 0.22%Life Sciences Tools & Services 0.81%Machinery 1.65%Marine 0.95%Media 0.94%Metals & Mining 4.04%Multiline Retail 0.88%Multi-Utilities 0.47%Oil, Gas & Consumable Fuels 1.85%Paper & Forest Products 0.33%Personal Products 1.69%Pharmaceuticals 7.99%
Professional Services 1.96%Real Estate Management & Development 0.36%Road & Rail 0.45%Semiconductors & Semiconductor Equipment 2.44%Software 2.11%Specialty Retail 1.90%Technology Hardware, Storage & Peripherals 0.91%Textiles, Apparel & Luxury Goods 3.49%Tobacco 0.82%Trading Companies & Distributors 2.88%Transportation Infrastructure 0.03%Water Utilities 0.02%Wireless Telecommunication Services 0.55%
TOTAL COMMON STOCKS 94.02%
INVESTMENT COMPANIESExchange Traded Funds 3.32%
TOTAL INVESTMENT COMPANIES 3.32%
PARTICIPATORY NOTESMachinery 0.03%
TOTAL PARTICIPATORY NOTES 0.03%
PREFERRED STOCKSAutomobiles 0.47%Chemicals 0.14%Health Care Equipment & Supplies 0.16%
TOTAL PREFERRED STOCKS 0.77%
REAL ESTATE INVESTMENT TRUSTSReal Estate Investment Trusts 0.26%
TOTAL REAL ESTATE INVESTMENT TRUSTS 0.26%
RIGHTSEnergy Equipment & Services 0.00%
TOTAL RIGHTS 0.00%
SHORT TERM INVESTMENTSMoney Market Funds 0.60%
TOTAL SHORT TERM INVESTMENTS 0.60%
INVESTMENTS PURCHASED WITH PROCEEDS FROMSECURITIES LENDING COLLATERAL
Private Investment Fund 0.51%
TOTAL INVESTMENTS PURCHASED WITH PROCEEDSFROM SECURITIES LENDING COLLATERAL 0.51%
TOTAL INVESTMENTS 99.51%Other Assets in Excess of Liabilities 0.49%
TOTAL NET ASSETS 100.00%
Percentages are stated as a percent of net assets.
See notes to financial statements.
71
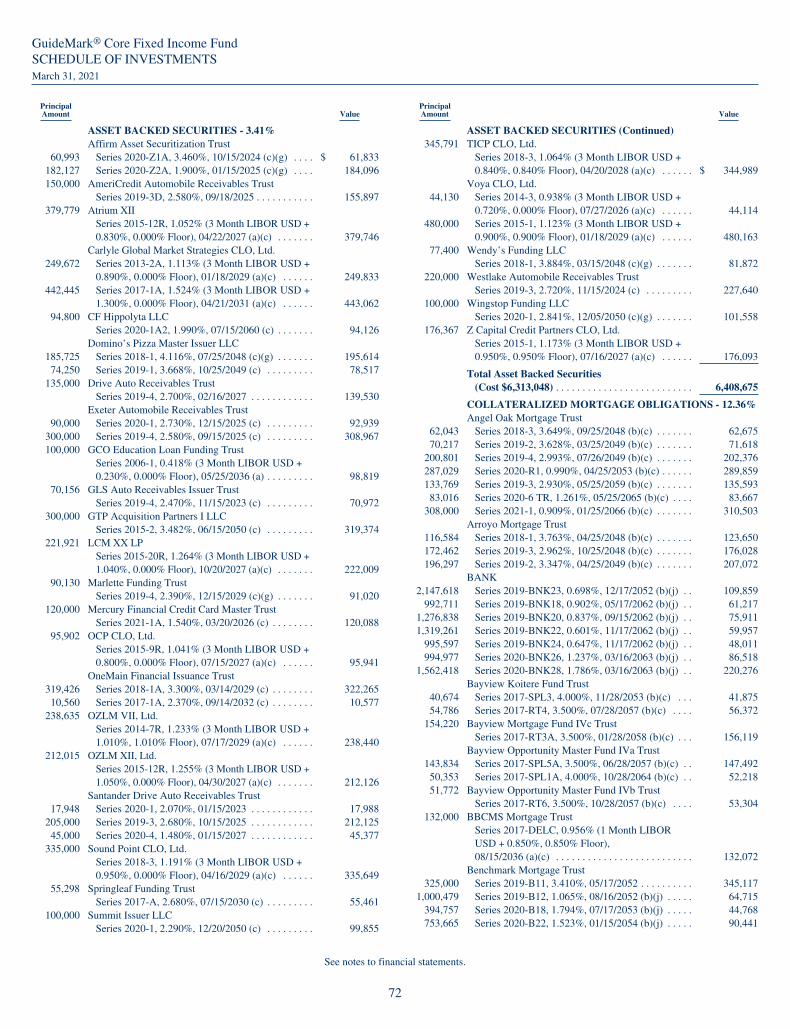
GuideMark® Core Fixed Income FundSCHEDULE OF INVESTMENTSMarch 31, 2021
PrincipalAmount Value
ASSET BACKED SECURITIES - 3.41%Affirm Asset Securitization Trust
60,993 Series 2020-Z1A, 3.460%, 10/15/2024 (c)(g) . . . . $ 61,833182,127 Series 2020-Z2A, 1.900%, 01/15/2025 (c)(g) . . . . 184,096150,000 AmeriCredit Automobile Receivables Trust
Series 2019-3D, 2.580%, 09/18/2025 . . . . . . . . . . . 155,897379,779 Atrium XII
Series 2015-12R, 1.052% (3 Month LIBOR USD +0.830%, 0.000% Floor), 04/22/2027 (a)(c) . . . . . . . 379,746
Carlyle Global Market Strategies CLO, Ltd.249,672 Series 2013-2A, 1.113% (3 Month LIBOR USD +
0.890%, 0.000% Floor), 01/18/2029 (a)(c) . . . . . . 249,833442,445 Series 2017-1A, 1.524% (3 Month LIBOR USD +
1.300%, 0.000% Floor), 04/21/2031 (a)(c) . . . . . . 443,06294,800 CF Hippolyta LLC
Series 2020-1A2, 1.990%, 07/15/2060 (c) . . . . . . . 94,126Domino’s Pizza Master Issuer LLC
185,725 Series 2018-1, 4.116%, 07/25/2048 (c)(g) . . . . . . . 195,61474,250 Series 2019-1, 3.668%, 10/25/2049 (c) . . . . . . . . . 78,517
135,000 Drive Auto Receivables TrustSeries 2019-4, 2.700%, 02/16/2027 . . . . . . . . . . . . 139,530
Exeter Automobile Receivables Trust90,000 Series 2020-1, 2.730%, 12/15/2025 (c) . . . . . . . . . 92,939
300,000 Series 2019-4, 2.580%, 09/15/2025 (c) . . . . . . . . . 308,967100,000 GCO Education Loan Funding Trust
Series 2006-1, 0.418% (3 Month LIBOR USD +0.230%, 0.000% Floor), 05/25/2036 (a) . . . . . . . . . 98,819
70,156 GLS Auto Receivables Issuer TrustSeries 2019-4, 2.470%, 11/15/2023 (c) . . . . . . . . . 70,972
300,000 GTP Acquisition Partners I LLCSeries 2015-2, 3.482%, 06/15/2050 (c) . . . . . . . . . 319,374
221,921 LCM XX LPSeries 2015-20R, 1.264% (3 Month LIBOR USD +1.040%, 0.000% Floor), 10/20/2027 (a)(c) . . . . . . . 222,009
90,130 Marlette Funding TrustSeries 2019-4, 2.390%, 12/15/2029 (c)(g) . . . . . . . 91,020
120,000 Mercury Financial Credit Card Master TrustSeries 2021-1A, 1.540%, 03/20/2026 (c) . . . . . . . . 120,088
95,902 OCP CLO, Ltd.Series 2015-9R, 1.041% (3 Month LIBOR USD +0.800%, 0.000% Floor), 07/15/2027 (a)(c) . . . . . . 95,941
OneMain Financial Issuance Trust319,426 Series 2018-1A, 3.300%, 03/14/2029 (c) . . . . . . . . 322,26510,560 Series 2017-1A, 2.370%, 09/14/2032 (c) . . . . . . . . 10,577
238,635 OZLM VII, Ltd.Series 2014-7R, 1.233% (3 Month LIBOR USD +1.010%, 1.010% Floor), 07/17/2029 (a)(c) . . . . . . 238,440
212,015 OZLM XII, Ltd.Series 2015-12R, 1.255% (3 Month LIBOR USD +1.050%, 0.000% Floor), 04/30/2027 (a)(c) . . . . . . . 212,126
Santander Drive Auto Receivables Trust17,948 Series 2020-1, 2.070%, 01/15/2023 . . . . . . . . . . . . 17,988
205,000 Series 2019-3, 2.680%, 10/15/2025 . . . . . . . . . . . . 212,12545,000 Series 2020-4, 1.480%, 01/15/2027 . . . . . . . . . . . . 45,377
335,000 Sound Point CLO, Ltd.Series 2018-3, 1.191% (3 Month LIBOR USD +0.950%, 0.000% Floor), 04/16/2029 (a)(c) . . . . . . 335,649
55,298 Springleaf Funding TrustSeries 2017-A, 2.680%, 07/15/2030 (c) . . . . . . . . . 55,461
100,000 Summit Issuer LLCSeries 2020-1, 2.290%, 12/20/2050 (c) . . . . . . . . . 99,855
PrincipalAmount Value
ASSET BACKED SECURITIES (Continued)345,791 TICP CLO, Ltd.
Series 2018-3, 1.064% (3 Month LIBOR USD +0.840%, 0.840% Floor), 04/20/2028 (a)(c) . . . . . . $ 344,989
Voya CLO, Ltd.44,130 Series 2014-3, 0.938% (3 Month LIBOR USD +
0.720%, 0.000% Floor), 07/27/2026 (a)(c) . . . . . . 44,114480,000 Series 2015-1, 1.123% (3 Month LIBOR USD +
0.900%, 0.900% Floor), 01/18/2029 (a)(c) . . . . . . 480,16377,400 Wendy’s Funding LLC
Series 2018-1, 3.884%, 03/15/2048 (c)(g) . . . . . . . 81,872220,000 Westlake Automobile Receivables Trust
Series 2019-3, 2.720%, 11/15/2024 (c) . . . . . . . . . 227,640100,000 Wingstop Funding LLC
Series 2020-1, 2.841%, 12/05/2050 (c)(g) . . . . . . . 101,558176,367 Z Capital Credit Partners CLO, Ltd.
Series 2015-1, 1.173% (3 Month LIBOR USD +0.950%, 0.950% Floor), 07/16/2027 (a)(c) . . . . . . 176,093
Total Asset Backed Securities(Cost $6,313,048) . . . . . . . . . . . . . . . . . . . . . . . . . . 6,408,675
COLLATERALIZED MORTGAGE OBLIGATIONS - 12.36%Angel Oak Mortgage Trust
62,043 Series 2018-3, 3.649%, 09/25/2048 (b)(c) . . . . . . . 62,67570,217 Series 2019-2, 3.628%, 03/25/2049 (b)(c) . . . . . . . 71,618
200,801 Series 2019-4, 2.993%, 07/26/2049 (b)(c) . . . . . . . 202,376287,029 Series 2020-R1, 0.990%, 04/25/2053 (b)(c) . . . . . . 289,859133,769 Series 2019-3, 2.930%, 05/25/2059 (b)(c) . . . . . . . 135,59383,016 Series 2020-6 TR, 1.261%, 05/25/2065 (b)(c) . . . . 83,667
308,000 Series 2021-1, 0.909%, 01/25/2066 (b)(c) . . . . . . . 310,503Arroyo Mortgage Trust
116,584 Series 2018-1, 3.763%, 04/25/2048 (b)(c) . . . . . . . 123,650172,462 Series 2019-3, 2.962%, 10/25/2048 (b)(c) . . . . . . . 176,028196,297 Series 2019-2, 3.347%, 04/25/2049 (b)(c) . . . . . . . 207,072
BANK2,147,618 Series 2019-BNK23, 0.698%, 12/17/2052 (b)(j) . . 109,859
992,711 Series 2019-BNK18, 0.902%, 05/17/2062 (b)(j) . . 61,2171,276,838 Series 2019-BNK20, 0.837%, 09/15/2062 (b)(j) . . 75,9111,319,261 Series 2019-BNK22, 0.601%, 11/17/2062 (b)(j) . . 59,957
995,597 Series 2019-BNK24, 0.647%, 11/17/2062 (b)(j) . . 48,011994,977 Series 2020-BNK26, 1.237%, 03/16/2063 (b)(j) . . 86,518
1,562,418 Series 2020-BNK28, 1.786%, 03/16/2063 (b)(j) . . 220,276Bayview Koitere Fund Trust
40,674 Series 2017-SPL3, 4.000%, 11/28/2053 (b)(c) . . . 41,87554,786 Series 2017-RT4, 3.500%, 07/28/2057 (b)(c) . . . . 56,372
154,220 Bayview Mortgage Fund IVc TrustSeries 2017-RT3A, 3.500%, 01/28/2058 (b)(c) . . . 156,119
Bayview Opportunity Master Fund IVa Trust143,834 Series 2017-SPL5A, 3.500%, 06/28/2057 (b)(c) . . 147,49250,353 Series 2017-SPL1A, 4.000%, 10/28/2064 (b)(c) . . 52,21851,772 Bayview Opportunity Master Fund IVb Trust
Series 2017-RT6, 3.500%, 10/28/2057 (b)(c) . . . . 53,304132,000 BBCMS Mortgage Trust
Series 2017-DELC, 0.956% (1 Month LIBORUSD + 0.850%, 0.850% Floor),08/15/2036 (a)(c) . . . . . . . . . . . . . . . . . . . . . . . . . . 132,072
Benchmark Mortgage Trust325,000 Series 2019-B11, 3.410%, 05/17/2052 . . . . . . . . . . 345,117
1,000,479 Series 2019-B12, 1.065%, 08/16/2052 (b)(j) . . . . . 64,715394,757 Series 2020-B18, 1.794%, 07/17/2053 (b)(j) . . . . . 44,768753,665 Series 2020-B22, 1.523%, 01/15/2054 (b)(j) . . . . . 90,441
See notes to financial statements.
72

GuideMark® Core Fixed Income FundSCHEDULE OF INVESTMENTS (Continued)March 31, 2021
PrincipalAmount Value
COLLATERALIZED MORTGAGE OBLIGATIONS(Continued)
1,502,651 Series 2019-B10, 1.229%, 03/17/2062 (b)(j) . . . . . $ 115,706260,000 BlueMountain CLO XXIV, Ltd.
Series 2019-24A AR, 0.000% (3 Month LIBORUSD + 1.100%, 1.100% Floor),04/20/2034 (a)(c) . . . . . . . . . . . . . . . . . . . . . . . . . . 260,158
BX Commercial Mortgage Trust106,183 Series 2018-IND, 0.856% (1 Month LIBOR USD +
0.750%, 0.750% Floor), 11/15/2035 (a)(c) . . . . . . . 106,312324,476 Series 2019-XL, 1.026% (1 Month LIBOR USD +
0.920%, 0.920% Floor), 10/15/2036 (a)(c) . . . . . . 324,679100,000 CAMB Commercial Mortgage Trust
Series 2019-LIFE, 1.556% (1 Month LIBORUSD + 1.450%, 1.450% Floor),12/15/2037 (a)(c) . . . . . . . . . . . . . . . . . . . . . . . . . . 100,237
145,000 Century Plaza TowersSeries 2019-CPT, 2.865%, 11/16/2039 (c) . . . . . . . 150,420
13,125 Chase Mortgage Finance TrustSeries 2007-A1, 2.674%, 02/25/2037 (b) . . . . . . . . 13,770
43,260 CIM TrustSeries 2017-7, 3.000%, 04/25/2057 (b)(c) . . . . . . . 44,111
Citigroup Commercial Mortgage Trust296,312 Series 2016-P3, 3.329%, 04/16/2049 . . . . . . . . . . . 319,512505,000 Series 2016-P4, 2.902%, 07/12/2049 . . . . . . . . . . . 536,274
Citigroup Mortgage Loan Trust, Inc.66,562 Series 2019-IMC1, 2.720%, 07/25/2049 (b)(c) . . . 67,905
206,001 Series 2018-RP2, 3.139%, 02/25/2058 (b)(c) . . . . 217,47890,002 Series 2018-RP1, 3.000%, 09/25/2064 (b)(c) . . . . 95,921
133,128 Series 2019-E, 3.228%, 11/25/2070 (c)(k) . . . . . . . 134,337COLT Mortgage Loan Trust
58,297 Series 2019-3, 2.764%, 08/25/2049 (b)(c) . . . . . . . 58,871127,609 Series 2019-4, 2.579%, 11/25/2049 (b)(c) . . . . . . . 128,868428,508 Series 2020-RPL1, 1.390%, 01/25/2065 (b)(c) . . . 430,31172,221 Series 2020-1R, 1.255%, 09/25/2065 (b)(c) . . . . . . 72,748
261,438 Series 2020-2R, 1.325%, 10/26/2065 (b)(c) . . . . . . 261,928COMM Mortgage Trust
120,000 Series 2013-300P, 4.353%, 08/12/2030 (c) . . . . . . 128,101290,000 Series 2019-WCM, 1.006% (1 Month LIBOR
USD + 0.900%, 0.900% Floor),10/16/2034 (a)(c) . . . . . . . . . . . . . . . . . . . . . . . . . . 290,725
Countrywide Home Loans, Inc.6,481 Series 2004-HYB6, 2.770%, 11/20/2034 (b) . . . . . 6,697
71,181 Series 2005-11, 0.709% (1 Month LIBOR USD +0.600%, 0.600% Floor, 10.500% Cap),03/25/2035 (a) . . . . . . . . . . . . . . . . . . . . . . . . . . . . 59,190
375,000 CSAIL Commercial Mortgage TrustSeries 2016-C6, 2.960%, 01/15/2049 . . . . . . . . . . . 394,053
CSMC Trust100,000 Series 2020-NET, 2.257%, 08/17/2037 (c) . . . . . . 101,87732,083 Series 2017-FHA1, 3.250%, 04/25/2047 (b)(c) . . . 32,780
334,476 Series 2020-RPL4, 2.000%, 01/25/2060 (b)(c) . . . 346,788359,273 Series 2020-NQM1, 1.208%, 05/25/2065 (c)(k) . . 361,319410,000 Series 2021-NQM2, 1.179%, 02/25/2066 (b)(c) . . 413,074
11,911,850 DBGS Mortgage TrustSeries 2018-C1, 0.203%, 10/17/2051 (b)(j) . . . . . . 162,573
DBJPM Mortgage Trust359,996 Series 2016-C1, 3.038%, 05/12/2049 . . . . . . . . . . . 378,705475,000 Series 2016-C3, 2.890%, 08/12/2049 . . . . . . . . . . . 504,139310,747 Series 2020-C9, 1.714%, 08/15/2053 (b)(j) . . . . . . 33,187
PrincipalAmount Value
COLLATERALIZED MORTGAGE OBLIGATIONS(Continued)
Deephaven Residential Mortgage Trust54,346 Series 2019-2, 3.558%, 04/25/2059 (b)(c) . . . . . . . $ 54,605
141,776 Series 2019-3, 2.964%, 07/25/2059 (b)(c) . . . . . . . 143,671326,745 GCAT Trust
Series 2021-NQM1, 0.874%, 01/25/2066 (c)(k) . . 329,269GS Mortgage Securities Trust
145,000 Series 2012-ALOH, 3.551%, 04/12/2034 (c) . . . . . 147,135145,000 Series 2012-BWTR, 2.954%, 11/07/2034 (c) . . . . 146,70135,000 Series 2015-GC34, 3.506%, 10/13/2048 . . . . . . . . 38,083
1,448,978 Series 2020-GC45, 0.674%, 02/14/2053 (b)(j) . . . 68,790220,000 Hawaii Hotel Trust 2019-MAUI
Series 2019-MAUI, 1.256% (1 Month LIBORUSD + 1.150%, 1.150% Floor),05/17/2038 (a)(c) . . . . . . . . . . . . . . . . . . . . . . . . . . 220,563
67,075 Homeward Opportunities Fund I TrustSeries 2019-2, 2.702%, 08/25/2059 (b)(c) . . . . . . . 67,549
JPMBB Commercial Mortgage Securities Trust90,000 Series 2020-NNN, 2.812%, 01/16/2037 (c) . . . . . . 93,180
230,735 Series 2013-C12, 3.157%, 07/17/2045 . . . . . . . . . . 234,16384,012 MFRA Trust
Series 2020-NQM3 A1, 1.014%,01/26/2065 (b)(c) . . . . . . . . . . . . . . . . . . . . . . . . . . 84,201
Mill City Mortgage Loan Trust148,511 Series 2018-2, 3.500%, 05/25/2058 (b)(c) . . . . . . . 153,029371,333 Series 2019-GS1, 2.750%, 07/25/2059 (b)(c) . . . . 392,705155,021 Series 2017-3, 2.750%, 01/25/2061 (b)(c) . . . . . . . 158,266122,164 Series 2018-1, 3.250%, 05/25/2062 (b)(c) . . . . . . . 126,610213,421 Series 2019-1, 3.250%, 10/25/2069 (b)(c) . . . . . . . 226,063123,091 Morgan Stanley ABS Capital I, Inc. Trust
Series 2003-NC10, 1.129% (1 Month LIBORUSD + 1.020%, 1.020% Floor), 10/25/2033 (a) . . . 123,025
175,000 Morgan Stanley Bank of America Merrill LynchTrustSeries 2016-C29, 3.325%, 05/17/2049 . . . . . . . . . . 189,009
185,000 Morgan Stanley Capital I TrustSeries 2014-MP, 3.469%, 08/11/2033 (c) . . . . . . . 185,512
222,000 Mortgage Insurance-Linked NotesSeries 2019-1, 2.009% (1 Month LIBOR USD +1.900%, 1.900% Floor), 11/26/2029 (a)(c) . . . . . . 223,095
MTRO Commercial Mortgage Trust100,000 Series 2019-TECH B, 1.206% (1 Month LIBOR
USD + 1.100%, 1.100% Floor),12/15/2033 (a)(c) . . . . . . . . . . . . . . . . . . . . . . . . . . 99,933
100,000 Series 2019-TECH C, 1.406% (1 Month LIBORUSD + 1.300%, 1.300% Floor),12/15/2033 (a)(c) . . . . . . . . . . . . . . . . . . . . . . . . . . 99,305
160,000 Natixis Commercial Mortgage Securities TrustSeries 2019-1776, 2.507%, 10/17/2036 (c) . . . . . . 162,146
New Residential Mortgage Loan Trust150,035 Series 2018-FNT1, 3.610%, 05/25/2023 (c) . . . . . 149,539166,576 Series 2018-FNT2, 3.790%, 07/25/2024 (c) . . . . . 167,06860,366 Series 2016-2, 3.750%, 11/25/2035 (b)(c) . . . . . . . 64,127
148,644 Series 2018-4, 0.859% (1 Month LIBOR USD +0.750%, 0.750% Floor), 01/27/2048 (a)(c) . . . . . . 149,643
50,998 Series 2016-4, 3.750%, 11/25/2056 (b)(c) . . . . . . . 54,44481,291 Series 2017-1, 4.000%, 02/25/2057 (b)(c) . . . . . . . 87,43774,216 Series 2017-2, 4.000%, 03/25/2057 (b)(c) . . . . . . . 79,43141,286 Series 2017-3, 4.000%, 04/25/2057 (b)(c) . . . . . . . 43,93442,496 Series 2017-4, 4.000%, 05/25/2057 (b)(c) . . . . . . . 45,346
See notes to financial statements.
73

GuideMark® Core Fixed Income FundSCHEDULE OF INVESTMENTS (Continued)March 31, 2021
PrincipalAmount Value
COLLATERALIZED MORTGAGE OBLIGATIONS(Continued)
41,476 Series 2017-5, 1.609% (1 Month LIBOR USD +1.500%, 1.500% Floor), 06/25/2057 (a)(c) . . . . . . $ 42,219
63,070 Series 2017-6, 4.000%, 08/25/2057 (b)(c) . . . . . . . 67,708137,561 Series 2018-1, 4.000%, 12/25/2057 (b)(c) . . . . . . . 153,801125,577 Series 2018-2, 4.500%, 02/25/2058 (b)(c) . . . . . . . 134,348283,306 Series 2018-3, 4.500%, 05/25/2058 (b)(c) . . . . . . . 307,395214,435 Series 2019-3, 3.750%, 11/25/2058 (b)(c) . . . . . . . 229,356168,145 Series 2019-5, 3.500%, 08/25/2059 (b)(c) . . . . . . . 176,37690,575 Series 2019-NQM4, 2.492%, 09/25/2059 (b)(c) . . 94,15085,807 Series 2020-NPL2, 3.228%, 08/25/2060 (c)(k) . . . 87,091
390,000 OBX TrustSeries 2021-NQM1, 1.072%, 02/25/2066 (b)(c) . . 392,440
PRPM Trust93,107 Series 2019-GS1, 3.500%, 10/25/2024 (b)(c) . . . . 93,951
252,729 Series 2020-3, 2.857%, 09/25/2025 (c)(k) . . . . . . . 256,63688,162 Series 2020-6, 2.363%, 11/25/2025 (c)(k) . . . . . . . 88,564
SBA Tower Trust155,000 Series 2019-1, 2.836%, 01/15/2025 (c) . . . . . . . . . 162,76990,000 Series 2017-1, 3.168%, 04/15/2047 (c) . . . . . . . . . 90,238
125,000 Series 2018-1, 3.448%, 03/15/2048 (c) . . . . . . . . . 131,68770,502 Seasoned Credit Risk Transfer Trust Series
Series 2019-3, 3.500%, 10/25/2058 . . . . . . . . . . . . 76,483SG Commercial Mortgage Securities Trust
355,000 Series 2020-COVE, 2.632%, 04/17/2037 (c) . . . . . 366,59775,000 Series 2016-C5, 3.055%, 10/13/2048 . . . . . . . . . . . 79,135
Starwood Mortgage Residential Trust80,541 Series 2020-3, 1.486%, 04/25/2065 (b)(c) . . . . . . . 81,112
410,000 Series 2021-1, 1.219%, 05/25/2065 (b)(c) . . . . . . . 409,992415,000 Thompson Park CLO, Ltd.
Series 2021-1A A1, 0.000% (3 Month LIBORUSD + 1.000%, 1.000% Floor),04/17/2034 (a)(c) . . . . . . . . . . . . . . . . . . . . . . . . . . 415,000
Towd Point Mortgage Trust53,319 Series 2015-6, 2.750%, 04/25/2055 (b)(c) . . . . . . . 53,74326,858 Series 2016-2, 2.750%, 08/25/2055 (b)(c) . . . . . . . 27,24022,703 Series 2016-3, 2.250%, 08/25/2055 (b)(c) . . . . . . . 22,893
301,498 Series 2017-1, 2.750%, 10/25/2056 (b)(c) . . . . . . . 306,789167,716 Series 2017-5, 0.709% (1 Month LIBOR USD +
0.600%, 0.000% Floor), 02/26/2057 (a)(c) . . . . . . 167,800149,176 Series 2017-2, 2.750%, 04/25/2057 (b)(c) . . . . . . . 151,59237,697 Series 2017-3, 2.750%, 06/25/2057 (b)(c) . . . . . . . 38,431
214,156 Series 2017-4, 2.750%, 06/25/2057 (b)(c) . . . . . . . 221,119327,495 Series 2017-6, 2.750%, 10/25/2057 (b)(c) . . . . . . . 338,17564,918 Series 2018-1, 3.000%, 01/28/2058 (b)(c) . . . . . . . 67,105
187,417 Series 2018-2, 3.250%, 03/25/2058 (b)(c) . . . . . . . 195,756359,390 Series 2019-1, 3.750%, 03/25/2058 (b)(c) . . . . . . . 381,253143,095 Series 2018-3, 3.750%, 05/25/2058 (b)(c) . . . . . . . 153,341229,641 Series 2020-4, 1.750%, 10/25/2060 (c) . . . . . . . . . 236,450100,000 VCAT Asset Securitization LLC
Series 2021-NPL2 A1, 2.115%,03/27/2051 (c)(k) . . . . . . . . . . . . . . . . . . . . . . . . . . 99,999
410,000 Venture 42 CLO, Ltd.Series 2021-42A A1A, 0.000% (3 Month LIBORUSD + 1.130%, 1.130% Floor),04/17/2034 (a)(c) . . . . . . . . . . . . . . . . . . . . . . . . . . 410,248
120,000 Vericrest Opportunity Loan TransfereeSeries 2021-NPL7, 2.116%, 04/25/2051 (c)(k) . . . 120,932
Verus Securitization Trust162,110 Series 2020-NPL1, 3.598%, 08/25/2050 (c)(k) . . . 163,31471,788 Series 2019-2, 3.211%, 05/25/2059 (b)(c) . . . . . . . 74,744
PrincipalAmount Value
COLLATERALIZED MORTGAGE OBLIGATIONS(Continued)
166,410 Series 2019-3, 2.784%, 07/25/2059 (c)(k) . . . . . . . $ 169,801215,869 Series 2019-4, 3.142%, 10/25/2059 (b)(c) . . . . . . . 220,132240,000 Series 2021-R2 A-1, 0.918%,
02/25/2064 (b)(c) . . . . . . . . . . . . . . . . . . . . . . . . . . 241,333265,000 Wells Fargo Commercial Mortgage Trust 2015-
NXS1Series A-5, 3.148%, 05/15/2048 . . . . . . . . . . . . . . . 284,082
384,939 Wells Fargo-RBS Commercial Mortgage TrustSeries 2014-C19, 3.660%, 03/15/2047 . . . . . . . . . . 387,473
Total Collateralized Mortgage Obligations(Cost $22,913,406) . . . . . . . . . . . . . . . . . . . . . . . . . 23,240,407
CORPORATE OBLIGATIONS - 29.92%Aerospace & Defense - 0.64%
235,000 Boeing Co.5.040%, 05/01/2027 . . . . . . . . . . . . . . . . . . . . . . . . 267,990
60,000 General Dynamics Corp.4.250%, 04/01/2040 . . . . . . . . . . . . . . . . . . . . . . . . 70,606
L3Harris Technologies, Inc.150,000 3.850%, 06/15/2023 . . . . . . . . . . . . . . . . . . . . . . . . 160,10631,000 4.400%, 06/15/2028 . . . . . . . . . . . . . . . . . . . . . . . . 35,21175,000 Lockheed Martin Corp.
4.090%, 09/15/2052 . . . . . . . . . . . . . . . . . . . . . . . . 87,874190,000 Northrop Grumman Corp.
5.150%, 05/01/2040 (e) . . . . . . . . . . . . . . . . . . . . . 238,575Raytheon Technologies Corp.
100,000 3.950%, 08/16/2025 . . . . . . . . . . . . . . . . . . . . . . . . 111,090140,000 3.125%, 05/04/2027 . . . . . . . . . . . . . . . . . . . . . . . . 150,57220,000 4.450%, 11/16/2038 . . . . . . . . . . . . . . . . . . . . . . . . 23,15050,000 4.625%, 11/16/2048 . . . . . . . . . . . . . . . . . . . . . . . . 59,797
1,204,971
Air Freight & Logistics - 0.19%FedEx Corp.
50,000 3.300%, 03/15/2027 . . . . . . . . . . . . . . . . . . . . . . . . 54,323265,000 4.250%, 05/15/2030 (e) . . . . . . . . . . . . . . . . . . . . . 301,044
355,367
Automobiles - 0.07%General Motors Co.
55,000 6.125%, 10/01/2025 (e) . . . . . . . . . . . . . . . . . . . . . 64,71455,000 5.200%, 04/01/2045 . . . . . . . . . . . . . . . . . . . . . . . . 63,084
127,798
Banks - 4.12%Bank of America Corp.
190,000 4.100%, 07/24/2023 . . . . . . . . . . . . . . . . . . . . . . . . 205,340250,000 3.864% (3 Month LIBOR USD + 0.940%),
07/23/2024 (a) . . . . . . . . . . . . . . . . . . . . . . . . . . . . 267,846140,000 2.456% (3 Month LIBOR USD + 0.870%),
10/22/2025 (a) . . . . . . . . . . . . . . . . . . . . . . . . . . . . 146,846185,000 3.366% (3 Month LIBOR USD + 0.810%),
01/23/2026 (a) . . . . . . . . . . . . . . . . . . . . . . . . . . . . 198,836330,000 1.658% (SOFR + 0.910%), 03/11/2027 (a) . . . . . . 330,557720,000 1.922% (SOFR + 1.370%), 10/24/2031 (a) . . . . . . 677,630550,000 4.083% (3 Month LIBOR USD + 3.150%),
03/20/2051 (a) . . . . . . . . . . . . . . . . . . . . . . . . . . . . 614,050200,000 BNP Paribas SA
2.219% (SOFR + 2.074%), 06/09/2026 (a)(c) . . . . 205,156
See notes to financial statements.
74

GuideMark® Core Fixed Income FundSCHEDULE OF INVESTMENTS (Continued)March 31, 2021
PrincipalAmount Value
CORPORATE OBLIGATIONS (Continued)Banks (Continued)Citigroup, Inc.
125,000 3.352% (3 Month LIBOR USD + 0.897%),04/24/2025 (a) . . . . . . . . . . . . . . . . . . . . . . . . . . . . $ 133,647
280,000 3.700%, 01/12/2026 . . . . . . . . . . . . . . . . . . . . . . . . 307,806200,000 4.412% (SOFR + 3.914%), 03/31/2031 (a) . . . . . . 227,62570,000 2.572% (SOFR + 2.107%), 06/03/2031 (a) . . . . . . 69,952
200,000 Danske Bank AS5.375%, 01/12/2024 (c) . . . . . . . . . . . . . . . . . . . . . 223,148
95,000 Fifth Third Bancorp2.375%, 01/28/2025 . . . . . . . . . . . . . . . . . . . . . . . . 99,126
HSBC Holdings PLC370,000 3.262% (3 Month LIBOR USD + 1.055%),
03/13/2023 (a) . . . . . . . . . . . . . . . . . . . . . . . . . . . . 379,133200,000 1.589% (SOFR + 1.290%), 05/24/2027 (a) . . . . . . 196,864200,000 4.583% (3 Month LIBOR USD + 1.535%),
06/19/2029 (a) . . . . . . . . . . . . . . . . . . . . . . . . . . . . 224,914JPMorgan Chase & Co.
150,000 3.797% (3 Month LIBOR USD + 0.890%),07/23/2024 (a) . . . . . . . . . . . . . . . . . . . . . . . . . . . . 160,594
155,000 4.023% (3 Month LIBOR USD + 1.000%),12/05/2024 (a) . . . . . . . . . . . . . . . . . . . . . . . . . . . . 168,219
225,000 3.220% (3 Month LIBOR USD + 1.155%),03/01/2025 (a) . . . . . . . . . . . . . . . . . . . . . . . . . . . . 240,098
170,000 3.300%, 04/01/2026 . . . . . . . . . . . . . . . . . . . . . . . . 185,01690,000 2.950%, 10/01/2026 . . . . . . . . . . . . . . . . . . . . . . . . 96,267
300,000 3.782% (3 Month LIBOR USD + 1.337%),02/01/2028 (a) . . . . . . . . . . . . . . . . . . . . . . . . . . . . 331,328
80,000 3.509% (3 Month LIBOR USD + 0.945%),01/23/2029 (a) . . . . . . . . . . . . . . . . . . . . . . . . . . . . 86,538
225,000 3.702% (3 Month LIBOR USD + 1.160%),05/06/2030 (a) . . . . . . . . . . . . . . . . . . . . . . . . . . . . 244,723
175,000 3.109% (SOFR + 2.460%), 04/22/2041 (a) . . . . . . 174,05170,000 3.109% (SOFR + 2.440%), 04/22/2051 (a)(e) . . . . 67,998
145,000 KeyCorp2.550%, 10/01/2029 (e) . . . . . . . . . . . . . . . . . . . . . 146,811
PNC Financial Services Group, Inc.55,000 2.200%, 11/01/2024 . . . . . . . . . . . . . . . . . . . . . . . . 57,85265,000 3.450%, 04/23/2029 . . . . . . . . . . . . . . . . . . . . . . . . 70,243
235,000 Santander Holdings USA, Inc.3.700%, 03/28/2022 . . . . . . . . . . . . . . . . . . . . . . . . 241,636
370,000 Truist Bank2.250%, 03/11/2030 . . . . . . . . . . . . . . . . . . . . . . . . 361,763
Wells Fargo & Co.85,000 2.406% (3 Month LIBOR USD + 0.825%),
10/30/2025 (a) . . . . . . . . . . . . . . . . . . . . . . . . . . . . 88,823120,000 3.000%, 04/22/2026 . . . . . . . . . . . . . . . . . . . . . . . . . 128,265135,000 3.000%, 10/23/2026 . . . . . . . . . . . . . . . . . . . . . . . . . 144,40941,000 5.606%, 01/15/2044 . . . . . . . . . . . . . . . . . . . . . . . . . 52,71945,000 4.750%, 12/07/2046 (e) . . . . . . . . . . . . . . . . . . . . . . . 52,850
115,000 5.013% (3 Month LIBOR USD + 4.240%),04/04/2051 (a)(e) . . . . . . . . . . . . . . . . . . . . . . . . . . 147,217
7,755,896
Beverages - 0.78%Anheuser-Busch InBev Worldwide, Inc.
180,000 5.450%, 01/23/2039 . . . . . . . . . . . . . . . . . . . . . . . . 224,99755,000 3.750%, 07/15/2042 . . . . . . . . . . . . . . . . . . . . . . . . 56,43420,000 4.900%, 02/01/2046 . . . . . . . . . . . . . . . . . . . . . . . . 23,742
145,000 4.600%, 04/15/2048 . . . . . . . . . . . . . . . . . . . . . . . . 166,218
PrincipalAmount Value
Beverages (Continued)112,000 4.750%, 04/15/2058 . . . . . . . . . . . . . . . . . . . . . . . . $ 129,03735,000 Coca-Cola Co.
3.000%, 03/05/2051 . . . . . . . . . . . . . . . . . . . . . . . . 33,911Constellation Brands, Inc.
75,000 4.400%, 11/15/2025 . . . . . . . . . . . . . . . . . . . . . . . . 84,586204,000 3.600%, 02/15/2028 . . . . . . . . . . . . . . . . . . . . . . . . 221,86725,000 4.650%, 11/15/2028 . . . . . . . . . . . . . . . . . . . . . . . . 28,7476,000 3.150%, 08/01/2029 . . . . . . . . . . . . . . . . . . . . . . . . 6,287
10,000 3.750%, 05/01/2050 . . . . . . . . . . . . . . . . . . . . . . . . 10,403200,000 Diageo Capital Plc
2.000%, 04/29/2030 . . . . . . . . . . . . . . . . . . . . . . . . 195,55150,000 Keurig Dr Pepper, Inc.
3.350%, 03/15/2051 . . . . . . . . . . . . . . . . . . . . . . . . 49,729PepsiCo, Inc.
40,000 2.625%, 03/19/2027 . . . . . . . . . . . . . . . . . . . . . . . . 42,5705,000 1.625%, 05/01/2030 . . . . . . . . . . . . . . . . . . . . . . . . 4,782
175,000 3.625%, 03/19/2050 . . . . . . . . . . . . . . . . . . . . . . . . 191,801
1,470,662
Biotechnology - 1.14%AbbVie, Inc.
135,000 3.450%, 03/15/2022 . . . . . . . . . . . . . . . . . . . . . . . . 138,131205,000 2.950%, 11/21/2026 . . . . . . . . . . . . . . . . . . . . . . . . 218,432355,000 3.200%, 11/21/2029 . . . . . . . . . . . . . . . . . . . . . . . . 377,669295,000 4.250%, 11/21/2049 . . . . . . . . . . . . . . . . . . . . . . . . 332,920
Amgen, Inc.45,000 2.650%, 05/11/2022 . . . . . . . . . . . . . . . . . . . . . . . . 45,94055,000 1.900%, 02/21/2025 . . . . . . . . . . . . . . . . . . . . . . . . 56,84595,000 2.200%, 02/21/2027 . . . . . . . . . . . . . . . . . . . . . . . . 97,451
475,000 2.300%, 02/25/2031 . . . . . . . . . . . . . . . . . . . . . . . . 470,513Gilead Sciences, Inc.
80,000 2.500%, 09/01/2023 . . . . . . . . . . . . . . . . . . . . . . . . 83,426335,000 1.650%, 10/01/2030 . . . . . . . . . . . . . . . . . . . . . . . . 314,618
2,135,945
Building Products - 0.05%90,000 Carrier Global Corp.
2.700%, 02/15/2031 . . . . . . . . . . . . . . . . . . . . . . . . 90,059
Capital Markets - 1.97%320,000 BlackRock, Inc.
1.900%, 01/28/2031 . . . . . . . . . . . . . . . . . . . . . . . . 309,67960,000 BP Capital Markets America, Inc. . . . . . . . . . . . . . . .
2.939%, 06/04/2051 . . . . . . . . . . . . . . . . . . . . . . . . 53,487Morgan Stanley
75,000 2.625%, 11/17/2021 . . . . . . . . . . . . . . . . . . . . . . . . 76,140195,000 3.737% (3 Month LIBOR USD + 0.847%),
04/24/2024 (a) . . . . . . . . . . . . . . . . . . . . . . . . . . . . 207,358180,000 3.700%, 10/23/2024 (e) . . . . . . . . . . . . . . . . . . . . . 197,13865,000 3.125%, 07/27/2026 . . . . . . . . . . . . . . . . . . . . . . . . 70,040
340,000 3.591% (3 Month LIBOR USD + 1.340%),07/22/2028 (a) . . . . . . . . . . . . . . . . . . . . . . . . . . . . 370,775
55,000 4.431% (3 Month LIBOR USD + 1.628%),01/23/2030 (a) . . . . . . . . . . . . . . . . . . . . . . . . . . . . 62,980
210,000 2.699% (SOFR + 1.143%), 01/22/2031 (a) . . . . . . 213,783285,000 1.794% (SOFR + 1.034%), 02/13/2032 (a) . . . . . . 265,006145,000 1.928% (SOFR + 1.020%), 04/28/2032 (a) . . . . . . 136,219180,000 3.971% (3 Month LIBOR USD + 1.455%),
07/22/2038 (a) . . . . . . . . . . . . . . . . . . . . . . . . . . . . 200,997State Street Corp.
80,000 3.776% (3 Month LIBOR USD + 0.770%),12/03/2024 (a) . . . . . . . . . . . . . . . . . . . . . . . . . . . . 86,670
See notes to financial statements.
75

GuideMark® Core Fixed Income FundSCHEDULE OF INVESTMENTS (Continued)March 31, 2021
PrincipalAmount Value
CORPORATE OBLIGATIONS (Continued)Capital Markets (Continued)
90,000 2.354% (SOFR + 0.940%), 11/01/2025 (a) . . . . . . $ 94,70780,000 2.901% (SOFR + 2.600%), 03/30/2026 (a) . . . . . . 85,131
The Bank of New York Mellon Corp.70,000 1.950%, 08/23/2022 . . . . . . . . . . . . . . . . . . . . . . . . 71,608
125,000 2.661% (3 Month LIBOR USD + 0.634%),05/16/2023 (a) . . . . . . . . . . . . . . . . . . . . . . . . . . . . 128,275
120,000 2.100%, 10/24/2024 . . . . . . . . . . . . . . . . . . . . . . . . 126,32690,000 2.450%, 08/17/2026 . . . . . . . . . . . . . . . . . . . . . . . . 94,645
The Goldman Sachs Group, Inc.135,000 2.876% (3 Month LIBOR USD + 0.821%),
10/31/2022 (a) . . . . . . . . . . . . . . . . . . . . . . . . . . . . 136,80655,000 2.905% (3 Month LIBOR USD + 0.990%),
07/24/2023 (a) . . . . . . . . . . . . . . . . . . . . . . . . . . . . 56,634140,000 3.500%, 01/23/2025 . . . . . . . . . . . . . . . . . . . . . . . . 151,18240,000 3.272% (3 Month LIBOR USD + 1.201%),
09/29/2025 (a) . . . . . . . . . . . . . . . . . . . . . . . . . . . . 42,93270,000 1.992% (SOFR + 1.090%), 01/27/2032 (a) . . . . . . 66,250
140,000 6.750%, 10/01/2037 . . . . . . . . . . . . . . . . . . . . . . . . 197,26820,000 6.250%, 02/01/2041 . . . . . . . . . . . . . . . . . . . . . . . . 28,216
Willis North America, Inc.25,000 3.600%, 05/15/2024 . . . . . . . . . . . . . . . . . . . . . . . . 26,951
145,000 2.950%, 09/15/2029 . . . . . . . . . . . . . . . . . . . . . . . . 149,903
3,707,106
Chemicals - 0.36%Air Products and Chemicals, Inc.
20,000 1.500%, 10/15/2025 . . . . . . . . . . . . . . . . . . . . . . . . 20,30040,000 1.850%, 05/15/2027 . . . . . . . . . . . . . . . . . . . . . . . . 40,447
295,000 DuPont de Nemours, Inc.4.205%, 11/15/2023 . . . . . . . . . . . . . . . . . . . . . . . . 320,520
The Sherwin-Williams Co.15,000 3.450%, 06/01/2027 . . . . . . . . . . . . . . . . . . . . . . . . 16,37795,000 2.950%, 08/15/2029 . . . . . . . . . . . . . . . . . . . . . . . . 99,049
105,000 2.300%, 05/15/2030 . . . . . . . . . . . . . . . . . . . . . . . . 103,50575,000 3.300%, 05/15/2050 . . . . . . . . . . . . . . . . . . . . . . . . 74,047
674,245
Commercial Services & Supplies - 0.15%240,000 Republic Services, Inc.
1.450%, 02/15/2031 . . . . . . . . . . . . . . . . . . . . . . . . 219,433Waste Management, Inc.
20,000 4.150%, 07/15/2049 . . . . . . . . . . . . . . . . . . . . . . . . 22,85940,000 2.500%, 11/15/2050 . . . . . . . . . . . . . . . . . . . . . . . . 34,496
276,788
Consumer Finance - 0.36%155,000 American Express Co.
4.200%, 11/06/2025 . . . . . . . . . . . . . . . . . . . . . . . . 175,388John Deere Capital Corp.
135,000 3.200%, 01/10/2022 . . . . . . . . . . . . . . . . . . . . . . . . 138,11825,000 1.200%, 04/06/2023 . . . . . . . . . . . . . . . . . . . . . . . . 25,40825,000 3.450%, 06/07/2023 . . . . . . . . . . . . . . . . . . . . . . . . 26,605
145,000 2.600%, 03/07/2024 . . . . . . . . . . . . . . . . . . . . . . . . 153,62525,000 1.750%, 03/09/2027 . . . . . . . . . . . . . . . . . . . . . . . . 25,261
125,000 NiSource, Inc.3.490%, 05/15/2027 . . . . . . . . . . . . . . . . . . . . . . . . 135,748
680,153
PrincipalAmount Value
Diversified Consumer Services - 0.09%Howard University
100,000 2.901%, 10/01/2031 . . . . . . . . . . . . . . . . . . . . . . . . $ 100,74175,000 3.476%, 10/01/2041 . . . . . . . . . . . . . . . . . . . . . . . . 72,080
172,821
Diversified Financial Services - 1.09%BAT Capital Corp.
55,000 3.222%, 08/15/2024 . . . . . . . . . . . . . . . . . . . . . . . . 58,572275,000 2.789%, 09/06/2024 . . . . . . . . . . . . . . . . . . . . . . . . 290,062200,000 2.259%, 03/25/2028 . . . . . . . . . . . . . . . . . . . . . . . . 196,950120,000 BAT International Finance Plc
1.668%, 03/25/2026 . . . . . . . . . . . . . . . . . . . . . . . . 118,816340,000 Equitable Financial Life Global Funding
1.800%, 03/08/2028 (c)(e) . . . . . . . . . . . . . . . . . . . 332,523200,000 GE Capital Funding LLC
4.400%, 05/15/2030 (c)(e) . . . . . . . . . . . . . . . . . . . 226,449160,000 GlaxoSmithKline Capital, Inc.
3.625%, 05/15/2025 (e) . . . . . . . . . . . . . . . . . . . . . 176,00455,000 LYB International Finance III LLC
1.250%, 10/01/2025 . . . . . . . . . . . . . . . . . . . . . . . . 54,33085,000 3.800%, 10/01/2060 . . . . . . . . . . . . . . . . . . . . . . . . 83,100
200,000 NTT Finance Corp.1.162%, 04/03/2026 (c) . . . . . . . . . . . . . . . . . . . . . 197,410
310,000 Siemens Financieringsmaatschappij NV1.200%, 03/11/2026 (c) . . . . . . . . . . . . . . . . . . . . . 306,477
2,040,693
Diversified Telecommunication Services - 1.43%AT&T, Inc.
210,000 1.700%, 03/25/2026 . . . . . . . . . . . . . . . . . . . . . . . . 210,042175,000 4.500%, 05/15/2035 . . . . . . . . . . . . . . . . . . . . . . . . 197,501110,000 3.650%, 06/01/2051 (e) . . . . . . . . . . . . . . . . . . . . . 106,325168,000 3.500%, 09/15/2053 (c)(e) . . . . . . . . . . . . . . . . . . . 154,79891,000 3.550%, 09/15/2055 (c) . . . . . . . . . . . . . . . . . . . . . 83,258
113,000 3.800%, 12/01/2057 (c) . . . . . . . . . . . . . . . . . . . . . 107,227165,000 3.500%, 02/01/2061 . . . . . . . . . . . . . . . . . . . . . . . . 149,493
Verizon Communications, Inc.140,000 4.500%, 08/10/2033 . . . . . . . . . . . . . . . . . . . . . . . . 162,63020,000 4.812%, 03/15/2039 . . . . . . . . . . . . . . . . . . . . . . . . 23,913
130,000 2.650%, 11/20/2040 . . . . . . . . . . . . . . . . . . . . . . . . 118,704620,000 3.400%, 03/22/2041 . . . . . . . . . . . . . . . . . . . . . . . . 627,403155,000 4.862%, 08/21/2046 . . . . . . . . . . . . . . . . . . . . . . . . 185,87530,000 4.000%, 03/22/2050 . . . . . . . . . . . . . . . . . . . . . . . . 32,251
525,000 3.550%, 03/22/2051 . . . . . . . . . . . . . . . . . . . . . . . . 523,6343,000 4.672%, 03/15/2055 . . . . . . . . . . . . . . . . . . . . . . . . 3,567
2,686,621
Electric Utilities - 2.51%Alabama Power Co.
65,000 2.450%, 03/30/2022 . . . . . . . . . . . . . . . . . . . . . . . . 66,26780,000 4.150%, 08/15/2044 . . . . . . . . . . . . . . . . . . . . . . . . 88,75370,000 BP Capital Markets America, Inc.
3.633%, 04/06/2030 . . . . . . . . . . . . . . . . . . . . . . . . 76,718Cleco Corporate Holdings LLC
46,000 3.743%, 05/01/2026 . . . . . . . . . . . . . . . . . . . . . . . . 49,9755,000 4.973%, 05/01/2046 . . . . . . . . . . . . . . . . . . . . . . . . 5,523
120,000 Commonwealth Edison Co.3.650%, 06/15/2046 . . . . . . . . . . . . . . . . . . . . . . . . 127,788
Duke Energy Carolinas LLC45,000 2.500%, 03/15/2023 . . . . . . . . . . . . . . . . . . . . . . . . 46,652
301,000 5.300%, 02/15/2040 . . . . . . . . . . . . . . . . . . . . . . . . 385,818
See notes to financial statements.
76

GuideMark® Core Fixed Income FundSCHEDULE OF INVESTMENTS (Continued)March 31, 2021
PrincipalAmount Value
CORPORATE OBLIGATIONS (Continued)Electric Utilities (Continued)
60,000 Duke Energy Indiana, Inc.4.900%, 07/15/2043 . . . . . . . . . . . . . . . . . . . . . . . . $ 72,341
170,000 Duke Energy Ohio, Inc.3.650%, 02/01/2029 . . . . . . . . . . . . . . . . . . . . . . . . 184,999
45,000 Evergy Metro, Inc.2.250%, 06/01/2030 . . . . . . . . . . . . . . . . . . . . . . . . 44,462
Evergy, Inc.55,000 2.450%, 09/15/2024 . . . . . . . . . . . . . . . . . . . . . . . . 57,608
180,000 2.900%, 09/15/2029 . . . . . . . . . . . . . . . . . . . . . . . . 183,659Exelon Corp.
185,000 2.450%, 04/15/2021 . . . . . . . . . . . . . . . . . . . . . . . . 184,60910,000 4.700%, 04/15/2050 . . . . . . . . . . . . . . . . . . . . . . . . 11,98325,000 FirstEnergy Corp.
1.600%, 01/15/2026 . . . . . . . . . . . . . . . . . . . . . . . . 24,340Georgia Power Co.
130,000 2.100%, 07/30/2023 . . . . . . . . . . . . . . . . . . . . . . . . 134,255105,000 4.750%, 09/01/2040 . . . . . . . . . . . . . . . . . . . . . . . . 122,226210,000 ITC Holdings Corp.
2.950%, 05/14/2030 (c) . . . . . . . . . . . . . . . . . . . . . 214,326325,000 NextEra Energy Capital Holdings, Inc.
2.250%, 06/01/2030 . . . . . . . . . . . . . . . . . . . . . . . . 318,010230,000 Oglethorpe Power Corp.
5.050%, 10/01/2048 . . . . . . . . . . . . . . . . . . . . . . . . 270,90250,000 Oncor Electric Delivery Co. LLC
5.750%, 03/15/2029 . . . . . . . . . . . . . . . . . . . . . . . . 61,912410,000 Pacific Gas and Electric Co.
2.500%, 02/01/2031 . . . . . . . . . . . . . . . . . . . . . . . . 387,221PacifiCorp
60,000 2.700%, 09/15/2030 . . . . . . . . . . . . . . . . . . . . . . . . 61,55933,000 4.125%, 01/15/2049 . . . . . . . . . . . . . . . . . . . . . . . . 36,70310,000 3.300%, 03/15/2051 . . . . . . . . . . . . . . . . . . . . . . . . 9,946
Puget Energy, Inc.135,000 3.650%, 05/15/2025 . . . . . . . . . . . . . . . . . . . . . . . . 146,037190,000 4.100%, 06/15/2030 . . . . . . . . . . . . . . . . . . . . . . . . 206,155110,000 Sierra Pacific Power Co.
2.600%, 05/01/2026 . . . . . . . . . . . . . . . . . . . . . . . . 116,118122,000 South Carolina Electric & Gas Co.
5.100%, 06/01/2065 . . . . . . . . . . . . . . . . . . . . . . . . 161,818Southern California Edison Co.
90,000 2.850%, 08/01/2029 . . . . . . . . . . . . . . . . . . . . . . . . 91,482225,000 2.250%, 06/01/2030 . . . . . . . . . . . . . . . . . . . . . . . . 218,07919,000 4.000%, 04/01/2047 . . . . . . . . . . . . . . . . . . . . . . . . 19,54961,000 4.125%, 03/01/2048 . . . . . . . . . . . . . . . . . . . . . . . . 63,78480,000 3.650%, 02/01/2050 . . . . . . . . . . . . . . . . . . . . . . . . 78,946
The Southern Co. . . . . . . . . . . . . . . . . . . . . . . . . . . . .230,000 3.700%, 04/30/2030 (e) . . . . . . . . . . . . . . . . . . . . . 248,72525,000 4.400%, 07/01/2046 . . . . . . . . . . . . . . . . . . . . . . . . 27,829
120,000 Xcel Energy, Inc.2.600%, 12/01/2029 . . . . . . . . . . . . . . . . . . . . . . . . 121,185
4,728,262
Entertainment - 0.15%235,000 ViacomCBS, Inc.
4.950%, 01/15/2031 . . . . . . . . . . . . . . . . . . . . . . . . 278,106
Equity Real Estate Investment Trusts (REITs) - 0.35%American Tower Corp.
105,000 2.400%, 03/15/2025 . . . . . . . . . . . . . . . . . . . . . . . . 109,526250,000 1.500%, 01/31/2028 . . . . . . . . . . . . . . . . . . . . . . . . 238,551110,000 2.950%, 01/15/2051 (e) . . . . . . . . . . . . . . . . . . . . . 97,110
PrincipalAmount Value
Equity Real Estate Investment Trusts (REITs) (Continued)45,000 Brixmor Operating Partnership LP
4.050%, 07/01/2030 . . . . . . . . . . . . . . . . . . . . . . . . $ 48,49425,000 Equinix, Inc.
1.800%, 07/15/2027 . . . . . . . . . . . . . . . . . . . . . . . . 24,542VEREIT Operating Partnership LP
35,000 3.400%, 01/15/2028 . . . . . . . . . . . . . . . . . . . . . . . . 36,92610,000 2.200%, 06/15/2028 . . . . . . . . . . . . . . . . . . . . . . . . 9,81810,000 2.850%, 12/15/2032 . . . . . . . . . . . . . . . . . . . . . . . . 9,68685,000 Welltower, Inc.
2.700%, 02/15/2027 . . . . . . . . . . . . . . . . . . . . . . . . 88,673
663,326
Food Products - 0.40%75,000 Archer-Daniels-Midland Co.
3.250%, 03/27/2030 . . . . . . . . . . . . . . . . . . . . . . . . 80,590Conagra Brands, Inc.
145,000 1.375%, 11/01/2027 . . . . . . . . . . . . . . . . . . . . . . . . 139,768130,000 4.850%, 11/01/2028 . . . . . . . . . . . . . . . . . . . . . . . . 151,402190,000 General Mills, Inc.
2.875%, 04/15/2030 . . . . . . . . . . . . . . . . . . . . . . . . 196,164Mondelez International, Inc.
15,000 2.750%, 04/13/2030 . . . . . . . . . . . . . . . . . . . . . . . . 15,321175,000 1.500%, 02/04/2031 . . . . . . . . . . . . . . . . . . . . . . . . 160,281
743,526
Gas Utilities - 0.01%10,000 Southern Co. Gas Capital Corp.
2.450%, 10/01/2023 . . . . . . . . . . . . . . . . . . . . . . . . 10,418
Health Care Equipment & Supplies - 0.47%200,000 Alcon Finance Corp.
2.750%, 09/23/2026 (c) . . . . . . . . . . . . . . . . . . . . . 211,59465,000 Baxter International, Inc.
3.950%, 04/01/2030 (c)(e) . . . . . . . . . . . . . . . . . . . 73,180Becton Dickinson and Co.
35,000 2.823%, 05/20/2030 (e) . . . . . . . . . . . . . . . . . . . . . 35,89880,000 1.957%, 02/11/2031 . . . . . . . . . . . . . . . . . . . . . . . . 75,901
Boston Scientific Corp.85,000 1.900%, 06/01/2025 . . . . . . . . . . . . . . . . . . . . . . . . 87,241
250,000 3.750%, 03/01/2026 . . . . . . . . . . . . . . . . . . . . . . . . 276,090125,000 Shire Acquisitions Investments Ireland Designated
Activity Co.2.875%, 09/23/2023 . . . . . . . . . . . . . . . . . . . . . . . . 131,398
891,302
Health Care Providers & Services - 0.78%Anthem, Inc.
95,000 3.650%, 12/01/2027 . . . . . . . . . . . . . . . . . . . . . . . . 104,822180,000 2.875%, 09/15/2029 . . . . . . . . . . . . . . . . . . . . . . . . 186,87140,000 4.375%, 12/01/2047 . . . . . . . . . . . . . . . . . . . . . . . . 46,018
345,000 Cigna Corp.1.250%, 03/15/2026 . . . . . . . . . . . . . . . . . . . . . . . . 340,664
70,000 CommonSpirit Health2.760%, 10/01/2024 . . . . . . . . . . . . . . . . . . . . . . . . 74,196
CVS Health Corp.100,000 4.125%, 04/01/2040 . . . . . . . . . . . . . . . . . . . . . . . . 110,46855,000 5.125%, 07/20/2045 . . . . . . . . . . . . . . . . . . . . . . . . 67,260
100,000 5.050%, 03/25/2048 . . . . . . . . . . . . . . . . . . . . . . . . 122,572100,000 Quest Diagnostics, Inc.
2.800%, 06/30/2031 . . . . . . . . . . . . . . . . . . . . . . . . 101,74075,000 Sutter Health
3.361%, 08/15/2050 . . . . . . . . . . . . . . . . . . . . . . . . 74,184
See notes to financial statements.
77
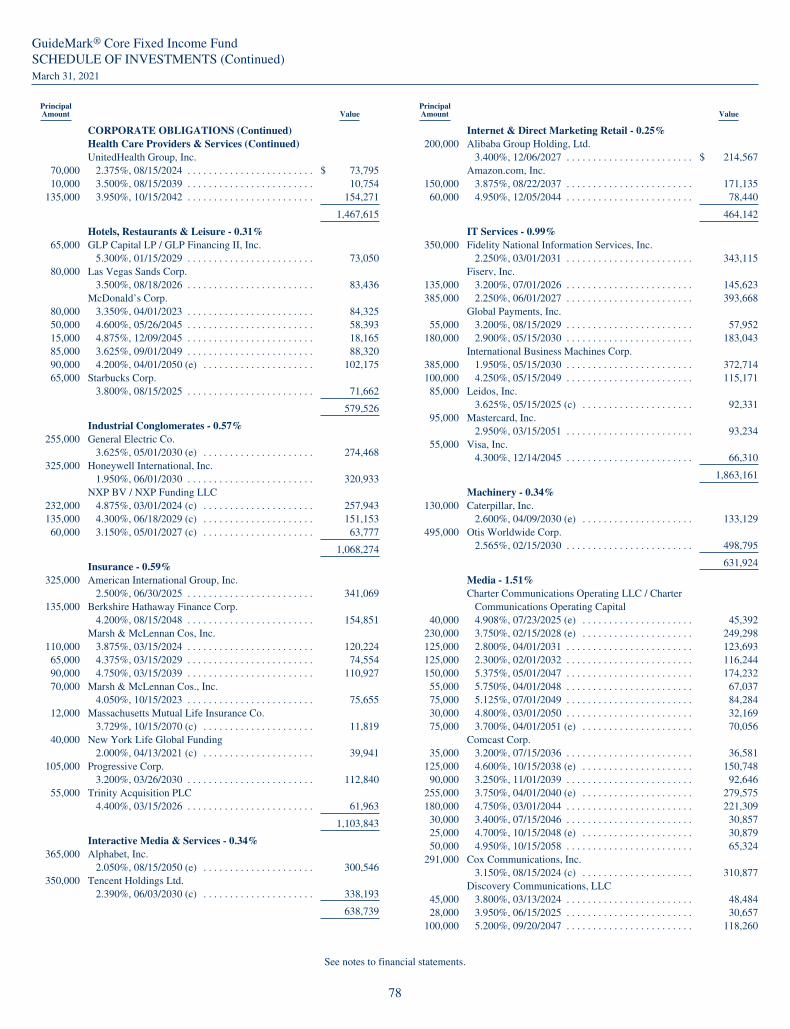
GuideMark® Core Fixed Income FundSCHEDULE OF INVESTMENTS (Continued)March 31, 2021
PrincipalAmount Value
CORPORATE OBLIGATIONS (Continued)Health Care Providers & Services (Continued)UnitedHealth Group, Inc.
70,000 2.375%, 08/15/2024 . . . . . . . . . . . . . . . . . . . . . . . . $ 73,79510,000 3.500%, 08/15/2039 . . . . . . . . . . . . . . . . . . . . . . . . 10,754
135,000 3.950%, 10/15/2042 . . . . . . . . . . . . . . . . . . . . . . . . 154,271
1,467,615
Hotels, Restaurants & Leisure - 0.31%65,000 GLP Capital LP / GLP Financing II, Inc.
5.300%, 01/15/2029 . . . . . . . . . . . . . . . . . . . . . . . . 73,05080,000 Las Vegas Sands Corp.
3.500%, 08/18/2026 . . . . . . . . . . . . . . . . . . . . . . . . 83,436McDonald’s Corp.
80,000 3.350%, 04/01/2023 . . . . . . . . . . . . . . . . . . . . . . . . 84,32550,000 4.600%, 05/26/2045 . . . . . . . . . . . . . . . . . . . . . . . . 58,39315,000 4.875%, 12/09/2045 . . . . . . . . . . . . . . . . . . . . . . . . 18,16585,000 3.625%, 09/01/2049 . . . . . . . . . . . . . . . . . . . . . . . . 88,32090,000 4.200%, 04/01/2050 (e) . . . . . . . . . . . . . . . . . . . . . 102,17565,000 Starbucks Corp.
3.800%, 08/15/2025 . . . . . . . . . . . . . . . . . . . . . . . . 71,662
579,526
Industrial Conglomerates - 0.57%255,000 General Electric Co.
3.625%, 05/01/2030 (e) . . . . . . . . . . . . . . . . . . . . . 274,468325,000 Honeywell International, Inc.
1.950%, 06/01/2030 . . . . . . . . . . . . . . . . . . . . . . . . 320,933NXP BV / NXP Funding LLC
232,000 4.875%, 03/01/2024 (c) . . . . . . . . . . . . . . . . . . . . . 257,943135,000 4.300%, 06/18/2029 (c) . . . . . . . . . . . . . . . . . . . . . 151,15360,000 3.150%, 05/01/2027 (c) . . . . . . . . . . . . . . . . . . . . . 63,777
1,068,274
Insurance - 0.59%325,000 American International Group, Inc.
2.500%, 06/30/2025 . . . . . . . . . . . . . . . . . . . . . . . . 341,069135,000 Berkshire Hathaway Finance Corp.
4.200%, 08/15/2048 . . . . . . . . . . . . . . . . . . . . . . . . 154,851Marsh & McLennan Cos, Inc.
110,000 3.875%, 03/15/2024 . . . . . . . . . . . . . . . . . . . . . . . . 120,22465,000 4.375%, 03/15/2029 . . . . . . . . . . . . . . . . . . . . . . . . 74,55490,000 4.750%, 03/15/2039 . . . . . . . . . . . . . . . . . . . . . . . . 110,92770,000 Marsh & McLennan Cos., Inc.
4.050%, 10/15/2023 . . . . . . . . . . . . . . . . . . . . . . . . 75,65512,000 Massachusetts Mutual Life Insurance Co.
3.729%, 10/15/2070 (c) . . . . . . . . . . . . . . . . . . . . . 11,81940,000 New York Life Global Funding
2.000%, 04/13/2021 (c) . . . . . . . . . . . . . . . . . . . . . 39,941105,000 Progressive Corp.
3.200%, 03/26/2030 . . . . . . . . . . . . . . . . . . . . . . . . 112,84055,000 Trinity Acquisition PLC
4.400%, 03/15/2026 . . . . . . . . . . . . . . . . . . . . . . . . 61,963
1,103,843
Interactive Media & Services - 0.34%365,000 Alphabet, Inc.
2.050%, 08/15/2050 (e) . . . . . . . . . . . . . . . . . . . . . 300,546350,000 Tencent Holdings Ltd.
2.390%, 06/03/2030 (c) . . . . . . . . . . . . . . . . . . . . . 338,193
638,739
PrincipalAmount Value
Internet & Direct Marketing Retail - 0.25%200,000 Alibaba Group Holding, Ltd.
3.400%, 12/06/2027 . . . . . . . . . . . . . . . . . . . . . . . . $ 214,567Amazon.com, Inc.
150,000 3.875%, 08/22/2037 . . . . . . . . . . . . . . . . . . . . . . . . 171,13560,000 4.950%, 12/05/2044 . . . . . . . . . . . . . . . . . . . . . . . . 78,440
464,142
IT Services - 0.99%350,000 Fidelity National Information Services, Inc.
2.250%, 03/01/2031 . . . . . . . . . . . . . . . . . . . . . . . . 343,115Fiserv, Inc.
135,000 3.200%, 07/01/2026 . . . . . . . . . . . . . . . . . . . . . . . . 145,623385,000 2.250%, 06/01/2027 . . . . . . . . . . . . . . . . . . . . . . . . 393,668
Global Payments, Inc.55,000 3.200%, 08/15/2029 . . . . . . . . . . . . . . . . . . . . . . . . 57,952
180,000 2.900%, 05/15/2030 . . . . . . . . . . . . . . . . . . . . . . . . 183,043International Business Machines Corp.
385,000 1.950%, 05/15/2030 . . . . . . . . . . . . . . . . . . . . . . . . 372,714100,000 4.250%, 05/15/2049 . . . . . . . . . . . . . . . . . . . . . . . . 115,17185,000 Leidos, Inc.
3.625%, 05/15/2025 (c) . . . . . . . . . . . . . . . . . . . . . 92,33195,000 Mastercard, Inc.
2.950%, 03/15/2051 . . . . . . . . . . . . . . . . . . . . . . . . 93,23455,000 Visa, Inc.
4.300%, 12/14/2045 . . . . . . . . . . . . . . . . . . . . . . . . 66,310
1,863,161
Machinery - 0.34%130,000 Caterpillar, Inc.
2.600%, 04/09/2030 (e) . . . . . . . . . . . . . . . . . . . . . 133,129495,000 Otis Worldwide Corp.
2.565%, 02/15/2030 . . . . . . . . . . . . . . . . . . . . . . . . 498,795
631,924
Media - 1.51%Charter Communications Operating LLC / Charter
Communications Operating Capital40,000 4.908%, 07/23/2025 (e) . . . . . . . . . . . . . . . . . . . . . 45,392
230,000 3.750%, 02/15/2028 (e) . . . . . . . . . . . . . . . . . . . . . 249,298125,000 2.800%, 04/01/2031 . . . . . . . . . . . . . . . . . . . . . . . . 123,693125,000 2.300%, 02/01/2032 . . . . . . . . . . . . . . . . . . . . . . . . 116,244150,000 5.375%, 05/01/2047 . . . . . . . . . . . . . . . . . . . . . . . . 174,23255,000 5.750%, 04/01/2048 . . . . . . . . . . . . . . . . . . . . . . . . 67,03775,000 5.125%, 07/01/2049 . . . . . . . . . . . . . . . . . . . . . . . . 84,28430,000 4.800%, 03/01/2050 . . . . . . . . . . . . . . . . . . . . . . . . 32,16975,000 3.700%, 04/01/2051 (e) . . . . . . . . . . . . . . . . . . . . . 70,056
Comcast Corp.35,000 3.200%, 07/15/2036 . . . . . . . . . . . . . . . . . . . . . . . . 36,581
125,000 4.600%, 10/15/2038 (e) . . . . . . . . . . . . . . . . . . . . . 150,74890,000 3.250%, 11/01/2039 . . . . . . . . . . . . . . . . . . . . . . . . 92,646
255,000 3.750%, 04/01/2040 (e) . . . . . . . . . . . . . . . . . . . . . 279,575180,000 4.750%, 03/01/2044 . . . . . . . . . . . . . . . . . . . . . . . . 221,30930,000 3.400%, 07/15/2046 . . . . . . . . . . . . . . . . . . . . . . . . 30,85725,000 4.700%, 10/15/2048 (e) . . . . . . . . . . . . . . . . . . . . . 30,87950,000 4.950%, 10/15/2058 . . . . . . . . . . . . . . . . . . . . . . . . 65,324
291,000 Cox Communications, Inc.3.150%, 08/15/2024 (c) . . . . . . . . . . . . . . . . . . . . . 310,877
Discovery Communications, LLC45,000 3.800%, 03/13/2024 . . . . . . . . . . . . . . . . . . . . . . . . 48,48428,000 3.950%, 06/15/2025 . . . . . . . . . . . . . . . . . . . . . . . . 30,657
100,000 5.200%, 09/20/2047 . . . . . . . . . . . . . . . . . . . . . . . . 118,260
See notes to financial statements.
78

GuideMark® Core Fixed Income FundSCHEDULE OF INVESTMENTS (Continued)March 31, 2021
PrincipalAmount Value
CORPORATE OBLIGATIONS (Continued)Media (Continued)
97,000 5.300%, 05/15/2049 . . . . . . . . . . . . . . . . . . . . . . . . $ 115,930115,000 4.650%, 05/15/2050 . . . . . . . . . . . . . . . . . . . . . . . . 126,761
Time Warner Cable, Inc.30,000 5.500%, 09/01/2041 . . . . . . . . . . . . . . . . . . . . . . . . 35,54150,000 4.500%, 09/15/2042 . . . . . . . . . . . . . . . . . . . . . . . . 53,386
110,000 ViacomCBS, Inc.4.200%, 05/19/2032 (e) . . . . . . . . . . . . . . . . . . . . . 123,464
2,833,684
Metals & Mining - 0.15%15,000 Steel Dynamics, Inc.
3.250%, 01/15/2031 . . . . . . . . . . . . . . . . . . . . . . . . 15,883260,000 Vale Overseas, Ltd.
3.750%, 07/08/2030 . . . . . . . . . . . . . . . . . . . . . . . . 272,910
288,793
Multi-Utilities - 0.70%Berkshire Hathaway Energy Co.
50,000 3.250%, 04/15/2028 . . . . . . . . . . . . . . . . . . . . . . . . 53,94365,000 6.125%, 04/01/2036 . . . . . . . . . . . . . . . . . . . . . . . . 87,689
170,000 Dominion Energy, Inc.2.850%, 08/15/2026 . . . . . . . . . . . . . . . . . . . . . . . . 180,560
290,000 NiSource, Inc.3.600%, 05/01/2030 (e) . . . . . . . . . . . . . . . . . . . . . 314,584
475,000 Public Service Enterprise Group, Inc.1.600%, 08/15/2030 . . . . . . . . . . . . . . . . . . . . . . . . 438,154
Sempra Energy150,000 3.400%, 02/01/2028 . . . . . . . . . . . . . . . . . . . . . . . . 160,92475,000 4.000%, 02/01/2048 . . . . . . . . . . . . . . . . . . . . . . . . 78,896
1,314,750
Oil, Gas & Consumable Fuels - 1.33%15,000 Canadian Natural Resources, Ltd.
6.500%, 02/15/2037 . . . . . . . . . . . . . . . . . . . . . . . . 19,04865,000 Eastern Energy Gas Holdings LLC
2.500%, 11/15/2024 . . . . . . . . . . . . . . . . . . . . . . . . 68,178Energy Transfer Operating LP
180,000 5.250%, 04/15/2029 . . . . . . . . . . . . . . . . . . . . . . . . 204,906140,000 6.125%, 12/15/2045 . . . . . . . . . . . . . . . . . . . . . . . . 160,28185,000 6.250%, 04/15/2049 . . . . . . . . . . . . . . . . . . . . . . . . 99,739
270,000 Enterprise Products Operating LLC4.800%, 02/01/2049 . . . . . . . . . . . . . . . . . . . . . . . . 309,675
Equinor ASA95,000 3.625%, 04/06/2040 . . . . . . . . . . . . . . . . . . . . . . . . 101,053
100,000 3.700%, 04/06/2050 . . . . . . . . . . . . . . . . . . . . . . . . 106,247135,000 Exxon Mobil Corp.
4.227%, 03/19/2040 . . . . . . . . . . . . . . . . . . . . . . . . 152,332200,000 Galaxy Pipeline Assets Bidco, Ltd.
2.940%, 09/30/2040 (c) . . . . . . . . . . . . . . . . . . . . . 193,467100,000 Hess Corp.
7.300%, 08/15/2031 . . . . . . . . . . . . . . . . . . . . . . . . 127,752130,000 Marathon Petroleum Corp.
4.700%, 05/01/2025 . . . . . . . . . . . . . . . . . . . . . . . . 146,603MPLX LP
100,000 1.750%, 03/01/2026 . . . . . . . . . . . . . . . . . . . . . . . . 100,17735,000 4.250%, 12/01/2027 . . . . . . . . . . . . . . . . . . . . . . . . 39,362
140,000 5.200%, 03/01/2047 . . . . . . . . . . . . . . . . . . . . . . . . 160,027ONEOK, Inc.
65,000 5.850%, 01/15/2026 . . . . . . . . . . . . . . . . . . . . . . . . 76,14230,000 4.000%, 07/13/2027 . . . . . . . . . . . . . . . . . . . . . . . . 32,51220,000 3.100%, 03/15/2030 . . . . . . . . . . . . . . . . . . . . . . . . 20,149
PrincipalAmount Value
Oil, Gas & Consumable Fuels (Continued)135,000 Sabine Pass Liquefaction LLC
4.500%, 05/15/2030 . . . . . . . . . . . . . . . . . . . . . . . . $ 151,671Sunoco Logistics Partners Operations LP
5,000 5.300%, 04/01/2044 . . . . . . . . . . . . . . . . . . . . . . . . 5,2615,000 5.350%, 05/15/2045 . . . . . . . . . . . . . . . . . . . . . . . . 5,250
TransCanada PipeLines, Ltd.110,000 4.100%, 04/15/2030 . . . . . . . . . . . . . . . . . . . . . . . . 122,671
5,000 4.750%, 05/15/2038 . . . . . . . . . . . . . . . . . . . . . . . . 5,73710,000 6.100%, 06/01/2040 . . . . . . . . . . . . . . . . . . . . . . . . 12,98165,000 5.100%, 03/15/2049 (e) . . . . . . . . . . . . . . . . . . . . . 79,503
2,500,724
Personal Products - 0.03%50,000 The Estee Lauder Cos, Inc.
2.600%, 04/15/2030 . . . . . . . . . . . . . . . . . . . . . . . . 51,543
Pharmaceuticals - 1.21%230,000 Bayer US Finance II LLC
4.250%, 12/15/2025 (c) . . . . . . . . . . . . . . . . . . . . . 256,069Bristol-Myers Squibb Co.
30,000 3.200%, 06/15/2026 . . . . . . . . . . . . . . . . . . . . . . . . 32,642230,000 1.125%, 11/13/2027 (e) . . . . . . . . . . . . . . . . . . . . . 222,43775,000 3.400%, 07/26/2029 . . . . . . . . . . . . . . . . . . . . . . . . 81,97770,000 2.550%, 11/13/2050 . . . . . . . . . . . . . . . . . . . . . . . . 62,430
195,000 GlaxoSmithKline Capital PLC2.875%, 06/01/2022 . . . . . . . . . . . . . . . . . . . . . . . . 200,080
Johnson & Johnson75,000 3.550%, 03/01/2036 . . . . . . . . . . . . . . . . . . . . . . . . 83,85955,000 3.625%, 03/03/2037 . . . . . . . . . . . . . . . . . . . . . . . . 62,158
Novartis Capital Corp.195,000 2.000%, 02/14/2027 . . . . . . . . . . . . . . . . . . . . . . . . 200,908205,000 2.200%, 08/14/2030 . . . . . . . . . . . . . . . . . . . . . . . . 206,169
Pfizer, Inc.120,000 2.625%, 04/01/2030 . . . . . . . . . . . . . . . . . . . . . . . . 124,520135,000 1.700%, 05/28/2030 . . . . . . . . . . . . . . . . . . . . . . . . 130,463
Royalty Pharma PLC15,000 1.750%, 09/02/2027 (c) . . . . . . . . . . . . . . . . . . . . . 14,571
200,000 2.200%, 09/02/2030 (c) . . . . . . . . . . . . . . . . . . . . . 191,036120,000 3.300%, 09/02/2040 (c) . . . . . . . . . . . . . . . . . . . . . 115,722105,000 3.550%, 09/02/2050 (c) . . . . . . . . . . . . . . . . . . . . . 100,017200,000 Takeda Pharmaceutical Co., Ltd
2.050%, 03/31/2030 (e) . . . . . . . . . . . . . . . . . . . . . 192,735
2,277,793
Professional Services - 0.05%Equifax, Inc.
67,000 2.600%, 12/15/2025 . . . . . . . . . . . . . . . . . . . . . . . . 70,32920,000 3.100%, 05/15/2030 . . . . . . . . . . . . . . . . . . . . . . . . 20,777
91,106
Road & Rail - 0.13%45,000 CSX Corp.
4.500%, 03/15/2049 . . . . . . . . . . . . . . . . . . . . . . . . 52,02530,000 Norfolk Southern Corp.
3.400%, 11/01/2049 . . . . . . . . . . . . . . . . . . . . . . . . 29,729160,000 Union Pacific Corp.
4.100%, 09/15/2067 . . . . . . . . . . . . . . . . . . . . . . . . 171,291
253,045
Semiconductors & Semiconductor Equipment - 1.04%Broadcom, Inc.
45,000 3.150%, 11/15/2025 . . . . . . . . . . . . . . . . . . . . . . . . 47,973
See notes to financial statements.
79

GuideMark® Core Fixed Income FundSCHEDULE OF INVESTMENTS (Continued)March 31, 2021
PrincipalAmount Value
CORPORATE OBLIGATIONS (Continued)Semiconductors & Semiconductor Equipment (Continued)
300,000 4.110%, 09/15/2028 . . . . . . . . . . . . . . . . . . . . . . . . $ 327,885425,000 5.000%, 04/15/2030 . . . . . . . . . . . . . . . . . . . . . . . . 483,577105,000 2.600%, 02/15/2033 (c) . . . . . . . . . . . . . . . . . . . . . 97,748205,000 3.420%, 04/15/2033 . . . . . . . . . . . . . . . . . . . . . . . . 206,593
Intel Corp.310,000 2.450%, 11/15/2029 . . . . . . . . . . . . . . . . . . . . . . . . 317,49419,000 3.734%, 12/08/2047 . . . . . . . . . . . . . . . . . . . . . . . . 20,458
115,000 3.250%, 11/15/2049 (e) . . . . . . . . . . . . . . . . . . . . . 114,102150,000 Microchip Technology, Inc.
2.670%, 09/01/2023 (c) . . . . . . . . . . . . . . . . . . . . . 156,299170,000 NVIDIA Corp.
3.500%, 04/01/2040 . . . . . . . . . . . . . . . . . . . . . . . . 182,804
1,954,933
Software - 0.75%155,000 Microsoft Corp.
2.525%, 06/01/2050 . . . . . . . . . . . . . . . . . . . . . . . . 141,439Oracle Corp.
270,000 2.300%, 03/25/2028 . . . . . . . . . . . . . . . . . . . . . . . . 273,171145,000 2.875%, 03/25/2031 . . . . . . . . . . . . . . . . . . . . . . . . 147,811185,000 4.300%, 07/08/2034 . . . . . . . . . . . . . . . . . . . . . . . . 208,16225,000 3.900%, 05/15/2035 . . . . . . . . . . . . . . . . . . . . . . . . 26,98150,000 3.800%, 11/15/2037 . . . . . . . . . . . . . . . . . . . . . . . . 52,064
185,000 3.600%, 04/01/2040 (e) . . . . . . . . . . . . . . . . . . . . . 186,105170,000 3.600%, 04/01/2050 . . . . . . . . . . . . . . . . . . . . . . . . 164,96780,000 3.950%, 03/25/2051 . . . . . . . . . . . . . . . . . . . . . . . . 82,17655,000 4.100%, 03/25/2061 . . . . . . . . . . . . . . . . . . . . . . . . 56,65675,000 salesforce.com, Inc.
3.250%, 04/11/2023 . . . . . . . . . . . . . . . . . . . . . . . . 79,255
1,418,787
Specialty Retail - 0.60%75,000 AutoZone, Inc.
3.625%, 04/15/2025 . . . . . . . . . . . . . . . . . . . . . . . . 81,722Home Depot, Inc.
235,000 3.300%, 04/15/2040 . . . . . . . . . . . . . . . . . . . . . . . . 247,3055,000 3.500%, 09/15/2056 . . . . . . . . . . . . . . . . . . . . . . . . 5,149
Lowe’s Cos, Inc.150,000 2.625%, 04/01/2031 . . . . . . . . . . . . . . . . . . . . . . . . 150,634345,000 1.700%, 10/15/2030 . . . . . . . . . . . . . . . . . . . . . . . . 324,09425,000 3.700%, 04/15/2046 . . . . . . . . . . . . . . . . . . . . . . . . 26,071
310,000 The Home Depot, Inc.1.375%, 03/15/2031 . . . . . . . . . . . . . . . . . . . . . . . . 285,892
1,120,867
Technology Hardware, Storage & Peripherals - 0.58%Apple, Inc.
360,000 1.125%, 05/11/2025 . . . . . . . . . . . . . . . . . . . . . . . . 362,422310,000 1.200%, 02/08/2028 . . . . . . . . . . . . . . . . . . . . . . . . 298,52940,000 3.450%, 02/09/2045 . . . . . . . . . . . . . . . . . . . . . . . . 42,331
430,000 2.650%, 02/08/2051 . . . . . . . . . . . . . . . . . . . . . . . . 392,433
1,095,715
Tobacco - 0.31%Altria Group, Inc.
45,000 2.350%, 05/06/2025 . . . . . . . . . . . . . . . . . . . . . . . . 46,67639,000 4.400%, 02/14/2026 . . . . . . . . . . . . . . . . . . . . . . . . 44,001
145,000 2.625%, 09/16/2026 . . . . . . . . . . . . . . . . . . . . . . . . 151,08380,000 2.450%, 02/04/2032 . . . . . . . . . . . . . . . . . . . . . . . . 76,09445,000 5.800%, 02/14/2039 . . . . . . . . . . . . . . . . . . . . . . . . 54,963
PrincipalAmount Value
Tobacco (Continued)15,000 5.375%, 01/31/2044 . . . . . . . . . . . . . . . . . . . . . . . . $ 17,490
165,000 3.875%, 09/16/2046 . . . . . . . . . . . . . . . . . . . . . . . . 159,90345,000 3.700%, 02/04/2051 . . . . . . . . . . . . . . . . . . . . . . . . 40,970
591,180
Water Utilities - 0.11%American Water Capital Corp.
140,000 3.750%, 09/01/2028 . . . . . . . . . . . . . . . . . . . . . . . . 155,80040,000 2.800%, 05/01/2030 . . . . . . . . . . . . . . . . . . . . . . . . 41,22215,000 4.150%, 06/01/2049 . . . . . . . . . . . . . . . . . . . . . . . . 17,237
214,259
Wireless Telecommunication Services - 0.92%205,000 Telefonica Emisiones SA
4.895%, 03/06/2048 (e) . . . . . . . . . . . . . . . . . . . . . 234,503T-Mobile USA, Inc.
235,000 3.500%, 04/15/2025 (c) . . . . . . . . . . . . . . . . . . . . . 253,896360,000 1.500%, 02/15/2026 (c) . . . . . . . . . . . . . . . . . . . . . 357,16165,000 2.050%, 02/15/2028 (c) . . . . . . . . . . . . . . . . . . . . . 63,924
290,000 3.875%, 04/15/2030 (c) . . . . . . . . . . . . . . . . . . . . . 316,384255,000 3.000%, 02/15/2041 (c) . . . . . . . . . . . . . . . . . . . . . 239,226155,000 4.500%, 04/15/2050 (c)(e) . . . . . . . . . . . . . . . . . . . 173,89290,000 Vodafone Group Plc
4.250%, 09/17/2050 (e) . . . . . . . . . . . . . . . . . . . . . 99,023
1,738,009
Total Corporate Obligations(Cost $54,548,969) . . . . . . . . . . . . . . . . . . . . . . . . . 56,256,477
FOREIGN GOVERNMENT DEBT OBLIGATIONS - 1.25%Mexico Government International Bond
330,000 2.659%, 05/24/2031 . . . . . . . . . . . . . . . . . . . . . . . . 311,797200,000 4.750%, 04/27/2032 . . . . . . . . . . . . . . . . . . . . . . . . 223,200176,000 4.750%, 03/08/2044 . . . . . . . . . . . . . . . . . . . . . . . . 185,584
Panama Government International Bond345,000 2.252%, 09/29/2032 . . . . . . . . . . . . . . . . . . . . . . . . 328,789220,000 3.870%, 07/23/2060 . . . . . . . . . . . . . . . . . . . . . . . . 217,780
Peruvian Government International Bond40,000 2.392%, 01/23/2026 . . . . . . . . . . . . . . . . . . . . . . . . 41,167
215,000 2.783%, 01/23/2031 . . . . . . . . . . . . . . . . . . . . . . . . 215,486130,000 3.300%, 03/11/2041 . . . . . . . . . . . . . . . . . . . . . . . . 126,54680,000 3.550%, 03/10/2051 . . . . . . . . . . . . . . . . . . . . . . . . 77,989
200,000 Qatar Government International Bond5.103%, 04/23/2048 . . . . . . . . . . . . . . . . . . . . . . . . 253,447
400,000 Saudi Government International Bond2.250%, 02/02/2033 (c) . . . . . . . . . . . . . . . . . . . . . 377,332
Total Foreign Government Debt Obligations(Cost $2,453,948) . . . . . . . . . . . . . . . . . . . . . . . . . . 2,359,117
MORTGAGE BACKED SECURITIES - U.S.GOVERNMENT AGENCY - 37.47%
Federal Home Loan Mortgage Corp.9,982 Pool #D9-6291 4.500%, 09/01/2023 . . . . . . . . . . . 10,842
21,725 Pool #G1-3624 5.000%, 08/01/2024 . . . . . . . . . . . 22,83682,000 Series K-068, 3.244%, 08/25/2027 . . . . . . . . . . . . . 91,015
723,882 Series K-104, 1.127%, 01/25/2030 (b)(j) . . . . . . . . 61,519334,651 Series K-110, 1.698%, 04/25/2030 (b)(j) . . . . . . . . 43,143
1,326,082 Series K-111, 1.572%, 05/25/2030 (j) . . . . . . . . . . 162,962934,206 Series K-114, 1.118%, 06/25/2030 (b)(j) . . . . . . . . 83,604299,888 Series K-122, 0.883%, 11/25/2030 (b)(j) . . . . . . . . 21,69893,482 Series 2329, 6.500%, 06/15/2031 . . . . . . . . . . . . . . 106,27347,793 Series 2338, 6.500%, 07/15/2031 . . . . . . . . . . . . . . 55,751
See notes to financial statements.
80

GuideMark® Core Fixed Income FundSCHEDULE OF INVESTMENTS (Continued)March 31, 2021
PrincipalAmount Value
MORTGAGE BACKED SECURITIES - U.S. GOVERNMENTAGENCY (Continued)
52,120 Pool #78-0447 3.426% (1 Year CMT Rate +2.250%, 2.250% Floor, 9.329% Cap),04/01/2033 (a) . . . . . . . . . . . . . . . . . . . . . . . . . . . . $ 54,449
74 Pool #A4-3129 5.500%, 02/01/2036 . . . . . . . . . . . 8388,974 Series 4216, 1.700%, 10/15/2039 . . . . . . . . . . . . . . 90,41846,768 Series 3883, 3.000%, 05/15/2041 . . . . . . . . . . . . . . 50,304
172,578 Series 4139, 2.500%, 11/15/2041 . . . . . . . . . . . . . . 180,799234,526 Pool #U9-0688 4.000%, 05/01/2042 . . . . . . . . . . . 257,334165,679 Series 4961, 2.500%, 12/15/2042 . . . . . . . . . . . . . . 173,010374,089 Pool #Q4-9389 3.500%, 07/01/2047 . . . . . . . . . . . 401,436325,943 Pool #Q5-2093 3.500%, 11/01/2047 . . . . . . . . . . . 346,362
2,999,998 Pool #SD-8123 3.000%, 01/01/2051 . . . . . . . . . . . 3,140,549Federal National Mortgage Association
244,887 Pool #AJ8325 3.000%, 12/01/2026 . . . . . . . . . . . . 259,8511,100,000 Pool #TBA 3.000%, 04/15/2027 (h) . . . . . . . . . . . 1,161,016
854,730 Pool #AN8322 3.190%, 02/01/2028 . . . . . . . . . . . 937,4961,000,654 Pool #AN8695 3.550%, 03/01/2028 . . . . . . . . . . . 1,120,149
1,767 Pool #544859 2.298% (11th District Cost ofFunds Index + 1.841%, 1.841% Floor, 14.718%Cap), 08/01/2029 (a) . . . . . . . . . . . . . . . . . . . . . . . . 1,767
36,635 Pool #BC4938 2.500%, 04/01/2031 . . . . . . . . . . . . 38,26370,805 Pool #786848 7.000%, 10/01/2031 . . . . . . . . . . . . 81,9672,385 Pool #727181 5.000%, 08/01/2033 . . . . . . . . . . . . 2,7501,050 Pool #730727 5.000%, 08/01/2033 . . . . . . . . . . . . 1,209
338 Pool #741862 5.500%, 09/01/2033 . . . . . . . . . . . . 395340 Pool #766197 5.500%, 02/01/2034 . . . . . . . . . . . . 39287 Pool #776974 5.500%, 04/01/2034 . . . . . . . . . . . . 102
52,993 Pool #888504 3.562% (1 Year CMT Rate +2.062%, 2.062% Floor, 9.321% Cap),04/01/2034 (a) . . . . . . . . . . . . . . . . . . . . . . . . . . . . 56,174
178,415 Pool #MA1870 4.500%, 04/01/2034 . . . . . . . . . . . 197,2513,070 Pool #775776 5.500%, 05/01/2034 . . . . . . . . . . . . 3,557
1,556,380 Series 2019-M21, 1.211%, 06/25/2034 (b)(j) . . . . 180,498103,906 Pool #802783 2.112% (12 Month LIBOR USD +
1.612%, 1.612% Floor, 10.299% Cap),10/01/2034 (a) . . . . . . . . . . . . . . . . . . . . . . . . . . . . 106,020
2,749 Pool #781629 5.500%, 12/01/2034 . . . . . . . . . . . . 3,2203,967 Pool #822815 5.500%, 04/01/2035 . . . . . . . . . . . . 4,6463,407 Pool #357850 5.500%, 07/01/2035 . . . . . . . . . . . . 3,9912,329 Pool #820242 5.000%, 07/01/2035 . . . . . . . . . . . . 2,711
537 Pool #838452 5.500%, 09/01/2035 . . . . . . . . . . . . 6301,650,000 Pool #TBA 1.500%, 11/25/2035 (h) . . . . . . . . . . . 1,654,477
2,812 Pool #865854 6.000%, 03/01/2036 . . . . . . . . . . . . 3,3634,955 Pool #891474 6.000%, 04/01/2036 . . . . . . . . . . . . 5,926
1,650,000 Pool #TBA 1.500%, 04/15/2036 (h) . . . . . . . . . . . 1,657,0903,200,000 Pool #TBA 2.000%, 04/15/2036 (h) . . . . . . . . . . . 3,283,375
1,916 Pool #906000 6.000%, 01/01/2037 . . . . . . . . . . . . 2,28838 Pool #928062 5.500%, 02/01/2037 . . . . . . . . . . . . 4557 Pool #899119 5.500%, 04/01/2037 . . . . . . . . . . . . 64
261,794 Pool #AS9772 3.500%, 06/01/2037 . . . . . . . . . . . . 283,020101 Pool #970131 5.500%, 03/01/2038 . . . . . . . . . . . . 11959 Pool #985108 5.500%, 07/01/2038 . . . . . . . . . . . . 6949 Pool #964930 5.500%, 08/01/2038 . . . . . . . . . . . . 5542 Pool #987032 5.500%, 08/01/2038 . . . . . . . . . . . . 4963 Pool #968371 5.500%, 09/01/2038 . . . . . . . . . . . . 7226 Pool #993050 5.500%, 12/01/2038 . . . . . . . . . . . . 30
10,454 Pool #993579 4.000%, 05/01/2039 . . . . . . . . . . . . 11,5202,013 Pool #AA5840 4.000%, 06/01/2039 . . . . . . . . . . . 2,219
37,289 Pool #AA8715 4.000%, 06/01/2039 . . . . . . . . . . . 41,581
PrincipalAmount Value
MORTGAGE BACKED SECURITIES - U.S. GOVERNMENTAGENCY (Continued)
117,008 Pool #AD0586 4.500%, 12/01/2039 . . . . . . . . . . . $ 131,993282,413 Pool #AD4062 5.000%, 05/01/2040 . . . . . . . . . . . 328,685236,239 Pool #AD6929 5.000%, 06/01/2040 . . . . . . . . . . . 272,068
5,181 Pool #AD9896 4.000%, 08/01/2040 . . . . . . . . . . . 5,6846,909 Pool #AB1500 4.000%, 09/01/2040 . . . . . . . . . . . 7,5838,349 Pool #AD9856 4.000%, 09/01/2040 . . . . . . . . . . . 9,2493,497 Pool #AE2559 4.000%, 09/01/2040 . . . . . . . . . . . . 3,8371,123 Pool #AE2562 4.000%, 09/01/2040 . . . . . . . . . . . . 1,2331,335 Pool #AE2566 4.000%, 09/01/2040 . . . . . . . . . . . . 1,465
14,396 Pool #AE4124 4.000%, 10/01/2040 . . . . . . . . . . . . 15,8747,673 Pool #AE4888 4.000%, 10/01/2040 . . . . . . . . . . . . 8,4459,755 Pool #AE3916 4.000%, 11/01/2040 . . . . . . . . . . . . 10,7521,472 Pool #AE5147 4.000%, 11/01/2040 . . . . . . . . . . . . 1,615
16,688 Pool #AE8715 4.000%, 11/01/2040 . . . . . . . . . . . . 18,3072,172 Pool #AH0006 4.000%, 12/01/2040 . . . . . . . . . . . 2,3946,863 Pool #AH0020 4.000%, 12/01/2040 . . . . . . . . . . . 7,566
11,183 Pool #AH0599 4.000%, 12/01/2040 . . . . . . . . . . . 12,2704,024 Pool #AH0601 4.000%, 12/01/2040 . . . . . . . . . . . 4,4556,898 Pool #AH1263 4.000%, 01/01/2041 . . . . . . . . . . . 7,568
36,912 Pool #AL5233 4.000%, 01/01/2041 . . . . . . . . . . . . 40,6352,361 Pool #AH4659 4.000%, 02/01/2041 . . . . . . . . . . . 2,590
41,960 Pool #AH5653 4.000%, 02/01/2041 . . . . . . . . . . . 46,26356,249 Pool #AL0934 5.000%, 02/01/2041 . . . . . . . . . . . . 65,17280,060 Pool #AD1889 4.500%, 03/01/2041 . . . . . . . . . . . 89,2116,162 Pool #AH6150 4.000%, 03/01/2041 . . . . . . . . . . . 6,824
53,869 Pool #AL0215 4.500%, 04/01/2041 . . . . . . . . . . . . 60,448400,000 Pool #TBA 4.000%, 04/15/2041 (h) . . . . . . . . . . . 429,28142,906 Pool #AL0187 5.000%, 05/01/2041 . . . . . . . . . . . . 49,9307,452 Pool #AL0456 5.000%, 06/01/2041 . . . . . . . . . . . . 8,611
33,441 Pool #AI8842 4.500%, 08/01/2041 . . . . . . . . . . . . 37,764109,899 Series 2013-43, 1.500%, 08/25/2041 . . . . . . . . . . . 112,28823,381 Pool #AL0815 4.000%, 09/01/2041 . . . . . . . . . . . . 26,06436,328 Series 2012-21, 2.000%, 09/25/2041 . . . . . . . . . . . 37,4628,719 Pool #AJ1562 4.000%, 10/01/2041 . . . . . . . . . . . . 9,7196,344 Pool #AJ1972 4.000%, 10/01/2041 . . . . . . . . . . . . 7,072
357,547 Pool #AJ2212 4.500%, 10/01/2041 . . . . . . . . . . . . 403,76312,188 Pool #AJ4756 4.000%, 10/01/2041 . . . . . . . . . . . . 13,58610,765 Pool #AJ3330 4.000%, 11/01/2041 . . . . . . . . . . . . 12,00010,013 Pool #AJ4549 4.000%, 11/01/2041 . . . . . . . . . . . . 11,1629,161 Pool #AJ4698 4.000%, 11/01/2041 . . . . . . . . . . . . 10,212
16,497 Pool #AJ5424 4.000%, 11/01/2041 . . . . . . . . . . . . 18,3906,500 Pool #AJ7840 4.000%, 11/01/2041 . . . . . . . . . . . . 7,246
10,592 Pool #AB3995 4.000%, 12/01/2041 . . . . . . . . . . . 11,8079,296 Pool #AI0848 4.000%, 12/01/2041 . . . . . . . . . . . . 10,3628,609 Pool #AJ4187 4.000%, 12/01/2041 . . . . . . . . . . . . 9,5978,778 Pool #AJ5736 4.000%, 12/01/2041 . . . . . . . . . . . . 9,7855,642 Pool #AJ5968 4.000%, 12/01/2041 . . . . . . . . . . . . 6,249
11,438 Pool #AJ6061 4.000%, 12/01/2041 . . . . . . . . . . . . 12,6568,547 Pool #AJ7868 4.000%, 12/01/2041 . . . . . . . . . . . . 9,528
16,381 Pool #AJ8104 4.000%, 12/01/2041 . . . . . . . . . . . . 18,26112,894 Pool #AJ8109 4.000%, 12/01/2041 . . . . . . . . . . . . 14,3737,194 Pool #AJ8171 4.000%, 12/01/2041 . . . . . . . . . . . . 8,019
13,406 Pool #AJ8341 4.000%, 12/01/2041 . . . . . . . . . . . . 14,94522,835 Pool #AJ8436 4.000%, 12/01/2041 . . . . . . . . . . . . 25,4557,938 Pool #AJ8912 4.000%, 12/01/2041 . . . . . . . . . . . . 8,8498,894 Pool #AJ9248 4.000%, 12/01/2041 . . . . . . . . . . . . 9,915
66,718 Series 2012-18, 2.000%, 12/25/2041 . . . . . . . . . . . 68,95263,758 Series 2012-75, 2.500%, 12/25/2041 . . . . . . . . . . . 65,8427,834 Pool #AJ2446 4.000%, 01/01/2042 . . . . . . . . . . . . 8,677
See notes to financial statements.
81

GuideMark® Core Fixed Income FundSCHEDULE OF INVESTMENTS (Continued)March 31, 2021
PrincipalAmount Value
MORTGAGE BACKED SECURITIES - U.S. GOVERNMENTAGENCY (Continued)
13,799 Pool #AJ7538 4.000%, 01/01/2042 . . . . . . . . . . . . $ 15,3833,489 Pool #AJ8001 4.000%, 01/01/2042 . . . . . . . . . . . . 3,839
11,356 Pool #AJ8369 4.000%, 01/01/2042 . . . . . . . . . . . . 12,65910,668 Pool #AJ9162 4.000%, 01/01/2042 . . . . . . . . . . . . 11,89462,519 Pool #AJ9330 4.000%, 01/01/2042 . . . . . . . . . . . . 69,7055,954 Pool #AJ9779 4.000%, 01/01/2042 . . . . . . . . . . . . 6,516
10,109 Pool #AK0170 4.000%, 01/01/2042 . . . . . . . . . . . 11,27222,150 Pool #AK0543 4.000%, 01/01/2042 . . . . . . . . . . . 24,6929,974 Pool #AK0563 4.000%, 01/01/2042 . . . . . . . . . . . 11,119
16,891 Pool #AK1827 4.000%, 01/01/2042 . . . . . . . . . . . 18,832196,768 Pool #AL2752 5.000%, 03/01/2042 . . . . . . . . . . . . 228,53445,059 Series 2012-52, 3.500%, 05/25/2042 . . . . . . . . . . . 48,770
157,774 Series 2012-128, 1.500%, 06/25/2042 . . . . . . . . . . 161,09936,989 Pool #AB5529 4.000%, 07/01/2042 . . . . . . . . . . . 40,572
108,018 Pool #AB6228 3.500%, 09/01/2042 . . . . . . . . . . . 116,771109,819 Series 415, 3.000%, 11/01/2042 . . . . . . . . . . . . . . . 113,111238,562 Pool #AQ9316 2.500%, 01/01/2043 . . . . . . . . . . . 247,150100,971 Series 2015-48, 3.000%, 02/25/2043 . . . . . . . . . . . 104,887658,261 Pool #AT2720 3.000%, 05/01/2043 . . . . . . . . . . . . 700,125439,306 Pool #AT5900 3.000%, 06/01/2043 . . . . . . . . . . . . 465,30583,712 Series 2013-77, 1.700%, 06/25/2043 . . . . . . . . . . . 85,168
276,378 Pool #AU1625 3.500%, 07/01/2043 . . . . . . . . . . . 298,92297,631 Series 2017-26, 3.500%, 07/25/2044 . . . . . . . . . . . 102,34852,388 Series 2018-38, 3.500%, 03/25/2045 . . . . . . . . . . . 53,113
332,177 Pool #AS5469 4.000%, 07/01/2045 . . . . . . . . . . . . 365,025426,564 Pool #AZ0832 4.000%, 07/01/2045 . . . . . . . . . . . . 471,63966,226 Pool #AS5597 3.500%, 08/01/2045 . . . . . . . . . . . . 71,06435,249 Series 2016-38, 3.000%, 01/25/2046 . . . . . . . . . . . 37,90571,573 Series 2016-11, 2.500%, 03/25/2046 . . . . . . . . . . . 74,637
356,465 Pool #AS7170 3.500%, 05/01/2046 . . . . . . . . . . . . 380,965246,039 Pool #AS7242 3.500%, 05/01/2046 . . . . . . . . . . . . 262,213395,348 Pool #BC9468 3.000%, 06/01/2046 . . . . . . . . . . . . 417,669270,698 Pool #AS7492 4.000%, 07/01/2046 . . . . . . . . . . . . 294,017291,277 Pool #AS8947 3.500%, 03/01/2047 . . . . . . . . . . . . 312,82048,327 Series 2017-34, 3.000%, 05/25/2047 . . . . . . . . . . . 50,06548,660 Pool #MA3038 4.500%, 06/01/2047 . . . . . . . . . . . 53,44287,193 Series 2017-72, 3.000%, 09/25/2047 . . . . . . . . . . . 92,82391,010 Series 2017-72, 3.000%, 09/25/2047 . . . . . . . . . . . 96,991
2,998,826 Pool #CA0858 3.500%, 12/01/2047 . . . . . . . . . . . 3,178,49485,110 Series 2018-80, 3.500%, 12/25/2047 . . . . . . . . . . . 89,76043,248 Series 2018-77, 3.500%, 02/25/2048 . . . . . . . . . . . 46,04796,879 Series 2018-23, 3.500%, 04/25/2048 . . . . . . . . . . . 104,321
1,018,077 Pool #BN5279 4.000%, 02/01/2049 . . . . . . . . . . . 1,092,432110,882 Series 2019-06, 3.000%, 02/25/2049 . . . . . . . . . . . 117,888107,373 Series 2019-07, 3.500%, 03/25/2049 . . . . . . . . . . . 115,068126,825 Series 2019-14, 3.500%, 04/25/2049 . . . . . . . . . . . 137,963150,544 Series 2019-45, 3.000%, 08/25/2049 . . . . . . . . . . . 161,989
1,210,000 Pool #TBA 2.500%, 09/25/2049 (h) . . . . . . . . . . . 1,240,8889,500,000 Pool #TBA 2.000%, 05/15/2050 (h) . . . . . . . . . . . 9,455,2834,195,000 Pool #TBA 2.000%, 09/25/2050 (h) . . . . . . . . . . . 4,182,9563,100,000 Pool #MA4307 3.000%, 04/01/2051 . . . . . . . . . . . 3,252,2734,290,000 Pool #TBA 2.500%, 05/15/2051 (h) . . . . . . . . . . . 4,390,296
137,175 Series 2019-41, 2.500%, 03/25/2053 . . . . . . . . . . . 142,926114,697 Series 2017-35, 3.500%, 04/25/2053 . . . . . . . . . . . 118,61082,045 Series 2017-84, 3.500%, 04/25/2053 . . . . . . . . . . . 84,702
129,190 Series 2019-15, 3.500%, 05/25/2053 . . . . . . . . . . . 136,68793,558 Series 2017-49, 4.000%, 07/25/2053 . . . . . . . . . . . 97,960
146,765 Series 2018-72, 3.500%, 07/25/2054 . . . . . . . . . . . 154,519125,380 Series 2017-96, 3.000%, 12/25/2054 . . . . . . . . . . . 131,880
PrincipalAmount Value
MORTGAGE BACKED SECURITIES - U.S. GOVERNMENTAGENCY (Continued)
63,901 Series 2018-19, 3.500%, 05/25/2056 . . . . . . . . . . . $ 67,203100,960 Series 2018-70, 3.500%, 10/25/2056 . . . . . . . . . . . 106,716108,533 Series 2019-07, 3.500%, 11/25/2057 . . . . . . . . . . . 115,608125,302 Series 2019-12, 3.500%, 11/25/2057 . . . . . . . . . . . 134,925352,990 Series 2020-1, 3.500%, 08/25/2058 . . . . . . . . . . . . 382,214112,818 Series 2019-28, 3.500%, 06/25/2059 . . . . . . . . . . . 122,456
Government National Mortgage Association9,145 Pool #614436X 5.000%, 08/15/2033 . . . . . . . . . . . 10,322
16,464 Pool #736686X 5.000%, 02/15/2039 . . . . . . . . . . . 18,981410,215 Pool #723248X 5.000%, 10/15/2039 . . . . . . . . . . . 477,921121,871 Series 2015-56, 1.500%, 04/16/2040 . . . . . . . . . . . 123,245177,469 Pool #783403X 3.500%, 09/15/2041 . . . . . . . . . . . 190,44490,471 Series 2013-37, 2.000%, 01/20/2042 . . . . . . . . . . . 92,966
900,000 Pool #TBA 4.000%, 04/15/2042 (h) . . . . . . . . . . . 960,8201,525,000 Pool #TBA 3.000%, 04/15/2045 (h) . . . . . . . . . . . 1,588,532
700,000 Pool #TBA 3.500%, 04/15/2045 (h) . . . . . . . . . . . 738,7741,775,000 Pool # TBA 3.000%, 05/15/2045 (h) . . . . . . . . . . . 1,849,848
700,000 Pool #TBA 3.500%, 05/15/2045 (h) . . . . . . . . . . . 739,26667,122 Series 2015-151, 1.700%, 10/20/2045 . . . . . . . . . . 68,02554,465 Pool #MA4587M 4.000%, 07/20/2047 . . . . . . . . . 59,082
144,641 Pool #MA4652M 3.500%, 08/20/2047 . . . . . . . . . 154,076275,038 Pool #MA4778M 3.500%, 10/20/2047 . . . . . . . . . 293,900204,831 Pool #MA4779M 4.000%, 10/20/2047 . . . . . . . . . 222,201234,043 Pool #MA4780M 4.500%, 10/20/2047 . . . . . . . . . 256,788
4,300,000 Pool #TBA 2.500%, 09/20/2049 (h) . . . . . . . . . . . 4,425,3891,000,000 Pool #TBA, 2.500%, 04/15/2050 (h) . . . . . . . . . . . 1,031,1522,700,000 Pool #TBA 2.000%, 04/15/2051 (h) . . . . . . . . . . . 2,724,943
Total Mortgage Backed Securities - U.S.Government Agency(Cost $69,254,085) . . . . . . . . . . . . . . . . . . . . . . . . . 70,455,612
MUNICIPAL DEBT OBLIGATIONS - 1.60%California, GO,
30,000 7.550%, 04/01/2039 (e) . . . . . . . . . . . . . . . . . . . . . 48,52060,000 7.300%, 10/01/2039 . . . . . . . . . . . . . . . . . . . . . . . . 91,5735,000 7.625%, 03/01/2040 . . . . . . . . . . . . . . . . . . . . . . . . 8,028
105,000 Chicago Transit Authority Sales & Transfer TaxReceipts, Series B, Revenue Bond,Series B, 6.899%, 12/01/2040 . . . . . . . . . . . . . . . . 146,844
20,000 Chicago Transit Authority Sales Tax Receipts,Revenue Bond3.912%, 12/01/2040 . . . . . . . . . . . . . . . . . . . . . . . . 21,262
County of Riverside CA345,000 2.963%, 02/15/2027 . . . . . . . . . . . . . . . . . . . . . . . . 367,315345,000 3.070%, 02/15/2028 . . . . . . . . . . . . . . . . . . . . . . . . 369,397125,000 District of Columbia, Revenue Bond
3.432%, 04/01/2042 . . . . . . . . . . . . . . . . . . . . . . . . 123,016255,000 Metropolitan Transportation Authority, Series C-1,
Revenue Bond5.175%, 11/15/2049 . . . . . . . . . . . . . . . . . . . . . . . . 317,386
100,000 Metropolitan Transportation Authority, Series C-2,Revenue Bond5.000%, 11/15/2050 . . . . . . . . . . . . . . . . . . . . . . . . 120,099
60,000 New York State Thruway Authority - Series M,Revenue Bond2.900%, 01/01/2035 . . . . . . . . . . . . . . . . . . . . . . . . 62,222
370,000 New York Transportation Development Corp.,Revenue Bond4.248%, 09/01/2035 . . . . . . . . . . . . . . . . . . . . . . . . 405,328
See notes to financial statements.
82
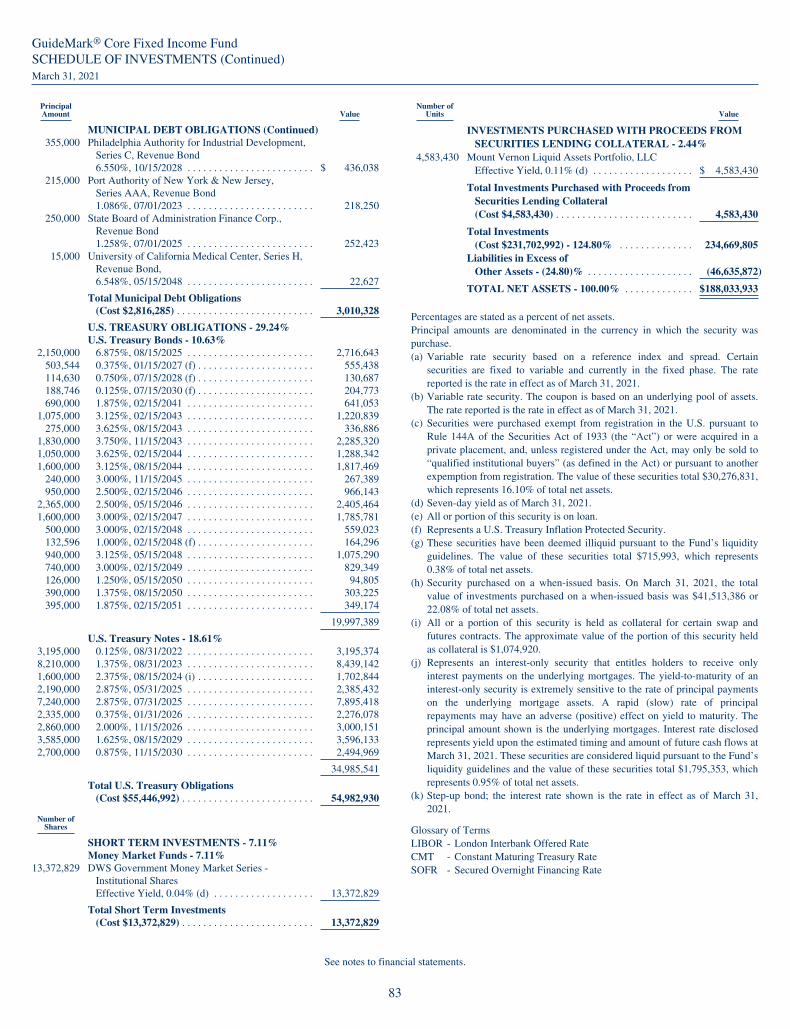
GuideMark® Core Fixed Income FundSCHEDULE OF INVESTMENTS (Continued)March 31, 2021
PrincipalAmount Value
MUNICIPAL DEBT OBLIGATIONS (Continued)355,000 Philadelphia Authority for Industrial Development,
Series C, Revenue Bond6.550%, 10/15/2028 . . . . . . . . . . . . . . . . . . . . . . . . $ 436,038
215,000 Port Authority of New York & New Jersey,Series AAA, Revenue Bond1.086%, 07/01/2023 . . . . . . . . . . . . . . . . . . . . . . . . 218,250
250,000 State Board of Administration Finance Corp.,Revenue Bond1.258%, 07/01/2025 . . . . . . . . . . . . . . . . . . . . . . . . 252,423
15,000 University of California Medical Center, Series H,Revenue Bond,6.548%, 05/15/2048 . . . . . . . . . . . . . . . . . . . . . . . . 22,627
Total Municipal Debt Obligations(Cost $2,816,285) . . . . . . . . . . . . . . . . . . . . . . . . . . 3,010,328
U.S. TREASURY OBLIGATIONS - 29.24%U.S. Treasury Bonds - 10.63%
2,150,000 6.875%, 08/15/2025 . . . . . . . . . . . . . . . . . . . . . . . . 2,716,643503,544 0.375%, 01/15/2027 (f) . . . . . . . . . . . . . . . . . . . . . . 555,438114,630 0.750%, 07/15/2028 (f) . . . . . . . . . . . . . . . . . . . . . . 130,687188,746 0.125%, 07/15/2030 (f) . . . . . . . . . . . . . . . . . . . . . . 204,773690,000 1.875%, 02/15/2041 . . . . . . . . . . . . . . . . . . . . . . . . 641,053
1,075,000 3.125%, 02/15/2043 . . . . . . . . . . . . . . . . . . . . . . . . 1,220,839275,000 3.625%, 08/15/2043 . . . . . . . . . . . . . . . . . . . . . . . . 336,886
1,830,000 3.750%, 11/15/2043 . . . . . . . . . . . . . . . . . . . . . . . . 2,285,3201,050,000 3.625%, 02/15/2044 . . . . . . . . . . . . . . . . . . . . . . . . 1,288,3421,600,000 3.125%, 08/15/2044 . . . . . . . . . . . . . . . . . . . . . . . . 1,817,469
240,000 3.000%, 11/15/2045 . . . . . . . . . . . . . . . . . . . . . . . . 267,389950,000 2.500%, 02/15/2046 . . . . . . . . . . . . . . . . . . . . . . . . 966,143
2,365,000 2.500%, 05/15/2046 . . . . . . . . . . . . . . . . . . . . . . . . 2,405,4641,600,000 3.000%, 02/15/2047 . . . . . . . . . . . . . . . . . . . . . . . . 1,785,781
500,000 3.000%, 02/15/2048 . . . . . . . . . . . . . . . . . . . . . . . . 559,023132,596 1.000%, 02/15/2048 (f) . . . . . . . . . . . . . . . . . . . . . . 164,296940,000 3.125%, 05/15/2048 . . . . . . . . . . . . . . . . . . . . . . . . 1,075,290740,000 3.000%, 02/15/2049 . . . . . . . . . . . . . . . . . . . . . . . . 829,349126,000 1.250%, 05/15/2050 . . . . . . . . . . . . . . . . . . . . . . . . 94,805390,000 1.375%, 08/15/2050 . . . . . . . . . . . . . . . . . . . . . . . . 303,225395,000 1.875%, 02/15/2051 . . . . . . . . . . . . . . . . . . . . . . . . 349,174
19,997,389
U.S. Treasury Notes - 18.61%3,195,000 0.125%, 08/31/2022 . . . . . . . . . . . . . . . . . . . . . . . . 3,195,3748,210,000 1.375%, 08/31/2023 . . . . . . . . . . . . . . . . . . . . . . . . 8,439,1421,600,000 2.375%, 08/15/2024 (i) . . . . . . . . . . . . . . . . . . . . . . 1,702,8442,190,000 2.875%, 05/31/2025 . . . . . . . . . . . . . . . . . . . . . . . . 2,385,4327,240,000 2.875%, 07/31/2025 . . . . . . . . . . . . . . . . . . . . . . . . 7,895,4182,335,000 0.375%, 01/31/2026 . . . . . . . . . . . . . . . . . . . . . . . . 2,276,0782,860,000 2.000%, 11/15/2026 . . . . . . . . . . . . . . . . . . . . . . . . 3,000,1513,585,000 1.625%, 08/15/2029 . . . . . . . . . . . . . . . . . . . . . . . . 3,596,1332,700,000 0.875%, 11/15/2030 . . . . . . . . . . . . . . . . . . . . . . . . 2,494,969
34,985,541
Total U.S. Treasury Obligations(Cost $55,446,992) . . . . . . . . . . . . . . . . . . . . . . . . . 54,982,930
Number ofShares
SHORT TERM INVESTMENTS - 7.11%Money Market Funds - 7.11%
13,372,829 DWS Government Money Market Series -Institutional SharesEffective Yield, 0.04% (d) . . . . . . . . . . . . . . . . . . . 13,372,829
Total Short Term Investments(Cost $13,372,829) . . . . . . . . . . . . . . . . . . . . . . . . . 13,372,829
Number ofUnits Value
INVESTMENTS PURCHASED WITH PROCEEDS FROMSECURITIES LENDING COLLATERAL - 2.44%
4,583,430 Mount Vernon Liquid Assets Portfolio, LLCEffective Yield, 0.11% (d) . . . . . . . . . . . . . . . . . . . $ 4,583,430
Total Investments Purchased with Proceeds fromSecurities Lending Collateral(Cost $4,583,430) . . . . . . . . . . . . . . . . . . . . . . . . . . 4,583,430
Total Investments(Cost $231,702,992) - 124.80% . . . . . . . . . . . . . . 234,669,805
Liabilities in Excess ofOther Assets - (24.80)% . . . . . . . . . . . . . . . . . . . . (46,635,872)
TOTAL NET ASSETS - 100.00% . . . . . . . . . . . . . $188,033,933
Percentages are stated as a percent of net assets.Principal amounts are denominated in the currency in which the security waspurchase.(a) Variable rate security based on a reference index and spread. Certain
securities are fixed to variable and currently in the fixed phase. The ratereported is the rate in effect as of March 31, 2021.
(b) Variable rate security. The coupon is based on an underlying pool of assets.The rate reported is the rate in effect as of March 31, 2021.
(c) Securities were purchased exempt from registration in the U.S. pursuant toRule 144A of the Securities Act of 1933 (the “Act”) or were acquired in aprivate placement, and, unless registered under the Act, may only be sold to“qualified institutional buyers” (as defined in the Act) or pursuant to anotherexpemption from registration. The value of these securities total $30,276,831,which represents 16.10% of total net assets.
(d) Seven-day yield as of March 31, 2021.(e) All or portion of this security is on loan.(f) Represents a U.S. Treasury Inflation Protected Security.(g) These securities have been deemed illiquid pursuant to the Fund’s liquidity
guidelines. The value of these securities total $715,993, which represents0.38% of total net assets.
(h) Security purchased on a when-issued basis. On March 31, 2021, the totalvalue of investments purchased on a when-issued basis was $41,513,386 or22.08% of total net assets.
(i) All or a portion of this security is held as collateral for certain swap andfutures contracts. The approximate value of the portion of this security heldas collateral is $1,074,920.
(j) Represents an interest-only security that entitles holders to receive onlyinterest payments on the underlying mortgages. The yield-to-maturity of aninterest-only security is extremely sensitive to the rate of principal paymentson the underlying mortgage assets. A rapid (slow) rate of principalrepayments may have an adverse (positive) effect on yield to maturity. Theprincipal amount shown is the underlying mortgages. Interest rate disclosedrepresents yield upon the estimated timing and amount of future cash flows atMarch 31, 2021. These securities are considered liquid pursuant to the Fund’sliquidity guidelines and the value of these securities total $1,795,353, whichrepresents 0.95% of total net assets.
(k) Step-up bond; the interest rate shown is the rate in effect as of March 31,2021.
Glossary of TermsLIBOR - London Interbank Offered RateCMT - Constant Maturing Treasury RateSOFR - Secured Overnight Financing Rate
See notes to financial statements.
83

GuideMark® Core Fixed Income FundSCHEDULE OF OPEN FUTURES CONTRACTSMarch 31, 2021
Description
Number ofContracts
Purchased / (Sold)Notional
ValueSettlement
Month
Value / UnrealizedAppreciation
(Depreciation)
U.S. Treasury 10 Year Note Futures (49) $(6,415,938) Jun-21 $117,748U.S. Treasury Ultra 10 Year Note Futures (63) (9,052,313) Jun-21 258,502U.S. Treasury 5 Year Note Futures (19) (2,344,570) Jun-21 7,246U.S. Treasury Long Bond Futures (6) (927,563) Jun-21 28,317U.S. Treasury Ultra Bond Futures (7) (1,268,531) Jun-21 29,612
$441,425
GuideMark® Core Fixed Income FundSCHEDULE OF OPEN SWAP CONTRACTSCREDIT DEFAULT SWAPS ON CREDIT INDICES — SELL PROTECTION(1)
March 31, 2021
Reference Obligation
ImpliedCredit
Spread at3/31/2021(2)
FixedPayRate
MaturityDate Counterparty
PaymentFrequency
NotionalAmount(3)
FairValue
UpfrontPremiums
Paid(Received)
UnrealizedAppreciation
(Depreciation)
CDX.NA.IG.36 Index* 53.93% 1.000% 06/20/2026 Morgan Stanley Quarterly $6,670,000 $155,958 $146,705 $9,253
INTEREST RATE SWAPSMarch 31, 2021
Pay/ReceiveFloating Rate
FloatingRate Index
FloatingPayment
Frequency
FixedPayRate
FixedPayment
FrequencyMaturity
Date CounterpartyNotionalAmount
FairValue
UpfrontPremiums
Paid(Received)
UnrealizedAppreciation
(Depreciation)
Receive 3-MO-USD-LIBOR** Quarterly 0.3800% Semi-Annual 12/16/2025 Morgan Stanley $5,270,000 $146,547 $(8,249) $154,796Receive 3-MO-USD-LIBOR** Quarterly 0.8100% Semi-Annual 9/16/2050 Morgan Stanley 690,000 218,373 2,114 216,259
$364,920 $(6,135) $371,055
1) If the Fund is a seller of protection and a credit event occurs, as defined under the terms of that particular swap agreement, the Fund will either (i) pay to the buyer ofprotection an amount equal to the notional amount of the swap and take delivery of the referenced obligation or underlying securities comprising the referenced indexor (ii) pay a net settlement amount in the form of cash or securities equal to the notional amount of the swap less the recovery value of the referenced obligation orunderlying securities comprising the referenced index.
2) Implied credit spreads, represented in absolute terms, utilized in determining the fair value of credit default swap agreements on U.S. municipal issues, corporateissues or sovereign issues of an emerging country as of year end serve as an indicator of the current status of the payment/ performance risk and represent thelikelihood or risk of default for the credit derivative. The implied credit spread of a particular referenced entity reflects the cost of buying/selling protection and mayinclude upfront payments required to be made to enter into the agreement. Wider credit spreads represent a deterioration of the referenced entity’s credit soundnessand a greater likelihood or risk of default or other credit event occurring as defined under the terms of the agreement. A credit spread identified as “Defaulted”indicates a credit event has occurred for the referenced entity or obligation.
3) The maximum potential amount the Fund could be required to pay as seller of credit protection or receive as a buyer of credit protection if a credit event occurs asdefined under the terms of that particular swap agreement.
* Centrally cleared swap, clearing agent: Intercontinental Exchange** Centrally cleared swap, clearing agent: LCH
See notes to financial statements.
84
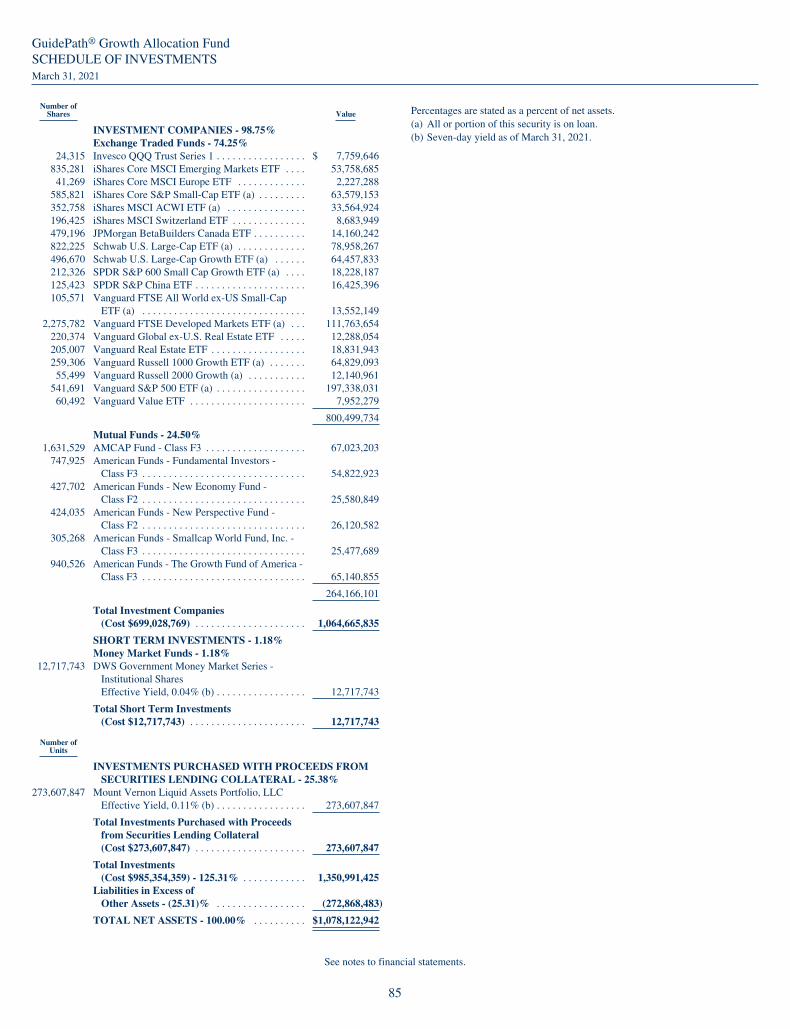
GuidePath® Growth Allocation FundSCHEDULE OF INVESTMENTSMarch 31, 2021
Number ofShares Value
INVESTMENT COMPANIES - 98.75%Exchange Traded Funds - 74.25%
24,315 Invesco QQQ Trust Series 1 . . . . . . . . . . . . . . . . . $ 7,759,646835,281 iShares Core MSCI Emerging Markets ETF . . . . 53,758,68541,269 iShares Core MSCI Europe ETF . . . . . . . . . . . . . 2,227,288
585,821 iShares Core S&P Small-Cap ETF (a) . . . . . . . . . 63,579,153352,758 iShares MSCI ACWI ETF (a) . . . . . . . . . . . . . . . 33,564,924196,425 iShares MSCI Switzerland ETF . . . . . . . . . . . . . . 8,683,949479,196 JPMorgan BetaBuilders Canada ETF . . . . . . . . . . 14,160,242822,225 Schwab U.S. Large-Cap ETF (a) . . . . . . . . . . . . . 78,958,267496,670 Schwab U.S. Large-Cap Growth ETF (a) . . . . . . 64,457,833212,326 SPDR S&P 600 Small Cap Growth ETF (a) . . . . 18,228,187125,423 SPDR S&P China ETF . . . . . . . . . . . . . . . . . . . . . 16,425,396105,571 Vanguard FTSE All World ex-US Small-Cap
ETF (a) . . . . . . . . . . . . . . . . . . . . . . . . . . . . . . . 13,552,1492,275,782 Vanguard FTSE Developed Markets ETF (a) . . . 111,763,654
220,374 Vanguard Global ex-U.S. Real Estate ETF . . . . . 12,288,054205,007 Vanguard Real Estate ETF . . . . . . . . . . . . . . . . . . 18,831,943259,306 Vanguard Russell 1000 Growth ETF (a) . . . . . . . 64,829,09355,499 Vanguard Russell 2000 Growth (a) . . . . . . . . . . . 12,140,961
541,691 Vanguard S&P 500 ETF (a) . . . . . . . . . . . . . . . . . 197,338,03160,492 Vanguard Value ETF . . . . . . . . . . . . . . . . . . . . . . 7,952,279
800,499,734
Mutual Funds - 24.50%1,631,529 AMCAP Fund - Class F3 . . . . . . . . . . . . . . . . . . . 67,023,203
747,925 American Funds - Fundamental Investors -Class F3 . . . . . . . . . . . . . . . . . . . . . . . . . . . . . . . 54,822,923
427,702 American Funds - New Economy Fund -Class F2 . . . . . . . . . . . . . . . . . . . . . . . . . . . . . . . 25,580,849
424,035 American Funds - New Perspective Fund -Class F2 . . . . . . . . . . . . . . . . . . . . . . . . . . . . . . . 26,120,582
305,268 American Funds - Smallcap World Fund, Inc. -Class F3 . . . . . . . . . . . . . . . . . . . . . . . . . . . . . . . 25,477,689
940,526 American Funds - The Growth Fund of America -Class F3 . . . . . . . . . . . . . . . . . . . . . . . . . . . . . . . 65,140,855
264,166,101
Total Investment Companies(Cost $699,028,769) . . . . . . . . . . . . . . . . . . . . . 1,064,665,835
SHORT TERM INVESTMENTS - 1.18%Money Market Funds - 1.18%
12,717,743 DWS Government Money Market Series -Institutional SharesEffective Yield, 0.04% (b) . . . . . . . . . . . . . . . . . 12,717,743
Total Short Term Investments(Cost $12,717,743) . . . . . . . . . . . . . . . . . . . . . . 12,717,743
Number ofUnits
INVESTMENTS PURCHASED WITH PROCEEDS FROMSECURITIES LENDING COLLATERAL - 25.38%
273,607,847 Mount Vernon Liquid Assets Portfolio, LLCEffective Yield, 0.11% (b) . . . . . . . . . . . . . . . . . 273,607,847
Total Investments Purchased with Proceedsfrom Securities Lending Collateral(Cost $273,607,847) . . . . . . . . . . . . . . . . . . . . . 273,607,847
Total Investments(Cost $985,354,359) - 125.31% . . . . . . . . . . . . 1,350,991,425
Liabilities in Excess ofOther Assets - (25.31)% . . . . . . . . . . . . . . . . . (272,868,483)
TOTAL NET ASSETS - 100.00% . . . . . . . . . . $1,078,122,942
Percentages are stated as a percent of net assets.(a) All or portion of this security is on loan.(b) Seven-day yield as of March 31, 2021.
See notes to financial statements.
85
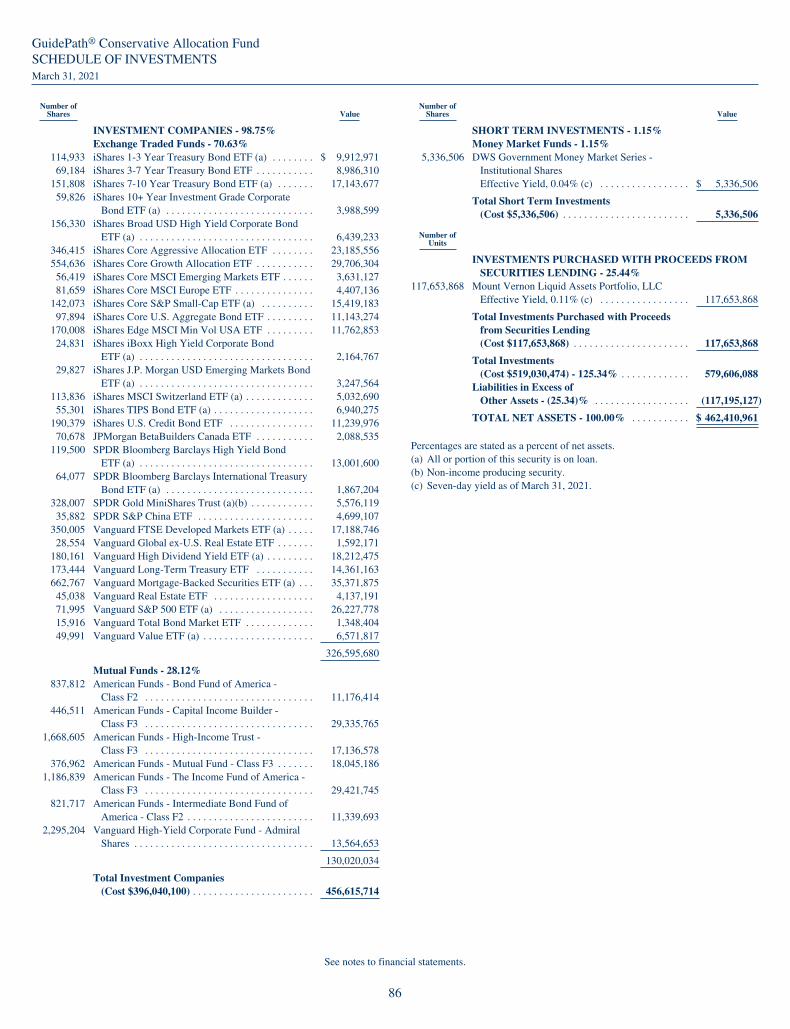
GuidePath® Conservative Allocation FundSCHEDULE OF INVESTMENTSMarch 31, 2021
Number ofShares Value
INVESTMENT COMPANIES - 98.75%Exchange Traded Funds - 70.63%
114,933 iShares 1-3 Year Treasury Bond ETF (a) . . . . . . . . $ 9,912,97169,184 iShares 3-7 Year Treasury Bond ETF . . . . . . . . . . . 8,986,310
151,808 iShares 7-10 Year Treasury Bond ETF (a) . . . . . . . 17,143,67759,826 iShares 10+ Year Investment Grade Corporate
Bond ETF (a) . . . . . . . . . . . . . . . . . . . . . . . . . . . . 3,988,599156,330 iShares Broad USD High Yield Corporate Bond
ETF (a) . . . . . . . . . . . . . . . . . . . . . . . . . . . . . . . . . 6,439,233346,415 iShares Core Aggressive Allocation ETF . . . . . . . . 23,185,556554,636 iShares Core Growth Allocation ETF . . . . . . . . . . . 29,706,30456,419 iShares Core MSCI Emerging Markets ETF . . . . . . 3,631,12781,659 iShares Core MSCI Europe ETF . . . . . . . . . . . . . . . 4,407,136
142,073 iShares Core S&P Small-Cap ETF (a) . . . . . . . . . . 15,419,18397,894 iShares Core U.S. Aggregate Bond ETF . . . . . . . . . 11,143,274
170,008 iShares Edge MSCI Min Vol USA ETF . . . . . . . . . 11,762,85324,831 iShares iBoxx High Yield Corporate Bond
ETF (a) . . . . . . . . . . . . . . . . . . . . . . . . . . . . . . . . . 2,164,76729,827 iShares J.P. Morgan USD Emerging Markets Bond
ETF (a) . . . . . . . . . . . . . . . . . . . . . . . . . . . . . . . . . 3,247,564113,836 iShares MSCI Switzerland ETF (a) . . . . . . . . . . . . . 5,032,69055,301 iShares TIPS Bond ETF (a) . . . . . . . . . . . . . . . . . . . 6,940,275
190,379 iShares U.S. Credit Bond ETF . . . . . . . . . . . . . . . . 11,239,97670,678 JPMorgan BetaBuilders Canada ETF . . . . . . . . . . . 2,088,535
119,500 SPDR Bloomberg Barclays High Yield BondETF (a) . . . . . . . . . . . . . . . . . . . . . . . . . . . . . . . . . 13,001,600
64,077 SPDR Bloomberg Barclays International TreasuryBond ETF (a) . . . . . . . . . . . . . . . . . . . . . . . . . . . . 1,867,204
328,007 SPDR Gold MiniShares Trust (a)(b) . . . . . . . . . . . . 5,576,11935,882 SPDR S&P China ETF . . . . . . . . . . . . . . . . . . . . . . 4,699,107
350,005 Vanguard FTSE Developed Markets ETF (a) . . . . . 17,188,74628,554 Vanguard Global ex-U.S. Real Estate ETF . . . . . . . 1,592,171
180,161 Vanguard High Dividend Yield ETF (a) . . . . . . . . . 18,212,475173,444 Vanguard Long-Term Treasury ETF . . . . . . . . . . . 14,361,163662,767 Vanguard Mortgage-Backed Securities ETF (a) . . . 35,371,87545,038 Vanguard Real Estate ETF . . . . . . . . . . . . . . . . . . . 4,137,19171,995 Vanguard S&P 500 ETF (a) . . . . . . . . . . . . . . . . . . 26,227,77815,916 Vanguard Total Bond Market ETF . . . . . . . . . . . . . 1,348,40449,991 Vanguard Value ETF (a) . . . . . . . . . . . . . . . . . . . . . 6,571,817
326,595,680
Mutual Funds - 28.12%837,812 American Funds - Bond Fund of America -
Class F2 . . . . . . . . . . . . . . . . . . . . . . . . . . . . . . . . 11,176,414446,511 American Funds - Capital Income Builder -
Class F3 . . . . . . . . . . . . . . . . . . . . . . . . . . . . . . . . 29,335,7651,668,605 American Funds - High-Income Trust -
Class F3 . . . . . . . . . . . . . . . . . . . . . . . . . . . . . . . . 17,136,578376,962 American Funds - Mutual Fund - Class F3 . . . . . . . 18,045,186
1,186,839 American Funds - The Income Fund of America -Class F3 . . . . . . . . . . . . . . . . . . . . . . . . . . . . . . . . 29,421,745
821,717 American Funds - Intermediate Bond Fund ofAmerica - Class F2 . . . . . . . . . . . . . . . . . . . . . . . . 11,339,693
2,295,204 Vanguard High-Yield Corporate Fund - AdmiralShares . . . . . . . . . . . . . . . . . . . . . . . . . . . . . . . . . . 13,564,653
130,020,034
Total Investment Companies(Cost $396,040,100) . . . . . . . . . . . . . . . . . . . . . . . 456,615,714
Number ofShares Value
SHORT TERM INVESTMENTS - 1.15%Money Market Funds - 1.15%
5,336,506 DWS Government Money Market Series -Institutional SharesEffective Yield, 0.04% (c) . . . . . . . . . . . . . . . . . $ 5,336,506
Total Short Term Investments(Cost $5,336,506) . . . . . . . . . . . . . . . . . . . . . . . . 5,336,506
Number ofUnits
INVESTMENTS PURCHASED WITH PROCEEDS FROMSECURITIES LENDING - 25.44%
117,653,868 Mount Vernon Liquid Assets Portfolio, LLCEffective Yield, 0.11% (c) . . . . . . . . . . . . . . . . . 117,653,868
Total Investments Purchased with Proceedsfrom Securities Lending(Cost $117,653,868) . . . . . . . . . . . . . . . . . . . . . . 117,653,868
Total Investments(Cost $519,030,474) - 125.34% . . . . . . . . . . . . . 579,606,088
Liabilities in Excess ofOther Assets - (25.34)% . . . . . . . . . . . . . . . . . . (117,195,127)
TOTAL NET ASSETS - 100.00% . . . . . . . . . . . $ 462,410,961
Percentages are stated as a percent of net assets.(a) All or portion of this security is on loan.(b) Non-income producing security.(c) Seven-day yield as of March 31, 2021.
See notes to financial statements.
86

GuidePath® Tactical Allocation FundSCHEDULE OF INVESTMENTSMarch 31, 2021
Number ofShares Value
COMMON STOCKS - 70.07%Biotechnology - 5.83%
38,793 Biogen, Inc. (a)(b) . . . . . . . . . . . . . . . . . . . . . . . . . . . $ 10,852,34222,755 Regeneron Pharmaceuticals, Inc. (a)(b) . . . . . . . . . . 10,766,30134,746 United Therapeutics Corp. (b) . . . . . . . . . . . . . . . . . . 5,811,963
27,430,606
Building Products - 0.80%89,532 Carrier Global Corp. . . . . . . . . . . . . . . . . . . . . . . . . . 3,780,041
Capital Markets - 3.44%22,244 FactSet Research Systems, Inc. . . . . . . . . . . . . . . . . . 6,864,2769,191 MarketAxess Holdings, Inc. . . . . . . . . . . . . . . . . . . . 4,576,383
15,958 Moody’s Corp. (a) . . . . . . . . . . . . . . . . . . . . . . . . . . . 4,765,218
16,205,877
Containers & Packaging - 0.79%88,868 Silgan Holdings, Inc. . . . . . . . . . . . . . . . . . . . . . . . . . 3,735,122
Diversified Financial Services - 0.69%51,384 Voya Financial, Inc. . . . . . . . . . . . . . . . . . . . . . . . . . 3,270,078
Entertainment - 2.15%36,465 Activision Blizzard, Inc. . . . . . . . . . . . . . . . . . . . . . . 3,391,24549,608 Electronic Arts, Inc. . . . . . . . . . . . . . . . . . . . . . . . . . . 6,715,435
10,106,680
Food & Staples Retailing - 0.72%93,639 Kroger Co. (a) . . . . . . . . . . . . . . . . . . . . . . . . . . . . . . 3,370,068
Food Products - 1.23%154,059 Conagra Brands, Inc. . . . . . . . . . . . . . . . . . . . . . . . . . 5,792,618
Health Care Equipment & Supplies - 2.09%6,615 Align Technology, Inc. (b) . . . . . . . . . . . . . . . . . . . . 3,582,221
12,810 IDEXX Laboratories, Inc. (b) . . . . . . . . . . . . . . . . . . 6,268,061
9,850,282
Health Care Providers & Services - 5.79%184,998 Centene Corp. (b) . . . . . . . . . . . . . . . . . . . . . . . . . . . 11,823,222204,985 CVS Health Corp. . . . . . . . . . . . . . . . . . . . . . . . . . . . 15,421,022
27,244,244
Hotels, Restaurants & Leisure - 0.68%21,623 Marriott International, Inc. - Class A (b) . . . . . . . . . . 3,202,582
Household Durables - 0.80%37,284 Lennar Corp. - Class A . . . . . . . . . . . . . . . . . . . . . . . 3,774,259
Household Products - 2.77%67,568 Clorox Co. (a) . . . . . . . . . . . . . . . . . . . . . . . . . . . . . . 13,032,516
Insurance - 5.37%267,134 Aflac, Inc. . . . . . . . . . . . . . . . . . . . . . . . . . . . . . . . . . 13,671,91875,411 Progressive Corp. (a) . . . . . . . . . . . . . . . . . . . . . . . . . 7,210,04648,416 Prudential Financial, Inc. . . . . . . . . . . . . . . . . . . . . . . 4,410,697
25,292,661
Interactive Media & Services - 2.38%38,098 Facebook, Inc. - Class A (b) . . . . . . . . . . . . . . . . . . . 11,221,004
Internet & Direct Marketing Retail - 0.79%60,815 eBay, Inc. (a) . . . . . . . . . . . . . . . . . . . . . . . . . . . . . . . 3,724,311
IT Services - 3.71%223,310 Cognizant Technology Solutions Corp. - Class A . . . 17,444,977
Life Sciences Tools & Services - 3.41%28,306 Agilent Technologies, Inc. . . . . . . . . . . . . . . . . . . . . 3,598,82521,778 Bio-Rad Laboratories, Inc. - Class A (b) . . . . . . . . . . 12,438,940
16,037,765
Number ofShares Value
Machinery - 1.51%30,704 Snap-on, Inc. (a) . . . . . . . . . . . . . . . . . . . . . . . . . . . $ 7,084,641
Media - 1.34%170,930 Discovery, Inc. - Class C (a)(b) . . . . . . . . . . . . . . . 6,305,608
Metals & Mining - 2.75%214,596 Newmont Corp. . . . . . . . . . . . . . . . . . . . . . . . . . . . 12,933,701
Multiline Retail - 7.62%180,976 Target Corp. (a) . . . . . . . . . . . . . . . . . . . . . . . . . . . 35,845,916
Multi-Utilities - 0.74%26,078 DTE Energy Co. (a) . . . . . . . . . . . . . . . . . . . . . . . . 3,472,025
Oil, Gas & Consumable Fuels - 0.68%170,581 Cabot Oil & Gas Corp. (a) . . . . . . . . . . . . . . . . . . . 3,203,511
Semiconductors & Semiconductor Equipment - 3.05%96,203 Intel Corp. . . . . . . . . . . . . . . . . . . . . . . . . . . . . . . . 6,156,99290,949 Marvell Technology Group, Ltd. (a) . . . . . . . . . . . 4,454,68220,379 Skyworks Solutions, Inc. . . . . . . . . . . . . . . . . . . . . 3,739,139
14,350,813
Software - 2.95%101,384 Cadence Design Systems, Inc. (b) . . . . . . . . . . . . . 13,888,594
Technology Hardware, Storage & Peripherals - 4.12%158,792 Apple, Inc. . . . . . . . . . . . . . . . . . . . . . . . . . . . . . . . 19,396,443
Trading Companies & Distributors - 1.87%26,660 United Rentals, Inc. (b) . . . . . . . . . . . . . . . . . . . . . 8,779,405
Total Common Stocks(Cost $289,437,956) . . . . . . . . . . . . . . . . . . . . . . 329,776,348
INVESTMENT COMPANIES - 8.91%Exchange Traded Funds - 8.91%
115,114 Vanguard S&P 500 ETF (a) . . . . . . . . . . . . . . . . . . 41,936,030
Total Investment Companies(Cost $38,790,332) . . . . . . . . . . . . . . . . . . . . . . . 41,936,030
REAL ESTATE INVESTMENT TRUSTS - 1.00%548,473 Annaly Capital Management, Inc. . . . . . . . . . . . . . 4,716,868
Total Real Estate Investment Trusts(Cost $4,570,143) . . . . . . . . . . . . . . . . . . . . . . . . 4,716,868
SHORT TERM INVESTMENTS - 20.16%Money Market Funds - 20.16%
94,875,186 DWS Government Money Market Series -Institutional SharesEffective Yield 0.04% (c) . . . . . . . . . . . . . . . . . . 94,875,186
Total Short Term Investments(Cost $94,875,186) . . . . . . . . . . . . . . . . . . . . . . . 94,875,186
Number ofUnits
INVESTMENTS PURCHASED WITH PROCEEDS FROMSECURITIES LENDING - 22.13%
104,133,886 Mount Vernon Liquid Assets Portfolio, LLCEffective Yield, 0.11% (c) . . . . . . . . . . . . . . . . . 104,133,886
Total Investments Purchased with Proceedsfrom Securities Lending(Cost $104,133,886) . . . . . . . . . . . . . . . . . . . . . . 104,133,886
Total Investments(Cost $531,807,503) - 122.27% . . . . . . . . . . . . . 575,438,318
Liabilities in Excess ofOther Assets - (22.27)% . . . . . . . . . . . . . . . . . . (104,821,603)
TOTAL NET ASSETS - 100.00% . . . . . . . . . . . $ 470,616,715
See notes to financial statements.
87

GuidePath® Tactical Allocation FundSCHEDULE OF INVESTMENTS (Continued)March 31, 2021
Percentages are stated as a percent of net assets.(a) All or portion of this security is on loan.(b) Non-income producing security.(c) Seven-day yield as of March 31, 2021.
See notes to financial statements.
88

GuidePath® Absolute Return Allocation FundSCHEDULE OF INVESTMENTSMarch 31, 2021
Number ofShares Value
INVESTMENT COMPANIES - 98.76%Exchange Traded Funds - 56.28%
4,308 Invesco DB Agriculture Fund (a) . . . . . . . . . . . . . . . $ 72,977579 Invesco DB Base Metals Fund (a) . . . . . . . . . . . . . . . 10,787
6,116 Invesco DB Energy Fund (a) . . . . . . . . . . . . . . . . . . . 79,875999 iShares Core MSCI Emerging Markets ETF . . . . . . . 64,296
11,205 iShares Interest Rate Hedged Corporate BondETF (b) . . . . . . . . . . . . . . . . . . . . . . . . . . . . . . . . . . 1,081,507
238,699 ProShares Investment Grade-Interest Rate HedgedETF . . . . . . . . . . . . . . . . . . . . . . . . . . . . . . . . . . . . . 18,401,306
206,592 Schwab Short-Term U.S. Treasury ETF . . . . . . . . . . 10,600,2353,464 SPDR Bloomberg Barclays 1-3 Month T-Bill
ETF . . . . . . . . . . . . . . . . . . . . . . . . . . . . . . . . . . . . . 316,956127,712 SPDR Bloomberg Barclays High Yield Bond
ETF (b) . . . . . . . . . . . . . . . . . . . . . . . . . . . . . . . . . . 13,895,066327,397 Vanguard Emerging Markets Government Bond
ETF . . . . . . . . . . . . . . . . . . . . . . . . . . . . . . . . . . . . . 25,373,2673,018 Vanguard FTSE Developed Markets ETF (b) . . . . . . 148,214
22,687 Vanguard Intermediate-Term Corporate BondETF . . . . . . . . . . . . . . . . . . . . . . . . . . . . . . . . . . . . . 2,110,572
524,273 Vanguard Mortgage-Backed Securities ETF (b) . . . . 27,980,4501,085 Vanguard S&P 500 ETF (b) . . . . . . . . . . . . . . . . . . . 395,265
65,329 Vanguard Total Bond Market ETF . . . . . . . . . . . . . . 5,534,673277,775 Xtrackers USD High Yield Corporate Bond
ETF (b) . . . . . . . . . . . . . . . . . . . . . . . . . . . . . . . . . . 13,885,972
119,951,418
Mutual Funds - 42.48%1,580,277 BlackRock Low Duration Bond Portfolio -
Institutional Shares . . . . . . . . . . . . . . . . . . . . . . . . . 15,423,506311,984 DoubleLine Core Fixed Income Fund - Institutional
Shares . . . . . . . . . . . . . . . . . . . . . . . . . . . . . . . . . . . 3,434,9421,650,861 DoubleLine Flexible Income Fund - Institutional
Shares (d) . . . . . . . . . . . . . . . . . . . . . . . . . . . . . . . . 15,930,8081,546,475 DoubleLine Low Duration Bond Fund - Institutional
Shares . . . . . . . . . . . . . . . . . . . . . . . . . . . . . . . . . . . 15,418,356302,324 DoubleLine Shiller Enhanced CAPE - Institutional
Shares . . . . . . . . . . . . . . . . . . . . . . . . . . . . . . . . . . . 5,931,5942,118,508 DoubleLine Total Return Bond Fund - Institutional
Shares . . . . . . . . . . . . . . . . . . . . . . . . . . . . . . . . . . . 22,159,590817,951 T. Rowe Price Institutional Floating Rate Fund -
Investor Shares . . . . . . . . . . . . . . . . . . . . . . . . . . . . 7,966,844719,943 Vanguard High-Yield Corporate Fund - Admiral
Shares . . . . . . . . . . . . . . . . . . . . . . . . . . . . . . . . . . . 4,254,863
90,520,503
Total Investment Companies(Cost $199,542,623) . . . . . . . . . . . . . . . . . . . . . . . . 210,471,921
SHORT TERM INVESTMENTS - 1.66%Money Market Funds - 1.66%
3,539,911 DWS Government Money Market Series -Institutional SharesEffective Yield 0.04%, (c) . . . . . . . . . . . . . . . . . . . 3,539,911
Total Short Term Investments(Cost $3,539,911) . . . . . . . . . . . . . . . . . . . . . . . . . . 3,539,911
Number ofUnits Value
INVESTMENTS PURCHASED WITH PROCEEDS FROMSECURITIES LENDING - 15.79%
33,662,416 Mount Vernon Liquid Assets Portfolio, LLCEffective Yield, 0.11% (c) . . . . . . . . . . . . . . . . . . . $ 33,662,416
Total Investments Purchased with Proceeds fromSecurities Lending(Cost $33,662,416) . . . . . . . . . . . . . . . . . . . . . . . . . 33,662,416
Total Investments(Cost $236,744,950) - 116.21% . . . . . . . . . . . . . . 247,674,248
Liabilities in Excess ofOther Assets - (16.21)% . . . . . . . . . . . . . . . . . . . . (34,541,313)
TOTAL NET ASSETS - 100.00% . . . . . . . . . . . . . $213,132,935
Percentages are stated as a percent of net assets.(a) Non-income producing security.(b) All or portion of this security is on loan.(c) Seven-day yield as of March 31, 2021.(d) Certain GuidePath® Funds invest in securities of unaffiliated underlying
funds in accordance with Section 12(d)(1)(F) of the Investment Company Actof 1940. Such investments are potentially illiquid, because an unaffiliatedunderlying fund, under the terms of Section 12(d)(1)(F), is not obligated toredeem its shares in an amount exceeding 1% of its total outstanding sharesduring any period of less than thirty days. Investments made in accordancewith Section 12(d)(1)(F) that exceed 1% of the outstanding shares of eachunderlying fund, and therefore are potentially illiquid, amount to $3,464,937or 1.63% of total net assets as of March 31, 2021.
See notes to financial statements.
89
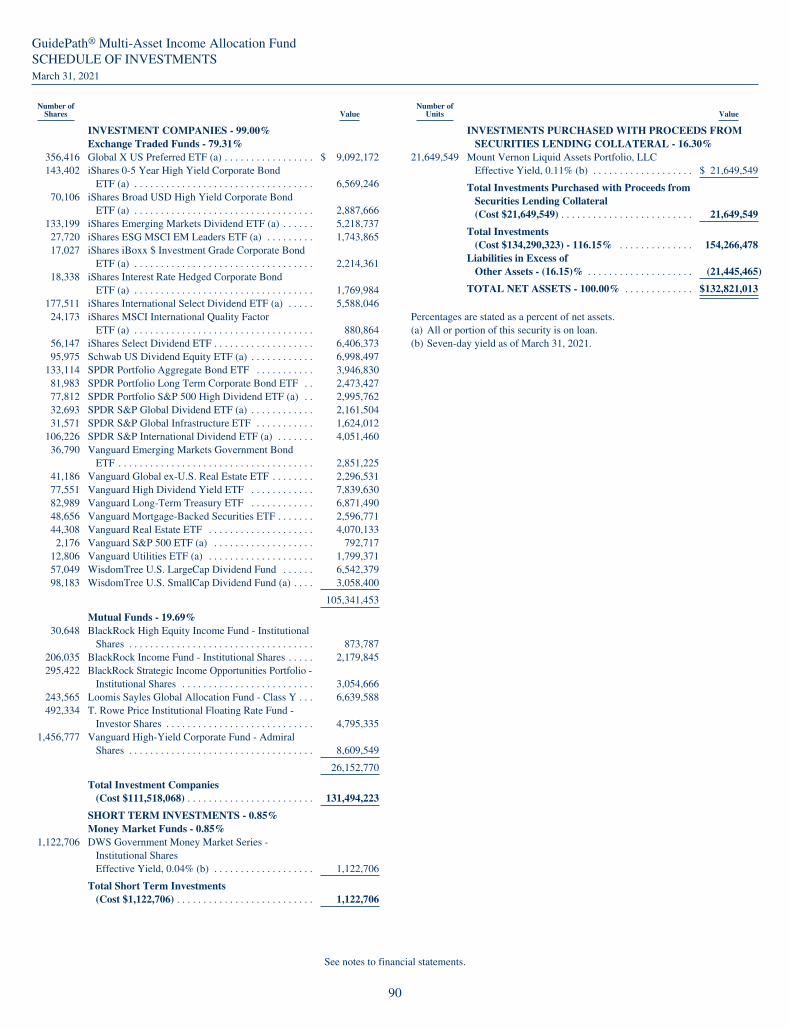
GuidePath® Multi-Asset Income Allocation FundSCHEDULE OF INVESTMENTSMarch 31, 2021
Number ofShares Value
INVESTMENT COMPANIES - 99.00%Exchange Traded Funds - 79.31%
356,416 Global X US Preferred ETF (a) . . . . . . . . . . . . . . . . . $ 9,092,172143,402 iShares 0-5 Year High Yield Corporate Bond
ETF (a) . . . . . . . . . . . . . . . . . . . . . . . . . . . . . . . . . . 6,569,24670,106 iShares Broad USD High Yield Corporate Bond
ETF (a) . . . . . . . . . . . . . . . . . . . . . . . . . . . . . . . . . . 2,887,666133,199 iShares Emerging Markets Dividend ETF (a) . . . . . . 5,218,73727,720 iShares ESG MSCI EM Leaders ETF (a) . . . . . . . . . 1,743,86517,027 iShares iBoxx $ Investment Grade Corporate Bond
ETF (a) . . . . . . . . . . . . . . . . . . . . . . . . . . . . . . . . . . 2,214,36118,338 iShares Interest Rate Hedged Corporate Bond
ETF (a) . . . . . . . . . . . . . . . . . . . . . . . . . . . . . . . . . . 1,769,984177,511 iShares International Select Dividend ETF (a) . . . . . 5,588,04624,173 iShares MSCI International Quality Factor
ETF (a) . . . . . . . . . . . . . . . . . . . . . . . . . . . . . . . . . . 880,86456,147 iShares Select Dividend ETF . . . . . . . . . . . . . . . . . . . 6,406,37395,975 Schwab US Dividend Equity ETF (a) . . . . . . . . . . . . 6,998,497
133,114 SPDR Portfolio Aggregate Bond ETF . . . . . . . . . . . 3,946,83081,983 SPDR Portfolio Long Term Corporate Bond ETF . . 2,473,42777,812 SPDR Portfolio S&P 500 High Dividend ETF (a) . . 2,995,76232,693 SPDR S&P Global Dividend ETF (a) . . . . . . . . . . . . 2,161,50431,571 SPDR S&P Global Infrastructure ETF . . . . . . . . . . . 1,624,012
106,226 SPDR S&P International Dividend ETF (a) . . . . . . . 4,051,46036,790 Vanguard Emerging Markets Government Bond
ETF . . . . . . . . . . . . . . . . . . . . . . . . . . . . . . . . . . . . . 2,851,22541,186 Vanguard Global ex-U.S. Real Estate ETF . . . . . . . . 2,296,53177,551 Vanguard High Dividend Yield ETF . . . . . . . . . . . . 7,839,63082,989 Vanguard Long-Term Treasury ETF . . . . . . . . . . . . 6,871,49048,656 Vanguard Mortgage-Backed Securities ETF . . . . . . . 2,596,77144,308 Vanguard Real Estate ETF . . . . . . . . . . . . . . . . . . . . 4,070,1332,176 Vanguard S&P 500 ETF (a) . . . . . . . . . . . . . . . . . . . 792,717
12,806 Vanguard Utilities ETF (a) . . . . . . . . . . . . . . . . . . . . 1,799,37157,049 WisdomTree U.S. LargeCap Dividend Fund . . . . . . 6,542,37998,183 WisdomTree U.S. SmallCap Dividend Fund (a) . . . . 3,058,400
105,341,453
Mutual Funds - 19.69%30,648 BlackRock High Equity Income Fund - Institutional
Shares . . . . . . . . . . . . . . . . . . . . . . . . . . . . . . . . . . . 873,787206,035 BlackRock Income Fund - Institutional Shares . . . . . 2,179,845295,422 BlackRock Strategic Income Opportunities Portfolio -
Institutional Shares . . . . . . . . . . . . . . . . . . . . . . . . . 3,054,666243,565 Loomis Sayles Global Allocation Fund - Class Y . . . 6,639,588492,334 T. Rowe Price Institutional Floating Rate Fund -
Investor Shares . . . . . . . . . . . . . . . . . . . . . . . . . . . . 4,795,3351,456,777 Vanguard High-Yield Corporate Fund - Admiral
Shares . . . . . . . . . . . . . . . . . . . . . . . . . . . . . . . . . . . 8,609,549
26,152,770
Total Investment Companies(Cost $111,518,068) . . . . . . . . . . . . . . . . . . . . . . . . 131,494,223
SHORT TERM INVESTMENTS - 0.85%Money Market Funds - 0.85%
1,122,706 DWS Government Money Market Series -Institutional SharesEffective Yield, 0.04% (b) . . . . . . . . . . . . . . . . . . . 1,122,706
Total Short Term Investments(Cost $1,122,706) . . . . . . . . . . . . . . . . . . . . . . . . . . 1,122,706
Number ofUnits Value
INVESTMENTS PURCHASED WITH PROCEEDS FROMSECURITIES LENDING COLLATERAL - 16.30%
21,649,549 Mount Vernon Liquid Assets Portfolio, LLCEffective Yield, 0.11% (b) . . . . . . . . . . . . . . . . . . . $ 21,649,549
Total Investments Purchased with Proceeds fromSecurities Lending Collateral(Cost $21,649,549) . . . . . . . . . . . . . . . . . . . . . . . . . 21,649,549
Total Investments(Cost $134,290,323) - 116.15% . . . . . . . . . . . . . . 154,266,478
Liabilities in Excess ofOther Assets - (16.15)% . . . . . . . . . . . . . . . . . . . . (21,445,465)
TOTAL NET ASSETS - 100.00% . . . . . . . . . . . . . $132,821,013
Percentages are stated as a percent of net assets.(a) All or portion of this security is on loan.(b) Seven-day yield as of March 31, 2021.
See notes to financial statements.
90
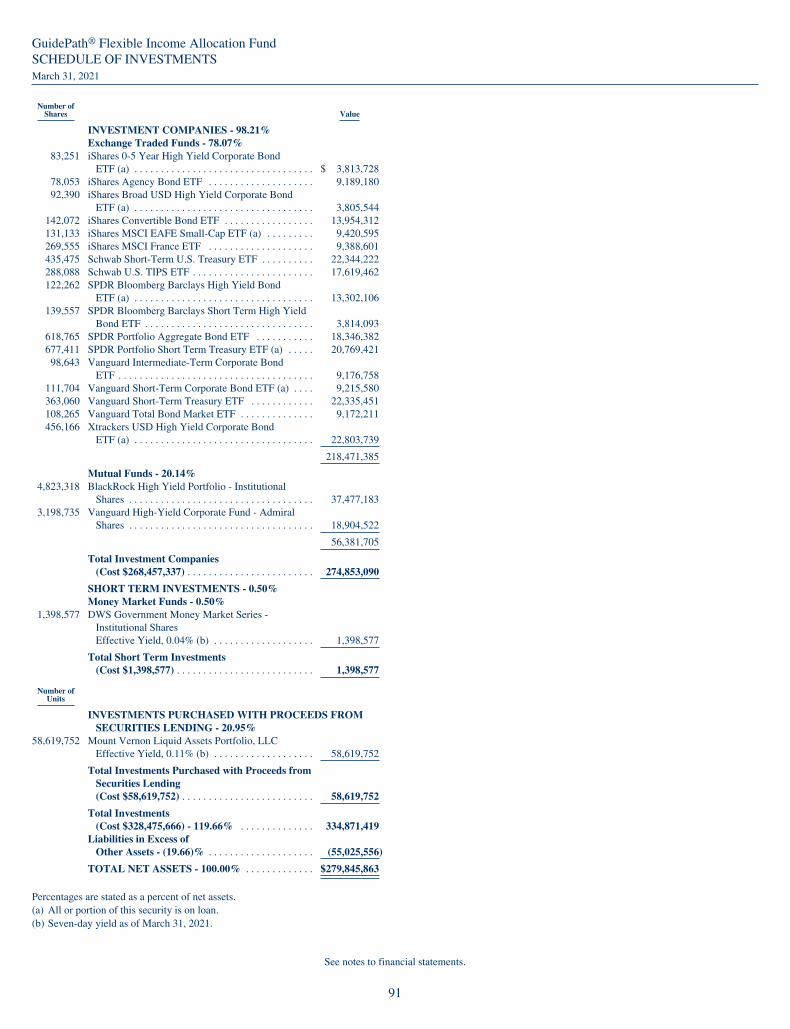
GuidePath® Flexible Income Allocation FundSCHEDULE OF INVESTMENTSMarch 31, 2021
Number ofShares Value
INVESTMENT COMPANIES - 98.21%Exchange Traded Funds - 78.07%
83,251 iShares 0-5 Year High Yield Corporate BondETF (a) . . . . . . . . . . . . . . . . . . . . . . . . . . . . . . . . . . $ 3,813,728
78,053 iShares Agency Bond ETF . . . . . . . . . . . . . . . . . . . . 9,189,18092,390 iShares Broad USD High Yield Corporate Bond
ETF (a) . . . . . . . . . . . . . . . . . . . . . . . . . . . . . . . . . . 3,805,544142,072 iShares Convertible Bond ETF . . . . . . . . . . . . . . . . . 13,954,312131,133 iShares MSCI EAFE Small-Cap ETF (a) . . . . . . . . . 9,420,595269,555 iShares MSCI France ETF . . . . . . . . . . . . . . . . . . . . 9,388,601435,475 Schwab Short-Term U.S. Treasury ETF . . . . . . . . . . 22,344,222288,088 Schwab U.S. TIPS ETF . . . . . . . . . . . . . . . . . . . . . . . 17,619,462122,262 SPDR Bloomberg Barclays High Yield Bond
ETF (a) . . . . . . . . . . . . . . . . . . . . . . . . . . . . . . . . . . 13,302,106139,557 SPDR Bloomberg Barclays Short Term High Yield
Bond ETF . . . . . . . . . . . . . . . . . . . . . . . . . . . . . . . . 3,814,093618,765 SPDR Portfolio Aggregate Bond ETF . . . . . . . . . . . 18,346,382677,411 SPDR Portfolio Short Term Treasury ETF (a) . . . . . 20,769,42198,643 Vanguard Intermediate-Term Corporate Bond
ETF . . . . . . . . . . . . . . . . . . . . . . . . . . . . . . . . . . . . . 9,176,758111,704 Vanguard Short-Term Corporate Bond ETF (a) . . . . 9,215,580363,060 Vanguard Short-Term Treasury ETF . . . . . . . . . . . . 22,335,451108,265 Vanguard Total Bond Market ETF . . . . . . . . . . . . . . 9,172,211456,166 Xtrackers USD High Yield Corporate Bond
ETF (a) . . . . . . . . . . . . . . . . . . . . . . . . . . . . . . . . . . 22,803,739
218,471,385
Mutual Funds - 20.14%4,823,318 BlackRock High Yield Portfolio - Institutional
Shares . . . . . . . . . . . . . . . . . . . . . . . . . . . . . . . . . . . 37,477,1833,198,735 Vanguard High-Yield Corporate Fund - Admiral
Shares . . . . . . . . . . . . . . . . . . . . . . . . . . . . . . . . . . . 18,904,522
56,381,705
Total Investment Companies(Cost $268,457,337) . . . . . . . . . . . . . . . . . . . . . . . . 274,853,090
SHORT TERM INVESTMENTS - 0.50%Money Market Funds - 0.50%
1,398,577 DWS Government Money Market Series -Institutional SharesEffective Yield, 0.04% (b) . . . . . . . . . . . . . . . . . . . 1,398,577
Total Short Term Investments(Cost $1,398,577) . . . . . . . . . . . . . . . . . . . . . . . . . . 1,398,577
Number ofUnits
INVESTMENTS PURCHASED WITH PROCEEDS FROMSECURITIES LENDING - 20.95%
58,619,752 Mount Vernon Liquid Assets Portfolio, LLCEffective Yield, 0.11% (b) . . . . . . . . . . . . . . . . . . . 58,619,752
Total Investments Purchased with Proceeds fromSecurities Lending(Cost $58,619,752) . . . . . . . . . . . . . . . . . . . . . . . . . 58,619,752
Total Investments(Cost $328,475,666) - 119.66% . . . . . . . . . . . . . . 334,871,419
Liabilities in Excess ofOther Assets - (19.66)% . . . . . . . . . . . . . . . . . . . . (55,025,556)
TOTAL NET ASSETS - 100.00% . . . . . . . . . . . . . $279,845,863
Percentages are stated as a percent of net assets.(a) All or portion of this security is on loan.(b) Seven-day yield as of March 31, 2021.
See notes to financial statements.
91

GuidePath® Managed Futures Strategy FundCONSOLIDATED SCHEDULE OF INVESTMENTSMarch 31, 2021
PrincipalAmount Value
SHORT TERM INVESTMENTS - 94.64%Certificate of Deposits - 31.95%
$7,000,000 Bank of Montreal0.240%, 06/23/2021 . . . . . . . . . . . . . . . . . . . . . . . . $ 7,000,000
CIBC1,500,000 0.080%, 04/23/2021 . . . . . . . . . . . . . . . . . . . . . . . . 1,500,0006,000,000 0.150%, 08/24/2021 . . . . . . . . . . . . . . . . . . . . . . . . 6,000,0005,500,000 Cooperatieve Centrale Raiffe
0.230%, 07/20/2021 . . . . . . . . . . . . . . . . . . . . . . . . 5,500,0847,000,000 DG Bank
0.140%, 06/03/2021 . . . . . . . . . . . . . . . . . . . . . . . . 7,000,0005,000,000 Mizuho Bank, Ltd.
0.170%, 05/18/2021 . . . . . . . . . . . . . . . . . . . . . . . . 5,000,0007,500,000 Norinchukin Bank
0.150%, 05/07/2021 . . . . . . . . . . . . . . . . . . . . . . . . 7,500,0006,500,000 Royal Bank of Canada
0.287% (3 Month LIBOR USD +0.110%), 06/11/2021 (a) . . . . . . . . . . . . . . . . . . . . . 6,501,632
8,000,000 SEB0.180%, 07/15/2021 . . . . . . . . . . . . . . . . . . . . . . . . 8,000,000
Sumitomo Mitsui Banking Corp.5,000,000 0.180%, 08/17/2021 . . . . . . . . . . . . . . . . . . . . . . . . 5,000,0002,500,000 0.190%, 09/08/2021 . . . . . . . . . . . . . . . . . . . . . . . . 2,500,0005,000,000 Sumitomo Mitsui Trust Bank, Ltd.
0.150%, 06/21/2021 . . . . . . . . . . . . . . . . . . . . . . . . 5,000,000
66,501,716
Number ofShares
Money Market Funds - 6.24%12,993,407 DWS Government Money Market Series -
Institutional SharesEffective Yield, 0.040% (b)(c) . . . . . . . . . . . . . . . . 12,993,407
PrincipalAmount
U.S. Treasury Bills - 56.45%$8,000,000 0.033%, 04/06/2021 . . . . . . . . . . . . . . . . . . . . . . . . 7,999,9613,500,000 0.033%, 04/08/2021 (c)(e) . . . . . . . . . . . . . . . . . . . 3,499,9777,000,000 0.035%, 04/13/2021 (d) . . . . . . . . . . . . . . . . . . . . . 6,999,9185,000,000 0.076%, 04/20/2021 (d) . . . . . . . . . . . . . . . . . . . . . 4,999,8027,000,000 0.081%, 05/04/2021 (d) . . . . . . . . . . . . . . . . . . . . . 6,999,4872,000,000 0.029%, 05/06/2021 (d)(e) . . . . . . . . . . . . . . . . . . . 1,999,9455,000,000 0.030%, 05/11/2021 . . . . . . . . . . . . . . . . . . . . . . . . 4,999,8894,000,000 0.081%, 05/18/2021 (d) . . . . . . . . . . . . . . . . . . . . . 3,999,5824,000,000 0.020%, 05/20/2021 (d) . . . . . . . . . . . . . . . . . . . . . 3,999,8917,000,000 0.035%, 05/25/2021 (d) . . . . . . . . . . . . . . . . . . . . . 6,999,6334,000,000 0.030%, 06/01/2021 (d) . . . . . . . . . . . . . . . . . . . . . 3,999,932
10,000,000 0.081%, 06/15/2021 (d) . . . . . . . . . . . . . . . . . . . . . 9,999,9374,000,000 0.071%, 06/17/2021 (d) . . . . . . . . . . . . . . . . . . . . . 3,999,9125,000,000 0.081%, 06/22/2021 (d) . . . . . . . . . . . . . . . . . . . . . 4,999,909
10,000,000 0.071%, 06/29/2021 (d) . . . . . . . . . . . . . . . . . . . . . 9,999,8777,000,000 0.046%, 07/13/2021 (d) . . . . . . . . . . . . . . . . . . . . . 6,999,740
10,000,000 0.086%, 07/15/2021 (d) . . . . . . . . . . . . . . . . . . . . . 9,999,7452,500,000 0.015%, 09/09/2021 (d) . . . . . . . . . . . . . . . . . . . . . 2,499,7762,500,000 0.025%, 09/23/2021 (d) . . . . . . . . . . . . . . . . . . . . . 2,499,684
10,000,000 0.056%, 01/27/2022 (d) . . . . . . . . . . . . . . . . . . . . . 9,995,819
117,492,416
Total Short Term Investments(cost $196,978,014) . . . . . . . . . . . . . . . . . . . . . . . . 196,987,539
Total Investments(Cost $196,978,014) - 94.64% . . . . . . . . . . . . . . . 196,987,539
Other Assets in Excess ofLiabilities - 5.36% . . . . . . . . . . . . . . . . . . . . . . . . . 11,149,649
TOTAL NET ASSETS - 100.00% . . . . . . . . . . . . . $208,137,188
Percentages are stated as a percent of net assets.(a) Variable rate security based on a reference index and spread. The rate
reported is the rate in effect as of March 31, 2021.(b) Seven-day yield as of March 31, 2021.(c) All or a portion of this security is held by GuidePath® Managed Futures
Strategy Cayman Fund Ltd.(d) Zero coupon bond. The effective yield is listed.(e) All or a portion of this security is held as collateral for certain futures
contracts. The approximate value of the portion of these securities held ascollateral is $5,499,922.
See notes to financial statements.
92
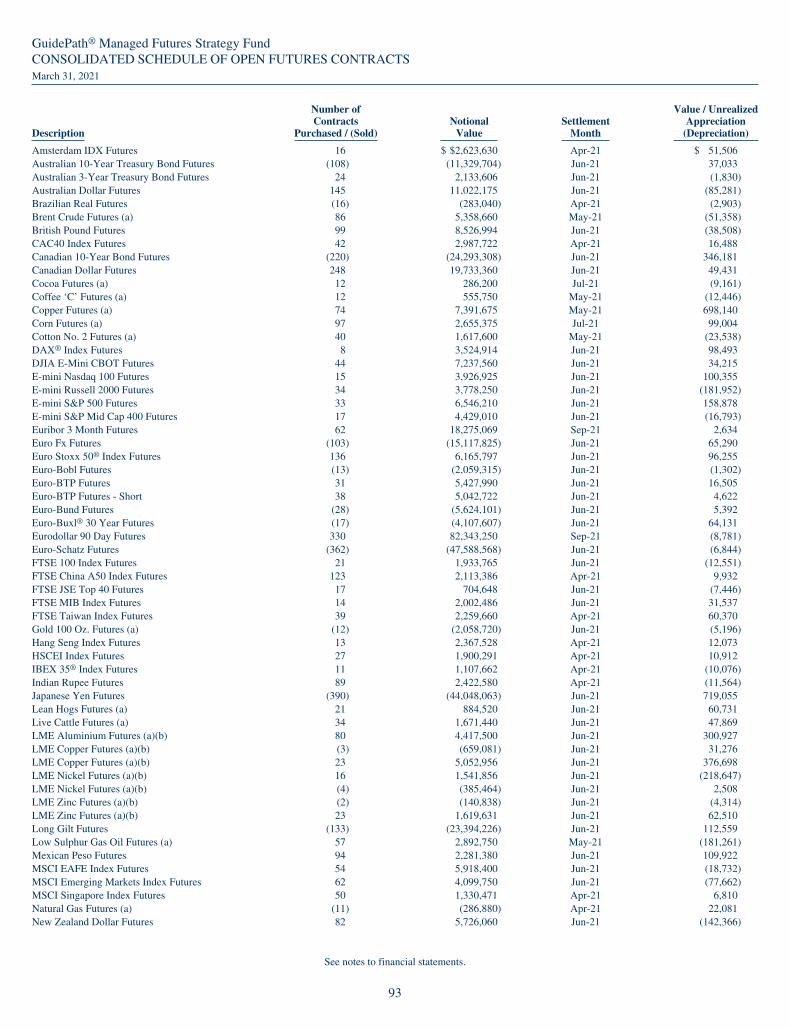
GuidePath® Managed Futures Strategy FundCONSOLIDATED SCHEDULE OF OPEN FUTURES CONTRACTSMarch 31, 2021
Description
Number ofContracts
Purchased / (Sold)Notional
ValueSettlement
Month
Value / UnrealizedAppreciation
(Depreciation)
Amsterdam IDX Futures 16 $ $2,623,630 Apr-21 $ 51,506Australian 10-Year Treasury Bond Futures (108) (11,329,704) Jun-21 37,033Australian 3-Year Treasury Bond Futures 24 2,133,606 Jun-21 (1,830)Australian Dollar Futures 145 11,022,175 Jun-21 (85,281)Brazilian Real Futures (16) (283,040) Apr-21 (2,903)Brent Crude Futures (a) 86 5,358,660 May-21 (51,358)British Pound Futures 99 8,526,994 Jun-21 (38,508)CAC40 Index Futures 42 2,987,722 Apr-21 16,488Canadian 10-Year Bond Futures (220) (24,293,308) Jun-21 346,181Canadian Dollar Futures 248 19,733,360 Jun-21 49,431Cocoa Futures (a) 12 286,200 Jul-21 (9,161)Coffee ‘C’ Futures (a) 12 555,750 May-21 (12,446)Copper Futures (a) 74 7,391,675 May-21 698,140Corn Futures (a) 97 2,655,375 Jul-21 99,004Cotton No. 2 Futures (a) 40 1,617,600 May-21 (23,538)DAX® Index Futures 8 3,524,914 Jun-21 98,493DJIA E-Mini CBOT Futures 44 7,237,560 Jun-21 34,215E-mini Nasdaq 100 Futures 15 3,926,925 Jun-21 100,355E-mini Russell 2000 Futures 34 3,778,250 Jun-21 (181,952)E-mini S&P 500 Futures 33 6,546,210 Jun-21 158,878E-mini S&P Mid Cap 400 Futures 17 4,429,010 Jun-21 (16,793)Euribor 3 Month Futures 62 18,275,069 Sep-21 2,634Euro Fx Futures (103) (15,117,825) Jun-21 65,290Euro Stoxx 50® Index Futures 136 6,165,797 Jun-21 96,255Euro-Bobl Futures (13) (2,059,315) Jun-21 (1,302)Euro-BTP Futures 31 5,427,990 Jun-21 16,505Euro-BTP Futures - Short 38 5,042,722 Jun-21 4,622Euro-Bund Futures (28) (5,624,101) Jun-21 5,392Euro-Buxl® 30 Year Futures (17) (4,107,607) Jun-21 64,131Eurodollar 90 Day Futures 330 82,343,250 Sep-21 (8,781)Euro-Schatz Futures (362) (47,588,568) Jun-21 (6,844)FTSE 100 Index Futures 21 1,933,765 Jun-21 (12,551)FTSE China A50 Index Futures 123 2,113,386 Apr-21 9,932FTSE JSE Top 40 Futures 17 704,648 Jun-21 (7,446)FTSE MIB Index Futures 14 2,002,486 Jun-21 31,537FTSE Taiwan Index Futures 39 2,259,660 Apr-21 60,370Gold 100 Oz. Futures (a) (12) (2,058,720) Jun-21 (5,196)Hang Seng Index Futures 13 2,367,528 Apr-21 12,073HSCEI Index Futures 27 1,900,291 Apr-21 10,912IBEX 35® Index Futures 11 1,107,662 Apr-21 (10,076)Indian Rupee Futures 89 2,422,580 Apr-21 (11,564)Japanese Yen Futures (390) (44,048,063) Jun-21 719,055Lean Hogs Futures (a) 21 884,520 Jun-21 60,731Live Cattle Futures (a) 34 1,671,440 Jun-21 47,869LME Aluminium Futures (a)(b) 80 4,417,500 Jun-21 300,927LME Copper Futures (a)(b) (3) (659,081) Jun-21 31,276LME Copper Futures (a)(b) 23 5,052,956 Jun-21 376,698LME Nickel Futures (a)(b) 16 1,541,856 Jun-21 (218,647)LME Nickel Futures (a)(b) (4) (385,464) Jun-21 2,508LME Zinc Futures (a)(b) (2) (140,838) Jun-21 (4,314)LME Zinc Futures (a)(b) 23 1,619,631 Jun-21 62,510Long Gilt Futures (133) (23,394,226) Jun-21 112,559Low Sulphur Gas Oil Futures (a) 57 2,892,750 May-21 (181,261)Mexican Peso Futures 94 2,281,380 Jun-21 109,922MSCI EAFE Index Futures 54 5,918,400 Jun-21 (18,732)MSCI Emerging Markets Index Futures 62 4,099,750 Jun-21 (77,662)MSCI Singapore Index Futures 50 1,330,471 Apr-21 6,810Natural Gas Futures (a) (11) (286,880) Apr-21 22,081New Zealand Dollar Futures 82 5,726,060 Jun-21 (142,366)
See notes to financial statements.
93

GuidePath® Managed Futures Strategy FundCONSOLIDATED SCHEDULE OF OPEN FUTURES CONTRACTS (Continued)March 31, 2021
Description
Number ofContracts
Purchased / (Sold)Notional
ValueSettlement
Month
Value / UnrealizedAppreciation
(Depreciation)
Nikkei 225 Futures 11 $ 2,898,894 Jun-21 $ 68,486NY Harbor ULSD Futures (a) 38 2,824,601 Apr-21 (232,509)OMXS30 Futures 112 2,804,985 Apr-21 37,653Platinum Futures (a) 9 536,175 Jul-21 (4,974)RBOB Gasoline Futures (a) 34 2,789,741 May-21 (53,493)S&P/TSX 60 Index Futures 38 6,719,472 Jun-21 (10,035)Silver Futures (a) 12 1,471,920 May-21 (170,416)South African Rand Futures 65 2,181,563 Jun-21 105,529Soybean Futures (a) 56 3,997,700 Jul-21 216,500Soybean Meal Futures (a) 63 2,676,240 Jul-21 6,679Soybean Oil Futures (a) 81 2,466,936 Jul-21 334,649SPI 200TM Index Futures 25 3,211,945 Jun-21 12,131Sterling 90 Day Futures (184) (31,677,833) Sep-21 1,910Sugar No. 11 Futures (a) 96 1,588,070 Jun-21 (9,449)Swiss Franc Futures (96) (12,714,000) Jun-21 125,499TOPIX Index Futures 21 3,705,938 Jun-21 87,887U.S. Treasury 10-Year Note Futures (150) (19,640,625) Jun-21 181,940U.S. Treasury 2-Year Note Futures 110 24,279,922 Jun-21 (19,878)U.S. Treasury 5-Year Note Futures (152) (18,756,563) Jun-21 83,920U.S. Treasury Long Bond Futures (85) (13,140,469) Jun-21 384,799U.S. Treasury Ultra Bond Futures (30) (5,436,563) Jun-21 246,492U.S. Ultra 10 Year Future (154) (22,127,875) Jun-21 396,326Wheat Futures (a) 43 1,323,863 Jul-21 (90,227)WTI Crude Futures (a) 30 1,774,800 Apr-21 (93,930)WTI Crude Futures (a) 45 2,663,100 May-21 (34,624)
$4,362,676
(a) All or a portion of this security is held by GuidePath® Managed Futures Strategy Cayman Fund Ltd.(b) London Metal Exchange (“LME”) futures contracts settle on their respective maturity date, and do not have daily cash movements like other futures contracts. The
unrealized appreciation on these contracts is a receivable for unsettled open futures contracts and the unrealized depreciation is a payable for unsettled open futurescontracts on the Fund’s consolidated statement of assets and liabilities.
GuidePath® Managed Futures Strategy FundCONSOLIDATED SCHEDULE OF OPEN FORWARD CURRENCY CONTRACTSMarch 31, 2021
ForwardExpiration Date Counterparty Currency to be received
Amount ofCurrency tobe received Currency to be delivered
Amount ofCurrency tobe delivered
UnrealizedAppreciation
(Depreciation)
6/16/2021 NatWest Chinese Yuan Renminbi 47,999,999 U.S. Dollar 7,304,890 $ (36,245)6/16/2021 NatWest New Turkish Lira 13,500,000 U.S. Dollar 1,689,742 (142,137)6/16/2021 NatWest Norwegian Krone 35,999,999 U.S. Dollar 4,239,004 (30,191)6/16/2021 NatWest Polish Zloty 7,000,000 U.S. Dollar 1,817,627 (45,626)6/16/2021 NatWest Singapore Dollar 24,000,000 U.S. Dollar 17,823,419 11,4756/16/2021 NatWest Swedish Krona 33,999,999 U.S. Dollar 3,994,195 (98,293)6/16/2021 NatWest U.S. Dollar 1,708,454 New Turkish Lira 15,300,000 (48,969)6/16/2021 NatWest U.S. Dollar 465,294 Norwegian Krone 4,000,000 (2,352)6/16/2021 NatWest U.S. Dollar 1,910,321 Polish Zloty 7,500,000 11,7486/16/2021 NatWest U.S. Dollar 637,759 Polish Zloty 2,500,000 4,9016/16/2021 NatWest U.S. Dollar 385,867 Polish Zloty 1,500,000 6,1526/16/2021 NatWest U.S. Dollar 1,394,747 Singapore Dollar 1,875,000 1,3966/16/2021 NatWest U.S. Dollar 1,301,214 Singapore Dollar 1,750,000 7536/16/2021 NatWest U.S. Dollar 5,291,818 Singapore Dollar 7,125,000 (2,916)6/16/2021 NatWest U.S. Dollar 1,204,385 Singapore Dollar 1,625,000 (3,186)6/16/2021 NatWest U.S. Dollar 1,145,667 Swedish Krona 10,000,000 (187)6/16/2021 NatWest U.S. Dollar 3,007,596 Swedish Krona 26,000,000 28,3766/16/2021 NatWest U.S. Dollar 463,639 Swedish Krona 4,000,000 5,2986/16/2021 NatWest U.S. Dollar 469,932 Swedish Krona 4,000,000 11,591
$(328,412)
See notes to financial statements.
94

GuidePath® Conservative Income FundSCHEDULE OF INVESTMENTSMarch 31, 2021
Number ofShares Value
INVESTMENT COMPANIES - 52.05%Exchange Traded Funds - 52.05%
27,313 iShares 0-5 Year High Yield Corporate Bond ETF . . . . $ 1,251,20963,978 iShares 0-5 Year Investment Grade Corporate Bond
ETF (a) . . . . . . . . . . . . . . . . . . . . . . . . . . . . . . . . . . . . 3,312,78015,855 iShares 0-5 Year TIPS Bond ETF (a) . . . . . . . . . . . . . . 1,676,19124,116 Schwab Short-Term U.S. Treasury ETF . . . . . . . . . . . . 1,237,39226,529 SPDR Bloomberg Barclays Investment Grade Floating
Rate ETF . . . . . . . . . . . . . . . . . . . . . . . . . . . . . . . . . . . 812,849
Total Investment Companies(Cost $8,235,484) . . . . . . . . . . . . . . . . . . . . . . . . . . . . 8,290,421
SHORT TERM INVESTMENTS - 47.83%Money Market Funds - 40.86%
6,506,956 DWS Government Money Market Series - InstitutionalSharesEffective Yield, 0.04% (b)(c) . . . . . . . . . . . . . . . . . . . 6,506,956
PrincipalAmount
U.S. Treasury Notes - 6.97%$ 300,000 1.125%, 06/30/2021 . . . . . . . . . . . . . . . . . . . . . . . . . . . 300,794
300,000 2.125%, 09/30/2021 . . . . . . . . . . . . . . . . . . . . . . . . . . . 303,121500,000 1.750%, 11/30/2021 . . . . . . . . . . . . . . . . . . . . . . . . . . . 505,658
1,109,573
Total Short Term Investments(Cost $7,616,503) . . . . . . . . . . . . . . . . . . . . . . . . . . . . 7,616,529
Number ofUnits
INVESTMENTS PURCHASED WITH PROCEEDS FROMSECURITIES LENDING - 3.37%
537,300 Mount Vernon Liquid Assets Portfolio, LLCEffective Yield, 0.11% (b) . . . . . . . . . . . . . . . . . . . . . 537,300
Total Investments Purchased with Proceeds fromSecurities Lending(Cost $537,300) . . . . . . . . . . . . . . . . . . . . . . . . . . . . . 537,300
Total Investments(Cost $16,389,287) - 103.25% . . . . . . . . . . . . . . . . . 16,444,250
Liabilities in Excess ofOther Assets - (3.25)% . . . . . . . . . . . . . . . . . . . . . . . (518,058)
TOTAL NET ASSETS - 100.00% . . . . . . . . . . . . . . . $15,926,192
Percentages are stated as a percent of net assets.(a) All or portion of this security is on loan.(b) Seven-day yield as of March 31, 2021.(c) Fair value of this security exceeds 25% of the Fund’s net assets. Additional
information for this security, including financial statements, is available fromthe SEC’s EDGAR database at www.sec.gov.
See notes to financial statements.
95
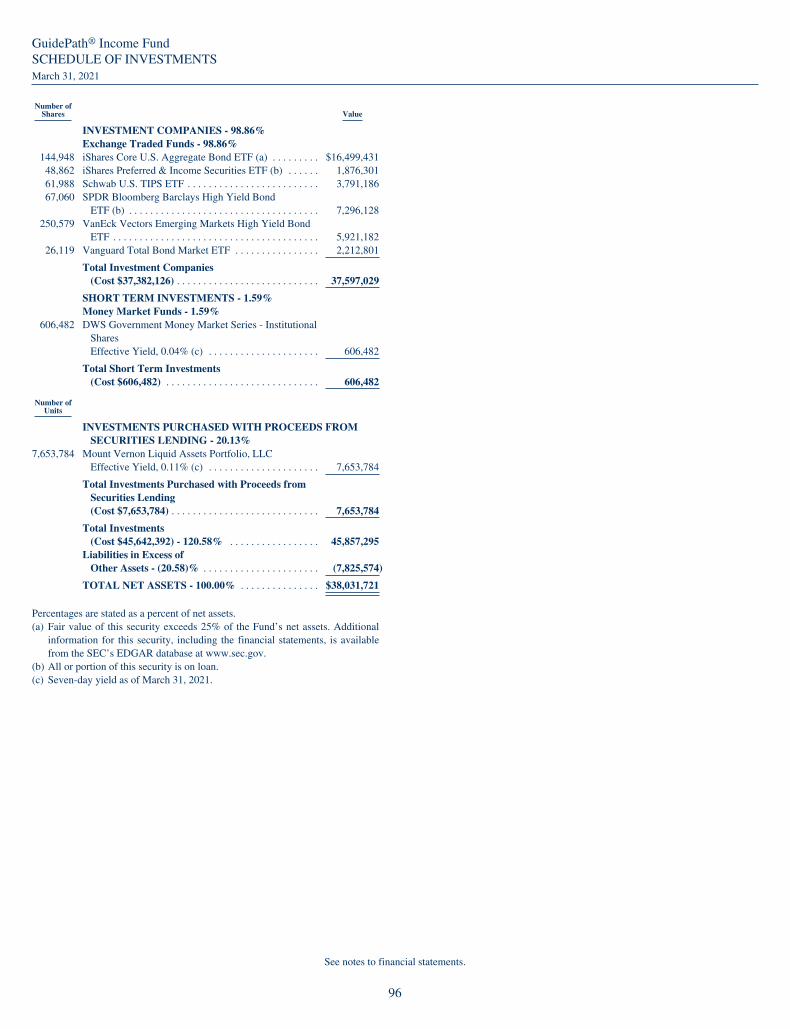
GuidePath® Income FundSCHEDULE OF INVESTMENTSMarch 31, 2021
Number ofShares Value
INVESTMENT COMPANIES - 98.86%Exchange Traded Funds - 98.86%
144,948 iShares Core U.S. Aggregate Bond ETF (a) . . . . . . . . . $16,499,43148,862 iShares Preferred & Income Securities ETF (b) . . . . . . 1,876,30161,988 Schwab U.S. TIPS ETF . . . . . . . . . . . . . . . . . . . . . . . . . 3,791,18667,060 SPDR Bloomberg Barclays High Yield Bond
ETF (b) . . . . . . . . . . . . . . . . . . . . . . . . . . . . . . . . . . . . 7,296,128250,579 VanEck Vectors Emerging Markets High Yield Bond
ETF . . . . . . . . . . . . . . . . . . . . . . . . . . . . . . . . . . . . . . . 5,921,18226,119 Vanguard Total Bond Market ETF . . . . . . . . . . . . . . . . 2,212,801
Total Investment Companies(Cost $37,382,126) . . . . . . . . . . . . . . . . . . . . . . . . . . . 37,597,029
SHORT TERM INVESTMENTS - 1.59%Money Market Funds - 1.59%
606,482 DWS Government Money Market Series - InstitutionalSharesEffective Yield, 0.04% (c) . . . . . . . . . . . . . . . . . . . . . 606,482
Total Short Term Investments(Cost $606,482) . . . . . . . . . . . . . . . . . . . . . . . . . . . . . 606,482
Number ofUnits
INVESTMENTS PURCHASED WITH PROCEEDS FROMSECURITIES LENDING - 20.13%
7,653,784 Mount Vernon Liquid Assets Portfolio, LLCEffective Yield, 0.11% (c) . . . . . . . . . . . . . . . . . . . . . 7,653,784
Total Investments Purchased with Proceeds fromSecurities Lending(Cost $7,653,784) . . . . . . . . . . . . . . . . . . . . . . . . . . . . 7,653,784
Total Investments(Cost $45,642,392) - 120.58% . . . . . . . . . . . . . . . . . 45,857,295
Liabilities in Excess ofOther Assets - (20.58)% . . . . . . . . . . . . . . . . . . . . . . (7,825,574)
TOTAL NET ASSETS - 100.00% . . . . . . . . . . . . . . . $38,031,721
Percentages are stated as a percent of net assets.(a) Fair value of this security exceeds 25% of the Fund’s net assets. Additional
information for this security, including the financial statements, is availablefrom the SEC’s EDGAR database at www.sec.gov.
(b) All or portion of this security is on loan.(c) Seven-day yield as of March 31, 2021.
See notes to financial statements.
96

GuidePath® Growth and Income FundSCHEDULE OF INVESTMENTSMarch 31, 2021
Number ofShares Value
COMMON STOCKS - 37.24%Aerospace & Defense - 1.03%
835 General Dynamics Corp. . . . . . . . . . . . . . . . . . . . . . . . $ 151,603959 Lockheed Martin Corp. . . . . . . . . . . . . . . . . . . . . . . . . 354,351
5,064 Raytheon Technologies Corp. . . . . . . . . . . . . . . . . . . . 391,294
897,248
Air Freight & Logistics - 0.64%3,254 United Parcel Service, Inc. - Class B . . . . . . . . . . . . . 553,147
Banks - 1.70%4,728 Citizens Financial Group, Inc. . . . . . . . . . . . . . . . . . . . 208,741
11,612 Huntington Bancshares, Inc. . . . . . . . . . . . . . . . . . . . . 182,541737 M&T Bank Corp. . . . . . . . . . . . . . . . . . . . . . . . . . . . . 111,737
1,046 PNC Financial Services Group, Inc. . . . . . . . . . . . . . . 183,47910,123 Regions Financial Corp. . . . . . . . . . . . . . . . . . . . . . . . 209,1416,280 Truist Financial Corp. . . . . . . . . . . . . . . . . . . . . . . . . . 366,2503,849 U.S. Bancorp . . . . . . . . . . . . . . . . . . . . . . . . . . . . . . . . 212,888
1,474,777
Beverages - 2.05%17,718 Coca-Cola Co. . . . . . . . . . . . . . . . . . . . . . . . . . . . . . . . 933,9165,961 PepsiCo, Inc. . . . . . . . . . . . . . . . . . . . . . . . . . . . . . . . . 843,183
1,777,099
Biotechnology - 1.88%6,506 AbbVie, Inc. . . . . . . . . . . . . . . . . . . . . . . . . . . . . . . . . 704,0802,320 Amgen, Inc. . . . . . . . . . . . . . . . . . . . . . . . . . . . . . . . . . 577,2395,410 Gilead Sciences, Inc. . . . . . . . . . . . . . . . . . . . . . . . . . . 349,648
1,630,967
Building Products - 0.27%3,908 Johnson Controls International PLC . . . . . . . . . . . . . . 233,190
Capital Markets - 1.35%468 BlackRock, Inc. . . . . . . . . . . . . . . . . . . . . . . . . . . . . . . 352,853
1,360 CME Group, Inc. . . . . . . . . . . . . . . . . . . . . . . . . . . . . . 277,7533,517 State Street Corp. (a) . . . . . . . . . . . . . . . . . . . . . . . . . . 295,4631,417 T. Rowe Price Group, Inc. (a) . . . . . . . . . . . . . . . . . . . 243,157
1,169,226
Chemicals - 0.34%1,049 Air Products & Chemicals, Inc. . . . . . . . . . . . . . . . . . . 295,126
Communications Equipment - 1.00%16,748 Cisco Systems, Inc. . . . . . . . . . . . . . . . . . . . . . . . . . . . 866,039
Consumer Finance - 0.22%4,742 Synchrony Financial . . . . . . . . . . . . . . . . . . . . . . . . . . 192,810
Diversified Telecommunication Services - 2.03%26,967 AT&T, Inc. . . . . . . . . . . . . . . . . . . . . . . . . . . . . . . . . . 816,29116,223 Verizon Communications, Inc. . . . . . . . . . . . . . . . . . . 943,368
1,759,659
Electric Utilities - 1.75%1,953 American Electric Power Co., Inc. . . . . . . . . . . . . . . . 165,4193,543 Duke Energy Corp. (a) . . . . . . . . . . . . . . . . . . . . . . . . 342,006
789 Eversource Energy . . . . . . . . . . . . . . . . . . . . . . . . . . . 68,3209,258 NextEra Energy, Inc. . . . . . . . . . . . . . . . . . . . . . . . . . . 699,9983,734 Xcel Energy, Inc. . . . . . . . . . . . . . . . . . . . . . . . . . . . . . 248,348
1,524,091
Electrical Equipment - 0.92%2,865 Eaton Corp. PLC . . . . . . . . . . . . . . . . . . . . . . . . . . . . . 396,1724,438 Emerson Electric Co. . . . . . . . . . . . . . . . . . . . . . . . . . . 400,397
796,569
Number ofShares Value
Food & Staples Retailing - 0.48%2,734 Sysco Corp. . . . . . . . . . . . . . . . . . . . . . . . . . . . . . . . . . $ 215,2753,720 Walgreens Boots Alliance, Inc. . . . . . . . . . . . . . . . . . . 204,228
419,503
Food Products - 0.88%3,825 Archer-Daniels-Midland Co. . . . . . . . . . . . . . . . . . . . . 218,0253,940 General Mills, Inc. . . . . . . . . . . . . . . . . . . . . . . . . . . . . 241,6015,197 Mondelez International, Inc. - Class A . . . . . . . . . . . . 304,180
763,806
Health Care Equipment & Supplies - 0.59%4,331 Medtronic PLC . . . . . . . . . . . . . . . . . . . . . . . . . . . . . . 511,621
Health Care Providers & Services - 0.53%6,134 CVS Health Corp. . . . . . . . . . . . . . . . . . . . . . . . . . . . . 461,461
Hotels, Restaurants & Leisure - 0.78%3,026 McDonald’s Corp. . . . . . . . . . . . . . . . . . . . . . . . . . . . . 678,248
Household Durables - 0.17%689 Whirlpool Corp. . . . . . . . . . . . . . . . . . . . . . . . . . . . . . . 151,821
Household Products - 1.86%4,488 Colgate-Palmolive Co. . . . . . . . . . . . . . . . . . . . . . . . . 353,7891,356 Kimberly-Clark Corp. . . . . . . . . . . . . . . . . . . . . . . . . . 188,5527,896 Procter & Gamble Co. . . . . . . . . . . . . . . . . . . . . . . . . . 1,069,355
1,611,696
Industrial Conglomerates - 1.36%3,067 3M Co. . . . . . . . . . . . . . . . . . . . . . . . . . . . . . . . . . . . . . 590,9502,724 Honeywell International, Inc. . . . . . . . . . . . . . . . . . . . 591,299
1,182,249
Insurance - 1.37%5,640 Aflac, Inc. . . . . . . . . . . . . . . . . . . . . . . . . . . . . . . . . . . 288,6552,321 Chubb Ltd. . . . . . . . . . . . . . . . . . . . . . . . . . . . . . . . . . . 366,6482,924 Hartford Financial Services Group, Inc. . . . . . . . . . . . 195,2942,032 Progressive Corp. . . . . . . . . . . . . . . . . . . . . . . . . . . . . 194,280
948 Travelers Cos., Inc. . . . . . . . . . . . . . . . . . . . . . . . . . . . 142,579
1,187,456
IT Services - 1.26%1,969 Automatic Data Processing, Inc. . . . . . . . . . . . . . . . . . 371,0974,279 International Business Machines Corp. . . . . . . . . . . . . 570,2201,555 Paychex, Inc. . . . . . . . . . . . . . . . . . . . . . . . . . . . . . . . . 152,421
1,093,738
Leisure Products - 0.08%723 Hasbro, Inc. . . . . . . . . . . . . . . . . . . . . . . . . . . . . . . . . . 69,495
Machinery - 0.67%967 Cummins, Inc. . . . . . . . . . . . . . . . . . . . . . . . . . . . . . . . 250,560950 Illinois Tool Works, Inc. . . . . . . . . . . . . . . . . . . . . . . . 210,444
1,283 PACCAR, Inc. . . . . . . . . . . . . . . . . . . . . . . . . . . . . . . . 119,216
580,220
Media - 0.14%2,714 ViacomCBS, Inc. - Class B . . . . . . . . . . . . . . . . . . . . . 122,401
Metals & Mining - 0.29%3,196 Nucor Corp. . . . . . . . . . . . . . . . . . . . . . . . . . . . . . . . . . 256,543
Multiline Retail - 0.38%1,650 Target Corp. (a) . . . . . . . . . . . . . . . . . . . . . . . . . . . . . . 326,816
Multi-Utilities - 1.02%2,937 Ameren Corp. . . . . . . . . . . . . . . . . . . . . . . . . . . . . . . . 238,9542,256 Consolidated Edison, Inc. (a) . . . . . . . . . . . . . . . . . . . 168,749
See notes to financial statements.
97
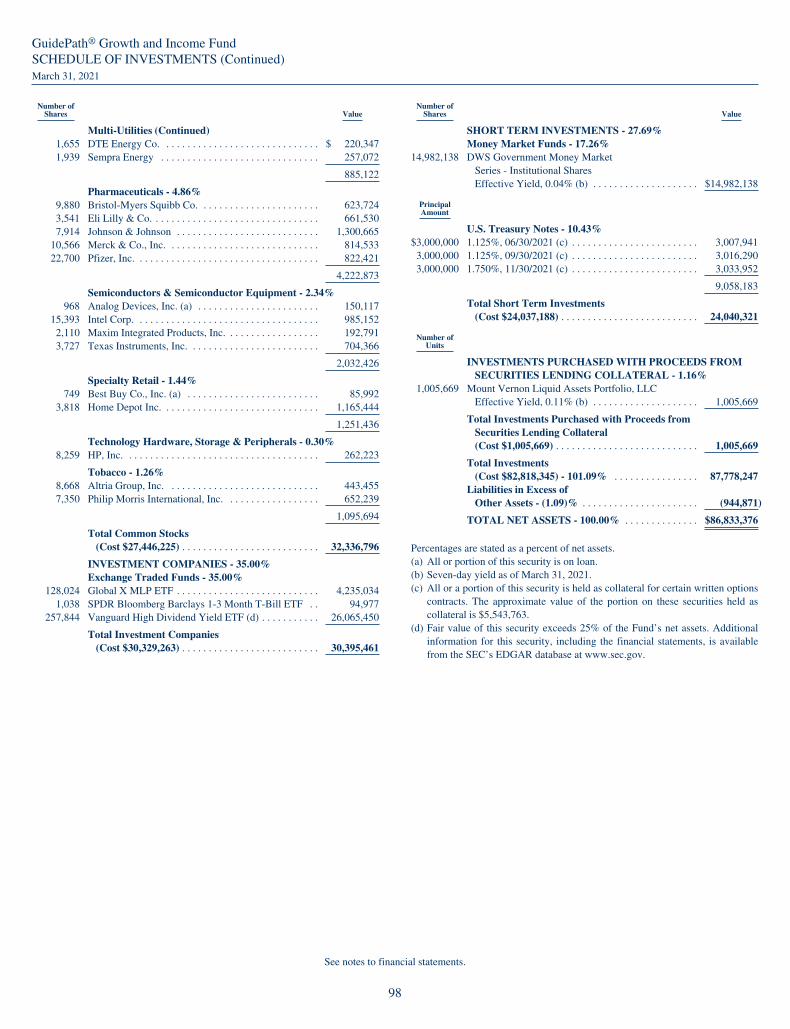
GuidePath® Growth and Income FundSCHEDULE OF INVESTMENTS (Continued)March 31, 2021
Number ofShares Value
Multi-Utilities (Continued)1,655 DTE Energy Co. . . . . . . . . . . . . . . . . . . . . . . . . . . . . . $ 220,3471,939 Sempra Energy . . . . . . . . . . . . . . . . . . . . . . . . . . . . . . 257,072
885,122
Pharmaceuticals - 4.86%9,880 Bristol-Myers Squibb Co. . . . . . . . . . . . . . . . . . . . . . . 623,7243,541 Eli Lilly & Co. . . . . . . . . . . . . . . . . . . . . . . . . . . . . . . . 661,5307,914 Johnson & Johnson . . . . . . . . . . . . . . . . . . . . . . . . . . . 1,300,665
10,566 Merck & Co., Inc. . . . . . . . . . . . . . . . . . . . . . . . . . . . . 814,53322,700 Pfizer, Inc. . . . . . . . . . . . . . . . . . . . . . . . . . . . . . . . . . . 822,421
4,222,873
Semiconductors & Semiconductor Equipment - 2.34%968 Analog Devices, Inc. (a) . . . . . . . . . . . . . . . . . . . . . . . 150,117
15,393 Intel Corp. . . . . . . . . . . . . . . . . . . . . . . . . . . . . . . . . . . 985,1522,110 Maxim Integrated Products, Inc. . . . . . . . . . . . . . . . . . 192,7913,727 Texas Instruments, Inc. . . . . . . . . . . . . . . . . . . . . . . . . 704,366
2,032,426
Specialty Retail - 1.44%749 Best Buy Co., Inc. (a) . . . . . . . . . . . . . . . . . . . . . . . . . 85,992
3,818 Home Depot Inc. . . . . . . . . . . . . . . . . . . . . . . . . . . . . . 1,165,444
1,251,436
Technology Hardware, Storage & Peripherals - 0.30%8,259 HP, Inc. . . . . . . . . . . . . . . . . . . . . . . . . . . . . . . . . . . . . 262,223
Tobacco - 1.26%8,668 Altria Group, Inc. . . . . . . . . . . . . . . . . . . . . . . . . . . . . 443,4557,350 Philip Morris International, Inc. . . . . . . . . . . . . . . . . . 652,239
1,095,694
Total Common Stocks(Cost $27,446,225) . . . . . . . . . . . . . . . . . . . . . . . . . . 32,336,796
INVESTMENT COMPANIES - 35.00%Exchange Traded Funds - 35.00%
128,024 Global X MLP ETF . . . . . . . . . . . . . . . . . . . . . . . . . . . 4,235,0341,038 SPDR Bloomberg Barclays 1-3 Month T-Bill ETF . . 94,977
257,844 Vanguard High Dividend Yield ETF (d) . . . . . . . . . . . 26,065,450
Total Investment Companies(Cost $30,329,263) . . . . . . . . . . . . . . . . . . . . . . . . . . 30,395,461
Number ofShares Value
SHORT TERM INVESTMENTS - 27.69%Money Market Funds - 17.26%
14,982,138 DWS Government Money MarketSeries - Institutional SharesEffective Yield, 0.04% (b) . . . . . . . . . . . . . . . . . . . . $14,982,138
PrincipalAmount
U.S. Treasury Notes - 10.43%$3,000,000 1.125%, 06/30/2021 (c) . . . . . . . . . . . . . . . . . . . . . . . . 3,007,9413,000,000 1.125%, 09/30/2021 (c) . . . . . . . . . . . . . . . . . . . . . . . . 3,016,2903,000,000 1.750%, 11/30/2021 (c) . . . . . . . . . . . . . . . . . . . . . . . . 3,033,952
9,058,183
Total Short Term Investments(Cost $24,037,188) . . . . . . . . . . . . . . . . . . . . . . . . . . 24,040,321
Number ofUnits
INVESTMENTS PURCHASED WITH PROCEEDS FROMSECURITIES LENDING COLLATERAL - 1.16%
1,005,669 Mount Vernon Liquid Assets Portfolio, LLCEffective Yield, 0.11% (b) . . . . . . . . . . . . . . . . . . . . 1,005,669
Total Investments Purchased with Proceeds fromSecurities Lending Collateral(Cost $1,005,669) . . . . . . . . . . . . . . . . . . . . . . . . . . . 1,005,669
Total Investments(Cost $82,818,345) - 101.09% . . . . . . . . . . . . . . . . 87,778,247
Liabilities in Excess ofOther Assets - (1.09)% . . . . . . . . . . . . . . . . . . . . . . (944,871)
TOTAL NET ASSETS - 100.00% . . . . . . . . . . . . . . $86,833,376
Percentages are stated as a percent of net assets.(a) All or portion of this security is on loan.(b) Seven-day yield as of March 31, 2021.(c) All or a portion of this security is held as collateral for certain written options
contracts. The approximate value of the portion on these securities held ascollateral is $5,543,763.
(d) Fair value of this security exceeds 25% of the Fund’s net assets. Additionalinformation for this security, including the financial statements, is availablefrom the SEC’s EDGAR database at www.sec.gov.
See notes to financial statements.
98
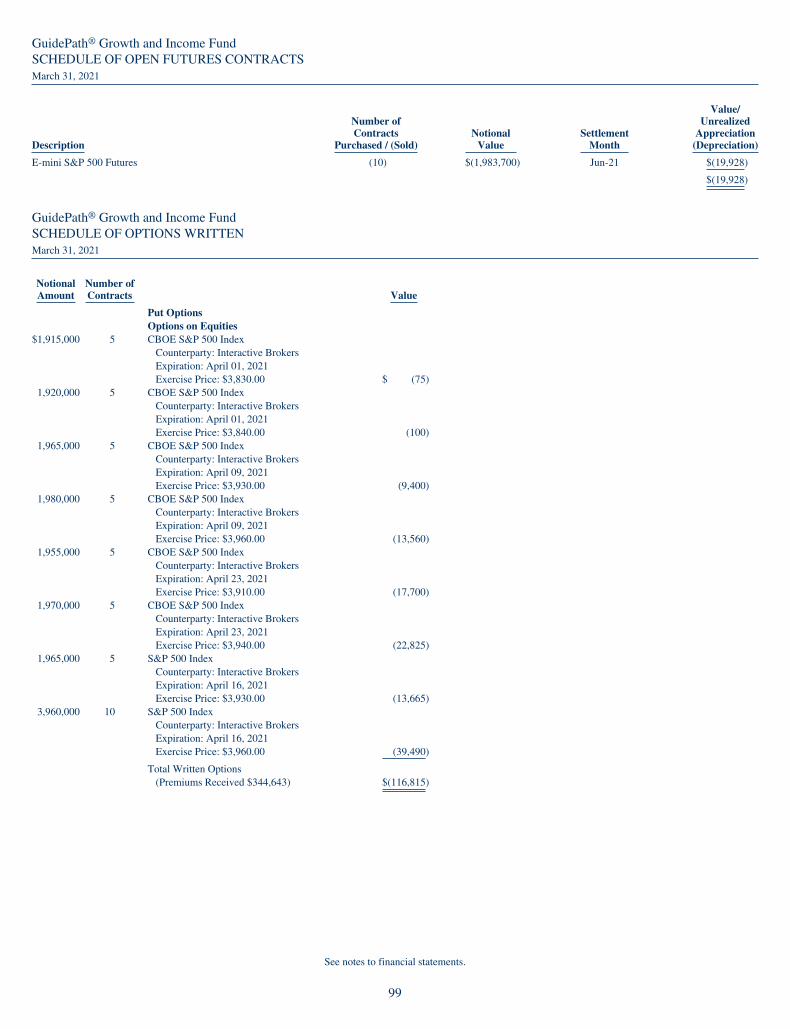
GuidePath® Growth and Income FundSCHEDULE OF OPEN FUTURES CONTRACTSMarch 31, 2021
Description
Number ofContracts
Purchased / (Sold)Notional
ValueSettlement
Month
Value/Unrealized
Appreciation(Depreciation)
E-mini S&P 500 Futures (10) $(1,983,700) Jun-21 $(19,928)
$(19,928)
GuidePath® Growth and Income FundSCHEDULE OF OPTIONS WRITTENMarch 31, 2021
NotionalAmount
Number ofContracts Value
Put OptionsOptions on Equities
$1,915,000 5 CBOE S&P 500 IndexCounterparty: Interactive BrokersExpiration: April 01, 2021Exercise Price: $3,830.00 $ (75)
1,920,000 5 CBOE S&P 500 IndexCounterparty: Interactive BrokersExpiration: April 01, 2021Exercise Price: $3,840.00 (100)
1,965,000 5 CBOE S&P 500 IndexCounterparty: Interactive BrokersExpiration: April 09, 2021Exercise Price: $3,930.00 (9,400)
1,980,000 5 CBOE S&P 500 IndexCounterparty: Interactive BrokersExpiration: April 09, 2021Exercise Price: $3,960.00 (13,560)
1,955,000 5 CBOE S&P 500 IndexCounterparty: Interactive BrokersExpiration: April 23, 2021Exercise Price: $3,910.00 (17,700)
1,970,000 5 CBOE S&P 500 IndexCounterparty: Interactive BrokersExpiration: April 23, 2021Exercise Price: $3,940.00 (22,825)
1,965,000 5 S&P 500 IndexCounterparty: Interactive BrokersExpiration: April 16, 2021Exercise Price: $3,930.00 (13,665)
3,960,000 10 S&P 500 IndexCounterparty: Interactive BrokersExpiration: April 16, 2021Exercise Price: $3,960.00 (39,490)
Total Written Options(Premiums Received $344,643) $(116,815)
See notes to financial statements.
99

GuideMark® Funds & GuidePath® FundsSTATEMENTS OF ASSETS & LIABILITIESMarch 31, 2021
Large CapCore Fund
EmergingMarkets Fund
Small/Mid CapCore Fund
ASSETS:Investments, at value (cost $375,248,495, $67,734,122 and $58,637,562, respectively)1 . . . . . . . . . . . . . . . . . . . . . $636,272,266 $101,749,104 $99,293,417Foreign currencies (cost $0, $2,258, and $0, respectively) . . . . . . . . . . . . . . . . . . . . . . . . . . . . . . . . . . . . . . . . . . . . — 2,309 —Cash . . . . . . . . . . . . . . . . . . . . . . . . . . . . . . . . . . . . . . . . . . . . . . . . . . . . . . . . . . . . . . . . . . . . . . . . . . . . . . . . . . . . . . — — 31Income receivable . . . . . . . . . . . . . . . . . . . . . . . . . . . . . . . . . . . . . . . . . . . . . . . . . . . . . . . . . . . . . . . . . . . . . . . . . . . . 235,669 282,988 45,570Receivable for dividend reclaims . . . . . . . . . . . . . . . . . . . . . . . . . . . . . . . . . . . . . . . . . . . . . . . . . . . . . . . . . . . . . . . . 3,729 1,058 —Receivable for fund shares sold . . . . . . . . . . . . . . . . . . . . . . . . . . . . . . . . . . . . . . . . . . . . . . . . . . . . . . . . . . . . . . . . . 1,616,592 100,072 279,836Other assets . . . . . . . . . . . . . . . . . . . . . . . . . . . . . . . . . . . . . . . . . . . . . . . . . . . . . . . . . . . . . . . . . . . . . . . . . . . . . . . . 20,324 14,728 16,103
Total Assets . . . . . . . . . . . . . . . . . . . . . . . . . . . . . . . . . . . . . . . . . . . . . . . . . . . . . . . . . . . . . . . . . . . . . . . . . . . . . . 638,148,580 102,150,259 99,634,957
LIABILITIES:Payable for collateral on securities loaned . . . . . . . . . . . . . . . . . . . . . . . . . . . . . . . . . . . . . . . . . . . . . . . . . . . . . . . . . 33,919,804 4,637,812 6,578,455Payable for fund shares redeemed . . . . . . . . . . . . . . . . . . . . . . . . . . . . . . . . . . . . . . . . . . . . . . . . . . . . . . . . . . . . . . . 792,689 56,927 152,988Payable to Investment Advisor . . . . . . . . . . . . . . . . . . . . . . . . . . . . . . . . . . . . . . . . . . . . . . . . . . . . . . . . . . . . . . . . . . 354,618 72,573 66,912Payable to custodian . . . . . . . . . . . . . . . . . . . . . . . . . . . . . . . . . . . . . . . . . . . . . . . . . . . . . . . . . . . . . . . . . . . . . . . . . . 5,579 13,904 1,725Accrued Trustee fees and expenses . . . . . . . . . . . . . . . . . . . . . . . . . . . . . . . . . . . . . . . . . . . . . . . . . . . . . . . . . . . . . . 2,171 354 345Accrued distribution and shareholder servicing fees . . . . . . . . . . . . . . . . . . . . . . . . . . . . . . . . . . . . . . . . . . . . . . . . . 157,805 31,355 24,943Deferred Tax . . . . . . . . . . . . . . . . . . . . . . . . . . . . . . . . . . . . . . . . . . . . . . . . . . . . . . . . . . . . . . . . . . . . . . . . . . . . . . . — 382,827 —Other accrued expenses . . . . . . . . . . . . . . . . . . . . . . . . . . . . . . . . . . . . . . . . . . . . . . . . . . . . . . . . . . . . . . . . . . . . . . . 126,617 58,644 53,239
Total Liabilities . . . . . . . . . . . . . . . . . . . . . . . . . . . . . . . . . . . . . . . . . . . . . . . . . . . . . . . . . . . . . . . . . . . . . . . . . . . 35,359,283 5,254,396 6,878,607
NET ASSETS . . . . . . . . . . . . . . . . . . . . . . . . . . . . . . . . . . . . . . . . . . . . . . . . . . . . . . . . . . . . . . . . . . . . . . . . . . . . . . . . . $602,789,297 $ 96,895,863 $92,756,350
NET ASSETS CONSIST OF:Capital stock . . . . . . . . . . . . . . . . . . . . . . . . . . . . . . . . . . . . . . . . . . . . . . . . . . . . . . . . . . . . . . . . . . . . . . . . . . . . . . . . 342,975,346 60,257,384 46,394,421Total distributable earnings . . . . . . . . . . . . . . . . . . . . . . . . . . . . . . . . . . . . . . . . . . . . . . . . . . . . . . . . . . . . . . . . . . . . 259,813,951 36,638,479 46,361,929
Total Net Assets . . . . . . . . . . . . . . . . . . . . . . . . . . . . . . . . . . . . . . . . . . . . . . . . . . . . . . . . . . . . . . . . . . . . . . . . . . . $602,789,297 $ 96,895,863 $92,756,350
Institutional SharesShares outstanding (unlimited shares of no par value authorized) . . . . . . . . . . . . . . . . . . . . . . . . . . . . . . . . . . . . . . . 23,333 — —Net assets . . . . . . . . . . . . . . . . . . . . . . . . . . . . . . . . . . . . . . . . . . . . . . . . . . . . . . . . . . . . . . . . . . . . . . . . . . . . . . . . . . 630,350 — —Net asset value, offering and redemption price per share . . . . . . . . . . . . . . . . . . . . . . . . . . . . . . . . . . . . . . . . . . . . . $ 27.015 $ — $ —
Service SharesShares outstanding (unlimited shares of no par value authorized) . . . . . . . . . . . . . . . . . . . . . . . . . . . . . . . . . . . . . . . 22,651,403 5,871,666 4,402,823Net assets . . . . . . . . . . . . . . . . . . . . . . . . . . . . . . . . . . . . . . . . . . . . . . . . . . . . . . . . . . . . . . . . . . . . . . . . . . . . . . . . . . 602,158,947 96,895,863 92,756,350Net asset value, offering and redemption price per share . . . . . . . . . . . . . . . . . . . . . . . . . . . . . . . . . . . . . . . . . . . . . $ 26.584 $ 16.502 $ 21.067
1Includes loaned securities with a value of: . . . . . . . . . . . . . . . . . . . . . . . . . . . . . . . . . . . . . . . . . . . . . . . . . . . . . . . . $ 33,216,688 $ 4,613,845 $ 6,513,442
See notes to financial statements.
100

GuideMark® Funds & GuidePath® FundsSTATEMENTS OF ASSETS & LIABILITIES (Continued)March 31, 2021
Worldex-US Fund
CoreFixed Income
Fund
GrowthAllocation
Fund
ASSETS:Investments, at value (cost $97,359,998, $231,702,992, and $985,354,359 respectively)1 . . . . . . . . . . . . . . . . . . . . . $137,429,321 $234,669,805 $1,350,991,425Foreign currencies (cost $228,009, $0, and $0, respectively) . . . . . . . . . . . . . . . . . . . . . . . . . . . . . . . . . . . . . . . . . . . 220,409 — —Cash . . . . . . . . . . . . . . . . . . . . . . . . . . . . . . . . . . . . . . . . . . . . . . . . . . . . . . . . . . . . . . . . . . . . . . . . . . . . . . . . . . . . . . . — 9,243 —Appreciation on swap agreements . . . . . . . . . . . . . . . . . . . . . . . . . . . . . . . . . . . . . . . . . . . . . . . . . . . . . . . . . . . . . . . . — 380,308 —Variation margin on futures . . . . . . . . . . . . . . . . . . . . . . . . . . . . . . . . . . . . . . . . . . . . . . . . . . . . . . . . . . . . . . . . . . . . . — 47,742 —Income receivable . . . . . . . . . . . . . . . . . . . . . . . . . . . . . . . . . . . . . . . . . . . . . . . . . . . . . . . . . . . . . . . . . . . . . . . . . . . . . 432,161 887,695 9,954Receivable for dividend reclaims . . . . . . . . . . . . . . . . . . . . . . . . . . . . . . . . . . . . . . . . . . . . . . . . . . . . . . . . . . . . . . . . . 655,390 — —Receivable for investment securities sold . . . . . . . . . . . . . . . . . . . . . . . . . . . . . . . . . . . . . . . . . . . . . . . . . . . . . . . . . . . 157,148 16,704,608 —Receivable for fund shares sold . . . . . . . . . . . . . . . . . . . . . . . . . . . . . . . . . . . . . . . . . . . . . . . . . . . . . . . . . . . . . . . . . . 201,298 540,468 3,524,599Swap premiums paid . . . . . . . . . . . . . . . . . . . . . . . . . . . . . . . . . . . . . . . . . . . . . . . . . . . . . . . . . . . . . . . . . . . . . . . . . . . — 148,819 —Other assets . . . . . . . . . . . . . . . . . . . . . . . . . . . . . . . . . . . . . . . . . . . . . . . . . . . . . . . . . . . . . . . . . . . . . . . . . . . . . . . . . . 14,069 15,957 66,043
Total Assets . . . . . . . . . . . . . . . . . . . . . . . . . . . . . . . . . . . . . . . . . . . . . . . . . . . . . . . . . . . . . . . . . . . . . . . . . . . . . . . 139,109,796 253,404,645 1,354,592,021
LIABILITIES:Payable for collateral on securities loaned . . . . . . . . . . . . . . . . . . . . . . . . . . . . . . . . . . . . . . . . . . . . . . . . . . . . . . . . . . 702,165 4,583,430 273,607,847Payable for investment securities purchased . . . . . . . . . . . . . . . . . . . . . . . . . . . . . . . . . . . . . . . . . . . . . . . . . . . . . . . . — 59,763,979 1,064,765Payable for fund shares redeemed . . . . . . . . . . . . . . . . . . . . . . . . . . . . . . . . . . . . . . . . . . . . . . . . . . . . . . . . . . . . . . . . 85,556 293,541 814,014Payable to Investment Advisor . . . . . . . . . . . . . . . . . . . . . . . . . . . . . . . . . . . . . . . . . . . . . . . . . . . . . . . . . . . . . . . . . . . 86,986 70,455 453,018Payable to custodian . . . . . . . . . . . . . . . . . . . . . . . . . . . . . . . . . . . . . . . . . . . . . . . . . . . . . . . . . . . . . . . . . . . . . . . . . . . 12,475 7,783 15,791Accrued Trustee fees and expenses . . . . . . . . . . . . . . . . . . . . . . . . . . . . . . . . . . . . . . . . . . . . . . . . . . . . . . . . . . . . . . . 490 598 3,932Accrued distribution and shareholder servicing fees . . . . . . . . . . . . . . . . . . . . . . . . . . . . . . . . . . . . . . . . . . . . . . . . . . 46,128 42,755 305,208Swap premiums received . . . . . . . . . . . . . . . . . . . . . . . . . . . . . . . . . . . . . . . . . . . . . . . . . . . . . . . . . . . . . . . . . . . . . . . — 8,249 —Due to broker for swaps . . . . . . . . . . . . . . . . . . . . . . . . . . . . . . . . . . . . . . . . . . . . . . . . . . . . . . . . . . . . . . . . . . . . . . . . — 496,639 —Other accrued expenses . . . . . . . . . . . . . . . . . . . . . . . . . . . . . . . . . . . . . . . . . . . . . . . . . . . . . . . . . . . . . . . . . . . . . . . . 63,986 103,283 204,504
Total Liabilities . . . . . . . . . . . . . . . . . . . . . . . . . . . . . . . . . . . . . . . . . . . . . . . . . . . . . . . . . . . . . . . . . . . . . . . . . . . . . 997,786 65,370,712 276,469,079
NET ASSETS . . . . . . . . . . . . . . . . . . . . . . . . . . . . . . . . . . . . . . . . . . . . . . . . . . . . . . . . . . . . . . . . . . . . . . . . . . . . . . . . . . $138,112,010 $188,033,933 $1,078,122,942
NET ASSETS CONSIST OF:Capital stock . . . . . . . . . . . . . . . . . . . . . . . . . . . . . . . . . . . . . . . . . . . . . . . . . . . . . . . . . . . . . . . . . . . . . . . . . . . . . . . . . 102,526,894 183,255,927 712,368,257Total distributable earnings . . . . . . . . . . . . . . . . . . . . . . . . . . . . . . . . . . . . . . . . . . . . . . . . . . . . . . . . . . . . . . . . . . . . . 35,585,116 4,778,006 365,754,685
Total Net Assets . . . . . . . . . . . . . . . . . . . . . . . . . . . . . . . . . . . . . . . . . . . . . . . . . . . . . . . . . . . . . . . . . . . . . . . . . . . . $138,112,010 $188,033,933 $1,078,122,942
Institutional SharesShares outstanding (unlimited shares of no par value authorized) . . . . . . . . . . . . . . . . . . . . . . . . . . . . . . . . . . . . . . . . 8,200 — 183,372Net assets . . . . . . . . . . . . . . . . . . . . . . . . . . . . . . . . . . . . . . . . . . . . . . . . . . . . . . . . . . . . . . . . . . . . . . . . . . . . . . . . . . . 88,302 — 2,892,788Net asset value, offering and redemption price per share . . . . . . . . . . . . . . . . . . . . . . . . . . . . . . . . . . . . . . . . . . . . . . . $ 10.7682 $ — $ 15.776
Service SharesShares outstanding (unlimited shares of no par value authorized) . . . . . . . . . . . . . . . . . . . . . . . . . . . . . . . . . . . . . . . . 13,214,251 19,384,099 68,764,916Net assets . . . . . . . . . . . . . . . . . . . . . . . . . . . . . . . . . . . . . . . . . . . . . . . . . . . . . . . . . . . . . . . . . . . . . . . . . . . . . . . . . . . 138,023,708 188,033,933 1,075,230,154Net asset value, offering and redemption price per share . . . . . . . . . . . . . . . . . . . . . . . . . . . . . . . . . . . . . . . . . . . . . . . $ 10.445 $ 9.700 $ 15.636
1Includes loaned securities with a value of: . . . . . . . . . . . . . . . . . . . . . . . . . . . . . . . . . . . . . . . . . . . . . . . . . . . . . . . . . $ 662,691 $ 4,497,539 $ 269,151,241
2Differences in actual and calculated net asset value shown are due to rounding.
See notes to financial statements.
101

GuideMark® Funds & GuidePath® FundsSTATEMENTS OF ASSETS & LIABILITIES (Continued)March 31, 2021
ConservativeAllocation
Fund
TacticalAllocation
Fund
AbsoluteReturn
AllocationFund
ASSETS:Investments, at value (cost $519,030,474, $531,807,503, and $236,744,950, respectively)1 . . . . . . . . . . . . . . . . . . . . . $579,606,088 $575,438,318 $247,674,248Income receivable . . . . . . . . . . . . . . . . . . . . . . . . . . . . . . . . . . . . . . . . . . . . . . . . . . . . . . . . . . . . . . . . . . . . . . . . . . . . . . . 171,614 151,474 56,353Receivable for fund shares sold . . . . . . . . . . . . . . . . . . . . . . . . . . . . . . . . . . . . . . . . . . . . . . . . . . . . . . . . . . . . . . . . . . . . 1,468,972 1,305,550 1,110,040Other assets . . . . . . . . . . . . . . . . . . . . . . . . . . . . . . . . . . . . . . . . . . . . . . . . . . . . . . . . . . . . . . . . . . . . . . . . . . . . . . . . . . . . 37,789 30,585 43,981
Total Assets . . . . . . . . . . . . . . . . . . . . . . . . . . . . . . . . . . . . . . . . . . . . . . . . . . . . . . . . . . . . . . . . . . . . . . . . . . . . . . . . . 581,284,463 576,925,927 248,884,622
LIABILITIES:Payable for collateral on securities loaned . . . . . . . . . . . . . . . . . . . . . . . . . . . . . . . . . . . . . . . . . . . . . . . . . . . . . . . . . . . . 117,653,868 104,133,886 33,662,416Payable for investment securities purchased . . . . . . . . . . . . . . . . . . . . . . . . . . . . . . . . . . . . . . . . . . . . . . . . . . . . . . . . . . 550,553 818,104 1,415,860Payable for fund shares redeemed . . . . . . . . . . . . . . . . . . . . . . . . . . . . . . . . . . . . . . . . . . . . . . . . . . . . . . . . . . . . . . . . . . 314,835 874,724 451,848Payable to Investment Advisor . . . . . . . . . . . . . . . . . . . . . . . . . . . . . . . . . . . . . . . . . . . . . . . . . . . . . . . . . . . . . . . . . . . . . 117,500 235,048 85,596Payable to custodian . . . . . . . . . . . . . . . . . . . . . . . . . . . . . . . . . . . . . . . . . . . . . . . . . . . . . . . . . . . . . . . . . . . . . . . . . . . . . 11,789 11,130 5,815Accrued Trustee fees and expenses . . . . . . . . . . . . . . . . . . . . . . . . . . . . . . . . . . . . . . . . . . . . . . . . . . . . . . . . . . . . . . . . . 1,614 1,622 700Accrued distribution and shareholder servicing fees . . . . . . . . . . . . . . . . . . . . . . . . . . . . . . . . . . . . . . . . . . . . . . . . . . . . 128,393 125,591 61,951Other accrued expenses . . . . . . . . . . . . . . . . . . . . . . . . . . . . . . . . . . . . . . . . . . . . . . . . . . . . . . . . . . . . . . . . . . . . . . . . . . 94,950 109,107 67,501
Total Liabilities . . . . . . . . . . . . . . . . . . . . . . . . . . . . . . . . . . . . . . . . . . . . . . . . . . . . . . . . . . . . . . . . . . . . . . . . . . . . . . . 118,873,502 106,309,212 35,751,687
NET ASSETS . . . . . . . . . . . . . . . . . . . . . . . . . . . . . . . . . . . . . . . . . . . . . . . . . . . . . . . . . . . . . . . . . . . . . . . . . . . . . . . . . . . . $462,410,961 $470,616,715 $213,132,935
NET ASSETS CONSIST OF:Capital stock . . . . . . . . . . . . . . . . . . . . . . . . . . . . . . . . . . . . . . . . . . . . . . . . . . . . . . . . . . . . . . . . . . . . . . . . . . . . . . . . . . . 404,266,375 425,151,326 206,515,387Total distributable earnings . . . . . . . . . . . . . . . . . . . . . . . . . . . . . . . . . . . . . . . . . . . . . . . . . . . . . . . . . . . . . . . . . . . . . . . 58,144,586 45,465,389 6,617,548
Total Net Assets . . . . . . . . . . . . . . . . . . . . . . . . . . . . . . . . . . . . . . . . . . . . . . . . . . . . . . . . . . . . . . . . . . . . . . . . . . . . . . $462,410,961 $470,616,715 $213,132,935
Institutional SharesShares outstanding (unlimited shares of no par value authorized) . . . . . . . . . . . . . . . . . . . . . . . . . . . . . . . . . . . . . . . . . . 115,302 113,633 45,145Net assets . . . . . . . . . . . . . . . . . . . . . . . . . . . . . . . . . . . . . . . . . . . . . . . . . . . . . . . . . . . . . . . . . . . . . . . . . . . . . . . . . . . . . 1,287,200 1,305,328 476,449Net asset value, offering and redemption price per share . . . . . . . . . . . . . . . . . . . . . . . . . . . . . . . . . . . . . . . . . . . . . . . . . $ 11.164 $ 11.487 $ 10.554
Service SharesShares outstanding (unlimited shares of no par value authorized) . . . . . . . . . . . . . . . . . . . . . . . . . . . . . . . . . . . . . . . . . . 41,655,456 41,188,136 20,104,505Net assets . . . . . . . . . . . . . . . . . . . . . . . . . . . . . . . . . . . . . . . . . . . . . . . . . . . . . . . . . . . . . . . . . . . . . . . . . . . . . . . . . . . . . 461,123,761 469,311,387 212,656,486Net asset value, offering and redemption price per share . . . . . . . . . . . . . . . . . . . . . . . . . . . . . . . . . . . . . . . . . . . . . . . . . $ 11.070 $ 11.394 $ 10.578
1Includes loaned securities with a value of: . . . . . . . . . . . . . . . . . . . . . . . . . . . . . . . . . . . . . . . . . . . . . . . . . . . . . . . . . . . $115,284,158 $101,678,549 $ 33,023,815
See notes to financial statements.
102
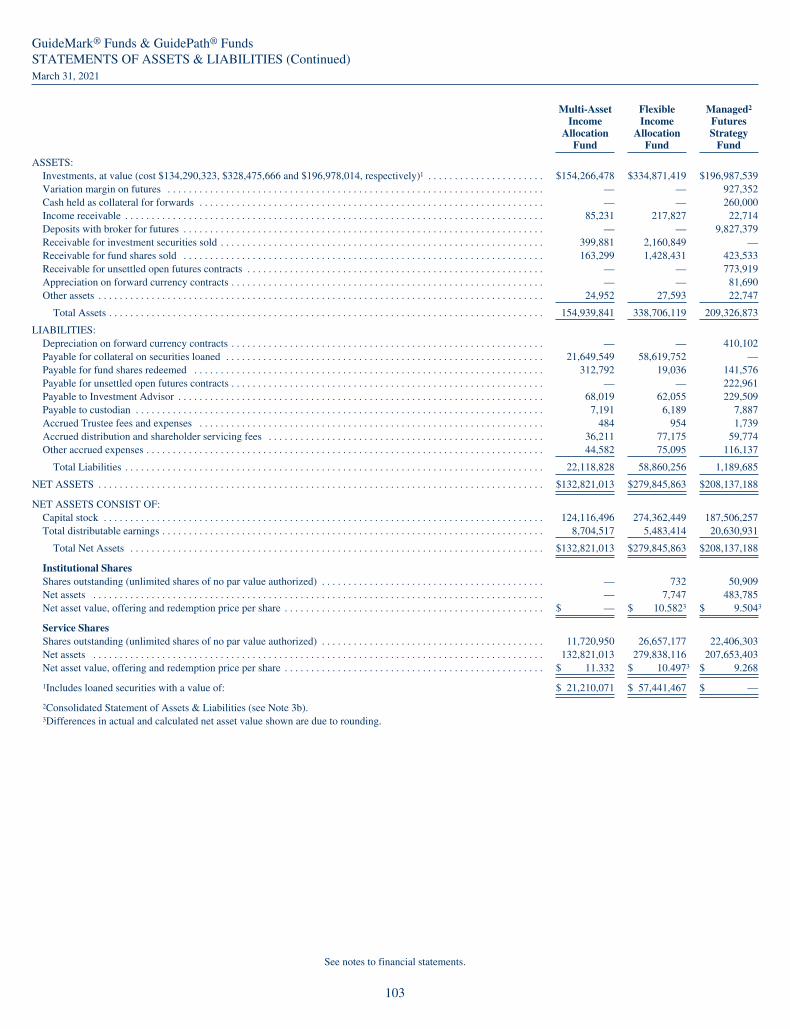
GuideMark® Funds & GuidePath® FundsSTATEMENTS OF ASSETS & LIABILITIES (Continued)March 31, 2021
Multi-AssetIncome
AllocationFund
FlexibleIncome
AllocationFund
Managed2
FuturesStrategy
Fund
ASSETS:Investments, at value (cost $134,290,323, $328,475,666 and $196,978,014, respectively)1 . . . . . . . . . . . . . . . . . . . . . . $154,266,478 $334,871,419 $196,987,539Variation margin on futures . . . . . . . . . . . . . . . . . . . . . . . . . . . . . . . . . . . . . . . . . . . . . . . . . . . . . . . . . . . . . . . . . . . . . . . — — 927,352Cash held as collateral for forwards . . . . . . . . . . . . . . . . . . . . . . . . . . . . . . . . . . . . . . . . . . . . . . . . . . . . . . . . . . . . . . . . . — — 260,000Income receivable . . . . . . . . . . . . . . . . . . . . . . . . . . . . . . . . . . . . . . . . . . . . . . . . . . . . . . . . . . . . . . . . . . . . . . . . . . . . . . . 85,231 217,827 22,714Deposits with broker for futures . . . . . . . . . . . . . . . . . . . . . . . . . . . . . . . . . . . . . . . . . . . . . . . . . . . . . . . . . . . . . . . . . . . . — — 9,827,379Receivable for investment securities sold . . . . . . . . . . . . . . . . . . . . . . . . . . . . . . . . . . . . . . . . . . . . . . . . . . . . . . . . . . . . . 399,881 2,160,849 —Receivable for fund shares sold . . . . . . . . . . . . . . . . . . . . . . . . . . . . . . . . . . . . . . . . . . . . . . . . . . . . . . . . . . . . . . . . . . . . 163,299 1,428,431 423,533Receivable for unsettled open futures contracts . . . . . . . . . . . . . . . . . . . . . . . . . . . . . . . . . . . . . . . . . . . . . . . . . . . . . . . . — — 773,919Appreciation on forward currency contracts . . . . . . . . . . . . . . . . . . . . . . . . . . . . . . . . . . . . . . . . . . . . . . . . . . . . . . . . . . . — — 81,690Other assets . . . . . . . . . . . . . . . . . . . . . . . . . . . . . . . . . . . . . . . . . . . . . . . . . . . . . . . . . . . . . . . . . . . . . . . . . . . . . . . . . . . . 24,952 27,593 22,747
Total Assets . . . . . . . . . . . . . . . . . . . . . . . . . . . . . . . . . . . . . . . . . . . . . . . . . . . . . . . . . . . . . . . . . . . . . . . . . . . . . . . . . . 154,939,841 338,706,119 209,326,873
LIABILITIES:Depreciation on forward currency contracts . . . . . . . . . . . . . . . . . . . . . . . . . . . . . . . . . . . . . . . . . . . . . . . . . . . . . . . . . . . — — 410,102Payable for collateral on securities loaned . . . . . . . . . . . . . . . . . . . . . . . . . . . . . . . . . . . . . . . . . . . . . . . . . . . . . . . . . . . . 21,649,549 58,619,752 —Payable for fund shares redeemed . . . . . . . . . . . . . . . . . . . . . . . . . . . . . . . . . . . . . . . . . . . . . . . . . . . . . . . . . . . . . . . . . . 312,792 19,036 141,576Payable for unsettled open futures contracts . . . . . . . . . . . . . . . . . . . . . . . . . . . . . . . . . . . . . . . . . . . . . . . . . . . . . . . . . . . — — 222,961Payable to Investment Advisor . . . . . . . . . . . . . . . . . . . . . . . . . . . . . . . . . . . . . . . . . . . . . . . . . . . . . . . . . . . . . . . . . . . . . 68,019 62,055 229,509Payable to custodian . . . . . . . . . . . . . . . . . . . . . . . . . . . . . . . . . . . . . . . . . . . . . . . . . . . . . . . . . . . . . . . . . . . . . . . . . . . . . 7,191 6,189 7,887Accrued Trustee fees and expenses . . . . . . . . . . . . . . . . . . . . . . . . . . . . . . . . . . . . . . . . . . . . . . . . . . . . . . . . . . . . . . . . . 484 954 1,739Accrued distribution and shareholder servicing fees . . . . . . . . . . . . . . . . . . . . . . . . . . . . . . . . . . . . . . . . . . . . . . . . . . . . 36,211 77,175 59,774Other accrued expenses . . . . . . . . . . . . . . . . . . . . . . . . . . . . . . . . . . . . . . . . . . . . . . . . . . . . . . . . . . . . . . . . . . . . . . . . . . . 44,582 75,095 116,137
Total Liabilities . . . . . . . . . . . . . . . . . . . . . . . . . . . . . . . . . . . . . . . . . . . . . . . . . . . . . . . . . . . . . . . . . . . . . . . . . . . . . . . 22,118,828 58,860,256 1,189,685
NET ASSETS . . . . . . . . . . . . . . . . . . . . . . . . . . . . . . . . . . . . . . . . . . . . . . . . . . . . . . . . . . . . . . . . . . . . . . . . . . . . . . . . . . . . $132,821,013 $279,845,863 $208,137,188
NET ASSETS CONSIST OF:Capital stock . . . . . . . . . . . . . . . . . . . . . . . . . . . . . . . . . . . . . . . . . . . . . . . . . . . . . . . . . . . . . . . . . . . . . . . . . . . . . . . . . . . 124,116,496 274,362,449 187,506,257Total distributable earnings . . . . . . . . . . . . . . . . . . . . . . . . . . . . . . . . . . . . . . . . . . . . . . . . . . . . . . . . . . . . . . . . . . . . . . . . 8,704,517 5,483,414 20,630,931
Total Net Assets . . . . . . . . . . . . . . . . . . . . . . . . . . . . . . . . . . . . . . . . . . . . . . . . . . . . . . . . . . . . . . . . . . . . . . . . . . . . . . $132,821,013 $279,845,863 $208,137,188
Institutional SharesShares outstanding (unlimited shares of no par value authorized) . . . . . . . . . . . . . . . . . . . . . . . . . . . . . . . . . . . . . . . . . . — 732 50,909Net assets . . . . . . . . . . . . . . . . . . . . . . . . . . . . . . . . . . . . . . . . . . . . . . . . . . . . . . . . . . . . . . . . . . . . . . . . . . . . . . . . . . . . . — 7,747 483,785Net asset value, offering and redemption price per share . . . . . . . . . . . . . . . . . . . . . . . . . . . . . . . . . . . . . . . . . . . . . . . . . $ — $ 10.5823 $ 9.5043
Service SharesShares outstanding (unlimited shares of no par value authorized) . . . . . . . . . . . . . . . . . . . . . . . . . . . . . . . . . . . . . . . . . . 11,720,950 26,657,177 22,406,303Net assets . . . . . . . . . . . . . . . . . . . . . . . . . . . . . . . . . . . . . . . . . . . . . . . . . . . . . . . . . . . . . . . . . . . . . . . . . . . . . . . . . . . . . 132,821,013 279,838,116 207,653,403Net asset value, offering and redemption price per share . . . . . . . . . . . . . . . . . . . . . . . . . . . . . . . . . . . . . . . . . . . . . . . . . $ 11.332 $ 10.4973 $ 9.268
1Includes loaned securities with a value of: $ 21,210,071 $ 57,441,467 $ —
2Consolidated Statement of Assets & Liabilities (see Note 3b).3Differences in actual and calculated net asset value shown are due to rounding.
See notes to financial statements.
103

GuideMark® Funds & GuidePath® FundsSTATEMENTS OF ASSETS & LIABILITIES (Continued)March 31, 2021
ConservativeIncomeFund
IncomeFund
Growth &IncomeFund
ASSETS:Investments, at value (cost $16,389,287, $45,642,392, and $82,818,345 respectively)1 . . . . . . . . . . . . . . . . . . . . . . . . . . . $16,444,250 $45,857,295 $87,778,247Income receivable . . . . . . . . . . . . . . . . . . . . . . . . . . . . . . . . . . . . . . . . . . . . . . . . . . . . . . . . . . . . . . . . . . . . . . . . . . . . . . . . . 3,941 22 94,214Receivable for dividend reclaims . . . . . . . . . . . . . . . . . . . . . . . . . . . . . . . . . . . . . . . . . . . . . . . . . . . . . . . . . . . . . . . . . . . . . — — 872Receivable for fund shares sold . . . . . . . . . . . . . . . . . . . . . . . . . . . . . . . . . . . . . . . . . . . . . . . . . . . . . . . . . . . . . . . . . . . . . . 21,943 51,192 193,933Deposits with broker for futures . . . . . . . . . . . . . . . . . . . . . . . . . . . . . . . . . . . . . . . . . . . . . . . . . . . . . . . . . . . . . . . . . . . . . . — — 137,699Other assets . . . . . . . . . . . . . . . . . . . . . . . . . . . . . . . . . . . . . . . . . . . . . . . . . . . . . . . . . . . . . . . . . . . . . . . . . . . . . . . . . . . . . . 20,764 16,821 14,132
Total Assets . . . . . . . . . . . . . . . . . . . . . . . . . . . . . . . . . . . . . . . . . . . . . . . . . . . . . . . . . . . . . . . . . . . . . . . . . . . . . . . . . . . 16,490,898 45,925,330 88,219,097
LIABILITIES:Written options, at value (premiums received $0, $0, and $344,643) . . . . . . . . . . . . . . . . . . . . . . . . . . . . . . . . . . . . . . . . . — — 116,815Payable for collateral on securities loaned . . . . . . . . . . . . . . . . . . . . . . . . . . . . . . . . . . . . . . . . . . . . . . . . . . . . . . . . . . . . . . 537,300 7,653,784 1,005,669Payable for investment securities purchased . . . . . . . . . . . . . . . . . . . . . . . . . . . . . . . . . . . . . . . . . . . . . . . . . . . . . . . . . . . . — 194,075 193,721Payable for fund shares redeemed . . . . . . . . . . . . . . . . . . . . . . . . . . . . . . . . . . . . . . . . . . . . . . . . . . . . . . . . . . . . . . . . . . . . 6,146 221 852Payable to Investment Advisor . . . . . . . . . . . . . . . . . . . . . . . . . . . . . . . . . . . . . . . . . . . . . . . . . . . . . . . . . . . . . . . . . . . . . . . 1,366 19,655 19,156Payable to custodian . . . . . . . . . . . . . . . . . . . . . . . . . . . . . . . . . . . . . . . . . . . . . . . . . . . . . . . . . . . . . . . . . . . . . . . . . . . . . . . 245 940 7,342Accrued Trustee fees and expenses . . . . . . . . . . . . . . . . . . . . . . . . . . . . . . . . . . . . . . . . . . . . . . . . . . . . . . . . . . . . . . . . . . . 30 143 277Other accrued expenses . . . . . . . . . . . . . . . . . . . . . . . . . . . . . . . . . . . . . . . . . . . . . . . . . . . . . . . . . . . . . . . . . . . . . . . . . . . . 19,619 24,791 41,889
Total Liabilities . . . . . . . . . . . . . . . . . . . . . . . . . . . . . . . . . . . . . . . . . . . . . . . . . . . . . . . . . . . . . . . . . . . . . . . . . . . . . . . . . 564,706 7,893,609 1,385,721
NET ASSETS . . . . . . . . . . . . . . . . . . . . . . . . . . . . . . . . . . . . . . . . . . . . . . . . . . . . . . . . . . . . . . . . . . . . . . . . . . . . . . . . . . . . . . $15,926,192 $38,031,721 $86,833,376
NET ASSETS CONSIST OF:Capital stock . . . . . . . . . . . . . . . . . . . . . . . . . . . . . . . . . . . . . . . . . . . . . . . . . . . . . . . . . . . . . . . . . . . . . . . . . . . . . . . . . . . . . 15,957,423 38,781,107 73,959,919Total distributable earnings (loss) . . . . . . . . . . . . . . . . . . . . . . . . . . . . . . . . . . . . . . . . . . . . . . . . . . . . . . . . . . . . . . . . . . . . (31,231) (749,386) 12,873,457
Total Net Assets . . . . . . . . . . . . . . . . . . . . . . . . . . . . . . . . . . . . . . . . . . . . . . . . . . . . . . . . . . . . . . . . . . . . . . . . . . . . . . . . $15,926,192 $38,031,721 $86,833,376
Shares outstanding (unlimited shares of no par value authorized) . . . . . . . . . . . . . . . . . . . . . . . . . . . . . . . . . . . . . . . . . . . . 1,602,511 3,822,343 7,432,647Net assets . . . . . . . . . . . . . . . . . . . . . . . . . . . . . . . . . . . . . . . . . . . . . . . . . . . . . . . . . . . . . . . . . . . . . . . . . . . . . . . . . . . . . . . 15,926,192 38,031,721 86,833,376Net asset value, offering and redemption price per share . . . . . . . . . . . . . . . . . . . . . . . . . . . . . . . . . . . . . . . . . . . . . . . . . . . $ 9.938 $ 9.950 $ 11.683
1Includes loaned securities with a value of: . . . . . . . . . . . . . . . . . . . . . . . . . . . . . . . . . . . . . . . . . . . . . . . . . . . . . . . . . . . . . $ 525,138 $ 7,519,776 $ 978,335
See notes to financial statements.
104
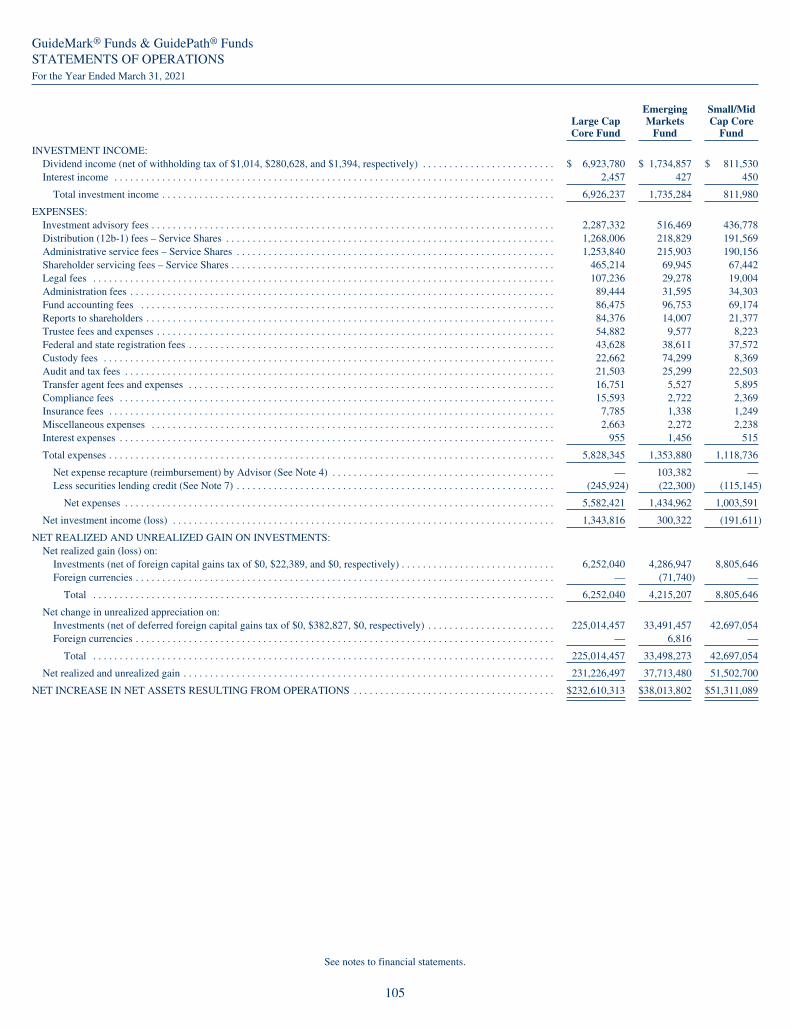
GuideMark® Funds & GuidePath® FundsSTATEMENTS OF OPERATIONSFor the Year Ended March 31, 2021
Large CapCore Fund
EmergingMarkets
Fund
Small/MidCap Core
Fund
INVESTMENT INCOME:Dividend income (net of withholding tax of $1,014, $280,628, and $1,394, respectively) . . . . . . . . . . . . . . . . . . . . . . . . . $ 6,923,780 $ 1,734,857 $ 811,530Interest income . . . . . . . . . . . . . . . . . . . . . . . . . . . . . . . . . . . . . . . . . . . . . . . . . . . . . . . . . . . . . . . . . . . . . . . . . . . . . . . . . . . 2,457 427 450
Total investment income . . . . . . . . . . . . . . . . . . . . . . . . . . . . . . . . . . . . . . . . . . . . . . . . . . . . . . . . . . . . . . . . . . . . . . . . . . 6,926,237 1,735,284 811,980
EXPENSES:Investment advisory fees . . . . . . . . . . . . . . . . . . . . . . . . . . . . . . . . . . . . . . . . . . . . . . . . . . . . . . . . . . . . . . . . . . . . . . . . . . . . 2,287,332 516,469 436,778Distribution (12b-1) fees – Service Shares . . . . . . . . . . . . . . . . . . . . . . . . . . . . . . . . . . . . . . . . . . . . . . . . . . . . . . . . . . . . . . 1,268,006 218,829 191,569Administrative service fees – Service Shares . . . . . . . . . . . . . . . . . . . . . . . . . . . . . . . . . . . . . . . . . . . . . . . . . . . . . . . . . . . . 1,253,840 215,903 190,156Shareholder servicing fees – Service Shares . . . . . . . . . . . . . . . . . . . . . . . . . . . . . . . . . . . . . . . . . . . . . . . . . . . . . . . . . . . . . 465,214 69,945 67,442Legal fees . . . . . . . . . . . . . . . . . . . . . . . . . . . . . . . . . . . . . . . . . . . . . . . . . . . . . . . . . . . . . . . . . . . . . . . . . . . . . . . . . . . . . . . 107,236 29,278 19,004Administration fees . . . . . . . . . . . . . . . . . . . . . . . . . . . . . . . . . . . . . . . . . . . . . . . . . . . . . . . . . . . . . . . . . . . . . . . . . . . . . . . . 89,444 31,595 34,303Fund accounting fees . . . . . . . . . . . . . . . . . . . . . . . . . . . . . . . . . . . . . . . . . . . . . . . . . . . . . . . . . . . . . . . . . . . . . . . . . . . . . . 86,475 96,753 69,174Reports to shareholders . . . . . . . . . . . . . . . . . . . . . . . . . . . . . . . . . . . . . . . . . . . . . . . . . . . . . . . . . . . . . . . . . . . . . . . . . . . . . 84,376 14,007 21,377Trustee fees and expenses . . . . . . . . . . . . . . . . . . . . . . . . . . . . . . . . . . . . . . . . . . . . . . . . . . . . . . . . . . . . . . . . . . . . . . . . . . . 54,882 9,577 8,223Federal and state registration fees . . . . . . . . . . . . . . . . . . . . . . . . . . . . . . . . . . . . . . . . . . . . . . . . . . . . . . . . . . . . . . . . . . . . . 43,628 38,611 37,572Custody fees . . . . . . . . . . . . . . . . . . . . . . . . . . . . . . . . . . . . . . . . . . . . . . . . . . . . . . . . . . . . . . . . . . . . . . . . . . . . . . . . . . . . . 22,662 74,299 8,369Audit and tax fees . . . . . . . . . . . . . . . . . . . . . . . . . . . . . . . . . . . . . . . . . . . . . . . . . . . . . . . . . . . . . . . . . . . . . . . . . . . . . . . . . 21,503 25,299 22,503Transfer agent fees and expenses . . . . . . . . . . . . . . . . . . . . . . . . . . . . . . . . . . . . . . . . . . . . . . . . . . . . . . . . . . . . . . . . . . . . . 16,751 5,527 5,895Compliance fees . . . . . . . . . . . . . . . . . . . . . . . . . . . . . . . . . . . . . . . . . . . . . . . . . . . . . . . . . . . . . . . . . . . . . . . . . . . . . . . . . . 15,593 2,722 2,369Insurance fees . . . . . . . . . . . . . . . . . . . . . . . . . . . . . . . . . . . . . . . . . . . . . . . . . . . . . . . . . . . . . . . . . . . . . . . . . . . . . . . . . . . . 7,785 1,338 1,249Miscellaneous expenses . . . . . . . . . . . . . . . . . . . . . . . . . . . . . . . . . . . . . . . . . . . . . . . . . . . . . . . . . . . . . . . . . . . . . . . . . . . . 2,663 2,272 2,238Interest expenses . . . . . . . . . . . . . . . . . . . . . . . . . . . . . . . . . . . . . . . . . . . . . . . . . . . . . . . . . . . . . . . . . . . . . . . . . . . . . . . . . . 955 1,456 515
Total expenses . . . . . . . . . . . . . . . . . . . . . . . . . . . . . . . . . . . . . . . . . . . . . . . . . . . . . . . . . . . . . . . . . . . . . . . . . . . . . . . . . . . . 5,828,345 1,353,880 1,118,736
Net expense recapture (reimbursement) by Advisor (See Note 4) . . . . . . . . . . . . . . . . . . . . . . . . . . . . . . . . . . . . . . . . . . — 103,382 —Less securities lending credit (See Note 7) . . . . . . . . . . . . . . . . . . . . . . . . . . . . . . . . . . . . . . . . . . . . . . . . . . . . . . . . . . . . (245,924) (22,300) (115,145)
Net expenses . . . . . . . . . . . . . . . . . . . . . . . . . . . . . . . . . . . . . . . . . . . . . . . . . . . . . . . . . . . . . . . . . . . . . . . . . . . . . . . . . 5,582,421 1,434,962 1,003,591
Net investment income (loss) . . . . . . . . . . . . . . . . . . . . . . . . . . . . . . . . . . . . . . . . . . . . . . . . . . . . . . . . . . . . . . . . . . . . . . . . 1,343,816 300,322 (191,611)
NET REALIZED AND UNREALIZED GAIN ON INVESTMENTS:Net realized gain (loss) on:
Investments (net of foreign capital gains tax of $0, $22,389, and $0, respectively) . . . . . . . . . . . . . . . . . . . . . . . . . . . . . 6,252,040 4,286,947 8,805,646Foreign currencies . . . . . . . . . . . . . . . . . . . . . . . . . . . . . . . . . . . . . . . . . . . . . . . . . . . . . . . . . . . . . . . . . . . . . . . . . . . . . . . — (71,740) —
Total . . . . . . . . . . . . . . . . . . . . . . . . . . . . . . . . . . . . . . . . . . . . . . . . . . . . . . . . . . . . . . . . . . . . . . . . . . . . . . . . . . . . . . . 6,252,040 4,215,207 8,805,646
Net change in unrealized appreciation on:Investments (net of deferred foreign capital gains tax of $0, $382,827, $0, respectively) . . . . . . . . . . . . . . . . . . . . . . . . 225,014,457 33,491,457 42,697,054Foreign currencies . . . . . . . . . . . . . . . . . . . . . . . . . . . . . . . . . . . . . . . . . . . . . . . . . . . . . . . . . . . . . . . . . . . . . . . . . . . . . . . — 6,816 —
Total . . . . . . . . . . . . . . . . . . . . . . . . . . . . . . . . . . . . . . . . . . . . . . . . . . . . . . . . . . . . . . . . . . . . . . . . . . . . . . . . . . . . . . . 225,014,457 33,498,273 42,697,054
Net realized and unrealized gain . . . . . . . . . . . . . . . . . . . . . . . . . . . . . . . . . . . . . . . . . . . . . . . . . . . . . . . . . . . . . . . . . . . . . . 231,226,497 37,713,480 51,502,700
NET INCREASE IN NET ASSETS RESULTING FROM OPERATIONS . . . . . . . . . . . . . . . . . . . . . . . . . . . . . . . . . . . . . . $232,610,313 $38,013,802 $51,311,089
See notes to financial statements.
105

GuideMark® Funds & GuidePath® FundsSTATEMENTS OF OPERATIONS (Continued)For the Year Ended March 31, 2021
Worldex-US Fund
CoreFixed Income
Fund
GrowthAllocation
Fund
INVESTMENT INCOME:Dividend income (net of withholding tax of $365,154, $0, and $0, respectively) . . . . . . . . . . . . . . . . . . . . . . . . . . . . . . $ 2,883,821 $ — $ 12,476,311Interest income . . . . . . . . . . . . . . . . . . . . . . . . . . . . . . . . . . . . . . . . . . . . . . . . . . . . . . . . . . . . . . . . . . . . . . . . . . . . . . . . . 439 3,524,347 7,111
Total investment income . . . . . . . . . . . . . . . . . . . . . . . . . . . . . . . . . . . . . . . . . . . . . . . . . . . . . . . . . . . . . . . . . . . . . . . . 2,884,260 3,524,347 12,483,422
EXPENSES:Investment advisory fees . . . . . . . . . . . . . . . . . . . . . . . . . . . . . . . . . . . . . . . . . . . . . . . . . . . . . . . . . . . . . . . . . . . . . . . . . . 639,875 614,896 2,264,803Distribution (12b-1) fees – Service Shares . . . . . . . . . . . . . . . . . . . . . . . . . . . . . . . . . . . . . . . . . . . . . . . . . . . . . . . . . . . . 319,549 384,310 2,252,173Administrative service fees – Service Shares . . . . . . . . . . . . . . . . . . . . . . . . . . . . . . . . . . . . . . . . . . . . . . . . . . . . . . . . . . 316,833 377,766 2,251,272Shareholder servicing fees – Service Shares . . . . . . . . . . . . . . . . . . . . . . . . . . . . . . . . . . . . . . . . . . . . . . . . . . . . . . . . . . . 111,779 135,158 889,104Legal fees . . . . . . . . . . . . . . . . . . . . . . . . . . . . . . . . . . . . . . . . . . . . . . . . . . . . . . . . . . . . . . . . . . . . . . . . . . . . . . . . . . . . . 36,766 37,245 172,863Administration fees . . . . . . . . . . . . . . . . . . . . . . . . . . . . . . . . . . . . . . . . . . . . . . . . . . . . . . . . . . . . . . . . . . . . . . . . . . . . . . 47,485 35,168 140,482Fund accounting fees . . . . . . . . . . . . . . . . . . . . . . . . . . . . . . . . . . . . . . . . . . . . . . . . . . . . . . . . . . . . . . . . . . . . . . . . . . . . . 119,268 225,920 113,603Reports to shareholders . . . . . . . . . . . . . . . . . . . . . . . . . . . . . . . . . . . . . . . . . . . . . . . . . . . . . . . . . . . . . . . . . . . . . . . . . . . 35,546 22,939 91,335Trustee fees and expenses . . . . . . . . . . . . . . . . . . . . . . . . . . . . . . . . . . . . . . . . . . . . . . . . . . . . . . . . . . . . . . . . . . . . . . . . . 14,924 17,228 101,996Federal and state registration fees . . . . . . . . . . . . . . . . . . . . . . . . . . . . . . . . . . . . . . . . . . . . . . . . . . . . . . . . . . . . . . . . . . . 37,727 38,390 44,901Custody fees . . . . . . . . . . . . . . . . . . . . . . . . . . . . . . . . . . . . . . . . . . . . . . . . . . . . . . . . . . . . . . . . . . . . . . . . . . . . . . . . . . . 36,073 32,285 61,078Audit and tax fees . . . . . . . . . . . . . . . . . . . . . . . . . . . . . . . . . . . . . . . . . . . . . . . . . . . . . . . . . . . . . . . . . . . . . . . . . . . . . . . 26,671 25,012 15,613Transfer agent fees and expenses . . . . . . . . . . . . . . . . . . . . . . . . . . . . . . . . . . . . . . . . . . . . . . . . . . . . . . . . . . . . . . . . . . . 7,249 8,004 26,689Compliance fees . . . . . . . . . . . . . . . . . . . . . . . . . . . . . . . . . . . . . . . . . . . . . . . . . . . . . . . . . . . . . . . . . . . . . . . . . . . . . . . . 3,944 4,762 27,964Insurance fees . . . . . . . . . . . . . . . . . . . . . . . . . . . . . . . . . . . . . . . . . . . . . . . . . . . . . . . . . . . . . . . . . . . . . . . . . . . . . . . . . . 2,681 2,189 17,382Miscellaneous expenses . . . . . . . . . . . . . . . . . . . . . . . . . . . . . . . . . . . . . . . . . . . . . . . . . . . . . . . . . . . . . . . . . . . . . . . . . . 2,280 2,373 3,016Interest expenses . . . . . . . . . . . . . . . . . . . . . . . . . . . . . . . . . . . . . . . . . . . . . . . . . . . . . . . . . . . . . . . . . . . . . . . . . . . . . . . . 1,698 — 8,583
Total expenses . . . . . . . . . . . . . . . . . . . . . . . . . . . . . . . . . . . . . . . . . . . . . . . . . . . . . . . . . . . . . . . . . . . . . . . . . . . . . . . . . . 1,760,348 1,963,645 8,482,857
Net expense recapture (reimbursement) by Advisor (See Note 4) . . . . . . . . . . . . . . . . . . . . . . . . . . . . . . . . . . . . . . . . 15 (123,677) —Less securities lending credit (See Note 7) . . . . . . . . . . . . . . . . . . . . . . . . . . . . . . . . . . . . . . . . . . . . . . . . . . . . . . . . . . (10,253) (10,652) (357,472)
Net expenses . . . . . . . . . . . . . . . . . . . . . . . . . . . . . . . . . . . . . . . . . . . . . . . . . . . . . . . . . . . . . . . . . . . . . . . . . . . . . . . 1,750,110 1,829,316 8,125,385
Net investment income . . . . . . . . . . . . . . . . . . . . . . . . . . . . . . . . . . . . . . . . . . . . . . . . . . . . . . . . . . . . . . . . . . . . . . . . . . . 1,134,150 1,695,031 4,358,037
NET REALIZED AND UNREALIZED GAIN ON INVESTMENTS:Net realized gain (loss) on:
Investments . . . . . . . . . . . . . . . . . . . . . . . . . . . . . . . . . . . . . . . . . . . . . . . . . . . . . . . . . . . . . . . . . . . . . . . . . . . . . . . . . . 263,853 3,760,167 20,562,986Foreign currencies . . . . . . . . . . . . . . . . . . . . . . . . . . . . . . . . . . . . . . . . . . . . . . . . . . . . . . . . . . . . . . . . . . . . . . . . . . . . . 20,783 (818) —Swaps . . . . . . . . . . . . . . . . . . . . . . . . . . . . . . . . . . . . . . . . . . . . . . . . . . . . . . . . . . . . . . . . . . . . . . . . . . . . . . . . . . . . . . . — (1,948,621) —Long-term capital gain distributions received . . . . . . . . . . . . . . . . . . . . . . . . . . . . . . . . . . . . . . . . . . . . . . . . . . . . . . . . 80 — 7,202,543Futures contracts . . . . . . . . . . . . . . . . . . . . . . . . . . . . . . . . . . . . . . . . . . . . . . . . . . . . . . . . . . . . . . . . . . . . . . . . . . . . . . — 747,454 —Written options . . . . . . . . . . . . . . . . . . . . . . . . . . . . . . . . . . . . . . . . . . . . . . . . . . . . . . . . . . . . . . . . . . . . . . . . . . . . . . . — 716,334 —
Total . . . . . . . . . . . . . . . . . . . . . . . . . . . . . . . . . . . . . . . . . . . . . . . . . . . . . . . . . . . . . . . . . . . . . . . . . . . . . . . . . . . . . . 284,716 3,274,516 27,765,529
Net change in unrealized appreciation (depreciation) on:Investments . . . . . . . . . . . . . . . . . . . . . . . . . . . . . . . . . . . . . . . . . . . . . . . . . . . . . . . . . . . . . . . . . . . . . . . . . . . . . . . . . . 44,997,686 (4,773,449) 362,168,372Foreign currencies . . . . . . . . . . . . . . . . . . . . . . . . . . . . . . . . . . . . . . . . . . . . . . . . . . . . . . . . . . . . . . . . . . . . . . . . . . . . . 267 — —Swaps . . . . . . . . . . . . . . . . . . . . . . . . . . . . . . . . . . . . . . . . . . . . . . . . . . . . . . . . . . . . . . . . . . . . . . . . . . . . . . . . . . . . . . . — 1,763,195 —Futures contracts . . . . . . . . . . . . . . . . . . . . . . . . . . . . . . . . . . . . . . . . . . . . . . . . . . . . . . . . . . . . . . . . . . . . . . . . . . . . . . — 485,295 —Written options . . . . . . . . . . . . . . . . . . . . . . . . . . . . . . . . . . . . . . . . . . . . . . . . . . . . . . . . . . . . . . . . . . . . . . . . . . . . . . . — 47,567 —
Total . . . . . . . . . . . . . . . . . . . . . . . . . . . . . . . . . . . . . . . . . . . . . . . . . . . . . . . . . . . . . . . . . . . . . . . . . . . . . . . . . . . . . . 44,997,953 (2,477,392) 362,168,372
Net realized and unrealized gain . . . . . . . . . . . . . . . . . . . . . . . . . . . . . . . . . . . . . . . . . . . . . . . . . . . . . . . . . . . . . . . . . . . . 45,282,669 797,124 389,933,901
NET INCREASE IN NET ASSETS RESULTING FROM OPERATIONS . . . . . . . . . . . . . . . . . . . . . . . . . . . . . . . . . . . . $46,416,819 $ 2,492,155 $394,291,938
See notes to financial statements.
106

GuideMark® Funds & GuidePath® FundsSTATEMENTS OF OPERATIONS (Continued)For the Year Ended March 31, 2021
ConservativeAllocation
Fund
TacticalAllocation
Fund
AbsoluteReturn
AllocationFund
INVESTMENT INCOME:Dividend income . . . . . . . . . . . . . . . . . . . . . . . . . . . . . . . . . . . . . . . . . . . . . . . . . . . . . . . . . . . . . . . . . . . . . . . . . . . . . . . . . $10,141,031 $ 4,647,732 $ 6,076,677Dividends from affiliated investments . . . . . . . . . . . . . . . . . . . . . . . . . . . . . . . . . . . . . . . . . . . . . . . . . . . . . . . . . . . . . . . . . — — 576,105Interest income . . . . . . . . . . . . . . . . . . . . . . . . . . . . . . . . . . . . . . . . . . . . . . . . . . . . . . . . . . . . . . . . . . . . . . . . . . . . . . . . . . . 3,117 72,666 2,443
Total investment income . . . . . . . . . . . . . . . . . . . . . . . . . . . . . . . . . . . . . . . . . . . . . . . . . . . . . . . . . . . . . . . . . . . . . . . . . 10,144,148 4,720,398 6,655,225
EXPENSES:Investment advisory fees . . . . . . . . . . . . . . . . . . . . . . . . . . . . . . . . . . . . . . . . . . . . . . . . . . . . . . . . . . . . . . . . . . . . . . . . . . . 976,098 1,454,814 881,415Distribution (12b-1) fees – Service Shares . . . . . . . . . . . . . . . . . . . . . . . . . . . . . . . . . . . . . . . . . . . . . . . . . . . . . . . . . . . . . . 971,164 1,034,395 627,673Administrative service fees – Service Shares . . . . . . . . . . . . . . . . . . . . . . . . . . . . . . . . . . . . . . . . . . . . . . . . . . . . . . . . . . . . 970,946 1,034,126 627,514Shareholder servicing fees – Service Shares . . . . . . . . . . . . . . . . . . . . . . . . . . . . . . . . . . . . . . . . . . . . . . . . . . . . . . . . . . . . 380,696 400,846 245,869Legal fees . . . . . . . . . . . . . . . . . . . . . . . . . . . . . . . . . . . . . . . . . . . . . . . . . . . . . . . . . . . . . . . . . . . . . . . . . . . . . . . . . . . . . . . 74,964 100,804 61,636Administration fees . . . . . . . . . . . . . . . . . . . . . . . . . . . . . . . . . . . . . . . . . . . . . . . . . . . . . . . . . . . . . . . . . . . . . . . . . . . . . . . . 64,529 75,532 38,671Fund accounting fees . . . . . . . . . . . . . . . . . . . . . . . . . . . . . . . . . . . . . . . . . . . . . . . . . . . . . . . . . . . . . . . . . . . . . . . . . . . . . . 53,704 57,272 37,614Reports to shareholders . . . . . . . . . . . . . . . . . . . . . . . . . . . . . . . . . . . . . . . . . . . . . . . . . . . . . . . . . . . . . . . . . . . . . . . . . . . . 49,548 69,393 30,556Trustee fees and expenses . . . . . . . . . . . . . . . . . . . . . . . . . . . . . . . . . . . . . . . . . . . . . . . . . . . . . . . . . . . . . . . . . . . . . . . . . . 43,882 46,464 31,742Federal and state registration fees . . . . . . . . . . . . . . . . . . . . . . . . . . . . . . . . . . . . . . . . . . . . . . . . . . . . . . . . . . . . . . . . . . . . 40,919 48,445 42,448Custody fees . . . . . . . . . . . . . . . . . . . . . . . . . . . . . . . . . . . . . . . . . . . . . . . . . . . . . . . . . . . . . . . . . . . . . . . . . . . . . . . . . . . . . 47,581 50,361 36,349Audit and tax fees . . . . . . . . . . . . . . . . . . . . . . . . . . . . . . . . . . . . . . . . . . . . . . . . . . . . . . . . . . . . . . . . . . . . . . . . . . . . . . . . . 14,991 14,991 14,994Transfer agent fees and expenses . . . . . . . . . . . . . . . . . . . . . . . . . . . . . . . . . . . . . . . . . . . . . . . . . . . . . . . . . . . . . . . . . . . . . 13,798 14,507 11,046Compliance fees . . . . . . . . . . . . . . . . . . . . . . . . . . . . . . . . . . . . . . . . . . . . . . . . . . . . . . . . . . . . . . . . . . . . . . . . . . . . . . . . . . 11,893 12,826 8,420Insurance fees . . . . . . . . . . . . . . . . . . . . . . . . . . . . . . . . . . . . . . . . . . . . . . . . . . . . . . . . . . . . . . . . . . . . . . . . . . . . . . . . . . . . 7,582 8,548 6,389Miscellaneous expenses . . . . . . . . . . . . . . . . . . . . . . . . . . . . . . . . . . . . . . . . . . . . . . . . . . . . . . . . . . . . . . . . . . . . . . . . . . . . 2,541 2,527 2,407Interest expenses . . . . . . . . . . . . . . . . . . . . . . . . . . . . . . . . . . . . . . . . . . . . . . . . . . . . . . . . . . . . . . . . . . . . . . . . . . . . . . . . . . 2,663 — 19,795
Total expenses . . . . . . . . . . . . . . . . . . . . . . . . . . . . . . . . . . . . . . . . . . . . . . . . . . . . . . . . . . . . . . . . . . . . . . . . . . . . . . . . . . . 3,727,499 4,425,851 2,724,538
Net expense recapture (reimbursement) by Advisor (See Note 4) . . . . . . . . . . . . . . . . . . . . . . . . . . . . . . . . . . . . . . . . . . (725,482) — (590,940)Less securities lending credit (See Note 7) . . . . . . . . . . . . . . . . . . . . . . . . . . . . . . . . . . . . . . . . . . . . . . . . . . . . . . . . . . . (278,122) (82,623) (103,722)
Net expenses . . . . . . . . . . . . . . . . . . . . . . . . . . . . . . . . . . . . . . . . . . . . . . . . . . . . . . . . . . . . . . . . . . . . . . . . . . . . . . . . . 2,723,895 4,343,228 2,029,876
Net investment income . . . . . . . . . . . . . . . . . . . . . . . . . . . . . . . . . . . . . . . . . . . . . . . . . . . . . . . . . . . . . . . . . . . . . . . . . . . . . 7,420,253 377,170 4,625,349
NET REALIZED AND UNREALIZED GAIN ON INVESTMENTS:Net realized gain on:
Investments . . . . . . . . . . . . . . . . . . . . . . . . . . . . . . . . . . . . . . . . . . . . . . . . . . . . . . . . . . . . . . . . . . . . . . . . . . . . . . . . . . . . 3,387,320 13,050,253 7,557,476Investments in affiliates . . . . . . . . . . . . . . . . . . . . . . . . . . . . . . . . . . . . . . . . . . . . . . . . . . . . . . . . . . . . . . . . . . . . . . . . . . — — 830,104Long-term capital gain distributions received . . . . . . . . . . . . . . . . . . . . . . . . . . . . . . . . . . . . . . . . . . . . . . . . . . . . . . . . . 197,048 — 20,978
Total . . . . . . . . . . . . . . . . . . . . . . . . . . . . . . . . . . . . . . . . . . . . . . . . . . . . . . . . . . . . . . . . . . . . . . . . . . . . . . . . . . . . . . . 3,584,368 13,050,253 8,408,558
Net change in unrealized appreciation on:Investments . . . . . . . . . . . . . . . . . . . . . . . . . . . . . . . . . . . . . . . . . . . . . . . . . . . . . . . . . . . . . . . . . . . . . . . . . . . . . . . . . . . . 66,230,963 60,280,536 9,604,882Investments in affiliates . . . . . . . . . . . . . . . . . . . . . . . . . . . . . . . . . . . . . . . . . . . . . . . . . . . . . . . . . . . . . . . . . . . . . . . . . . — — 3,164,895
Total . . . . . . . . . . . . . . . . . . . . . . . . . . . . . . . . . . . . . . . . . . . . . . . . . . . . . . . . . . . . . . . . . . . . . . . . . . . . . . . . . . . . . . . 66,230,963 60,280,536 12,769,777
Net realized and unrealized gains . . . . . . . . . . . . . . . . . . . . . . . . . . . . . . . . . . . . . . . . . . . . . . . . . . . . . . . . . . . . . . . . . . . . . 69,815,331 73,330,789 21,178,335
NET INCREASE IN NET ASSETS RESULTING FROM OPERATIONS . . . . . . . . . . . . . . . . . . . . . . . . . . . . . . . . . . . . . . $77,235,584 $73,707,959 $25,803,684
See notes to financial statements.
107

GuideMark® Funds & GuidePath® FundsSTATEMENTS OF OPERATIONS (Continued)For the Year Ended March 31, 2021
Multi-AssetIncome
AllocationFund
FlexibleIncome
AllocationFund
Managed1
FuturesStrategy
Fund
INVESTMENT INCOME:Dividend income . . . . . . . . . . . . . . . . . . . . . . . . . . . . . . . . . . . . . . . . . . . . . . . . . . . . . . . . . . . . . . . . . . . . . . . . . . . . . . . . . . . $ 4,394,534 $ 6,522,366 $ —Interest income . . . . . . . . . . . . . . . . . . . . . . . . . . . . . . . . . . . . . . . . . . . . . . . . . . . . . . . . . . . . . . . . . . . . . . . . . . . . . . . . . . . . 986 2,411 782,581
Total investment income . . . . . . . . . . . . . . . . . . . . . . . . . . . . . . . . . . . . . . . . . . . . . . . . . . . . . . . . . . . . . . . . . . . . . . . . . . . 4,395,520 6,524,777 782,581
EXPENSES:Investment advisory fees . . . . . . . . . . . . . . . . . . . . . . . . . . . . . . . . . . . . . . . . . . . . . . . . . . . . . . . . . . . . . . . . . . . . . . . . . . . . . 430,548 515,003 2,540,516Distribution (12b-1) fees – Service Shares . . . . . . . . . . . . . . . . . . . . . . . . . . . . . . . . . . . . . . . . . . . . . . . . . . . . . . . . . . . . . . . 307,535 514,973 601,791Administrative service fees – Service Shares . . . . . . . . . . . . . . . . . . . . . . . . . . . . . . . . . . . . . . . . . . . . . . . . . . . . . . . . . . . . . 307,535 514,973 601,620Shareholder servicing fees – Service Shares . . . . . . . . . . . . . . . . . . . . . . . . . . . . . . . . . . . . . . . . . . . . . . . . . . . . . . . . . . . . . . 119,323 201,869 235,307Legal fees . . . . . . . . . . . . . . . . . . . . . . . . . . . . . . . . . . . . . . . . . . . . . . . . . . . . . . . . . . . . . . . . . . . . . . . . . . . . . . . . . . . . . . . . 25,958 50,001 58,609Administration fees . . . . . . . . . . . . . . . . . . . . . . . . . . . . . . . . . . . . . . . . . . . . . . . . . . . . . . . . . . . . . . . . . . . . . . . . . . . . . . . . . 20,575 31,231 39,413Fund accounting fees . . . . . . . . . . . . . . . . . . . . . . . . . . . . . . . . . . . . . . . . . . . . . . . . . . . . . . . . . . . . . . . . . . . . . . . . . . . . . . . 15,505 31,567 48,119Reports to shareholders . . . . . . . . . . . . . . . . . . . . . . . . . . . . . . . . . . . . . . . . . . . . . . . . . . . . . . . . . . . . . . . . . . . . . . . . . . . . . . 9,006 42,921 49,469Trustee fees and expenses . . . . . . . . . . . . . . . . . . . . . . . . . . . . . . . . . . . . . . . . . . . . . . . . . . . . . . . . . . . . . . . . . . . . . . . . . . . . 14,311 20,531 28,339Federal and state registration fees . . . . . . . . . . . . . . . . . . . . . . . . . . . . . . . . . . . . . . . . . . . . . . . . . . . . . . . . . . . . . . . . . . . . . . 35,702 49,183 54,273Custody fees . . . . . . . . . . . . . . . . . . . . . . . . . . . . . . . . . . . . . . . . . . . . . . . . . . . . . . . . . . . . . . . . . . . . . . . . . . . . . . . . . . . . . . 28,433 25,914 34,732Audit and tax fees . . . . . . . . . . . . . . . . . . . . . . . . . . . . . . . . . . . . . . . . . . . . . . . . . . . . . . . . . . . . . . . . . . . . . . . . . . . . . . . . . . 14,996 15,007 31,494Transfer agent fees and expenses . . . . . . . . . . . . . . . . . . . . . . . . . . . . . . . . . . . . . . . . . . . . . . . . . . . . . . . . . . . . . . . . . . . . . . 5,378 9,133 10,527Compliance fees . . . . . . . . . . . . . . . . . . . . . . . . . . . . . . . . . . . . . . . . . . . . . . . . . . . . . . . . . . . . . . . . . . . . . . . . . . . . . . . . . . . 3,792 6,179 8,212Insurance fees . . . . . . . . . . . . . . . . . . . . . . . . . . . . . . . . . . . . . . . . . . . . . . . . . . . . . . . . . . . . . . . . . . . . . . . . . . . . . . . . . . . . . 2,648 2,369 5,987Miscellaneous expenses . . . . . . . . . . . . . . . . . . . . . . . . . . . . . . . . . . . . . . . . . . . . . . . . . . . . . . . . . . . . . . . . . . . . . . . . . . . . . 2,285 2,378 3,547Interest expenses . . . . . . . . . . . . . . . . . . . . . . . . . . . . . . . . . . . . . . . . . . . . . . . . . . . . . . . . . . . . . . . . . . . . . . . . . . . . . . . . . . . 1,458 9,419 —
Total expenses . . . . . . . . . . . . . . . . . . . . . . . . . . . . . . . . . . . . . . . . . . . . . . . . . . . . . . . . . . . . . . . . . . . . . . . . . . . . . . . . . . . . . 1,344,988 2,042,651 4,351,955
Net expense recapture (reimbursement) by Advisor (See Note 4) . . . . . . . . . . . . . . . . . . . . . . . . . . . . . . . . . . . . . . . . . . . — (287,982) 14,869Less securities lending credit (See Note 7) . . . . . . . . . . . . . . . . . . . . . . . . . . . . . . . . . . . . . . . . . . . . . . . . . . . . . . . . . . . . . (158,249) (200,313) —
Net expenses . . . . . . . . . . . . . . . . . . . . . . . . . . . . . . . . . . . . . . . . . . . . . . . . . . . . . . . . . . . . . . . . . . . . . . . . . . . . . . . . . . 1,186,739 1,554,356 4,366,824
Net investment income (loss) . . . . . . . . . . . . . . . . . . . . . . . . . . . . . . . . . . . . . . . . . . . . . . . . . . . . . . . . . . . . . . . . . . . . . . . . . 3,208,781 4,970,421 (3,584,243)
NET REALIZED AND UNREALIZED GAIN ON INVESTMENTS:Net realized gain (loss) on:
Investments . . . . . . . . . . . . . . . . . . . . . . . . . . . . . . . . . . . . . . . . . . . . . . . . . . . . . . . . . . . . . . . . . . . . . . . . . . . . . . . . . . . . . 1,135,497 10,412,026 1,267Long-term capital gain distributions received . . . . . . . . . . . . . . . . . . . . . . . . . . . . . . . . . . . . . . . . . . . . . . . . . . . . . . . . . . 348,540 308,617 —Foreign currencies . . . . . . . . . . . . . . . . . . . . . . . . . . . . . . . . . . . . . . . . . . . . . . . . . . . . . . . . . . . . . . . . . . . . . . . . . . . . . . . . — — (73,102)Forward currency contracts . . . . . . . . . . . . . . . . . . . . . . . . . . . . . . . . . . . . . . . . . . . . . . . . . . . . . . . . . . . . . . . . . . . . . . . . . — — 1,172,575Futures contracts . . . . . . . . . . . . . . . . . . . . . . . . . . . . . . . . . . . . . . . . . . . . . . . . . . . . . . . . . . . . . . . . . . . . . . . . . . . . . . . . . — — 30,448,077
Total . . . . . . . . . . . . . . . . . . . . . . . . . . . . . . . . . . . . . . . . . . . . . . . . . . . . . . . . . . . . . . . . . . . . . . . . . . . . . . . . . . . . . . . . 1,484,037 10,720,643 31,548,817
Net change in unrealized appreciation (depreciation) on:Investments . . . . . . . . . . . . . . . . . . . . . . . . . . . . . . . . . . . . . . . . . . . . . . . . . . . . . . . . . . . . . . . . . . . . . . . . . . . . . . . . . . . . . 25,556,751 6,177,140 52,814Foreign currencies . . . . . . . . . . . . . . . . . . . . . . . . . . . . . . . . . . . . . . . . . . . . . . . . . . . . . . . . . . . . . . . . . . . . . . . . . . . . . . . . — — 4,849Forward currency contracts . . . . . . . . . . . . . . . . . . . . . . . . . . . . . . . . . . . . . . . . . . . . . . . . . . . . . . . . . . . . . . . . . . . . . . . . . — — (1,901,107)Futures contracts . . . . . . . . . . . . . . . . . . . . . . . . . . . . . . . . . . . . . . . . . . . . . . . . . . . . . . . . . . . . . . . . . . . . . . . . . . . . . . . . . — — (3,812,134)
Total . . . . . . . . . . . . . . . . . . . . . . . . . . . . . . . . . . . . . . . . . . . . . . . . . . . . . . . . . . . . . . . . . . . . . . . . . . . . . . . . . . . . . . . . 25,556,751 6,177,140 (5,655,578)
Net realized and unrealized gain . . . . . . . . . . . . . . . . . . . . . . . . . . . . . . . . . . . . . . . . . . . . . . . . . . . . . . . . . . . . . . . . . . . . . . . 27,040,788 16,897,783 25,893,239
NET INCREASE IN NET ASSETS RESULTING FROM OPERATIONS . . . . . . . . . . . . . . . . . . . . . . . . . . . . . . . . . . . . . . . $30,249,569 $21,868,204 $22,308,996
1Consolidated Statement of Operations for the period (see Note 3b).
See notes to financial statements.
108

GuideMark® Funds & GuidePath® FundsSTATEMENTS OF OPERATIONS (Continued)For the Year Ended March 31, 2021
ConservativeIncomeFund
IncomeFund
Growth &IncomeFund
INVESTMENT INCOME:Dividend income . . . . . . . . . . . . . . . . . . . . . . . . . . . . . . . . . . . . . . . . . . . . . . . . . . . . . . . . . . . . . . . . . . . . . . . . . . . . . . . . . . . $ 82,732 $ 904,530 $ 1,257,815Interest income . . . . . . . . . . . . . . . . . . . . . . . . . . . . . . . . . . . . . . . . . . . . . . . . . . . . . . . . . . . . . . . . . . . . . . . . . . . . . . . . . . . . . 9,439 389 44,380
Total investment income . . . . . . . . . . . . . . . . . . . . . . . . . . . . . . . . . . . . . . . . . . . . . . . . . . . . . . . . . . . . . . . . . . . . . . . . . . . 92,171 904,919 1,302,195
EXPENSES:Investment advisory fees . . . . . . . . . . . . . . . . . . . . . . . . . . . . . . . . . . . . . . . . . . . . . . . . . . . . . . . . . . . . . . . . . . . . . . . . . . . . . 34,480 153,874 280,968Administrative service fees . . . . . . . . . . . . . . . . . . . . . . . . . . . . . . . . . . . . . . . . . . . . . . . . . . . . . . . . . . . . . . . . . . . . . . . . . . . 24,629 85,486 156,093Legal fees . . . . . . . . . . . . . . . . . . . . . . . . . . . . . . . . . . . . . . . . . . . . . . . . . . . . . . . . . . . . . . . . . . . . . . . . . . . . . . . . . . . . . . . . . 1,183 7,276 27,511Administration fees . . . . . . . . . . . . . . . . . . . . . . . . . . . . . . . . . . . . . . . . . . . . . . . . . . . . . . . . . . . . . . . . . . . . . . . . . . . . . . . . . 1,788 5,176 10,669Fund accounting fees . . . . . . . . . . . . . . . . . . . . . . . . . . . . . . . . . . . . . . . . . . . . . . . . . . . . . . . . . . . . . . . . . . . . . . . . . . . . . . . . 1,736 4,232 10,628Reports to shareholders . . . . . . . . . . . . . . . . . . . . . . . . . . . . . . . . . . . . . . . . . . . . . . . . . . . . . . . . . . . . . . . . . . . . . . . . . . . . . . 1,284 2,536 7,640Trustee fees and expenses . . . . . . . . . . . . . . . . . . . . . . . . . . . . . . . . . . . . . . . . . . . . . . . . . . . . . . . . . . . . . . . . . . . . . . . . . . . . 1,019 3,750 6,329Federal and state registration fees . . . . . . . . . . . . . . . . . . . . . . . . . . . . . . . . . . . . . . . . . . . . . . . . . . . . . . . . . . . . . . . . . . . . . . 24,618 23,014 26,406Custody fees . . . . . . . . . . . . . . . . . . . . . . . . . . . . . . . . . . . . . . . . . . . . . . . . . . . . . . . . . . . . . . . . . . . . . . . . . . . . . . . . . . . . . . . 298 3,391 28,549Audit and tax fees . . . . . . . . . . . . . . . . . . . . . . . . . . . . . . . . . . . . . . . . . . . . . . . . . . . . . . . . . . . . . . . . . . . . . . . . . . . . . . . . . . . 15,005 15,005 20,498Transfer agent fees and expenses . . . . . . . . . . . . . . . . . . . . . . . . . . . . . . . . . . . . . . . . . . . . . . . . . . . . . . . . . . . . . . . . . . . . . . . 4,097 4,390 4,585Compliance fees . . . . . . . . . . . . . . . . . . . . . . . . . . . . . . . . . . . . . . . . . . . . . . . . . . . . . . . . . . . . . . . . . . . . . . . . . . . . . . . . . . . . 300 1,072 1,897Insurance fees . . . . . . . . . . . . . . . . . . . . . . . . . . . . . . . . . . . . . . . . . . . . . . . . . . . . . . . . . . . . . . . . . . . . . . . . . . . . . . . . . . . . . . 181 547 759Miscellaneous expenses . . . . . . . . . . . . . . . . . . . . . . . . . . . . . . . . . . . . . . . . . . . . . . . . . . . . . . . . . . . . . . . . . . . . . . . . . . . . . . 1,503 1,536 1,570Interest expenses . . . . . . . . . . . . . . . . . . . . . . . . . . . . . . . . . . . . . . . . . . . . . . . . . . . . . . . . . . . . . . . . . . . . . . . . . . . . . . . . . . . — 2,762 11,057
Total expenses . . . . . . . . . . . . . . . . . . . . . . . . . . . . . . . . . . . . . . . . . . . . . . . . . . . . . . . . . . . . . . . . . . . . . . . . . . . . . . . . . . . . . 112,121 314,047 595,159
Net expense recapture (reimbursement) by Advisor (See Note 4) . . . . . . . . . . . . . . . . . . . . . . . . . . . . . . . . . . . . . . . . . . . . (38,716) (27,365) (81,402)Less securities lending credit (See Note 7) . . . . . . . . . . . . . . . . . . . . . . . . . . . . . . . . . . . . . . . . . . . . . . . . . . . . . . . . . . . . . (10,356) (13,784) (9,445)
Net expenses . . . . . . . . . . . . . . . . . . . . . . . . . . . . . . . . . . . . . . . . . . . . . . . . . . . . . . . . . . . . . . . . . . . . . . . . . . . . . . . . . . . 63,049 272,898 504,312
Net investment income . . . . . . . . . . . . . . . . . . . . . . . . . . . . . . . . . . . . . . . . . . . . . . . . . . . . . . . . . . . . . . . . . . . . . . . . . . . . . . . 29,122 632,021 797,883
NET REALIZED AND UNREALIZED GAIN ON INVESTMENTS:Net realized gain (loss) on:
Investments . . . . . . . . . . . . . . . . . . . . . . . . . . . . . . . . . . . . . . . . . . . . . . . . . . . . . . . . . . . . . . . . . . . . . . . . . . . . . . . . . . . . . 17,869 920,043 7,825,209Net long-term capital gain distribution received . . . . . . . . . . . . . . . . . . . . . . . . . . . . . . . . . . . . . . . . . . . . . . . . . . . . . . . . . — 4,779 —Written options . . . . . . . . . . . . . . . . . . . . . . . . . . . . . . . . . . . . . . . . . . . . . . . . . . . . . . . . . . . . . . . . . . . . . . . . . . . . . . . . . . . — — 4,077,844Futures contracts . . . . . . . . . . . . . . . . . . . . . . . . . . . . . . . . . . . . . . . . . . . . . . . . . . . . . . . . . . . . . . . . . . . . . . . . . . . . . . . . . — — (2,047,298)
Total . . . . . . . . . . . . . . . . . . . . . . . . . . . . . . . . . . . . . . . . . . . . . . . . . . . . . . . . . . . . . . . . . . . . . . . . . . . . . . . . . . . . . . . . . 17,869 924,822 9,855,755
Net change in unrealized appreciation (depreciation) on:Investments . . . . . . . . . . . . . . . . . . . . . . . . . . . . . . . . . . . . . . . . . . . . . . . . . . . . . . . . . . . . . . . . . . . . . . . . . . . . . . . . . . . . . 30,391 (864,099) 7,462,275Written options . . . . . . . . . . . . . . . . . . . . . . . . . . . . . . . . . . . . . . . . . . . . . . . . . . . . . . . . . . . . . . . . . . . . . . . . . . . . . . . . . . . — — 148,265Futures contracts . . . . . . . . . . . . . . . . . . . . . . . . . . . . . . . . . . . . . . . . . . . . . . . . . . . . . . . . . . . . . . . . . . . . . . . . . . . . . . . . . — — 19,639
Total . . . . . . . . . . . . . . . . . . . . . . . . . . . . . . . . . . . . . . . . . . . . . . . . . . . . . . . . . . . . . . . . . . . . . . . . . . . . . . . . . . . . . . . . . 30,391 (864,099) 7,630,179
Net realized and unrealized gain . . . . . . . . . . . . . . . . . . . . . . . . . . . . . . . . . . . . . . . . . . . . . . . . . . . . . . . . . . . . . . . . . . . . . . . 48,260 60,723 17,485,934
NET INCREASE IN NET ASSETS RESULTING FROM OPERATIONS . . . . . . . . . . . . . . . . . . . . . . . . . . . . . . . . . . . . . . . $ 77,382 $ 692,744 $18,283,817
See notes to financial statements.
109
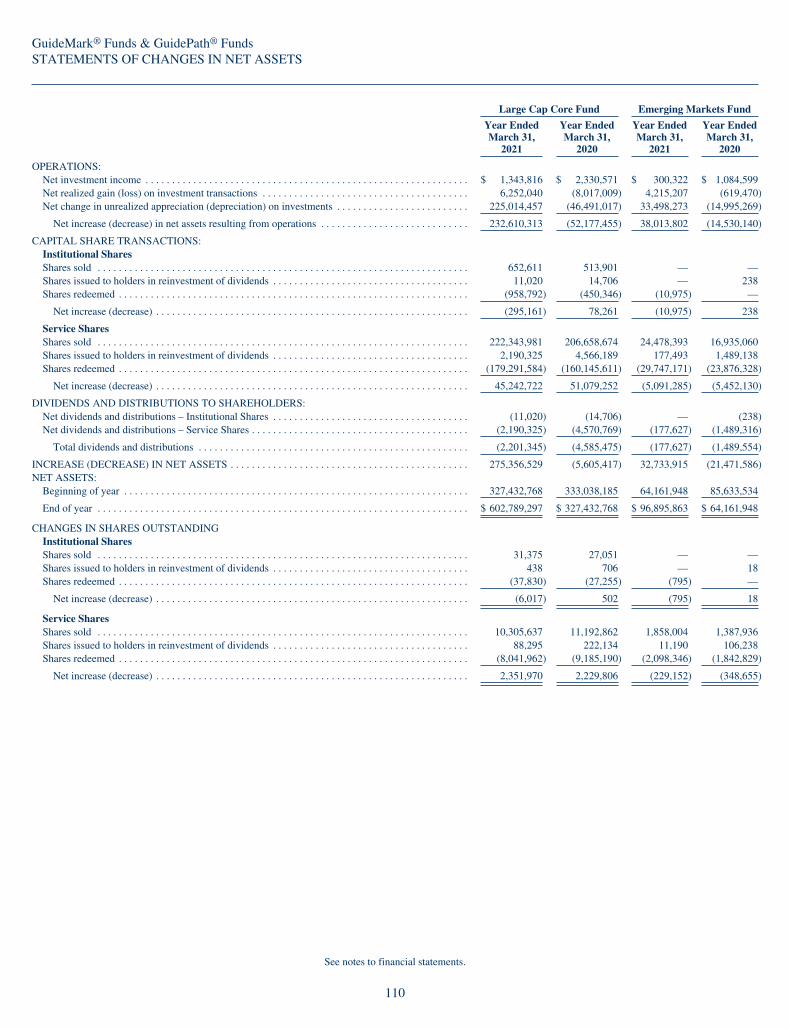
GuideMark® Funds & GuidePath® FundsSTATEMENTS OF CHANGES IN NET ASSETS
Large Cap Core Fund Emerging Markets Fund
Year EndedMarch 31,
2021
Year EndedMarch 31,
2020
Year EndedMarch 31,
2021
Year EndedMarch 31,
2020
OPERATIONS:Net investment income . . . . . . . . . . . . . . . . . . . . . . . . . . . . . . . . . . . . . . . . . . . . . . . . . . . . . . . . . . . . . $ 1,343,816 $ 2,330,571 $ 300,322 $ 1,084,599Net realized gain (loss) on investment transactions . . . . . . . . . . . . . . . . . . . . . . . . . . . . . . . . . . . . . . . 6,252,040 (8,017,009) 4,215,207 (619,470)Net change in unrealized appreciation (depreciation) on investments . . . . . . . . . . . . . . . . . . . . . . . . . 225,014,457 (46,491,017) 33,498,273 (14,995,269)
Net increase (decrease) in net assets resulting from operations . . . . . . . . . . . . . . . . . . . . . . . . . . . . 232,610,313 (52,177,455) 38,013,802 (14,530,140)
CAPITAL SHARE TRANSACTIONS:Institutional SharesShares sold . . . . . . . . . . . . . . . . . . . . . . . . . . . . . . . . . . . . . . . . . . . . . . . . . . . . . . . . . . . . . . . . . . . . . . 652,611 513,901 — —Shares issued to holders in reinvestment of dividends . . . . . . . . . . . . . . . . . . . . . . . . . . . . . . . . . . . . . 11,020 14,706 — 238Shares redeemed . . . . . . . . . . . . . . . . . . . . . . . . . . . . . . . . . . . . . . . . . . . . . . . . . . . . . . . . . . . . . . . . . . (958,792) (450,346) (10,975) —
Net increase (decrease) . . . . . . . . . . . . . . . . . . . . . . . . . . . . . . . . . . . . . . . . . . . . . . . . . . . . . . . . . . . (295,161) 78,261 (10,975) 238
Service SharesShares sold . . . . . . . . . . . . . . . . . . . . . . . . . . . . . . . . . . . . . . . . . . . . . . . . . . . . . . . . . . . . . . . . . . . . . . 222,343,981 206,658,674 24,478,393 16,935,060Shares issued to holders in reinvestment of dividends . . . . . . . . . . . . . . . . . . . . . . . . . . . . . . . . . . . . . 2,190,325 4,566,189 177,493 1,489,138Shares redeemed . . . . . . . . . . . . . . . . . . . . . . . . . . . . . . . . . . . . . . . . . . . . . . . . . . . . . . . . . . . . . . . . . . (179,291,584) (160,145,611) (29,747,171) (23,876,328)
Net increase (decrease) . . . . . . . . . . . . . . . . . . . . . . . . . . . . . . . . . . . . . . . . . . . . . . . . . . . . . . . . . . . 45,242,722 51,079,252 (5,091,285) (5,452,130)
DIVIDENDS AND DISTRIBUTIONS TO SHAREHOLDERS:Net dividends and distributions – Institutional Shares . . . . . . . . . . . . . . . . . . . . . . . . . . . . . . . . . . . . . (11,020) (14,706) — (238)Net dividends and distributions – Service Shares . . . . . . . . . . . . . . . . . . . . . . . . . . . . . . . . . . . . . . . . . (2,190,325) (4,570,769) (177,627) (1,489,316)
Total dividends and distributions . . . . . . . . . . . . . . . . . . . . . . . . . . . . . . . . . . . . . . . . . . . . . . . . . . . (2,201,345) (4,585,475) (177,627) (1,489,554)
INCREASE (DECREASE) IN NET ASSETS . . . . . . . . . . . . . . . . . . . . . . . . . . . . . . . . . . . . . . . . . . . . . 275,356,529 (5,605,417) 32,733,915 (21,471,586)NET ASSETS:
Beginning of year . . . . . . . . . . . . . . . . . . . . . . . . . . . . . . . . . . . . . . . . . . . . . . . . . . . . . . . . . . . . . . . . . 327,432,768 333,038,185 64,161,948 85,633,534
End of year . . . . . . . . . . . . . . . . . . . . . . . . . . . . . . . . . . . . . . . . . . . . . . . . . . . . . . . . . . . . . . . . . . . . . . $ 602,789,297 $ 327,432,768 $ 96,895,863 $ 64,161,948
CHANGES IN SHARES OUTSTANDINGInstitutional SharesShares sold . . . . . . . . . . . . . . . . . . . . . . . . . . . . . . . . . . . . . . . . . . . . . . . . . . . . . . . . . . . . . . . . . . . . . . 31,375 27,051 — —Shares issued to holders in reinvestment of dividends . . . . . . . . . . . . . . . . . . . . . . . . . . . . . . . . . . . . . 438 706 — 18Shares redeemed . . . . . . . . . . . . . . . . . . . . . . . . . . . . . . . . . . . . . . . . . . . . . . . . . . . . . . . . . . . . . . . . . . (37,830) (27,255) (795) —
Net increase (decrease) . . . . . . . . . . . . . . . . . . . . . . . . . . . . . . . . . . . . . . . . . . . . . . . . . . . . . . . . . . . (6,017) 502 (795) 18
Service SharesShares sold . . . . . . . . . . . . . . . . . . . . . . . . . . . . . . . . . . . . . . . . . . . . . . . . . . . . . . . . . . . . . . . . . . . . . . 10,305,637 11,192,862 1,858,004 1,387,936Shares issued to holders in reinvestment of dividends . . . . . . . . . . . . . . . . . . . . . . . . . . . . . . . . . . . . . 88,295 222,134 11,190 106,238Shares redeemed . . . . . . . . . . . . . . . . . . . . . . . . . . . . . . . . . . . . . . . . . . . . . . . . . . . . . . . . . . . . . . . . . . (8,041,962) (9,185,190) (2,098,346) (1,842,829)
Net increase (decrease) . . . . . . . . . . . . . . . . . . . . . . . . . . . . . . . . . . . . . . . . . . . . . . . . . . . . . . . . . . . 2,351,970 2,229,806 (229,152) (348,655)
See notes to financial statements.
110

GuideMark® Funds & GuidePath® FundsSTATEMENTS OF CHANGES IN NET ASSETS (Continued)
Small/Mid Cap Core Fund World ex-US Fund
Year EndedMarch 31,
2021
Year EndedMarch 31,
2020
Year EndedMarch 31,
2021
Year EndedMarch 31,
2020
OPERATIONS:Net investment income (loss) . . . . . . . . . . . . . . . . . . . . . . . . . . . . . . . . . . . . . . . . . . . . . . . . . . . . . . . . . $ (191,611) $ (33,242) $ 1,134,150 $ 2,819,154Net realized gain (loss) on investment transactions . . . . . . . . . . . . . . . . . . . . . . . . . . . . . . . . . . . . . . . . 8,805,646 456,752 284,716 (3,404,293)Net change in unrealized appreciation (depreciation) on investments . . . . . . . . . . . . . . . . . . . . . . . . . . 42,697,054 (15,970,798) 44,997,953 (22,860,422)
Net increase (decrease) in net assets resulting from operations . . . . . . . . . . . . . . . . . . . . . . . . . . . . . 51,311,089 (15,547,288) 46,416,819 (23,445,561)
CAPITAL SHARE TRANSACTIONS:Institutional SharesShares sold . . . . . . . . . . . . . . . . . . . . . . . . . . . . . . . . . . . . . . . . . . . . . . . . . . . . . . . . . . . . . . . . . . . . . . . — — 88,861 42,416Shares issued to holders in reinvestment of dividends . . . . . . . . . . . . . . . . . . . . . . . . . . . . . . . . . . . . . . — — 4,893 2,574Shares redeemed . . . . . . . . . . . . . . . . . . . . . . . . . . . . . . . . . . . . . . . . . . . . . . . . . . . . . . . . . . . . . . . . . . — — (129,265) (470,575)
Net decrease . . . . . . . . . . . . . . . . . . . . . . . . . . . . . . . . . . . . . . . . . . . . . . . . . . . . . . . . . . . . . . . . . . . . — — (35,511) (425,585)
Service SharesShares sold . . . . . . . . . . . . . . . . . . . . . . . . . . . . . . . . . . . . . . . . . . . . . . . . . . . . . . . . . . . . . . . . . . . . . . . 24,856,523 24,717,091 35,293,023 44,121,495Shares issued to holders in reinvestment of dividends . . . . . . . . . . . . . . . . . . . . . . . . . . . . . . . . . . . . . . 1,753,311 986,422 2,711,103 2,534,791Shares redeemed . . . . . . . . . . . . . . . . . . . . . . . . . . . . . . . . . . . . . . . . . . . . . . . . . . . . . . . . . . . . . . . . . . (36,315,873) (20,170,137) (54,196,819) (126,573,250)
Net increase (decrease) . . . . . . . . . . . . . . . . . . . . . . . . . . . . . . . . . . . . . . . . . . . . . . . . . . . . . . . . . . . (9,706,039) 5,533,376 (16,192,693) (79,916,964)
DIVIDENDS AND DISTRIBUTIONS TO SHAREHOLDERS:Net dividends and distributions – Institutional Shares . . . . . . . . . . . . . . . . . . . . . . . . . . . . . . . . . . . . . . — — (4,893) (2,574)Net dividends and distributions – Service Shares . . . . . . . . . . . . . . . . . . . . . . . . . . . . . . . . . . . . . . . . . (1,753,311) (986,422) (2,711,109) (2,539,718)
Total dividends and distributions . . . . . . . . . . . . . . . . . . . . . . . . . . . . . . . . . . . . . . . . . . . . . . . . . . . . (1,753,311) (986,422) (2,716,002) (2,542,292)
INCREASE (DECREASE) IN NET ASSETS . . . . . . . . . . . . . . . . . . . . . . . . . . . . . . . . . . . . . . . . . . . . . 39,851,739 (11,000,334) 27,472,613 (106,330,402)NET ASSETS:
Beginning of year . . . . . . . . . . . . . . . . . . . . . . . . . . . . . . . . . . . . . . . . . . . . . . . . . . . . . . . . . . . . . . . . . . 52,904,611 63,904,945 110,639,397 216,969,799
End of year . . . . . . . . . . . . . . . . . . . . . . . . . . . . . . . . . . . . . . . . . . . . . . . . . . . . . . . . . . . . . . . . . . . . . . . $ 92,756,350 $ 52,904,611 $138,112,010 $ 110,639,397
CHANGES IN SHARES OUTSTANDINGInstitutional SharesShares sold . . . . . . . . . . . . . . . . . . . . . . . . . . . . . . . . . . . . . . . . . . . . . . . . . . . . . . . . . . . . . . . . . . . . . . . — — 9,817 4,693Shares issued to holders in reinvestment of dividends . . . . . . . . . . . . . . . . . . . . . . . . . . . . . . . . . . . . . . — — 470 263Shares redeemed . . . . . . . . . . . . . . . . . . . . . . . . . . . . . . . . . . . . . . . . . . . . . . . . . . . . . . . . . . . . . . . . . . — — (12,467) (53,285)
Net decrease . . . . . . . . . . . . . . . . . . . . . . . . . . . . . . . . . . . . . . . . . . . . . . . . . . . . . . . . . . . . . . . . . . . . — — (2,180) (48,329)
Service SharesShares sold . . . . . . . . . . . . . . . . . . . . . . . . . . . . . . . . . . . . . . . . . . . . . . . . . . . . . . . . . . . . . . . . . . . . . . . 1,544,180 1,868,502 3,900,356 5,127,561Shares issued to holders in reinvestment of dividends . . . . . . . . . . . . . . . . . . . . . . . . . . . . . . . . . . . . . . 96,505 64,012 267,896 267,439Shares redeemed . . . . . . . . . . . . . . . . . . . . . . . . . . . . . . . . . . . . . . . . . . . . . . . . . . . . . . . . . . . . . . . . . . (2,152,163) (1,460,604) (6,093,422) (14,696,494)
Net increase (decrease) . . . . . . . . . . . . . . . . . . . . . . . . . . . . . . . . . . . . . . . . . . . . . . . . . . . . . . . . . . . (511,478) 471,910 (1,925,170) (9,301,494)
See notes to financial statements.
111

GuideMark® Funds & GuidePath® FundsSTATEMENTS OF CHANGES IN NET ASSETS (Continued)
Core Fixed Income Fund Growth Allocation Fund
Year EndedMarch 31,
2021
Year EndedMarch 31,
2020
Year EndedMarch 31,
2021
Year EndedMarch 31,
2020
OPERATIONS:Net investment income . . . . . . . . . . . . . . . . . . . . . . . . . . . . . . . . . . . . . . . . . . . . . . . . . . . . . . . . . . . $ 1,695,031 $ 2,439,710 $ 4,358,037 $ 9,295,484Net realized gain on investment transactions . . . . . . . . . . . . . . . . . . . . . . . . . . . . . . . . . . . . . . . . . . 3,274,516 2,684,610 27,765,529 2,955,907Net change in unrealized appreciation (depreciation) on investments . . . . . . . . . . . . . . . . . . . . . . . (2,477,392) 4,413,771 362,168,372 (106,645,627)
Net increase (decrease) in net assets resulting from operations . . . . . . . . . . . . . . . . . . . . . . . . . . 2,492,155 9,538,091 394,291,938 (94,394,236)
CAPITAL SHARE TRANSACTIONS:Institutional SharesShares sold . . . . . . . . . . . . . . . . . . . . . . . . . . . . . . . . . . . . . . . . . . . . . . . . . . . . . . . . . . . . . . . . . . . . . — — 1,056,916 1,182,389Shares issued to holders in reinvestment of dividends . . . . . . . . . . . . . . . . . . . . . . . . . . . . . . . . . . . — — 130,543 92,823Shares redeemed . . . . . . . . . . . . . . . . . . . . . . . . . . . . . . . . . . . . . . . . . . . . . . . . . . . . . . . . . . . . . . . . — — (4,797,400) (1,738,209)
Net decrease . . . . . . . . . . . . . . . . . . . . . . . . . . . . . . . . . . . . . . . . . . . . . . . . . . . . . . . . . . . . . . . . . . — — (3,609,941) (462,997)
Service SharesShares sold . . . . . . . . . . . . . . . . . . . . . . . . . . . . . . . . . . . . . . . . . . . . . . . . . . . . . . . . . . . . . . . . . . . . . 93,103,633 48,416,876 314,130,015 359,009,853Shares issued to holders in reinvestment of dividends . . . . . . . . . . . . . . . . . . . . . . . . . . . . . . . . . . . 5,600,988 1,893,151 18,559,997 10,362,363Shares redeemed . . . . . . . . . . . . . . . . . . . . . . . . . . . . . . . . . . . . . . . . . . . . . . . . . . . . . . . . . . . . . . . . (42,948,776) (55,360,113) (370,911,135) (313,472,188)
Net increase (decrease) . . . . . . . . . . . . . . . . . . . . . . . . . . . . . . . . . . . . . . . . . . . . . . . . . . . . . . . . . 55,755,845 (5,050,086) (38,221,123) 55,900,028
DIVIDENDS AND DISTRIBUTIONS TO SHAREHOLDERS:Net dividends and distributions – Institutional Shares . . . . . . . . . . . . . . . . . . . . . . . . . . . . . . . . . . . — — (130,543) (92,823)Net dividends and distributions – Service Shares . . . . . . . . . . . . . . . . . . . . . . . . . . . . . . . . . . . . . . . (5,601,028) (1,893,282) (18,559,997) (10,362,363)
Total dividends and distributions . . . . . . . . . . . . . . . . . . . . . . . . . . . . . . . . . . . . . . . . . . . . . . . . . . (5,601,028) (1,893,282) (18,690,540) (10,455,186)
INCREASE (DECREASE) IN NET ASSETS . . . . . . . . . . . . . . . . . . . . . . . . . . . . . . . . . . . . . . . . . . . 52,646,972 2,594,723 333,770,334 (49,412,391)NET ASSETS:
Beginning of year . . . . . . . . . . . . . . . . . . . . . . . . . . . . . . . . . . . . . . . . . . . . . . . . . . . . . . . . . . . . . . . 135,386,961 132,792,238 744,352,608 793,764,999
End of year . . . . . . . . . . . . . . . . . . . . . . . . . . . . . . . . . . . . . . . . . . . . . . . . . . . . . . . . . . . . . . . . . . . . . $188,033,933 $135,386,961 $1,078,122,942 $ 744,352,608
CHANGES IN SHARES OUTSTANDINGInstitutional SharesShares sold . . . . . . . . . . . . . . . . . . . . . . . . . . . . . . . . . . . . . . . . . . . . . . . . . . . . . . . . . . . . . . . . . . . . . — — 78,493 103,712Shares issued to holders in reinvestment of dividends . . . . . . . . . . . . . . . . . . . . . . . . . . . . . . . . . . . — — 8,720 7,252Shares redeemed . . . . . . . . . . . . . . . . . . . . . . . . . . . . . . . . . . . . . . . . . . . . . . . . . . . . . . . . . . . . . . . . — — (338,046) (148,558)
Net decrease . . . . . . . . . . . . . . . . . . . . . . . . . . . . . . . . . . . . . . . . . . . . . . . . . . . . . . . . . . . . . . . . . . — — (250,833) (37,594)
Service SharesShares sold . . . . . . . . . . . . . . . . . . . . . . . . . . . . . . . . . . . . . . . . . . . . . . . . . . . . . . . . . . . . . . . . . . . . . 9,269,060 5,049,690 23,367,321 31,144,526Shares issued to holders in reinvestment of dividends . . . . . . . . . . . . . . . . . . . . . . . . . . . . . . . . . . . 556,486 197,922 1,249,074 814,523Shares redeemed . . . . . . . . . . . . . . . . . . . . . . . . . . . . . . . . . . . . . . . . . . . . . . . . . . . . . . . . . . . . . . . . (4,258,071) (5,756,218) (29,389,992) (27,109,951)
Net increase (decrease) . . . . . . . . . . . . . . . . . . . . . . . . . . . . . . . . . . . . . . . . . . . . . . . . . . . . . . . . . 5,567,475 (508,606) (4,773,597) 4,849,098
See notes to financial statements.
112
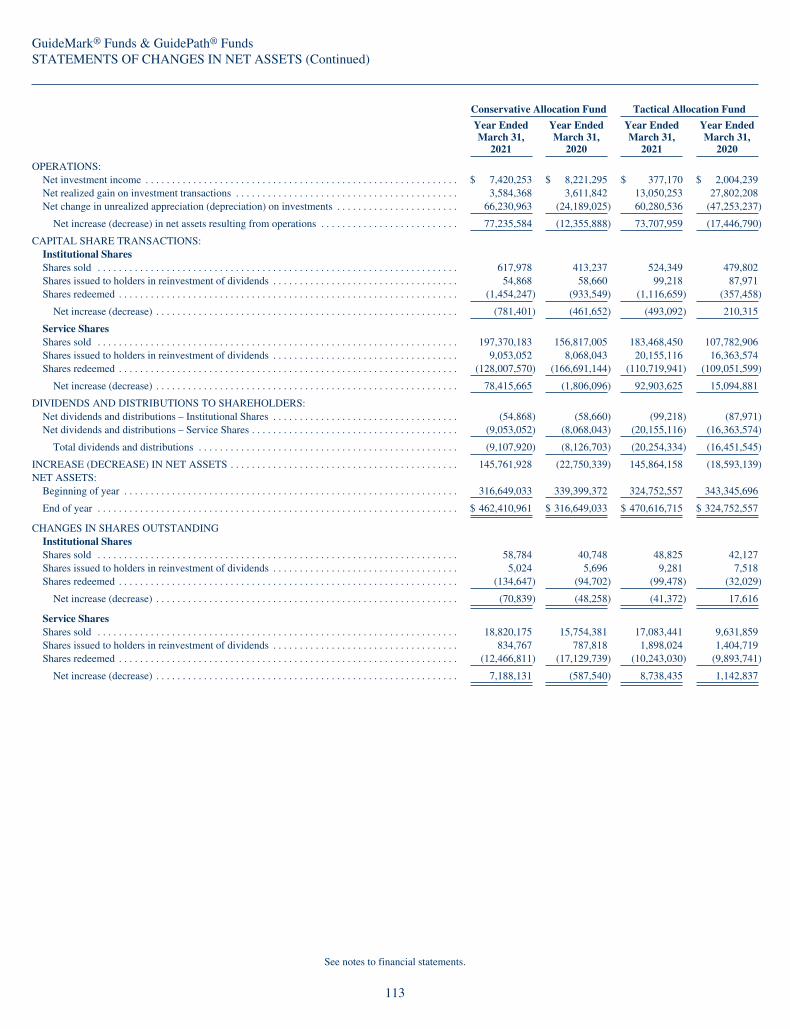
GuideMark® Funds & GuidePath® FundsSTATEMENTS OF CHANGES IN NET ASSETS (Continued)
Conservative Allocation Fund Tactical Allocation Fund
Year EndedMarch 31,
2021
Year EndedMarch 31,
2020
Year EndedMarch 31,
2021
Year EndedMarch 31,
2020
OPERATIONS:Net investment income . . . . . . . . . . . . . . . . . . . . . . . . . . . . . . . . . . . . . . . . . . . . . . . . . . . . . . . . . . . $ 7,420,253 $ 8,221,295 $ 377,170 $ 2,004,239Net realized gain on investment transactions . . . . . . . . . . . . . . . . . . . . . . . . . . . . . . . . . . . . . . . . . . 3,584,368 3,611,842 13,050,253 27,802,208Net change in unrealized appreciation (depreciation) on investments . . . . . . . . . . . . . . . . . . . . . . . 66,230,963 (24,189,025) 60,280,536 (47,253,237)
Net increase (decrease) in net assets resulting from operations . . . . . . . . . . . . . . . . . . . . . . . . . . 77,235,584 (12,355,888) 73,707,959 (17,446,790)
CAPITAL SHARE TRANSACTIONS:Institutional SharesShares sold . . . . . . . . . . . . . . . . . . . . . . . . . . . . . . . . . . . . . . . . . . . . . . . . . . . . . . . . . . . . . . . . . . . . 617,978 413,237 524,349 479,802Shares issued to holders in reinvestment of dividends . . . . . . . . . . . . . . . . . . . . . . . . . . . . . . . . . . . 54,868 58,660 99,218 87,971Shares redeemed . . . . . . . . . . . . . . . . . . . . . . . . . . . . . . . . . . . . . . . . . . . . . . . . . . . . . . . . . . . . . . . . (1,454,247) (933,549) (1,116,659) (357,458)
Net increase (decrease) . . . . . . . . . . . . . . . . . . . . . . . . . . . . . . . . . . . . . . . . . . . . . . . . . . . . . . . . . (781,401) (461,652) (493,092) 210,315
Service SharesShares sold . . . . . . . . . . . . . . . . . . . . . . . . . . . . . . . . . . . . . . . . . . . . . . . . . . . . . . . . . . . . . . . . . . . . 197,370,183 156,817,005 183,468,450 107,782,906Shares issued to holders in reinvestment of dividends . . . . . . . . . . . . . . . . . . . . . . . . . . . . . . . . . . . 9,053,052 8,068,043 20,155,116 16,363,574Shares redeemed . . . . . . . . . . . . . . . . . . . . . . . . . . . . . . . . . . . . . . . . . . . . . . . . . . . . . . . . . . . . . . . . (128,007,570) (166,691,144) (110,719,941) (109,051,599)
Net increase (decrease) . . . . . . . . . . . . . . . . . . . . . . . . . . . . . . . . . . . . . . . . . . . . . . . . . . . . . . . . . 78,415,665 (1,806,096) 92,903,625 15,094,881
DIVIDENDS AND DISTRIBUTIONS TO SHAREHOLDERS:Net dividends and distributions – Institutional Shares . . . . . . . . . . . . . . . . . . . . . . . . . . . . . . . . . . . (54,868) (58,660) (99,218) (87,971)Net dividends and distributions – Service Shares . . . . . . . . . . . . . . . . . . . . . . . . . . . . . . . . . . . . . . . (9,053,052) (8,068,043) (20,155,116) (16,363,574)
Total dividends and distributions . . . . . . . . . . . . . . . . . . . . . . . . . . . . . . . . . . . . . . . . . . . . . . . . . (9,107,920) (8,126,703) (20,254,334) (16,451,545)
INCREASE (DECREASE) IN NET ASSETS . . . . . . . . . . . . . . . . . . . . . . . . . . . . . . . . . . . . . . . . . . . 145,761,928 (22,750,339) 145,864,158 (18,593,139)NET ASSETS:
Beginning of year . . . . . . . . . . . . . . . . . . . . . . . . . . . . . . . . . . . . . . . . . . . . . . . . . . . . . . . . . . . . . . . 316,649,033 339,399,372 324,752,557 343,345,696
End of year . . . . . . . . . . . . . . . . . . . . . . . . . . . . . . . . . . . . . . . . . . . . . . . . . . . . . . . . . . . . . . . . . . . . $ 462,410,961 $ 316,649,033 $ 470,616,715 $ 324,752,557
CHANGES IN SHARES OUTSTANDINGInstitutional SharesShares sold . . . . . . . . . . . . . . . . . . . . . . . . . . . . . . . . . . . . . . . . . . . . . . . . . . . . . . . . . . . . . . . . . . . . 58,784 40,748 48,825 42,127Shares issued to holders in reinvestment of dividends . . . . . . . . . . . . . . . . . . . . . . . . . . . . . . . . . . . 5,024 5,696 9,281 7,518Shares redeemed . . . . . . . . . . . . . . . . . . . . . . . . . . . . . . . . . . . . . . . . . . . . . . . . . . . . . . . . . . . . . . . . (134,647) (94,702) (99,478) (32,029)
Net increase (decrease) . . . . . . . . . . . . . . . . . . . . . . . . . . . . . . . . . . . . . . . . . . . . . . . . . . . . . . . . . (70,839) (48,258) (41,372) 17,616
Service SharesShares sold . . . . . . . . . . . . . . . . . . . . . . . . . . . . . . . . . . . . . . . . . . . . . . . . . . . . . . . . . . . . . . . . . . . . 18,820,175 15,754,381 17,083,441 9,631,859Shares issued to holders in reinvestment of dividends . . . . . . . . . . . . . . . . . . . . . . . . . . . . . . . . . . . 834,767 787,818 1,898,024 1,404,719Shares redeemed . . . . . . . . . . . . . . . . . . . . . . . . . . . . . . . . . . . . . . . . . . . . . . . . . . . . . . . . . . . . . . . . (12,466,811) (17,129,739) (10,243,030) (9,893,741)
Net increase (decrease) . . . . . . . . . . . . . . . . . . . . . . . . . . . . . . . . . . . . . . . . . . . . . . . . . . . . . . . . . 7,188,131 (587,540) 8,738,435 1,142,837
See notes to financial statements.
113
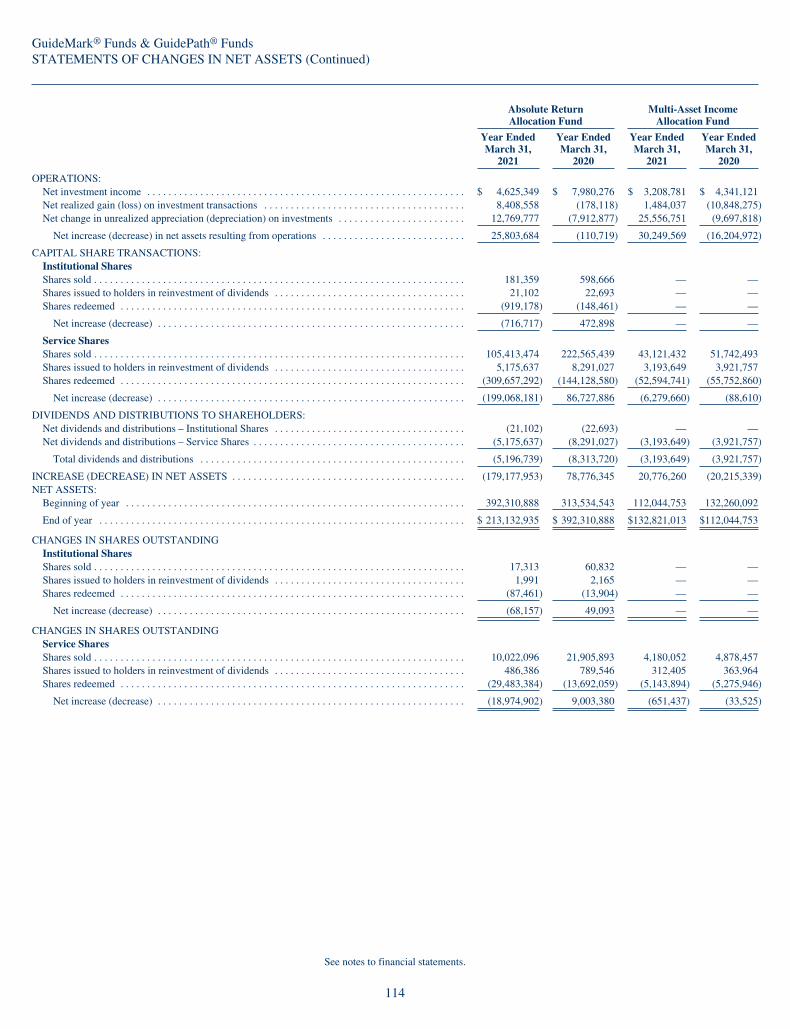
GuideMark® Funds & GuidePath® FundsSTATEMENTS OF CHANGES IN NET ASSETS (Continued)
Absolute ReturnAllocation Fund
Multi-Asset IncomeAllocation Fund
Year EndedMarch 31,
2021
Year EndedMarch 31,
2020
Year EndedMarch 31,
2021
Year EndedMarch 31,
2020
OPERATIONS:Net investment income . . . . . . . . . . . . . . . . . . . . . . . . . . . . . . . . . . . . . . . . . . . . . . . . . . . . . . . . . . . . $ 4,625,349 $ 7,980,276 $ 3,208,781 $ 4,341,121Net realized gain (loss) on investment transactions . . . . . . . . . . . . . . . . . . . . . . . . . . . . . . . . . . . . . . 8,408,558 (178,118) 1,484,037 (10,848,275)Net change in unrealized appreciation (depreciation) on investments . . . . . . . . . . . . . . . . . . . . . . . . 12,769,777 (7,912,877) 25,556,751 (9,697,818)
Net increase (decrease) in net assets resulting from operations . . . . . . . . . . . . . . . . . . . . . . . . . . . 25,803,684 (110,719) 30,249,569 (16,204,972)
CAPITAL SHARE TRANSACTIONS:Institutional SharesShares sold . . . . . . . . . . . . . . . . . . . . . . . . . . . . . . . . . . . . . . . . . . . . . . . . . . . . . . . . . . . . . . . . . . . . . . 181,359 598,666 — —Shares issued to holders in reinvestment of dividends . . . . . . . . . . . . . . . . . . . . . . . . . . . . . . . . . . . . 21,102 22,693 — —Shares redeemed . . . . . . . . . . . . . . . . . . . . . . . . . . . . . . . . . . . . . . . . . . . . . . . . . . . . . . . . . . . . . . . . . (919,178) (148,461) — —
Net increase (decrease) . . . . . . . . . . . . . . . . . . . . . . . . . . . . . . . . . . . . . . . . . . . . . . . . . . . . . . . . . . (716,717) 472,898 — —
Service SharesShares sold . . . . . . . . . . . . . . . . . . . . . . . . . . . . . . . . . . . . . . . . . . . . . . . . . . . . . . . . . . . . . . . . . . . . . . 105,413,474 222,565,439 43,121,432 51,742,493Shares issued to holders in reinvestment of dividends . . . . . . . . . . . . . . . . . . . . . . . . . . . . . . . . . . . . 5,175,637 8,291,027 3,193,649 3,921,757Shares redeemed . . . . . . . . . . . . . . . . . . . . . . . . . . . . . . . . . . . . . . . . . . . . . . . . . . . . . . . . . . . . . . . . . (309,657,292) (144,128,580) (52,594,741) (55,752,860)
Net increase (decrease) . . . . . . . . . . . . . . . . . . . . . . . . . . . . . . . . . . . . . . . . . . . . . . . . . . . . . . . . . . (199,068,181) 86,727,886 (6,279,660) (88,610)
DIVIDENDS AND DISTRIBUTIONS TO SHAREHOLDERS:Net dividends and distributions – Institutional Shares . . . . . . . . . . . . . . . . . . . . . . . . . . . . . . . . . . . . (21,102) (22,693) — —Net dividends and distributions – Service Shares . . . . . . . . . . . . . . . . . . . . . . . . . . . . . . . . . . . . . . . . (5,175,637) (8,291,027) (3,193,649) (3,921,757)
Total dividends and distributions . . . . . . . . . . . . . . . . . . . . . . . . . . . . . . . . . . . . . . . . . . . . . . . . . . (5,196,739) (8,313,720) (3,193,649) (3,921,757)
INCREASE (DECREASE) IN NET ASSETS . . . . . . . . . . . . . . . . . . . . . . . . . . . . . . . . . . . . . . . . . . . . (179,177,953) 78,776,345 20,776,260 (20,215,339)NET ASSETS:
Beginning of year . . . . . . . . . . . . . . . . . . . . . . . . . . . . . . . . . . . . . . . . . . . . . . . . . . . . . . . . . . . . . . . . 392,310,888 313,534,543 112,044,753 132,260,092
End of year . . . . . . . . . . . . . . . . . . . . . . . . . . . . . . . . . . . . . . . . . . . . . . . . . . . . . . . . . . . . . . . . . . . . . $ 213,132,935 $ 392,310,888 $132,821,013 $112,044,753
CHANGES IN SHARES OUTSTANDINGInstitutional SharesShares sold . . . . . . . . . . . . . . . . . . . . . . . . . . . . . . . . . . . . . . . . . . . . . . . . . . . . . . . . . . . . . . . . . . . . . . 17,313 60,832 — —Shares issued to holders in reinvestment of dividends . . . . . . . . . . . . . . . . . . . . . . . . . . . . . . . . . . . . 1,991 2,165 — —Shares redeemed . . . . . . . . . . . . . . . . . . . . . . . . . . . . . . . . . . . . . . . . . . . . . . . . . . . . . . . . . . . . . . . . . (87,461) (13,904) — —
Net increase (decrease) . . . . . . . . . . . . . . . . . . . . . . . . . . . . . . . . . . . . . . . . . . . . . . . . . . . . . . . . . . (68,157) 49,093 — —
CHANGES IN SHARES OUTSTANDINGService SharesShares sold . . . . . . . . . . . . . . . . . . . . . . . . . . . . . . . . . . . . . . . . . . . . . . . . . . . . . . . . . . . . . . . . . . . . . . 10,022,096 21,905,893 4,180,052 4,878,457Shares issued to holders in reinvestment of dividends . . . . . . . . . . . . . . . . . . . . . . . . . . . . . . . . . . . . 486,386 789,546 312,405 363,964Shares redeemed . . . . . . . . . . . . . . . . . . . . . . . . . . . . . . . . . . . . . . . . . . . . . . . . . . . . . . . . . . . . . . . . . (29,483,384) (13,692,059) (5,143,894) (5,275,946)
Net increase (decrease) . . . . . . . . . . . . . . . . . . . . . . . . . . . . . . . . . . . . . . . . . . . . . . . . . . . . . . . . . . (18,974,902) 9,003,380 (651,437) (33,525)
See notes to financial statements.
114

GuideMark® Funds & GuidePath® FundsSTATEMENTS OF CHANGES IN NET ASSETS (Continued)
Flexible IncomeAllocation Fund
Managed FuturesStrategy Fund1
Year EndedMarch 31,
2021
Year EndedMarch 31,
2020
Year EndedMarch 31,
2021
Year EndedMarch 31,
2020
OPERATIONS:Net investment income (loss) . . . . . . . . . . . . . . . . . . . . . . . . . . . . . . . . . . . . . . . . . . . . . . . . . . . . . . . $ 4,970,421 $ 2,881,327 $ (3,584,243) $ 248,028Net realized gain (loss) on investment transactions . . . . . . . . . . . . . . . . . . . . . . . . . . . . . . . . . . . . . . 10,720,643 (1,482,272) 31,548,817 15,984,318Net change in unrealized appreciation (depreciation) on investments . . . . . . . . . . . . . . . . . . . . . . . . 6,177,140 (921,236) (5,655,578) 2,830,019
Net increase in net assets resulting from operations . . . . . . . . . . . . . . . . . . . . . . . . . . . . . . . . . . . . 21,868,204 477,819 22,308,996 19,062,365
CAPITAL SHARE TRANSACTIONS:Institutional SharesShares sold . . . . . . . . . . . . . . . . . . . . . . . . . . . . . . . . . . . . . . . . . . . . . . . . . . . . . . . . . . . . . . . . . . . . . 1,496 15,036 883,558 1,103,093Shares issued to holders in reinvestment of dividends . . . . . . . . . . . . . . . . . . . . . . . . . . . . . . . . . . . . 200 1,248 28,507 47,540Shares redeemed . . . . . . . . . . . . . . . . . . . . . . . . . . . . . . . . . . . . . . . . . . . . . . . . . . . . . . . . . . . . . . . . . (31,828) (7,977) (1,729,385) (962,837)
Net increase (decrease) . . . . . . . . . . . . . . . . . . . . . . . . . . . . . . . . . . . . . . . . . . . . . . . . . . . . . . . . . . (30,132) 8,307 (817,320) 187,796
Service SharesShares sold . . . . . . . . . . . . . . . . . . . . . . . . . . . . . . . . . . . . . . . . . . . . . . . . . . . . . . . . . . . . . . . . . . . . . 272,070,564 73,398,512 206,736,848 226,293,387Shares issued to holders in reinvestment of dividends . . . . . . . . . . . . . . . . . . . . . . . . . . . . . . . . . . . . 4,975,041 2,892,886 6,341,510 7,130,028Shares redeemed . . . . . . . . . . . . . . . . . . . . . . . . . . . . . . . . . . . . . . . . . . . . . . . . . . . . . . . . . . . . . . . . . (112,613,106) (35,100,214) (243,151,657) (179,766,240)
Net increase (decrease) . . . . . . . . . . . . . . . . . . . . . . . . . . . . . . . . . . . . . . . . . . . . . . . . . . . . . . . . . . 164,432,499 41,191,184 (30,073,299) 53,657,175
DIVIDENDS AND DISTRIBUTIONS TO SHAREHOLDERS:Net dividends and distributions – Institutional Shares . . . . . . . . . . . . . . . . . . . . . . . . . . . . . . . . . . . . (200) (1,248) (28,507) (47,540)Net dividends and distributions – Service Shares . . . . . . . . . . . . . . . . . . . . . . . . . . . . . . . . . . . . . . . . (4,975,041) (2,892,886) (6,341,510) (7,130,028)
Total dividends and distributions . . . . . . . . . . . . . . . . . . . . . . . . . . . . . . . . . . . . . . . . . . . . . . . . . . (4,975,241) (2,894,134) (6,370,017) (7,177,568)
INCREASE (DECREASE) IN NET ASSETS . . . . . . . . . . . . . . . . . . . . . . . . . . . . . . . . . . . . . . . . . . . . 181,295,330 38,783,176 (14,951,640) 65,729,768NET ASSETS:
Beginning of year . . . . . . . . . . . . . . . . . . . . . . . . . . . . . . . . . . . . . . . . . . . . . . . . . . . . . . . . . . . . . . . . 98,550,533 59,767,357 223,088,828 157,359,060
End of year . . . . . . . . . . . . . . . . . . . . . . . . . . . . . . . . . . . . . . . . . . . . . . . . . . . . . . . . . . . . . . . . . . . . . $ 279,845,863 $ 98,550,533 $ 208,137,188 $ 223,088,828
CHANGES IN SHARES OUTSTANDINGInstitutional SharesShares sold . . . . . . . . . . . . . . . . . . . . . . . . . . . . . . . . . . . . . . . . . . . . . . . . . . . . . . . . . . . . . . . . . . . . . 150 1,554 102,168 124,742Shares issued to holders in reinvestment of dividends . . . . . . . . . . . . . . . . . . . . . . . . . . . . . . . . . . . . 19 133 3,139 5,744Shares redeemed . . . . . . . . . . . . . . . . . . . . . . . . . . . . . . . . . . . . . . . . . . . . . . . . . . . . . . . . . . . . . . . . . (3,083) (830) (192,898) (111,224)
Net increase (decrease) . . . . . . . . . . . . . . . . . . . . . . . . . . . . . . . . . . . . . . . . . . . . . . . . . . . . . . . . . . (2,914) 857 (87,591) 19,262
CHANGES IN SHARES OUTSTANDINGService SharesShares sold . . . . . . . . . . . . . . . . . . . . . . . . . . . . . . . . . . . . . . . . . . . . . . . . . . . . . . . . . . . . . . . . . . . . . 26,497,771 7,620,555 24,150,473 26,297,941Shares issued to holders in reinvestment of dividends . . . . . . . . . . . . . . . . . . . . . . . . . . . . . . . . . . . . 479,935 309,366 714,778 876,571Shares redeemed . . . . . . . . . . . . . . . . . . . . . . . . . . . . . . . . . . . . . . . . . . . . . . . . . . . . . . . . . . . . . . . . . (10,909,327) (3,718,790) (28,114,302) (21,281,209)
Net increase (decrease) . . . . . . . . . . . . . . . . . . . . . . . . . . . . . . . . . . . . . . . . . . . . . . . . . . . . . . . . . . 16,068,379 4,211,131 (3,249,051) 5,893,303
1 Consolidated Statements of Changes in Net Assets (see note 3b).
See notes to financial statements.
115

GuideMark® Funds & GuidePath® FundsSTATEMENTS OF CHANGES IN NET ASSETS (Continued)
Conservative Income Fund Income Fund
Year EndedMarch 31,
2021
Year EndedMarch 31,
2020
Year EndedMarch 31,
2021
Year EndedMarch 31,
2020
OPERATIONS:Net investment income . . . . . . . . . . . . . . . . . . . . . . . . . . . . . . . . . . . . . . . . . . . . . . . . . . . . . . . . . . . . . . . . $ 29,122 $ 81,195 $ 632,021 $ 578,434Net realized gain (loss) on investment transactions . . . . . . . . . . . . . . . . . . . . . . . . . . . . . . . . . . . . . . . . . . 17,869 (99,937) 924,822 (1,891,187)Net change in unrealized appreciation (depreciation) on investments . . . . . . . . . . . . . . . . . . . . . . . . . . . . 30,391 23,476 (864,099) 1,035,114
Net increase (decrease) in net assets resulting from operations . . . . . . . . . . . . . . . . . . . . . . . . . . . . . . . 77,382 4,734 692,744 (277,639)
CAPITAL SHARE TRANSACTIONS:Shares sold . . . . . . . . . . . . . . . . . . . . . . . . . . . . . . . . . . . . . . . . . . . . . . . . . . . . . . . . . . . . . . . . . . . . . . . . . 16,684,553 9,021,060 22,531,050 31,868,029Shares issued to holders in reinvestment of dividends . . . . . . . . . . . . . . . . . . . . . . . . . . . . . . . . . . . . . . . . 33,374 81,578 628,224 589,863Shares redeemed . . . . . . . . . . . . . . . . . . . . . . . . . . . . . . . . . . . . . . . . . . . . . . . . . . . . . . . . . . . . . . . . . . . . . (7,560,561) (3,274,503) (17,686,947) (2,715,144)
Net increase . . . . . . . . . . . . . . . . . . . . . . . . . . . . . . . . . . . . . . . . . . . . . . . . . . . . . . . . . . . . . . . . . . . . . . . 9,157,366 5,828,135 5,472,327 29,742,748
DIVIDENDS AND DISTRIBUTIONS TO SHAREHOLDERS:Net dividends and distributions . . . . . . . . . . . . . . . . . . . . . . . . . . . . . . . . . . . . . . . . . . . . . . . . . . . . . . . . . (33,374) (81,578) (628,224) (589,863)
Total dividends and distributions . . . . . . . . . . . . . . . . . . . . . . . . . . . . . . . . . . . . . . . . . . . . . . . . . . . . . . (33,374) (81,578) (628,224) (589,863)
INCREASE IN NET ASSETS . . . . . . . . . . . . . . . . . . . . . . . . . . . . . . . . . . . . . . . . . . . . . . . . . . . . . . . . . . . . 9,201,374 5,751,291 5,536,847 28,875,246NET ASSETS:
Beginning of year . . . . . . . . . . . . . . . . . . . . . . . . . . . . . . . . . . . . . . . . . . . . . . . . . . . . . . . . . . . . . . . . . . . . 6,724,818 973,527 32,494,874 3,619,628
End of year . . . . . . . . . . . . . . . . . . . . . . . . . . . . . . . . . . . . . . . . . . . . . . . . . . . . . . . . . . . . . . . . . . . . . . . . . $15,926,192 $ 6,724,818 $ 38,031,721 $32,494,874
CHANGES IN SHARES OUTSTANDINGShares sold . . . . . . . . . . . . . . . . . . . . . . . . . . . . . . . . . . . . . . . . . . . . . . . . . . . . . . . . . . . . . . . . . . . . . . . . . 1,681,782 900,671 2,245,317 3,142,291Shares issued to holders in reinvestment of dividends . . . . . . . . . . . . . . . . . . . . . . . . . . . . . . . . . . . . . . . . 3,365 8,153 62,466 58,174Shares redeemed . . . . . . . . . . . . . . . . . . . . . . . . . . . . . . . . . . . . . . . . . . . . . . . . . . . . . . . . . . . . . . . . . . . . . (761,983) (326,952) (1,782,132) (269,703)
Net increase . . . . . . . . . . . . . . . . . . . . . . . . . . . . . . . . . . . . . . . . . . . . . . . . . . . . . . . . . . . . . . . . . . . . . . . 923,164 581,872 525,651 2,930,762
See notes to financial statements.
116

GuideMark® Funds & GuidePath® FundsSTATEMENTS OF CHANGES IN NET ASSETS (Continued)
Growth & Income Fund
Year EndedMarch 31,
2021
Year EndedMarch 31,
2020
OPERATIONS:Net investment income . . . . . . . . . . . . . . . . . . . . . . . . . . . . . . . . . . . . . . . . . . . . . . . . . . . . . . . . . . . . . . . . . . . . . . . . . . . . . . . . . . . . . . . . . . $ 797,883 $ 454,681Net realized gain (loss) on investment transactions . . . . . . . . . . . . . . . . . . . . . . . . . . . . . . . . . . . . . . . . . . . . . . . . . . . . . . . . . . . . . . . . . . . . 9,855,755 (2,211,753)Net change in unrealized appreciation (depreciation) on investments . . . . . . . . . . . . . . . . . . . . . . . . . . . . . . . . . . . . . . . . . . . . . . . . . . . . . . 7,630,179 (2,484,867)
Net increase (decrease) in net assets resulting from operations . . . . . . . . . . . . . . . . . . . . . . . . . . . . . . . . . . . . . . . . . . . . . . . . . . . . . . . . . 18,283,817 (4,241,939)
CAPITAL SHARE TRANSACTIONS:Shares sold . . . . . . . . . . . . . . . . . . . . . . . . . . . . . . . . . . . . . . . . . . . . . . . . . . . . . . . . . . . . . . . . . . . . . . . . . . . . . . . . . . . . . . . . . . . . . . . . . . . 45,484,222 36,359,310Shares issued to holders in reinvestment of dividends . . . . . . . . . . . . . . . . . . . . . . . . . . . . . . . . . . . . . . . . . . . . . . . . . . . . . . . . . . . . . . . . . . 795,837 394,397Shares redeemed . . . . . . . . . . . . . . . . . . . . . . . . . . . . . . . . . . . . . . . . . . . . . . . . . . . . . . . . . . . . . . . . . . . . . . . . . . . . . . . . . . . . . . . . . . . . . . (10,862,322) (2,708,772)
Net increase . . . . . . . . . . . . . . . . . . . . . . . . . . . . . . . . . . . . . . . . . . . . . . . . . . . . . . . . . . . . . . . . . . . . . . . . . . . . . . . . . . . . . . . . . . . . . . . . 35,417,737 34,044,935
DIVIDENDS AND DISTRIBUTIONS TO SHAREHOLDERS:Net dividends and distributions . . . . . . . . . . . . . . . . . . . . . . . . . . . . . . . . . . . . . . . . . . . . . . . . . . . . . . . . . . . . . . . . . . . . . . . . . . . . . . . . . . . (795,837) (394,397)
Total dividends and distributions . . . . . . . . . . . . . . . . . . . . . . . . . . . . . . . . . . . . . . . . . . . . . . . . . . . . . . . . . . . . . . . . . . . . . . . . . . . . . . . . (795,837) (394,397)
INCREASE IN NET ASSETS . . . . . . . . . . . . . . . . . . . . . . . . . . . . . . . . . . . . . . . . . . . . . . . . . . . . . . . . . . . . . . . . . . . . . . . . . . . . . . . . . . . . . . 52,905,717 29,408,599NET ASSETS:
Beginning of year . . . . . . . . . . . . . . . . . . . . . . . . . . . . . . . . . . . . . . . . . . . . . . . . . . . . . . . . . . . . . . . . . . . . . . . . . . . . . . . . . . . . . . . . . . . . . . 33,927,659 4,519,060
End of year . . . . . . . . . . . . . . . . . . . . . . . . . . . . . . . . . . . . . . . . . . . . . . . . . . . . . . . . . . . . . . . . . . . . . . . . . . . . . . . . . . . . . . . . . . . . . . . . . . . $ 86,833,376 $33,927,659
CHANGES IN SHARES OUTSTANDINGShares sold . . . . . . . . . . . . . . . . . . . . . . . . . . . . . . . . . . . . . . . . . . . . . . . . . . . . . . . . . . . . . . . . . . . . . . . . . . . . . . . . . . . . . . . . . . . . . . . . . . . 4,492,685 3,673,636Shares issued to holders in reinvestment of dividends . . . . . . . . . . . . . . . . . . . . . . . . . . . . . . . . . . . . . . . . . . . . . . . . . . . . . . . . . . . . . . . . . . 75,569 39,418Shares redeemed . . . . . . . . . . . . . . . . . . . . . . . . . . . . . . . . . . . . . . . . . . . . . . . . . . . . . . . . . . . . . . . . . . . . . . . . . . . . . . . . . . . . . . . . . . . . . . (1,027,656) (283,441)
Net increase . . . . . . . . . . . . . . . . . . . . . . . . . . . . . . . . . . . . . . . . . . . . . . . . . . . . . . . . . . . . . . . . . . . . . . . . . . . . . . . . . . . . . . . . . . . . . . . . 3,540,598 3,429,613
See notes to financial statements.
117
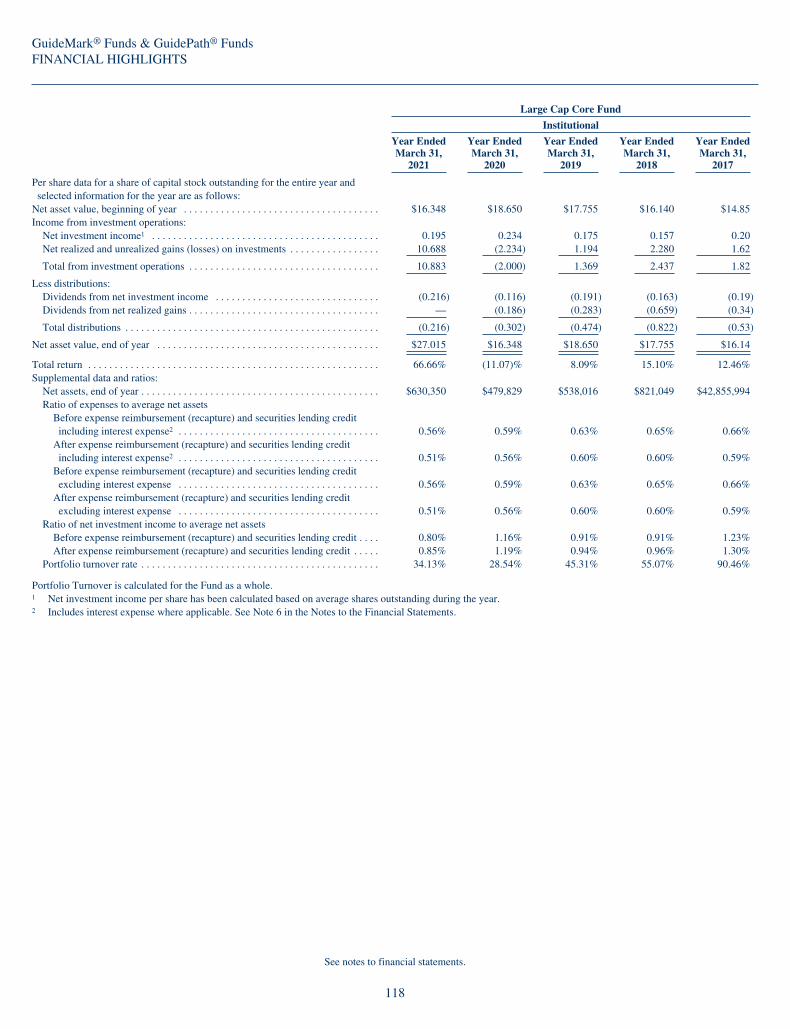
GuideMark® Funds & GuidePath® FundsFINANCIAL HIGHLIGHTS
Large Cap Core Fund
Institutional
Year EndedMarch 31,
2021
Year EndedMarch 31,
2020
Year EndedMarch 31,
2019
Year EndedMarch 31,
2018
Year EndedMarch 31,
2017
Per share data for a share of capital stock outstanding for the entire year andselected information for the year are as follows:
Net asset value, beginning of year . . . . . . . . . . . . . . . . . . . . . . . . . . . . . . . . . . . . . $16.348 $18.650 $17.755 $16.140 $14.85Income from investment operations:
Net investment income1 . . . . . . . . . . . . . . . . . . . . . . . . . . . . . . . . . . . . . . . . . . . 0.195 0.234 0.175 0.157 0.20Net realized and unrealized gains (losses) on investments . . . . . . . . . . . . . . . . . 10.688 (2.234) 1.194 2.280 1.62
Total from investment operations . . . . . . . . . . . . . . . . . . . . . . . . . . . . . . . . . . . . 10.883 (2.000) 1.369 2.437 1.82
Less distributions:Dividends from net investment income . . . . . . . . . . . . . . . . . . . . . . . . . . . . . . . (0.216) (0.116) (0.191) (0.163) (0.19)Dividends from net realized gains . . . . . . . . . . . . . . . . . . . . . . . . . . . . . . . . . . . . — (0.186) (0.283) (0.659) (0.34)
Total distributions . . . . . . . . . . . . . . . . . . . . . . . . . . . . . . . . . . . . . . . . . . . . . . . . (0.216) (0.302) (0.474) (0.822) (0.53)
Net asset value, end of year . . . . . . . . . . . . . . . . . . . . . . . . . . . . . . . . . . . . . . . . . . $27.015 $16.348 $18.650 $17.755 $16.14
Total return . . . . . . . . . . . . . . . . . . . . . . . . . . . . . . . . . . . . . . . . . . . . . . . . . . . . . . . 66.66% (11.07)% 8.09% 15.10% 12.46%Supplemental data and ratios:
Net assets, end of year . . . . . . . . . . . . . . . . . . . . . . . . . . . . . . . . . . . . . . . . . . . . . $630,350 $479,829 $538,016 $821,049 $42,855,994Ratio of expenses to average net assets
Before expense reimbursement (recapture) and securities lending creditincluding interest expense2 . . . . . . . . . . . . . . . . . . . . . . . . . . . . . . . . . . . . . . 0.56% 0.59% 0.63% 0.65% 0.66%
After expense reimbursement (recapture) and securities lending creditincluding interest expense2 . . . . . . . . . . . . . . . . . . . . . . . . . . . . . . . . . . . . . . 0.51% 0.56% 0.60% 0.60% 0.59%
Before expense reimbursement (recapture) and securities lending creditexcluding interest expense . . . . . . . . . . . . . . . . . . . . . . . . . . . . . . . . . . . . . . 0.56% 0.59% 0.63% 0.65% 0.66%
After expense reimbursement (recapture) and securities lending creditexcluding interest expense . . . . . . . . . . . . . . . . . . . . . . . . . . . . . . . . . . . . . . 0.51% 0.56% 0.60% 0.60% 0.59%
Ratio of net investment income to average net assetsBefore expense reimbursement (recapture) and securities lending credit . . . . 0.80% 1.16% 0.91% 0.91% 1.23%After expense reimbursement (recapture) and securities lending credit . . . . . 0.85% 1.19% 0.94% 0.96% 1.30%
Portfolio turnover rate . . . . . . . . . . . . . . . . . . . . . . . . . . . . . . . . . . . . . . . . . . . . . 34.13% 28.54% 45.31% 55.07% 90.46%
Portfolio Turnover is calculated for the Fund as a whole.1 Net investment income per share has been calculated based on average shares outstanding during the year.2 Includes interest expense where applicable. See Note 6 in the Notes to the Financial Statements.
See notes to financial statements.
118
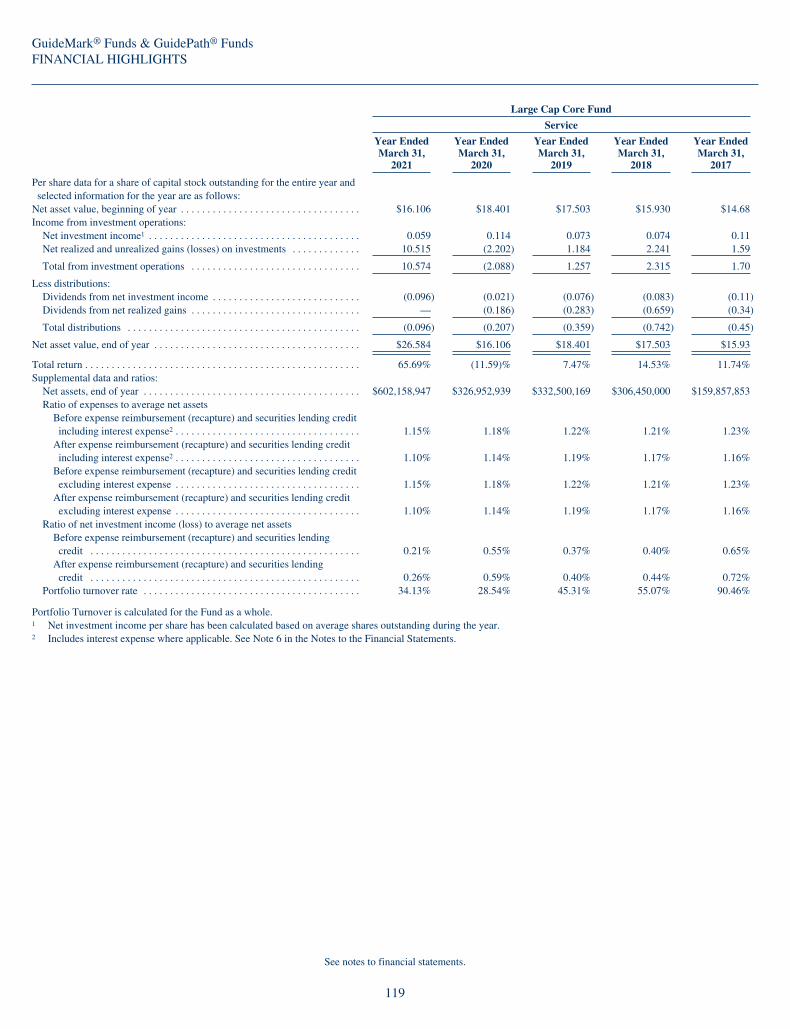
GuideMark® Funds & GuidePath® FundsFINANCIAL HIGHLIGHTS
Large Cap Core Fund
Service
Year EndedMarch 31,
2021
Year EndedMarch 31,
2020
Year EndedMarch 31,
2019
Year EndedMarch 31,
2018
Year EndedMarch 31,
2017
Per share data for a share of capital stock outstanding for the entire year andselected information for the year are as follows:
Net asset value, beginning of year . . . . . . . . . . . . . . . . . . . . . . . . . . . . . . . . . . $16.106 $18.401 $17.503 $15.930 $14.68Income from investment operations:
Net investment income1 . . . . . . . . . . . . . . . . . . . . . . . . . . . . . . . . . . . . . . . . 0.059 0.114 0.073 0.074 0.11Net realized and unrealized gains (losses) on investments . . . . . . . . . . . . . 10.515 (2.202) 1.184 2.241 1.59
Total from investment operations . . . . . . . . . . . . . . . . . . . . . . . . . . . . . . . . 10.574 (2.088) 1.257 2.315 1.70
Less distributions:Dividends from net investment income . . . . . . . . . . . . . . . . . . . . . . . . . . . . (0.096) (0.021) (0.076) (0.083) (0.11)Dividends from net realized gains . . . . . . . . . . . . . . . . . . . . . . . . . . . . . . . . — (0.186) (0.283) (0.659) (0.34)
Total distributions . . . . . . . . . . . . . . . . . . . . . . . . . . . . . . . . . . . . . . . . . . . . (0.096) (0.207) (0.359) (0.742) (0.45)
Net asset value, end of year . . . . . . . . . . . . . . . . . . . . . . . . . . . . . . . . . . . . . . . $26.584 $16.106 $18.401 $17.503 $15.93
Total return . . . . . . . . . . . . . . . . . . . . . . . . . . . . . . . . . . . . . . . . . . . . . . . . . . . . 65.69% (11.59)% 7.47% 14.53% 11.74%Supplemental data and ratios:
Net assets, end of year . . . . . . . . . . . . . . . . . . . . . . . . . . . . . . . . . . . . . . . . . $602,158,947 $326,952,939 $332,500,169 $306,450,000 $159,857,853Ratio of expenses to average net assets
Before expense reimbursement (recapture) and securities lending creditincluding interest expense2 . . . . . . . . . . . . . . . . . . . . . . . . . . . . . . . . . . . 1.15% 1.18% 1.22% 1.21% 1.23%
After expense reimbursement (recapture) and securities lending creditincluding interest expense2 . . . . . . . . . . . . . . . . . . . . . . . . . . . . . . . . . . . 1.10% 1.14% 1.19% 1.17% 1.16%
Before expense reimbursement (recapture) and securities lending creditexcluding interest expense . . . . . . . . . . . . . . . . . . . . . . . . . . . . . . . . . . . 1.15% 1.18% 1.22% 1.21% 1.23%
After expense reimbursement (recapture) and securities lending creditexcluding interest expense . . . . . . . . . . . . . . . . . . . . . . . . . . . . . . . . . . . 1.10% 1.14% 1.19% 1.17% 1.16%
Ratio of net investment income (loss) to average net assetsBefore expense reimbursement (recapture) and securities lendingcredit . . . . . . . . . . . . . . . . . . . . . . . . . . . . . . . . . . . . . . . . . . . . . . . . . . . 0.21% 0.55% 0.37% 0.40% 0.65%
After expense reimbursement (recapture) and securities lendingcredit . . . . . . . . . . . . . . . . . . . . . . . . . . . . . . . . . . . . . . . . . . . . . . . . . . . 0.26% 0.59% 0.40% 0.44% 0.72%
Portfolio turnover rate . . . . . . . . . . . . . . . . . . . . . . . . . . . . . . . . . . . . . . . . . 34.13% 28.54% 45.31% 55.07% 90.46%
Portfolio Turnover is calculated for the Fund as a whole.1 Net investment income per share has been calculated based on average shares outstanding during the year.2 Includes interest expense where applicable. See Note 6 in the Notes to the Financial Statements.
See notes to financial statements.
119
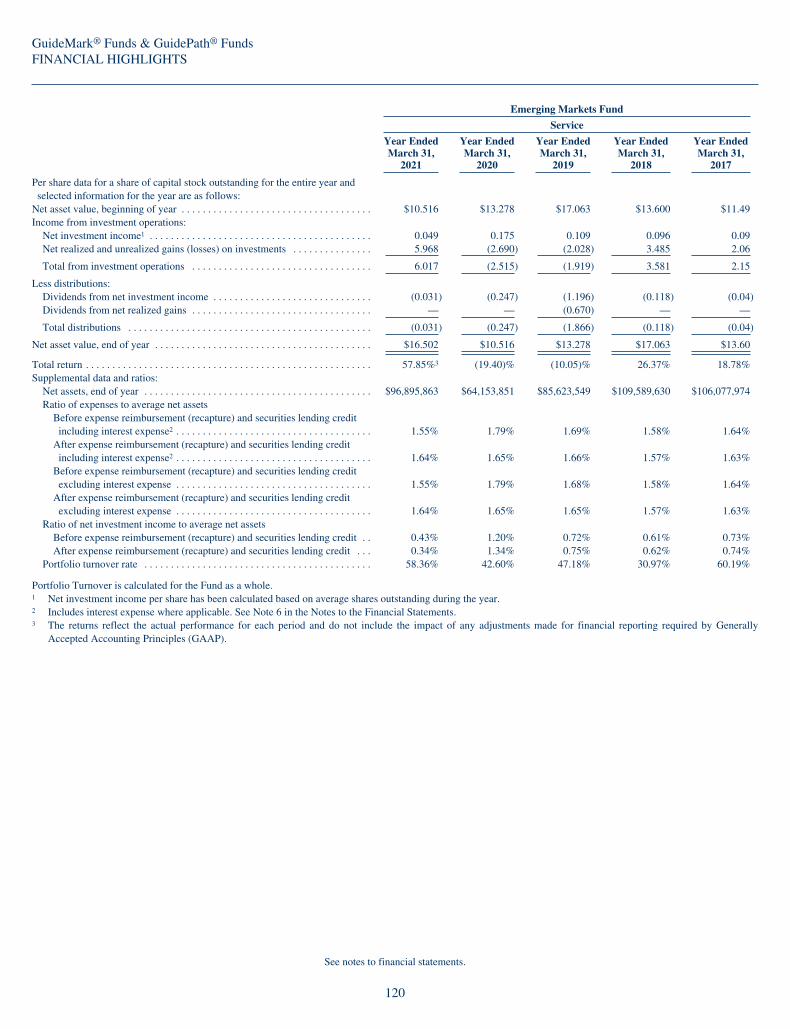
GuideMark® Funds & GuidePath® FundsFINANCIAL HIGHLIGHTS
Emerging Markets Fund
Service
Year EndedMarch 31,
2021
Year EndedMarch 31,
2020
Year EndedMarch 31,
2019
Year EndedMarch 31,
2018
Year EndedMarch 31,
2017
Per share data for a share of capital stock outstanding for the entire year andselected information for the year are as follows:
Net asset value, beginning of year . . . . . . . . . . . . . . . . . . . . . . . . . . . . . . . . . . . . $10.516 $13.278 $17.063 $13.600 $11.49Income from investment operations:
Net investment income1 . . . . . . . . . . . . . . . . . . . . . . . . . . . . . . . . . . . . . . . . . . 0.049 0.175 0.109 0.096 0.09Net realized and unrealized gains (losses) on investments . . . . . . . . . . . . . . . 5.968 (2.690) (2.028) 3.485 2.06
Total from investment operations . . . . . . . . . . . . . . . . . . . . . . . . . . . . . . . . . . 6.017 (2.515) (1.919) 3.581 2.15
Less distributions:Dividends from net investment income . . . . . . . . . . . . . . . . . . . . . . . . . . . . . . (0.031) (0.247) (1.196) (0.118) (0.04)Dividends from net realized gains . . . . . . . . . . . . . . . . . . . . . . . . . . . . . . . . . . — — (0.670) — —
Total distributions . . . . . . . . . . . . . . . . . . . . . . . . . . . . . . . . . . . . . . . . . . . . . . (0.031) (0.247) (1.866) (0.118) (0.04)
Net asset value, end of year . . . . . . . . . . . . . . . . . . . . . . . . . . . . . . . . . . . . . . . . . $16.502 $10.516 $13.278 $17.063 $13.60
Total return . . . . . . . . . . . . . . . . . . . . . . . . . . . . . . . . . . . . . . . . . . . . . . . . . . . . . . 57.85%3 (19.40)% (10.05)% 26.37% 18.78%Supplemental data and ratios:
Net assets, end of year . . . . . . . . . . . . . . . . . . . . . . . . . . . . . . . . . . . . . . . . . . . $96,895,863 $64,153,851 $85,623,549 $109,589,630 $106,077,974Ratio of expenses to average net assets
Before expense reimbursement (recapture) and securities lending creditincluding interest expense2 . . . . . . . . . . . . . . . . . . . . . . . . . . . . . . . . . . . . . 1.55% 1.79% 1.69% 1.58% 1.64%
After expense reimbursement (recapture) and securities lending creditincluding interest expense2 . . . . . . . . . . . . . . . . . . . . . . . . . . . . . . . . . . . . . 1.64% 1.65% 1.66% 1.57% 1.63%
Before expense reimbursement (recapture) and securities lending creditexcluding interest expense . . . . . . . . . . . . . . . . . . . . . . . . . . . . . . . . . . . . . 1.55% 1.79% 1.68% 1.58% 1.64%
After expense reimbursement (recapture) and securities lending creditexcluding interest expense . . . . . . . . . . . . . . . . . . . . . . . . . . . . . . . . . . . . . 1.64% 1.65% 1.65% 1.57% 1.63%
Ratio of net investment income to average net assetsBefore expense reimbursement (recapture) and securities lending credit . . 0.43% 1.20% 0.72% 0.61% 0.73%After expense reimbursement (recapture) and securities lending credit . . . 0.34% 1.34% 0.75% 0.62% 0.74%
Portfolio turnover rate . . . . . . . . . . . . . . . . . . . . . . . . . . . . . . . . . . . . . . . . . . . 58.36% 42.60% 47.18% 30.97% 60.19%
Portfolio Turnover is calculated for the Fund as a whole.1 Net investment income per share has been calculated based on average shares outstanding during the year.2 Includes interest expense where applicable. See Note 6 in the Notes to the Financial Statements.3 The returns reflect the actual performance for each period and do not include the impact of any adjustments made for financial reporting required by Generally
Accepted Accounting Principles (GAAP).
See notes to financial statements.
120
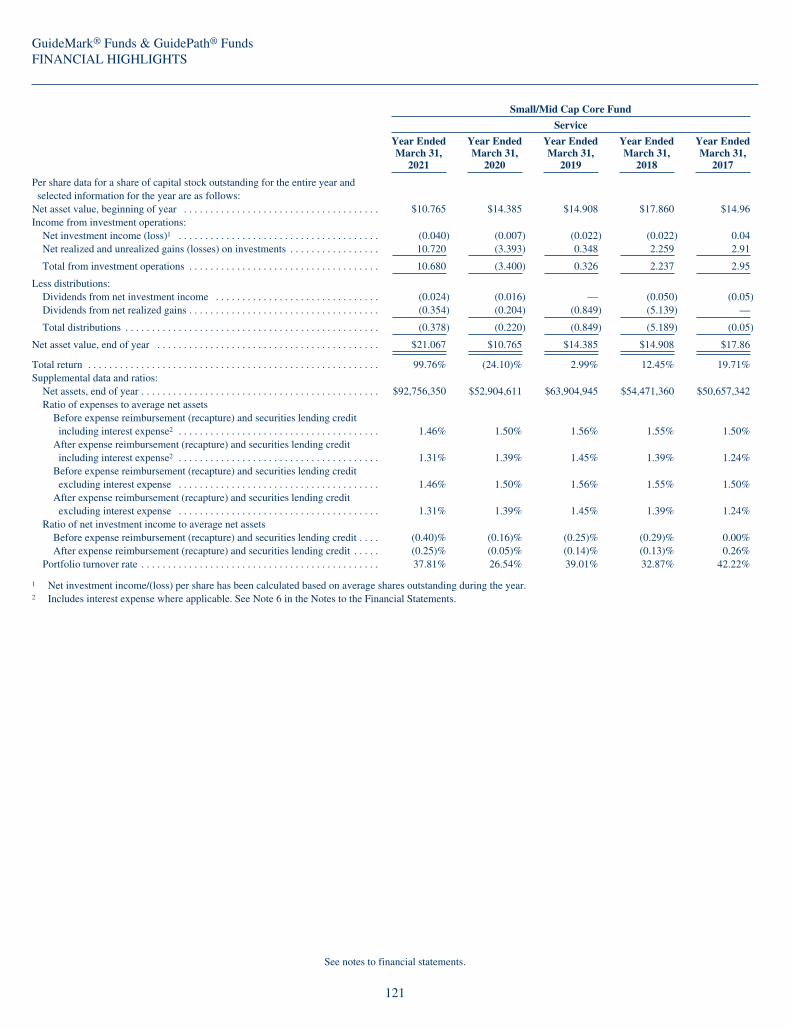
GuideMark® Funds & GuidePath® FundsFINANCIAL HIGHLIGHTS
Small/Mid Cap Core Fund
Service
Year EndedMarch 31,
2021
Year EndedMarch 31,
2020
Year EndedMarch 31,
2019
Year EndedMarch 31,
2018
Year EndedMarch 31,
2017
Per share data for a share of capital stock outstanding for the entire year andselected information for the year are as follows:
Net asset value, beginning of year . . . . . . . . . . . . . . . . . . . . . . . . . . . . . . . . . . . . . $10.765 $14.385 $14.908 $17.860 $14.96Income from investment operations:
Net investment income (loss)1 . . . . . . . . . . . . . . . . . . . . . . . . . . . . . . . . . . . . . . (0.040) (0.007) (0.022) (0.022) 0.04Net realized and unrealized gains (losses) on investments . . . . . . . . . . . . . . . . . 10.720 (3.393) 0.348 2.259 2.91
Total from investment operations . . . . . . . . . . . . . . . . . . . . . . . . . . . . . . . . . . . . 10.680 (3.400) 0.326 2.237 2.95
Less distributions:Dividends from net investment income . . . . . . . . . . . . . . . . . . . . . . . . . . . . . . . (0.024) (0.016) — (0.050) (0.05)Dividends from net realized gains . . . . . . . . . . . . . . . . . . . . . . . . . . . . . . . . . . . . (0.354) (0.204) (0.849) (5.139) —
Total distributions . . . . . . . . . . . . . . . . . . . . . . . . . . . . . . . . . . . . . . . . . . . . . . . . (0.378) (0.220) (0.849) (5.189) (0.05)
Net asset value, end of year . . . . . . . . . . . . . . . . . . . . . . . . . . . . . . . . . . . . . . . . . . $21.067 $10.765 $14.385 $14.908 $17.86
Total return . . . . . . . . . . . . . . . . . . . . . . . . . . . . . . . . . . . . . . . . . . . . . . . . . . . . . . . 99.76% (24.10)% 2.99% 12.45% 19.71%Supplemental data and ratios:
Net assets, end of year . . . . . . . . . . . . . . . . . . . . . . . . . . . . . . . . . . . . . . . . . . . . . $92,756,350 $52,904,611 $63,904,945 $54,471,360 $50,657,342Ratio of expenses to average net assets
Before expense reimbursement (recapture) and securities lending creditincluding interest expense2 . . . . . . . . . . . . . . . . . . . . . . . . . . . . . . . . . . . . . . 1.46% 1.50% 1.56% 1.55% 1.50%
After expense reimbursement (recapture) and securities lending creditincluding interest expense2 . . . . . . . . . . . . . . . . . . . . . . . . . . . . . . . . . . . . . . 1.31% 1.39% 1.45% 1.39% 1.24%
Before expense reimbursement (recapture) and securities lending creditexcluding interest expense . . . . . . . . . . . . . . . . . . . . . . . . . . . . . . . . . . . . . . 1.46% 1.50% 1.56% 1.55% 1.50%
After expense reimbursement (recapture) and securities lending creditexcluding interest expense . . . . . . . . . . . . . . . . . . . . . . . . . . . . . . . . . . . . . . 1.31% 1.39% 1.45% 1.39% 1.24%
Ratio of net investment income to average net assetsBefore expense reimbursement (recapture) and securities lending credit . . . . (0.40)% (0.16)% (0.25)% (0.29)% 0.00%After expense reimbursement (recapture) and securities lending credit . . . . . (0.25)% (0.05)% (0.14)% (0.13)% 0.26%
Portfolio turnover rate . . . . . . . . . . . . . . . . . . . . . . . . . . . . . . . . . . . . . . . . . . . . . 37.81% 26.54% 39.01% 32.87% 42.22%
1 Net investment income/(loss) per share has been calculated based on average shares outstanding during the year.2 Includes interest expense where applicable. See Note 6 in the Notes to the Financial Statements.
See notes to financial statements.
121

GuideMark® Funds & GuidePath® FundsFINANCIAL HIGHLIGHTS
World ex-US Fund
Institutional
Year EndedMarch 31,
2021
Year EndedMarch 31,
2020
Year EndedMarch 31,
2019
Year EndedMarch 31,
2018
Year EndedMarch 31,
2017
Per share data for a share of capital stock outstanding for the entire year andselected information for the year are as follows:
Net asset value, beginning of year . . . . . . . . . . . . . . . . . . . . . . . . . . . . . . . . . . . . . $7.537 $9.100 $9.759 $8.380 $7.74Income from investment operations:
Net investment income1 . . . . . . . . . . . . . . . . . . . . . . . . . . . . . . . . . . . . . . . . . . . 0.125 0.222 0.194 0.243 0.15Net realized and unrealized gains (losses) on investments . . . . . . . . . . . . . . . . . 3.386 (1.610) (0.680) 1.305 0.65
Total from investment operations . . . . . . . . . . . . . . . . . . . . . . . . . . . . . . . . . . . . 3.511 (1.388) (0.486) 1.548 0.80
Less distributions:Dividends from net investment income . . . . . . . . . . . . . . . . . . . . . . . . . . . . . . . (0.280) (0.175) (0.173) (0.169) (0.16)
Total distributions . . . . . . . . . . . . . . . . . . . . . . . . . . . . . . . . . . . . . . . . . . . . . . . . (0.280) (0.175) (0.173) (0.169) (0.16)
Net asset value, end of year . . . . . . . . . . . . . . . . . . . . . . . . . . . . . . . . . . . . . . . . . . $10.768 $7.537 $9.100 $9.759 $8.38
Total return . . . . . . . . . . . . . . . . . . . . . . . . . . . . . . . . . . . . . . . . . . . . . . . . . . . . . . . 46.72% (15.69)% (4.79)% 18.49%3 10.48%Supplemental data and ratios:
Net assets, end of year . . . . . . . . . . . . . . . . . . . . . . . . . . . . . . . . . . . . . . . . . . . . . $88,302 $78,232 $534,233 $822,817 $75,295,608Ratio of expenses to average net assets
Before expense reimbursement (recapture) and securities lending creditincluding interest expense2 . . . . . . . . . . . . . . . . . . . . . . . . . . . . . . . . . . . . . . 0.79% 0.77% 0.80% 0.83%4 0.84%
After expense reimbursement (recapture) and securities lending creditincluding interest expense2 . . . . . . . . . . . . . . . . . . . . . . . . . . . . . . . . . . . . . . 0.79% 0.79% 0.79% 0.79%4 0.79%
Before expense reimbursement (recapture) and securities lending creditexcluding interest expense . . . . . . . . . . . . . . . . . . . . . . . . . . . . . . . . . . . . . . 0.79% 0.77% 0.80% 0.83%4 0.84%
After expense reimbursement (recapture) and securities lending creditexcluding interest expense . . . . . . . . . . . . . . . . . . . . . . . . . . . . . . . . . . . . . . 0.79% 0.79% 0.79% 0.79%4 0.79%
Ratio of net investment income to average net assetsBefore expense reimbursement (recapture) and securities lending credit . . . . 1.30% 2.43% 2.04% 3.01%4 1.83%After expense reimbursement (recapture) and securities lending credit . . . . . 1.30% 2.41% 2.05% 3.05%4 1.88%
Portfolio turnover rate . . . . . . . . . . . . . . . . . . . . . . . . . . . . . . . . . . . . . . . . . . . . . 46.15% 25.52% 59.18% 84.22% 60.68%
Portfolio Turnover is calculated for the Fund as a whole.1 Net investment income per share has been calculated based on average shares outstanding during the year.2 Includes interest expense where applicable. See Note 6 in the Notes to the Financial Statements.3 During the period August 3, 2017 through September 5, 2017 there were no Instutional Shares of the Fund outstanding. Performance information provided for the
Institutional Shares during that period reflects the last calculated net asset value of the Institutional Shares on August 2, 2017, without any adjustments. Had there beenInstitutional Shares outstanding during the period August 3, 2017 through September 5, 2017, their annual returns would have been substantially similar to those ofthe Service Shares of the Fund because they would have been invested in the same portfolio securities, but would have differed to the extent that the classes havedifferent expenses. Because the Service Shares have higher expenses than the Institutional Shares, the returns of the Service Shares would have been lower than thereturns of the Institutional Shares during the same period.
4 Annualized.
See notes to financial statements.
122
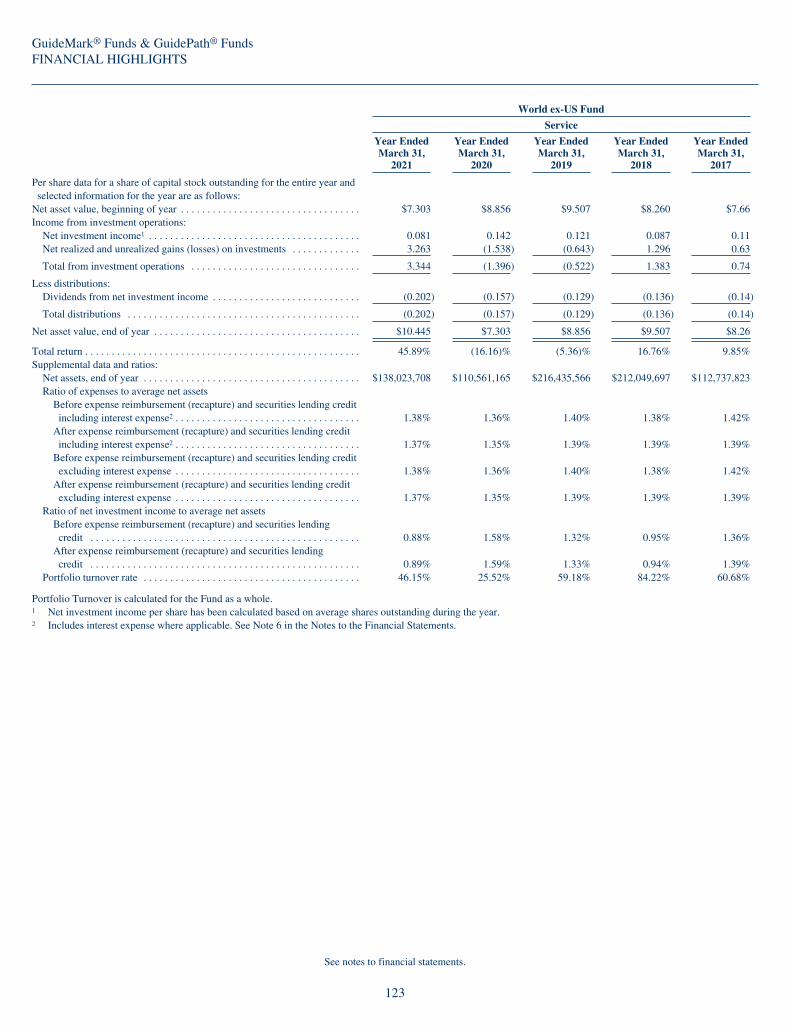
GuideMark® Funds & GuidePath® FundsFINANCIAL HIGHLIGHTS
World ex-US Fund
Service
Year EndedMarch 31,
2021
Year EndedMarch 31,
2020
Year EndedMarch 31,
2019
Year EndedMarch 31,
2018
Year EndedMarch 31,
2017
Per share data for a share of capital stock outstanding for the entire year andselected information for the year are as follows:
Net asset value, beginning of year . . . . . . . . . . . . . . . . . . . . . . . . . . . . . . . . . . $7.303 $8.856 $9.507 $8.260 $7.66Income from investment operations:
Net investment income1 . . . . . . . . . . . . . . . . . . . . . . . . . . . . . . . . . . . . . . . . 0.081 0.142 0.121 0.087 0.11Net realized and unrealized gains (losses) on investments . . . . . . . . . . . . . 3.263 (1.538) (0.643) 1.296 0.63
Total from investment operations . . . . . . . . . . . . . . . . . . . . . . . . . . . . . . . . 3.344 (1.396) (0.522) 1.383 0.74
Less distributions:Dividends from net investment income . . . . . . . . . . . . . . . . . . . . . . . . . . . . (0.202) (0.157) (0.129) (0.136) (0.14)
Total distributions . . . . . . . . . . . . . . . . . . . . . . . . . . . . . . . . . . . . . . . . . . . . (0.202) (0.157) (0.129) (0.136) (0.14)
Net asset value, end of year . . . . . . . . . . . . . . . . . . . . . . . . . . . . . . . . . . . . . . . $10.445 $7.303 $8.856 $9.507 $8.26
Total return . . . . . . . . . . . . . . . . . . . . . . . . . . . . . . . . . . . . . . . . . . . . . . . . . . . . 45.89% (16.16)% (5.36)% 16.76% 9.85%Supplemental data and ratios:
Net assets, end of year . . . . . . . . . . . . . . . . . . . . . . . . . . . . . . . . . . . . . . . . . $138,023,708 $110,561,165 $216,435,566 $212,049,697 $112,737,823Ratio of expenses to average net assets
Before expense reimbursement (recapture) and securities lending creditincluding interest expense2 . . . . . . . . . . . . . . . . . . . . . . . . . . . . . . . . . . . 1.38% 1.36% 1.40% 1.38% 1.42%
After expense reimbursement (recapture) and securities lending creditincluding interest expense2 . . . . . . . . . . . . . . . . . . . . . . . . . . . . . . . . . . . 1.37% 1.35% 1.39% 1.39% 1.39%
Before expense reimbursement (recapture) and securities lending creditexcluding interest expense . . . . . . . . . . . . . . . . . . . . . . . . . . . . . . . . . . . 1.38% 1.36% 1.40% 1.38% 1.42%
After expense reimbursement (recapture) and securities lending creditexcluding interest expense . . . . . . . . . . . . . . . . . . . . . . . . . . . . . . . . . . . 1.37% 1.35% 1.39% 1.39% 1.39%
Ratio of net investment income to average net assetsBefore expense reimbursement (recapture) and securities lendingcredit . . . . . . . . . . . . . . . . . . . . . . . . . . . . . . . . . . . . . . . . . . . . . . . . . . . 0.88% 1.58% 1.32% 0.95% 1.36%
After expense reimbursement (recapture) and securities lendingcredit . . . . . . . . . . . . . . . . . . . . . . . . . . . . . . . . . . . . . . . . . . . . . . . . . . . 0.89% 1.59% 1.33% 0.94% 1.39%
Portfolio turnover rate . . . . . . . . . . . . . . . . . . . . . . . . . . . . . . . . . . . . . . . . . 46.15% 25.52% 59.18% 84.22% 60.68%
Portfolio Turnover is calculated for the Fund as a whole.1 Net investment income per share has been calculated based on average shares outstanding during the year.2 Includes interest expense where applicable. See Note 6 in the Notes to the Financial Statements.
See notes to financial statements.
123

GuideMark® Funds & GuidePath® FundsFINANCIAL HIGHLIGHTS
Core Fixed Income Fund
Service
Year EndedMarch 31,
2021
Year EndedMarch 31,
2020
Year EndedMarch 31,
2019
Year EndedMarch 31,
2018
Year EndedMarch 31,
2017
Per share data for a share of capital stock outstanding for the entire year andselected information for the year are as follows:
Net asset value, beginning of year . . . . . . . . . . . . . . . . . . . . . . . . . . . . . . . . . . $9.798 $9.270 $9.131 $9.320 $9.54Income from investment operations:
Net investment income1 . . . . . . . . . . . . . . . . . . . . . . . . . . . . . . . . . . . . . . . . 0.112 0.170 0.176 0.133 0.12Net realized and unrealized gains (losses) on investments . . . . . . . . . . . . . 0.1413 0.490 0.144 (0.098) (0.11)
Total from investment operations . . . . . . . . . . . . . . . . . . . . . . . . . . . . . . . . 0.253 0.660 0.320 0.035 0.01
Less distributions:Dividends from net investment income . . . . . . . . . . . . . . . . . . . . . . . . . . . . (0.184) (0.108) (0.181) (0.168) (0.17)Dividends from net realized gains . . . . . . . . . . . . . . . . . . . . . . . . . . . . . . . . (0.167) (0.024) — (0.056) (0.06)
Total distributions . . . . . . . . . . . . . . . . . . . . . . . . . . . . . . . . . . . . . . . . . . . . (0.351) (0.132) (0.181) (0.224) (0.23)
Net asset value, end of year . . . . . . . . . . . . . . . . . . . . . . . . . . . . . . . . . . . . . . . $9.700 $9.798 $9.270 $9.131 $9.32
Total return . . . . . . . . . . . . . . . . . . . . . . . . . . . . . . . . . . . . . . . . . . . . . . . . . . . . 2.47% 7.16% 3.57% 0.35% 0.02%Supplemental data and ratios:
Net assets, end of year . . . . . . . . . . . . . . . . . . . . . . . . . . . . . . . . . . . . . . . . . $188,033,933 $135,386,961 $132,792,238 $134,255,059 $137,358,236Ratio of expenses to average net assets
Before expense reimbursement (recapture) and securities lending creditincluding interest expense2 . . . . . . . . . . . . . . . . . . . . . . . . . . . . . . . . . . . 1.28% 1.29% 1.34% 1.38% 1.36%
After expense reimbursement (recapture) and securities lending creditincluding interest expense2 . . . . . . . . . . . . . . . . . . . . . . . . . . . . . . . . . . . 1.19% 1.19% 1.19% 1.26% 1.29%
Before expense reimbursement (recapture) and securities lending creditexcluding interest expense . . . . . . . . . . . . . . . . . . . . . . . . . . . . . . . . . . . 1.28% 1.29% 1.34% 1.38% 1.36%
After expense reimbursement (recapture) and securities lending creditexcluding interest expense . . . . . . . . . . . . . . . . . . . . . . . . . . . . . . . . . . . 1.19% 1.19% 1.19% 1.26% 1.29%
Ratio of net investment income to average net assetsBefore expense reimbursement (recapture) and securities lendingcredit . . . . . . . . . . . . . . . . . . . . . . . . . . . . . . . . . . . . . . . . . . . . . . . . . . . 1.01% 1.67% 1.80% 1.30% 1.14%
After expense reimbursement (recapture) and securities lendingcredit . . . . . . . . . . . . . . . . . . . . . . . . . . . . . . . . . . . . . . . . . . . . . . . . . . . 1.10% 1.77% 1.95% 1.42% 1.21%
Portfolio turnover rate . . . . . . . . . . . . . . . . . . . . . . . . . . . . . . . . . . . . . . . . . 283.45% 278.67% 239.11% 193.12% 164.81%
1 Net investment income/(loss) per share has been calculated based on average shares outstanding during the year.2 Includes interest expense where applicable. See Note 6 in the Notes to the Financial Statements.3 Realized and unrealized gains and losses per shares in this caption are balancing amounts necessary to reconcile the change in net asset value per share for the year,
and may not reconcile with aggregate gains and losses in the Statement of Operations due to share transactions for the year.
See notes to financial statements.
124

GuideMark® Funds & GuidePath® FundsFINANCIAL HIGHLIGHTS
Growth Allocation Fund
Institutional
Year EndedMarch 31,
2021
Year EndedMarch 31,
2020
Year EndedMarch 31,
2019
Year EndedMarch 31,
2018
Year EndedMarch 31,
2017
Per share data for a share of capital stock outstanding for the entire year andselected information for the year are as follows:
Net asset value, beginning of year . . . . . . . . . . . . . . . . . . . . . . . . . . . . . . . . . . . . . $10.139 $11.553 $11.534 $11.340 $10.46Income from investment operations:
Net investment income1 . . . . . . . . . . . . . . . . . . . . . . . . . . . . . . . . . . . . . . . . . . . 0.140 0.199 0.227 0.236 0.19Net realized and unrealized gains (losses) on investments . . . . . . . . . . . . . . . . . 5.843 (1.407) (0.003)5 1.466 1.20
Total from investment operations . . . . . . . . . . . . . . . . . . . . . . . . . . . . . . . . . . . . 5.983 (1.208) 0.224 1.702 1.39
Less distributions:Dividends from net investment income . . . . . . . . . . . . . . . . . . . . . . . . . . . . . . . (0.147) (0.206) (0.193) (0.210) (0.20)Dividends from net realized gains . . . . . . . . . . . . . . . . . . . . . . . . . . . . . . . . . . . . (0.199) — (0.012) (1.298) (0.31)
Total distributions . . . . . . . . . . . . . . . . . . . . . . . . . . . . . . . . . . . . . . . . . . . . . . . . (0.346) (0.206) (0.205) (1.508) (0.51)
Net asset value, end of year . . . . . . . . . . . . . . . . . . . . . . . . . . . . . . . . . . . . . . . . . . $15.776 $10.139 $11.553 $11.534 $11.34
Total return . . . . . . . . . . . . . . . . . . . . . . . . . . . . . . . . . . . . . . . . . . . . . . . . . . . . . . . 59.19% (10.82)% 2.22% 14.90% 13.54%Supplemental data and ratios:
Net assets, end of year . . . . . . . . . . . . . . . . . . . . . . . . . . . . . . . . . . . . . . . . . . . . . $2,892,788 $4,402,611 $5,450,557 $6,646,937 $13,176,782Ratio of expenses to average net assets2
Before expense reimbursement (recapture) and securities lending creditincluding interest expense3 . . . . . . . . . . . . . . . . . . . . . . . . . . . . . . . . . . . . . . 0.34% 0.38% 0.40% 0.40% 0.42%
After expense reimbursement (recapture) and securities lending creditincluding interest expense3 . . . . . . . . . . . . . . . . . . . . . . . . . . . . . . . . . . . . . . 0.30% 0.33% 0.35% 0.35% 0.32%
Before expense reimbursement (recapture) and securities lending creditexcluding interest expense . . . . . . . . . . . . . . . . . . . . . . . . . . . . . . . . . . . . . . 0.34% 0.38% 0.39% 0.40% 0.42%
After expense reimbursement (recapture) and securities lending creditexcluding interest expense . . . . . . . . . . . . . . . . . . . . . . . . . . . . . . . . . . . . . . 0.30% 0.33% 0.34% 0.35% 0.32%
Ratio of net investment income to average net assets4
Before expense reimbursement (recapture) and securities lending credit . . . . 0.99% 1.60% 1.92% 1.91% 1.64%After expense reimbursement (recapture) and securities lending credit . . . . . 1.03% 1.65% 1.97% 1.96% 1.74%
Portfolio turnover rate . . . . . . . . . . . . . . . . . . . . . . . . . . . . . . . . . . . . . . . . . . . . . 39.58% 37.80% 53.89% 70.47% 42.81%
Portfolio Turnover is calculated for the Fund as a whole.1 Net investment income per share has been calculated based on average shares outstanding during the year.2 These ratios exclude the impact of the expenses of the underlying investment companies and exchange-traded funds in which the Fund invests.3 Includes interest expense where applicable. See Note 6 in the Notes to the Financial Statements.4 Recognition of the net investment income by the Fund is affected by the timing of the declaration of dividends by the underlying investment companies and exchange-
traded funds in which the Fund invests.5 Realized and unrealized gains and losses per shares in this caption are balancing amounts necessary to reconcile the change in net asset value per share for the year,
and may not reconcile with aggregate gains and losses in the Statement of Operations due to share transactions for the year.
See notes to financial statements.
125

GuideMark® Funds & GuidePath® FundsFINANCIAL HIGHLIGHTS
Growth Allocation Fund
Service
Year EndedMarch 31,
2021
Year EndedMarch 31,
2020
Year EndedMarch 31,
2019
Year EndedMarch 31,
2018
Year EndedMarch 31,
2017
Per share data for a share of capital stock outstanding for the entire yearand selected information for the year are as follows:
Net asset value, beginning of year . . . . . . . . . . . . . . . . . . . . . . . . . . . . . . . . $10.062 $11.477 $11.458 $11.290 $10.42Income from investment operations:
Net investment income1 . . . . . . . . . . . . . . . . . . . . . . . . . . . . . . . . . . . . . . 0.064 0.128 0.160 0.152 0.12Net realized and unrealized gains (losses) on investments . . . . . . . . . . . . 5.780 (1.402) 0.0035 1.467 1.20
Total from investment operations . . . . . . . . . . . . . . . . . . . . . . . . . . . . . . . 5.844 (1.274) 0.163 1.619 1.32
Less distributions:Dividends from net investment income . . . . . . . . . . . . . . . . . . . . . . . . . . (0.072) (0.141) (0.132) (0.153) (0.14)Dividends from net realized gains . . . . . . . . . . . . . . . . . . . . . . . . . . . . . . (0.198) — (0.012) (1.298) (0.31)
Total distributions . . . . . . . . . . . . . . . . . . . . . . . . . . . . . . . . . . . . . . . . . . . (0.270) (0.141) (0.144) (1.451) (0.45)
Net asset value, end of year . . . . . . . . . . . . . . . . . . . . . . . . . . . . . . . . . . . . . $15.636 $10.062 $11.477 $11.458 $11.29
Total return . . . . . . . . . . . . . . . . . . . . . . . . . . . . . . . . . . . . . . . . . . . . . . . . . . 58.23% (11.35)% 1.61% 14.22% 12.91%Supplemental data and ratios:
Net assets, end of year . . . . . . . . . . . . . . . . . . . . . . . . . . . . . . . . . . . . . . . $1,075,230,154 $739,949,997 $788,314,442 $611,928,879 $551,141,139Ratio of expenses to average net assets2
Before expense reimbursement (recapture) and securities lendingcredit including interest expense3 . . . . . . . . . . . . . . . . . . . . . . . . . . . . 0.94% 0.97% 1.00% 1.00% 1.01%
After expense reimbursement (recapture) and securities lending creditincluding interest expense3 . . . . . . . . . . . . . . . . . . . . . . . . . . . . . . . . . 0.90% 0.93% 0.95% 0.95% 0.92%
Before expense reimbursement (recapture) and securities lendingcredit excluding interest expense . . . . . . . . . . . . . . . . . . . . . . . . . . . . 0.94% 0.97% 0.99% 0.99% 1.01%
After expense reimbursement (recapture) and securities lending creditexcluding interest expense . . . . . . . . . . . . . . . . . . . . . . . . . . . . . . . . . 0.90% 0.93% 0.94% 0.94% 0.92%
Ratio of net investment income to average net assets4
Before expense reimbursement (recapture) and securities lendingcredit . . . . . . . . . . . . . . . . . . . . . . . . . . . . . . . . . . . . . . . . . . . . . . . . . . 0.44% 1.03% 1.35% 1.22% 0.99%
After expense reimbursement (recapture) and securities lendingcredit . . . . . . . . . . . . . . . . . . . . . . . . . . . . . . . . . . . . . . . . . . . . . . . . . . 0.48% 1.07% 1.40% 1.27% 1.08%
Portfolio turnover rate . . . . . . . . . . . . . . . . . . . . . . . . . . . . . . . . . . . . . . . . 39.58% 37.80% 53.89% 70.47% 42.81%
Portfolio Turnover is calculated for the Fund as a whole.1 Net investment income per share has been calculated based on average shares outstanding during the year.2 These ratios exclude the impact of the expenses of the underlying investment companies and exchange-traded funds in which the Fund invests.3 Includes interest expense where applicable. See Note 6 in the Notes to the Financial Statements.4 Recognition of the net investment income by the Fund is affected by the timing of the declaration of dividends by the underlying investment companies and exchange-
traded funds in which the Fund invests.5 Realized and unrealized gains and losses per shares in this caption are balancing amounts necessary to reconcile the change in net asset value per share for the year,
and may not reconcile with aggregate gains and losses in the Statement of Operations due to share transactions for the year.
See notes to financial statements.
126
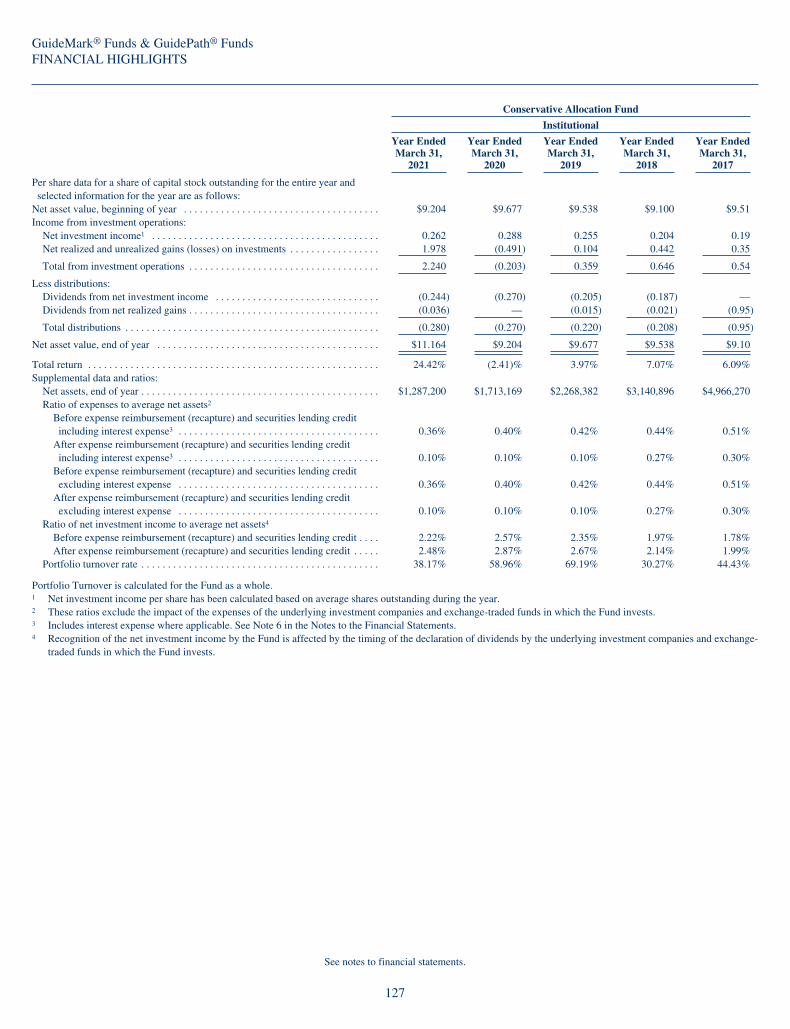
GuideMark® Funds & GuidePath® FundsFINANCIAL HIGHLIGHTS
Conservative Allocation Fund
Institutional
Year EndedMarch 31,
2021
Year EndedMarch 31,
2020
Year EndedMarch 31,
2019
Year EndedMarch 31,
2018
Year EndedMarch 31,
2017
Per share data for a share of capital stock outstanding for the entire year andselected information for the year are as follows:
Net asset value, beginning of year . . . . . . . . . . . . . . . . . . . . . . . . . . . . . . . . . . . . . $9.204 $9.677 $9.538 $9.100 $9.51Income from investment operations:
Net investment income1 . . . . . . . . . . . . . . . . . . . . . . . . . . . . . . . . . . . . . . . . . . . 0.262 0.288 0.255 0.204 0.19Net realized and unrealized gains (losses) on investments . . . . . . . . . . . . . . . . . 1.978 (0.491) 0.104 0.442 0.35
Total from investment operations . . . . . . . . . . . . . . . . . . . . . . . . . . . . . . . . . . . . 2.240 (0.203) 0.359 0.646 0.54
Less distributions:Dividends from net investment income . . . . . . . . . . . . . . . . . . . . . . . . . . . . . . . (0.244) (0.270) (0.205) (0.187) —Dividends from net realized gains . . . . . . . . . . . . . . . . . . . . . . . . . . . . . . . . . . . . (0.036) — (0.015) (0.021) (0.95)
Total distributions . . . . . . . . . . . . . . . . . . . . . . . . . . . . . . . . . . . . . . . . . . . . . . . . (0.280) (0.270) (0.220) (0.208) (0.95)
Net asset value, end of year . . . . . . . . . . . . . . . . . . . . . . . . . . . . . . . . . . . . . . . . . . $11.164 $9.204 $9.677 $9.538 $9.10
Total return . . . . . . . . . . . . . . . . . . . . . . . . . . . . . . . . . . . . . . . . . . . . . . . . . . . . . . . 24.42% (2.41)% 3.97% 7.07% 6.09%Supplemental data and ratios:
Net assets, end of year . . . . . . . . . . . . . . . . . . . . . . . . . . . . . . . . . . . . . . . . . . . . . $1,287,200 $1,713,169 $2,268,382 $3,140,896 $4,966,270Ratio of expenses to average net assets2
Before expense reimbursement (recapture) and securities lending creditincluding interest expense3 . . . . . . . . . . . . . . . . . . . . . . . . . . . . . . . . . . . . . . 0.36% 0.40% 0.42% 0.44% 0.51%
After expense reimbursement (recapture) and securities lending creditincluding interest expense3 . . . . . . . . . . . . . . . . . . . . . . . . . . . . . . . . . . . . . . 0.10% 0.10% 0.10% 0.27% 0.30%
Before expense reimbursement (recapture) and securities lending creditexcluding interest expense . . . . . . . . . . . . . . . . . . . . . . . . . . . . . . . . . . . . . . 0.36% 0.40% 0.42% 0.44% 0.51%
After expense reimbursement (recapture) and securities lending creditexcluding interest expense . . . . . . . . . . . . . . . . . . . . . . . . . . . . . . . . . . . . . . 0.10% 0.10% 0.10% 0.27% 0.30%
Ratio of net investment income to average net assets4
Before expense reimbursement (recapture) and securities lending credit . . . . 2.22% 2.57% 2.35% 1.97% 1.78%After expense reimbursement (recapture) and securities lending credit . . . . . 2.48% 2.87% 2.67% 2.14% 1.99%
Portfolio turnover rate . . . . . . . . . . . . . . . . . . . . . . . . . . . . . . . . . . . . . . . . . . . . . 38.17% 58.96% 69.19% 30.27% 44.43%
Portfolio Turnover is calculated for the Fund as a whole.1 Net investment income per share has been calculated based on average shares outstanding during the year.2 These ratios exclude the impact of the expenses of the underlying investment companies and exchange-traded funds in which the Fund invests.3 Includes interest expense where applicable. See Note 6 in the Notes to the Financial Statements.4 Recognition of the net investment income by the Fund is affected by the timing of the declaration of dividends by the underlying investment companies and exchange-
traded funds in which the Fund invests.
See notes to financial statements.
127

GuideMark® Funds & GuidePath® FundsFINANCIAL HIGHLIGHTS
Conservative Allocation Fund
Service
Year EndedMarch 31,
2021
Year EndedMarch 31,
2020
Year EndedMarch 31,
2019
Year EndedMarch 31,
2018
Year EndedMarch 31,
2017
Per share data for a share of capital stock outstanding for the entire year andselected information for the year are as follows:
Net asset value, beginning of year . . . . . . . . . . . . . . . . . . . . . . . . . . . . . . . . . . $9.137 $9.617 $9.482 $9.060 $9.53Income from investment operations:
Net investment income1 . . . . . . . . . . . . . . . . . . . . . . . . . . . . . . . . . . . . . . . . 0.199 0.226 0.196 0.143 0.12Net realized and unrealized gains (losses) on investments . . . . . . . . . . . . . 1.959 (0.490) 0.107 0.438 0.36
Total from investment operations . . . . . . . . . . . . . . . . . . . . . . . . . . . . . . . . 2.158 (0.264) 0.303 0.581 0.48
Less distributions:Dividends from net investment income . . . . . . . . . . . . . . . . . . . . . . . . . . . . (0.189) (0.216) (0.153) (0.138) —Dividends from net realized gains . . . . . . . . . . . . . . . . . . . . . . . . . . . . . . . . (0.036) — (0.015) (0.021) (0.95)
Total distributions . . . . . . . . . . . . . . . . . . . . . . . . . . . . . . . . . . . . . . . . . . . . (0.225) (0.216) (0.168) (0.159) (0.95)
Net asset value, end of year . . . . . . . . . . . . . . . . . . . . . . . . . . . . . . . . . . . . . . . $11.070 $9.137 $9.617 $9.482 $9.06
Total return . . . . . . . . . . . . . . . . . . . . . . . . . . . . . . . . . . . . . . . . . . . . . . . . . . . . 23.67% (2.99)% 3.35% 6.39% 5.44%Supplemental data and ratios:
Net assets, end of year . . . . . . . . . . . . . . . . . . . . . . . . . . . . . . . . . . . . . . . . . $461,123,761 $314,935,864 $337,130,990 $268,079,977 $110,985,447Ratio of expenses to average net assets2
Before expense reimbursement (recapture) and securities lending creditincluding interest expense3 . . . . . . . . . . . . . . . . . . . . . . . . . . . . . . . . . . . 0.96% 0.99% 1.02% 1.03% 1.10%
After expense reimbursement (recapture) and securities lending creditincluding interest expense3 . . . . . . . . . . . . . . . . . . . . . . . . . . . . . . . . . . . 0.70% 0.70% 0.70% 0.83% 0.89%
Before expense reimbursement (recapture) and securities lending creditexcluding interest expense . . . . . . . . . . . . . . . . . . . . . . . . . . . . . . . . . . . 0.96% 0.99% 1.02% 1.03% 1.10%
After expense reimbursement (recapture) and securities lending creditexcluding interest expense . . . . . . . . . . . . . . . . . . . . . . . . . . . . . . . . . . . 0.70% 0.70% 0.70% 0.83% 0.89%
Ratio of net investment income to average net assets4
Before expense reimbursement (recapture) and securities lendingcredit . . . . . . . . . . . . . . . . . . . . . . . . . . . . . . . . . . . . . . . . . . . . . . . . . . . 1.64% 1.98% 1.75% 1.31% 1.10%
After expense reimbursement (recapture) and securities lendingcredit . . . . . . . . . . . . . . . . . . . . . . . . . . . . . . . . . . . . . . . . . . . . . . . . . . . 1.90% 2.27% 2.07% 1.51% 1.31%
Portfolio turnover rate . . . . . . . . . . . . . . . . . . . . . . . . . . . . . . . . . . . . . . . . . 38.17% 58.96% 69.19% 30.27% 44.43%
Portfolio Turnover is calculated for the Fund as a whole.1 Net investment income per share has been calculated based on average shares outstanding during the year.2 These ratios exclude the impact of the expenses of the underlying investment companies and exchange-traded funds in which the Fund invests.3 Includes interest expense where applicable. See Note 6 in the Notes to the Financial Statements.4 Recognition of the net investment income by the Fund is affected by the timing of the declaration of dividends by the underlying investment companies and exchange-
traded funds in which the Fund invests.
See notes to financial statements.
128

GuideMark® Funds & GuidePath® FundsFINANCIAL HIGHLIGHTS
Tactical Allocation Fund
Institutional
Year EndedMarch 31,
2021
Year EndedMarch 31,
2020
Year EndedMarch 31,
2019
Year EndedMarch 31,
2018
Year EndedMarch 31,
2017
Per share data for a share of capital stock outstanding for the entire year andselected information for the year are as follows:
Net asset value, beginning of year . . . . . . . . . . . . . . . . . . . . . . . . . . . . . . . . . . . . . $10.019 $10.962 $10.950 $10.250 $9.38Income from investment operations:
Net investment income1 . . . . . . . . . . . . . . . . . . . . . . . . . . . . . . . . . . . . . . . . . . . 0.073 0.129 0.138 0.142 0.18Net realized and unrealized gains (losses) on investments . . . . . . . . . . . . . . . . . 1.958 (0.517) 0.408 1.078 0.81
Total from investment operations . . . . . . . . . . . . . . . . . . . . . . . . . . . . . . . . . . . . 2.031 (0.388) 0.546 1.220 0.99
Less distributions:Dividends from net investment income . . . . . . . . . . . . . . . . . . . . . . . . . . . . . . . (0.051) (0.108) (0.128) (0.393) (0.12)Dividends from net realized gains . . . . . . . . . . . . . . . . . . . . . . . . . . . . . . . . . . . . (0.512) (0.447) (0.406) (0.127) —
Total distributions . . . . . . . . . . . . . . . . . . . . . . . . . . . . . . . . . . . . . . . . . . . . . . . . (0.563) (0.555) (0.534) (0.520) (0.12)
Net asset value, end of year . . . . . . . . . . . . . . . . . . . . . . . . . . . . . . . . . . . . . . . . . . $11.487 $10.019 $10.962 $10.950 $10.25
Total return . . . . . . . . . . . . . . . . . . . . . . . . . . . . . . . . . . . . . . . . . . . . . . . . . . . . . . . 20.69% (4.27)% 5.59% 11.83% 10.63%Supplemental data and ratios:
Net assets, end of year . . . . . . . . . . . . . . . . . . . . . . . . . . . . . . . . . . . . . . . . . . . . . $1,305,328 $1,553,075 $1,506,030 $1,681,043 $3,767,220Ratio of expenses to average net assets2
Before expense reimbursement (recapture) and securities lending creditincluding interest expense3 . . . . . . . . . . . . . . . . . . . . . . . . . . . . . . . . . . . . . . 0.47% 0.50% 0.51% 0.52% 0.53%
After expense reimbursement (recapture) and securities lending creditincluding interest expense3 . . . . . . . . . . . . . . . . . . . . . . . . . . . . . . . . . . . . . . 0.45% 0.46% 0.43% 0.45% 0.40%
Before expense reimbursement (recapture) and securities lending creditexcluding interest expense . . . . . . . . . . . . . . . . . . . . . . . . . . . . . . . . . . . . . . 0.47% 0.50% 0.51% 0.52% 0.53%
After expense reimbursement (recapture) and securities lending creditexcluding interest expense . . . . . . . . . . . . . . . . . . . . . . . . . . . . . . . . . . . . . . 0.45% 0.46% 0.43% 0.45% 0.40%
Ratio of net investment income to average net assets4
Before expense reimbursement (recapture) and securities lending credit . . . . 0.65% 1.10% 1.15% 1.25% 1.69%After expense reimbursement (recapture) and securities lending credit . . . . . 0.67% 1.14% 1.23% 1.32% 1.82%
Portfolio turnover rate . . . . . . . . . . . . . . . . . . . . . . . . . . . . . . . . . . . . . . . . . . . . . 443.30% 500.28% 336.60% 369.57% 336.50%
Portfolio Turnover is calculated for the Fund as a whole.1 Net investment income per share has been calculated based on average shares outstanding during the year.2 These ratios exclude the impact of the expenses of the underlying investment companies and exchange-traded funds in which the Fund invests.3 Includes interest expense where applicable. See Note 6 in the Notes to the Financial Statements.4 Recognition of the net investment income by the Fund is affected by the timing of the declaration of dividends by the underlying investment companies and exchange-
traded funds in which the Fund invests.
See notes to financial statements.
129

GuideMark® Funds & GuidePath® FundsFINANCIAL HIGHLIGHTS
Tactical Allocation Fund
Service
Year EndedMarch 31,
2021
Year EndedMarch 31,
2020
Year EndedMarch 31,
2019
Year EndedMarch 31,
2018
Year EndedMarch 31,
2017
Per share data for a share of capital stock outstanding for the entire year andselected information for the year are as follows:
Net asset value, beginning of year . . . . . . . . . . . . . . . . . . . . . . . . . . . . . . . . . . $9.960 $10.919 $10.907 $10.150 $9.32Income from investment operations:
Net investment income1 . . . . . . . . . . . . . . . . . . . . . . . . . . . . . . . . . . . . . . . . 0.010 0.061 0.074 0.082 0.11Net realized and unrealized gains (losses) on investments . . . . . . . . . . . . . 1.941 (0.515) 0.410 1.054 0.82
Total from investment operations . . . . . . . . . . . . . . . . . . . . . . . . . . . . . . . . 1.951 (0.454) 0.484 1.136 0.93
Less distributions:Dividends from net investment income . . . . . . . . . . . . . . . . . . . . . . . . . . . . (0.005) (0.058) (0.066) (0.252) (0.10)Dividends from net realized gains . . . . . . . . . . . . . . . . . . . . . . . . . . . . . . . . (0.512) (0.447) (0.406) (0.127) —
Total distributions . . . . . . . . . . . . . . . . . . . . . . . . . . . . . . . . . . . . . . . . . . . . (0.517) (0.505) (0.472) (0.379) (0.10)
Net asset value, end of year . . . . . . . . . . . . . . . . . . . . . . . . . . . . . . . . . . . . . . . $11.394 $9.960 $10.919 $10.907 $10.15
Total return . . . . . . . . . . . . . . . . . . . . . . . . . . . . . . . . . . . . . . . . . . . . . . . . . . . . 19.96% (4.83)% 4.96% 11.14% 10.05%Supplemental data and ratios:
Net assets, end of year . . . . . . . . . . . . . . . . . . . . . . . . . . . . . . . . . . . . . . . . . $469,311,387 $323,199,482 $341,839,666 $271,460,164 $304,159,564Ratio of expenses to average net assets2
Before expense reimbursement (recapture) and securities lending creditincluding interest expense3 . . . . . . . . . . . . . . . . . . . . . . . . . . . . . . . . . . . 1.07% 1.10% 1.11% 1.11% 1.12%
After expense reimbursement (recapture) and securities lending creditincluding interest expense3 . . . . . . . . . . . . . . . . . . . . . . . . . . . . . . . . . . . 1.05% 1.06% 1.03% 1.03% 1.00%
Before expense reimbursement (recapture) and securities lending creditexcluding interest expense . . . . . . . . . . . . . . . . . . . . . . . . . . . . . . . . . . . 1.07% 1.10% 1.11% 1.11% 1.12%
After expense reimbursement (recapture) and securities lending creditexcluding interest expense . . . . . . . . . . . . . . . . . . . . . . . . . . . . . . . . . . . 1.05% 1.06% 1.03% 1.03% 1.00%
Ratio of net investment income to average net assets4
Before expense reimbursement (recapture) and securities lendingcredit . . . . . . . . . . . . . . . . . . . . . . . . . . . . . . . . . . . . . . . . . . . . . . . . . . . 0.07% 0.50% 0.58% 0.69% 1.07%
After expense reimbursement (recapture) and securities lendingcredit . . . . . . . . . . . . . . . . . . . . . . . . . . . . . . . . . . . . . . . . . . . . . . . . . . . 0.09% 0.54% 0.66% 0.77% 1.19%
Portfolio turnover rate . . . . . . . . . . . . . . . . . . . . . . . . . . . . . . . . . . . . . . . . . 443.30% 500.28% 336.60% 369.57% 336.50%
Portfolio Turnover is calculated for the Fund as a whole.1 Net investment income per share has been calculated based on average shares outstanding during the year.2 These ratios exclude the impact of the expenses of the underlying investment companies and exchange-traded funds in which the Fund invests.3 Includes interest expense where applicable. See Note 6 in the Notes to the Financial Statements.4 Recognition of the net investment income by the Fund is affected by the timing of the declaration of dividends by the underlying investment companies and exchange-
traded funds in which the Fund invests.
See notes to financial statements.
130
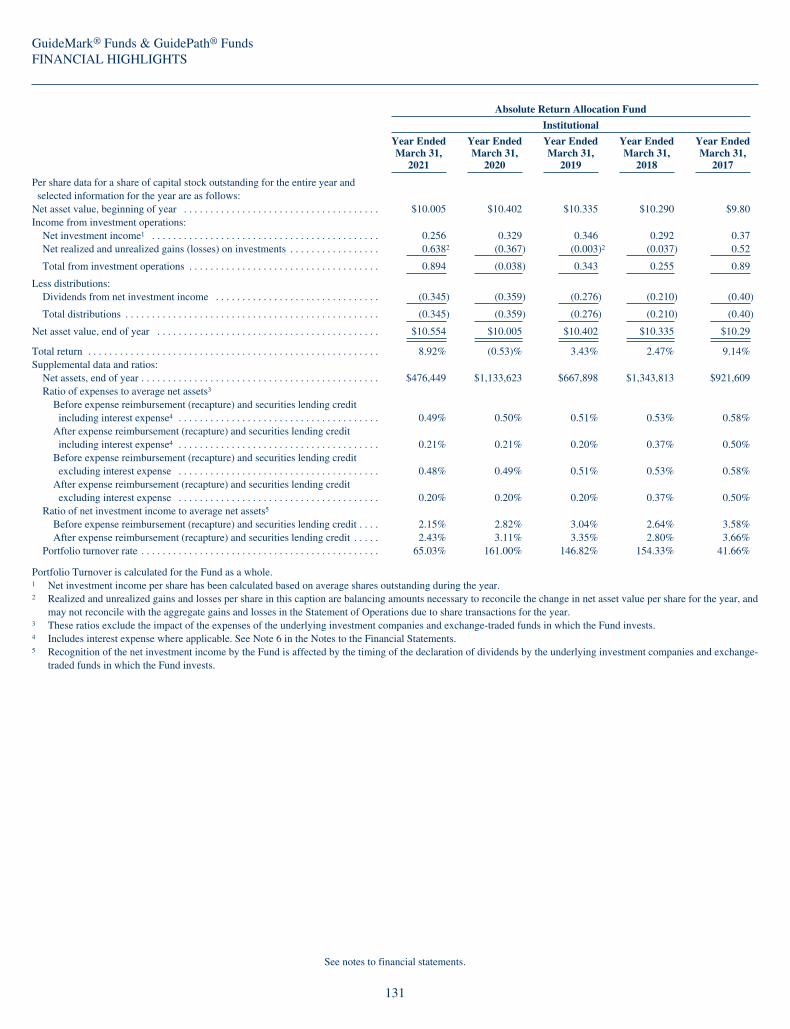
GuideMark® Funds & GuidePath® FundsFINANCIAL HIGHLIGHTS
Absolute Return Allocation Fund
Institutional
Year EndedMarch 31,
2021
Year EndedMarch 31,
2020
Year EndedMarch 31,
2019
Year EndedMarch 31,
2018
Year EndedMarch 31,
2017
Per share data for a share of capital stock outstanding for the entire year andselected information for the year are as follows:
Net asset value, beginning of year . . . . . . . . . . . . . . . . . . . . . . . . . . . . . . . . . . . . . $10.005 $10.402 $10.335 $10.290 $9.80Income from investment operations:
Net investment income1 . . . . . . . . . . . . . . . . . . . . . . . . . . . . . . . . . . . . . . . . . . . 0.256 0.329 0.346 0.292 0.37Net realized and unrealized gains (losses) on investments . . . . . . . . . . . . . . . . . 0.6382 (0.367) (0.003)2 (0.037) 0.52
Total from investment operations . . . . . . . . . . . . . . . . . . . . . . . . . . . . . . . . . . . . 0.894 (0.038) 0.343 0.255 0.89
Less distributions:Dividends from net investment income . . . . . . . . . . . . . . . . . . . . . . . . . . . . . . . (0.345) (0.359) (0.276) (0.210) (0.40)
Total distributions . . . . . . . . . . . . . . . . . . . . . . . . . . . . . . . . . . . . . . . . . . . . . . . . (0.345) (0.359) (0.276) (0.210) (0.40)
Net asset value, end of year . . . . . . . . . . . . . . . . . . . . . . . . . . . . . . . . . . . . . . . . . . $10.554 $10.005 $10.402 $10.335 $10.29
Total return . . . . . . . . . . . . . . . . . . . . . . . . . . . . . . . . . . . . . . . . . . . . . . . . . . . . . . . 8.92% (0.53)% 3.43% 2.47% 9.14%Supplemental data and ratios:
Net assets, end of year . . . . . . . . . . . . . . . . . . . . . . . . . . . . . . . . . . . . . . . . . . . . . $476,449 $1,133,623 $667,898 $1,343,813 $921,609Ratio of expenses to average net assets3
Before expense reimbursement (recapture) and securities lending creditincluding interest expense4 . . . . . . . . . . . . . . . . . . . . . . . . . . . . . . . . . . . . . . 0.49% 0.50% 0.51% 0.53% 0.58%
After expense reimbursement (recapture) and securities lending creditincluding interest expense4 . . . . . . . . . . . . . . . . . . . . . . . . . . . . . . . . . . . . . . 0.21% 0.21% 0.20% 0.37% 0.50%
Before expense reimbursement (recapture) and securities lending creditexcluding interest expense . . . . . . . . . . . . . . . . . . . . . . . . . . . . . . . . . . . . . . 0.48% 0.49% 0.51% 0.53% 0.58%
After expense reimbursement (recapture) and securities lending creditexcluding interest expense . . . . . . . . . . . . . . . . . . . . . . . . . . . . . . . . . . . . . . 0.20% 0.20% 0.20% 0.37% 0.50%
Ratio of net investment income to average net assets5
Before expense reimbursement (recapture) and securities lending credit . . . . 2.15% 2.82% 3.04% 2.64% 3.58%After expense reimbursement (recapture) and securities lending credit . . . . . 2.43% 3.11% 3.35% 2.80% 3.66%
Portfolio turnover rate . . . . . . . . . . . . . . . . . . . . . . . . . . . . . . . . . . . . . . . . . . . . . 65.03% 161.00% 146.82% 154.33% 41.66%
Portfolio Turnover is calculated for the Fund as a whole.1 Net investment income per share has been calculated based on average shares outstanding during the year.2 Realized and unrealized gains and losses per share in this caption are balancing amounts necessary to reconcile the change in net asset value per share for the year, and
may not reconcile with the aggregate gains and losses in the Statement of Operations due to share transactions for the year.3 These ratios exclude the impact of the expenses of the underlying investment companies and exchange-traded funds in which the Fund invests.4 Includes interest expense where applicable. See Note 6 in the Notes to the Financial Statements.5 Recognition of the net investment income by the Fund is affected by the timing of the declaration of dividends by the underlying investment companies and exchange-
traded funds in which the Fund invests.
See notes to financial statements.
131

GuideMark® Funds & GuidePath® FundsFINANCIAL HIGHLIGHTS
Absolute Return Allocation Fund
Service
Year EndedMarch 31,
2021
Year EndedMarch 31,
2020
Year EndedMarch 31,
2019
Year EndedMarch 31,
2018
Year EndedMarch 31,
2017
Per share data for a share of capital stock outstanding for the entire year andselected information for the year are as follows:
Net asset value, beginning of year . . . . . . . . . . . . . . . . . . . . . . . . . . . . . . . . . . . $10.010 $10.402 $10.348 10.320 $9.81Income from investment operations:
Net investment income1 . . . . . . . . . . . . . . . . . . . . . . . . . . . . . . . . . . . . . . . . . 0.195 0.266 0.283 0.231 0.30Net realized and unrealized gains (losses) on investments . . . . . . . . . . . . . . 0.6345 (0.368) (0.001)5 (0.036) 0.53
Total from investment operations . . . . . . . . . . . . . . . . . . . . . . . . . . . . . . . . . 0.829 (0.102) 0.282 0.195 0.83
Less distributions:Dividends from net investment income . . . . . . . . . . . . . . . . . . . . . . . . . . . . . (0.261) (0.290) (0.228) (0.167) (0.32)
Total distributions . . . . . . . . . . . . . . . . . . . . . . . . . . . . . . . . . . . . . . . . . . . . . (0.261) (0.290) (0.228) (0.167) (0.32)
Net asset value, end of year . . . . . . . . . . . . . . . . . . . . . . . . . . . . . . . . . . . . . . . . $10.578 $10.010 $10.402 $10.348 $10.32
Total return . . . . . . . . . . . . . . . . . . . . . . . . . . . . . . . . . . . . . . . . . . . . . . . . . . . . 8.26% (1.11)% 2.81% 1.88% 8.54%Supplemental data and ratios:
Net assets, end of year . . . . . . . . . . . . . . . . . . . . . . . . . . . . . . . . . . . . . . . . . . $212,656,486 $391,177,265 $312,866,645 267,250,294 $128,948,108Ratio of expenses to average net assets2
Before expense reimbursement (recapture) and securities lending creditincluding interest expense3 . . . . . . . . . . . . . . . . . . . . . . . . . . . . . . . . . . . 1.09% 1.10% 1.11% 1.12% 1.18%
After expense reimbursement (recapture) and securities lending creditincluding interest expense3 . . . . . . . . . . . . . . . . . . . . . . . . . . . . . . . . . . . 0.81% 0.81% 0.80% 0.96% 1.10%
Before expense reimbursement (recapture) and securities lending creditexcluding interest expense . . . . . . . . . . . . . . . . . . . . . . . . . . . . . . . . . . . . 1.08% 1.09% 1.11% 1.12% 1.18%
After expense reimbursement (recapture) and securities lending creditexcluding interest expense . . . . . . . . . . . . . . . . . . . . . . . . . . . . . . . . . . . . 0.80% 0.80% 0.80% 0.96% 1.10%
Ratio of net investment income to average net assets4
Before expense reimbursement (recapture) and securities lendingcredit . . . . . . . . . . . . . . . . . . . . . . . . . . . . . . . . . . . . . . . . . . . . . . . . . . . . 1.57% 2.22% 2.44% 2.04% 2.91%
After expense reimbursement (recapture) and securities lendingcredit . . . . . . . . . . . . . . . . . . . . . . . . . . . . . . . . . . . . . . . . . . . . . . . . . . . . 1.85% 2.51% 2.75% 2.20% 2.99%
Portfolio turnover rate . . . . . . . . . . . . . . . . . . . . . . . . . . . . . . . . . . . . . . . . . . 65.03% 161.00% 146.82% 154.33% 41.66%
Portfolio Turnover is calculated for the Fund as a whole.1 Net investment income per share has been calculated based on average shares outstanding during the year.2 These ratios exclude the impact of the expenses of the underlying investment companies and exchange-traded funds in which the Fund invests.3 Includes interest expense where applicable. See Note 6 in the Notes to the Financial Statements.4 Recognition of the net investment income by the Fund is affected by the timing of the declaration of dividends by the underlying investment companies and exchange-
traded funds in which the Fund invests.5 Realized and unrealized gains and losses per share in this caption are balancing amounts necessary to reconcile the change in net asset value per share for the year, and
may not reconcile with the aggregate gains and losses in the Statement of Operations due to share transactions for the year.
See notes to financial statements.
132
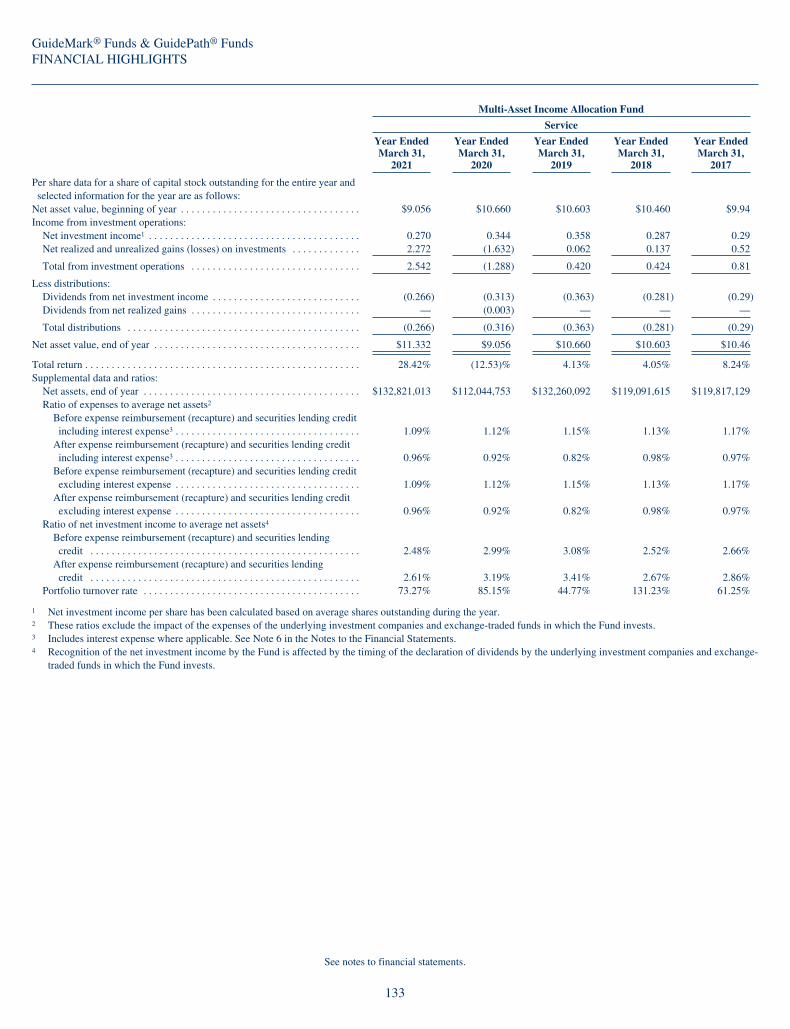
GuideMark® Funds & GuidePath® FundsFINANCIAL HIGHLIGHTS
Multi-Asset Income Allocation Fund
Service
Year EndedMarch 31,
2021
Year EndedMarch 31,
2020
Year EndedMarch 31,
2019
Year EndedMarch 31,
2018
Year EndedMarch 31,
2017
Per share data for a share of capital stock outstanding for the entire year andselected information for the year are as follows:
Net asset value, beginning of year . . . . . . . . . . . . . . . . . . . . . . . . . . . . . . . . . . $9.056 $10.660 $10.603 $10.460 $9.94Income from investment operations:
Net investment income1 . . . . . . . . . . . . . . . . . . . . . . . . . . . . . . . . . . . . . . . . 0.270 0.344 0.358 0.287 0.29Net realized and unrealized gains (losses) on investments . . . . . . . . . . . . . 2.272 (1.632) 0.062 0.137 0.52
Total from investment operations . . . . . . . . . . . . . . . . . . . . . . . . . . . . . . . . 2.542 (1.288) 0.420 0.424 0.81
Less distributions:Dividends from net investment income . . . . . . . . . . . . . . . . . . . . . . . . . . . . (0.266) (0.313) (0.363) (0.281) (0.29)Dividends from net realized gains . . . . . . . . . . . . . . . . . . . . . . . . . . . . . . . . — (0.003) — — —
Total distributions . . . . . . . . . . . . . . . . . . . . . . . . . . . . . . . . . . . . . . . . . . . . (0.266) (0.316) (0.363) (0.281) (0.29)
Net asset value, end of year . . . . . . . . . . . . . . . . . . . . . . . . . . . . . . . . . . . . . . . $11.332 $9.056 $10.660 $10.603 $10.46
Total return . . . . . . . . . . . . . . . . . . . . . . . . . . . . . . . . . . . . . . . . . . . . . . . . . . . . 28.42% (12.53)% 4.13% 4.05% 8.24%Supplemental data and ratios:
Net assets, end of year . . . . . . . . . . . . . . . . . . . . . . . . . . . . . . . . . . . . . . . . . $132,821,013 $112,044,753 $132,260,092 $119,091,615 $119,817,129Ratio of expenses to average net assets2
Before expense reimbursement (recapture) and securities lending creditincluding interest expense3 . . . . . . . . . . . . . . . . . . . . . . . . . . . . . . . . . . . 1.09% 1.12% 1.15% 1.13% 1.17%
After expense reimbursement (recapture) and securities lending creditincluding interest expense3 . . . . . . . . . . . . . . . . . . . . . . . . . . . . . . . . . . . 0.96% 0.92% 0.82% 0.98% 0.97%
Before expense reimbursement (recapture) and securities lending creditexcluding interest expense . . . . . . . . . . . . . . . . . . . . . . . . . . . . . . . . . . . 1.09% 1.12% 1.15% 1.13% 1.17%
After expense reimbursement (recapture) and securities lending creditexcluding interest expense . . . . . . . . . . . . . . . . . . . . . . . . . . . . . . . . . . . 0.96% 0.92% 0.82% 0.98% 0.97%
Ratio of net investment income to average net assets4
Before expense reimbursement (recapture) and securities lendingcredit . . . . . . . . . . . . . . . . . . . . . . . . . . . . . . . . . . . . . . . . . . . . . . . . . . . 2.48% 2.99% 3.08% 2.52% 2.66%
After expense reimbursement (recapture) and securities lendingcredit . . . . . . . . . . . . . . . . . . . . . . . . . . . . . . . . . . . . . . . . . . . . . . . . . . . 2.61% 3.19% 3.41% 2.67% 2.86%
Portfolio turnover rate . . . . . . . . . . . . . . . . . . . . . . . . . . . . . . . . . . . . . . . . . 73.27% 85.15% 44.77% 131.23% 61.25%
1 Net investment income per share has been calculated based on average shares outstanding during the year.2 These ratios exclude the impact of the expenses of the underlying investment companies and exchange-traded funds in which the Fund invests.3 Includes interest expense where applicable. See Note 6 in the Notes to the Financial Statements.4 Recognition of the net investment income by the Fund is affected by the timing of the declaration of dividends by the underlying investment companies and exchange-
traded funds in which the Fund invests.
See notes to financial statements.
133

GuideMark® Funds & GuidePath® FundsFINANCIAL HIGHLIGHTS
Flexible Income Allocation Fund
Institutional
Year EndedMarch 31,
2021
Year EndedMarch 31,
2020
Year EndedMarch 31,
2019
Year EndedMarch 31,
2018
Year EndedMarch 31,
2017
Per share data for a share of capital stock outstanding for the entire year andselected information for the year are as follows:
Net asset value, beginning of year . . . . . . . . . . . . . . . . . . . . . . . . . . . . . . . . . . . . . $9.368 $9.422 $9.577 $9.670 $9.62Income from investment operations:
Net investment income1 . . . . . . . . . . . . . . . . . . . . . . . . . . . . . . . . . . . . . . . . . . . 0.511 0.391 0.426 0.543 0.24Net realized and unrealized gains (losses) on investments . . . . . . . . . . . . . . . . . 0.9892 (0.076)2 (0.183) (0.158)2 0.07
Total from investment operations . . . . . . . . . . . . . . . . . . . . . . . . . . . . . . . . . . . . 1.500 0.315 0.243 0.385 0.31
Less distributions:Dividends from net investment income . . . . . . . . . . . . . . . . . . . . . . . . . . . . . . . (0.286) (0.369) (0.398) (0.478) (0.26)
Total distributions . . . . . . . . . . . . . . . . . . . . . . . . . . . . . . . . . . . . . . . . . . . . . . . . (0.286) (0.369) (0.398) (0.478) (0.26)
Net asset value, end of year . . . . . . . . . . . . . . . . . . . . . . . . . . . . . . . . . . . . . . . . . . $10.582 $9.368 $9.422 $9.577 $9.67
Total return . . . . . . . . . . . . . . . . . . . . . . . . . . . . . . . . . . . . . . . . . . . . . . . . . . . . . . . 16.10% 3.38% 2.58% 3.99% 3.23%Supplemental data and ratios:
Net assets, end of year . . . . . . . . . . . . . . . . . . . . . . . . . . . . . . . . . . . . . . . . . . . . . $7,747 $34,154 $26,280 $224,505 $52,492Ratio of expenses to average net assets3
Before expense reimbursement (recapture) and securities lending creditincluding interest expense4 . . . . . . . . . . . . . . . . . . . . . . . . . . . . . . . . . . . . . . 0.37% 0.45% 0.56% 0.52% 0.50%
After expense reimbursement (recapture) and securities lending creditincluding interest expense4 . . . . . . . . . . . . . . . . . . . . . . . . . . . . . . . . . . . . . . 0.15% 0.15% 0.16% 0.27% 0.37%
Before expense reimbursement (recapture) and securities lending creditexcluding interest expense . . . . . . . . . . . . . . . . . . . . . . . . . . . . . . . . . . . . . . 0.37% 0.45% 0.55% 0.52% 0.50%
After expense reimbursement (recapture) and securities lending creditexcluding interest expense . . . . . . . . . . . . . . . . . . . . . . . . . . . . . . . . . . . . . . 0.15% 0.15% 0.15% 0.27% 0.37%
Ratio of net investment income to average net assets5
Before expense reimbursement (recapture) and securities lending credit . . . . 4.84% 3.81% 4.07% 5.27% 2.32%After expense reimbursement (recapture) and securities lending credit . . . . . 5.06% 4.11% 4.47% 5.52% 2.45%
Portfolio turnover rate . . . . . . . . . . . . . . . . . . . . . . . . . . . . . . . . . . . . . . . . . . . . . 211.84% 517.05% 380.48% 232.11% 114.68%
Portfolio Turnover is calculated for the Fund as a whole.1 Net investment income per share has been calculated based on average shares outstanding during the year.2 Realized and unrealized gains and losses per share in this caption are balancing amounts necessary to reconcile the change in net asset value per share for the year, and
may not reconcile with the aggregate gains and losses in the Statement of Operations due to share transactions for the year.3 These ratios exclude the impact of the expenses of the underlying investment companies and exchange-traded funds in which the Fund invests.4 Includes interest expense where applicable. See Note 6 in the Notes to the Financial Statements.5 Recognition of the net investment income by the Fund is affected by the timing of the declaration of dividends by the underlying investment companies and exchange-
traded funds in which the Fund invests.
See notes to financial statements.
134
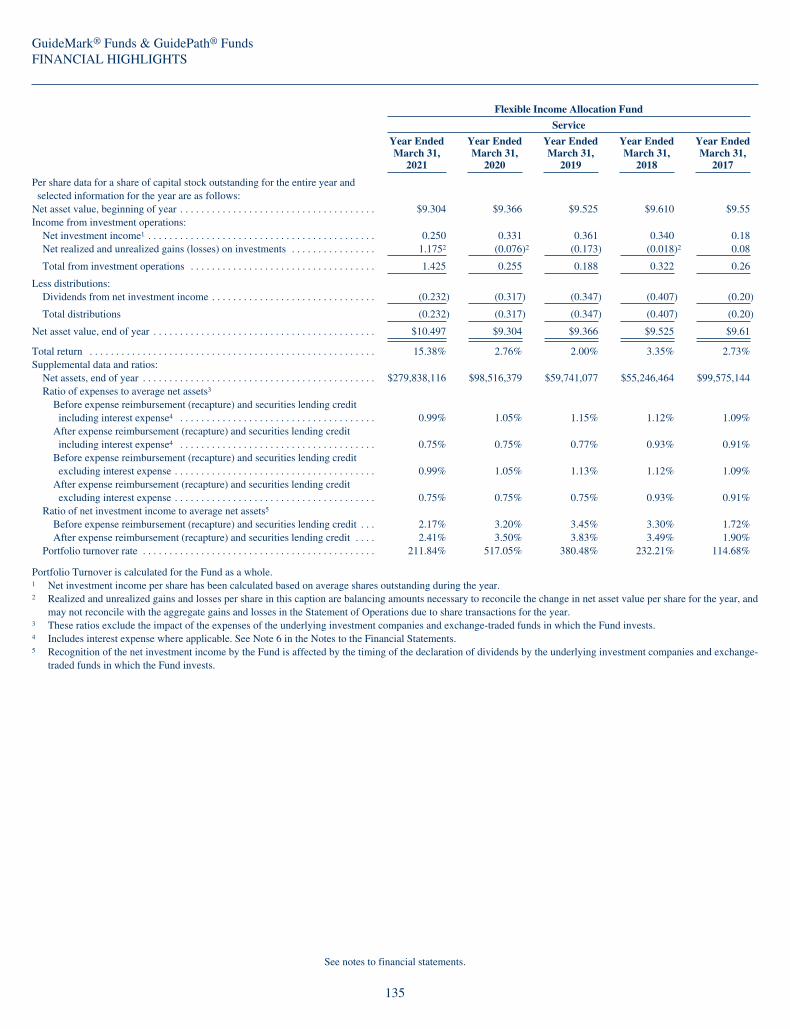
GuideMark® Funds & GuidePath® FundsFINANCIAL HIGHLIGHTS
Flexible Income Allocation Fund
Service
Year EndedMarch 31,
2021
Year EndedMarch 31,
2020
Year EndedMarch 31,
2019
Year EndedMarch 31,
2018
Year EndedMarch 31,
2017
Per share data for a share of capital stock outstanding for the entire year andselected information for the year are as follows:
Net asset value, beginning of year . . . . . . . . . . . . . . . . . . . . . . . . . . . . . . . . . . . . . $9.304 $9.366 $9.525 $9.610 $9.55Income from investment operations:
Net investment income1 . . . . . . . . . . . . . . . . . . . . . . . . . . . . . . . . . . . . . . . . . . . 0.250 0.331 0.361 0.340 0.18Net realized and unrealized gains (losses) on investments . . . . . . . . . . . . . . . . 1.1752 (0.076)2 (0.173) (0.018)2 0.08
Total from investment operations . . . . . . . . . . . . . . . . . . . . . . . . . . . . . . . . . . . 1.425 0.255 0.188 0.322 0.26
Less distributions:Dividends from net investment income . . . . . . . . . . . . . . . . . . . . . . . . . . . . . . . (0.232) (0.317) (0.347) (0.407) (0.20)
Total distributions (0.232) (0.317) (0.347) (0.407) (0.20)
Net asset value, end of year . . . . . . . . . . . . . . . . . . . . . . . . . . . . . . . . . . . . . . . . . . $10.497 $9.304 $9.366 $9.525 $9.61
Total return . . . . . . . . . . . . . . . . . . . . . . . . . . . . . . . . . . . . . . . . . . . . . . . . . . . . . . 15.38% 2.76% 2.00% 3.35% 2.73%Supplemental data and ratios:
Net assets, end of year . . . . . . . . . . . . . . . . . . . . . . . . . . . . . . . . . . . . . . . . . . . . $279,838,116 $98,516,379 $59,741,077 $55,246,464 $99,575,144Ratio of expenses to average net assets3
Before expense reimbursement (recapture) and securities lending creditincluding interest expense4 . . . . . . . . . . . . . . . . . . . . . . . . . . . . . . . . . . . . . 0.99% 1.05% 1.15% 1.12% 1.09%
After expense reimbursement (recapture) and securities lending creditincluding interest expense4 . . . . . . . . . . . . . . . . . . . . . . . . . . . . . . . . . . . . . 0.75% 0.75% 0.77% 0.93% 0.91%
Before expense reimbursement (recapture) and securities lending creditexcluding interest expense . . . . . . . . . . . . . . . . . . . . . . . . . . . . . . . . . . . . . . 0.99% 1.05% 1.13% 1.12% 1.09%
After expense reimbursement (recapture) and securities lending creditexcluding interest expense . . . . . . . . . . . . . . . . . . . . . . . . . . . . . . . . . . . . . . 0.75% 0.75% 0.75% 0.93% 0.91%
Ratio of net investment income to average net assets5
Before expense reimbursement (recapture) and securities lending credit . . . 2.17% 3.20% 3.45% 3.30% 1.72%After expense reimbursement (recapture) and securities lending credit . . . . 2.41% 3.50% 3.83% 3.49% 1.90%
Portfolio turnover rate . . . . . . . . . . . . . . . . . . . . . . . . . . . . . . . . . . . . . . . . . . . . 211.84% 517.05% 380.48% 232.21% 114.68%
Portfolio Turnover is calculated for the Fund as a whole.1 Net investment income per share has been calculated based on average shares outstanding during the year.2 Realized and unrealized gains and losses per share in this caption are balancing amounts necessary to reconcile the change in net asset value per share for the year, and
may not reconcile with the aggregate gains and losses in the Statement of Operations due to share transactions for the year.3 These ratios exclude the impact of the expenses of the underlying investment companies and exchange-traded funds in which the Fund invests.4 Includes interest expense where applicable. See Note 6 in the Notes to the Financial Statements.5 Recognition of the net investment income by the Fund is affected by the timing of the declaration of dividends by the underlying investment companies and exchange-
traded funds in which the Fund invests.
See notes to financial statements.
135
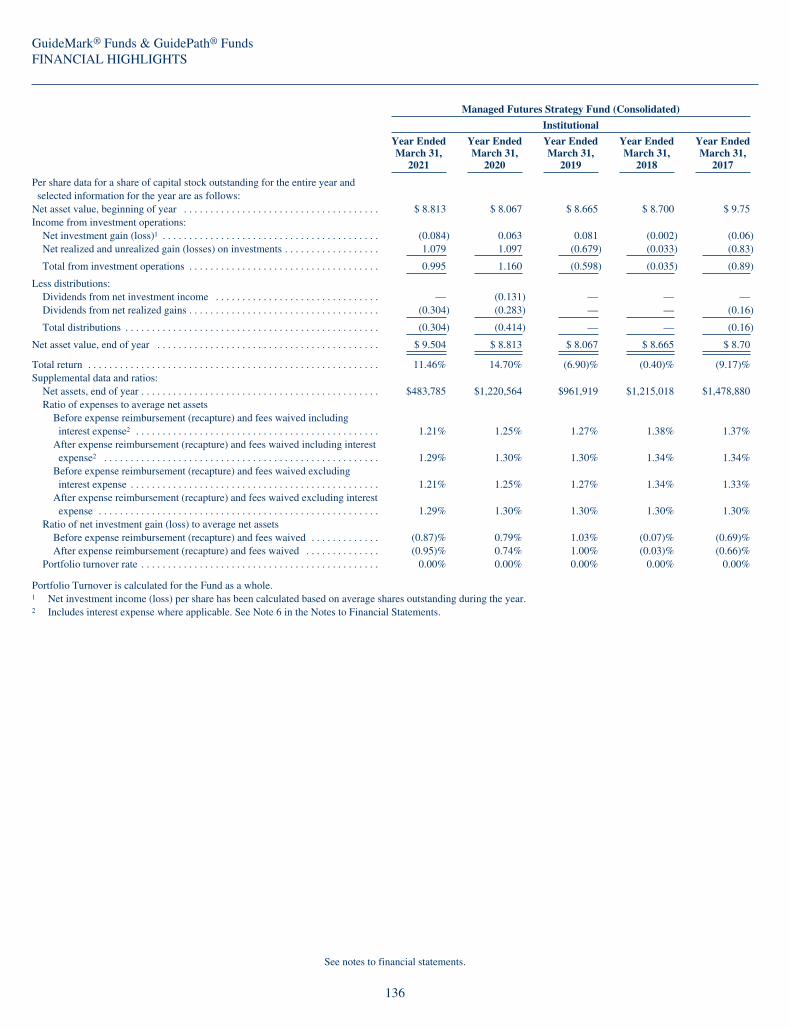
GuideMark® Funds & GuidePath® FundsFINANCIAL HIGHLIGHTS
Managed Futures Strategy Fund (Consolidated)
Institutional
Year EndedMarch 31,
2021
Year EndedMarch 31,
2020
Year EndedMarch 31,
2019
Year EndedMarch 31,
2018
Year EndedMarch 31,
2017
Per share data for a share of capital stock outstanding for the entire year andselected information for the year are as follows:
Net asset value, beginning of year . . . . . . . . . . . . . . . . . . . . . . . . . . . . . . . . . . . . . $ 8.813 $ 8.067 $ 8.665 $ 8.700 $ 9.75Income from investment operations:
Net investment gain (loss)1 . . . . . . . . . . . . . . . . . . . . . . . . . . . . . . . . . . . . . . . . . (0.084) 0.063 0.081 (0.002) (0.06)Net realized and unrealized gain (losses) on investments . . . . . . . . . . . . . . . . . . 1.079 1.097 (0.679) (0.033) (0.83)
Total from investment operations . . . . . . . . . . . . . . . . . . . . . . . . . . . . . . . . . . . . 0.995 1.160 (0.598) (0.035) (0.89)
Less distributions:Dividends from net investment income . . . . . . . . . . . . . . . . . . . . . . . . . . . . . . . — (0.131) — — —Dividends from net realized gains . . . . . . . . . . . . . . . . . . . . . . . . . . . . . . . . . . . . (0.304) (0.283) — — (0.16)
Total distributions . . . . . . . . . . . . . . . . . . . . . . . . . . . . . . . . . . . . . . . . . . . . . . . . (0.304) (0.414) — — (0.16)
Net asset value, end of year . . . . . . . . . . . . . . . . . . . . . . . . . . . . . . . . . . . . . . . . . . $ 9.504 $ 8.813 $ 8.067 $ 8.665 $ 8.70
Total return . . . . . . . . . . . . . . . . . . . . . . . . . . . . . . . . . . . . . . . . . . . . . . . . . . . . . . . 11.46% 14.70% (6.90)% (0.40)% (9.17)%Supplemental data and ratios:
Net assets, end of year . . . . . . . . . . . . . . . . . . . . . . . . . . . . . . . . . . . . . . . . . . . . . $483,785 $1,220,564 $961,919 $1,215,018 $1,478,880Ratio of expenses to average net assets
Before expense reimbursement (recapture) and fees waived includinginterest expense2 . . . . . . . . . . . . . . . . . . . . . . . . . . . . . . . . . . . . . . . . . . . . . . 1.21% 1.25% 1.27% 1.38% 1.37%
After expense reimbursement (recapture) and fees waived including interestexpense2 . . . . . . . . . . . . . . . . . . . . . . . . . . . . . . . . . . . . . . . . . . . . . . . . . . . . 1.29% 1.30% 1.30% 1.34% 1.34%
Before expense reimbursement (recapture) and fees waived excludinginterest expense . . . . . . . . . . . . . . . . . . . . . . . . . . . . . . . . . . . . . . . . . . . . . . . 1.21% 1.25% 1.27% 1.34% 1.33%
After expense reimbursement (recapture) and fees waived excluding interestexpense . . . . . . . . . . . . . . . . . . . . . . . . . . . . . . . . . . . . . . . . . . . . . . . . . . . . . 1.29% 1.30% 1.30% 1.30% 1.30%
Ratio of net investment gain (loss) to average net assetsBefore expense reimbursement (recapture) and fees waived . . . . . . . . . . . . . (0.87)% 0.79% 1.03% (0.07)% (0.69)%After expense reimbursement (recapture) and fees waived . . . . . . . . . . . . . . (0.95)% 0.74% 1.00% (0.03)% (0.66)%
Portfolio turnover rate . . . . . . . . . . . . . . . . . . . . . . . . . . . . . . . . . . . . . . . . . . . . . 0.00% 0.00% 0.00% 0.00% 0.00%
Portfolio Turnover is calculated for the Fund as a whole.1 Net investment income (loss) per share has been calculated based on average shares outstanding during the year.2 Includes interest expense where applicable. See Note 6 in the Notes to Financial Statements.
See notes to financial statements.
136

GuideMark® Funds & GuidePath® FundsFINANCIAL HIGHLIGHTS
Managed Futures Strategy Fund (Consolidated)
Service
Year EndedMarch 31,
2021
Year EndedMarch 31,
2020
Year EndedMarch 31,
2019
Year EndedMarch 31,
2018
Year EndedMarch 31,
2017
Per share data for a share of capital stock outstanding for the entire year andselected information for the year are as follows:
Net asset value, beginning of year . . . . . . . . . . . . . . . . . . . . . . . . . . . . . . . . . . . $ 8.648 $ 7.914 $ 8.551 $ 8.640 $ 9.73Income from investment operations:
Net investment gain (loss)1 . . . . . . . . . . . . . . . . . . . . . . . . . . . . . . . . . . . . . . (0.129) 0.011 0.035 (0.050) (0.11)Net realized and unrealized gains (losses) on investments . . . . . . . . . . . . . . 1.053 1.077 (0.672) (0.039) (0.82)
Total from investment operations . . . . . . . . . . . . . . . . . . . . . . . . . . . . . . . . . 0.924 1.088 (0.637) (0.089) (0.93)
Less distributions:Dividends from net investment income . . . . . . . . . . . . . . . . . . . . . . . . . . . . . — (0.071) — — —Dividends from net realized gains . . . . . . . . . . . . . . . . . . . . . . . . . . . . . . . . . (0.304) (0.283) — — (0.16)
Total distributions . . . . . . . . . . . . . . . . . . . . . . . . . . . . . . . . . . . . . . . . . . . . . (0.304) (0.354) — — (0.16)
Net asset value, end of year . . . . . . . . . . . . . . . . . . . . . . . . . . . . . . . . . . . . . . . . $ 9.268 $ 8.648 $ 7.914 $ 8.551 $ 8.64
Total return . . . . . . . . . . . . . . . . . . . . . . . . . . . . . . . . . . . . . . . . . . . . . . . . . . . . 10.84% 14.03% (7.45)% (0.92)% (9.70)%Supplemental data and ratios:
Net assets, end of year . . . . . . . . . . . . . . . . . . . . . . . . . . . . . . . . . . . . . . . . . . $207,653,403 $221,868,264 $156,397,141 $121,362,278 $81,212,945Ratio of expenses to average net assets
Before expense reimbursement (recapture) and fees waived includinginterest expense2 . . . . . . . . . . . . . . . . . . . . . . . . . . . . . . . . . . . . . . . . . . . 1.80% 1.85% 1.87% 1.97% 1.97%
After expense reimbursement (recapture) and fees waived includinginterest expense2 . . . . . . . . . . . . . . . . . . . . . . . . . . . . . . . . . . . . . . . . . . . 1.81% 1.90% 1.90% 1.94% 1.94%
Before expense reimbursement (recapture) and fees waived excludinginterest expense . . . . . . . . . . . . . . . . . . . . . . . . . . . . . . . . . . . . . . . . . . . . 1.80% 1.85% 1.87% 1.93% 1.93%
After expense reimbursement (recapture) and fees waived excludinginterest expense . . . . . . . . . . . . . . . . . . . . . . . . . . . . . . . . . . . . . . . . . . . . 1.81% 1.90% 1.90% 1.90% 1.90%
Ratio of net investment gain (loss) to average net assetsBefore expense reimbursement (recapture) and fees waived . . . . . . . . . . (1.47)% 0.18% 0.47% (0.61)% (1.27)%After expense reimbursement (recapture) and fees waived . . . . . . . . . . . (1.48)% 0.13% 0.44% (0.58)% (1.24)%
Portfolio turnover rate . . . . . . . . . . . . . . . . . . . . . . . . . . . . . . . . . . . . . . . . . . 0.00% 0.00% 0.00% 0.00% 0.00%
Portfolio Turnover is calculated for the Fund as a whole.1 Net investment income (loss) per share has been calculated based on average shares outstanding during the year.2 Includes interest expense where applicable. See Note 6 in the Notes to Financial Statements.
See notes to financial statements.
137

GuideMark® Funds & GuidePath® FundsFINANCIAL HIGHLIGHTS
Conservative Income Fund
Year EndedMarch 31,
2021
Year EndedMarch 31,
2020
April 30, 20181
throughMarch 31,
2019
Per share data for a share of capital stock outstanding for the entire year and selected information for the year areas follows:
Net asset value, beginning of year . . . . . . . . . . . . . . . . . . . . . . . . . . . . . . . . . . . . . . . . . . . . . . . . . . . . . . . . . . . . . . . . $9.899 $9.987 $10.000Income from investment operations:
Net investment income2 . . . . . . . . . . . . . . . . . . . . . . . . . . . . . . . . . . . . . . . . . . . . . . . . . . . . . . . . . . . . . . . . . . . . . . 0.029 0.177 0.153Net realized and unrealized gains (losses) on investments . . . . . . . . . . . . . . . . . . . . . . . . . . . . . . . . . . . . . . . . . . . 0.044 (0.092) (0.020)7
Total from investment operations . . . . . . . . . . . . . . . . . . . . . . . . . . . . . . . . . . . . . . . . . . . . . . . . . . . . . . . . . . . . . . 0.073 0.085 0.133
Less distributions:Dividends from net investment income . . . . . . . . . . . . . . . . . . . . . . . . . . . . . . . . . . . . . . . . . . . . . . . . . . . . . . . . . . (0.034) (0.173) (0.144)Dividends from net realized gains . . . . . . . . . . . . . . . . . . . . . . . . . . . . . . . . . . . . . . . . . . . . . . . . . . . . . . . . . . . . . . — — (0.002)
Total distributions . . . . . . . . . . . . . . . . . . . . . . . . . . . . . . . . . . . . . . . . . . . . . . . . . . . . . . . . . . . . . . . . . . . . . . . . . . (0.034) (0.173) (0.146)
Net asset value, end of year . . . . . . . . . . . . . . . . . . . . . . . . . . . . . . . . . . . . . . . . . . . . . . . . . . . . . . . . . . . . . . . . . . . . . $9.938 $9.899 $9.987
Total return . . . . . . . . . . . . . . . . . . . . . . . . . . . . . . . . . . . . . . . . . . . . . . . . . . . . . . . . . . . . . . . . . . . . . . . . . . . . . . . . . 0.74% 0.85% 1.34%3
Supplemental data and ratios:Net assets, end of year . . . . . . . . . . . . . . . . . . . . . . . . . . . . . . . . . . . . . . . . . . . . . . . . . . . . . . . . . . . . . . . . . . . . . . . $15,926,192 $6,724,818 $973,527Ratio of expenses to average net assets4
Before expense reimbursement (recapture) and securities lending credit . . . . . . . . . . . . . . . . . . . . . . . . . . . . . . 1.14% 2.23% 43.40%5
After expense reimbursement (recapture) and securities lending credit . . . . . . . . . . . . . . . . . . . . . . . . . . . . . . . 0.64% 0.64% 0.64%5
Ratio of net investment income to average net assets6
Before expense reimbursement (recapture) and fees waived . . . . . . . . . . . . . . . . . . . . . . . . . . . . . . . . . . . . . . . (0.20)% 0.18% (41.09)%5
After expense reimbursement (recapture) and fees waived . . . . . . . . . . . . . . . . . . . . . . . . . . . . . . . . . . . . . . . . 0.30% 1.77% 1.67%5
Portfolio turnover rate . . . . . . . . . . . . . . . . . . . . . . . . . . . . . . . . . . . . . . . . . . . . . . . . . . . . . . . . . . . . . . . . . . . . . . . 190.65% 190.99% 388.79%3
1 Commencement of operations.2 Net investment income per share has been calculated based on average shares outstanding during the year.3 Not annualized.4 These ratios exclude the impact of the expenses of the underlying investment companies and exchange-traded funds in which the Fund invests.5 Annualized.6 Recognition of the net investment income by the Fund is affected by the timing of the declaration of dividends by the underlying investment companies and exchange-
traded funds in which the Fund invests.7 Realized and unrealized gains and losses per shares in this caption are balancing amounts necessary to reconcile the change in net asset value per share for the year,
and may not reconcile with aggregate gains and losses in the Statement of Operations due to share transactions for the year.
See notes to financial statements.
138
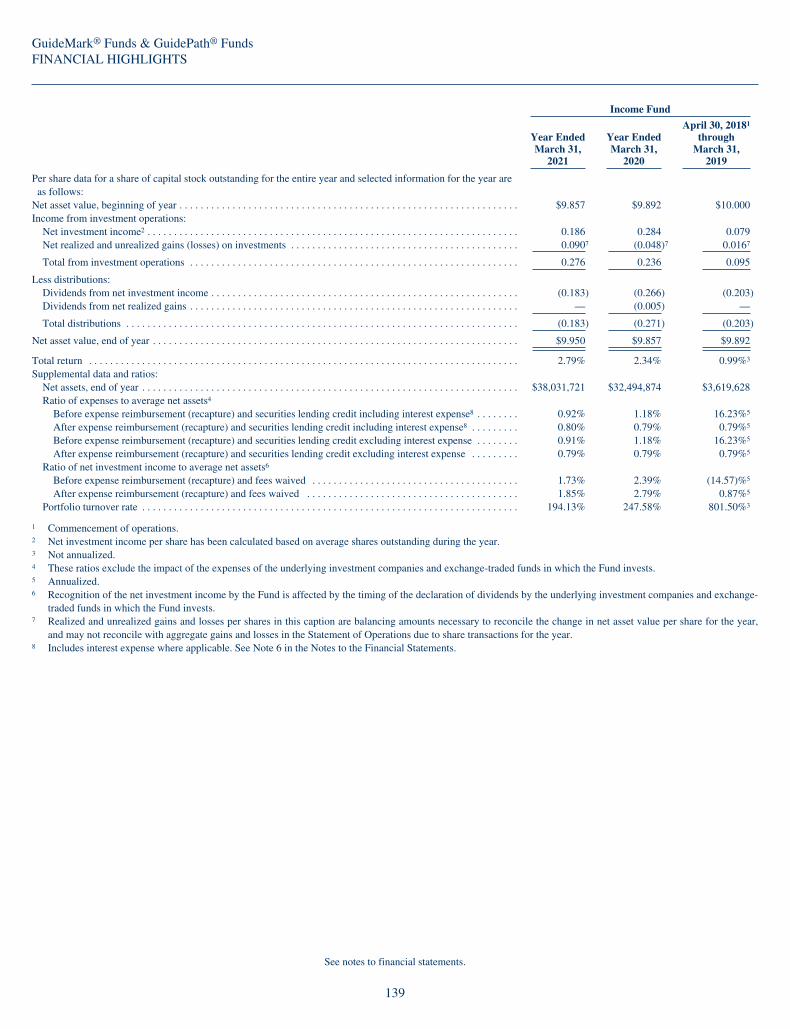
GuideMark® Funds & GuidePath® FundsFINANCIAL HIGHLIGHTS
Income Fund
Year EndedMarch 31,
2021
Year EndedMarch 31,
2020
April 30, 20181
throughMarch 31,
2019
Per share data for a share of capital stock outstanding for the entire year and selected information for the year areas follows:
Net asset value, beginning of year . . . . . . . . . . . . . . . . . . . . . . . . . . . . . . . . . . . . . . . . . . . . . . . . . . . . . . . . . . . . . . . . $9.857 $9.892 $10.000Income from investment operations:
Net investment income2 . . . . . . . . . . . . . . . . . . . . . . . . . . . . . . . . . . . . . . . . . . . . . . . . . . . . . . . . . . . . . . . . . . . . . . 0.186 0.284 0.079Net realized and unrealized gains (losses) on investments . . . . . . . . . . . . . . . . . . . . . . . . . . . . . . . . . . . . . . . . . . . 0.0907 (0.048)7 0.0167
Total from investment operations . . . . . . . . . . . . . . . . . . . . . . . . . . . . . . . . . . . . . . . . . . . . . . . . . . . . . . . . . . . . . . 0.276 0.236 0.095
Less distributions:Dividends from net investment income . . . . . . . . . . . . . . . . . . . . . . . . . . . . . . . . . . . . . . . . . . . . . . . . . . . . . . . . . . (0.183) (0.266) (0.203)Dividends from net realized gains . . . . . . . . . . . . . . . . . . . . . . . . . . . . . . . . . . . . . . . . . . . . . . . . . . . . . . . . . . . . . . — (0.005) —
Total distributions . . . . . . . . . . . . . . . . . . . . . . . . . . . . . . . . . . . . . . . . . . . . . . . . . . . . . . . . . . . . . . . . . . . . . . . . . . (0.183) (0.271) (0.203)
Net asset value, end of year . . . . . . . . . . . . . . . . . . . . . . . . . . . . . . . . . . . . . . . . . . . . . . . . . . . . . . . . . . . . . . . . . . . . . $9.950 $9.857 $9.892
Total return . . . . . . . . . . . . . . . . . . . . . . . . . . . . . . . . . . . . . . . . . . . . . . . . . . . . . . . . . . . . . . . . . . . . . . . . . . . . . . . . . 2.79% 2.34% 0.99%3
Supplemental data and ratios:Net assets, end of year . . . . . . . . . . . . . . . . . . . . . . . . . . . . . . . . . . . . . . . . . . . . . . . . . . . . . . . . . . . . . . . . . . . . . . . $38,031,721 $32,494,874 $3,619,628Ratio of expenses to average net assets4
Before expense reimbursement (recapture) and securities lending credit including interest expense8 . . . . . . . . 0.92% 1.18% 16.23%5
After expense reimbursement (recapture) and securities lending credit including interest expense8 . . . . . . . . . 0.80% 0.79% 0.79%5
Before expense reimbursement (recapture) and securities lending credit excluding interest expense . . . . . . . . 0.91% 1.18% 16.23%5
After expense reimbursement (recapture) and securities lending credit excluding interest expense . . . . . . . . . 0.79% 0.79% 0.79%5
Ratio of net investment income to average net assets6
Before expense reimbursement (recapture) and fees waived . . . . . . . . . . . . . . . . . . . . . . . . . . . . . . . . . . . . . . . 1.73% 2.39% (14.57)%5
After expense reimbursement (recapture) and fees waived . . . . . . . . . . . . . . . . . . . . . . . . . . . . . . . . . . . . . . . . 1.85% 2.79% 0.87%5
Portfolio turnover rate . . . . . . . . . . . . . . . . . . . . . . . . . . . . . . . . . . . . . . . . . . . . . . . . . . . . . . . . . . . . . . . . . . . . . . . 194.13% 247.58% 801.50%3
1 Commencement of operations.2 Net investment income per share has been calculated based on average shares outstanding during the year.3 Not annualized.4 These ratios exclude the impact of the expenses of the underlying investment companies and exchange-traded funds in which the Fund invests.5 Annualized.6 Recognition of the net investment income by the Fund is affected by the timing of the declaration of dividends by the underlying investment companies and exchange-
traded funds in which the Fund invests.7 Realized and unrealized gains and losses per shares in this caption are balancing amounts necessary to reconcile the change in net asset value per share for the year,
and may not reconcile with aggregate gains and losses in the Statement of Operations due to share transactions for the year.8 Includes interest expense where applicable. See Note 6 in the Notes to the Financial Statements.
See notes to financial statements.
139

GuideMark® Funds & GuidePath® FundsFINANCIAL HIGHLIGHTS
Growth & Income Fund
Year EndedMarch 31,
2021
Year EndedMarch 31,
2020
April 30, 20181
throughMarch 31,
2019
Per share data for a share of capital stock outstanding for the entire year and selected information for the year areas follows:
Net asset value, beginning of year . . . . . . . . . . . . . . . . . . . . . . . . . . . . . . . . . . . . . . . . . . . . . . . . . . . . . . . . . . . . . . . . $8.717 $9.772 $10.000Income from investment operations:
Net investment income2 . . . . . . . . . . . . . . . . . . . . . . . . . . . . . . . . . . . . . . . . . . . . . . . . . . . . . . . . . . . . . . . . . . . . . . 0.134 0.189 0.331Net realized and unrealized gains (losses) on investments . . . . . . . . . . . . . . . . . . . . . . . . . . . . . . . . . . . . . . . . . . . 2.959 (1.094) (0.320)7
Total from investment operations . . . . . . . . . . . . . . . . . . . . . . . . . . . . . . . . . . . . . . . . . . . . . . . . . . . . . . . . . . . . . . 3.093 (0.905) 0.011
Less distributions:Dividends from net investment income . . . . . . . . . . . . . . . . . . . . . . . . . . . . . . . . . . . . . . . . . . . . . . . . . . . . . . . . . . (0.127) (0.146) (0.239)Dividends from net realized gains . . . . . . . . . . . . . . . . . . . . . . . . . . . . . . . . . . . . . . . . . . . . . . . . . . . . . . . . . . . . . . — (0.004) —
Total distributions . . . . . . . . . . . . . . . . . . . . . . . . . . . . . . . . . . . . . . . . . . . . . . . . . . . . . . . . . . . . . . . . . . . . . . . . . . (0.127) (0.150) (0.239)
Net asset value, end of year . . . . . . . . . . . . . . . . . . . . . . . . . . . . . . . . . . . . . . . . . . . . . . . . . . . . . . . . . . . . . . . . . . . . . $11.683 $8.717 $9.772
Total return . . . . . . . . . . . . . . . . . . . . . . . . . . . . . . . . . . . . . . . . . . . . . . . . . . . . . . . . . . . . . . . . . . . . . . . . . . . . . . . . . 35.67% (9.45)% 0.14%3
Supplemental data and ratios:Net assets, end of year . . . . . . . . . . . . . . . . . . . . . . . . . . . . . . . . . . . . . . . . . . . . . . . . . . . . . . . . . . . . . . . . . . . . . . . $86,833,376 $33,927,659 $4,519,060Ratio of expenses to average net assets4
Before expense reimbursement (recapture) and securities lending credit including interest expense8 . . . . . . . . 0.95% 1.34% 27.58%5
After expense reimbursement (recapture) and securities lending credit including interest expense8 . . . . . . . . . 0.80% 0.79% 0.79%5
Before expense reimbursement (recapture) and securities lending credit excluding interest expense . . . . . . . . 0.94% 1.34% 27.58%5
After expense reimbursement (recapture) and securities lending credit excluding interest expense . . . . . . . . . 0.79% 0.79% 0.79%5
Ratio of net investment income to average net assets6
Before expense reimbursement (recapture) and fees waived . . . . . . . . . . . . . . . . . . . . . . . . . . . . . . . . . . . . . . . 1.13% 1.34% (23.11)%5
After expense reimbursement (recapture) and fees waived . . . . . . . . . . . . . . . . . . . . . . . . . . . . . . . . . . . . . . . . 1.28% 1.89% 3.68%5
Portfolio turnover rate . . . . . . . . . . . . . . . . . . . . . . . . . . . . . . . . . . . . . . . . . . . . . . . . . . . . . . . . . . . . . . . . . . . . . . . 108.96% 159.34% 123.50%3
1 Commencement of operations.2 Net investment income per share has been calculated based on average shares outstanding during the year.3 Not annualized.4 These ratios exclude the impact of the expenses of the underlying investment companies and exchange-traded funds in which the Fund invests.5 Annualized.6 Recognition of the net investment income by the Fund is affected by the timing of the declaration of dividends by the underlying investment companies and exchange-
traded funds in which the Fund invests.7 Realized and unrealized gains and losses per shares in this caption are balancing amounts necessary to reconcile the change in net asset value per share for the year,
and may not reconcile with aggregate gains and losses in the Statement of Operations due to share transactions for the year.8 Includes interest expense where applicable. See Note 6 in the Notes to the Financial Statements.
See notes to financial statements.
140

GuideMark® Funds & GuidePath® FundsNOTES TO FINANCIAL STATEMENTSMarch 31, 2021
1. Organization
GPS Funds I and GPS Funds II (the “Trusts”) are organized asDelaware statutory trusts under Declarations of Trusts datedJanuary 2, 2001 and October 20, 2010, respectively. The Trusts areregistered under the Investment Company Act of 1940, as amended(the “1940 Act”), as open-end management investment companies.GPS Funds I is comprised of the following 5 funds: GuideMark®
Large Cap Core Fund, GuideMark® Emerging Markets Fund,GuideMark® Small/Mid Cap Core Fund, GuideMark® World ex-USFund, GuideMark® Core Fixed Income. GPS Funds II is comprisedof the following 10 funds: GuidePath® Growth Allocation Fund,GuidePath® Conservative Allocation Fund, GuidePath® TacticalAllocation Fund, GuidePath® Absolute Return Allocation Fund,GuidePath® Multi-Asset Income Allocation Fund, GuidePath®
Flexible Income Allocation Fund, GuidePath® Managed FuturesStrategy Fund, GuidePath® Conservative Income Fund, GuidePath®
Income Fund and GuidePath® Growth and Income Fund(collectively, the “Funds”). All of the Funds are classified andoperate as diversified funds under the 1940 Act. Each Fundrepresents a distinct portfolio with its own investment objectivesand policies. The assets of each Fund are segregated, and ashareholder’s interest is limited to the Fund in which shares areheld. GuidePath® Growth Allocation Fund, GuidePath®
Conservative Allocation Fund, GuidePath® Tactical AllocationFund and GuidePath® Absolute Return Allocation Fund wereseeded on March 4, 2011 and the prospectus went effective onApril 1, 2011. The GuidePath® Growth Allocation Fund,GuidePath® Conservative Allocation Fund, GuidePath® TacticalAllocation Fund and GuidePath® Absolute Return Allocation Fundcommenced operations on April 29, 2011. The GuidePath® Multi-Asset Income Allocation Fund and GuidePath® Flexible IncomeAllocation Fund commenced operations on August 31, 2012. TheGuidePath® Managed Futures Strategy Fund commenced operationson January 19, 2016. The GuidePath® Conservative Income Fund,GuidePath® Income Fund and GuidePath® Growth and IncomeFund commenced operations on April 30, 2018. Each Fund offerstwo classes of shares: Service Shares and Institutional Shares,except GuidePath® Conservative Income Fund, GuidePath® IncomeFund and GuidePath® Growth and Income Fund, which are onlyoffered with a single share class. Certain Fund classes were withoutshares as of the period end; any share activity related to thoseclasses is presented in the Statement of Changes in Net Assets. TheFunds are investment companies and accordingly follow theinvestment company accounting and reporting guidance of theFinancial Accounting Standards Board (“FASB”) AccountingStandards Codification Topic 946 Financial Services – InvestmentCompanies.
2. Fund of Funds
The GuidePath® Growth Allocation Fund, GuidePath®
Conservative Allocation Fund, GuidePath® Absolute ReturnAllocation Fund, GuidePath® Multi-Asset Income Allocation Fund,GuidePath® Flexible Income Allocation Fund, GuidePath®
Conservative Income Fund, GuidePath® Income Fund andGuidePath® Growth and Income Fund each operate as a “Fund ofFunds,” investing primarily (or, in the case of the GuidePath®
Tactical Allocation Fund, between 10% and 100% of its assets) inregistered investment companies, including mutual funds and
exchange-traded funds (“ETFs”). The funds in which the Fund ofFunds may invest are referred to herein as the “Underlying Funds.”The Advisor believes that investing in Underlying Funds provideseach Fund of Funds with an efficient means of creating a portfoliothat provides investors with indirect exposure to a broad range ofsecurities. By investing in a Fund of Funds, you will indirectly bearfees and expenses of the Underlying Funds in addition to the Fund’sdirect fees and expenses. In order to obtain exposure to certainmarkets, asset classes or active management styles, each Fund ofFunds may buy Underlying Funds managed by the Advisor or itsaffiliates, which in turn, invest in various securities, including ETFs.The Fund of Funds may also invest directly in securities and otherexchange-traded products, such as exchange-traded notes.
3. Significant Accounting Policies
The following is a summary of significant accounting policiesconsistently followed by the Funds in the preparation of thefinancial statements. These policies are in conformity with U.S.generally accepted accounting principles (“GAAP”).
(a) Investment ValuationPortfolio securities listed on a national or foreign securitiesexchange, except those listed on NASDAQ, for which marketquotations are available are valued at the last quoted sale priceon each business day. Portfolio securities traded on NASDAQare valued at the NASDAQ Official Closing Price (“NOCP”) oneach business day. If there is no reported sale on an exchange orNASDAQ, the portfolio security will be valued at the meanbetween the most recent quoted bid and asked price. Priceinformation on listed securities is taken from the exchangewhere the security is primarily traded.
All equity securities that are not traded on a listed exchange arevalued at the last sale price in the over-the-counter market. If anon-exchange traded security does not trade on a particular day,then the mean between the last quoted closing bid and askedprice will be used. Non-exchange traded ADRs are priced withan evaluated price as determined by the current evaluatedpricing procedures of, and provided by, the pricing vendor.
Fixed income securities that have a maturity of greater than 60days are generally valued on the basis of evaluations obtainedfrom third party pricing services, which take into accountappropriate factors such as institutional-sized trading in similargroups of securities, yield, quality, coupon rate, maturity, typeof issue, trading characteristics and other market data. Shortterm investments having a maturity of less than 60 days aregenerally valued at amortized cost, which approximates fairvalue.
Investments in mutual funds are valued at the closing net assetvalue per share of each mutual fund on the day of valuation.These investments in mutual funds may include investments inaffiliated mutual funds. Investments in mutual funds aregenerally priced using values supplied by the underlying fundsthemselves. Units of Mount Vernon Liquid Assets Portfolio arenot traded on an exchange and are valued at the investmentcompany’s NAV per share.
To assess the continuing appropriateness of security valuation,the Advisor regularly compares prior day prices with current
141
GuideMark® Funds & GuidePath® FundsNOTES TO FINANCIAL STATEMENTS (Continued)March 31, 2021
day prices and transaction prices. When the comparison resultsexceed pre-defined thresholds, the Advisor challenges the pricesexceeding tolerance levels with the pricing service or broker.Securities for which no market quotations are readily availableor when a significant event has occurred between the time of thesecurity’s last close and the time that a Fund next calculates itsnet asset value will be valued at their fair value as determinedby the applicable Fund’s Valuation Committee. Securities forwhich no market prices are readily available will be valued attheir fair value as determined by the Valuation Committee underprocedures adopted by the applicable Board of Trustees (the“Board”).
The Funds have adopted authoritative fair valuation accountingstandards which establish an authoritative definition of fairvalue and set out a hierarchy for measuring fair value. Thesestandards require additional disclosures about the various inputsand valuation techniques used to develop the measurements offair value and a discussion in changes in valuation techniquesand related inputs, if any, during the year. In addition, thesestandards require expanded disclosure for each major categoryof assets. These inputs are summarized in the three broad levelslisted below:
Level 1 – Quoted prices in active markets for identicalsecurities.
Level 2 – Other significant observable inputs (including quotedprices for similar securities, interest rates, prepayment speeds,credit risk, etc.).
Level 3 – Significant unobservable inputs (including the Funds’own assumptions in determining the fair value of investments).
During the year, certain securities and other instruments held bythe Funds were categorized as Level 2 or Level 3 based uponthe inputs and methodologies used to determine the fair value ofthe security or instrument. Descriptions of the inputs andvaluation methodologies used to determine the fair values ofeach class of investments within Level 2 and Level 3 are setforth below.
Level 2 Investments. The Funds’ investments that werecategorized as Level 2 include: (1) certain fixed incomesecurities, including asset-backed securities, collateralizedmortgage obligations, corporate obligations, U.S. and foreigngovernment obligations, mortgage-backed securities andmunicipal bonds; (2) certain foreign common stocks, preferredstocks, participatory notes, and real estate investment trusts; and(3) certain over-the-counter derivative instruments, includingforward currency contracts, and swaps.
Fixed income securities are normally valued by pricing vendorsthat use broker-dealer quotations, reported trades or valuationestimates from their internal pricing models. The serviceproviders’ internal models typically use inputs that areobservable such as institutional-sized trading in similar groupsof securities, yield, credit quality, coupon rate, maturity, type ofissue, trading characteristics and other market data.
Certain common stocks that trade on foreign exchanges aresubject to valuation adjustments. These valuation adjustments
are applied to the foreign exchange-traded common stocks toaccount for the market movement between the close of theforeign market in which the security is traded and the close ofthe New York Stock Exchange. These securities are valuedusing pricing vendors that consider the correlation patterns ofprice movements of the foreign security to the intraday tradingin the U.S. markets.
Forward currency contracts and swaps derive their value fromunderlying asset prices, indices, reference rates, and other inputsor a combination of these factors. These instruments arenormally valued using pricing vendors. Depending upon theinstrument, its value may be provided by a pricing vendor usinga series of techniques, including pricing models. The pricingmodels typically use inputs that are observed from activemarkets such as indices, spreads, interest rates, curves,dividends and exchange rates.
Level 3 Investments. The Funds’ investments that werecategorized as Level 3 include: fair valued securities.
Fair valued securities are normally valued by pricing vendorsusing relevant observable inputs, as described above. In certaincircumstances, the types of observable inputs that are typicallyused by a pricing service may be unavailable or deemed by thepricing service to be unreliable. In these instances, the pricingvendor may value the security based upon significantunobservable inputs, or the pricing vendor may not provide avalue for the security. To the extent that a pricing vendor doesnot provide a value for a particular security, or the pricingvendor provides a value that the Valuation Committee does notbelieve accurately reflects the value of the security, the securitywill be valued by the Valuation Committee based upon theinformation available to the Committee at the time of valuationand in accordance with procedures adopted by the Board. Thesemethodologies may require subjective judgments anddeterminations about the value of a particular security. Whensignificant unobservable inputs are used to value a security, thesecurity is categorized as Level 3.
To verify Level 3 unobservable inputs, the ValuationCommittee uses a variety of techniques as appropriate tosubstantiate these valuation approaches including a regularreview of key inputs and assumptions, transaction back-testingor disposition analysis and review of related market activity.
The inputs or methodology used for valuing securities are not anindication of the risk associated with investing in thosesecurities.
142
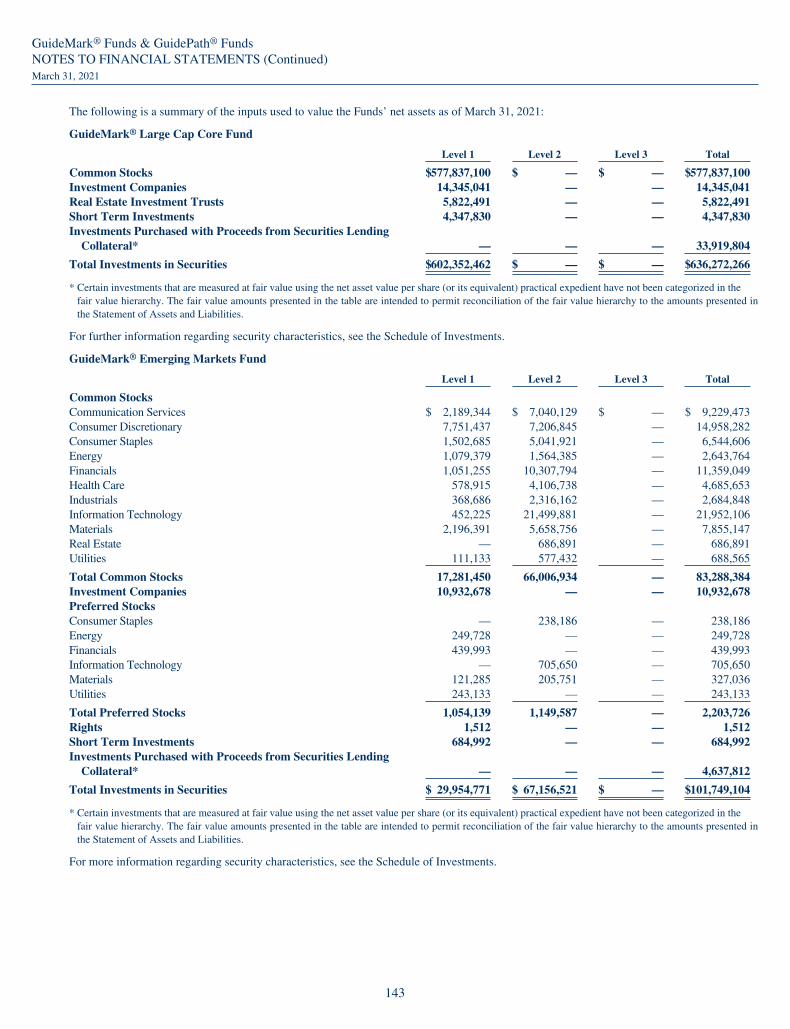
GuideMark® Funds & GuidePath® FundsNOTES TO FINANCIAL STATEMENTS (Continued)March 31, 2021
The following is a summary of the inputs used to value the Funds’ net assets as of March 31, 2021:
GuideMark® Large Cap Core Fund
Level 1 Level 2 Level 3 Total
Common Stocks $577,837,100 $ — $ — $577,837,100Investment Companies 14,345,041 — — 14,345,041Real Estate Investment Trusts 5,822,491 — — 5,822,491Short Term Investments 4,347,830 — — 4,347,830Investments Purchased with Proceeds from Securities Lending
Collateral* — — — 33,919,804
Total Investments in Securities $602,352,462 $ — $ — $636,272,266
* Certain investments that are measured at fair value using the net asset value per share (or its equivalent) practical expedient have not been categorized in thefair value hierarchy. The fair value amounts presented in the table are intended to permit reconciliation of the fair value hierarchy to the amounts presented inthe Statement of Assets and Liabilities.
For further information regarding security characteristics, see the Schedule of Investments.
GuideMark® Emerging Markets Fund
Level 1 Level 2 Level 3 Total
Common StocksCommunication Services $ 2,189,344 $ 7,040,129 $ — $ 9,229,473Consumer Discretionary 7,751,437 7,206,845 — 14,958,282Consumer Staples 1,502,685 5,041,921 — 6,544,606Energy 1,079,379 1,564,385 — 2,643,764Financials 1,051,255 10,307,794 — 11,359,049Health Care 578,915 4,106,738 — 4,685,653Industrials 368,686 2,316,162 — 2,684,848Information Technology 452,225 21,499,881 — 21,952,106Materials 2,196,391 5,658,756 — 7,855,147Real Estate — 686,891 — 686,891Utilities 111,133 577,432 — 688,565
Total Common Stocks 17,281,450 66,006,934 — 83,288,384Investment Companies 10,932,678 — — 10,932,678Preferred StocksConsumer Staples — 238,186 — 238,186Energy 249,728 — — 249,728Financials 439,993 — — 439,993Information Technology — 705,650 — 705,650Materials 121,285 205,751 — 327,036Utilities 243,133 — — 243,133
Total Preferred Stocks 1,054,139 1,149,587 — 2,203,726Rights 1,512 — — 1,512Short Term Investments 684,992 — — 684,992Investments Purchased with Proceeds from Securities Lending
Collateral* — — — 4,637,812
Total Investments in Securities $ 29,954,771 $ 67,156,521 $ — $101,749,104
* Certain investments that are measured at fair value using the net asset value per share (or its equivalent) practical expedient have not been categorized in thefair value hierarchy. The fair value amounts presented in the table are intended to permit reconciliation of the fair value hierarchy to the amounts presented inthe Statement of Assets and Liabilities.
For more information regarding security characteristics, see the Schedule of Investments.
143

GuideMark® Funds & GuidePath® FundsNOTES TO FINANCIAL STATEMENTS (Continued)March 31, 2021
GuideMark® Small/Mid Cap Core Fund
Level 1 Level 2 Level 3 Total
Common Stock $ 85,497,758 $ — $ 3,866 $ 85,501,624Investment Companies 3,265,582 — — 3,265,582Real Estate Investment Trusts 3,258,590 — — 3,258,590Short Term Investments 689,166 — — 689,166Investments Purchased with Proceeds from Securities Lending
Collateral* — — — 6,578,455
Total Investments in Securities $ 92,711,096 $ — $ 3,866 $ 99,293,417
* Certain investments that are measured at fair value using the net asset value per share (or its equivalent) practical expedient have not been categorized in thefair value hierarchy. The fair value amounts presented in the table are intended to permit reconciliation of the fair value hierarchy to the amounts presented inthe Statement of Assets and Liabilities.
For further information regarding security characteristics, see the Schedule of Investments.
Below is a reconciliation of Level 3 assets for which significant unobservable inputs were used to determine fair value.
Description Common Stocks Rights
Balance as of April 1, 2020 $ 9,708 0Purchases — —Sales proceeds and paydowns — 0Accreted discounts, net —Corporate Actions 0 —Realized gain (loss) — 0Change in unrealized appreciation (depreciation) (5,842) —Transfers into/(out of) Level 3 — —
Balance as of March 31, 2021 $ 3,866 —
Change in unrealized appreciation (depreciation) during the year for Level 3 investments held atMarch 31, 2021. $ (5,842) —
GuideMark® World ex-US Fund
Level 1 Level 2 Level 3 Total
Common StocksCommunication Services $ 40,711 $ 6,186,617 $ — $ 6,227,328Consumer Discretionary 556,879 18,245,478 — 18,802,357Consumer Staples 2,008,135 13,715,016 — 15,723,151Energy 314,279 2,531,919 — 2,846,198Financials 3,842,282 17,302,110 — 21,144,392Health Care 526,010 17,204,534 — 17,730,544Industrials 1,792,189 18,452,961 — 20,245,150Information Technology 1,864,551 10,551,705 — 12,416,256Materials 1,439,599 9,652,502 — 11,092,101Real Estate 99,007 321,820 — 420,827Utilities 190,564 3,006,915 — 3,197,479
Total Common Stocks 12,674,206 117,171,577 — 129,845,783Investment Companies 4,588,494 — — 4,588,494Participatory Notes — 37,901 — 37,901Preferred Stocks — 1,061,668 — 1,061,668Real Estate Investment Trusts — 355,976 — 355,976Rights — — 3,326 3,326Short Term Investments 834,008 — — 834,008Investments Purchased with Proceeds from Securities Lending
Collateral* — — — 702,165
Total Investments in Securities $ 18,096,708 $118,627,122 $ 3,326 $137,429,321
* Certain investments that are measured at fair value using the net asset value per share (or its equivalent) practical expedient have not been categorized in thefair value hierarchy. The fair value amounts presented in the table are intended to permit reconciliation of the fair value hierarchy to the amounts presented inthe Statement of Assets and Liabilities.
144

GuideMark® Funds & GuidePath® FundsNOTES TO FINANCIAL STATEMENTS (Continued)March 31, 2021
For further information regarding security characteristics, see the Schedule of Investments.
Below is a reconciliation of Level 3 assets for which significant unobservable inputs were used to determine fair value.
Description Rights
Balance as of April 1, 2020 $ —Purchases —Sales proceeds and paydowns —Accreted discounts, net —Corporate Actions 0Realized gain (loss) —Change in unrealized appreciation (depreciation) 3,326Transfers into/(out of) Level 3 —
Balance as of March 31, 2021 $ 3,326
Change in unrealized appreciation (depreciation) during the year for Level 3 investments held at March 31, 2021. $ 3,326
GuideMark® Core Fixed Income Fund
Level 1 Level 2 Level 3 Total
Fixed IncomeAsset Backed Securities $ — $ 6,408,675 $ — $ 6,408,675Collateralized Mortgage Obligations — 23,240,407 — 23,240,407Corporate Obligations — 56,256,477 — 56,256,477Foreign Government Debt Obligations — 2,359,117 — 2,359,117Mortgage Backed Securities – U.S. Government Agency — 70,455,612 — 70,455,612Municipal Debt Obligations — 3,010,328 — 3,010,328U.S. Treasury Obligations — 54,982,930 — 54,982,930
Total Fixed Income — 216,713,546 — 216,713,546Short Term Investments 13,372,829 — — 13,372,829Investments Purchased with Proceeds from Securities Lending
Collateral* — — — 4,583,430
Total Investments in Securities $ 13,372,829 $216,713,546 $ — $234,669,805
Other Financial Instruments**Futures $ 441,425 $ — $ — $ 441,425Swaps — 380,308 — 380,308* Certain investments that are measured at fair value using the net asset value per share (or its equivalent) practical expedient have not been categorized in the
fair value hierarchy. The fair value amounts presented in the table are intended to permit reconciliation of the fair value hierarchy to the amounts presented inthe Statement of Assets and Liabilities.
**Other financial instruments are derivative instruments not reflected in the Schedule of Investments, such as futures and swaps. Futures and swaps are reflectedas the unrealized appreciation (depreciation) on the instrument.
For more information regarding security characteristics, see the Schedule of Investments.
GuidePath® Growth Allocation Fund
Level 1 Level 2 Level 3 Total
Investment Companies $1,064,665,835 $ — $ — $1,064,665,835Short Term Investments 12,717,743 — — 12,717,743Investments Purchased with Proceeds from Securities Lending
Collateral* — — — 273,607,847
Total Investments in Securities $1,077,383,578 $ — $ — $1,350,991,425
* Certain investments that are measured at fair value using the net asset value per share (or its equivalent) practical expedient have not been categorized in thefair value hierarchy. The fair value amounts presented in the table are intended to permit reconciliation of the fair value hierarchy to the amounts presented inthe Statement of Assets and Liabilities.
For further information regarding security characteristics, see the Schedule of Investments.
145
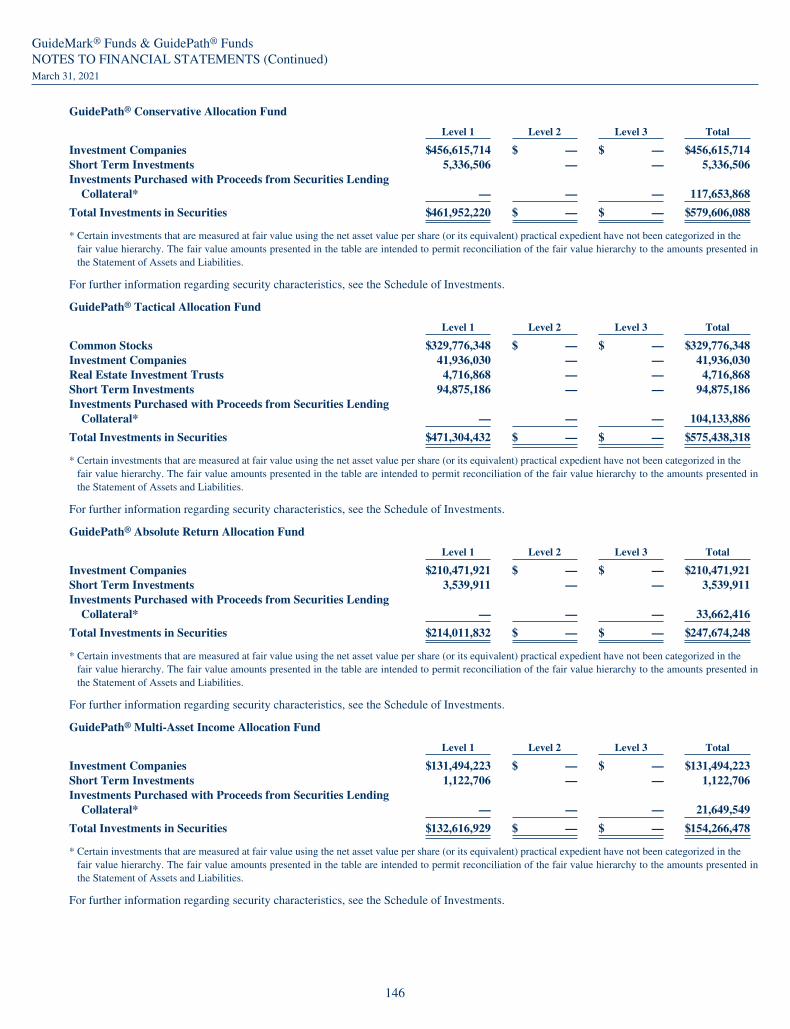
GuideMark® Funds & GuidePath® FundsNOTES TO FINANCIAL STATEMENTS (Continued)March 31, 2021
GuidePath® Conservative Allocation Fund
Level 1 Level 2 Level 3 Total
Investment Companies $456,615,714 $ — $ — $456,615,714Short Term Investments 5,336,506 — — 5,336,506Investments Purchased with Proceeds from Securities Lending
Collateral* — — — 117,653,868
Total Investments in Securities $461,952,220 $ — $ — $579,606,088
* Certain investments that are measured at fair value using the net asset value per share (or its equivalent) practical expedient have not been categorized in thefair value hierarchy. The fair value amounts presented in the table are intended to permit reconciliation of the fair value hierarchy to the amounts presented inthe Statement of Assets and Liabilities.
For further information regarding security characteristics, see the Schedule of Investments.
GuidePath® Tactical Allocation Fund
Level 1 Level 2 Level 3 Total
Common Stocks $329,776,348 $ — $ — $329,776,348Investment Companies 41,936,030 — — 41,936,030Real Estate Investment Trusts 4,716,868 — — 4,716,868Short Term Investments 94,875,186 — — 94,875,186Investments Purchased with Proceeds from Securities Lending
Collateral* — — — 104,133,886
Total Investments in Securities $471,304,432 $ — $ — $575,438,318
* Certain investments that are measured at fair value using the net asset value per share (or its equivalent) practical expedient have not been categorized in thefair value hierarchy. The fair value amounts presented in the table are intended to permit reconciliation of the fair value hierarchy to the amounts presented inthe Statement of Assets and Liabilities.
For further information regarding security characteristics, see the Schedule of Investments.
GuidePath® Absolute Return Allocation Fund
Level 1 Level 2 Level 3 Total
Investment Companies $210,471,921 $ — $ — $210,471,921Short Term Investments 3,539,911 — — 3,539,911Investments Purchased with Proceeds from Securities Lending
Collateral* — — — 33,662,416
Total Investments in Securities $214,011,832 $ — $ — $247,674,248
* Certain investments that are measured at fair value using the net asset value per share (or its equivalent) practical expedient have not been categorized in thefair value hierarchy. The fair value amounts presented in the table are intended to permit reconciliation of the fair value hierarchy to the amounts presented inthe Statement of Assets and Liabilities.
For further information regarding security characteristics, see the Schedule of Investments.
GuidePath® Multi-Asset Income Allocation Fund
Level 1 Level 2 Level 3 Total
Investment Companies $131,494,223 $ — $ — $131,494,223Short Term Investments 1,122,706 — — 1,122,706Investments Purchased with Proceeds from Securities Lending
Collateral* — — — 21,649,549
Total Investments in Securities $132,616,929 $ — $ — $154,266,478
* Certain investments that are measured at fair value using the net asset value per share (or its equivalent) practical expedient have not been categorized in thefair value hierarchy. The fair value amounts presented in the table are intended to permit reconciliation of the fair value hierarchy to the amounts presented inthe Statement of Assets and Liabilities.
For further information regarding security characteristics, see the Schedule of Investments.
146

GuideMark® Funds & GuidePath® FundsNOTES TO FINANCIAL STATEMENTS (Continued)March 31, 2021
GuidePath® Flexible Income Allocation Fund
Level 1 Level 2 Level 3 Total
Investment Companies $274,853,090 $ — $ — $274,853,090Short Term Investments 1,398,577 — — 1,398,577Investments Purchased with Proceeds from Securities Lending
Collateral* — — — 58,619,752
Total Investments in Securities $276,251,667 $ — $ — $334,871,419
* Certain investments that are measured at fair value using the net asset value per share (or its equivalent) practical expedient have not been categorized in thefair value hierarchy. The fair value amounts presented in the table are intended to permit reconciliation of the fair value hierarchy to the amounts presented inthe Statement of Assets and Liabilities.
For further information regarding security characteristics, see the Schedule of Investments.
GuidePath® Managed Futures Strategy Fund
Level 1 Level 2 Level 3 Total
Short Term Investments $ 12,993,407 $183,994,132 $ — $196,987,539
Total Investments in Securities $ 12,993,407 $183,994,132 $ — $196,987,539
Other Financial Instruments*Futures $ 4,362,676 $ — $ — $ 4,362,676Forward Currency Contracts $ — $ (328,412) $ — $ (328,412)* Other financial instruments are derivative instruments not reflected in the Consolidated Schedule of Investments, such as futures and forward currency
contracts. Futures and forward currency contracts are reflected as the unrealized appreciation (depreciation) on the instrument.
For further information regarding security characteristics, see the Consolidated Schedule of Investments.
GuidePath® Conservative Income Fund
Level 1 Level 2 Level 3 Total
Investment Companies $ 8,290,421 $ — $ — $ 8,290,421Short Term Investments 6,506,956 1,109,573 — 7,616,529Investments Purchased with Proceeds from Securities Lending
Collateral* — — — 537,300
Total Investments in Securities $ 14,797,377 $ 1,109,573 $ — $ 16,444,250
* Certain investments that are measured at fair value using the net asset value per share (or its equivalent) practical expedient have not been categorized in thefair value hierarchy. The fair value amounts presented in the table are intended to permit reconciliation of the fair value hierarchy to the amounts presented inthe Statement of Assets and Liabilities.
For further information regarding security characteristics, see the Schedule of Investments.
GuidePath® Income Fund
Level 1 Level 2 Level 3 Total
Investment Companies $ 37,597,029 $ — $ — $ 37,597,029Short Term Investments 606,482 — — 606,482Investments Purchased with Proceeds from Securities Lending
Collateral* — — — 7,653,784
Total Investments in Securities $ 38,203,511 $ — $ — $ 45,857,295
* Certain investments that are measured at fair value using the net asset value per share (or its equivalent) practical expedient have not been categorized in thefair value hierarchy. The fair value amounts presented in the table are intended to permit reconciliation of the fair value hierarchy to the amounts presented inthe Statement of Assets and Liabilities.
For further information regarding security characteristics, see the Schedule of Investments.
147

GuideMark® Funds & GuidePath® FundsNOTES TO FINANCIAL STATEMENTS (Continued)March 31, 2021
GuidePath® Growth & Income Fund
Level 1 Level 2 Level 3 Total
Common Stock $ 32,336,796 $ — $ — $ 32,336,796Investment Companies 30,395,461 — — 30,395,461Short Term Investments 14,982,138 9,058,183 — 24,040,321Investments Purchased with Proceeds from Securities Lending
Collateral* — — — 1,005,669
Total Investments in Securities $ 77,714,395 $ 9,058,183 $ — $ 87,778,247
Other Financial Instruments**Futures $ (19,928) $ — $ — $ (19,928)Options Written (116,815) — — (116,815)* Certain investments that are measured at fair value using the net asset value per share (or its equivalent) practical expedient have not been categorized in the
fair value hierarchy. The fair value amounts presented in the table are intended to permit reconciliation of the fair value hierarchy to the amounts presented inthe Statement of Assets and Liabilities.
** Other financial instruments are derivative instruments not reflected in the Schedule of Investments, such as futures and written options. Futures are reflectedas unrealized appreciation (depreciation) on the instrument, while written options are reflected at value.
For further information regarding security characteristics, see the Schedule of Investments.
(b) Consolidation of SubsidiaryThe GuidePath® Managed Futures Strategy Fund may invest upto 25% of its total assets in GuidePath Managed FuturesStrategy Cayman Fund Ltd. (the “Subsidiary”). The Subsidiary,which is organized under the laws of the Cayman Islands, iswholly-owned and controlled by GuidePath® Managed FuturesStrategy Fund. The financial statements of the GuidePath®
Managed Futures Strategy Fund include the operations of theSubsidiary. All intercompany accounts and transactions havebeen eliminated in consolidation. The Subsidiary acts as aninvestment vehicle in order to invest in commodity-linkedderivative instruments consistent with the Fund’s investmentobjectives and policies. The GuidePath® Managed FuturesStrategy Fund had 3.40% of its total assets invested in theSubsidiary as of March 31, 2021.
The Subsidiary is an exempted Cayman Islands investmentcompany and as such is not subject to Cayman Islands taxes atthe present time. For U.S. income tax purposes, the Subsidiary isa Controlled Foreign Corporation (“CFC”) not subject to U.S.income taxes. As a wholly-owned CFC, however, theSubsidiary’s net income and capital gains, if any, will be includedeach year in the Fund’s investment company taxable income.
(c) Subsequent Events EvaluationIn preparing these financial statements, the Funds haveevaluated events and transactions through the date of issuancefor potential recognition or disclosure resulting from subsequentevents. This evaluation did not result in any subsequent eventsthat necessitated disclosures and/or adjustments to the financialstatements, other than the following:
The Board of Trustees of the Trusts, based upon therecommendation of the Advisor, determined to terminate theFunds’ Distribution Plans pursuant to Rule 12b-1 under theInvestment Company Act of 1940, as amended, effective as ofApril 1, 2021. As a result, Service Shares of the Funds no longerpay Rule 12b-1 fees as of April 1, 2021. In addition, to correspondwith the discontinuation of the Funds’ Rule 12b-1 plans, eachFund’s Expense Cap for Service Shares was lowered by 25 basis
points to reflect to the removal of Rule 12b-1 fees, effectiveApril 1, 2021.
(d) Repurchase AgreementsEach Fund may enter into repurchase agreements with banks andsecurities dealers. These transactions involve the purchase ofsecurities with a simultaneous commitment to sell the securitiesto the bank or the dealer at an agreed-upon date and price. Arepurchase agreement is accounted for as an investment by theFund, collateralized by securities, which are delivered to theFund’s Custodian or to an agent bank under a tri-party agreement.The securities are marked-to-market daily and additionalsecurities are acquired as needed, to ensure that their value equalsor exceeds the repurchase price plus accrued interest.
(e) Federal Income TaxesThe Funds intend to continue to comply with the requirementsof sub-chapter M of the Internal Revenue Code necessary toqualify as regulated investment companies and to make therequisite distributions of income and capital gains toshareholders sufficient to relieve the Funds from all orsubstantially all Federal income taxes. Therefore, no Federalincome tax provision is required.
The Funds have adopted financial reporting rules regardingrecognition and measurement of tax positions taken or expectedto be taken on a tax return. In order to avoid imposition of theexcise tax applicable to regulated investment companies, it isalso each Fund’s intention to declare as dividends in eachcalendar year at least 98% of its net investment income (earnedduring the calendar year) and 98.2% of its net realized capitalgains (earned during the twelve months ended October 31) plusundistributed amounts from prior years. The Funds havereviewed all open tax years and major jurisdictions andconcluded that no provision for income tax is required in theFunds’ financial statements. As of and during the year endedMarch 31, 2021, the Funds did not have any tax positions thatdid not meet the “more-likely-than-not” threshold of beingsustained by the applicable tax authority and did not haveliabilities for any unrecognized tax benefits. The Funds
148

GuideMark® Funds & GuidePath® FundsNOTES TO FINANCIAL STATEMENTS (Continued)March 31, 2021
recognize interest and penalties, if any, related to unrecognizedtax benefits as income tax expense on the Statements ofOperations. During the fiscal year ended March 31, 2021, theFunds did not incur any interest or penalties. The Funds’Federal and state income and Federal excise tax returns for taxyears for which the applicable statutes of limitations have notexpired are subject to examination by the Internal RevenueService and state departments of revenue.
(f) Use of EstimatesThe preparation of financial statements in conformity withGAAP requires management to make estimates and assumptionsthat affect the reported amounts of assets and liabilities anddisclosure of contingent assets and liabilities at the date of thefinancial statements and the reported amounts of revenues andexpenses during the reported period. Actual results could differfrom those estimates.
(g) IndemnificationsUnder each Trust’s organizational documents, its officers andtrustees are indemnified against certain liability arising out of theirperformance of their duties to the Funds. In addition, in the normalcourse of business, the Funds enter into contracts that contain avariety of representations and warranties that provide generalindemnifications. The Funds’ maximum exposure under thesearrangements is unknown as this would involve future claims thatmay be made against the Funds that have not yet occurred.However, the Funds expect the risk of loss to be remote.
(h) ExpensesMany expenses of the Funds can be directly attributed to aspecific Fund. Additionally, some expenses can be directlyattributed to a specific Trust, in which case the expense isapportioned among the Funds within that Trust based on relativenet assets. Expenses that cannot be directly attributed to aspecific Fund or Trust are apportioned among all the Fundsbased on relative net assets.
(i) Organization and Offering CostsOrganization costs consist of costs incurred to establish a Fundand enable it legally to do business. The Funds expenseorganizational costs as incurred. These expenses were advancedby the Advisor, and the Advisor has agreed to reimburse theFunds for these expenses, subject to potential recovery (seeNote 4). Offering costs are accounted for as deferred costs untiloperations begin. Offering costs include legal fees regarding thepreparation of the initial registration statement. Offering costsare then amortized to expense over twelve months on a straight-line basis.
(j) Security Transactions and Income RecognitionSecurity transactions are accounted for on trade date. Dividendincome is recognized on the ex-dividend date, and the interestincome recorded using the effective yield method is accrueddaily, and is recognized on an accrual basis. Premiums anddiscounts on the purchase of securities are amortized/accretedusing the effective interest method. Withholding taxes onforeign dividends and taxes on capital gains, which are includedas a component of net investment income and realized gain(loss) on investments, respectively, have been provided inaccordance with the Trusts’ understanding of the applicable
country’s tax rules and rates. Any deferred foreign capital gainstax is accrued based upon net unrealized gains, and is payableupon sale of such investment. Realized gains and losses oninvestment transactions are determined using the high costmethod. Return of capital distributions received from REITsecurities are recorded as an adjustment to the cost of thesecurity and thus may impact unrealized or realized gains orlosses on the security. Gains and losses from paydowns onmortgage and asset backed securities are recorded asadjustments to interest income. Distributions from underlyinginvestment companies are classified as investment income orrealized gains based on the U.S. income tax characteristics ofthe distribution.
(k) Distributions to ShareholdersThe Funds, with the exception of the Core Fixed Income Fund,Multi-Asset Income Allocation Fund, Flexible IncomeAllocation Fund, Conservative Income Fund, Income Fund andGrowth and Income Fund will distribute any net investmentincome at least annually. The Core Fixed Income Fund, Multi-Asset Income Allocation Fund and Flexible Income AllocationFund will distribute any net investment income quarterly. TheConservative Income Fund, Income Fund and Growth andIncome Fund will generally distribute any net investmentincome monthly. All of the Funds will generally distribute anynet realized long or short-term capital gains at least annually.Certain Funds also utilize earnings and profits distributed toshareholders on redemptions of shares as part of the dividendspaid deduction. Distributions to shareholders are recorded onthe ex-dividend date. The Funds may also pay a specialdistribution at the end of the calendar year to comply withFederal tax requirements.
(l) DerivativesEach Fund may invest in derivative securities including putoptions, futures, forward currency contracts and swaps. Theseinstruments may be used by a Fund for hedging purposes aswell as direct investment.
Forward Currency ContractsThe Funds may enter into forward currency contracts, obligatingthe Funds to deliver and receive currency at a specified futuredate. Transactions involving forward currency contracts mayserve as long hedges (for example, if a Fund seeks to buy asecurity denominated in a foreign security, it may purchase aforward currency contract to lock in the U.S. dollar price of thesecurity) or as short hedges (if a Fund anticipates selling asecurity denominated in a foreign currency, it may sell aforward currency contract to lock in the U.S. dollar equivalentof the anticipated sales proceeds). Forward contracts are valueddaily and unrealized appreciation or depreciation is recordeddaily as the difference between the contract exchange rate andthe closing forward rate applied to the face amount of thecontract.
OptionsThe Funds may purchase and write call or put options onsecurities and indices and enter into related closing transactions.All of the Funds may invest in options that are listed on U.S.exchanges or traded over the counter. Exchange-traded optionsare valued at the last reported sale price on the exchange on
149

GuideMark® Funds & GuidePath® FundsNOTES TO FINANCIAL STATEMENTS (Continued)March 31, 2021
which the security underlying the option is principally traded. Ifno sales are reported on a particular day for exchange-tradedoptions, or the options are not exchange-traded, the options arevalued at the mean between the most recent quoted bid andasked quotations at the close of the exchange. The premium thata Fund pays when purchasing a call option or receives whenwriting a call option will reflect, among other things, the marketprice of the security, the relationship of the exercise price to themarket price of the security, the relationship of the exerciseprice to the volatility of the security, the length of the optionperiod and supply and demand factors. The premium is thevalue of an option at the date of purchase.
A purchaser (holder) of a put option pays a non-refundablepremium to the seller (writer) of a put option to obtain the rightto sell a specified amount of a security at a fixed price (theexercise price) during a specified period (exercise period).Conversely, the seller (writer) of a put option, upon payment bythe holder of the premium, has the obligation to buy the securityfrom the holder of the put option at the exercise price during theexercise period.
FuturesEach Fund has the ability to buy and sell stock index futurescontracts traded on domestic stock exchanges to hedge the valueof its portfolio against changes in market conditions. A stockindex futures contract is an agreement between two parties totake or make delivery of an amount of cash equal to a specifieddollar amount, times the difference between stock index value atthe close of the last trading day of the contract and the price atwhich the futures contract is originally struck. A stock indexfutures contract does not involve the physical delivery of theunderlying stocks in the index. Although stock index futures
contracts call for the actual taking of delivery of cash, in mostcases a Fund expects to liquidate its stock index futurespositions through offsetting transactions, which may result in again or loss, before cash settlement is required.
The Funds may purchase or sell other types of futures contracts,including those based on particular interest rates, securities,foreign currencies, securities indices and other financialinstruments and indices. The Funds may also purchase and writecall and put options on such futures contracts, in order to seek toincrease total return or to hedge against changes in interest rates,securities prices, or currency exchange rates, or, to the extentpermitted by its investment policies, to otherwise manage itsportfolio of investments.
Futures contracts are valued at the daily quoted settlementprices.
SwapsThe Funds may enter into interest rate, mortgage, credit,currency and total return swaps, interest rate caps, floors andcollars. The Funds may also purchase and write (sell) optionscontracts on swaps, referred to as “swaptions”. The Funds mayenter into swap transactions for hedging purposes or to seek toincrease total return. Since interest rate, mortgage, credit andcurrency swaps and interest rate caps, floors and collars areindividually negotiated, the Funds expect to achieve anacceptable degree of correlation between their portfolioinvestments and their swap, cap, floor and collar positions.
Swap agreements are valued using the daily mean andunrealized appreciation or depreciation is recorded daily as thedifference between the prior day and current day closing price.
Derivative Instruments and Hedging Activities
Each Trust has adopted derivative instruments disclosure standards, in order to enable the investor to understand how and why an entity usedderivatives, how derivatives are accounted for, and how derivative instruments affect an entity’s results of operations and financial position.
In general, the use of derivatives may increase the risk within the Funds. The use of over-the-counter derivatives involves the risk that the counterpartyto the contract will fail to make required payments or otherwise comply with the terms of the contract. The results achieved by the use of derivatives inthe Funds may not match or fully offset changes in the value of the underlying financial assets being hedged or the investment opportunity the Fundswere pursuing, thereby failing to achieve, to an extent, the original purpose for using the derivatives. Certain types of derivatives may create leverageinsofar as the Funds may receive returns (or suffer losses) exceeding the initial amounts the Funds committed in connection with the derivatives. Theuse of derivatives can result in losses or gains to the Funds exceeding the amount the Funds would have experienced in the absence of usingderivatives. A relatively small price movement in a derivative may result in an immediate and substantial loss, or gain, to the Funds.
GuideMark® Core Fixed Income Fund
During the year, the Fund used fixed income derivatives including U.S. Treasury futures and credit default swaps on investment grade fixed incomeindices (CDX and CMBX), for both hedging and investment purposes, primarily duration management, risk management, and the pursuit of relativevalue opportunities. Futures contracts used in the Fund during the year included those based on short, medium, and long-term U.S. Treasury debt.
The Fund used futures contracts during the year primarily to manage interest rate risk. The Fund used investment grade CDX and CMBX to efficientlymanage investment grade credit exposure.
150
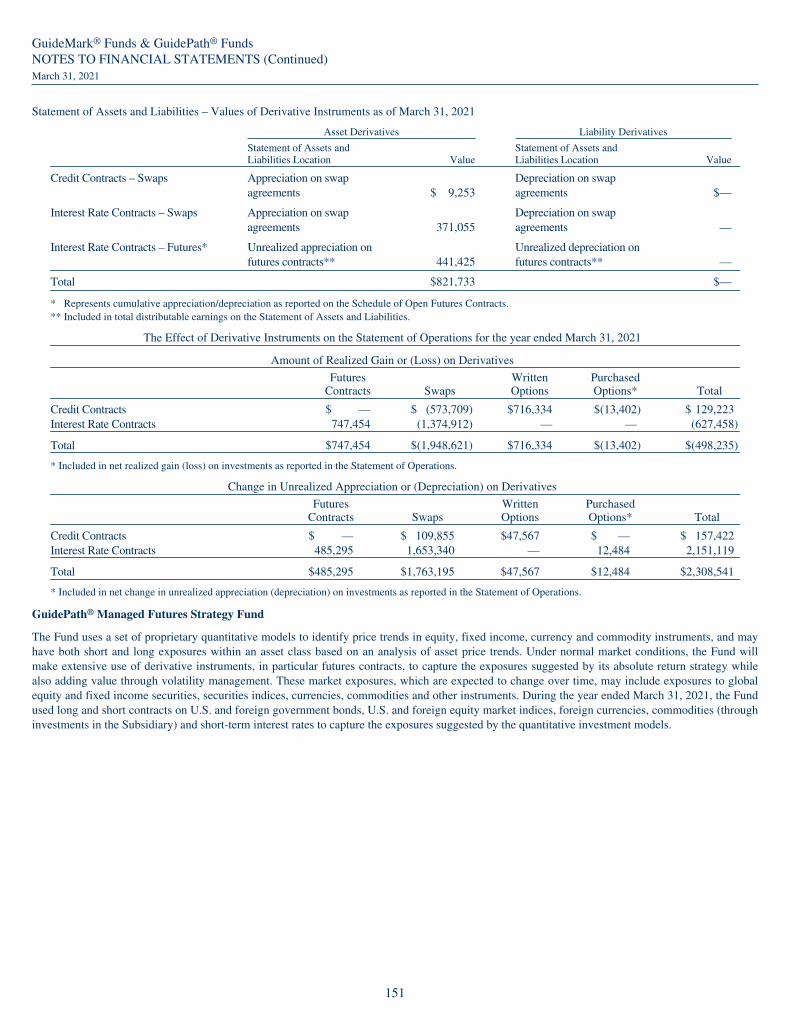
GuideMark® Funds & GuidePath® FundsNOTES TO FINANCIAL STATEMENTS (Continued)March 31, 2021
Statement of Assets and Liabilities – Values of Derivative Instruments as of March 31, 2021
Asset Derivatives Liability Derivatives
Statement of Assets andLiabilities Location Value
Statement of Assets andLiabilities Location Value
Credit Contracts – Swaps Appreciation on swapagreements $ 9,253
Depreciation on swapagreements $—
Interest Rate Contracts – Swaps Appreciation on swapagreements 371,055
Depreciation on swapagreements —
Interest Rate Contracts – Futures* Unrealized appreciation onfutures contracts** 441,425
Unrealized depreciation onfutures contracts** —
Total $821,733 $—
* Represents cumulative appreciation/depreciation as reported on the Schedule of Open Futures Contracts.** Included in total distributable earnings on the Statement of Assets and Liabilities.
The Effect of Derivative Instruments on the Statement of Operations for the year ended March 31, 2021
Amount of Realized Gain or (Loss) on Derivatives
FuturesContracts Swaps
WrittenOptions
PurchasedOptions* Total
Credit Contracts $ — $ (573,709) $716,334 $(13,402) $ 129,223Interest Rate Contracts 747,454 (1,374,912) — — (627,458)
Total $747,454 $(1,948,621) $716,334 $(13,402) $(498,235)
* Included in net realized gain (loss) on investments as reported in the Statement of Operations.
Change in Unrealized Appreciation or (Depreciation) on Derivatives
FuturesContracts Swaps
WrittenOptions
PurchasedOptions* Total
Credit Contracts $ — $ 109,855 $47,567 $ — $ 157,422Interest Rate Contracts 485,295 1,653,340 — 12,484 2,151,119
Total $485,295 $1,763,195 $47,567 $12,484 $2,308,541
* Included in net change in unrealized appreciation (depreciation) on investments as reported in the Statement of Operations.
GuidePath® Managed Futures Strategy Fund
The Fund uses a set of proprietary quantitative models to identify price trends in equity, fixed income, currency and commodity instruments, and mayhave both short and long exposures within an asset class based on an analysis of asset price trends. Under normal market conditions, the Fund willmake extensive use of derivative instruments, in particular futures contracts, to capture the exposures suggested by its absolute return strategy whilealso adding value through volatility management. These market exposures, which are expected to change over time, may include exposures to globalequity and fixed income securities, securities indices, currencies, commodities and other instruments. During the year ended March 31, 2021, the Fundused long and short contracts on U.S. and foreign government bonds, U.S. and foreign equity market indices, foreign currencies, commodities (throughinvestments in the Subsidiary) and short-term interest rates to capture the exposures suggested by the quantitative investment models.
151

GuideMark® Funds & GuidePath® FundsNOTES TO FINANCIAL STATEMENTS (Continued)March 31, 2021
Consolidated Statement of Assets and Liabilities – Values of Derivative Instruments as of March 31, 2021
Asset Derivatives Liability Derivatives
Consolidated Statementof Assets and LiabilitiesLocation Value
Consolidated Statement ofAssets and LiabilitiesLocation Value
Commodity Contracts – Futures* Unrealized appreciationon futures contracts** $2,259,572
Unrealized depreciationon futures contracts** $1,195,543
Equity Contracts – Futures* Unrealized appreciationon futures contracts** 893,981
Unrealized depreciationon futures contracts** 335,247
Foreign Exchange Contracts – ForwardCurrency Contracts
Unrealized appreciationon forward currencycontracts 81,690
Unrealized Depreciationon forward currencycontracts 410,102
Foreign Exchange Contracts – Futures* Unrealized appreciationon futures contracts** 1,174,726
Unrealized depreciationon futures contracts** 280,622
Interest Rate Contracts – Futures* Unrealized appreciationon futures contracts** 1,884,444
Unrealized depreciationon futures contracts** 38,635
Total $6,294,413 $2,260,149
* Represents cumulative appreciation/depreciation as reported on the Consolidated Schedule of Open Futures Contracts.** Included in total distributable earnings on the Consolidated Statement of Assets and Liabilities.
The Effect of Derivative Instruments on the Consolidated Statement of Operations for the year ended March 31, 2021
Amount of Realized Gain (Loss) on Derivatives
FuturesContracts
ForwardCurrencyContracts Total
Commodity Contracts $ 9,721,640 $ — $ 9,721,640Equity Contracts 12,624,846 — 12,624,846Foreign Exchange Contracts 2,029,033 1,172,575 3,201,608Interest Rate Contracts 6,072,558 — 6,072,558
Total $30,448,077 $1,172,575 $31,620,652
Change in Unrealized Appreciation (Depreciation) on Derivatives
FuturesContracts
ForwardCurrencyContracts Total
Commodity Contracts $(3,082,808) $ — $(1,741,187)Equity Contracts 1,033,271 — 1,033,271Foreign Exchange Contracts 99,230 (1,901,107) (1,664,348)Interest Rate Contracts (1,861,827) — (3,340,977)
Total $(3,812,134) $(1,901,107) $(5,713,241)
GuidePath® Growth and Income Fund
During the year, the Fund used equity derivatives including S&P 500 Index futures and S&P 500 Index and exchange trade funds (“ETFs”) options, for bothhedging and investment purposes, primarily risk management, and the pursuit of excess premium opportunities. The Fund used futures contracts during theyear primarily to manage portfolio risk (volatility). The Fund wrote collateralized put options in an attempt to generate returns through receiving the optionpremiums; together with investments in fixed income instruments, it intended to lower the volatility relative to as if the Fund held the S&P 500 index.
Statement of Assets and Liabilities – Values of Derivative Instruments as of March 31, 2021
Asset Derivatives Liability Derivatives
Statement of Assets and LiabilitiesLocation Value
Statement of Assets and LiabilitiesLocation Value
Equity Contracts – Futures* Unrealized appreciation onfutures contracts** $—
Unrealized depreciation on futurescontracts** $ 19,928
Equity Contracts – Options Investments, at Value — Options Written, at Value 116,815
Total $— $136,743
* Represents cumulative appreciation/depreciation as reported on the Schedule of Open Futures Contracts.** Included in total distributable earnings on the Statement of Assets and Liabilities.
152

GuideMark® Funds & GuidePath® FundsNOTES TO FINANCIAL STATEMENTS (Continued)March 31, 2021
The Effect of Derivative Instruments on the Statement of Operations for the year ended March 31, 2021
Amount of Realized Gain (Loss) on Derivatives
FuturesContracts
WrittenOptions Total
Equity Contracts $(2,047,298) $4,077,844 $2,030,546
Total $(2,047,298) $4,077,844 $2,030,546
Change in Unrealized Appreciation (Depreciation) on Derivatives
FuturesContracts
WrittenOptions Total
Equity Contracts $19,639 $148,265 $167,904
Total $19,639 $148,265 $167,904
Volume Disclosures
The average monthly value outstanding of purchased and written options during the year ended March 31, 2021 were as follows:
GuideMark®
Core FixedIncome Fund
GuidePath®
Managed FuturesStrategy Fund
GuidePath®
Growth andIncome Fund
Purchased Options $ 109 $ — $ —Written Options $(61,444) $ — $(336,589)
The average monthly notional amount outstanding of futures, forwards and swaps during the year ended March 31, 2021 were as follows:
Long Positions
GuideMark®
Core FixedIncome Fund
GuidePath®
Managed FuturesStrategy Fund
GuidePath®
Growth andIncome Fund
Futures $ 6,950,142 $1,053,157,342 $ 1,086,808Forwards $ — $ 44,515,204 $ —Swaps $13,744,615 $ — $ —
Short Positions
GuideMark®
Core FixedIncome Fund
GuidePath®
Managed FuturesStrategy Fund
GuidePath®
Growth andIncome Fund
Futures $ (9,221,270) $ (189,793,280) $(3,553,025)Forwards $ — $ (61,033,621) $ —
Derivative Risks
The risks of using the various types of derivatives in which the Funds may engage include: the risk that movements in the value of the derivative maynot fully offset or complement instruments currently held in the Funds in the manner intended by the Advisor or sub-advisor; the risk that thecounterparty to a derivative contract may fail to comply with its obligations to the Funds; the risk that there may not be a liquid secondary market forthe derivative at a time when the Funds would look to disengage the position; the risk that additional capital from the Funds may be called upon tofulfill the conditions of the derivative contract; the risk that the use of derivatives in the Funds may induce leverage in the Funds, and the risk that thecost of the derivative contracts may reduce the overall returns experienced by the Funds.
Offsetting Assets and Liabilities
GuideMark® Core Fixed Income Fund
The Fund is subject to various Master Netting Arrangements, which govern the terms of certain transactions with select counterparties. The MasterNetting Arrangements allow the Fund to close out and net its total exposure to a counterparty in the event of a default with respect to all thetransactions governed under a single agreement with a counterparty. The Master Netting Arrangements also specify collateral posting arrangements atpre-arranged exposure levels. Under the Master Netting Arrangements, collateral is routinely transferred if the total net exposure to certain transactions(net of existing collateral already in place) governed under the relevant Master Netting Arrangement with a counterparty in a given account exceeds aspecified threshold depending on the counterparty and the type of Master Netting Arrangement.
153

GuideMark® Funds & GuidePath® FundsNOTES TO FINANCIAL STATEMENTS (Continued)March 31, 2021
The table below, as of March 31, 2021, discloses both gross information and net information about instruments and transactions eligible for offset inthe Statements of Assets and Liabilities, and instruments and transactions that are subject to an agreement similar to a master netting agreement as wellas amounts related to collateral held at clearing brokers and counterparties. For financial reporting purposes, the Fund does not offset derivative assetsand liabilities, and any related collateral received or pledged, on the Statement of Assets and Liabilities, except in the case of futures contracts.
Assets
Gross Amounts not offsetin the Statement of
Assets and Liabilities
Gross Amountsof Recognized
Assets
Gross AmountsOffset in theStatement of
Assets and Liabilities
Net AmountsPresented in the
Statement ofAssets and Liabilities
FinancialInstruments
CashCollateralReceived
NetAmount
Description / CounterpartyFutures
Credit Suisse $ 47,742 $ — $ 47,742 $ — $ — $ 47,742Swaps
Morgan Stanley 529,127 (8,249) 520,878 — — 520,878
$576,869 $(8,249) $ 568,620 $ — $ — $ 568,620
Liabilities
Gross Amounts not offsetin the Statement of
Assets and Liabilities
Gross Amountsof Recognized
Liabilities
Gross AmountsOffset in theStatement of
Assets and Liabilities
Net AmountsPresented in the
Statement ofAssets and Liabilities
FinancialInstruments
CollateralPledged
NetAmount
Description / CounterpartySwaps
Morgan Stanley $ 8,249 $(8,249) $ — $ — $ — $ —
$ 8,249 $(8,249) $ — $ — $ — $ —
GuidePath® Managed Futures Strategy Fund
The Fund is subject to various Master Netting Arrangements, which govern the terms of certain transactions with select counterparties. The MasterNetting Arrangements allow the Fund to close out and net its total exposure to a counterparty in the event of a default with respect to all thetransactions governed under a single agreement with a counterparty. The Master Netting Arrangements also specify collateral posting arrangements atpre-arranged exposure levels. Under the Master Netting Arrangements, collateral is routinely transferred if the total net exposure to certain transactions(net of existing collateral already in place) governed under the relevant Master Netting Arrangement with a counterparty in a given account exceeds aspecified threshold depending on the counterparty and the type of Master Netting Arrangement.
The table below, as of March 31, 2021, discloses both gross information and net information about instruments and transactions eligible for offset inthe Consolidated Statement of Assets and Liabilities, and instruments and transactions that are subject to an agreement similar to a master nettingagreement as well as amounts related to collateral held at clearing brokers and counterparties. For financial reporting purposes, the Fund does notoffset derivative assets and liabilities, and any related collateral received or pledged, on the Consolidated Statement of Assets and Liabilities, except inthe case of futures contracts.
Assets
Gross Amounts not offset inthe Consolidated Statement of
Assets and Liabilities
Gross Amountsof Recognized
Assets
Gross AmountsOffset in theConsolidatedStatement of
Assets and Liabilities
Net AmountsPresented in the
ConsolidatedStatement of
Assets and LiabilitiesFinancial
Instruments
CashCollateralReceived
NetAmount
Description / CounterpartyForwards
NatWest $ 81,690 $ — $ 81,690 $ (81,690) $ — $ —Futures*
Goldman Sachs 2,392,629 (691,358) 1,701,271 (222,961) — 1,478,310
$2,474,319 $(691,358) $1,782,961 $(304,651) $ — $1,478,310
154

GuideMark® Funds & GuidePath® FundsNOTES TO FINANCIAL STATEMENTS (Continued)March 31, 2021
Liabilities
Gross Amounts not offset inthe Consolidated Statement of
Assets and Liabilities
GrossAmounts ofRecognizedLiabilities
Gross AmountsOffset in theConsolidatedStatement of
Assets and Liabilities
Net AmountsPresented in the
ConsolidatedStatement of
Assets and LiabilitiesFinancial
Instruments
CashCollateralPledged
NetAmount
Description / CounterpartyForwards
NatWest $ 410,102 $ — $410,102 $ (81,690) $(260,000) $68,412Futures*
Goldman Sachs 914,319 (691,358) 222,961 (222,961) — —
$1,324,421 $(691,358) $633,063 $(304,651) $(260,000) $68,412
* Cumulative appreciation/ depreciation on futures contracts is reported in the Consolidated Schedule of Open Futures Contracts—variation margin and recievable/payable for unsettled open futures contracts presented above is presented in the Consolidated Statement of Assets and Liabilities.
GuidePath® Growth and Income Fund
The Fund is subject to various Master Netting Arrangements, which govern the terms of certain transactions with select counterparties. The MasterNetting Arrangements allow the Fund to close out and net its total exposure to a counterparty in the event of a default with respect to all thetransactions governed under a single agreement with a counterparty. The Master Netting Arrangements also specify collateral posting arrangements atpre-arranged exposure levels. Under the Master Netting Arrangements, collateral is routinely transferred if the total net exposure to certain transactions(net of existing collateral already in place) governed under the relevant Master Netting Arrangement with a counterparty in a given account exceeds aspecified threshold depending on the counterparty and the type of Master Netting Arrangement.
The table below, as of March 31, 2021, discloses both gross information and net information about instruments and transactions eligible for offset inthe Statements of Assets and Liabilities, and instruments and transactions that are subject to an agreement similar to a master netting agreement as wellas amounts related to collateral held at clearing brokers and counterparties. For financial reporting purposes, the Fund does not offset derivative assetsand liabilities, and any related collateral received or pledged, on the Statement of Assets and Liabilities, except in the case of futures contracts.
Liabilities
Gross Amounts not offset inthe Statement of
Assets and Liabilities
Gross Amountsof Recognized
Liabilities
Gross AmountsOffset in theStatement of
Assets and Liabilities
Net AmountsPresented in the
Statement ofAssets and Liabilities
FinancialInstruments
CashCollateralPledged
NetAmount
Description / CounterpartyOptions Written
Interactive Brokers $116,815 $ — $116,815 $(116,815) $ — $ —
$116,815 $ — $116,815 $(116,815) $ — $ —
In some instances, the collateral amounts disclosed in the tables were adjusted due to the requirement to limit the collateral amounts to avoid the effectof overcollateralization. Actual collateral received/pledged may be more than the amounts disclosed herein.
Due to the absence of a master netting agreement relating to the Funds’ participation in securities lending, no additional disclosures have been made onbehalf of the Funds. Please reference Note 7 for collateral related to securities on loan.
(m) Securities Purchased or Sold on a Forward-Commitment BasisThe Funds may enter into when-issued or other purchase or saletransactions that specify forward delivery of a financial security.In connection with this ability, the Funds may enter intomortgage “dollar rolls” in which a Fund sells securities in thecurrent month for delivery and simultaneously contracts withthe same counterparty to repurchase similar (same type, couponand maturity), but not identical securities on a specified futuredate. The party that is obligated to buy a security in the futurewill retain the use of their funds, and will benefit from anyinterest that is earned on those funds from the day that theyenter into the forward contract until the day that they take
delivery and pay for the security. Each Fund designated andmaintains cash and/or marketable securities at least equal invalue to commitments for securities purchased on a forward-commitment basis.
(n) Foreign Securities – For purposes of these financial statements,foreign securities are defined as securities issued by companiesthat are organized outside the United States. Investing in thesetypes of securities make a fund more susceptible to additionalrisks. These risks include currency fluctuations, political andeconomic instability, less government regulation, less publiclyavailable information, limited trading markets, differences infinancial reporting standards, fewer protections for passive
155

GuideMark® Funds & GuidePath® FundsNOTES TO FINANCIAL STATEMENTS (Continued)March 31, 2021
investors and less stringent regulation of securities markets.Moreover, securities of many foreign companies and foreigngovernments and their markets may be less liquid and theirprices more volatile than those of securities of comparable U.S.companies and the U.S. government. Occasionally, events thataffect these values and exchange rates may occur after the closeof the exchange on which such securities are traded. If suchevents materially affect the value of a Fund’s securities, thesesecurities may be valued at their fair value pursuant toprocedures adopted by the Board.
(o) Foreign Currency TranslationThe accounting records of the Funds are maintained in U.S.dollars. Investment securities and all other assets and liabilitiesof the Funds denominated in a foreign currency are translatedinto U.S. dollars at current exchange rates. Purchases and salesof securities, income receipts, and expense payments aretranslated into U.S. dollars at the exchange rate in effect on thedates of the respective transactions. The Funds do not isolate theportion of the fluctuations on investments resulting fromchanges in foreign currency exchange rates from thefluctuations in market prices of investments held. Suchfluctuations are included with the net realized and unrealizedgain or loss from investments.
Net realized gain (loss) on foreign currencies include those gainsand losses arising from the sale of foreign currencies, currencygains or losses realized between the trade and settlement dates onforeign currency transactions, the differences between theamounts of dividends, and foreign withholding taxes recorded ona Fund’s books, and the U.S. dollar equivalent of the amountsactually received or paid. Net unrealized appreciation(depreciation) on investments includes changes in the value ofinvestments resulting from exchange rates.
The value of the Funds’ foreign holdings as measured in U.S.dollars may be affected unfavorably by changes in foreigncurrency exchange rates, as a change in the value of a foreigncurrency against the U.S. dollar generally will result in acorresponding change in the U.S. dollar value of securitiesdenominated in that currency held by a Fund. In addition to therisks of foreign currency exchange rates generally, trading in thecurrencies of certain countries may face periods of limitedliquidity or the political risk of exchange controls or currencyrepatriation restrictions, which may in turn make such holdingsdenominated in those currencies difficult to value. The Fundsmay also incur losses in connection with conversions betweenvarious currencies.
(p) Restricted and Illiquid SecuritiesNo Fund may acquire any illiquid investment if, immediatelyafter the acquisition, the Fund would have invested more than15% of it’s net assets in illiquid investments that are assets. TheAdvisor, with the assistance of the sub-advisors and/or pricingservices, will determine the value of such securities in goodfaith pursuant to procedures adopted by the applicable Board ofTrustees. Illiquid securities present the risks that a Fund mayhave difficulty valuing these holdings and/or may be unable tosell these holdings at the time or price desired. There are norestrictions on each Fund’s ability to invest in restrictedsecurities (that is, securities that are not registered pursuant to
the Securities Act of 1933), except to the extent such securitiesmay be considered illiquid. Securities issued pursuant to Rule144A of the Securities Act of 1933 will be considered liquid ifdetermined to be so under the Funds’ liquidity guidelines.
(q) Auction Rate SecuritiesThe Core Fixed Income Fund and each of the GPS Funds IIportfolios may invest in auction rate municipal securities. Auctionrate securities usually permit the holder to sell the securities in anauction at par value at specified intervals. The dividend is reset by“Dutch” auction in which bids are made by broker-dealers andother institutions for a certain amount of securities at a specifiedminimum yield. The dividend rate set by the auction is the lowestinterest or dividend rate that covers all securities offered for sale.While this process is designed to permit auction rate securities tobe traded at par value, there is a risk that an auction will fail dueto insufficient demand for the securities.
(r) Short SalesAlthough not currently part of any Fund’s principal investmentstrategy, each Fund has the ability to make equity short sales.Short sales are transactions where a Fund sells securities it doesnot own in anticipation of a decline in the value of the securities.
(s) Trustee CompensationDuring the year ended March 31, 2021, for the servicesperformed as Trustees of the consolidated Board of GPS FundsI, GPS Funds II, and Savos Investments Trust, which currentlyconsists of one fund, the Independent Trustees receive a retainerfee of $87,500 per year, $5,000 for each quarterly meeting andannual agreement renewal review meeting, whether heldin-person or telephonically, $5,000 for each special meetingattended in person and $2,000 for each special meeting attendedtelephonically, as well as reimbursement for expenses incurredin connection with attendance at such meetings. Effective April1, 2021, the Trustees will receive a retainer fee of $90,000 peryear, $5,000 for each quarterly meeting and annual agreementrenewal review meeting, whether held in-person ortelephonically, $5,000 for each special meeting attended inperson and $2,500 for each special meeting attendedtelephonically, as well as reimbursement for expenses incurredin connection with attendance at such meetings. The fees areallocated proportionally to each Fund within the Trusts based ontotal assets under management.
The “interested persons” who serve as Trustees of the Trustsreceive no compensation from the Trusts for their services asTrustees. The Funds reimburse the Advisor an allocated amountfor the compensation and related expenses of certain officers ofthe Trusts who provide compliance services to the Funds. Theaggregate amount of all such reimbursements is determined bythe Trustees. No other compensation or retirement benefits arereceived by any Trustee or officer from the Funds.
(t) Pending LitigationThe Funds are subject to claims and suits that arise from time totime in the ordinary course of business (for example, in TheTribune Company Bankruptcy, certain creditors have filedactions against all shareholders of The Tribune Company, whichincluded the GuideMark® Emerging Markets Fund, whotendered shares when the Tribune Company went private in
156
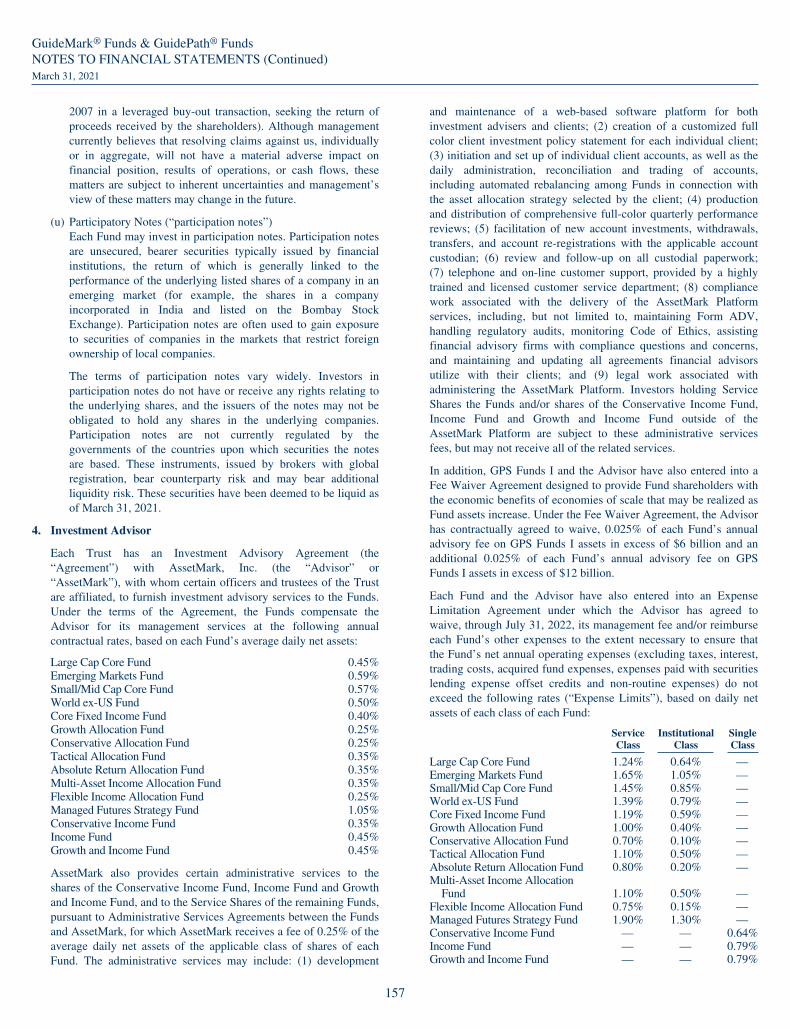
GuideMark® Funds & GuidePath® FundsNOTES TO FINANCIAL STATEMENTS (Continued)March 31, 2021
2007 in a leveraged buy-out transaction, seeking the return ofproceeds received by the shareholders). Although managementcurrently believes that resolving claims against us, individuallyor in aggregate, will not have a material adverse impact onfinancial position, results of operations, or cash flows, thesematters are subject to inherent uncertainties and management’sview of these matters may change in the future.
(u) Participatory Notes (“participation notes”)Each Fund may invest in participation notes. Participation notesare unsecured, bearer securities typically issued by financialinstitutions, the return of which is generally linked to theperformance of the underlying listed shares of a company in anemerging market (for example, the shares in a companyincorporated in India and listed on the Bombay StockExchange). Participation notes are often used to gain exposureto securities of companies in the markets that restrict foreignownership of local companies.
The terms of participation notes vary widely. Investors inparticipation notes do not have or receive any rights relating tothe underlying shares, and the issuers of the notes may not beobligated to hold any shares in the underlying companies.Participation notes are not currently regulated by thegovernments of the countries upon which securities the notesare based. These instruments, issued by brokers with globalregistration, bear counterparty risk and may bear additionalliquidity risk. These securities have been deemed to be liquid asof March 31, 2021.
4. Investment Advisor
Each Trust has an Investment Advisory Agreement (the“Agreement”) with AssetMark, Inc. (the “Advisor” or“AssetMark”), with whom certain officers and trustees of the Trustare affiliated, to furnish investment advisory services to the Funds.Under the terms of the Agreement, the Funds compensate theAdvisor for its management services at the following annualcontractual rates, based on each Fund’s average daily net assets:
Large Cap Core Fund 0.45%Emerging Markets Fund 0.59%Small/Mid Cap Core Fund 0.57%World ex-US Fund 0.50%Core Fixed Income Fund 0.40%Growth Allocation Fund 0.25%Conservative Allocation Fund 0.25%Tactical Allocation Fund 0.35%Absolute Return Allocation Fund 0.35%Multi-Asset Income Allocation Fund 0.35%Flexible Income Allocation Fund 0.25%Managed Futures Strategy Fund 1.05%Conservative Income Fund 0.35%Income Fund 0.45%Growth and Income Fund 0.45%
AssetMark also provides certain administrative services to theshares of the Conservative Income Fund, Income Fund and Growthand Income Fund, and to the Service Shares of the remaining Funds,pursuant to Administrative Services Agreements between the Fundsand AssetMark, for which AssetMark receives a fee of 0.25% of theaverage daily net assets of the applicable class of shares of eachFund. The administrative services may include: (1) development
and maintenance of a web-based software platform for bothinvestment advisers and clients; (2) creation of a customized fullcolor client investment policy statement for each individual client;(3) initiation and set up of individual client accounts, as well as thedaily administration, reconciliation and trading of accounts,including automated rebalancing among Funds in connection withthe asset allocation strategy selected by the client; (4) productionand distribution of comprehensive full-color quarterly performancereviews; (5) facilitation of new account investments, withdrawals,transfers, and account re-registrations with the applicable accountcustodian; (6) review and follow-up on all custodial paperwork;(7) telephone and on-line customer support, provided by a highlytrained and licensed customer service department; (8) compliancework associated with the delivery of the AssetMark Platformservices, including, but not limited to, maintaining Form ADV,handling regulatory audits, monitoring Code of Ethics, assistingfinancial advisory firms with compliance questions and concerns,and maintaining and updating all agreements financial advisorsutilize with their clients; and (9) legal work associated withadministering the AssetMark Platform. Investors holding ServiceShares the Funds and/or shares of the Conservative Income Fund,Income Fund and Growth and Income Fund outside of theAssetMark Platform are subject to these administrative servicesfees, but may not receive all of the related services.
In addition, GPS Funds I and the Advisor have also entered into aFee Waiver Agreement designed to provide Fund shareholders withthe economic benefits of economies of scale that may be realized asFund assets increase. Under the Fee Waiver Agreement, the Advisorhas contractually agreed to waive, 0.025% of each Fund’s annualadvisory fee on GPS Funds I assets in excess of $6 billion and anadditional 0.025% of each Fund’s annual advisory fee on GPSFunds I assets in excess of $12 billion.
Each Fund and the Advisor have also entered into an ExpenseLimitation Agreement under which the Advisor has agreed towaive, through July 31, 2022, its management fee and/or reimburseeach Fund’s other expenses to the extent necessary to ensure thatthe Fund’s net annual operating expenses (excluding taxes, interest,trading costs, acquired fund expenses, expenses paid with securitieslending expense offset credits and non-routine expenses) do notexceed the following rates (“Expense Limits”), based on daily netassets of each class of each Fund:
ServiceClass
InstitutionalClass
SingleClass
Large Cap Core Fund 1.24% 0.64% —Emerging Markets Fund 1.65% 1.05% —Small/Mid Cap Core Fund 1.45% 0.85% —World ex-US Fund 1.39% 0.79% —Core Fixed Income Fund 1.19% 0.59% —Growth Allocation Fund 1.00% 0.40% —Conservative Allocation Fund 0.70% 0.10% —Tactical Allocation Fund 1.10% 0.50% —Absolute Return Allocation Fund 0.80% 0.20% —Multi-Asset Income Allocation
Fund 1.10% 0.50% —Flexible Income Allocation Fund 0.75% 0.15% —Managed Futures Strategy Fund 1.90% 1.30% —Conservative Income Fund — — 0.64%Income Fund — — 0.79%Growth and Income Fund — — 0.79%
157

GuideMark® Funds & GuidePath® FundsNOTES TO FINANCIAL STATEMENTS (Continued)March 31, 2021
Effective April 1, 2021, the Expense Limits for the applicableFunds’ Service Shares were reduced by 25 basis points inconnection with the termination of the Funds’ Rule 12b-1 Plan. Seenote 2(c).
Any such contractual waiver or reimbursement is subject to lateradjustment to allow the Advisor to recoup amounts waived orreimbursed to the extent actual fees and expenses for a fiscal periodare less than each Fund’s Expense Limits at the time of the waiver,provided, however, that the Advisor shall only be entitled to recoup
such amounts for a period of three years after the end of thecalendar month in which the fee or expense was waived orreimbursed. As of March 31, 2021, Large Cap Core Fund, EmergingMarkets Fund Service Class Shares, Small/Mid Cap Core Fund,World ex-US Fund Service Class Shares, Growth Allocation Fund,Tactical Allocation Fund, Multi-Asset Income Allocation Fund andManaged Futures Strategy Fund have recouped all potentialrecoverable waivers or reimbursed expenses.
The Advisor is currently waiving fees and, in some cases, reimbursing expenses in the Funds listed below in order to keep these Funds at theirExpense Limits. Waived expenses subject to potential recovery are as follows:
Year ofExpiration03/31/2022
Year ofExpiration03/31/2023
Year ofExpiration03/31/2024
Emerging Markets Fund $ — $ 9 $ —World ex-US Fund 17 3 21Core Fixed Income Fund 187,844 132,507 123,677Conservative Allocation Fund 461,910 778,668 725,482Absolute Return Allocation Fund 735,890 847,340 590,940Flexible Income Allocation Fund 67,053 205,738 289,266Conservative Income Fund 55,574 70,018 38,716Income Fund 58,215 74,536 27,465Growth and Income Fund 56,091 124,031 81,402
Sub-advisory services are provided to certain of the Funds, pursuantto agreements between the Advisor and various sub-advisors. Underthe terms of these sub-advisory agreements, the Advisorcompensates each sub-advisor based on the portion of each Fund’saverage daily net assets that is allocated to the sub-advisor.
5. Distribution Plan
For the year ended March 31, 2021, each Trust, on behalf of theService Shares class of its Funds, as applicable, had a distributionplan pursuant to Rule 12b-1 under the 1940 Act (the “12b-1 Plan”),which authorized each Fund to pay distribution fees at an annualrate of 0.25% of the average daily net assets of the Funds’ ServiceShares. Payments under the 12b-1 Plan were used to compensatepersons (including affiliates of the Trust) who provide supportservices in connection with the distribution of the Funds’ ServiceShares class and servicing of the Funds’ Service Shares classshareholders. For example, these amounts are paid to financialintermediaries that perform back office shareholder servicing andrecordkeeping services that facilitate the operation of the AssetMarkProgram through which the Funds are primarily distributed. TheAdvisor (and its affiliates) similarly received portions of suchpayments for their services provided to facilitate the operation of theprogram. These financial intermediaries and affiliates of the Trustalso receive payments from the Trust outside of the 12b-1 Plan forshareholder services that are unrelated to distribution services.AssetMark BrokerageTM, LLC (“Distributor”), an affiliate of theAdvisor, serves as the Funds principal underwriter and distributor.The Funds did not pay any commissions or other compensation,other than 12b-1 fees, to the Distributor during the Funds’ mostrecent fiscal year ended March 31, 2021.
As noted above, effective as of April 1, 2021, the Board determinedto terminate the Funds’ 12b-1 Plans. As a result, Service Shares ofthe Funds no longer pay Rule 12b-1 fees as of April 1, 2021.Notwithstanding the foregoing, subsequent to the termination of theRule 12b-1 Plans, financial intermediaries and affiliates of the Trustwill continue to receive payments from the Trust outside of the12b-1 Plan for shareholder services that are unrelated to distributionservices.
6. Service, Custody, and Line of Credit Agreements
The Funds have entered into Service Agreements with U.S. BancorpFund Services, LLC, doing business as U.S. Bank Global FundServices (“Fund Services”) and a Custody Agreement with U.S.Bank, N.A. (“USB” or the “Custodian”), an affiliate of FundServices. Under these agreements, Fund Services and the Custodianprovide certain transfer agency, administrative, accounting andcustody services.
The Funds have established a line of credit (“LoC”) with USB to beused for temporary or emergency purposes, primarily for financingredemption payments, using the securities in the Funds’ portfoliosas collateral. Savos Investments Trust, which is also managed byAssetMark, is also party to the same LoC agreement. The LoC wasrenewed August 1, 2020 and will mature, unless renewed, onJuly 31, 2021. Borrowing under the LoC is limited to the lesser of20% of the gross market value of a Fund, 20% of specificmarketable securities acceptable to USB, or $250,000,000 for allFunds. The interest rate paid by the Funds on outstandingborrowings is equal to the prime rate, which was 3.25% atMarch 31, 2021. The Funds have authorized USB to charge any ofthe custody accounts of the Funds for any missed payments by theFunds. Interest expense incurred for the Funds is disclosed on theStatements of Operations.
158
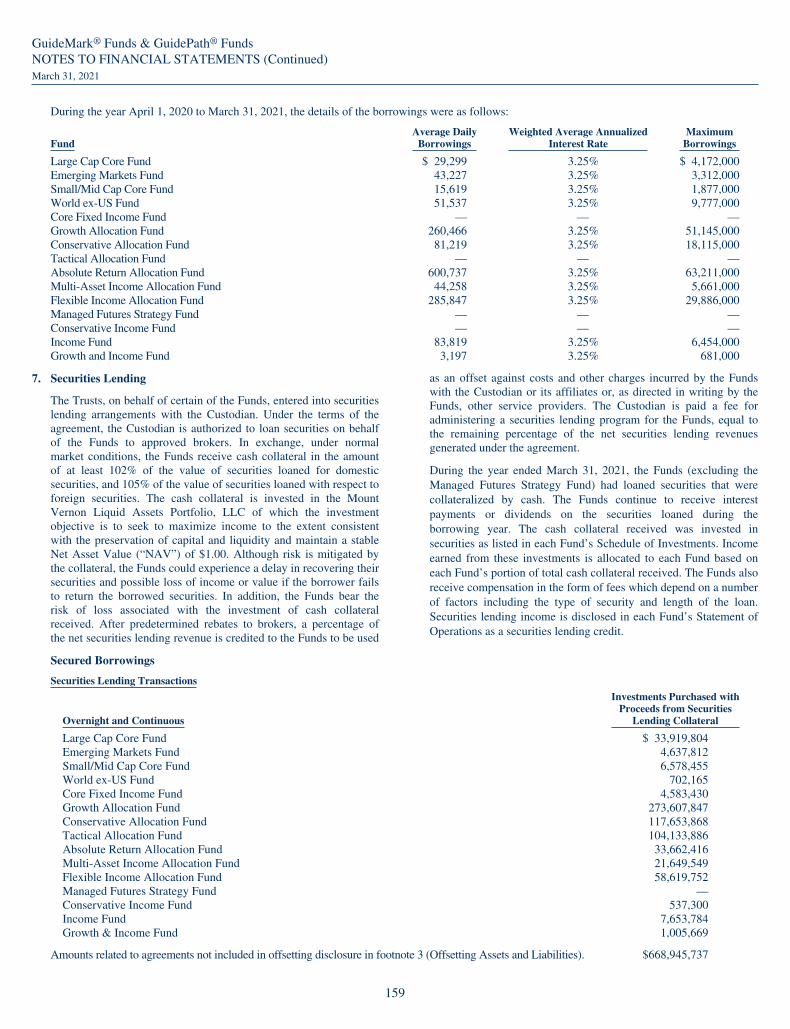
GuideMark® Funds & GuidePath® FundsNOTES TO FINANCIAL STATEMENTS (Continued)March 31, 2021
During the year April 1, 2020 to March 31, 2021, the details of the borrowings were as follows:
FundAverage Daily
BorrowingsWeighted Average Annualized
Interest RateMaximum
Borrowings
Large Cap Core Fund $ 29,299 3.25% $ 4,172,000Emerging Markets Fund 43,227 3.25% 3,312,000Small/Mid Cap Core Fund 15,619 3.25% 1,877,000World ex-US Fund 51,537 3.25% 9,777,000Core Fixed Income Fund — — —Growth Allocation Fund 260,466 3.25% 51,145,000Conservative Allocation Fund 81,219 3.25% 18,115,000Tactical Allocation Fund — — —Absolute Return Allocation Fund 600,737 3.25% 63,211,000Multi-Asset Income Allocation Fund 44,258 3.25% 5,661,000Flexible Income Allocation Fund 285,847 3.25% 29,886,000Managed Futures Strategy Fund — — —Conservative Income Fund — — —Income Fund 83,819 3.25% 6,454,000Growth and Income Fund 3,197 3.25% 681,000
7. Securities Lending
The Trusts, on behalf of certain of the Funds, entered into securitieslending arrangements with the Custodian. Under the terms of theagreement, the Custodian is authorized to loan securities on behalfof the Funds to approved brokers. In exchange, under normalmarket conditions, the Funds receive cash collateral in the amountof at least 102% of the value of securities loaned for domesticsecurities, and 105% of the value of securities loaned with respect toforeign securities. The cash collateral is invested in the MountVernon Liquid Assets Portfolio, LLC of which the investmentobjective is to seek to maximize income to the extent consistentwith the preservation of capital and liquidity and maintain a stableNet Asset Value (“NAV”) of $1.00. Although risk is mitigated bythe collateral, the Funds could experience a delay in recovering theirsecurities and possible loss of income or value if the borrower failsto return the borrowed securities. In addition, the Funds bear therisk of loss associated with the investment of cash collateralreceived. After predetermined rebates to brokers, a percentage ofthe net securities lending revenue is credited to the Funds to be used
as an offset against costs and other charges incurred by the Fundswith the Custodian or its affiliates or, as directed in writing by theFunds, other service providers. The Custodian is paid a fee foradministering a securities lending program for the Funds, equal tothe remaining percentage of the net securities lending revenuesgenerated under the agreement.
During the year ended March 31, 2021, the Funds (excluding theManaged Futures Strategy Fund) had loaned securities that werecollateralized by cash. The Funds continue to receive interestpayments or dividends on the securities loaned during theborrowing year. The cash collateral received was invested insecurities as listed in each Fund’s Schedule of Investments. Incomeearned from these investments is allocated to each Fund based oneach Fund’s portion of total cash collateral received. The Funds alsoreceive compensation in the form of fees which depend on a numberof factors including the type of security and length of the loan.Securities lending income is disclosed in each Fund’s Statement ofOperations as a securities lending credit.
Secured Borrowings
Securities Lending Transactions
Overnight and Continuous
Investments Purchased withProceeds from Securities
Lending Collateral
Large Cap Core Fund $ 33,919,804Emerging Markets Fund 4,637,812Small/Mid Cap Core Fund 6,578,455World ex-US Fund 702,165Core Fixed Income Fund 4,583,430Growth Allocation Fund 273,607,847Conservative Allocation Fund 117,653,868Tactical Allocation Fund 104,133,886Absolute Return Allocation Fund 33,662,416Multi-Asset Income Allocation Fund 21,649,549Flexible Income Allocation Fund 58,619,752Managed Futures Strategy Fund —Conservative Income Fund 537,300Income Fund 7,653,784Growth & Income Fund 1,005,669
Amounts related to agreements not included in offsetting disclosure in footnote 3 (Offsetting Assets and Liabilities). $668,945,737
159

GuideMark® Funds & GuidePath® FundsNOTES TO FINANCIAL STATEMENTS (Continued)March 31, 2021
8. Investment Transactions
The aggregate purchases and sales of securities, excluding short-term investments, for the year ended March 31, 2021 are summarized below.
Purchases Sales
Large Cap Core Fund $ 214,786,886 $ 169,028,130Emerging Markets Fund 49,604,747 52,797,392Small/Mid Cap Core Fund 28,184,101 39,358,821World ex-US Fund 57,264,896 77,273,806Core Fixed Income Fund* 550,640,925 488,515,116Growth Allocation Fund 353,726,802 406,012,068Conservative Allocation Fund 221,182,404 146,889,140Tactical Allocation Fund 1,511,930,670 1,429,144,852Absolute Return Allocation Fund 165,875,258 365,304,552Multi-Asset Income Allocation Fund 88,737,444 93,297,791Flexible Income Allocation Fund 590,726,057 430,386,201Managed Futures Strategy Fund — —Conservative Income Fund** 15,592,491 10,885,111Income Fund 71,797,653 65,970,621Growth and Income Fund*** 79,417,931 52,214,075* Included in these amounts were $493,901,438 of purchases and $449,389,505 of sales of U.S. Government Securities.** Included in these amounts were $309,000 of purchases and $300,000 of sales of U.S. Government Securities.*** Included in these amounts were $4,056,250 of purchases and $2,150,000 of sales of U.S. Government Securities.
9. Transactions with Affiliates
The GuidePath® Absolute Return Allocation Fund owned 5% or more of the voting securities of the following company during the year endedMarch 31, 2021. As a result, this company is deemed to be an affiliated company. The below table represents fair value:
IssuerValue as of
April 1, 2020 Purchases SalesRealized Gain
(Loss)
ProShares Investment Grade-Interest Rate Hedged ETF1 $29,836,379 $9,415,828 $24,845,900 $830,104
$29,836,379 $9,415,828 $24,845,900 $830,104
Issuer
Change inUnrealized
Appreciation(Depreciation)
DividendIncome
Fair Value as ofMarch 31, 2021
Share Balance as ofMarch 31, 2021
ProShares Investment Grade-Interest Rate Hedged ETF1 $3,164,895 $ 576,105 $18,401,306 238,699
$3,164,895 $ 576,105 $18,401,306 238,699
1No longer an affiliate as of March 31, 2021.
10. COVID-19 Pandemic
The recent global outbreak of COVID-19 has disrupted economicmarkets and the prolonged economic impact is uncertain. Theoperational and financial performance of the issuers of securities inwhich the Funds’ invest depends on future developments,including the duration and spread of the outbreak, and suchuncertainty may in turn impact the value of the Funds’investments.
11. New Accounting Pronouncements
In August 2018, FASB issued Accounting Standards Update(“ASU”) 2018-13, Fair Value Measurement (Topic 820): DisclosureFramework – Changes to the Disclosure Requirements for Fair
Value Measurement (“ASU 2018-13”). The primary focus of ASU2018-13 is to improve the effectiveness of the disclosurerequirements for fair value measurements. The changes affect allcompanies that are required to include fair value measurementdisclosures. In general, the amendments in ASU 2018-13 areeffective for all entities for fiscal years and interim periods withinthose fiscal years, beginning after December 15, 2019. An entity ispermitted to early adopt the removed or modified disclosures uponthe issuance of ASU 2018-13 and may delay adoption of theadditional disclosures, which are required for public companiesonly, until their effective date. Management has evaluated ASU2018-13 and has adopted the relevant provisions of the disclosureframework.
12. Other Tax Information
Net investment income and realized gains and losses for Federal income tax purposes may differ from that reported on the financial statementsbecause of permanent book-to-tax differences. GAAP requires that permanent differences between financial reporting and tax reporting bereclassified between various components of net assets.
160

GuideMark® Funds & GuidePath® FundsNOTES TO FINANCIAL STATEMENTS (Continued)March 31, 2021
These differences are primarily due to CFC income reversal, partnerships and equalization. On the Statements of Assets and Liabilities, thefollowing adjustments were made:
Total DistributableEarnings (Loss) Capital Stock
Large Cap Core Fund $ (4) $ 4Emerging Markets Fund 9 (9)Small/Mid Cap Core Fund (10) 10World ex-US Fund — —Core Fixed Income Fund 18 (18)Growth Allocation Fund 50 (50)Conservative Allocation Fund (321,342) 321,342Tactical Allocation Fund (146,482) 146,482Absolute Return Allocation Fund (2) 2Multi-Asset Income Allocation Fund (22) 22Flexible Income Allocation Fund (34) 34Managed Futures Strategy Fund (458,264) 458,264Conservative Income Fund 187 (187)Income Fund 2 (2)Growth and Income Fund — —
The Funds intend to utilize capital loss carryforwards to offset future realized capital gains. Losses are carried forward indefinitely and anycorresponding loss character is retained. Capital loss carryforwards available for Federal income tax purposes are as follows:
Capital losses
Short Term Long Term Utilized
Large Cap Core Fund $1,584,575 $ — $(4,827,801)Emerging Markets Fund — — (479,613)Small/Mid Cap Core Fund — — —World ex-US Fund 3,959,293 1,340,690 —Core Fixed Income Fund — — —Growth Allocation Fund — — (1,788,501)Conservative Allocation Fund — — (691,182)Tactical Allocation Fund — — —Absolute Return Allocation Fund — 2,985,570 (7,170,921)Multi-Asset Income Allocation Fund — 9,721,660 —Flexible Income Allocation Fund — 529,452 (8,745,275)Managed Futures Strategy Fund — — —Conservative Income Fund 81,722 — (18,665)Income Fund 875,368 — (1,014,069)Growth and Income Fund — — (1,178,671)
Additionally, at March 31, 2021, the Funds deferred on a tax basis losses as follows:
Ordinary LateYear Loss
CapitalLoss
Large Cap Core Fund $ — $—Emerging Markets Fund — —Small/Mid Cap Core Fund — —World ex-US Fund — —Core Fixed Income Fund — —Growth Allocation Fund — —Conservative Allocation Fund — —Tactical Allocation Fund — —Absolute Return Allocation Fund — —Multi-Asset Income Allocation Fund — —Flexible Income Allocation Fund — —Managed Futures Strategy Fund — —Conservative Income Fund 3,677 —Income Fund — —Growth and Income Fund — —
161

GuideMark® Funds & GuidePath® FundsNOTES TO FINANCIAL STATEMENTS (Continued)March 31, 2021
A regulated investment company may elect for any taxable year to treat any portion of the qualified late year loss as arising on the first day of thenext taxable year. Qualified late year losses are certain capital and ordinary losses which occur during the portion of the taxable year subsequent toOctober 31 and December 31, respectively.
The character of distributions for tax purposes paid during the fiscal years ended March 31, 2021 and March 31, 2020 are as follows:
Year Ended March 31, 2021
OrdinaryIncome
Distributions
Long-TermCapital GainDistributions
Large Cap Core Fund $ 2,201,345 $ —Emerging Markets Fund 177,627 —Small/Mid Cap Core Fund 110,758 1,642,553World ex-US Fund 2,716,002 —Core Fixed Income Fund 4,964,515 636,513Growth Allocation Fund 4,754,892 13,935,648Conservative Allocation Fund 7,633,082 1,474,838Tactical Allocation Fund 2,082,296 18,172,038Absolute Return Allocation Fund 5,196,739 —Multi-Asset Income Allocation Fund 3,193,649 —Flexible Income Allocation Fund 4,975,241 —Managed Futures Strategy Fund — 6,730,017Conservative Income Fund 33,188 —Income Fund 628,224 —Growth and Income Fund 795,837 —
Year Ended March 31, 2020
OrdinaryIncome
Distributions
Long-TermCapital GainDistributions
Large Cap Core Fund $ 460,107 $ 4,125,368Emerging Markets Fund 1,489,554 —Small/Mid Cap Core Fund 23,201 963,221World ex-US Fund 2,542,292 —Core Fixed Income Fund 1,893,282 —Growth Allocation Fund 10,455,186 —Conservative Allocation Fund 8,126,703 —Tactical Allocation Fund 3,986,966 12,464,579Absolute Return Allocation Fund 8,313,720 —Multi-Asset Income Allocation Fund 3,881,432 40,325Flexible Income Allocation Fund 2,894,134 —Managed Futures Strategy Fund 2,629,756 4,547,812Conservative Income Fund 81,578 —Income Fund 589,175 688Growth and Income Fund 394,397 —
162
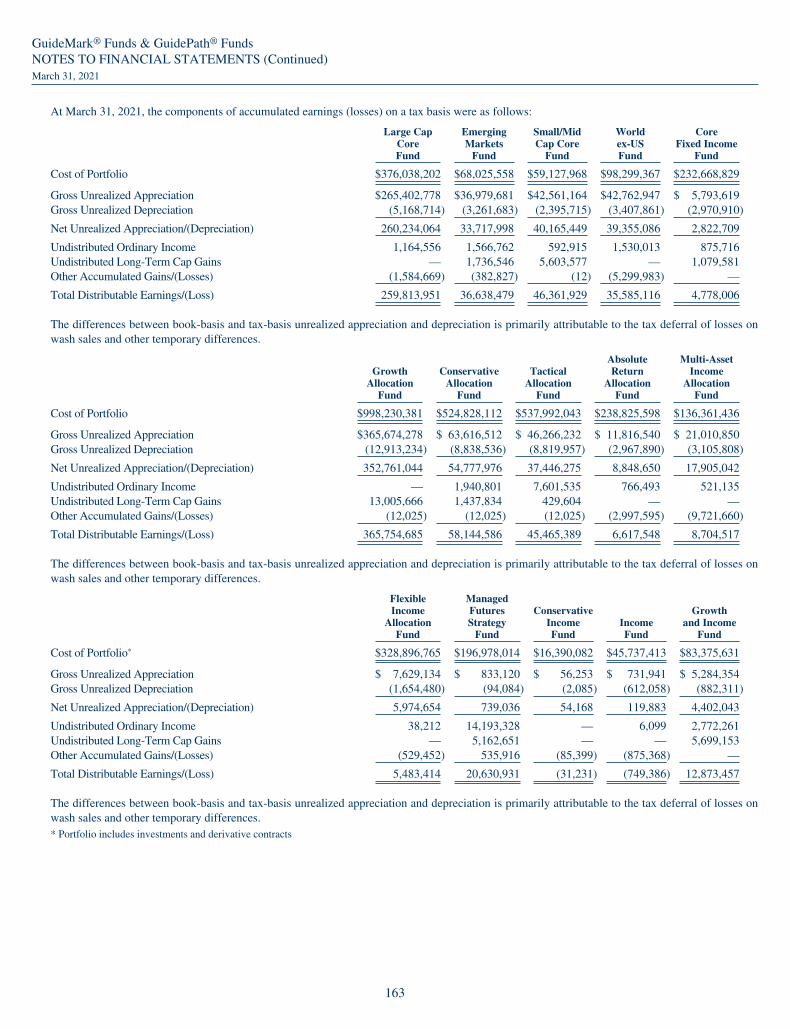
GuideMark® Funds & GuidePath® FundsNOTES TO FINANCIAL STATEMENTS (Continued)March 31, 2021
At March 31, 2021, the components of accumulated earnings (losses) on a tax basis were as follows:
Large CapCoreFund
EmergingMarkets
Fund
Small/MidCap Core
Fund
Worldex-USFund
CoreFixed Income
Fund
Cost of Portfolio $376,038,202 $68,025,558 $59,127,968 $98,299,367 $232,668,829
Gross Unrealized Appreciation $265,402,778 $36,979,681 $42,561,164 $42,762,947 $ 5,793,619Gross Unrealized Depreciation (5,168,714) (3,261,683) (2,395,715) (3,407,861) (2,970,910)
Net Unrealized Appreciation/(Depreciation) 260,234,064 33,717,998 40,165,449 39,355,086 2,822,709
Undistributed Ordinary Income 1,164,556 1,566,762 592,915 1,530,013 875,716Undistributed Long-Term Cap Gains — 1,736,546 5,603,577 — 1,079,581Other Accumulated Gains/(Losses) (1,584,669) (382,827) (12) (5,299,983) —
Total Distributable Earnings/(Loss) 259,813,951 36,638,479 46,361,929 35,585,116 4,778,006
The differences between book-basis and tax-basis unrealized appreciation and depreciation is primarily attributable to the tax deferral of losses onwash sales and other temporary differences.
GrowthAllocation
Fund
ConservativeAllocation
Fund
TacticalAllocation
Fund
AbsoluteReturn
AllocationFund
Multi-AssetIncome
AllocationFund
Cost of Portfolio $998,230,381 $524,828,112 $537,992,043 $238,825,598 $136,361,436
Gross Unrealized Appreciation $365,674,278 $ 63,616,512 $ 46,266,232 $ 11,816,540 $ 21,010,850Gross Unrealized Depreciation (12,913,234) (8,838,536) (8,819,957) (2,967,890) (3,105,808)
Net Unrealized Appreciation/(Depreciation) 352,761,044 54,777,976 37,446,275 8,848,650 17,905,042
Undistributed Ordinary Income — 1,940,801 7,601,535 766,493 521,135Undistributed Long-Term Cap Gains 13,005,666 1,437,834 429,604 — —Other Accumulated Gains/(Losses) (12,025) (12,025) (12,025) (2,997,595) (9,721,660)
Total Distributable Earnings/(Loss) 365,754,685 58,144,586 45,465,389 6,617,548 8,704,517
The differences between book-basis and tax-basis unrealized appreciation and depreciation is primarily attributable to the tax deferral of losses onwash sales and other temporary differences.
FlexibleIncome
AllocationFund
ManagedFuturesStrategy
Fund
ConservativeIncomeFund
IncomeFund
Growthand Income
Fund
Cost of Portfolio* $328,896,765 $196,978,014 $16,390,082 $45,737,413 $83,375,631
Gross Unrealized Appreciation $ 7,629,134 $ 833,120 $ 56,253 $ 731,941 $ 5,284,354Gross Unrealized Depreciation (1,654,480) (94,084) (2,085) (612,058) (882,311)
Net Unrealized Appreciation/(Depreciation) 5,974,654 739,036 54,168 119,883 4,402,043
Undistributed Ordinary Income 38,212 14,193,328 — 6,099 2,772,261Undistributed Long-Term Cap Gains — 5,162,651 — — 5,699,153Other Accumulated Gains/(Losses) (529,452) 535,916 (85,399) (875,368) —
Total Distributable Earnings/(Loss) 5,483,414 20,630,931 (31,231) (749,386) 12,873,457
The differences between book-basis and tax-basis unrealized appreciation and depreciation is primarily attributable to the tax deferral of losses onwash sales and other temporary differences.* Portfolio includes investments and derivative contracts
163

GuideMark® Funds & GuidePath® FundsREPORT OF REGISTERED PUBLIC ACCOUNTING FIRM
To the Shareholders and Board of Trustees ofGPS Funds I and GPS Funds II
Opinion on the Financial Statements
We have audited the accompanying statements of assets and liabilities, including the schedules of investments, open futures contracts, open swapcontracts, and options written (including the consolidated statement of assets and liabilities and consolidated schedules of investments, open futurescontracts and open forward currency contracts of GuidePath® Managed Futures Strategy Fund), of GPS Funds I and GPS Funds II comprising thefunds listed below (the “Funds”) as of March 31, 2021, the related statements of operations, the statements of changes in net assets, the related notes,and the financial highlights for each of the periods indicated below (collectively referred to as the “financial statements”). In our opinion, the financialstatements present fairly, in all material respects, the financial position of each of the Funds as of March 31, 2021, the results of their operations, thechanges in net assets, and the financial highlights for each of the periods indicated below in conformity with accounting principles generally acceptedin the United States of America.
Fund NameStatements of
Operations
Statements ofChanges in Net
Assets Financial Highlights
GuideMark® Large Cap Core Fund,GuideMark® Emerging Markets Fund,GuideMark® Small/Mid Cap Core Fund,GuideMark® World ex-US Fund,GuideMark® Core Fixed Income Fund,GuidePath® Growth Allocation Fund,GuidePath® Conservative Allocation Fund,GuidePath® Tactical Allocation Fund,GuidePath® Absolute Return Allocation Fund,GuidePath® Multi-Asset Income Allocation Fund, andGuidePath® Flexible Income Allocation Fund
For the year endedMarch 31, 2021
For the yearsended March 31,2021 and 2020
For the years endedMarch 31, 2021, 2020,2019, 2018 and 2017
GuidePath® Managed Futures Strategy Fund Consolidated forthe year endedMarch 31, 2021
Consolidated forthe years endedMarch 31, 2021and 2020
Consolidated for theyears ended March 31,2021, 2020, 2019, 2018and 2017
GuidePath® Conservative Income Fund,GuidePath® Income Fund, andGuidePath® Growth and Income Fund
For the year endedMarch 31, 2021
For the yearsended March 31,2021 and 2020
For the years endedMarch 31, 2021 and2020 and for the periodfrom April 30, 2018(commencement ofoperations) throughMarch 31, 2019
Basis for Opinion
These financial statements are the responsibility of the Funds’ management. Our responsibility is to express an opinion on the Funds’ financialstatements based on our audits. We are a public accounting firm registered with the Public Company Accounting Oversight Board (United States)(“PCAOB”) and are required to be independent with respect to the Funds in accordance with the U.S. federal securities laws and the applicable rulesand regulations of the Securities and Exchange Commission and the PCAOB.
We conducted our audits in accordance with the standards of the PCAOB. Those standards require that we plan and perform the audit to obtainreasonable assurance about whether the financial statements are free of material misstatement whether due to error or fraud.
Our audits included performing procedures to assess the risks of material misstatement of the financial statements, whether due to error or fraud, andperforming procedures that respond to those risks. Such procedures included examining, on a test basis, evidence regarding the amounts anddisclosures in the financial statements. Our procedures included confirmation of securities owned as of March 31, 2021, by correspondence with thecustodian and brokers; when replies were not received from brokers, we performed other auditing procedures. Our audits also included evaluating theaccounting principles used and significant estimates made by management, as well as evaluating the overall presentation of the financial statements.We believe that our audits provide a reasonable basis for our opinion.
We have served as the Funds’ auditor since 2014.
/s/ COHEN & COMPANY, LTD.Milwaukee, WisconsinMay 28, 2021
164

GuideMark® Funds & GuidePath® FundsADDITIONAL INFORMATIONMarch 31, 2021
Additional Information
1. Shareholder Notification of Federal Tax Status (Unaudited)
The Funds designated the following percentages of dividends during the fiscal year ended March 31, 2021 as dividends qualifying for thedividends received deduction available to corporate shareholders and as dividends from net investment income that are qualifying income underthe Jobs and Growth Tax Relief Reconciliation Act of 2003, respectively:
Dividends receiveddeduction % for
corporate shareholders% of dividends asqualified income
Large Cap Core Fund 100.00% 100.00%Emerging Markets Fund 1.05% 65.09%Small/Mid Cap Core Fund 90.81% 68.24%World ex-US Fund 0.00% 100.00%Core Fixed Income Fund 0.00% 0.00%Growth Allocation Fund 85.03% 100.00%Conservative Allocation Fund 22.25% 46.65%Tactical Allocation Fund 0.00% 5.44%Absolute Return Allocation Fund 0.00% 0.00%Multi-Asset Income Allocation Fund 29.42% 52.20%Flexible Income Allocation Fund 2.44% 2.65%Managed Futures Strategy Fund 0.00% 0.00%Conservative Income Fund 0.00% 0.00%Income Fund 0.00% 0.00%Growth and Income Fund 0.00% 0.00%
The Percentage of taxable ordinary income distributions that are designated as short-term capital gain distributions under Internal RevenueSection 871(k)(2)(C) for each Fund were as follows (unaudited).
% of dividends asshort-term capital gain
Large Cap Core Fund 0.00%Emerging Markets Fund 4.84%Small/Mid Cap Core Fund 100.00%World ex-US Fund 0.00%Core Fixed Income Fund 42.11%Growth Allocation Fund 0.00%Conservative Allocation Fund 0.00%Tactical Allocation Fund 0.00%Absolute Return Allocation Fund 0.00%Multi-Asset Income Allocation Fund 0.00%Flexible Income Allocation Fund 0.00%Managed Futures Strategy Fund 0.00%Conservative Income Fund 0.00%Income Fund 0.00%Growth and Income Fund 0.00%
2. Foreign Tax Credit Pass Through (Unaudited)
Pursuant to Section 853 of the Internal Revenue Code, the following Funds designate the following amounts as foreign taxes paid for the periodended March 31, 2021. Foreign taxes paid for purposes of Section 853 may be less than actual foreign taxes paid for financial statement purposes.
Creditable ForeignTaxes Paid
Per ShareAmount
Portion of Ordinary IncomeDistribution Derived fromForeign Sourced Income*
Emerging Markets $259,188 $0.0441 94.37%World ex-US Fund 282,892 0.0214 97.43%* The Funds listed above did not derive any income from “ineligible foreign sources” as defined under Section 901(j) of the Internal Revenue Code.
Foreign taxes paid or withheld should be included in taxable income with an offsetting deduction from gross income or as a credit for taxes paid toforeign governments.
165
GuideMark® Funds & GuidePath® FundsADDITIONAL INFORMATION (Continued)March 31, 2021
Above figures may differ from those cited elsewhere in this report due to differences in the calculation of income and gains under U.S. generallyaccepted accounting principles (book) purposes and Internal Revenue Service (tax) purposes.
Shareholders are strongly advised to consult their own tax advisers with respect to the tax consequences of their investments in the Funds. InJanuary, shareholders, excluding corporate shareholders, receive an IRS 1099-DIV regarding the Federal tax status of the dividends anddistributions they received in the calendar year.
3. Disclosure Regarding Fund Trustees and Officers (Unaudited)
Name, Addressand Year of Birth
Position(s) Heldwith the Trusts
Term of Office andLength of Time Served
Principal OccupationDuring Past Five Years or Longer
# ofPortfoliosin FundComplexOverseenby Trustee
Other Director/Trustee Positions
GPS Funds I and GPS Funds II
Independent Trustees
David M. DunfordYear of Birth: 1949c/o AssetMark, Inc.1655 Grant Street,10th FloorConcord, CA 94520
Lead IndependentTrustee
Indefinite Term(since 2013 for GPSFunds I and since 2011for GPS Funds II)
Retired; formerly, Senior VicePresident, Merrill Lynch InsuranceGroup (1989-2001).
16 Trustee, Savos Investments Trust(2015-present); Director,New England Bancorp(2006-2016);
Paul S. FeinbergYear of Birth: 1942c/o AssetMark, Inc.1655 Grant Street,10th FloorConcord, CA 94520
IndependentTrustee
Indefinite Term(since 2013 for GPSFunds I and since 2011for GPS Funds II)
Retired; formerly, President,CitiStreet Funds, Inc. (2000-2005);Executive Vice President andGeneral Counsel, CitiStreetAssociates LLC (insuranceagency), CitiStreet Equities LLC(broker- dealer), CitiStreetFinancial Services LLC (registeredinvestment advisor) and CitiStreetFunds Management LLC(registered investment advisor)(1990-2005).
16 Trustee, Savos Investments Trust(2015-present);
Dennis G. SchmalYear of Birth: 1947c/o AssetMark, Inc.1655 Grant Street,10th FloorConcord, CA 94520
IndependentTrustee
Indefinite Term(since 2007 for GPSFunds I and since 2013for GPS Funds II)
Self-employed consultant (1999-present); formerly, Partner, ArthurAndersen LLP (audit services)(1972-1999).
16 Trustee, Savos Investments Trust(2015-present); Director, BlueCalypso, Inc. (2015-2019);Director, Owens RealtyMortgage Inc. (2013-2019);Director, Cambria ETF SeriesTrust (2013-present); Director,Wells Fargo GAI Hedge Funds(2008-2019). Director, MerrimanHoldings, Inc. (financialservices) (2003-2016);
Interested Trustee
Carrie E. Hansen*Year of Birth: 1970c/o AssetMark, Inc.1655 Grant Street,10th FloorConcord, CA 94520
Interested Trusteeand ChairpersonPresident
Indefinite Termsince 2014Renewed 1-Year Termsince 2008
President, GPS Funds I (2007-present) and GPS Funds II (2011-present); President, SavosInvestments Trust (“Savos”) (2008-present); Executive Vice Presidentand Chief Operating Officer,AssetMark (2008-present);President, AssetMark Brokerage™,LLC (2013-present).
16 Trustee, Savos Investments Trust(2014-present); Director andChairperson, AssetMark TrustCo. (2008-present); Director,AssetMark, Inc. (2013-present);Treasurer, Acalanes BoostersClub (2017-2019).
166

GuideMark® Funds & GuidePath® FundsADDITIONAL INFORMATION (Continued)March 31, 2021
Name, Addressand Year of Birth
Position(s) Heldwith the Trusts
Term of Office andLength of Time Served Principal Occupation During Past Five Years
Officers of the Trusts**
John KovalYear of Birth: 1966c/o AssetMark, Inc.1655 Grant Street,10th FloorConcord, CA 94520
Chief ComplianceOfficer and AMLComplianceOfficer
Renewed 1-Year Termsince 2013
Chief Compliance Officer, GPS Funds I, GPS Funds II, and Savos (2013-present);Interim Chief Compliance Officer, GPS Funds I, GPS Funds II, and Savos(September 2012-January 2013); Senior Compliance Officer, AssetMark (2011-2012);Chief Operating Officer, SEAL Capital, Inc. (2009-2010); Chief Compliance Officer,Cliffwood Partners LLC (2004-2009).
Patrick R. YoungYear of Birth: 1982c/o AssetMark, Inc.1655 Grant Street,10th FloorConcord, CA 94520
Vice Presidentand Treasurer
Renewed 1-Year Termsince 2014
Vice President and Treasurer, GPS Funds I, GPS Funds II, and Savos (May 2014-present); Director of Mutual Fund Operations and Finance, AssetMark (February 2016-present); Manager of Fund Administration, AssetMark (May 2014-February 2016);Senior Fund Administration Officer, AssetMark (2008-May 2014).
Christine Villas-ChernakYear of Birth: 1968c/o AssetMark, Inc.1655 Grant Street,10th FloorConcord, CA 94520
Secretary Renewed 1-Year Termsince 2014
Secretary, GPS Funds I (2006-2013 and May 2014-present), GPS Funds II (2011-2013and May 2014- present), Savos (2009-2010 and May 2014-present) Deputy ChiefCompliance Officer, GPS Funds I (2009-present), GPS Funds II (2011-present) andGVIT (2009-2012); Senior Compliance Officer, AssetMark (2005-2009).
* Ms. Hansen is a Trustee who is an “interested person” of the Trusts as defined in the 1940 Act because she is an officer of AssetMark or certain of its affiliates.** Each Officer of the Trusts serves at the pleasure of the Board.
The Statement of Additional Information includes additional information about the Funds’ Trustees and is available free of charge upon request bycalling the Funds toll free at (888) 278-5809.
4. Proxy Voting Policies and Procedures and Proxy Voting Record (Unaudited)
A description of the policies and procedures that the Funds use to determine how to vote proxies related to the Funds’ portfolio securities as well asinformation regarding how the Funds voted proxies relating to portfolio securities during the most recent 12-month period ended June 30 isavailable without charge, upon request, by calling (888) 278-5809. Furthermore, you can obtain the Fund’s proxy voting records on the SEC’swebsite at http://www.sec.gov.
5. Availability of Quarterly Portfolio Holdings Schedules (Unaudited)
The Funds file their complete schedules of portfolio holdings with the SEC for their first and third fiscal quarters on Part F of Form N-PORT. Oncefiled, the Funds’ Part F of Form N-PORT is available without charge, upon request on the SEC’s website (http://www.sec.gov) and is available bycalling (888) 278-5809.
6. Statement Regarding the Basis for Approval of Investment Advisory Agreement and Sub-Advisory Agreements (Unaudited)
GPS FUNDS I and GPS FUNDS II: Annual Consideration and Approval of Investment Advisory and Sub-Advisory Agreements
At a meeting held on December 3, 2020 (the “Meeting”), the Board of Trustees (the “Board” or the “Trustees”) of GPS Funds I and GPS Funds II(collectively, the “Trusts”) conducted its annual review and consideration of the renewal of the investment advisory agreements betweenAssetMark, Inc. (“AssetMark”) and each Trust on behalf of its respective series (each, a “Fund” and collectively, the “Funds”) and the renewal ofthe investment advisory agreement between AssetMark and the wholly-owned Cayman Islands subsidiary of the GuidePath® Managed FuturesStrategy Fund, GuidePath® Managed Futures Strategy Cayman Fund Ltd. (the “Cayman Subsidiary”) (each such agreement, an “AdvisoryAgreement,” and collectively, the “Advisory Agreements”). Additionally, the Board considered the renewal of the investment sub-advisoryagreements between (i) Goldman Sachs Asset Management, L.P. (“GSAM”) and AssetMark, on behalf of GuideMark® Large Cap Core Fund,GuideMark® Emerging Markets Fund, GuideMark® Small/Mid Cap Core Fund, and GuideMark® World ex-US Fund; (ii) Wellington ManagementCompany LLP (“Wellington”) and AssetMark, on behalf of the GuideMark® Core Fixed Income Fund; and (iii) AlphaSimplex Group, LLC(“ASG”) and AssetMark, on behalf of the GuidePath® Managed Futures Strategy Fund and the Cayman Subsidiary (each, a “Sub-AdvisoryAgreement, and collectively, the “Sub-Advisory Agreements”).
Hereinafter, GSAM, Wellington, and ASG are collectively referred to as the “Sub-Advisors” and the above-listed Funds are collectively referred toas the “Sub-Advised Funds.” The Advisory Agreements and Sub-Advisory Agreements are collectively referred to herein as the “Agreements.”The Sub-Advised Funds are managed using a “manager-of-managers” structure that generally involves the use of one or more sub-advisors tomanage allocated portions of the Sub-Advised Funds’ portfolios. For those Sub-Advised Funds AssetMark is responsible for evaluating andselecting sub-advisors on an ongoing basis and making any decisions to recommend hiring, retaining, or replacing sub-advisors. The Board isengaged in monitoring this process in connection with its meetings held throughout the year, and under the manager-of-managers structure, allparties understand that sub-advisors are being monitored and evaluated, and are subject to replacement, at all times.
167

GuideMark® Funds & GuidePath® FundsADDITIONAL INFORMATION (Continued)March 31, 2021
The Board – including a majority of the Trustees who are not “interested persons” of the Funds or AssetMark as that term is defined in theInvestment Company Act of 1940, as amended (the “Independent Trustees”) – determined to approve the continuance of the Advisory Agreementsand the Sub-Advisory Agreements. In connection with their consideration of the renewal of the Advisory Agreements, the Trustees consideredseveral factors they deemed relevant to the process, including: the nature, quality and extent of the services provided to each Fund by the Advisor;the costs of providing services to each Fund; the anticipated profitability to be realized by the Advisor; any potential “fall-out” or ancillary benefitsto the Advisor or its affiliates; the potential effects of asset growth and related economies of scale on each fund’s expenses; and the fees charged byinvestment advisers of other comparable funds. The material factors considered and the conclusions that formed the basis of the Board’s approvalof the renewal of the Agreements are described below. This summary describes the most significant, but not all, of the factors evaluated by theBoard. Prior to considering the approval of the renewal of the Agreements, the Trustees requested, received, and reviewed information relevant totheir consideration of the Agreements. The Trustees also received assistance and advice regarding legal and industry standards from counsel to theTrusts and separately from independent legal counsel to the Independent Trustees (“Independent Counsel”). Prior to approving the AdvisoryAgreements, the Independent Trustees met in executive session with Independent Counsel without representatives of the Advisor or its affiliates.The Independent Trustees relied upon the advice of Independent Counsel and their own business judgment in determining the material factors to beconsidered in evaluating each Investment Advisory Agreement and the weight to be given to each such factor. The conclusions reached by theTrustees were based on a comprehensive evaluation of all of the information available to the Trustees and not the result of any particularinformation or any single factor. Moreover, each Trustee may have afforded different weight to various information and factors in reaching hisconclusions with respect to the renewal of the Agreements.
The Advisory Agreements
Materials Reviewed and the Review Process
Prior to voting to approve the renewal of the Advisory Agreements, the Trustees – assisted by Independent Counsel – specifically requested andwere furnished with materials supplied by counsel and AssetMark for purposes of their review of each Advisory Agreement. The materialsprovided to the Board with regard to the Funds included, among other information: (1) a copy of each Advisory Agreement; (2) informationdescribing each Fund’s performance compared to the Fund’s peer group of other investment companies with investment objectives similar to theinvestment objective(s) of the Fund; (3) information describing the nature, quality and extent of the services that AssetMark provides to therespective Funds, and the fees AssetMark charges to the Funds for such services, and a comparison of those fees to the fees paid by a peer group ofother investment companies having investment objectives similar to the investment objectives of the respective Funds; (4) information regardingAssetMark’s business and operations, investment team, compliance program and internal procedures; (5) information describing each Fund’sexpense ratio compared to the Fund’s peer group of other registered investment companies with investment objectives similar to the investmentobjective(s) of the Fund; (6) information regarding the financial condition of AssetMark; (7) information regarding AssetMark’s profitabilityoverall and with respect to each Fund, including information regarding the anticipated impact to the Advisor’s profitability of the proposedliquidation of the GuideMark Tax-Exempt Fixed Income Fund and GuideMark Opportunistic Fixed Income Fund (the “Liquidating Funds”) andthe proposed changes to the GuideMark and GuidePath Funds’ fee structures, each anticipated to take effect on or about April 1, 2021; (8) reportson AssetMark’s evaluation of the Sub-Advisors, including reports relating to the monitoring of each Sub-Advisor’s trading and brokeragepractices; (9) reports relating to the distribution, sales and redemptions of Fund shares and related shareholder services; (10) reports relating to themonitoring of the other service providers; and (11) other information relevant to an evaluation of the nature, extent and quality of the servicesprovided by AssetMark in response to a series of detailed questions posed by Independent Counsel on behalf of the Independent Trustees. TheTrustees met with representatives of AssetMark. The Trustees also considered their discussions with and presentations from representatives ofAssetMark throughout the course of the Meeting. In addition, the Trustees considered information furnished to the Board and its Committeesthroughout the year and in between regularly scheduled meetings on particular matters as the need arose. Information provided to the Board and itsCommittees at their meetings throughout the year included, among other things, reports on Fund performance, compliance and risk managementmatters, sales activity, revenue and profitability of AssetMark, and the Funds’ distribution and servicing arrangements and related compensation.
The Trustees received assistance and advice regarding legal and industry standards from counsel to the Trusts and separately from IndependentCounsel, which included detailed memoranda from Independent Counsel that described the Trustees’ legal duties and obligations in consideringwhether to approve the continuation of the Advisory Agreements. The Independent Trustees also discussed the Advisory Agreements prior to theMeeting and during the course of their meeting in executive session with Independent Counsel, at which no representatives of AssetMark werepresent.
Factors Considered
The Trustees considered and reached conclusions on a number of factors that they deemed relevant in making the decision to approve the renewalof each Advisory Agreement. These factors and conclusions are described below.
Nature, Quality and Extent of Services
The Trustees considered the nature, extent and quality of the services that AssetMark provides to the Funds. With respect to the Sub-AdvisedFunds, the Board considered the fact that, as an investment advisor operating within a manager-of-managers structure, AssetMark maintains aprimary focus on the selection, evaluation and oversight of the Sub-Advisors and considered each Advisory Agreement in this context. In thisregard, the Trustees considered the information provided to them throughout the course of the year during regular meetings of the Board, which
168

GuideMark® Funds & GuidePath® FundsADDITIONAL INFORMATION (Continued)March 31, 2021
included meetings with the Trusts’ CCO at which the Trustees are provided with details regarding AssetMark’s compliance functions. In addition,the Trustees took into account the Advisor’s communications with the Board in light of the market volatility amidst the coronavirus (“COVID-19”)pandemic.
The Trustees considered AssetMark’s investment team and its capabilities, including with respect to the responsibilities that AssetMark has for theFunds that pursue their investment objectives through investments in other funds (each a “Fund-of-Funds”). The Trustees also consideredAssetMark’s capabilities with respect to the administrative and compliance services provided to the Funds. The Trustees considered the experience,capability and integrity of AssetMark’s management and other personnel, the role of AssetMark’s senior management and the extent of itsinvolvement with the Funds, and AssetMark’s willingness to add personnel over time in order to ensure that appropriate staffing levels aremaintained. With respect to the Sub-Advised Funds, the Trustees noted the responsibilities that AssetMark has under certainFunds’ manager-of-managers structure, including: selecting and oversight of the Funds’ Sub-Advisors; maintaining a comprehensive complianceand administration program; and implementing Fund policies.
The Trustees also considered (a) the financial position of AssetMark; (b) the quality of AssetMark’s regulatory and legal compliance policies,procedures and systems; (c) the nature, extent and quality of administrative and shareholder services provided by AssetMark to the Funds; and(d) AssetMark’s supervision of the Funds’ third-party service providers.
The Board considered the breadth and quality of services that AssetMark provides to the Funds. The Trustees also considered that the Funds are anintegral part of AssetMark’s program of asset allocation and shareholder services. Additionally, with respect to the Sub-Advised Funds, theTrustees considered AssetMark’s ability to provide administrative and compliance-related services in connection with AssetMark’s (a) oversightof the Sub-Advisors’ compliance with the Funds’ respective investment objectives, policies, and restrictions; (b) review of trading and brokeragematters; and (c) other oversight activities.
The Trustees also considered the Advisor’s investments in business continuity planning designed to benefit the Funds, and the implementation ofthe Advisor’s business continuity planning plans due to the COVID-19 pandemic. The Trustees also noted the Advisor’s commitment tomaintaining high quality systems and expending substantial resources to prepare for and respond to ongoing changes to the market, regulatory andcontrol environments in which the Funds and their service providers operate, including changes associated with the COVID-19 pandemic.
Based on the factors described above, among other factors, as well as the information provided to the Board throughout the year, the Trusteesconcluded that they were satisfied with the nature, extent and quality of the services provided by AssetMark, which will continue to be provided toeach Fund.
Investment Performance
The Trustees considered the overall investment performance of the Funds, and, with respect to the Sub-Advised Funds, evaluated the Funds’performance in the context of the manager-of-managers structure. The Trustees considered whether the Funds operated in a manner consistent withtheir investment objectives and styles and considered each Fund’s record of compliance with its respective investment restrictions.
The Trustees also considered each Fund’s investment performance relative to its respective benchmark index and relative to the performance offunds with comparable investment strategies selected by a third-party information provider. The Trustees also considered performance-related datareceived throughout the past year at and in connection with meetings of the Board. With respect to each Fund-of-Funds, the Trustees reviewed theperformance of AssetMark in selecting the underlying funds for the Fund.
The Trustees considered that, as applicable, AssetMark continued to be proactive in seeking to replace and/or add Sub-Advisors or underlyingfunds, to reallocate assets among Sub-Advisors or underlying funds and to implement new investment strategies, with a view to improving Fundperformance over the long term.
The Trustees concluded that AssetMark’s performance record in managing each of the Funds was satisfactory and supported a decision to approvethe renewal of the Advisory Agreements.
Advisory Fees and Total Expenses
The Trustees considered a detailed analysis of each Fund’s fees and expenses. The materials provided to the Board included (i) a comparison of theadvisory fees and total expenses of each Fund (as a percentage of average net assets) with the fees and expenses of a group of funds selected by athird-party information provider; (ii) comparisons of each Fund’s expenses to industry averages; and (iii) fee schedules forthe Funds’ Sub-Advisors , as applicable.
The Trustees considered expense limitation arrangements under which AssetMark has agreed to limit the Funds’ expenses. With respectto each Fund-of-Funds, the Trustees considered the indirect expenses borne by the Funds as shareholders of certain underlying funds. The Trusteesalso considered other efforts by AssetMark to reduce overall Fund expenses, including attempts to improve asset flows, implementing programssuch as securities lending and negotiating strategic contracts with service providers.
In analyzing the Funds’ fee levels as compared to other similar funds, the Trustees considered the Funds’ fee levels in light of the Funds’ specialdistribution structure, under which the Funds were distributed as part of a suite of products and services with asset allocation modeling, fullperformance reporting and other services that are not typically provided with mutual funds. In this regard, while the Board recognized that
169

GuideMark® Funds & GuidePath® FundsADDITIONAL INFORMATION (Continued)March 31, 2021
comparisons between a Fund and its peer group may be imprecise given the Funds’ special distribution structure, among other differences, thecomparative information assisted the Board in evaluating the reasonableness of each Fund’s fees and expenses.
After comparing each Fund’s fees with other comparable funds and industry averages, and in light of the nature, extent and quality of servicesprovided to the Funds by AssetMark, as well as the costs incurred by AssetMark in rendering those services, the Trustees concluded that the levelof fees paid to AssetMark with respect to each Fund was reasonable. In addition, the Trustees, including all of the Independent Trustees,determined that the fees to be charged by AssetMark pursuant to the Advisory Agreements are for services provided in addition to, rather thanduplicative of, services provided under any underlying fund’s investment advisory agreement.
Profitability, Economies of Scale and Ancillary Benefits
The Trustees reviewed and discussed the financial information presented by AssetMark, including information relating to the financial stability ofAssetMark and its historical and anticipated profitability with respect to its management of the Funds. The Trustees discussed the methods used byAssetMark to allocate expenses to the Funds under its profitability analysis, and the Trustees considered the individual profitability of AssetMarkwith respect to each Fund under this methodology.
In evaluating AssetMark’s profitability, the Trustees acknowledged that the Funds are distributed in connection with AssetMark providing apackage of administrative and other services as the sponsor of AssetMark’s investment platform and considered the benefits that flow to Fundshareholders as a result of these services. Additionally, the Trustees considered AssetMark’s existing agreements to waive advisory fees receivedfrom certain Funds and/or pay certain Fund expenses to the extent necessary to ensure that the Funds’ overall expenses do not exceed certainlevels.
The Trustees considered ancillary benefits received by AssetMark as a result of its relationship with the Funds, including the benefits of offering anintegrated set of investment options as an integral part of AssetMark’s asset allocation investment programs and the related compensation paid bycertain third-party custodians to AssetMark in exchange for AssetMark providing a combination of administrative/shareholder services anddistribution-related services (custodial rebates). The Trustees concluded that these benefits were reasonable.
The Trustees considered AssetMark’s profitability in managing each Fund, the anticipated effect of asset growth on each Fund’s expenses, andother information that might suggest the potential for realizing economies of scale that could be shared with Fund shareholders. The Trusteesconsidered the fee waiver agreements under which AssetMark had agreed to waive expenses based upon the achievement of certain breakpointslisted in the agreement.
The Trustees concluded, in light of the foregoing factors, that AssetMark’s level of profitability with respect to each Fund is reasonable.Additionally, the Trustees concluded that the economies of scale being realized by AssetMark, if any, do not mandate the implementation of newor amended breakpoints or other changes in the fee structure for any Fund at this time.
Conclusion
After consideration of the foregoing factors, and such other matters as were deemed relevant, and with no single factor being determinative to theirdecision, the Trustees, including all of the Independent Trustees, concluded to approve the renewal of each Advisory Agreement with, and the feeto be paid to, AssetMark for each of the Funds.
The Sub-Advisory Agreements
Materials Reviewed and the Review Process
Prior to voting to approve the renewal of the Sub-Advisory Agreements, the Trustees – assisted by Independent Counsel – specifically requestedand were furnished with materials supplied by counsel, AssetMark and each Sub-Advisor for purposes of their review. The materials provided tothe Board included, among other information: (1) a copy of each Sub-Advisory Agreement; (2) information regarding the nature, quality and scopeof the services to be provided by the Sub-Advisors; (3) the investment performance of each Sub-Advisor in managing their respective Fundcompared to an industry peer group, appropriate benchmark, and comparable Sub-Advisor client accounts, to the extent applicable; (4)AssetMark’s evaluation of the nature, extent and quality of the services provided by each Sub-Advisor; (5) information regarding any benefits toeach Sub-Advisor, such as receipt of research from brokers, that might result from the Sub-Advisor’s relationship with a Sub-Advised Fund; (6)information concerning each Sub-Advisor’s personnel, business, operations and investment team, including biographical information for theinvestment professionals that are responsible for the day-to-day management of the applicable Sub-Advised Fund’s portfolio; (7) informationregarding each Sub-Advisor’s compliance policies and other internal procedures, including the Sub-Advisor’s brokerage practices; (8) informationregarding the financial condition of each Sub-Advisor or its parent company; and (9) other information relevant to an evaluation of the nature,extent and quality of the services provided by each Sub-Advisor provided in response to a series of detailed questions posed by IndependentCounsel on behalf of the Independent Trustees. The Trustees also considered the recommendations of AssetMark with respect to each Sub-Advisorand the methods and resources AssetMark utilized in its efforts to identify and engage Sub-Advisors for the Sub-Advised Funds.
In connection with their consideration of the Sub-Advisory Agreements, the Trustees considered several factors that they deemed relevant to thisprocess, including: (1) the nature, quality and extent of the services to be provided to each Sub-Advised Fund by the respective Sub-Advisor; (2)the quantitative performance of each Sub-Advisor; (3) AssetMark’s evaluation, in accordance with its role as a “manager-of-managers,” of thenature, extent and quality of the services provided by each Sub-Advisor; (4) information that might suggest the potential for realizing economies of
170
GuideMark® Funds & GuidePath® FundsADDITIONAL INFORMATION (Continued)March 31, 2021
scale that could potentially be shared with Fund shareholders; and (5) any potential “fall-out” or ancillary benefits to a Sub-Advisor or its affiliates.Prior to approving the continuation of the Sub-Advisory Agreements, the Independent Trustees met in executive session with Independent Counsel.The Independent Trustees were assisted by Independent Counsel throughout the review process. The Independent Trustees relied upon the adviceof Independent Counsel and their own business judgment in determining the material factors to be considered in evaluating each Sub-AdvisoryAgreement and the weight to be given to each such factor. The conclusions reached by the Independent Trustees were based on a comprehensiveevaluation of all of the information provided and were not the result of any one factor. Moreover, each Independent Trustee may have affordeddifferent weight to the various factors in reaching his conclusions with respect to each Sub-Advisory Agreement. A more detailed summary of theimportant, but not necessarily all, of the factors the Independent Trustees considered with respect to their approval of the continuation of the Sub-Advisory Agreements is provided below.
Nature, Quality and Extent of Services
The Trustees considered each Sub-Advisor’s investment management process, including (a) the experience, capability and integrity of the Sub-Advisor’s management, investment professionals and other personnel; (b) the financial position of the Sub-Advisor; (c) the quality andcommitment of the Sub-Advisor’s regulatory and legal compliance policies, procedures and systems; (d) the Sub-Advisor’s brokerage and tradingpractices; and (e) AssetMark’s evaluation of the nature, quality and extent of services performed by each Sub-Advisor.
The Trustees specifically considered the qualifications, experience and track record of the individuals and portfolio management teams at eachSub-Advisor that are responsible for the day-to-day management of each Sub-Advised Fund’s portfolio. The Trustees also considered, with respectto each Sub-Advisor, the specific investment approach and level of expertise within its particular asset class. The Trustees considered whether eachSub-Advisor operated within its respective Fund’s investment objective and style and considered each Sub-Advisor’s record of compliance withapplicable investment restrictions. The Trustees also considered each Sub-Advisor’s performance record with respect to the relevant benchmark(s).
The Trustees concluded that the nature, extent and quality of the services provided by each Sub-Advisor to its respective Sub-Advised Fund issatisfactory.
Sub-Advisor Investment Performance
The Trustees considered whether each Sub-Advisor operated within its respective Sub-Advised Fund’s investment objective and style andconsidered each Sub-Advisor’s record of compliance with applicable investment restrictions. The Trustees also considered each Sub-Advisor’sinvestment performance relative to benchmark indices.
The Trustees considered that they had reviewed each Sub-Advisor, including the primary contributors to and detractors from performance, withAssetMark and concluded that each Sub-Advisor’s performance record is satisfactory.
Sub-Advisory Fees, Economies of Scale, Profitability and Ancillary Benefits
The Trustees considered the fee paid to each Sub-Advisor by AssetMark for providing services to its relevant Sub-Advised Fund. The Trusteesconsidered management’s representation that AssetMark’s focus in negotiating sub-advisory arrangements is on achieving favorable, competitivefee structures for each Fund, and that the sub-advisory fees are paid by AssetMark out of the investment advisory fees received and not the Funds.The Trustees also considered individual reports prepared with regard to each Sub-Advisor, containing comparative information regarding fees. TheTrustees noted that each Sub-Advisor’s fees were generally similar to or lower than the fees charged by each Sub-Advisor to other comparablefunds and accounts.
The Trustees considered each Sub-Advisor’s fee schedule, the anticipated effect of asset growth on each Fund’s expenses, and other informationthat might suggest the potential for realizing economies of scale that could be shared with Fund shareholders. In this regard, the Trustees noted thatcertain of the Sub-Advisory Agreements’ fee schedules contain breakpoints that present potential economies of scale that could potentially beshared with the Sub-Advised Funds’ shareholders as assets of the Sub-Advised Funds grow.
The Trustees concluded that the fees to be paid to each Sub-Advisor by AssetMark are reasonable in light of the services performed for the Sub-Advised Funds by the Sub-Advisors and that the economies of scale being realized by the Sub-Advisors, if any, do not mandate the implementationof any new or amended breakpoints or other changes in the fee structure for any Sub-Advised Fund at this time.
The Trustees did not consider the profitability of the Sub-Advisors to be a material factor based on representations from AssetMark that itnegotiates sub-advisory fees with the Sub-Advisors on an arm’s-length basis and reports regarding any relationships between the Sub-Advisors andAssetMark.
The Trustees considered the allocation (if any) of Fund brokerage to brokers affiliated with a Sub-Advisor, and benefits to the Sub-Advisors fromthe use of “soft dollar” commissions (if any) to pay for research and brokerage services. The Trustees also considered any other ancillary benefitsthat accrue to a Sub-Advisor or any affiliate by virtue of the Sub-Advisor’s relationship with the Fund, and concluded that such benefits, if any,were reasonable.
171

GuideMark® Funds & GuidePath® FundsADDITIONAL INFORMATION (Continued)March 31, 2021
Conclusion
After consideration of the foregoing factors, and such other matters as were deemed relevant, and with no single factor being determinative to theirdecision, the Trustees, including all of the Independent Trustees, determined to approve the renewal of the Sub-Advisory Agreement with, and thefees to be paid to, each of the Sub-Advisors for each of the relevant Sub-Advised Funds.
7. Statement Regarding the Trusts’ Liquidity Risk Management Program (Unaudited)
This section discusses the operation and effectiveness of the Liquidity Risk Management Program (the “Program”) of GPS Funds I and GPSFunds II Trust (each, a “Trust” and collectively, the “Trusts”), including each of their respective series (each, a “Fund” and collectively, the“Funds”), established in accordance with Rule 22e-4 under the Investment Company Act of 1940, as amended (the “Liquidity Rule”). The Board ofTrustees of each Trust (the “Board”), including a majority of the Trustees who are not “interested persons” as defined in the 1940 Act, previouslyapproved the Program on behalf of each Fund, as required pursuant to the Liquidity Rule. The Board also approved the designation of AssetMark,Inc. (“AssetMark”), the investment adviser to each Fund, as the Program Administrator for the Program. AssetMarkadministers day-to-day implementation of the Program through a Liquidity Risk Management Committee (the “Committee”), as set forth in theProgram.
At the meeting of the Board held on March 4, 2021, AssetMark, as Program Administrator, provided the Board with the annual report addressingthe operation of the Program and assessing its adequacy and effectiveness of implementation, including, if applicable, the operation of any highlyliquid investments minimum (“HLIM”) and any material changes to the Program (the “Report”).
The Report included an overview of the operation of the Program from January 1, 2020 through December 31, 2020 (the “Review Period”),including liquidity events relevant to the Funds, if any, during the Review Period and conclusions with respect to the adequacy of the policies andprocedures of the Program and its effectiveness of implementation.
I. Key Conclusions of the Report
The Report concluded that (i) the Program is reasonably designed to assess and manage each Fund’s liquidity risk, taking into account the Fund’sparticular risks and circumstances, and includes policies and procedures reasonably designed to implement each required component of theLiquidity Rule; (ii) each Fund’s investment strategy is appropriate for an open-end fund; (iii) each Fund was able to meet requests for redemptionswithout significant dilution of remaining investors’ interests in the Fund during the Review Period; and (iv) the Program was implemented andoperated effectively to assess and manage each Fund’s liquidity risk during the Review Period, including during periods of market volatility andnet redemptions, as applicable.
There were no material liquidity matters impacting the Funds identified in the Report. In addition, the Report noted that there were no materialchanges to the Program during the Review Period.
II. Summary of the Review
A. Liquidity Risk Assessment and Review
Throughout the Review Period, the Program Administrator, in consultation with the Funds’ sub-advisers, as applicable, and portfolio managementteams, monitored the Funds’ portfolio liquidity and liquidity risk on an ongoing basis, as described in the Program and in quarterly Boardreporting.
The Program Administrator also conducted an annual review assessing each Fund’s liquidity risk as described in the Report, in accordance with therequirements of the Program and the Liquidity Rule, taking into account the following factors enumerated in the Liquidity Rule and identified inthe Program, as applicable:
a. Each Fund’s investment strategy and liquidity of portfolio investments during both normal and reasonably foreseeable stressed conditions,including: (i) whether the Fund’s investment strategy is appropriate for an open-end fund; (ii) the extent to which the Fund’s strategy involves arelatively concentrated portfolio or large positions in particular issuers; (iii) the Fund’s use of borrowings for investment purposes; and (iv) theFund’s use of derivatives (including for hedging purposes);
b. Short-term and long-term cash flow projections during both normal and reasonably foreseeable stressed conditions; and
c. Holdings of cash and cash equivalents, as well as borrowing arrangements and other funding sources.
In addition, in connection with the review of the Funds’ liquidity risks and the operation of the Program and the adequacy and effectiveness of itsimplementation, the Program Administrator also reviewed:
‰ Reasonably Anticipated Trade Size and Significant Value Impact metrics for each Fund
‰ Process for identifying and monitoring illiquid investments
‰ Responsibilities and operations of the Committee
‰ Effectiveness of third-party liquidity classification vendor
172

GuideMark® Funds & GuidePath® FundsADDITIONAL INFORMATION (Continued)March 31, 2021
In light of the assessment and review as discussed above, the Program Administrator did not recommend any changes in the management of theFunds’ liquidity risk.
B. Portfolio Holdings Classifications
During the Review Period, each Fund’s portfolio holdings (including derivative investments) were classified monthly as Highly LiquidInvestments, Moderately Liquid Investments, Less Liquid Investments and Illiquid Investments pursuant to the Program, as required by theLiquidity Rule. Upon the Committee’s review and approval, the classifications were recorded for reporting in each Fund’s Form N-PORT filingsduring the Review Period. The Report reviewed the classification methodology as provided in the Program and noted the liquidity classificationsprocess operated effectively during the Review Period.
C. HLIM
Each Fund qualified as a Primarily Highly Liquid Fund (“PHLF”) under the Program during the Review Period and accordingly, none of the Fundsmaintained or were required to establish an HLIM during the Review Period. There were no changes recommended in the Report with respect tothe status of any Fund as a PHLF pursuant to the review.
D. Compliance with the 15% Limitation on Illiquid Investments
Pursuant to the Liquidity Rule, no Fund may acquire any illiquid investment if, after the acquisition, the Fund would have invested more than 15%of its assets in illiquid investments that are assets (the “15% Limit”). All Funds were monitored daily for compliance with the 15% Limit duringthe Review Period. During the Review Period, the Funds operated in accordance with the relevant provisions of the Program addressing the 15%Limit, including with respect to temporary investment illiquidity as a result of extended market closures. The Report also addressed significantliquidity matters which occurred or were reported during the Review Period applicable to the Funds, if any, and actions to address such matters asapplicable.
173
GuideMark® FundsGuidePath® Funds
GUIDEMARK® FUNDS & GUIDEPATH® FUNDS
GuideMark® Large Cap Core FundGuideMark® Emerging Markets FundGuideMark® Small/Mid Cap Core FundGuideMark® World ex-US FundGuideMark® Core Fixed Income FundGuidePath® Growth Allocation FundGuidePath® Conservative Allocation FundGuidePath® Tactical Allocation FundGuidePath® Absolute Return Allocation FundGuidePath® Multi-Asset Income Allocation FundGuidePath® Flexible Income Allocation FundGuidePath® Managed Futures Strategy FundGuidePath® Conservative Income FundGuidePath® Income FundGuidePath® Growth and Income Fund
Investment AdvisorAssetMark, Inc.1655 Grant Street, 10th FloorConcord, CA 94520
Legal CounselStradley Ronon Stevens & Young, LLP2005 Market Street, Suite 2600Philadelphia, PA 19103
Independent Registered Public Accounting FirmCohen & Company, Ltd.342 North Water St.Suite 830Milwaukee, WI 53202
Transfer Agent, Fund Accountant and Fund AdministratorU.S. Bancorp Fund Services, LLC,doing business as U.S. Bank Global Fund Services615 East Michigan StreetMilwaukee, WI 53202
CustodianU.S. Bank, N.A.1555 North RiverCenter Drive, Suite 302Milwaukee, WI 53212
DistributorAssetMark BrokerageTM, LLC1655 Grant Street, 10th FloorConcord, CA 94520
This document must bepreceded or accompanied by afree prospectus. Investorsshould consider the Funds’investment objectives, risks,charges and expenses carefullybefore investing. Theprospectus contains this andother important informationabout the Funds. Please readthe prospectus carefully beforeyou invest or send money.
Annual ReportMarch 31, 2021
Related Documents


![GuideMark Funds GuidePath Funds · [Date] Dear Shareholder: Enclosed is the Semi-Annual Report for the GuideMark® and GuidePath®Funds covering the period from April 1, 2020 to September](https://static.cupdf.com/doc/110x72/60ac4ed3bf45d75f0f2a3658/guidemark-funds-guidepath-funds-date-dear-shareholder-enclosed-is-the-semi-annual.jpg)