BIOTA HYDROLOGY REGULATION UNITED NATIONS EDUCATIONAL, SCIENTIFICAND CULTURAL ORGANIZATION INTERNATIONAL HYDROLOGICAL PROGRAMME THE UNITED NATIONS ENVIRONMENT PROGRAMME INTERNATIONAL ENVIRONMENTAL TECHNOLOGY CENTRE Integrated Watershed Management - Ecohydrology & Phytotechnology - - Manual -

Welcome message from author
This document is posted to help you gain knowledge. Please leave a comment to let me know what you think about it! Share it to your friends and learn new things together.
Transcript
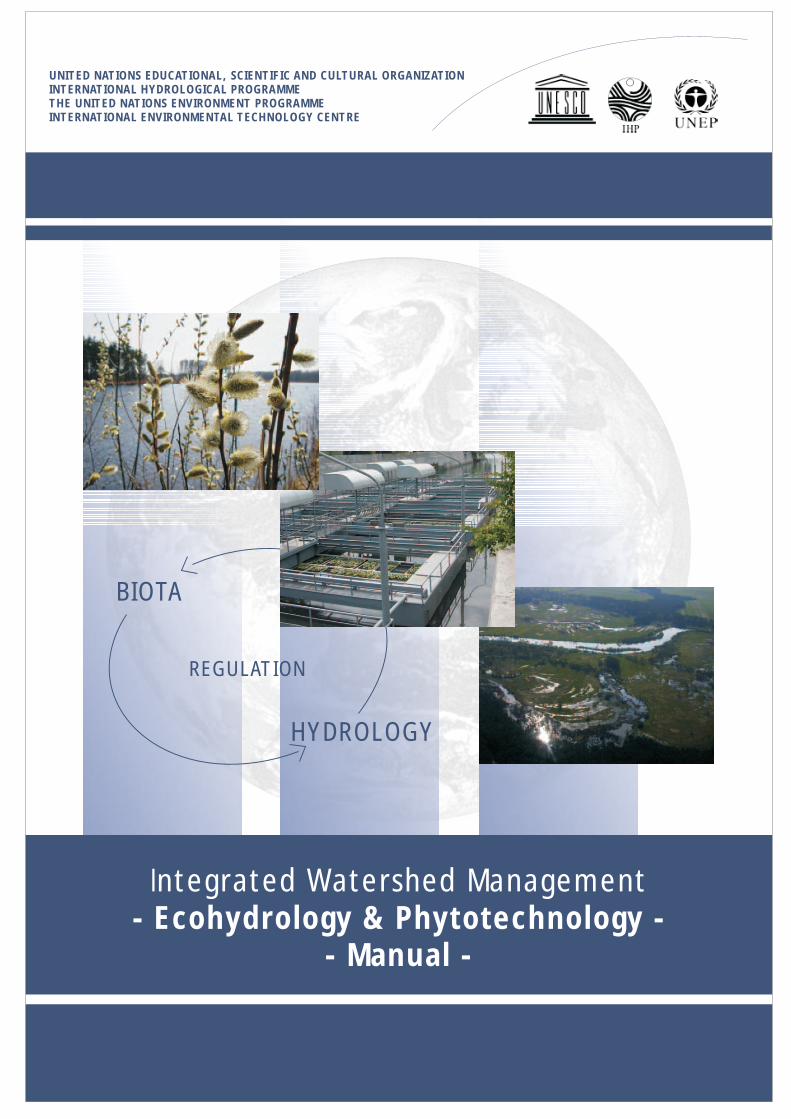
BIOTA
HYDROLOGY
REGULATION
UNITED NATIONS EDUCATIONAL, SCIENTIFIC AND CULTURAL ORGANIZATIONINTERNATIONAL HYDROLOGICAL PROGRAMMETHE UNITED NATIONS ENVIRONMENT PROGRAMMEINTERNATIONAL ENVIRONMENTAL TECHNOLOGY CENTRE
Integrated Watershed Management- Ecohydrology & Phytotechnology -
- Manual -
3
Integrated Watershed Management- Ecohydrology & Phytotechnology -
- Manual -
UNITED NATIONS ENVIRONMENT PROGRAMMEDIVISION OF TECHNOLOGY, IINDUSTRY AND ECONOMICS - INTERNATIONAL ENVIRONMENTAL TECHNOLOGY CENTRE
Email: [email protected]: http://www.unep.or.jp
Osaka Office2-110 Ryokuchi koen, Tsurumi-ku,
Osaka 538-0036 JapanTel: +81-6-6915-4581Fax: +81-6-6915-0304
Shiga Office1091 Oroshimo-cho, Kusatsu City,
Shiga 525-0001 JapanTel: +81-77-568-4581Fax: +81-77-568-4587
VwerySmatrBook03.p65 2004-06-18, 16:283

4
The photographs on the front cover page are (top to bottom): 1. Willows - used for water quality improvement andbioenergy production (Photo: Nyga); 2. Engineering device for purifying water using aquatic macrophytes - City ofRostov on Don, Russia (photo: Santiago-Fandino); 3. Pilica River floodplain, part of a UNESCO/UNEP DemonstrationProject (photo: Wagner-Lotkowska); 4. The Earth from space (photo: NASA).
The scheme on the back cover page is modified from Zalewski (2002). International Journal of Ecohydrology andHydrobiology. vol. 2, no 1-4. Proceedings of the final Conference of the First Phase of the IHP-V Project 2.3/2.4 onEcohydrology "The application of Ecohydrology to Water Resources Development and Management'. Venice, Italy 16-18 September 2001.
Design: Kamil ZakrzewskiTypesetting: Przemyslaw Nyga
UNEP’s Copyright
Copyright 2004 UNEP
This publication may be reproduced in whole or in part and in any form for educational or non-profit purposes withoutspecial permission from the copyright holder, provided acknowledgement of the source is made. UNEP would appre-ciate receiving a copy of any publication that uses this publication as a source.
No use of this publication may be made for resale or for any other commercial purpose whatsoever without priorpermission in writing from UNEP.
First edition 2004
The designations employed and the presentation of the material in this publication do not imply the expression of anyopinion whatsoever on the part of the United Nations Environment Programme concerning the legal status of anycountry, territory, city or area or of its authorities, or concerning delimitation of its frontiers or boundaries. More-over, the views expressed do not necessarily represent the decision or the stated policy of the United Nations Environ-ment Programme, nor does citing of trade names or commercial processes constitute endorsement.
UNITED NATIONS PUBLICATION
This publication is printed on paper made from 100 per cent recycled material.
VwerySmatrBook03.p65 2004-06-18, 16:284

5
UNESCO Regional Bureau for Science in EuropePalazzo Zorzi, Castello 4930
30122 Venice, Italy
The United Nations Environment ProgrammeInternational Environmental Technology Centre
2-110 Ryokuchi Koen, Tsurumi-ku, Osaka 538-00361091 Oroshimo-cho, Kusatsu-City, Shiga 525-0001, Japan
Centre for Ecohydrological StudiesUniversity of Lodz
12/16 Banacha Str., 90-237 Lodz, Poland
International Centre for EcologyPolish Academy of Sciences
Warsaw, Dziekanow Lesny, 1 Konopnickiej Str.05-092 Lomianki, Poland
Editors:Maciej Zalewski
(ICE-PAS)Iwona Wagner-Lotkowska
(CEHS-UL)
Assistant Editor:Richard D. Robarts
(UNEP-GEMS/Water)
Coordination & Supervision:Vicente Santiago-Fandino
(UNEP-IETC)Philippe Pypaert
(UNESCO-ROSTE)
UNESCO International Hydrological ProgrammeDivision of Water Sciences
1, rue Miollis 75732 Paris Cedex 15, France
VENICE OFFICE
VwerySmatrBook03.p65 2004-06-18, 16:285
6
The Manual is one of the results of the ongoing co-operation between the United Nations EnvironmentProgramme - Division of Technology, Industry and Economics - International Environmental Technology
Centre (UNEP-DTIE-IETC) and the United Nations Educational, Scientific, and Cultural Organization -International Hydrological Programme (UNESCO-IHP), represented by the Regional Bureau for Science in
Europe (UNESCO-ROSTE). A printed version has been separately produced by UNESCO IHP (ISBN: 92-9220-011-9, ISBN: 83-908410-8-8).
The Manual has been produced with the assistance and advice of the members of the Scientific Advisory Commit-
tee (SAC) of the Ecohydrology Initiative of UNESCO-IHP and in some cases with their direct participation.
The manual contains results of the first joint UNEP-IETC/UNESCO-IHP Ecohydrology & PhytotechnologyDemonstration Project „Application of Ecohydrology and Phytotechnology for Water Resources Manage-
ment and Sustainable Development”, on the Pilica River catchment in the Republic of Poland. This wasdeveloped and implemented by the International Centre for Ecology, Polish Academy of Sciences (ICE-
PAS) and Centre for Ecohydrological Studies, University of Lodz (CEHS UL).
This publication contains results of research supported by grants: European Commission projects: EC-EVK1-2001-00182 - acronym TOXIC; EC-EVK2-2002-00546 - acronym MIDI-CHIP; EVK1 -CT-2001-00094 –
acronym FAME; Polish Committee of Scientific Research grants: 6 PO4F 065 19, 3 PO4G 057 22, 6 PO4F 06719, 6 P04G 112 20.
The following experts contributed to the production of this manual:
Chapter 1: M. Zalewski, I. Wagner-LotkowskaChapter 2: M. Zalewski (A), V. Santiago-Fandino (B), I. Wagner-Lotkowska (A, B, C)
Chapter 3: I. Wagner-Lotkowska (A, C, D, G), A. Magnuszewski (A, C), Z. Kaczmarek (B),A. Trojanowska (D), K. Krauze (E), M. Lapinska (F), K. Izydorczyk,
A. Wojtal & P. Frankiewicz (H), L. Chicharo (I)Chapter 4: R. Kucharski, A. Sas-Nowosielska, M. Kuperberg (C), K. Krauze (B), J. Bocian (A)
Chapter 5: A. Zdanowicz (A), K. Krauze (B), I. Wagner-Lotkowska, J. Markowska & J. Markowski (C)Chapter 6: M. Lapinska (A, B), A. Trojanowska (C), M. Zalewski (B)
Chapter 7: A. Trojanowska (A), A. Bednarek (B), K. Izydorczyk (C), J. Mankiewicz, T. Jurczak,B. Romanowska-Duda, M. Tarczynska (D), A. Wojtal (E), P. Frankiewicz (F)
Chapter 8: A. Chicharo (A, B), L. Chicharo (C)Chapter 9: R. Kucharski, A. Sas-Nowosielska & M. Kuperberg (A), L. Ryszkowski, A. Kedziora (B, C)
Chapter 10: K. Krauze (B), I. Wagner-Lotkowska, E. Kiedrzynska, B. Sumorok (C), J. Bocian (A)Chapter 11: M. Lapinska (A, C), K. Krauze (B), Z. Kaczkowski (D)
Chapter 12: I. Wagner-Lotkowska, K. Izydorczyk, T. Jurczak & M. Tarczynska (A), P. Frankiewicz (B),S. E. Jorgensen (C, D)
Chapter 13: L. ChicharoChapter 14: A. T. Calcagno (A), Z. Kaczmarek (B)
Special thanks to Boguslawa Brewinska-Zaras and Marta Rogalewicz for their help in preparing the final
version of the manual.
ACKNOWLEDGMENTS
VwerySmatrBook03.p65 2004-06-18, 16:286
7
PREFACE
The World Summit on Sustainable Development (WSSD) held in Johannesburg, South Africa in 2002 andthe 3rd World Water Forum held in Kyoto, Japan in 2003 highlighted the importance of the UN Millennium
Declaration and the Millennium Development Goals. Both events emphasized the importance of elabora-ting strong science to support sustainable development policy.
Further, the International Council for Scientific Unions (ICSU) declared that in the twenty-first century
science „must become more problem-focused and apply an interdisciplinary approach to sustainabledevelopment issues in order for science to become more policy relevant”. Likewise, the UN World Com-
mission for Sustainable Development (CSD), besides supporting the development and application of soundscience towards sustainable development, also underscored the importance of developing and transfer-
ring environmentally sound technologies.
As the twenty-first century begins, it has been recognized that successfully managing water resources isan essential component of achieving sustainable development. However, due to the anthropogenic modi-
fication of the hydrological cycle by deforestation, urbanization and irrigation, water resources havebeen overexploited, degraded and wasted, resulting in higher risks to human health, economic and social
development as well as to the functioning of ecosystems and the preservation of the environment.
In light of this scenario, there is a need to develop a novel, environmental management approach withinthe context of Integrated Watershed Management (IWM). This is where ecohydrology as well as the
application of Environmentally Sound Technologies (ESTs) such as phytotechnology constitute a new di-mension.
The concept of ecohydrology and its scientific foundations were developed by UNESCO-IHP over the pastfew decades. The integration of the two components - hydrology and ecology - by means of regulating
hydrological, biotic and landscape interactions and processes, has contributed to improving ecosystems’resistance to stress. The concept of phytotechnology, developed by the UNEP-International Environmen-
tal Technology Center, encompasses a variety of environmental approaches and technologies based onthe ecosystem services that plants provide. The use of phytotechnologies, together with the develop-
ment of ecohydrology, can help prevent, control and even reverse the degradation of water resources.
Considering the complementarities of ecohydrology and phytotechnology and, taking into account thecalls for an interdisciplinary approach by the WSSD, the 3rd WWF and the ICSU, UNESCO-IHP, UNESCO-
Regional Bureau for Science in Europe (ROSTE) and UNEP-IETC merged their efforts through a number ofprojects and activities, including the present publication. The „Manual for Integrated Watershed Manage-
ment” follows on the „Guidelines for the Integrated Management of the Watershed”, published in 2002 bythe same agencies, in which the general philosophy of ecohydrology and phytotechnology was put toge-
ther for the first time, providing the reader an understanding of the concepts and their application to theintegrated management of watersheds.
Due to the great interest generated by the Guidelines, and in order to provide practitioners with practical
information about how to implement the concepts and approaches considered within ecohydrology andphytotechnology, the Scientific Advisory Committee of Ecohydrology IHP-VI and UNEP-IETC decided to
produce the present publication. The manual has been designed to improve decision makers’ identifica-
VwerySmatrBook03.p65 2004-06-18, 16:287

8
Steve Halls
DirectorUNEP-IETC
Andras Szöllösi-Nagy
DirectorDivision of Water Sciences, UNESCO
Secretaryof the UNESCO IHP
tion capabilities and understanding of mechanisms used to solve problems related to water resourcedegradation within watersheds. It is also expected that a larger audience would benefit from the present
publication (i.e., technical experts, scientists, NGOs and others interested in water resource manage-ment.)
Bearing in mind once again that one of the major questions in achieving sustainable development is
„whether scientific evidence can successfully overcome social, economic and political resistance” (Ken-nedy, Science 2003), we sincerely hope that the new approaches of ecohydrology and phytotechnology,
developed in IHP-V and VI and supported by UNEP-IETC, will generate positive socioeconomic benefits forthose living in watersheds in addition to improving the water resources quality.
VwerySmatrBook03.p65 2004-06-18, 16:288
9
AcknowledgmentsPrefaceTable of contents
PART ONE: INTRODUCTION1. About this Manual
1.A. What is the goal of this manual?1.B. Why is this manual needed?
1.C. What is covered by this manual?1.D. Who should use this manual?
2. What are Ecohydrology & Phytotechnology?2.A. What is ecohydrology?
2.B. What is phytotechnology?2.C. Application of ecohydrology and phytotechnology for water resources management and
sustainable development. UNESCO/UNEP Demonstration Project3. Basic Concepts & Definitions
3.A. Watershed3.B. Climate
3.C. Hydrological cycle3.D. Biogeochemical cycles
3.E. Landscape structure and vegetation cover3.F. Streams and rivers
3.G. Lakes and reservoirs3.H. Freshwater Biota3.I. Estuarine and coastal areas
PART TWO: SURVEYS & ASSESSMENT: How to Assess & Quantify Specific Issues in Watersheds4. LANDSCAPES: Defining Critical Areas in Watersheds
4.A. How urbanization and industries influence water quality
4.B. How to assess landscape impacts on water quality4.C. How to assess soil contamination
5. LAND-WATER INTERACTIONS: How to Assess their Effectiveness5.A. Can ground water influence surface water quality
5.B. How to assess the efficiency of ecotones in nutrient removal5.C. How to estimate effects of riparian areas and floodplains on water quality and quantity
6. STREAMS & RIVERS: Defining their Quality & Absorbing Capacity6.A. Bioassays – A tool to measure ecosystem quality
6.B. Fish communities – indicators of riverine degradation6.C. Bacteria, fungi and microbial processes
7. LAKES & RESERVOIRS: Defining their Ecosystem Status7.A. What happens to phosphorus in a water body: Sedimentation
7.B. What happens to nitrogen in a water body: Denitrification7.C. How to assess phytoplankton biomass?
7.D. Why are cyanobacterial blooms harmful7.E. Assessment of zooplankton communities
7.F. Assessment of fish communities
TABLE OF CONTENTS
67
9
1314
1516
17
21
25
3031
3233
3435
363740
45
4956
61
6671
75
7990
97
101106
110116
121
VwerySmatrBook03.p65 2004-06-18, 16:279

10
8. ESTUARINE & COASTAL AREAS: How & What to Measure8.A. Water Chemistry
8.B. Water Circulation8.C. Structure of Biota
PART THREE: MANAGEMENT: How to Prevent Degradation & Restore Watersheds9. LANDSCAPE MANAGEMENT: Regulating Pollution Exports & Hydrological Cycles
9.A. Phytoremediation of soils
9.B. How to manage water cycles in watersheds9.C. Control of diffuse pollutant inputs to water bodies
10. LAND-WATER INTERACTIONS: Reduction of Contamination Transport10.A. Constructed wetlands: How to combine sewage treatment with phytotechnology
10.B. Ecotones: How to diminish nutrient transport from landscapes10.C. Floodplains and natural wetlands: Reduction of nutrient transport
11. MANAGEMENT OF STREAMS & RIVERS: How to Enhance Absorbing Capacityagainst Human Impacts11.A. Restoration of physical structure in a river11.B. Restoration of vegetation: Increasing nutrient retention capacity and self-purification ability
11.C. Management of shoreline and riverbed structure: Increasing fish yields11.D. Ecohydrological approach in pond aquaculture
12. RESERVOIR & LAKE MANAGEMENT: Improvement of Water Quality12.A. Ecohydrological methods of algal bloom control
12.B. How to manage biotic structure in a reservoir12.C. Harvesting macrophytes and macroalgae12.D. Other methods of water quality improvement
13. ESTUARINE & COASTAL AREAS: How to prevent degradation and restore14. OTHER ASPECTS OF WATERSHED MANAGEMENT
14.A. Socio-economic aspects of ecohydrology & phytotechnology applications in integrated water-shed management (IWM)
14.B. Can global climate change affect management outcomes?
APPENDIXAppendix
Glossary of TermsReferences
Contributing Authors
124
128131
139
144150
154
158163
169175
180184
188
194197199
202
209
212
219
226231
246
VwerySmatrBook03.p65 2004-06-18, 16:2710

11
VwerySmatrBook03.p65 2004-06-17, 17:1811

12
VwerySmatrBook03.p65 2004-06-17, 17:1812
13
1.A. What is the goal of this ManualIntroduction: About this M
anual
ECOHYDROLOGY & PHYTOTECHNOLOGYPROGRAMMESThe concept of ecohydrology and its scientific fo-undations were developed by International Hydro-
logical Programme (IHP) of UNESCO. According toecohydrology, through the manipulation of biota
and hydrology interactions in a landscape, thepossibility of augmenting ecosystems resilience to
anthropogenic changes can be achieved.Phytotechnology, on the other hand, as the use of
vegetation and its natural services for environmen-tal quality improvement, is being developed by
the UNEP International Environmental TechnologyCentre (UNEP - IETC). This can complement eco-
hydrology through, for example, development oftechniques of vegetation use to reducing erosion
of shorelines, preserving and restoring soils andlandscapes, controlling and preventing pollution,
as well as restoring habitats.
ECOHYDROLOGY & PHYTOTECHNOLOGYGUIDELINES FOR IWMThe complementarities of ecohydrology and phy-totechnology, together with the similar interestsin water resources management of UNEP-IETC,
UNESCO-IHP and UNESCO-Regional Bureau forScience in Europe (ROSTE), led to a joint project
that produced the „Guidelines for the IntegratedManagement of the Watershed”. The Guidelines
provided a strong scientific basis for the conceptsof ecohydrology and phytotechnology as well as a
theoretical background for their application in In-tegrated Watershed Management (IWM). They pre-
sented ecohydrological approach to understandingof processes regulating dynamics of water basins, as
well as the mechanisms for increasing absorbing capa-city of ecosystems against human impacts.
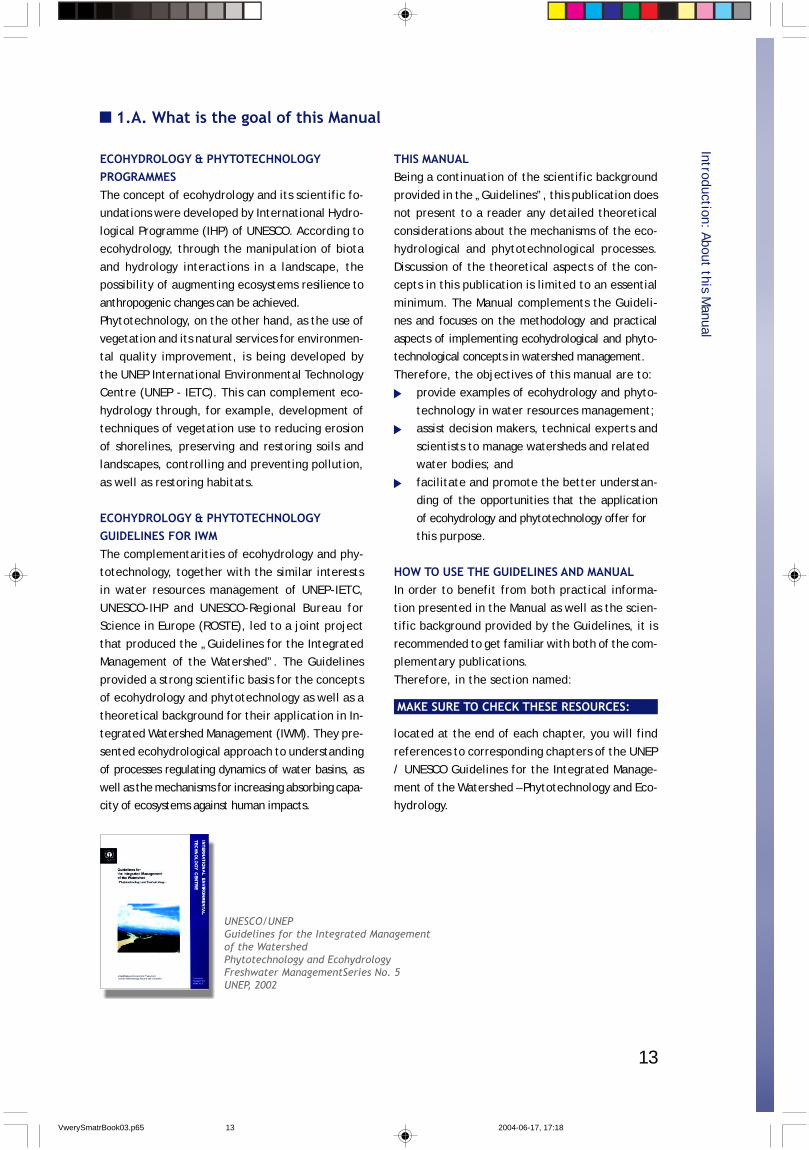
THIS MANUALBeing a continuation of the scientific background
provided in the „Guidelines”, this publication doesnot present to a reader any detailed theoretical
considerations about the mechanisms of the eco-hydrological and phytotechnological processes.
Discussion of the theoretical aspects of the con-cepts in this publication is limited to an essential
minimum. The Manual complements the Guideli-nes and focuses on the methodology and practical
aspects of implementing ecohydrological and phyto-technological concepts in watershed management.
Therefore, the objectives of this manual are to:provide examples of ecohydrology and phyto-
technology in water resources management;assist decision makers, technical experts and
scientists to manage watersheds and relatedwater bodies; and
facilitate and promote the better understan-ding of the opportunities that the application
of ecohydrology and phytotechnology offer forthis purpose.
HOW TO USE THE GUIDELINES AND MANUALIn order to benefit from both practical informa-
tion presented in the Manual as well as the scien-tific background provided by the Guidelines, it is
recommended to get familiar with both of the com-plementary publications.
Therefore, in the section named:
located at the end of each chapter, you will find
references to corresponding chapters of the UNEP/ UNESCO Guidelines for the Integrated Manage-
ment of the Watershed – Phytotechnology and Eco-hydrology.
UNESCO/UNEPGuidelines for the Integrated Managementof the WatershedPhytotechnology and EcohydrologyFreshwater ManagementSeries No. 5UNEP, 2002
MAKE SURE TO CHECK THESE RESOURCES:
VwerySmatrBook03.p65 2004-06-17, 17:1813
14
Introduction: About this Manual
1.B. WHY IS THIS MANUAL NEEDED?
FRESHWATER DEGRADATION IS MUCH MORE THANJUST POLLUTIONAt the beginning of the 21st century, the incre-asing human population has become a major fac-
tor in progressive environmental degradation onthe global scale. Although the traditional percep-
tion of freshwater degradation has been usuallylinked to pollution, increasing human activities in
a catchment have more profound effects on envi-ronmental quality. Most river basins in the world
have been dramatically modified due to unsusta-inable development of agriculture, grazing, defo-
restation, and urbanization. These disturbanceshave been changing local and regional climates,
hydrological cycles as well as evolutionary esta-blished biogeochemical cycles in a catchment.
Therefore, it became evident that the degrada-tion of river ecosystems has been of a two-dimen-
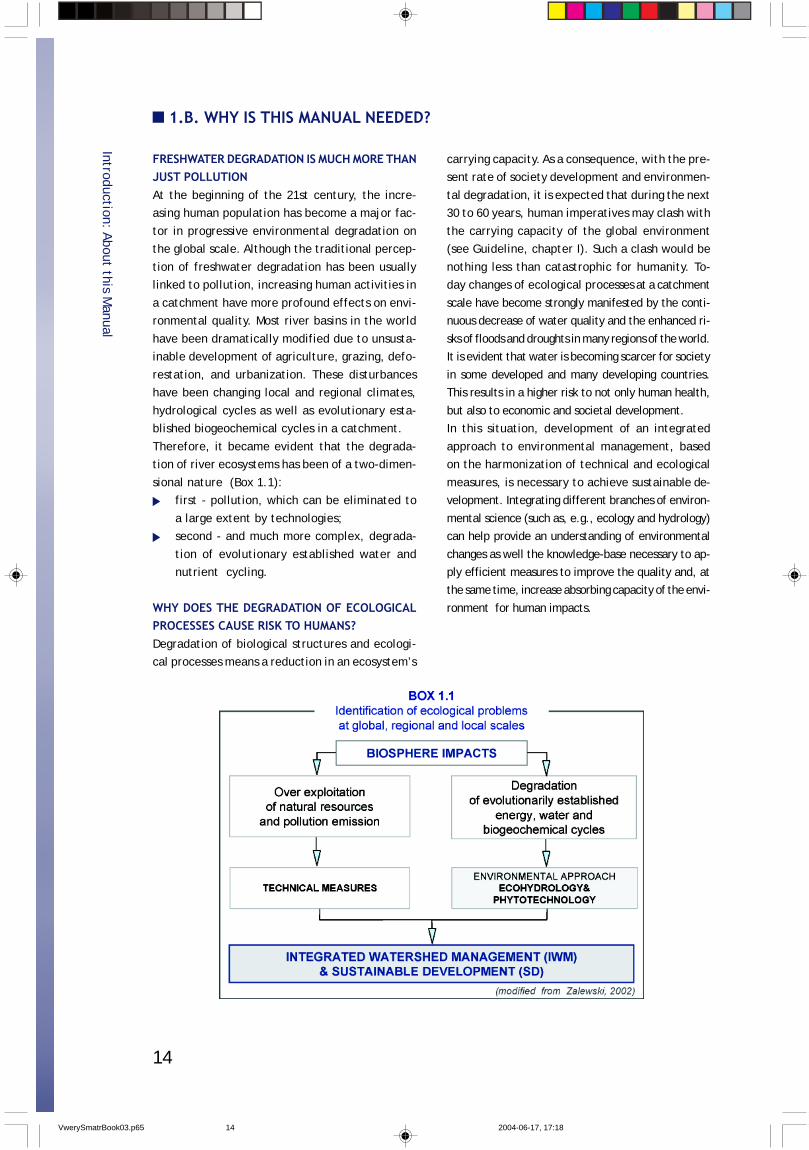
sional nature (Box 1.1):first - pollution, which can be eliminated to
a large extent by technologies;second - and much more complex, degrada-
tion of evolutionary established water andnutrient cycling.
WHY DOES THE DEGRADATION OF ECOLOGICALPROCESSES CAUSE RISK TO HUMANS?Degradation of biological structures and ecologi-cal processes means a reduction in an ecosystem’s
carrying capacity. As a consequence, with the pre-sent rate of society development and environmen-
tal degradation, it is expected that during the next30 to 60 years, human imperatives may clash with
the carrying capacity of the global environment(see Guideline, chapter I). Such a clash would be
nothing less than catastrophic for humanity. To-day changes of ecological processes at a catchment
scale have become strongly manifested by the conti-nuous decrease of water quality and the enhanced ri-
sks of floods and droughts in many regions of the world.It is evident that water is becoming scarcer for society
in some developed and many developing countries.This results in a higher risk to not only human health,
but also to economic and societal development.In this situation, development of an integrated
approach to environmental management, basedon the harmonization of technical and ecological
measures, is necessary to achieve sustainable de-velopment. Integrating different branches of environ-
mental science (such as, e.g., ecology and hydrology)can help provide an understanding of environmental
changes as well the knowledge-base necessary to ap-ply efficient measures to improve the quality and, atthe same time, increase absorbing capacity of the envi-
ronment for human impacts.
VwerySmatrBook03.p65 2004-06-17, 17:1814
15
Introduction: About this Manual
1.C. WHAT IS COVERED BY THIS MANUAL?
This manual provides a new approach based onapplication of across disciplines knowledge in ho-
listic management of water resources. It encoura-ges a reader to have a broader, interdisciplinary
view on various aspects of IWM, with special em-phasis on practical use of understanding relation-
ships between hydrology and biota and their usein order to control environment quality.
According to the presented approach, for susta-inable management of water resources quality and
stabilization of hydrological cycle, it is necessaryto harmonize technological and ecological measu-
res. Ecological measures should be based on un-derstanding of biota-water interplay in various scales
of a catchment. Therefore, the manual has been orga-nized hierarchically, in order to easily identify the ne-
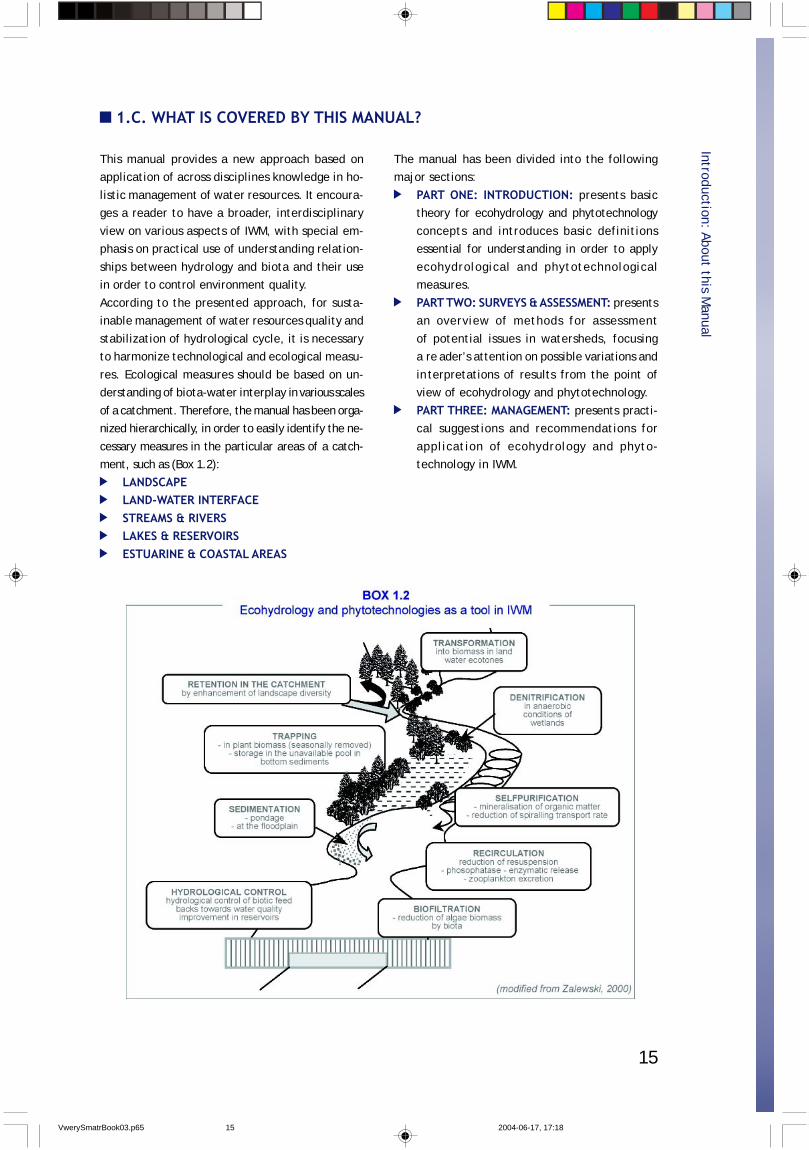
cessary measures in the particular areas of a catch-ment, such as (Box 1.2):
LANDSCAPELAND-WATER INTERFACESTREAMS & RIVERSLAKES & RESERVOIRSESTUARINE & COASTAL AREAS
The manual has been divided into the followingmajor sections:
PART ONE: INTRODUCTION: presents basictheory for ecohydrology and phytotechnology
concepts and introduces basic definitionsessential for understanding in order to apply
ecohydrological and phytotechnologicalmeasures.
PART TWO: SURVEYS & ASSESSMENT: presentsan overview of methods for assessment
of potential issues in watersheds, focusinga re ader’s attention on possible variations and
interpretations of results from the point ofview of ecohydrology and phytotechnology.
PART THREE: MANAGEMENT: presents practi-cal suggestions and recommendations for
application of ecohydrology and phyto-technology in IWM.
VwerySmatrBook03.p65 2004-06-17, 17:1815
16
1.D. WHO SHOULD USE THIS MANUAL?
Introduction: About this Manual
Anyone who is involved in Integrated WatershedManagement (IWM) should find this manual of
interest. In particular, those who deal withimprovement of degraded aquatic and terrestrial
environments, as well as those interested insustainable management and maintaining good
quality water recourses, will find this manualuseful.
In the traditional approach to water resourcesmanagement, hydrotechnical engineers have
usually been the major target group. Although theystill play a fundamental role as those who
eliminate threats, such as for example, pointsources of pollution, it has become obvious that
to achieve high-quality results with environmentalissues, the technical approach alone is not enough.
This manual encourages and provides anunderstanding of the need for a broader view on
catchment management. This involves the
application of new strategies that amplify theopportunities provided by an understanding of
ecosystem properties in order to enhance theircarrying capacity against increasing human
impacts.Successful implementation of any strategy in IWM
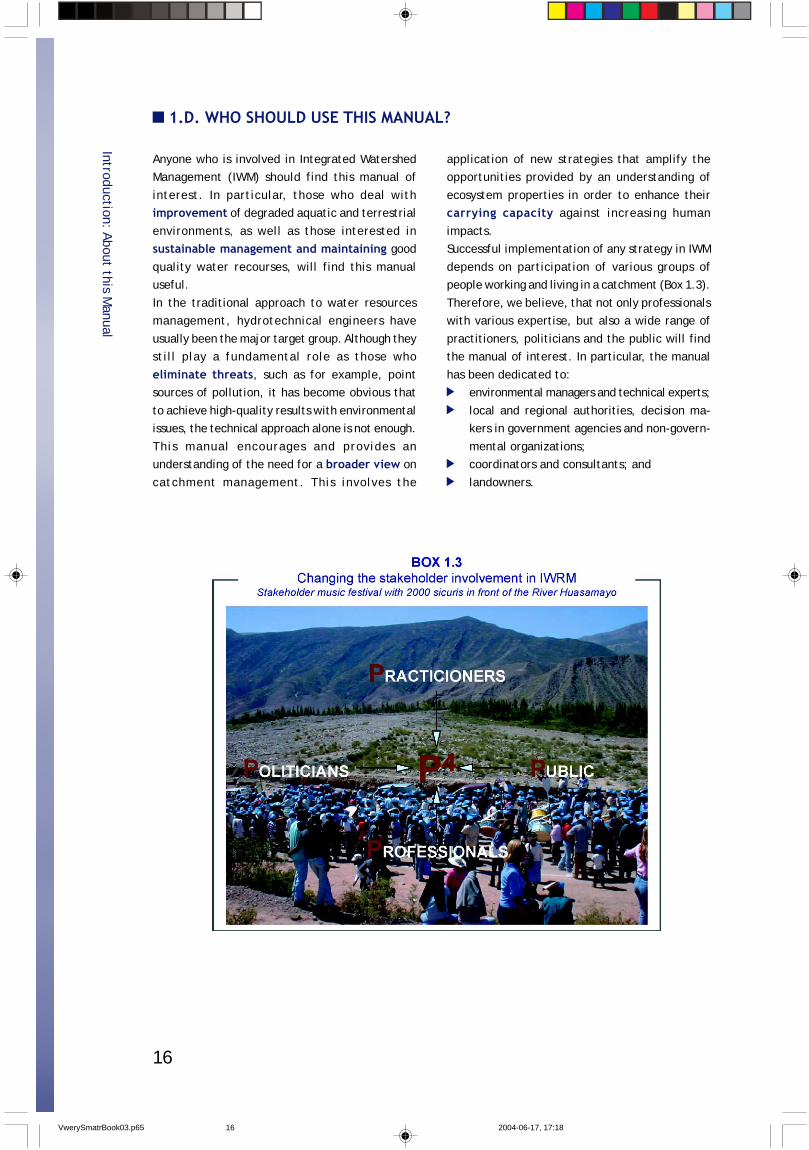
depends on participation of various groups ofpeople working and living in a catchment (Box 1.3).
Therefore, we believe, that not only professionalswith various expertise, but also a wide range of
practitioners, politicians and the public will findthe manual of interest. In particular, the manual
has been dedicated to:environmental managers and technical experts;
local and regional authorities, decision ma-kers in government agencies and non-govern-
mental organizations;coordinators and consultants; and
landowners.
VwerySmatrBook03.p65 2004-06-17, 17:1816
17
2.A. WHAT IS ECOHYDROLOGY?Introduction: Ecohydrology &
Phytotechnology
INTEGRATION OF SCIENCES...According to the strategy defined by ICSU, scien-
ce in the 21st century should actively participatein creating a vision, strategy and implementation
methodology essential to the support of sustaina-ble development. The approach that accelerates
the above actions should be based on the integra-tion of various interdisciplinary and transdiscipli-
nary fields of science. The developmental condi-tions required for comprehensive, integrative and
interdisciplinary scientific research is „maturity”of the empirical disciplines that participate in the
integration process.The progress that took place in ecological scien-
ces in the last years of the 20th century, allowedfor major advancements of knowledge. A level was
attained that permitted an attempt to integrateecological sciences with the more advanced scien-
tific fields to great extend expresses by phisicsand mathematics hydrology. This integration cre-
ated a platform for the development of a new di-scipline (Zalewski et al., 1997; Zalewski, 2000).
Ecohydrology (EH), has been formulated and de-veloped within the framework of UNESCO’s Inter-national Hydrological Programme, IHP -V.
DEFINING ECOHYDROLOGY...The basis for the development and advancementof interdisciplinary science and related research
should be the defining of a new scope and formu-lation of new key questions to be answered (Key-
fitz, 1993). In the course of the genesis of ecohy-drology, it was assumed that the questions should
meet the two following fundamental conditions:1. They should be related to the dynamics of two
entities in such a way that the answer withoutconsideration of one of the two components
(both ways E <-> H) would be impossible. Inother words, this question should enable the
defining of relationships between hydrologi-cal and biological processes in order to obtain
comprehensive empirical data at the samespatial and temporal scales.
2. The results of the empirical analysis shouldtest the whole range of processes (from a
molecular to catchment scale), should ena-ble their spatial/temporal integration and
should be convertible to large-scale mana-gement measures in order to enable further
testing of the hypotheses.Taking into account the above conditions, the key
questions for ecohydrology have been defined ba-sed on an in-depth understanding of the interplay
between biological and hydrological processes andthe factors that regulate and shape them. The
hypotheses have been defined in the form of thefollowing questions:
Hypothesis H1: „The regulation of hydrologicalparameters in an ecosystem or catchment can be
applied for controlling biological processes”.Hypothesis H2: „The shaping of the biological
structure of an ecosystem(s) in a catchment canbe applied to regulating hydrological processes”.
Hypothesis H3: „Both types of regulation (H2 andH3) integrated at a catchment scale and in a sy-
nergistic way can be applied to the sustainabledevelopment of freshwater resources, measuredas the improvement of water quality and quantity
(providing of ecosystem services)”(Zalewski, 2000).It should be stressed that according to the ecohy-
drology concept, the overall goal defined in theabove hypotheses is the sustainable management
of water resources. This should be focused on theenhancement of ecosystem carrying capacity aga-
inst anthropogenic stresses.
WHAT IS ECOHYDROLOGY?Ecohydrology is a scientific concept applied to
environmental problem-solving (Zalewski et al.,1997). It quantifies and explains the relationships
between hydrological processes and biotic dyna-mics at a catchment scale.
The concept is based upon the assumptionthat sustainable development of water re-sources is dependent on the ability to re-store and maintain evolutionarily establi-shed processes of water and nutrient circu-lation and energy flows at the basin scale.
VwerySmatrBook03.p65 2004-06-17, 17:1817
18
This depends on an in-depth understanding of awhole range of processes involved that have a
two-dimensional character:temporal: spanning a time frame from the past
to the present with due consideration offuture global change scenarios; and
spatial: understanding the dynamic role ofaquatic and terrestrial biota over a range of
scales from the molecular- to the basin-scale.Both dimensions should serve as a reference sys-
tem for enhancing the buffering capacity of eco-systems against human impacts by using ecosys-
tem properties as a management tool. This, in turn,depends on the development, dissemination, and
implementation of interdisciplinary principles andknowledge based on recent advances in environ-
mental science.
ECOHYDROLOGY KEY ASSUMPTIONSAND PRINCIPLESUp to the time when the ecohydrology conceptwas defined, hydrologists considered aquatic bio-
ta mostly as an indicative system for monitoringwhile hydrobiologists considered hydrological pro-cesses as a disturbance factor.
The ecohydrology paradigm, which is based onfunctional relationships between hydrology and
biota (Zalewski et al. 1997, Zalewski 2000; 2002),can be expressed in three key assumptions.
Key assumptions of EHREGULATION of hydrology by shaping biotaand, vice versa, regulation of biota by alte-
ring hydrology.INTEGRATION - at the basin scale various
types of regulations (E <-> H) act in a synergi-stic way to improve and stabilize the quality
of water resources.HARMONIZATION of ecohydrological measu-
res with necessary hydrotechnical solutions(e.g., dams, sewage treatment plants, levees at
urbanized areas, etc.)Following these assumptions the concept of eco-
hydrology is based on three principles.
Principles1. FRAMEWORK - Integration of the catchment,
water and its biota into one entity, including:Scale - the mesoscale cycle of water cir-
culation within a basin is a template forthe quantification of ecological processes;
Dynamics - water and temperature arethe driving forces for both terrestrial and
freshwater ecosystems;Hierarchy of factors - abiotic (e.g., hy-
drological) processes are dominant inregulating ecosystem functioning. Biotic
interactions may manifest themselves whenabiotic factors are stable and pre-dictable.
2. TARGET - Understanding evolutionarily esta-blished ecohydrological processes is crucial
for a proactive approach to the sustainablemanagement of freshwater resources.
It assumes that it is not enough to simplyprotect ecosystems but, in the face of
increasing global changes (such as increasingpopulation, energy consumption, global
climate change), it is necessary to increasethe carrying capacity of ecosystems, andtheir resistance and resilience, to absorbhuman-induced impacts.
3 METHODOLOGY - ecohydrology uses ecosys-
tem properties as a management tool. It isapplied by using biota to control hydrological
processes and, vice versa, by using hydrologyto regulate biota. Scientific basis for the
methodological aspect of using biota for wa-ter quality improvement has been seriously
advanced by ecological engineering (e.g.,Mitsch & Jorgensen, 2004).
Technical approach is not enough...The importance of the effort to develop the eco-hydrology approach increased with the publica-
tion of the paper by Meybeck (2003) in which hejustifies the name of Anthropocene for the pre-
sent era. Based on an in-depth analysis of publi-shed studies, he demonstrated that the modifica-
tion of aquatic systems by human pressures (e.g.,flood regulation, fragmentation, sedimentation im-
balance, salinization, contamination, eutrophica-tion, etc.) has increased to a level that no longer
Introduction: Ecohydrology & Phytotechnology
VwerySmatrBook03.p65 2004-06-17, 17:1818
19
can be considered as being controlled by only na-tural processes (climate, relief, vegetation, lim-
nology), thus defining a new era that we have al-ready entered.
The decline in water quality and biodiversity, ob-served at the global scale in both developed and
developing countries, has provided evidence thatthe traditional „mechanistic” approach focused on
elimination of threats, such as point source pol-lution and flood control, is crucial but not suffi-
cient. This is because purely technical control, wi-thout understanding and considering biotic dyna-
mics, constitutes a more trial and error approachto water management than the imple-mentation
of a policy toward sustainable water use. Whileelements of this approach remain valid and via-
ble, a technical solution alone is clearly insuffi-cient for the sustainable use of the world’s water
resources. To guarantee the sustainability of fre-shwater resource use, it is necessary not only to
reduce or eliminate the discharge of pollutants,but also to extend the number of potential tools
to manage the degradation of ecological proces-ses in landscapes. Such a more efficient approachmust be based on an understanding of the tempo-
ral and spatial patterns of catchment scale waterdynamics.
ECOHYDROLOGY - CREATING OPPORTUNITIESHuman survival and the preservation of biodiver-
sity on Earth are dependent on our ability to ma-intain the integrity of ecological processes. The-
refore, one of the fundamental tenets for the su-stainable development of water resources is the
main-tenance of a homeostatic equilibrium withinan ecosystem.
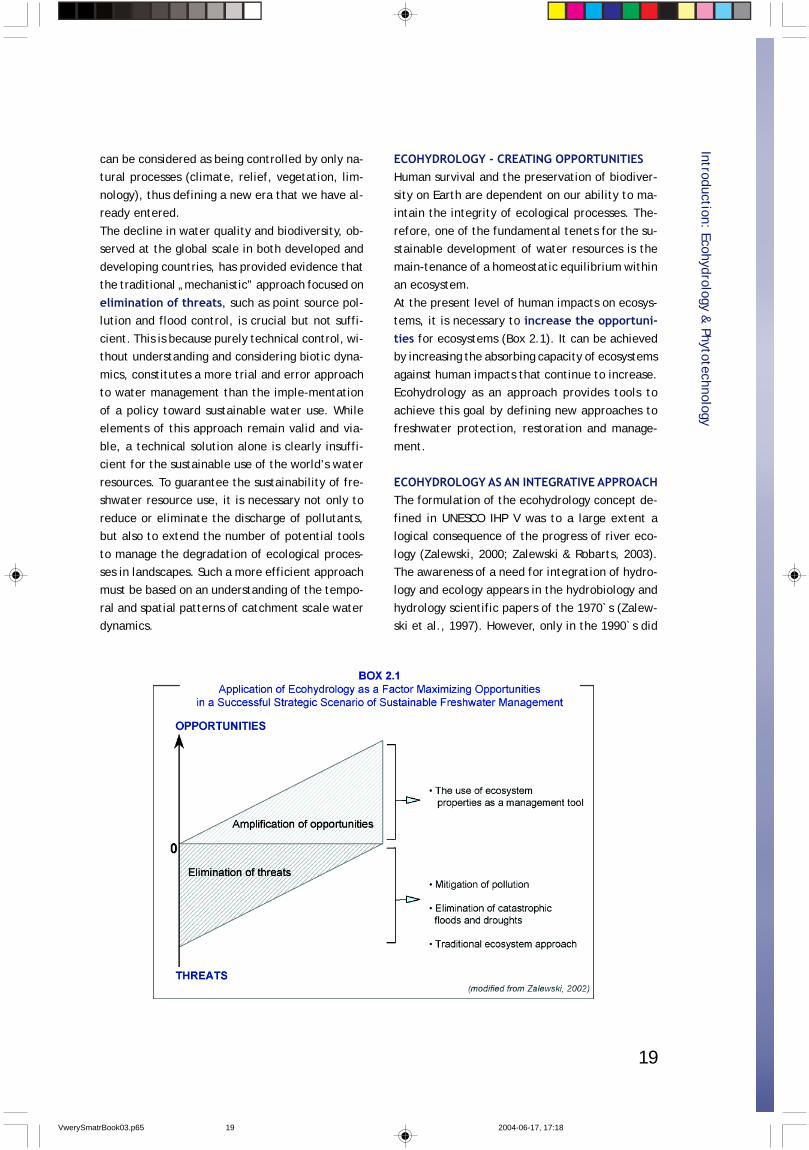
At the present level of human impacts on ecosys-tems, it is necessary to increase the opportuni-ties for ecosystems (Box 2.1). It can be achievedby increasing the absorbing capacity of ecosystems
against human impacts that continue to increase.Ecohydrology as an approach provides tools to
achieve this goal by defining new approaches tofreshwater protection, restoration and manage-
ment.
ECOHYDROLOGY AS AN INTEGRATIVE APPROACHThe formulation of the ecohydrology concept de-
fined in UNESCO IHP V was to a large extent alogical consequence of the progress of river eco-
logy (Zalewski, 2000; Zalewski & Robarts, 2003).The awareness of a need for integration of hydro-logy and ecology appears in the hydrobiology and
hydrology scientific papers of the 1970`s (Zalew-ski et al., 1997). However, only in the 1990`s did
Introduction: Ecohydrology & Phytotechnology
VwerySmatrBook03.p65 2004-06-17, 17:1819
20
independent research directed to the interactionsbetween the hydrosphere and biosphere become
a subject of research for scientists in various fields.This created a basis for the holistic approach to
understanding interactions between ecological andhydrological processes at a catchment scale and
directed at the development of practical appro-aches for sustainable watershed management (Box
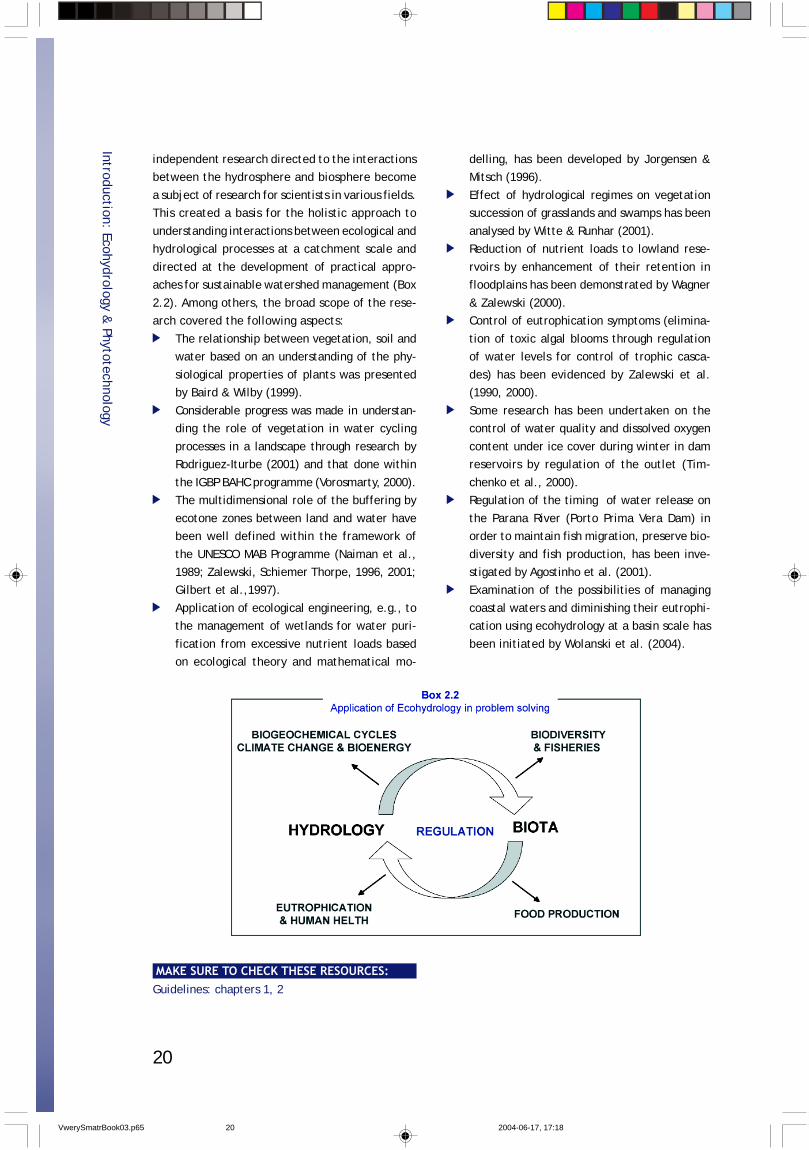
2.2). Among others, the broad scope of the rese-arch covered the following aspects:
The relationship between vegetation, soil andwater based on an understanding of the phy-
siological properties of plants was presentedby Baird & Wilby (1999).
Considerable progress was made in understan-ding the role of vegetation in water cycling
processes in a landscape through research byRodriguez-Iturbe (2001) and that done within
the IGBP BAHC programme (Vorosmarty, 2000).The multidimensional role of the buffering by
ecotone zones between land and water havebeen well defined within the framework of
the UNESCO MAB Programme (Naiman et al.,1989; Zalewski, Schiemer Thorpe, 1996, 2001;Gilbert et al.,1997).
Application of ecological engineering, e.g., tothe management of wetlands for water puri-
fication from excessive nutrient loads basedon ecological theory and mathematical mo-
delling, has been developed by Jorgensen &Mitsch (1996).
Effect of hydrological regimes on vegetationsuccession of grasslands and swamps has been
analysed by Witte & Runhar (2001).Reduction of nutrient loads to lowland rese-
rvoirs by enhancement of their retention infloodplains has been demonstrated by Wagner
& Zalewski (2000).Control of eutrophication symptoms (elimina-
tion of toxic algal blooms through regulationof water levels for control of trophic casca-
des) has been evidenced by Zalewski et al.(1990, 2000).
Some research has been undertaken on thecontrol of water quality and dissolved oxygen
content under ice cover during winter in damreservoirs by regulation of the outlet (Tim-
chenko et al., 2000).Regulation of the timing of water release on
the Parana River (Porto Prima Vera Dam) inorder to maintain fish migration, preserve bio-
diversity and fish production, has been inve-stigated by Agostinho et al. (2001).Examination of the possibilities of managing
coastal waters and diminishing their eutrophi-cation using ecohydrology at a basin scale has
been initiated by Wolanski et al. (2004).
Introduction: Ecohydrology & Phytotechnology
MAKE SURE TO CHECK THESE RESOURCES:Guidelines: chapters 1, 2
VwerySmatrBook03.p65 2004-06-17, 17:1820
21
Introduction: Ecohydrology & Phytotechnology
2.B. WHAT IS PHYTOTECHNOLOGY?
WHAT IS PHYTOTECHNOLOGY?In general, the term phytotechnology describes
the application of science and engineering to exa-mine problems and provide solutions involving
plants. The term itself is helpful in promoting abroader understanding of the importance of plants
and their beneficial role within both societal andnatural systems. A central component of this con-
cept is the use of plants as living environmental-ly sound technologies (ESTs) that provide servi-
ces in addressing environmental issues. In the con-text of this manual phytotechnologies are related
to environmental problems and the provision ofsolutions within Integrated Watershed Manage-
ment.Phytotechnological applications employ ecologi-cal engineering (Mitsch & Jorgensen, 2004) prin-ciples and are considered to be ecotechnologies.
Ecotechnologies are dependent on the self-regu-lating capabilities of ecosystems and nature. The
focus on, and use of, biological species, commu-nities, and ecosystems distinguishes ecotechnolo-
gies from more conventional engineering-techno-logical approaches, which seldom consider inte-grative ecosystem-based approaches (UNEP, 2003).
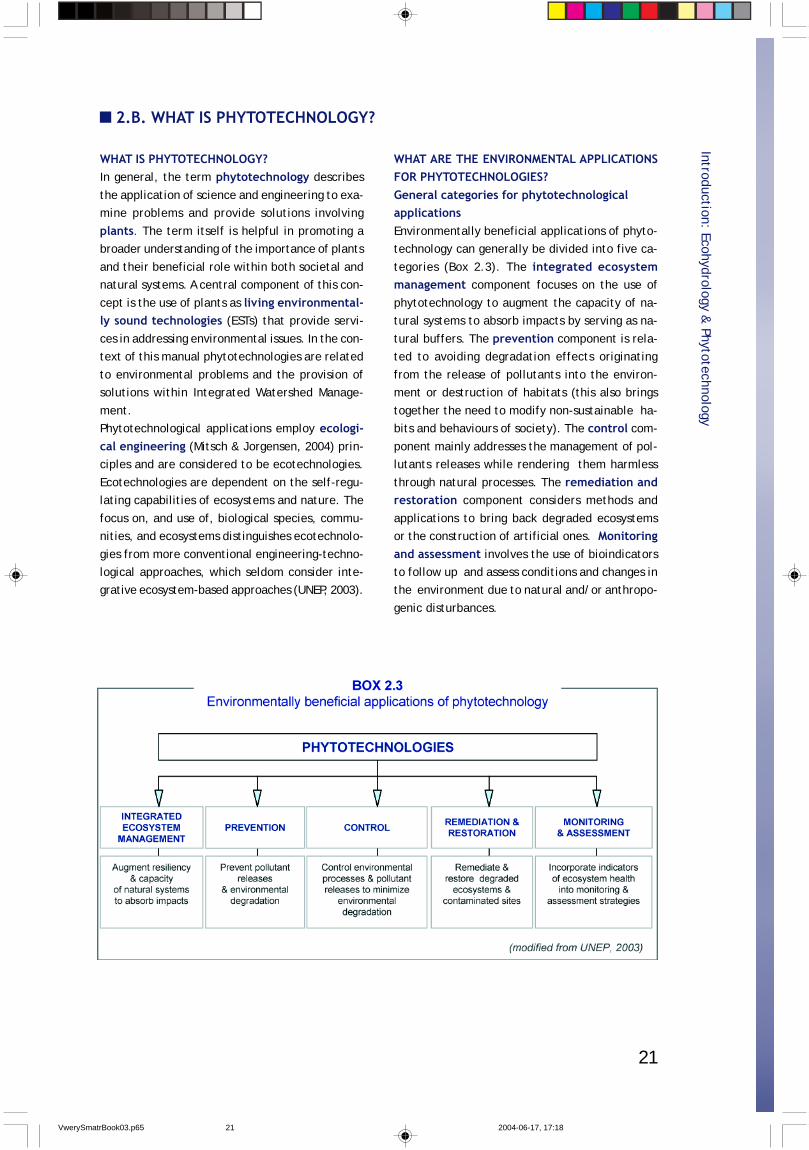
WHAT ARE THE ENVIRONMENTAL APPLICATIONSFOR PHYTOTECHNOLOGIES?General categories for phytotechnologicalapplicationsEnvironmentally beneficial applications of phyto-technology can generally be divided into five ca-
tegories (Box 2.3). The integrated ecosystemmanagement component focuses on the use of
phytotechnology to augment the capacity of na-tural systems to absorb impacts by serving as na-
tural buffers. The prevention component is rela-ted to avoiding degradation effects originating
from the release of pollutants into the environ-ment or destruction of habitats (this also brings
together the need to modify non-sustainable ha-bits and behaviours of society). The control com-
ponent mainly addresses the management of pol-lutants releases while rendering them harmless
through natural processes. The remediation andrestoration component considers methods and
applications to bring back degraded ecosystemsor the construction of artificial ones. Monitoringand assessment involves the use of bioindicatorsto follow up and assess conditions and changes inthe environment due to natural and/or anthropo-
genic disturbances.
VwerySmatrBook03.p65 2004-06-17, 17:1821
22
Introduction: Ecohydrology & Phytotechnology
Benefits of the applications of phytotechnologiesTheir application may increase the functioning of
ecological systems and hence the value of naturalcapital and natural services provided by ecosys-
tems as a whole. The term „ecosystem services”or „natural services” refers to the conditions and
processes through which natural ecosystems su-stain and fulfill human life (Daily, 1977). These
services are the result of complex natural cyclesdriven by solar energy, influencing the functioning
of the biosphere in a number of different ways.Ecosystem services maintaining biodiversity and
the production of ecosystem goods, such as food,timber, energy and natural fiber, as well as many
pharmaceuticals, industrial products, and theirprecursors. The harvest and trade of these goods
is based on „natural capital” and hence are animportant part of the global economy. In addition,
ecological services include life support functions,such as protecting watersheds, reducing erosion,
providing habitats for wild species, as well as thecleaning, recycling, and renewal of systems.
Plants are a fundamental part of the world’s na-tural capital base due to the services they provi-de. The value of natural capital is increased by
augmenting the capacity of ecological systems tofunction effectively. Some examples of the bene-
fits of ecological services are:purification of air and water;
mitigation of floods and droughts;detoxification and decomposition of wastes;
generation and renewal of soil and soil fer-tility;
translocation of nutrients;pest control;
biomass production from simple elementsthrough photosynthesis, and
moderation of temperature, wind forceand wave action.
Examples of phytotechnological applicationsPhytotechnology can be applied for solving seve-ral ecological problems by the direct use of plants
for in situ (or „in place”) removal or degradationof contaminants or improving the physical struc-
ture of an ecosystem and hence it’s functioning.Phytotechnology covers a variety of low cost, so-
lar energy driven cleanup techniques. At some si-tes with low levels of environmental degradation
they can be used in place of conventional techni-cal solutions. In other cases, they can be applied
together with them a final step towards refinedenvironmental improvement. Some specific exam-
ples of phytotechnological applications include(UNEP, 2003):
Reduction and management of problemsrelated to point and non-point sources ofpollution through the use of natural or con-structed wetlands (usually coupled with
conventional methods).Facilitating the recovery of degraded eco-systems and soils, such as brown fields orpost industrial sites, or, for example, in the
case of mine-tailing fields and dumping si-tes. Also they are widely used for aquatic
and terrestrial ecotone recovery.Sinks for carbon dioxide to mitigate the
impacts of climate change through reforestation and afforestation.
Augmentation of the environmental capa-city of urban areas to mitigate pollutionimpacts and moderate energy extremes.
An example is the use of rooftop vegeta-tion, or „green roofs” to thermally insula-
te buildings as well as to avoid or reducethe formation of „heat islands”. They can
also be used to increase land beautifica-tion and urban biodiversity.
WHY IS PHYTOTECHNOLOGY USED IN IWM?Specific applications of phytotechnologies in inte-grated watershed management are complemen-
tary to ecohydrology. The biota, hence plants, arekey players in restoring water and biogeochemi-
cal cycles augmenting the carrying capacity, resi-lience and functionality of ecosystems (UNEP,
2003). In Box 2.4 the role of phytotechnology inIWM is presented in schematic form while in the
following information some of the reasons behindtheir application are given:
Plants form the first level of ecosystem struc-ture (primary producers) and, therefore,
control energy flow and nutrient cycling inlandscapes. Control of vegetation structure
VwerySmatrBook03.p65 2004-06-17, 17:1822
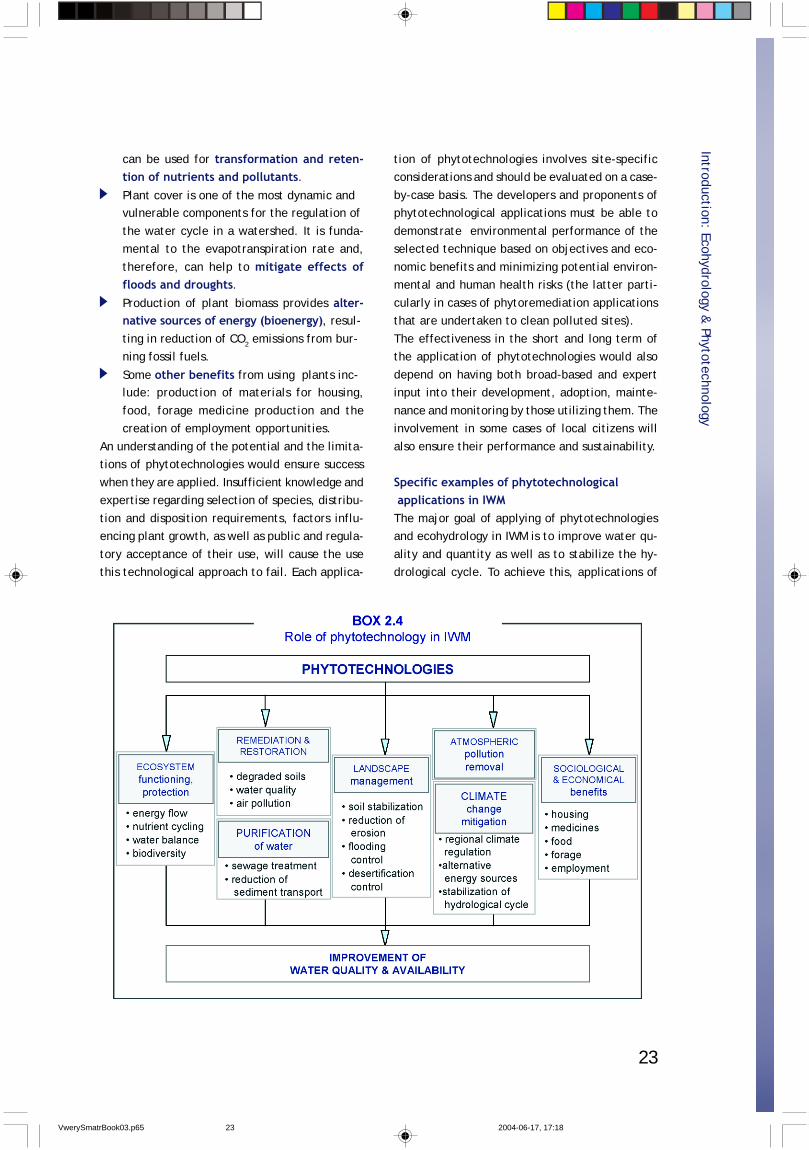
23
Introduction: Ecohydrology & Phytotechnology
can be used for transformation and reten-tion of nutrients and pollutants.Plant cover is one of the most dynamic andvulnerable components for the regulation of
the water cycle in a watershed. It is funda-mental to the evapotranspiration rate and,
therefore, can help to mitigate effects offloods and droughts.Production of plant biomass provides alter-native sources of energy (bioenergy), resul-
ting in reduction of CO2 emissions from bur-ning fossil fuels.
Some other benefits from using plants inc-lude: production of materials for housing,
food, forage medicine production and thecreation of employment opportunities.
An understanding of the potential and the limita-tions of phytotechnologies would ensure success
when they are applied. Insufficient knowledge andexpertise regarding selection of species, distribu-
tion and disposition requirements, factors influ-encing plant growth, as well as public and regula-
tory acceptance of their use, will cause the usethis technological approach to fail. Each applica-
tion of phytotechnologies involves site-specificconsiderations and should be evaluated on a case-
by-case basis. The developers and proponents ofphytotechnological applications must be able to
demonstrate environmental performance of theselected technique based on objectives and eco-
nomic benefits and minimizing potential environ-mental and human health risks (the latter parti-
cularly in cases of phytoremediation applicationsthat are undertaken to clean polluted sites).
The effectiveness in the short and long term ofthe application of phytotechnologies would also
depend on having both broad-based and expertinput into their development, adoption, mainte-
nance and monitoring by those utilizing them. Theinvolvement in some cases of local citizens will
also ensure their performance and sustainability.
Specific examples of phytotechnological applications in IWMThe major goal of applying of phytotechnologiesand ecohydrology in IWM is to improve water qu-
ality and quantity as well as to stabilize the hy-drological cycle. To achieve this, applications of
VwerySmatrBook03.p65 2004-06-17, 17:1823
24
phytotechnologies should cover activities at allspatial levels in the watershed (see chapter 1.C),
which include the landscape, land-water ecotonezones, freshwater bodies and estuaries. The most
commonly used applications of phytotechnologyfor management of water resources include the
following:phytoremediation of soils to reduce land-
scape pollution impacts on fresh waters(e.g., chapter 9.A);
vegetation cover management (forestryand agriculture practices) in order to con-
trol the water cycle in landscapes and re-duce nutrient leaching and erosion from a
catchment (e.g., chapters 9.B, 9.C);ecotone protection and rehabilitation for
reducing diffuse pollution from agricultu-ral lands and others (e.g., chapters 10.B, 11.C);
water quality improvement and eutrophi-cation control through the use of naturaland constructed wetlands and floodplains(e.g., chapters 10.A, 10 C);
enhancement of biodiversity through thegrowth of aquatic vegetation (e.g., chap-ters 11.B, 12.C); and
production of alternative fuels or bio-ener-gy production to reduce oil and charcoal
use as the main sources of energy mainlyin rural areas (e.g., chapters 2.C).
Socio-economic benefits of phytotechnologicalapplications in IWMPhytotechnologies are considered as low cost envi-
ronmentally sound technologies and may providehigh environmental efficiency at reduced costs.
While applied together in some cases with conven-tional methods, they can provide socio-economic
benefits on their own. For example: provision of alternative sources of energy(bioenergy), resulting in a decrease of percapita outflows of capital for fossil fuel use;
fertilizer source for agriculture, forestryand bioenergetic plantations;
production of material for housing, food,forage and sources of medicine;
creation of employment opportunities forlocal residents;
increase of the quality of life through ru-ral development and more livable cities;
and contribute to the inflow of capital resul
ting from the activities based on the quali-ty of water and environment (e.g., to-urism).
MAKE SURE TO CHECK THESE RESOURCES:
Introduction: Ecohydrology & Phytotechnology
Guidelines: chapters 1, 4, 5
http://www.unep.or.jp/ietc/Publications/Freshwater/FMS7/index.asphttp://www.unep.or.jp/ietc/Publications/Freshwater/FMS2/index.asp
http://www.rtdf.org/public/phyto/bib/default.cfmhttp://www.itrcweb.org
http://www.ec.gc.ca/etad/default.asp?lang=En&n=510541DD-1
VwerySmatrBook03.p65 2004-06-17, 17:1824
25
Demonstration projects aims at developing, vali-
dating and implementing ecohydrology and phy-totechnology in integrated watershed manage-
ment, and are joint UNESCO/UNEP initiatives.Based on the above concepts, demonstration pro-
jects endeavour to develop a cost-effective, com-prehensive strategy, not only for improving water
quality and quantity, but also for meeting localconcerns in a given region.
The Pilica River Demonstration Project was desi-gned to mitigate point and non-point sources of
pollution entering a river, reduce the risk of toxicalgal blooms appearing in a shallow reservoir and
converting these threats into opportunities for theregional economy.
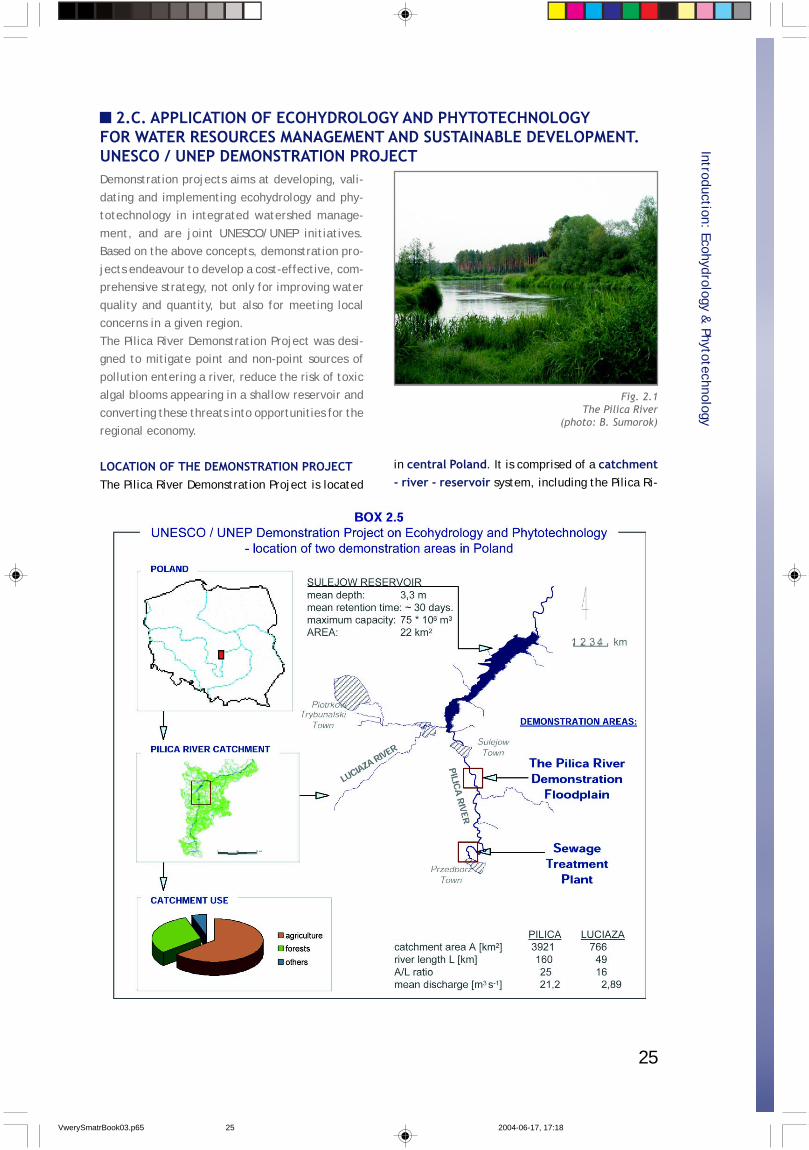
LOCATION OF THE DEMONSTRATION PROJECTThe Pilica River Demonstration Project is located
2.C. APPLICATION OF ECOHYDROLOGY AND PHYTOTECHNOLOGYFOR WATER RESOURCES MANAGEMENT AND SUSTAINABLE DEVELOPMENT.UNESCO / UNEP DEMONSTRATION PROJECT
in central Poland. It is comprised of a catchment- river - reservoir system, including the Pilica Ri-
Fig. 2.1The Pilica River
(photo: B. Sumorok)
Introduction: Ecohydrology & Phytotechnology
VwerySmatrBook03.p65 2004-06-17, 17:1825
26
ver (Fig. 2.1) and a lowland reservoir located inits middle reach (the Sulejow Reservoir; Box 2.5).
For nearly 30 years the main function of the rese-rvoir has been to supply the City of Lodz (about
800 000 inhabitants) with drinking water. This pur-pose has lately been restricted because of water
quality concerns. It serves now as an optional so-urce of drinking water and recreational area for
about 1 million people.
KEY ISSUESKey issues have been classified into ecological and
socio-economic categories (Box 2.6).
Ecological issuesThe Pilica River catchment is a beautiful, picture-
sque area, with several landscape parks and pre-served old forests, as well it has high cultural and
historical values. The river itself - although overmost of it’s length has an undisturbed character -
it is, however, impacted by point-sources of pol-lution due to unstable and outdated sewage tre-
atment technologies. These affect the chemicaland physical components, bacteriology and biotic
structure of the river. A large part of the pollutionalso comes from non-point sources, which is de-
rived mostly from agriculture in the catchment(Box 2.5).
The pollution not only effects the quality of theriver, but is transported to the Sulejow Reservoir
located downstream. Large amounts of the inflo-wing sediment and nutrients are retained in the
reservoir, resulting in eutrophication and the oc-currence of intensive cyanobacterial blooms du-
ring summers. The maximum cyanobacterial bio-mass observed in 1995 reached 60 mg L-1 (Tarczyn-
ska, 1998). Several studies revealed cancerous andtoxic effects of the toxins produced in the rese-rvoir by the cyanobacteria (Microcystis aerugino-
sa) (Mankiewicz, Tarczynska, Walter, Zalewski,2003; see chapter 7.D).
Socio-economic issuesThe area is characterized by a high unemploymentrate, locally reaching more than 20%. At the same
time agriculture, considered traditionally to be themain income for a large part of the local popula-
tion, has been limited by low soil quality in a com-petitive economy.
High value of the region’s natural resources couldmake it a good area for future development of
recreation, tourism and eco-tourism. However,there is a need to improve the water quality and
reduce the occurrence of toxic algal blooms, whichreduce the appeal of the area for potential inve-
stors and can restrict the development. Anotheropportunity is development of alternative agricul-
tural production, e.g., production of biomass.
Introduction: Ecohydrology & Phytotechnology
VwerySmatrBook03.p65 2004-06-17, 17:1826
27
GOAL OF THE PROJECTThe major goal of the project has been to valida-
te application of ecohydrology and phytotechno-logy for converting of nutrients from point and
non-point sources of pollution into biomass andbioenergy. This is not only to improve the quali-ty of the environment, but also to provide addi-tional alternatives for development of the regionand employment.
DEMONSTRATION AREASThe project has been developed in the two de-
monstration areas (Box 2.5):
The sewage treatment plant in PrzedborzTown (4,000 inhabitants), where treated se-wage from the plant has been disposed di-
rectly into the river, until now. According tothe phytotechnology approach, establish-
ment of a constructed wetland together witha willow plantation as the final step of treat-
ment, could diminish the impact on the ri-ver. Additionally, the biomass produced in the
wetland could be utilized as bioenergy, andcover part of the energetic needs of the treat-ment plant, reducing costs of it’s maintenance.
Demonstration floodplain of the Pilica Ri-ver, where a method for reduction nutrientloads transported by the river down to thereservoir was to be developed and quanti-
fied. Nutrient retention can be enhancedby two groups of processes: physical ones
(intensification of sedimentation by regula-tion of floodplain hydraulics) and biological
ones (uptake of the dissolved fraction by bio-mass through the management of the natu-
ral floodplain vegetation communities andpatches of planted willow).
PROJECT IMPLEMENTATIONThe implementation of the project has been de-veloped through five parallel lines of action:
research - providing scientific evidence ofthe hydrological and biological processes;
development and implementation of tech-nologies for applying ecohydrology and phy-
totechnology in the research areas;
Meetings with local government, stakehol-
ders and landowners, for dissemination of
information and facilitation of implementation;
Training and education - including primaryand secondary schools in the region, natio-nal and international university students and
young scientists;
Dissemination of the information and expe-riences about the project at the nationaland international levels;
Fig. 2.2Sampling of mycorrhizal samples
on the Pilica River demonstration floodplain(photo: I. Wagner-Lotkowska)
Introduction: Ecohydrology & Phytotechnology
VwerySmatrBook03.p65 2004-06-17, 17:1827
28
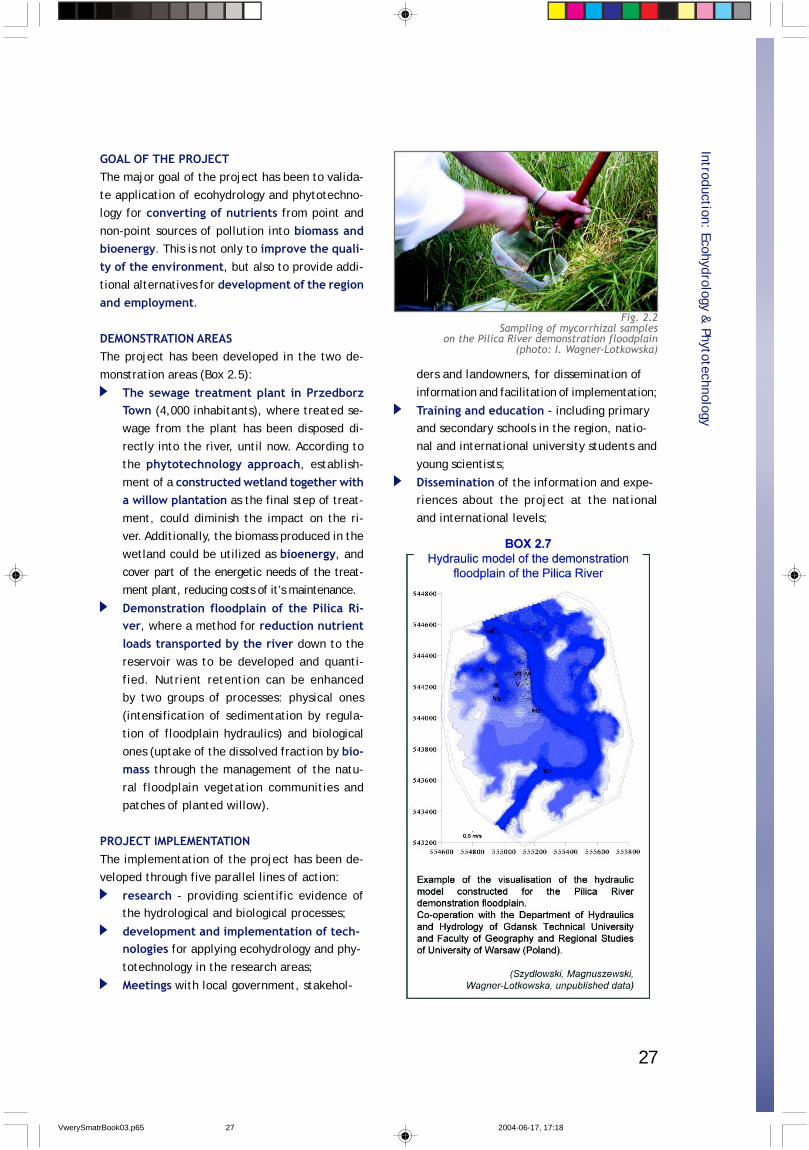
GENERAL RESULTSThe results of the first year of project implemen-
tation include the following:
Development of hydraulic models of the de-monstration floodplain, for optimization ofsedimentation processes and nutrient and
water retention (Box 2.7);
Elaboration of recommendations for vegeta-tion management in order to enhance theability of the system to retain nutrients in
biomass.
Elaboration of a draft management plan fora water treatment plant in Przedborz, inc-luding recommendations for both technical
upgrades and justifications for a phytotech-nological application.
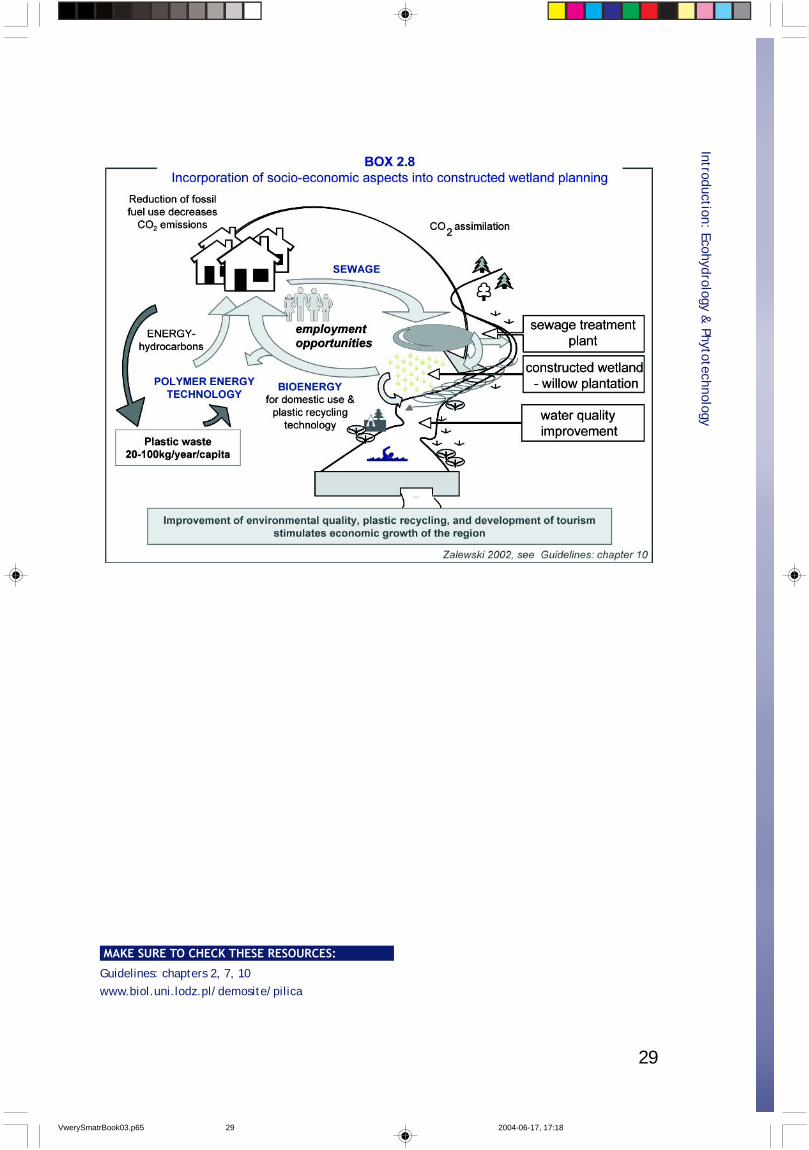
Elaboration of a management strategy forthe use of biomass produced in the area.Following the idea presented in the summa-
ry of the UNESCO/UNEP Guidelines (Box 2.8),the strategy should generate a positive so-
cio-economic feedback based on the use andmanagement of environmental resources. Thepotential for bioenergy production in the
region has been estimated using various sce-narios of energetic needs.
Increase of knowledge and awareness abo-ut ecohydrology and phytotechnology, theirapplication in IWM and benefits for susta-inable development in the region, by tra-
ining, education and dissemination. Severaltrained target groups includes local, regio-
nal and national authorities, NGOs, stakehol-
ders and landowners, which have been invo-
lved in implementation of the project du-ring the latter stages. Another group of ac-
tivities was aimed at researchers, youngscientists, university teachers, students,
youth and children, primary and secondaryteachers. The outcomes and results of the
project have been disseminated during anumber of national and international me-
etings and conferences, by distribution ofinformative materials and a website written
in both Polish and English.
FUTURE PERSPECTIVESThe results of the first phase of the project im-
plementation show the potential for the applica-tion of ecohydrology and phytotechnology measu-
res in the Pilica Region, which has attracted theinterest of local and regional authorities. Further
development of the project is to be focused onthe following aspects:
Continuation of the tasks developed in thefirst phase of the project;
Preparatory work for implementation of theachievements of the project’s first phase at
a larger scale;
Elaboration of a strategy for biomass use forsolving other environmental problems in ci-ties in the region, such as conversion of po-
lyolefin wastes into energy.
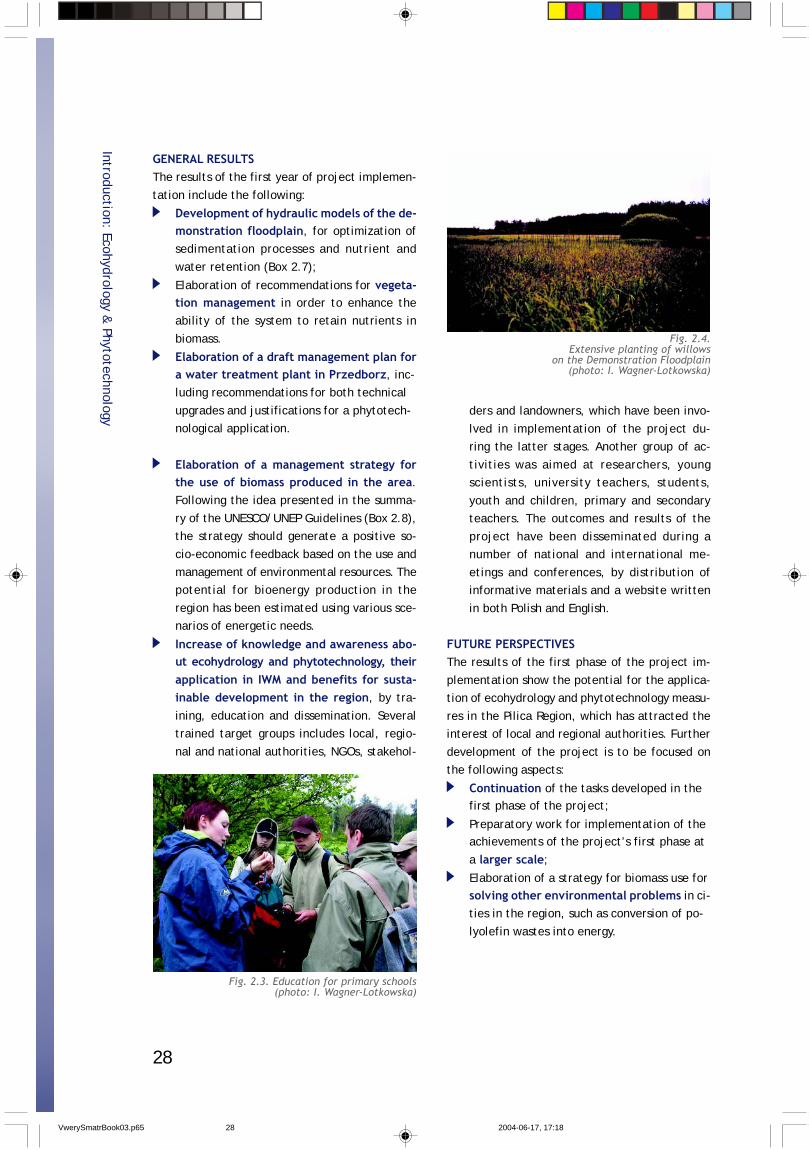
Fig. 2.4.Extensive planting of willows
on the Demonstration Floodplain(photo: I. Wagner-Lotkowska)
Fig. 2.3. Education for primary schools(photo: I. Wagner-Lotkowska)
Introduction: Ecohydrology & Phytotechnology
VwerySmatrBook03.p65 2004-06-17, 17:1828
29
MAKE SURE TO CHECK THESE RESOURCES:
Introduction: Ecohydrology & Phytotechnology
Guidelines: chapters 2, 7, 10www.biol.uni.lodz.pl/demosite/pilica
VwerySmatrBook03.p65 2004-06-17, 17:1829
30
Introduction: Basic Concepts & D
efinitions
3.A. WATERSHED
WHAT IS A WATERSHED?Rivers can be seen as veins of a leaf, extending all
over a drainage basin up to their divides. Whenrain falls on a watershed it finally ends up in a
river system. A river channel is the lowest point inthe surrounding landscape. Its purpose is to co-
nvey excess water from a drainage basin, whichwill include the products of weathering and addi-
tional loads of solutes produced by man. This pro-perty makes a drainage basin an integrator and its
operation is reflected in the quantity and qualityof the river run-off.
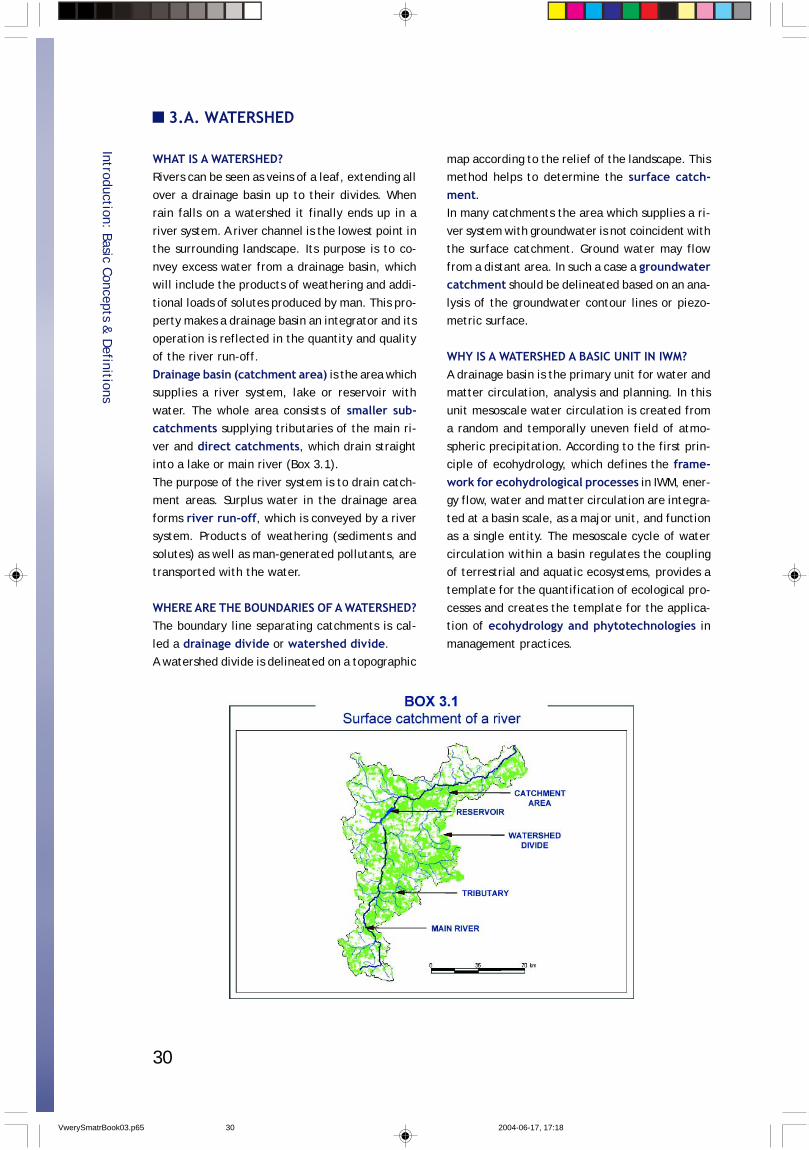
Drainage basin (catchment area) is the area whichsupplies a river system, lake or reservoir with
water. The whole area consists of smaller sub-catchments supplying tributaries of the main ri-
ver and direct catchments, which drain straightinto a lake or main river (Box 3.1).
The purpose of the river system is to drain catch-ment areas. Surplus water in the drainage area
forms river run-off, which is conveyed by a riversystem. Products of weathering (sediments and
solutes) as well as man-generated pollutants, aretransported with the water.
WHERE ARE THE BOUNDARIES OF A WATERSHED?The boundary line separating catchments is cal-
led a drainage divide or watershed divide.A watershed divide is delineated on a topographic
map according to the relief of the landscape. Thismethod helps to determine the surface catch-ment.In many catchments the area which supplies a ri-
ver system with groundwater is not coincident withthe surface catchment. Ground water may flow
from a distant area. In such a case a groundwatercatchment should be delineated based on an ana-
lysis of the groundwater contour lines or piezo-metric surface.
WHY IS A WATERSHED A BASIC UNIT IN IWM?A drainage basin is the primary unit for water andmatter circulation, analysis and planning. In this
unit mesoscale water circulation is created froma random and temporally uneven field of atmo-
spheric precipitation. According to the first prin-ciple of ecohydrology, which defines the frame-work for ecohydrological processes in IWM, ener-gy flow, water and matter circulation are integra-
ted at a basin scale, as a major unit, and functionas a single entity. The mesoscale cycle of water
circulation within a basin regulates the couplingof terrestrial and aquatic ecosystems, provides atemplate for the quantification of ecological pro-
cesses and creates the template for the applica-tion of ecohydrology and phytotechnologies inmanagement practices.
VwerySmatrBook03.p65 2004-06-17, 17:1830
31
3.B. CLIMATEIntroduction: Basic Concepts &
Definitions
WHAT IS CLIMATE?Climate is defined as the average of weathervariables over relatively long periods of time.
Climate variability is defined as the range ofvalues that the climate can take over time ina given area.
Climate change means an alteration of atmo-spheric processes attributed to human activi-
ty, in addition to natural climate variability.
DOES CLIMATE CHANGE?According to the most recent assessment of theIntergovernmental Panel on Climate Change
(2001), the global surface temperature may in-crease by between 1,4oC and 5,8oC over the 21st
Century as a result of human activities. Not onlyair temperature, but also precipitation, evapo-transpiration, wind speed and solar radiation,are likely to be perturbed due to changes in the
chemical composition of the atmosphere. Climatechanges are likely to exaggerate extreme weatherfluctuations.
HOW DOES IT CHANGE?The impacts of climate change on hydrology andecology are usually assessed by defining scenarios
for changes in climatic inputs to physical and bio-logical processes. There is a growing demand for
credible regional-scale climate scenarios, whichare reliant on techniques to downscale from Glo-bal Climate Models (GCMs) - the principal toolsfor climate change research.
There is much uncertainty implicit in the choiceof GCM, further complicated by the variety of do-
wnscaling methods. One of the major policy im-plications of climate change is that it may no lon-
ger be assumed that the future aquatic resourcesbase will be similar to that of the present.
HOW CAN CLIMATE CHANGE IMPACTECOHYDROLOGICAL PROCESSES?Global climate change is expected to affect di-
rectly both the quantity and quality of water re-sources.It will affect particular elements of the hydrologi-cal cycle, changing river discharges, and hence
also water retention times in reservoirs and waterlevels in lakes. It is predicted that the timing and
intensity of floods and droughts will also change,which can have serious economic and sociological
effects. Since water is the main medium responsi-ble for the export of nutrients and pollutants from
catchments, the above processes will alter nu-trient transport patterns to fresh waters, and
hence their physical and chemical parameters.Due to predicted air temperature increases, wa-ter temperature and the number of ice-free days
will also change. The rate of all physical, chemi-cal and biological processes could be accelerated.
Some species may disappear or the boundaries oftheir range could be shifted. All the above pro-
cesses may seriously affect ecosystem functioningand structure, especially in the case of degraded
ecosystems.
VwerySmatrBook03.p65 2004-06-17, 17:1831
32
Introduction: Basic Concepts & D
efinitions
3.C. HYDROLOGICAL CYCLE
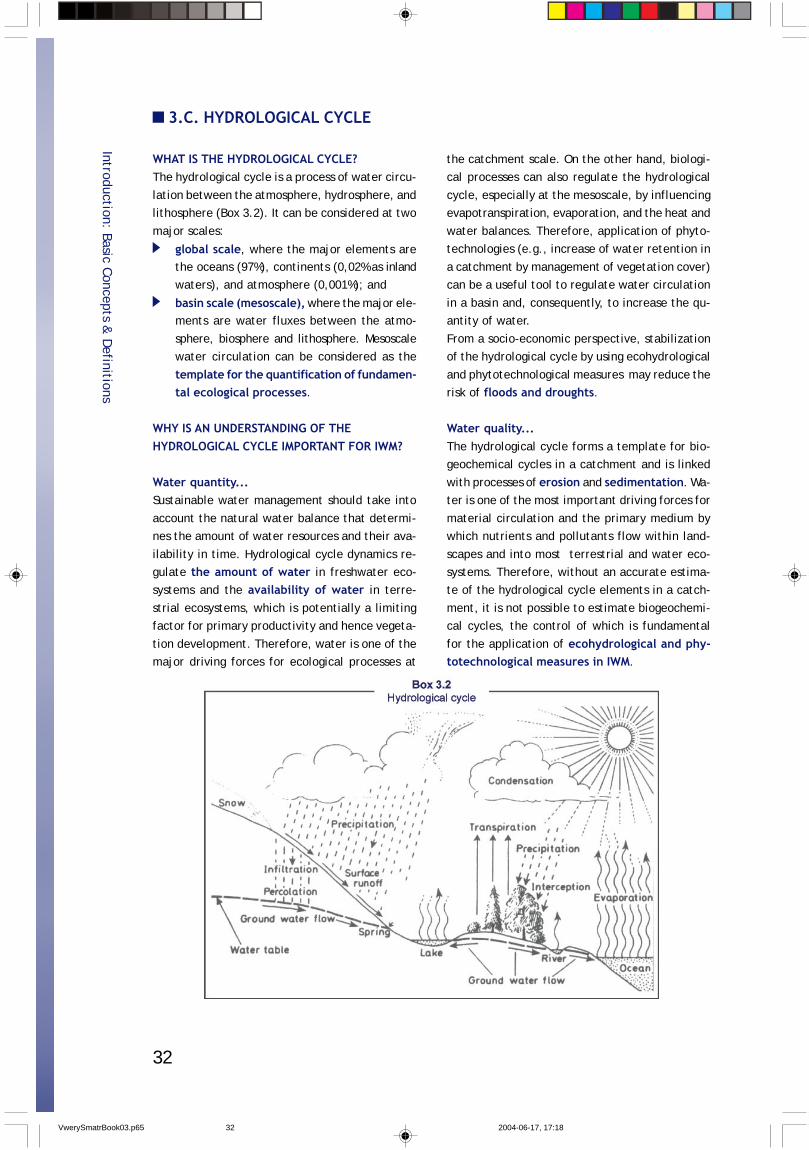
WHAT IS THE HYDROLOGICAL CYCLE?The hydrological cycle is a process of water circu-
lation between the atmosphere, hydrosphere, andlithosphere (Box 3.2). It can be considered at two
major scales:
global scale, where the major elements arethe oceans (97%), continents (0,02% as inlandwaters), and atmosphere (0,001%); and
basin scale (mesoscale), where the major ele-ments are water fluxes between the atmo-
sphere, biosphere and lithosphere. Mesoscalewater circulation can be considered as the
template for the quantification of fundamen-tal ecological processes.
WHY IS AN UNDERSTANDING OF THEHYDROLOGICAL CYCLE IMPORTANT FOR IWM?
Water quantity...Sustainable water management should take into
account the natural water balance that determi-nes the amount of water resources and their ava-
ilability in time. Hydrological cycle dynamics re-gulate the amount of water in freshwater eco-systems and the availability of water in terre-
strial ecosystems, which is potentially a limitingfactor for primary productivity and hence vegeta-
tion development. Therefore, water is one of themajor driving forces for ecological processes at
the catchment scale. On the other hand, biologi-cal processes can also regulate the hydrological
cycle, especially at the mesoscale, by influencingevapotranspiration, evaporation, and the heat and
water balances. Therefore, application of phyto-technologies (e.g., increase of water retention in
a catchment by management of vegetation cover)can be a useful tool to regulate water circulation
in a basin and, consequently, to increase the qu-antity of water.
From a socio-economic perspective, stabilizationof the hydrological cycle by using ecohydrological
and phytotechnological measures may reduce therisk of floods and droughts.
Water quality...The hydrological cycle forms a template for bio-geochemical cycles in a catchment and is linked
with processes of erosion and sedimentation. Wa-ter is one of the most important driving forces for
material circulation and the primary medium bywhich nutrients and pollutants flow within land-
scapes and into most terrestrial and water eco-systems. Therefore, without an accurate estima-te of the hydrological cycle elements in a catch-
ment, it is not possible to estimate biogeochemi-cal cycles, the control of which is fundamental
for the application of ecohydrological and phy-totechnological measures in IWM.
VwerySmatrBook03.p65 2004-06-17, 17:1832
33
3.D. BIOGEOCHEMICAL CYCLESIntroduction: Basic Concepts &
Definitions
WHAT ARE BIOGEOCHEMICAL CYCLES?Biogeochemical cycles are the characteristic ro-
utes between abiotic elements of the environ-ment and its biotic components through which
matter circulates. Matter circulates as particularelements and occurs in the form of continuouslytransformed organic and inorganic compounds.Living organisms need 40 elements to sustain
growth and reproduction. The most required nu-trients include such elements as: carbon, phospho-
rus, nitrogen, oxygen and hydrogen, of which thelast two are usually readily available in most envi-
ronments.
HOW ARE NUTRIENTS TRANSFORMED?Nutrient transformations in biogeochemical cyc-
les are controlled by two groups of processes:
Abiotic - geochemical cycles such as: prec-ipitation, diffusion, dissociation and redoxreactions.
Biotic - resulting from the activity of liveorganisms such as: incorporation of inorganic
and organic nutrients into the biomass ofplants, grazers and predators or liberation ofnutrients in microbiological decomposition.
All the above processes in both terrestrial and fresh-
water ecosystems are strongly controlled by solar ener-gy, water and temperature. Solar energy is asimila-
ted by plants and flows trough trophic levels and backto decomposers. Water serves as a medium determi-
ning the «routes» of the nutrients in biogeochemicalcycles (e.g., the rate of erosion and nutrient availabi-
lity for vegetation). Temperature determines the rateof both abiotic and biotic process.
Degradation of biogeochemical cyclesAnthropogenic pressure results in degradation oflandscapes (e.g., deforestation, unsustainable
agriculture and urbanization) and the biotic struc-ture of fresh waters (e.g., river regulation), and
thus leads to modification of evolutionarily esta-blished biogeochemical cycles.
The above processes open nutrient cycles thatresults in their increased export from the land-
scape to fresh waters and diminish the ability offreshwater ecosystems to self-purify, while nu-
trient enrichment will lead to eutrophication.
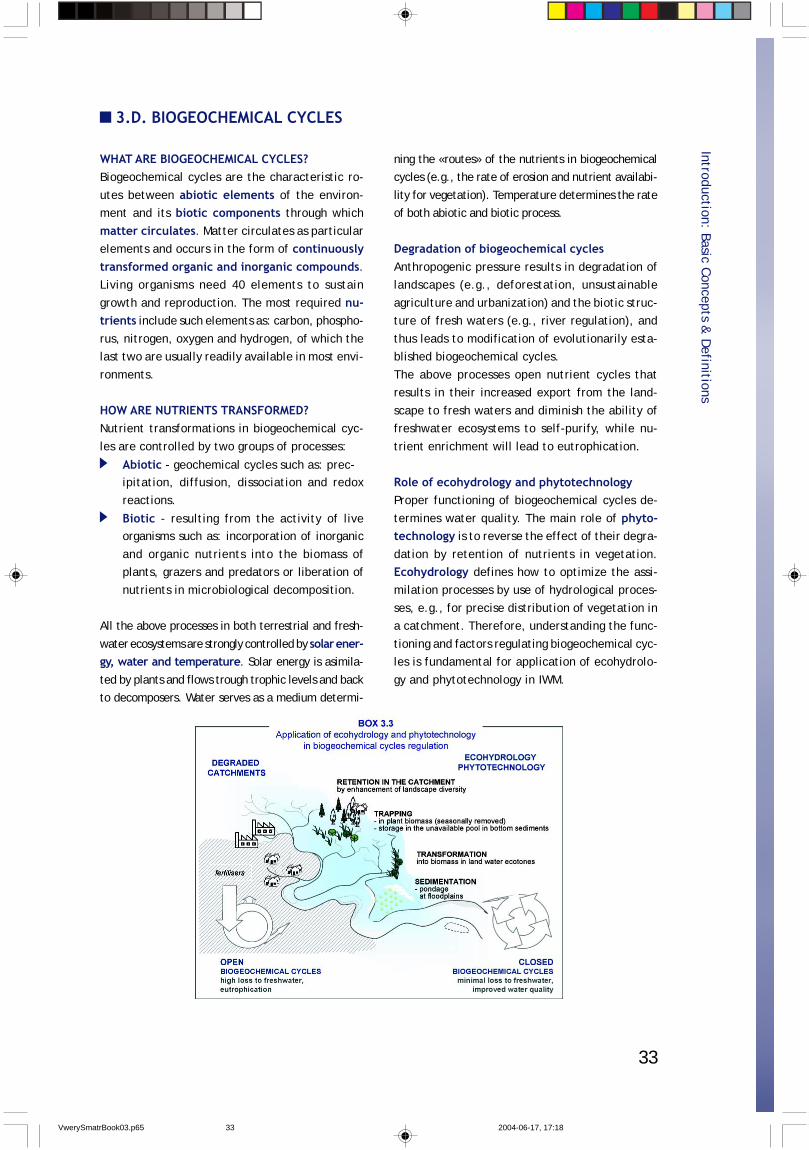
Role of ecohydrology and phytotechnologyProper functioning of biogeochemical cycles de-
termines water quality. The main role of phyto-technology is to reverse the effect of their degra-
dation by retention of nutrients in vegetation.Ecohydrology defines how to optimize the assi-milation processes by use of hydrological proces-
ses, e.g., for precise distribution of vegetation ina catchment. Therefore, understanding the func-
tioning and factors regulating biogeochemical cyc-les is fundamental for application of ecohydrolo-
gy and phytotechnology in IWM.
VwerySmatrBook03.p65 2004-06-17, 17:1833
34
Introduction: Basic Concepts & D
efinitions
3.E. LANDSCAPE STRUCTURE AND VEGETATION COVER
WHAT IS A LANDSCAPE?A landscape is the total human environment inc-
luding the geosphere, biosphere and technosphe-re. From an ecological point of view, it should be
considered as a group of biotopes, which are thesmallest spatial units of homogenous abiotic con-
ditions (physiotope) with a related natural com-bination of biota.
This imposes the approach for landscape analy-sis, which requires a holistic and integrative ap-
proach focused on the entirety of biogeochemicalprocesses, such as proposed in the concept of eco-
hydrology.
WHAT ARE LANDSCAPE FUNCTIONS?accumulation of material and dispersion ofhuman - induced energy;
receptacle of unsuitable wastes from popula-ted areas and their rendering;
filtration of energy, matter and organismflows;
resource regeneration and recycling;provision of wildlife refuges; and
support for regional settlement and recre-ation (Mander et al., 1995).
WHAT DECIDES LANDSCAPE STRUCTURE?A landscape is a complex system of elements, whichare static or dynamic in time and space.
static elements include forms that are struc-tural in character - point, line and areaelements distributed homogenously, hete-rogeneously or in a patchy way;
dynamic elements consist of biota reflectingrelationships between biotic and abiotic com-
ponents.
UNBALANCED AND BALANCED LANDSCAPESThe elements in each class consist of primary or
natural, and secondary, or human-made or man-modified, structures. The unsustainable interac-
tion between these two groups may create anunbalanced situation leading to devaluation of
landscape processes.The effect of this interaction is degradation of
landscape structure, its fragmentation or homo-genization (depending on the land - use system).
Both situations may lead to:
increased leak of toxic substances andnutrients to waters;
decrease of water retention in river catchments;
changes in solar radiation balance; and
decline of biodiversity.Freshwater ecosystems, which are located in land
depressions, are good indicators of the quality ofneighbouring terrestrial systems.
ECOHYDROLOGY & PHYTOTECHNOLOGYIN LANDSCAPE MANAGEMENTVegetation is one of the most important factors
protecting landscapes and, at the same time, themost sensitive element affected by man’s activi-
ties. Its role is influenced by: the reduction of fo-rests, changes in species composition and quanti-
tative properties of vegetation cover, land dra-inage or irrigation, and the degradation of land -
water ecotone zones.Therefore, sustainable landscape management,as well as management of ecotone zones betwe-en a landscape and water, requires a better un-
derstanding and regulation of hydrology - biotainteractions as proposed in the ecohydrologicalapproach and put into practice through the appli-cation of phytotechnologies as one of major bio-
tic tods.The goal of sustainable management is to mainta-
in the ecological functions of landscapes underincreasing human aspirations and pressures.
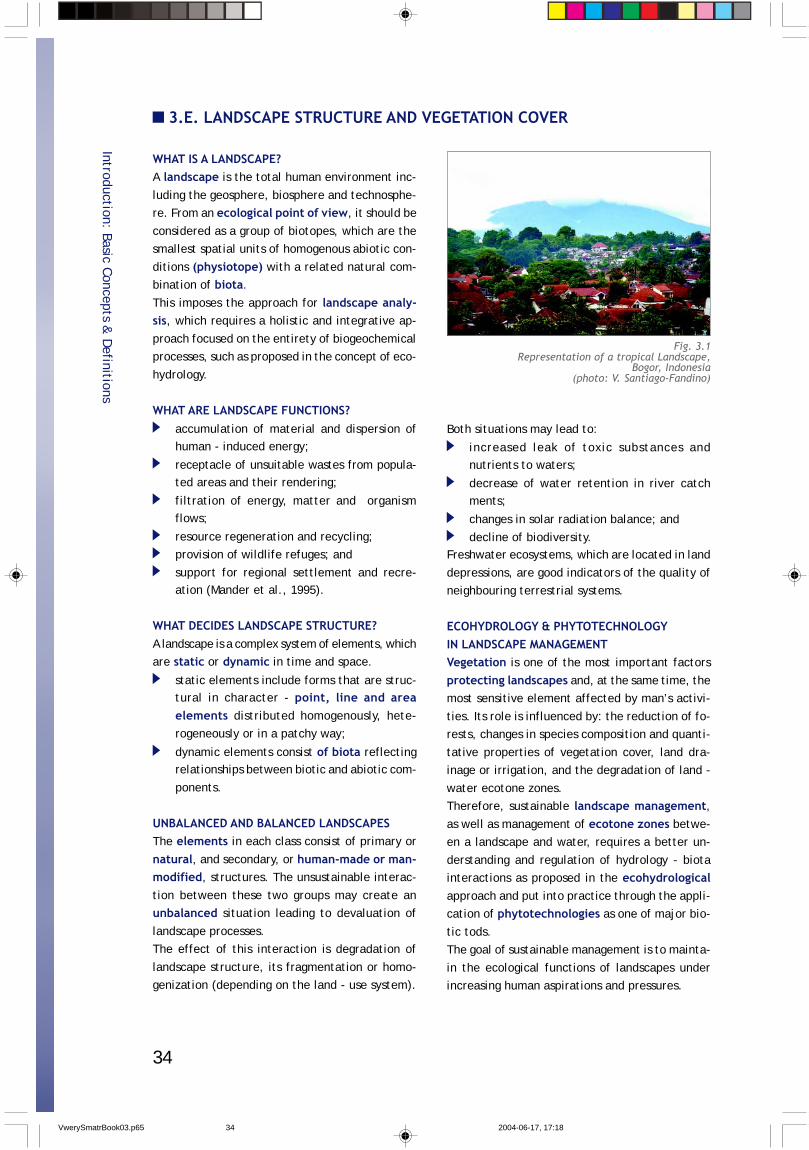
Fig. 3.1Representation of a tropical Landscape,
Bogor, Indonesia(photo: V. Santiago-Fandino)
VwerySmatrBook03.p65 2004-06-17, 17:1834
35
3.F. STREAMS AND RIVERS
WHAT ARE THE STRUCTURAL COMPONENTSOF A RIVER ECOSYSTEM?Streams and rivers are integrated flowing systemsthat create and maintain aquatic habitats within
the structure of their flow as well as on and belowtheir wetted boundaries.
Natural channel evolution is governed by climate,geology, topography, soil and vegetation conditions
of a watercourse and watershed. The characteri-stic regime, or geomorphology, of a natural chan-
nel can be defined in terms of the maximum wa-ter level contained between its banks, channel
width to depth ratio, occurrence of an active flo-odplain, meander pattern, slope, bed material and
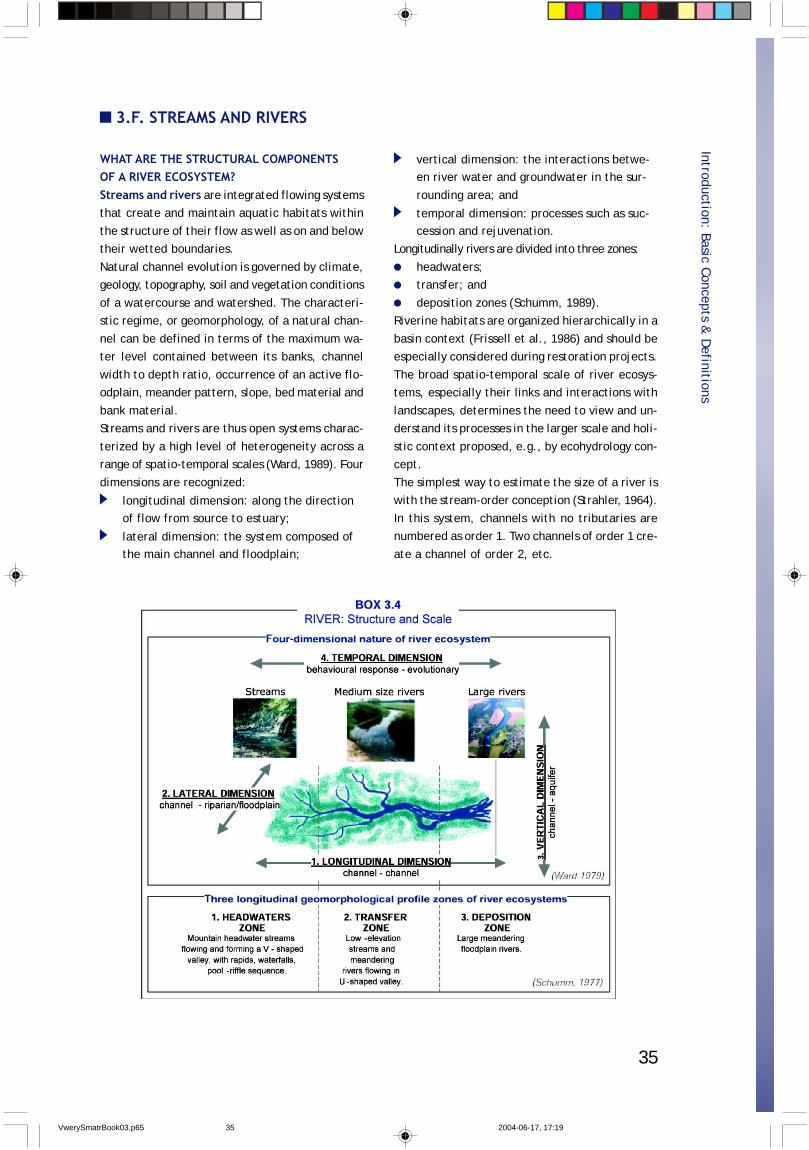
bank material.Streams and rivers are thus open systems charac-
terized by a high level of heterogeneity across arange of spatio-temporal scales (Ward, 1989). Four
dimensions are recognized:
longitudinal dimension: along the directionof flow from source to estuary;
lateral dimension: the system composed ofthe main channel and floodplain;
vertical dimension: the interactions betwe-en river water and groundwater in the sur-
rounding area; and
temporal dimension: processes such as suc-cession and rejuvenation.
Longitudinally rivers are divided into three zones:
headwaters;transfer; and
deposition zones (Schumm, 1989).Riverine habitats are organized hierarchically in a
basin context (Frissell et al., 1986) and should beespecially considered during restoration projects.
The broad spatio-temporal scale of river ecosys-tems, especially their links and interactions with
landscapes, determines the need to view and un-derstand its processes in the larger scale and holi-
stic context proposed, e.g., by ecohydrology con-cept.
The simplest way to estimate the size of a river iswith the stream-order conception (Strahler, 1964).
In this system, channels with no tributaries arenumbered as order 1. Two channels of order 1 cre-
ate a channel of order 2, etc.
Introduction: Basic Concepts & D
efinitions
VwerySmatrBook03.p65 2004-06-17, 17:1935
36
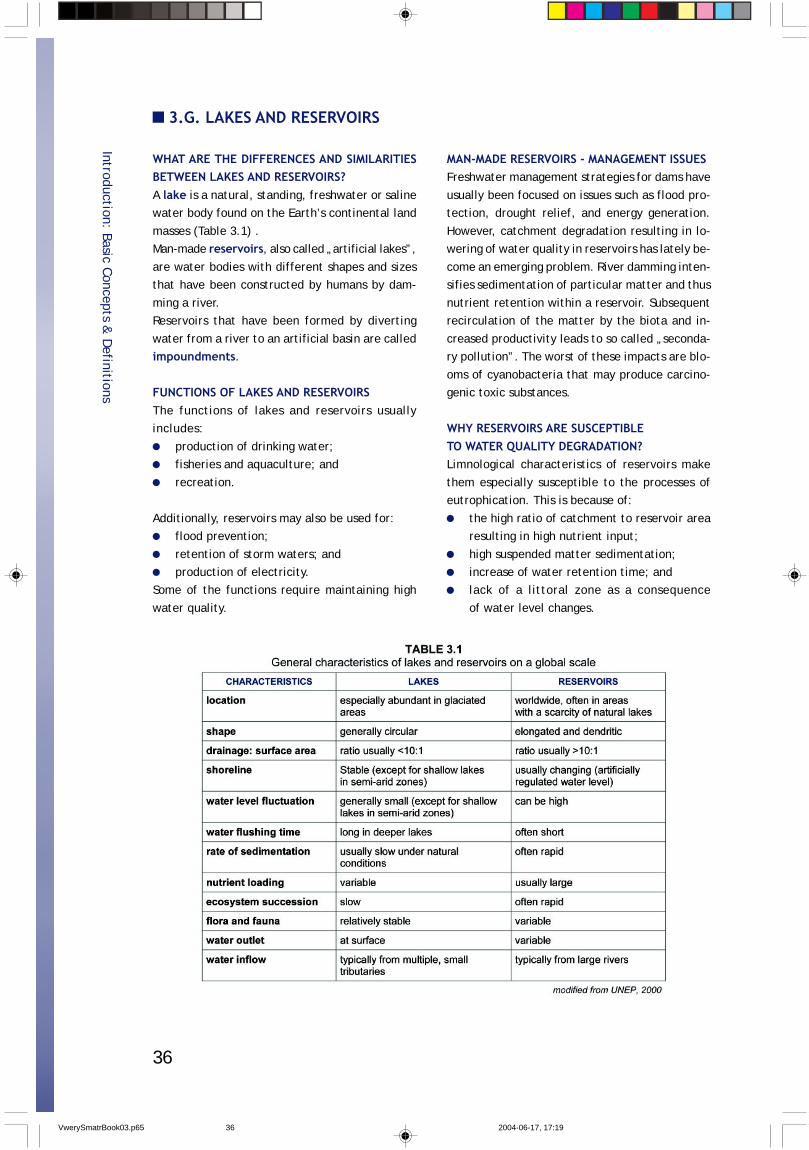
3.G. LAKES AND RESERVOIRS
Introduction: Basic Concepts & D
efinitions
WHAT ARE THE DIFFERENCES AND SIMILARITIESBETWEEN LAKES AND RESERVOIRS?A lake is a natural, standing, freshwater or salinewater body found on the Earth’s continental land
masses (Table 3.1) .Man-made reservoirs, also called „artificial lakes”,
are water bodies with different shapes and sizesthat have been constructed by humans by dam-
ming a river.Reservoirs that have been formed by diverting
water from a river to an artificial basin are calledimpoundments.
FUNCTIONS OF LAKES AND RESERVOIRSThe functions of lakes and reservoirs usuallyincludes:
production of drinking water;fisheries and aquaculture; and
recreation.
Additionally, reservoirs may also be used for:flood prevention;
retention of storm waters; andproduction of electricity.
Some of the functions require maintaining high
water quality.
MAN-MADE RESERVOIRS - MANAGEMENT ISSUESFreshwater management strategies for dams have
usually been focused on issues such as flood pro-tection, drought relief, and energy generation.
However, catchment degradation resulting in lo-wering of water quality in reservoirs has lately be-
come an emerging problem. River damming inten-sifies sedimentation of particular matter and thus
nutrient retention within a reservoir. Subsequentrecirculation of the matter by the biota and in-
creased productivity leads to so called „seconda-ry pollution”. The worst of these impacts are blo-
oms of cyanobacteria that may produce carcino-genic toxic substances.
WHY RESERVOIRS ARE SUSCEPTIBLETO WATER QUALITY DEGRADATION?Limnological characteristics of reservoirs make
them especially susceptible to the processes ofeutrophication. This is because of:
the high ratio of catchment to reservoir arearesulting in high nutrient input;
high suspended matter sedimentation;increase of water retention time; andlack of a littoral zone as a consequence
of water level changes.
VwerySmatrBook03.p65 2004-06-17, 17:1936
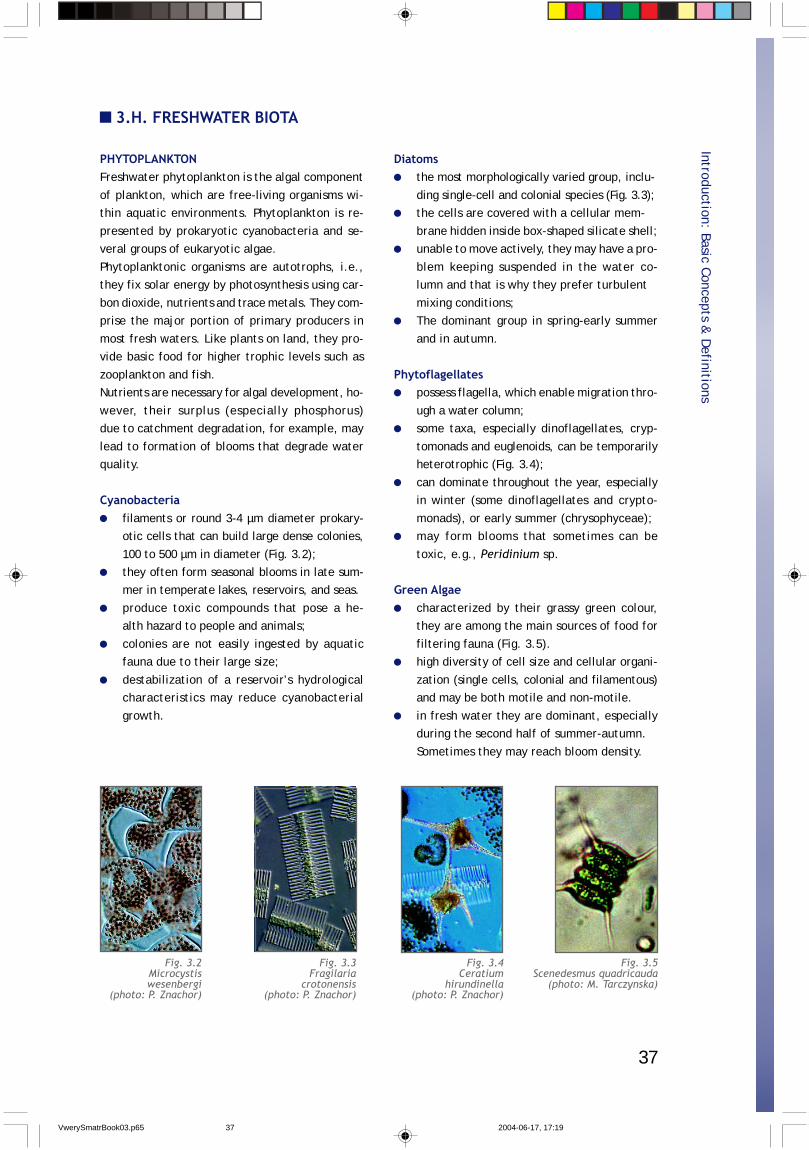
37
Introduction: Basic Concepts & D
efinitions 3.H. FRESHWATER BIOTA
PHYTOPLANKTONFreshwater phytoplankton is the algal component
of plankton, which are free-living organisms wi-thin aquatic environments. Phytoplankton is re-
presented by prokaryotic cyanobacteria and se-veral groups of eukaryotic algae.
Phytoplanktonic organisms are autotrophs, i.e.,they fix solar energy by photosynthesis using car-
bon dioxide, nutrients and trace metals. They com-prise the major portion of primary producers in
most fresh waters. Like plants on land, they pro-vide basic food for higher trophic levels such as
zooplankton and fish.Nutrients are necessary for algal development, ho-
wever, their surplus (especially phosphorus)due to catchment degradation, for example, may
lead to formation of blooms that degrade waterquality.
Cyanobacteriafilaments or round 3-4 µm diameter prokary-otic cells that can build large dense colonies,
100 to 500 µm in diameter (Fig. 3.2);they often form seasonal blooms in late sum-mer in temperate lakes, reservoirs, and seas.
produce toxic compounds that pose a he-alth hazard to people and animals;
colonies are not easily ingested by aquaticfauna due to their large size;
destabilization of a reservoir’s hydrologicalcharacteristics may reduce cyanobacterial
growth.
Diatomsthe most morphologically varied group, inclu-
ding single-cell and colonial species (Fig. 3.3);the cells are covered with a cellular mem-
brane hidden inside box-shaped silicate shell;unable to move actively, they may have a pro-
blem keeping suspended in the water co-lumn and that is why they prefer turbulent
mixing conditions;The dominant group in spring-early summer
and in autumn.
Phytoflagellatespossess flagella, which enable migration thro-
ugh a water column;some taxa, especially dinoflagellates, cryp-
tomonads and euglenoids, can be temporarilyheterotrophic (Fig. 3.4);
can dominate throughout the year, especiallyin winter (some dinoflagellates and crypto-
monads), or early summer (chrysophyceae);may form blooms that sometimes can be
toxic, e.g., Peridinium sp.
Green Algaecharacterized by their grassy green colour,they are among the main sources of food for
filtering fauna (Fig. 3.5).high diversity of cell size and cellular organi-
zation (single cells, colonial and filamentous)and may be both motile and non-motile.
in fresh water they are dominant, especiallyduring the second half of summer-autumn.
Sometimes they may reach bloom density.
Fig. 3.2Microcystiswesenbergi
(photo: P. Znachor)
Fig. 3.3Fragilaria
crotonensis(photo: P. Znachor)
Fig. 3.4Ceratium
hirundinella(photo: P. Znachor)
Fig. 3.5Scenedesmus quadricauda
(photo: M. Tarczynska)
VwerySmatrBook03.p65 2004-06-17, 17:1937
38
Introduction: Basic Concepts & D
efinitions
ZOOPLANKTONZooplankton occupy a key position in the food webs
of lakes and reservoirs, transferring algal primaryproduction to higher trophic levels. Filtering al-
gae and suspended detritus, zooplankton stronglydetermine the amount and composition of organic
matter in the water column.
Rotatoriasmall organisms (body lengh <0,2 mm)
characterised by different body forms (Fig.3.6). Among them one can find planktonic,
crawling or sedentary genera, while a few areparasites. Rotatoria occur in lakes of diffe-
rent trophic status. Most rotatorians have acarapax, a taxonomic feature;
they feed on algae, bacteria and detri-tus while some forms are predatory, e.g.,
Asplanchna sp. (Fig. 3.7). They are charac-terized by sexual reproduction - they may
be partenogenetic or may have separate se-xes. In lakes of temperate regions, Rotatoria
peak in early spring and/or during autumn.
Cladocerathey are the dominant mesoplankton (200µm - 2 mm in length) in many lakes but are
repre-sented by only three genera in thesea (Evad-ne sp., Podon sp., Penilia sp.);
herbivorous cladocerans are filter feeders andform the most studied group of zooplankton;
especially the genus Daphnia spp (Fig. 3.8),which is characteristic of mesotrophic lakes;
small species of Cladocera, like Bosmina sp.(Fig. 3.9), may control the microbial food
web as top predators;very large predatory cladocerans (8-16 mm in
length), like Leptodora kindtii (Fig. 3.10)or Bythotrephes sp., can significantly reduce
zooplankton population biomass by 50-60% dueto their intensive consumption rates;
Cladocerans have simple life cycles with par-tenogenetic reproduction through most of
the year with no larval stages. Neonates aremorphologically similar to adults.
Copepodapelagic copepods belong to the two suborders
Calanoida and Cyclopoida and occur both inthe sea and in fresh waters. Most of the spe-
cies are herbivorous (mainly Calanoida), al-though there are also some predatory and
parasitic Copepoda.different dominance patterns are often obse-
rved along trophic gradients: calanoid cope-pods reach their highest biomass levels in
oligotrophic lakes and cyclopoid copepodsin eutrophic lakes.
they are characterized by a complicated lifecycle: obligate sexuality, larval nauplius sta-
ges and subadult copepodid stages.
Fig. 3.10Leptodora kindi
(photo: A. Wojtal)
Fig. 3.8Daphnia longispina
(photo: A. Wojtal)
Fig. 3.9Bosmina coregoni
(photo: A. Wojtal)
Fig. 3.6Keratella
taurocephala(photo: A. Wojtal)
Fig. 3.7Asplanacha sp.
(photo: A. Wojtal)
VwerySmatrBook03.p65 2004-06-17, 17:1938
39
FISHTeleost fish are represented by about 20 000 spe-
cies, which means that nearly half of all vertebra-te species are fish. Fresh waters are inhabited by
approximately 41% of all fish species (Wootton,1990). Freshwater fish show multi-adaptations for li-
ving in highly variable habitats, utilizing all availablefood sources by means detritivory via herbivory to in-
sectivory and piscivory (Box 3.2). Many are key majorspecies in lakes and reservoirs, influencing their func-
tioning and dynamics.In many countries freshwater fish are of great
importance as a source of food, but in recent yearsthey also serve as a biomanipulation tool for im-
proving water quality by changing the biotic struc-ture of ecosystems. To achieve this goal, proper
fish stock management based on a thorough know-ledge of fish biology and ecology is required.
Depending on the position of a given fish speciesin the trophic structure of a ecosystem, it may
play a positive or negative role in regulating wa-ter quality. Many piscivorous fish control zooplank-
tivorous fish reducing greezing preassure on zoo-plankton, thus can indirectly reduce algal blooms.On the other hand herbivorous fish by consuption
Introduction: Basic Concepts & D
efinitions
of macrophytes and algae return readily availablenutrients (up to 90%) to water and intensify algal
blooms.To promote a strong and vital population of fish
species favourable for lakes and reservoirs, onecan utilize the inherent properties of the ecosys-
tem, e.g., the dependence of spawning success ofgiven fish species on the availability of spawning
grounds, which in nature is highly influenced bythe hydrological regime. Water level manipulation
in a reservoir in order to regulate fish spawningsuccess is a good example of an activity based on
this principle (Zalewski et al., 1990).
Fig. 3.11Pikepearch
(photo: Z. Kaczkowski)
VwerySmatrBook03.p65 2004-06-17, 17:1939
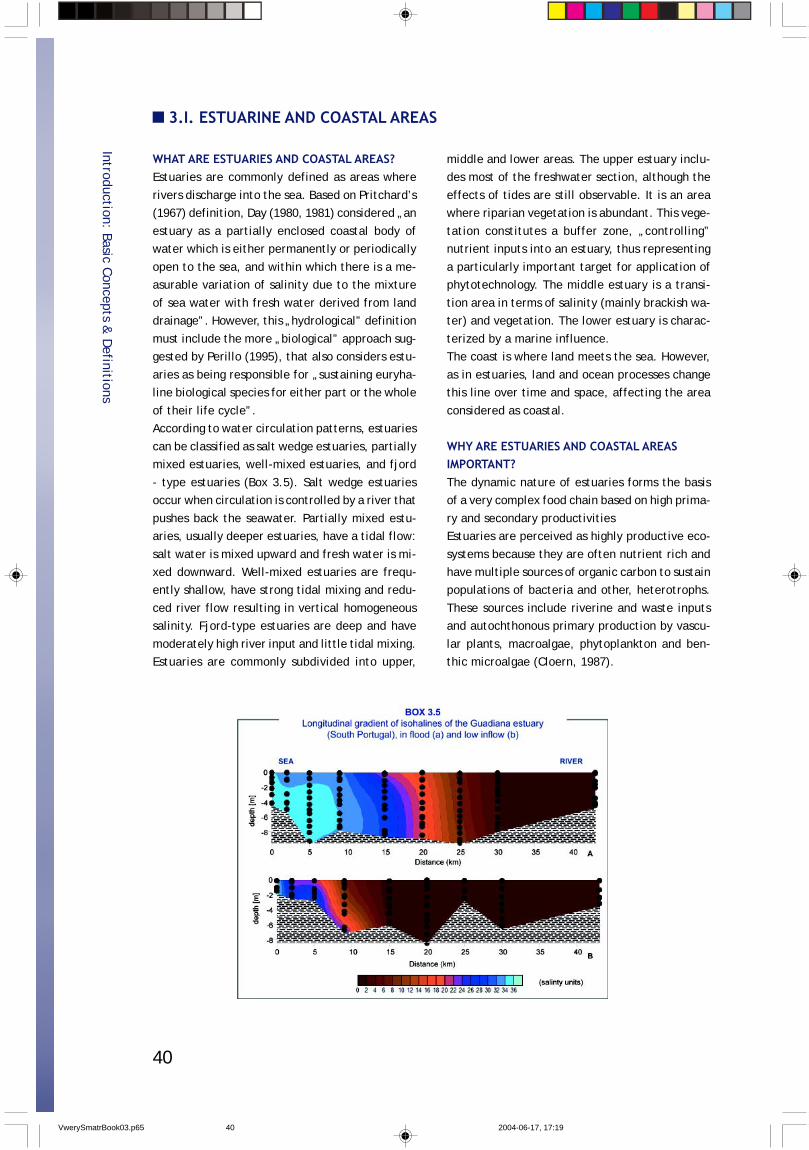
40
3.I. ESTUARINE AND COASTAL AREAS
Introduction: Basic Concepts & D
efinitions
WHAT ARE ESTUARIES AND COASTAL AREAS?Estuaries are commonly defined as areas where
rivers discharge into the sea. Based on Pritchard’s(1967) definition, Day (1980, 1981) considered „an
estuary as a partially enclosed coastal body ofwater which is either permanently or periodically
open to the sea, and within which there is a me-asurable variation of salinity due to the mixture
of sea water with fresh water derived from landdrainage”. However, this „hydrological” definition
must include the more „biological” approach sug-gested by Perillo (1995), that also considers estu-
aries as being responsible for „sustaining euryha-line biological species for either part or the whole
of their life cycle”.According to water circulation patterns, estuaries
can be classified as salt wedge estuaries, partiallymixed estuaries, well-mixed estuaries, and fjord
- type estuaries (Box 3.5). Salt wedge estuariesoccur when circulation is controlled by a river that
pushes back the seawater. Partially mixed estu-aries, usually deeper estuaries, have a tidal flow:
salt water is mixed upward and fresh water is mi-xed downward. Well-mixed estuaries are frequ-ently shallow, have strong tidal mixing and redu-
ced river flow resulting in vertical homogeneoussalinity. Fjord-type estuaries are deep and have
moderately high river input and little tidal mixing.Estuaries are commonly subdivided into upper,
middle and lower areas. The upper estuary inclu-des most of the freshwater section, although the
effects of tides are still observable. It is an areawhere riparian vegetation is abundant. This vege-
tation constitutes a buffer zone, „controlling”nutrient inputs into an estuary, thus representing
a particularly important target for application ofphytotechnology. The middle estuary is a transi-
tion area in terms of salinity (mainly brackish wa-ter) and vegetation. The lower estuary is charac-
terized by a marine influence.The coast is where land meets the sea. However,
as in estuaries, land and ocean processes changethis line over time and space, affecting the area
considered as coastal.
WHY ARE ESTUARIES AND COASTAL AREASIMPORTANT?The dynamic nature of estuaries forms the basisof a very complex food chain based on high prima-
ry and secondary productivitiesEstuaries are perceived as highly productive eco-
systems because they are often nutrient rich andhave multiple sources of organic carbon to sustainpopulations of bacteria and other, heterotrophs.
These sources include riverine and waste inputsand autochthonous primary production by vascu-
lar plants, macroalgae, phytoplankton and ben-thic microalgae (Cloern, 1987).
VwerySmatrBook03.p65 2004-06-17, 17:1940
41
Sediments in the water column, of organic andinorganic origins, can be trapped in a strong upstre-
am bottom flow and forced into the Maximum Tur-bidity Zone (MTZ). This occurrence affects the
structure and functioning of the microbial com-munity, may be limiting to photosynthesis (suspen-
ded particulate matter > 50 mg L-1), contributes tothe increase of heteretrophic processes and re-
sults in the degradation of organic material, whatmay lead to depletion of oxygen concentrations.
In this zone the transition between freshwater andmarine environments occurs. Phytoplankton and
bacterioplankton transported down a river willexperience salt stress. The freshwater microbial
population will lyse and die in this zone.The composition and spatial distribution of groups
of organisms like phytoplankton, zooplankton andbenthic invertebrates in estuaries are primarily
regulated by salinity and only secondarily by ha-bitat factors, such as sediment structure and
depth. Due to their ability to osmotically regula-te, fishes are less affected by salinity changes.
Estuaries are also important nursery areas for se-veral invertebrate and fish species. Protectionagainst predators and loss by outwelling currents
increases success of larval development and re-cruitment. River discharge and the consequent ri-
ver plume, associated with tides, export estuari-ne nutrients and organisms to coastal areas, en-
hancing coastal food web dynamics, supportingcoastal fisheries and contributing to global ocean
productivity.The structure, broad range and biodiversity of
coastal habitats provides a large number of ecolo-gical tools and services, such as storage and cyc-
ling of nutrients, filtration of pollutants from in-land freshwater systems, and protection from ero-
sion and storms. Coral reefs, mangroves, tidalwetlands, seagrasses, estuaries and a variety of
other habitats, each provides its own distinct go-ods and services and faces different pressures.
Human modification on shorelines changes currentsand sediment loading, affecting coastlines and
habitats in some areas.
WHY ARE ESTUARIES AND COASTAL AREASCONSIDERED SUSCEPTIBLE?Many coastal areas are ecologically productive,biologically diverse and climatically and physical-
ly attractive and, therefore, are preferred placesfor the settlement of human populations. Thus,
estuaries and coastal areas became the final re-ceptacles of innumerous human and natural fac-
tors from land, riverine and oceanic origins.In the last century, development of cities with
millions of people on estuarine margins contribu-ted to the massive destruction of vegetation co-
ver and other habitats. Cumulatively, constructionof river diversions (barrages, dams, etc) aimed to
provide enough fresh water for human consump-tion and uses, affects water quality and quantity
in estuaries and coastal areas. This human migra-tion to the coast occured both in developed and
developing countries. The resulting stress has be-come apparent as populations increase, watersheds
are deforested and fisheries are over exploited.Considering the expected human population
growth and the increasing need for food, waterand space, pressure on estuaries and coastal are-as will continue to rise. The consequences could
be aggravated under predicted global changes andsea-level rise scenarios.
WHAT FACTORS INFLUENCE ESTUARIESAND COASTAL AREAS?Estuaries and coastal areas are affected by both
continental and oceanic factors, from exogenousand endogenous origins. As noted above, conti-
nental (land and river) originating factors and pro-cesses (e.g., run-off, changes in riverine dischar-
ges, changes in agricultural practices, etc.) af-fect estuaries and coastal areas. Moreover, oce-
anographic factors and processes (e.g., longshoreor upwelling currents) also influence water cha-
racteristics and affect coastal biological commu-nities and sediment composition and distribution.
Endogenous fluctuations in estuarine and coastalcommunities are expected, for example, as a re-
sult from seasonal reproductive cycles. Exogeno-us impacts caused by anthropogenic activities
(e.g., water canalization, pollution, destructionof riparian and salt-marsh vegetation or construc-
Introduction: Basic Concepts & D
efinitions
VwerySmatrBook03.p65 2004-06-17, 17:1941
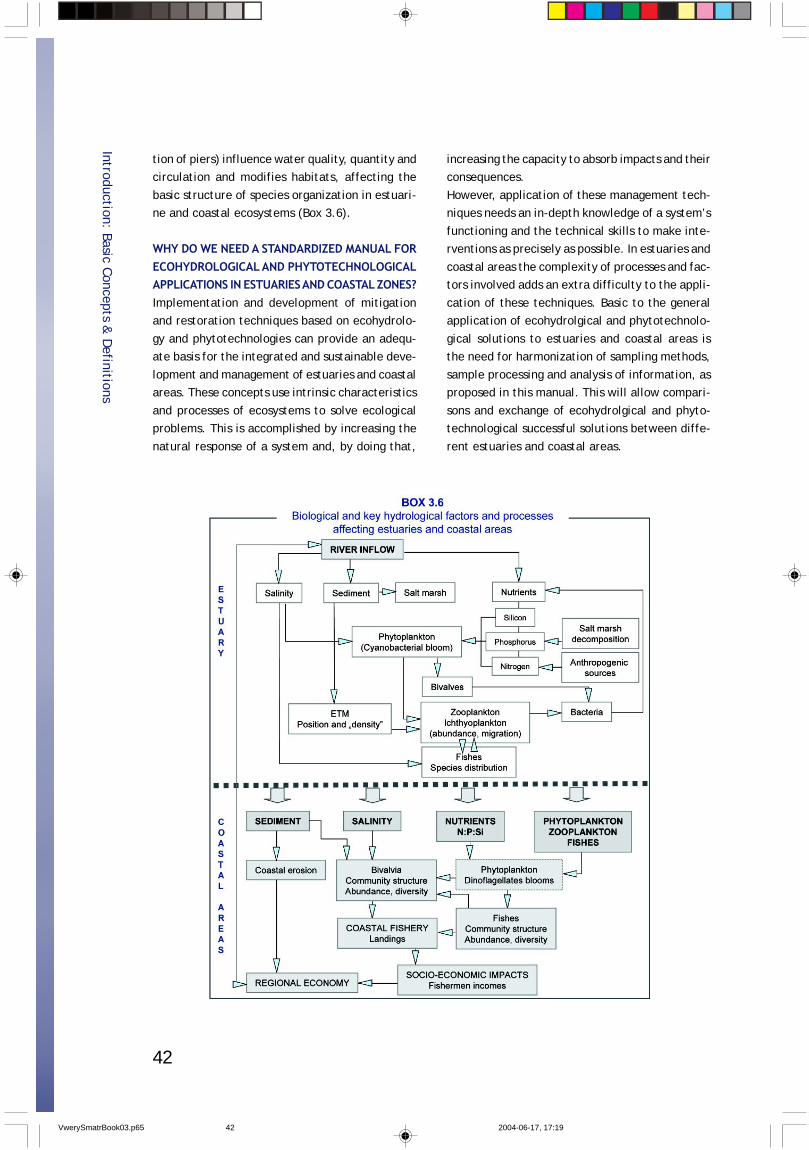
42
tion of piers) influence water quality, quantity andcirculation and modifies habitats, affecting the
basic structure of species organization in estuari-ne and coastal ecosystems (Box 3.6).
WHY DO WE NEED A STANDARDIZED MANUAL FORECOHYDROLOGICAL AND PHYTOTECHNOLOGICALAPPLICATIONS IN ESTUARIES AND COASTAL ZONES?Implementation and development of mitigationand restoration techniques based on ecohydrolo-
gy and phytotechnologies can provide an adequ-ate basis for the integrated and sustainable deve-
lopment and management of estuaries and coastalareas. These concepts use intrinsic characteristics
and processes of ecosystems to solve ecologicalproblems. This is accomplished by increasing the
natural response of a system and, by doing that,
increasing the capacity to absorb impacts and theirconsequences.
However, application of these management tech-niques needs an in-depth knowledge of a system’s
functioning and the technical skills to make inte-rventions as precisely as possible. In estuaries and
coastal areas the complexity of processes and fac-tors involved adds an extra difficulty to the appli-
cation of these techniques. Basic to the generalapplication of ecohydrolgical and phytotechnolo-
gical solutions to estuaries and coastal areas isthe need for harmonization of sampling methods,
sample processing and analysis of information, asproposed in this manual. This will allow compari-
sons and exchange of ecohydrolgical and phyto-technological successful solutions between diffe-
rent estuaries and coastal areas.
Introduction: Basic Concepts & D
efinitions
VwerySmatrBook03.p65 2004-06-17, 17:1942

43
VwerySmatrBook03.p65 2004-06-17, 17:2343

44
VwerySmatrBook03.p65 2004-06-17, 17:2344
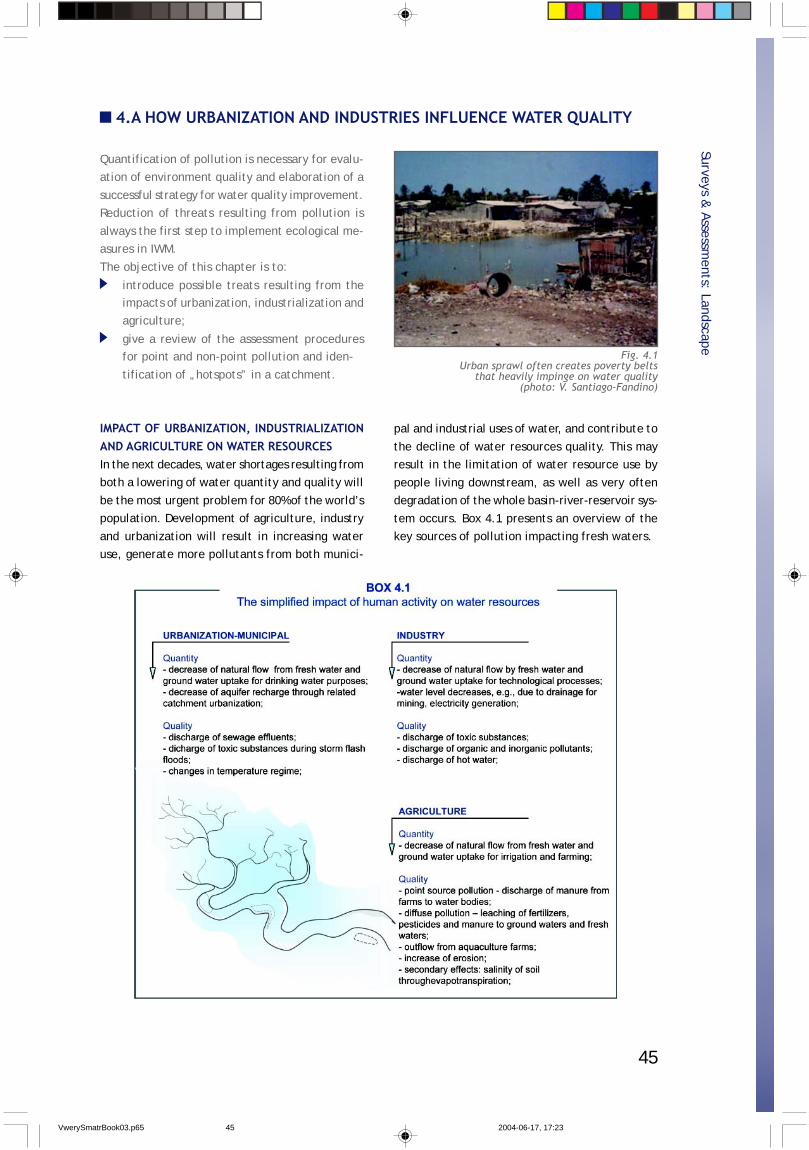
45
Surveys & Assessm
ents: Landscape 4.A HOW URBANIZATION AND INDUSTRIES INFLUENCE WATER QUALITY
Quantification of pollution is necessary for evalu-ation of environment quality and elaboration of a
successful strategy for water quality improvement.Reduction of threats resulting from pollution is
always the first step to implement ecological me-asures in IWM.
The objective of this chapter is to:
introduce possible treats resulting from theimpacts of urbanization, industrialization andagriculture;
give a review of the assessment proceduresfor point and non-point pollution and iden-
tification of „hotspots” in a catchment.
IMPACT OF URBANIZATION, INDUSTRIALIZATIONAND AGRICULTURE ON WATER RESOURCES
pal and industrial uses of water, and contribute to
the decline of water resources quality. This mayresult in the limitation of water resource use by
people living downstream, as well as very oftendegradation of the whole basin-river-reservoir sys-
tem occurs. Box 4.1 presents an overview of thekey sources of pollution impacting fresh waters.
In the next decades, water shortages resulting fromboth a lowering of water quantity and quality will
be the most urgent problem for 80% of the world’spopulation. Development of agriculture, industry
and urbanization will result in increasing wateruse, generate more pollutants from both munici-
Fig. 4.1Urban sprawl often creates poverty belts
that heavily impinge on water quality(photo: V. Santiago-Fandino)
VwerySmatrBook03.p65 2004-06-17, 17:2345
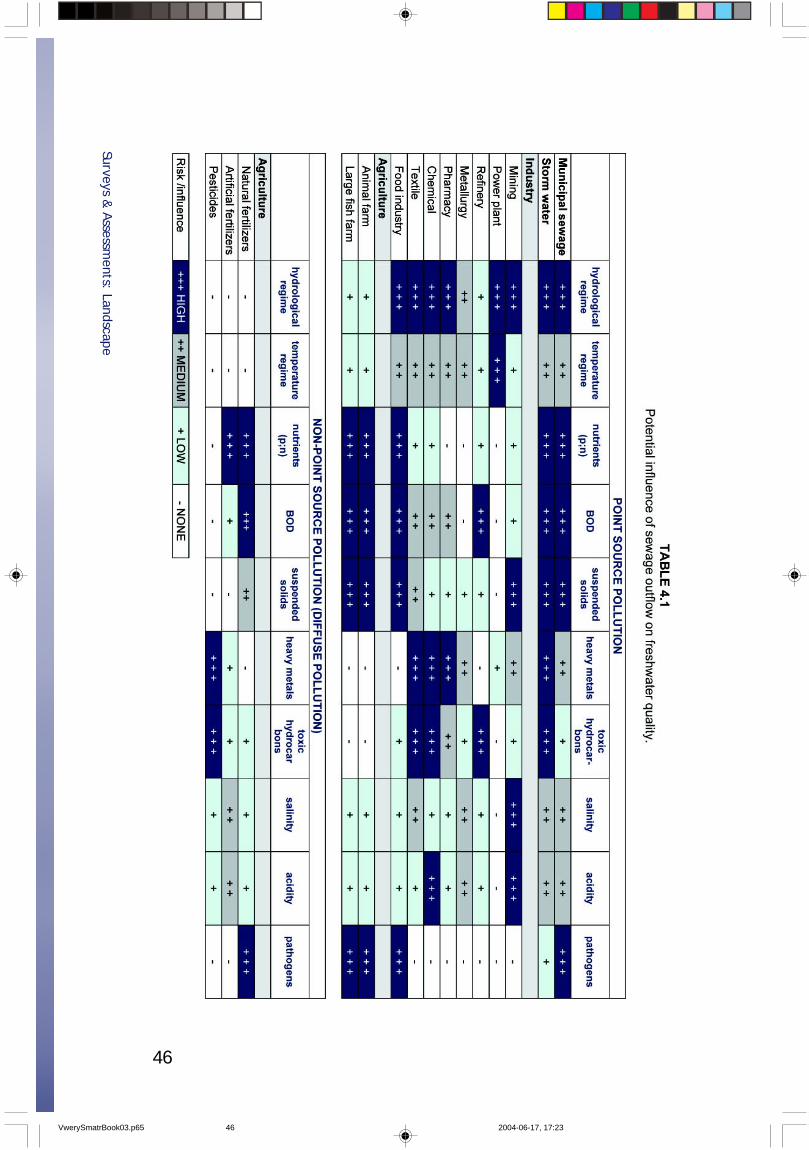
46
Surveys & Assessm
ents: Landscape
VwerySmatrBook03.p65 2004-06-17, 17:2346
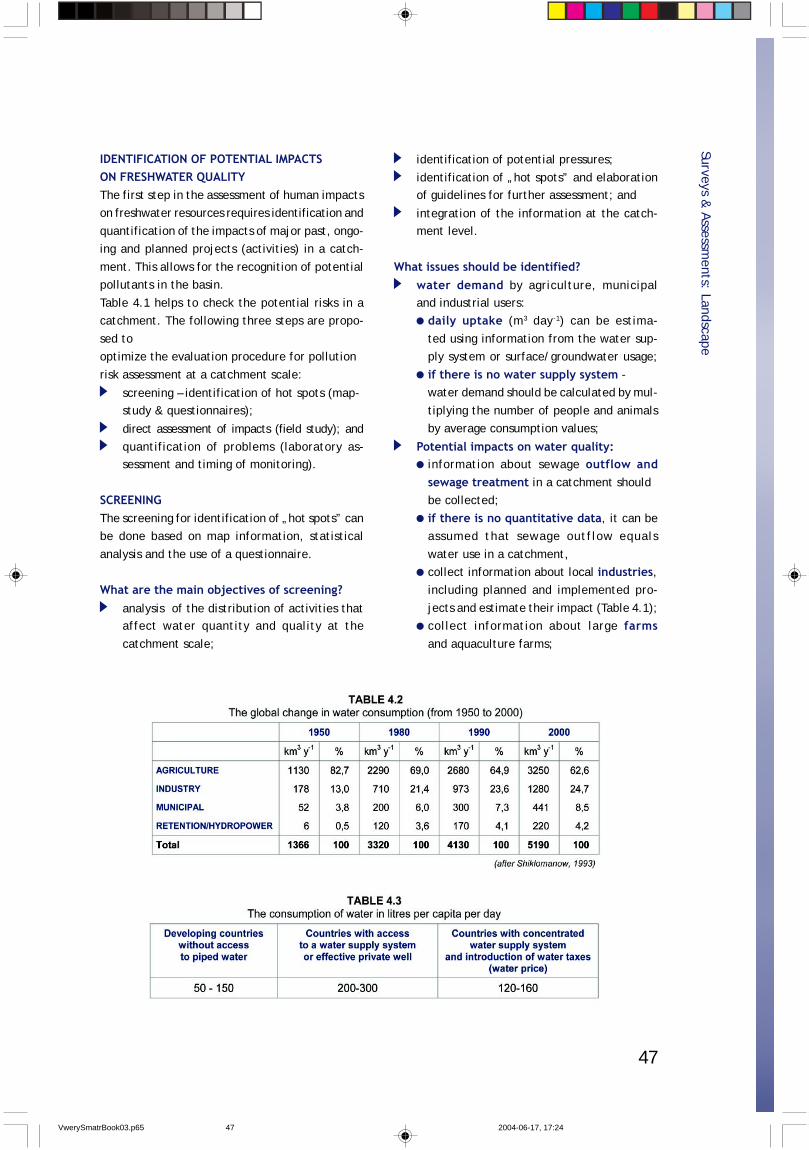
47
IDENTIFICATION OF POTENTIAL IMPACTSON FRESHWATER QUALITYThe first step in the assessment of human impactson freshwater resources requires identification and
quantification of the impacts of major past, ongo-ing and planned projects (activities) in a catch-
ment. This allows for the recognition of potentialpollutants in the basin.
Table 4.1 helps to check the potential risks in acatchment. The following three steps are propo-
sed tooptimize the evaluation procedure for pollution
risk assessment at a catchment scale:
screening – identification of hot spots (map-study & questionnaires);
direct assessment of impacts (field study); andquantification of problems (laboratory as-sessment and timing of monitoring).
SCREENINGThe screening for identification of „hot spots” canbe done based on map information, statistical
analysis and the use of a questionnaire.
What are the main objectives of screening?analysis of the distribution of activities thataffect water quantity and quality at the
catchment scale;
identification of potential pressures;
identification of „hot spots” and elaborationof guidelines for further assessment; and
integration of the information at the catch-ment level.
What issues should be identified?water demand by agriculture, municipaland industrial users:
daily uptake (m3 day-1) can be estima-
ted using information from the water sup-ply system or surface/groundwater usage;
if there is no water supply system -water demand should be calculated by mul-
tiplying the number of people and animalsby average consumption values;
Potential impacts on water quality:information about sewage outflow andsewage treatment in a catchment shouldbe collected;
if there is no quantitative data, it can beassumed that sewage outflow equals
water use in a catchment,collect information about local industries,including planned and implemented pro-
jects and estimate their impact (Table 4.1);collect information about large farmsand aquaculture farms;
Surveys & Assessm
ents: Landscape
VwerySmatrBook03.p65 2004-06-17, 17:2447
48
calculate the number of cows, sheepand pigs per 100 ha of agriculture land and
identify regions with high impermeableareas, especially in urbanized regions.
Make aggregations of your informationand mark „hotspots” on maps of 1:50 000
or 1:100 000 resolution for catchmentssmaller then 100 km2, and 1:500 000 for
catchments greater than 100 km2.
DIRECT ASSESSMENT OF IMPACTAfter identification of „hotspots” the
assessment should be continued in the fieldaccording to the following steps:
establishing monitoring stations:for point source pollution set at least
three stations, located at:- outflow of sewage;
- 100-1000 m upstream of the inflow; and- 100-1000 m downstream depending on
river width.for diffuse pollution:- at least two stations should be chosen
based on a land-use map and for riversections of between 10 to 50 km.
as a first step, conduct simple fieldmeasurements at the identified stations
at times of low and high discharge andtaking into account the timing of sewage
discharge:physical measurements such as:
temperature, O2 concentration, pH,conductivity, salinity;
preliminary chemical measurementsshould be considered;
use of bioassessment methods that willgive an indication of the possible toxic
effect of the sewage inflow (for moreinformation - see chapter 7.D);
use biomonitoring methods (e.g., macroin-vertebrates, macrophytes, fish) to check
the effect of sewage inflow on a river ecosystem (for more information - see
chapter 6.A);
compare the data for upstream anddownstream stations. If differences aregreater than 20% in the measured values,
contacting a professional laboratory tofocus on the problem should be
considered.
The timing of monitoring is important, especiallyif you have information about illegal sewage in-
flows and stormwater pollutants (dilution effectsalter very high concentrations of pollutants).
QUANTIFICATION OF THE PROBLEMThe preliminary issues identified during thedirect assessment of impacts should be further
specified by chemical analysis made in aprofessional laboratory. Water samples for
laboratory study (1-5 litres) should be collectedat each study station.
the water should be taken from the maincourse of a river. If the river is more then
10 m wide, an integrated sample should becollected by mixing equal volumes of water
from every 10-20 m of the cross section;
transport the samples to the laboratoryor use field equipment to make analyses
standardize the system; andthe basic parameters that should bedetermined include: BOD5, Total SuspendedSolids (TSS), Organic Suspended Mater (OSM),
Coliform index, NH4-N, NO2-N, NO3-N, N tot,PO4-P, P tot, TOC;
To quantify the impact of pollution on water qu-
ality, compare the obtained data with data fromnon-impacted (reference) sites. The data can be
compared to regional standards for water quality.
To have a complete picture for formulating amanagement strategy and identification of „hot
spots” in the catchment, aggregation of all theabove information can be made by using one
of the following systems:
GIS (see chapter 4.B);
hydrochemical profiles of a river; anduse of water quality indexes.
Surveys & Assessm
ents: Landscape
VwerySmatrBook03.p65 2004-06-17, 17:2448
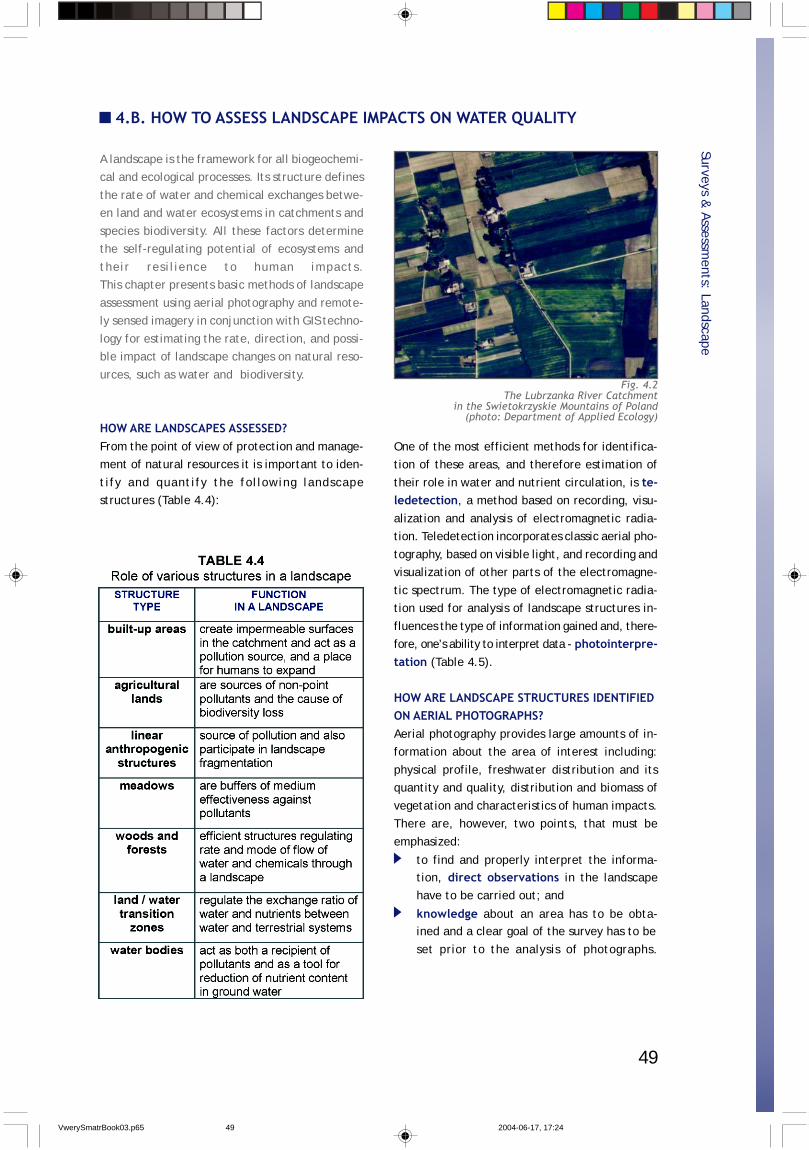
49
A landscape is the framework for all biogeochemi-cal and ecological processes. Its structure defines
the rate of water and chemical exchanges betwe-en land and water ecosystems in catchments and
species biodiversity. All these factors determinethe self-regulating potential of ecosystems and
their resilience to human impacts.This chapter presents basic methods of landscape
assessment using aerial photography and remote-ly sensed imagery in conjunction with GIS techno-
logy for estimating the rate, direction, and possi-ble impact of landscape changes on natural reso-
urces, such as water and biodiversity.
HOW ARE LANDSCAPES ASSESSED?From the point of view of protection and manage-ment of natural resources it is important to iden-
tify and quantify the following landscapestructures (Table 4.4):
4.B. HOW TO ASSESS LANDSCAPE IMPACTS ON WATER QUALITY
One of the most efficient methods for identifica-tion of these areas, and therefore estimation of
their role in water and nutrient circulation, is te-ledetection, a method based on recording, visu-
alization and analysis of electromagnetic radia-tion. Teledetection incorporates classic aerial pho-
tography, based on visible light, and recording andvisualization of other parts of the electromagne-
tic spectrum. The type of electromagnetic radia-tion used for analysis of landscape structures in-
fluences the type of information gained and, there-fore, one’s ability to interpret data - photointerpre-tation (Table 4.5).
HOW ARE LANDSCAPE STRUCTURES IDENTIFIEDON AERIAL PHOTOGRAPHS?Aerial photography provides large amounts of in-formation about the area of interest including:
physical profile, freshwater distribution and itsquantity and quality, distribution and biomass of
vegetation and characteristics of human impacts.There are, however, two points, that must be
emphasized:
to find and properly interpret the informa-tion, direct observations in the landscapehave to be carried out; and
knowledge about an area has to be obta-ined and a clear goal of the survey has to be
set prior to the analysis of photographs.
Surveys & Assessm
ents: Landscape
Fig. 4.2The Lubrzanka River Catchment
in the Swietokrzyskie Mountains of Poland(photo: Department of Applied Ecology)
VwerySmatrBook03.p65 2004-06-17, 17:2449
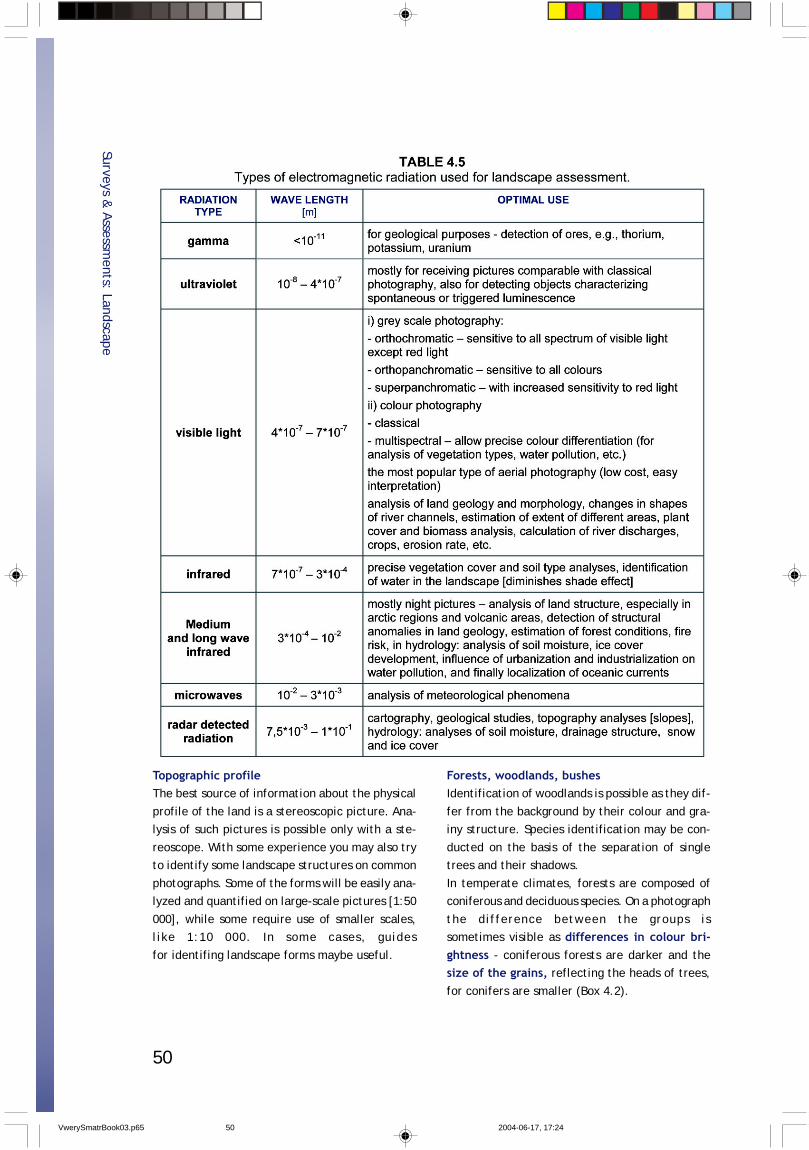
50
Topographic profileThe best source of information about the physical
profile of the land is a stereoscopic picture. Ana-lysis of such pictures is possible only with a ste-
reoscope. With some experience you may also tryto identify some landscape structures on common
photographs. Some of the forms will be easily ana-lyzed and quantified on large-scale pictures [1:50
000], while some require use of smaller scales,like 1:10 000. In some cases, guides
for identifing landscape forms maybe useful.
Forests, woodlands, bushesIdentification of woodlands is possible as they dif-
fer from the background by their colour and gra-iny structure. Species identification may be con-
ducted on the basis of the separation of singletrees and their shadows.
In temperate climates, forests are composed ofconiferous and deciduous species. On a photograph
the difference between the groups issometimes visible as differences in colour bri-ghtness - coniferous forests are darker and thesize of the grains, reflecting the heads of trees,
for conifers are smaller (Box 4.2).
Surveys & Assessm
ents: Landscape
VwerySmatrBook03.p65 2004-06-17, 17:2450
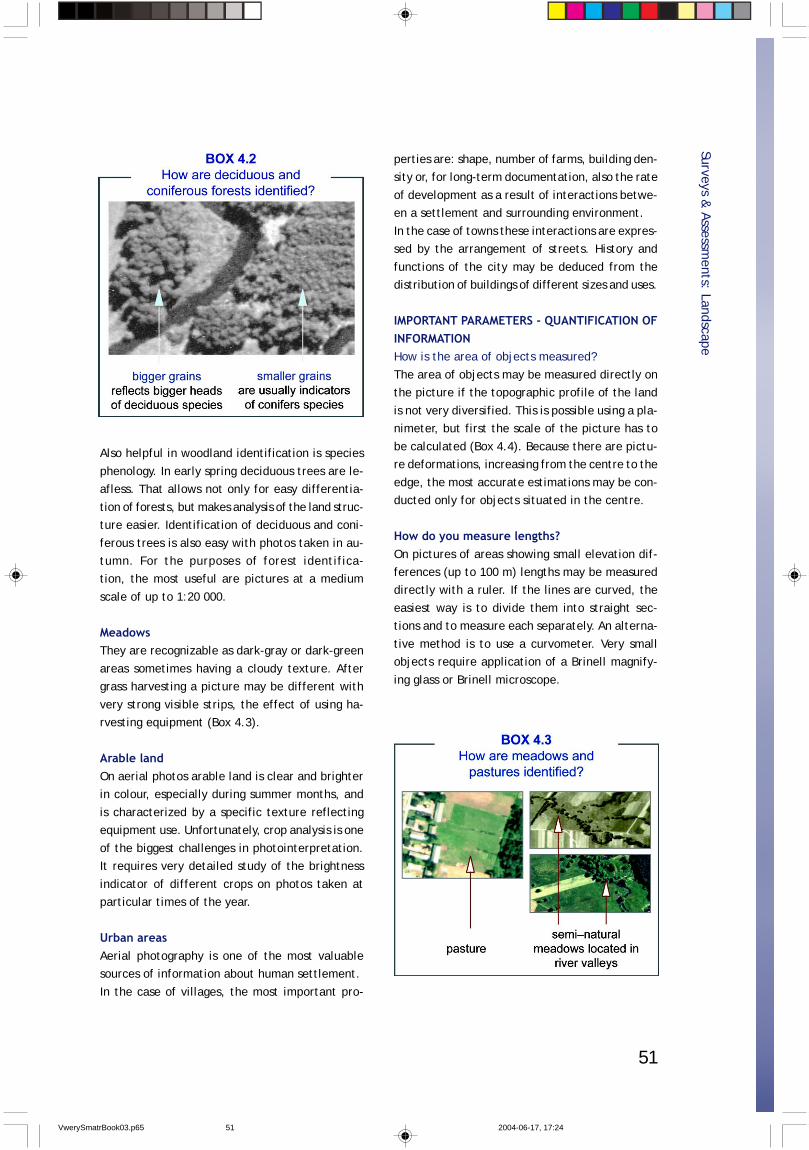
51
Also helpful in woodland identification is species
phenology. In early spring deciduous trees are le-afless. That allows not only for easy differentia-
tion of forests, but makes analysis of the land struc-ture easier. Identification of deciduous and coni-
ferous trees is also easy with photos taken in au-tumn. For the purposes of forest identifica-tion, the most useful are pictures at a medium
scale of up to 1:20 000.
MeadowsThey are recognizable as dark-gray or dark-green
areas sometimes having a cloudy texture. Aftergrass harvesting a picture may be different with
very strong visible strips, the effect of using ha-rvesting equipment (Box 4.3).
Arable landOn aerial photos arable land is clear and brighterin colour, especially during summer months, and
is characterized by a specific texture reflectingequipment use. Unfortunately, crop analysis is one
of the biggest challenges in photointerpretation.It requires very detailed study of the brightness
indicator of different crops on photos taken atparticular times of the year.
Urban areasAerial photography is one of the most valuablesources of information about human settlement.
In the case of villages, the most important pro-
perties are: shape, number of farms, building den-sity or, for long-term documentation, also the rate
of development as a result of interactions betwe-en a settlement and surrounding environment.
In the case of towns these interactions are expres-sed by the arrangement of streets. History and
functions of the city may be deduced from thedistribution of buildings of different sizes and uses.
IMPORTANT PARAMETERS - QUANTIFICATION OFINFORMATIONHow is the area of objects measured?
The area of objects may be measured directly onthe picture if the topographic profile of the land
is not very diversified. This is possible using a pla-nimeter, but first the scale of the picture has to
be calculated (Box 4.4). Because there are pictu-re deformations, increasing from the centre to the
edge, the most accurate estimations may be con-ducted only for objects situated in the centre.
How do you measure lengths?On pictures of areas showing small elevation dif-ferences (up to 100 m) lengths may be measureddirectly with a ruler. If the lines are curved, the
easiest way is to divide them into straight sec-tions and to measure each separately. An alterna-
tive method is to use a curvometer. Very smallobjects require application of a Brinell magnify-
ing glass or Brinell microscope.
Surveys & Assessm
ents: Landscape
VwerySmatrBook03.p65 2004-06-17, 17:2451
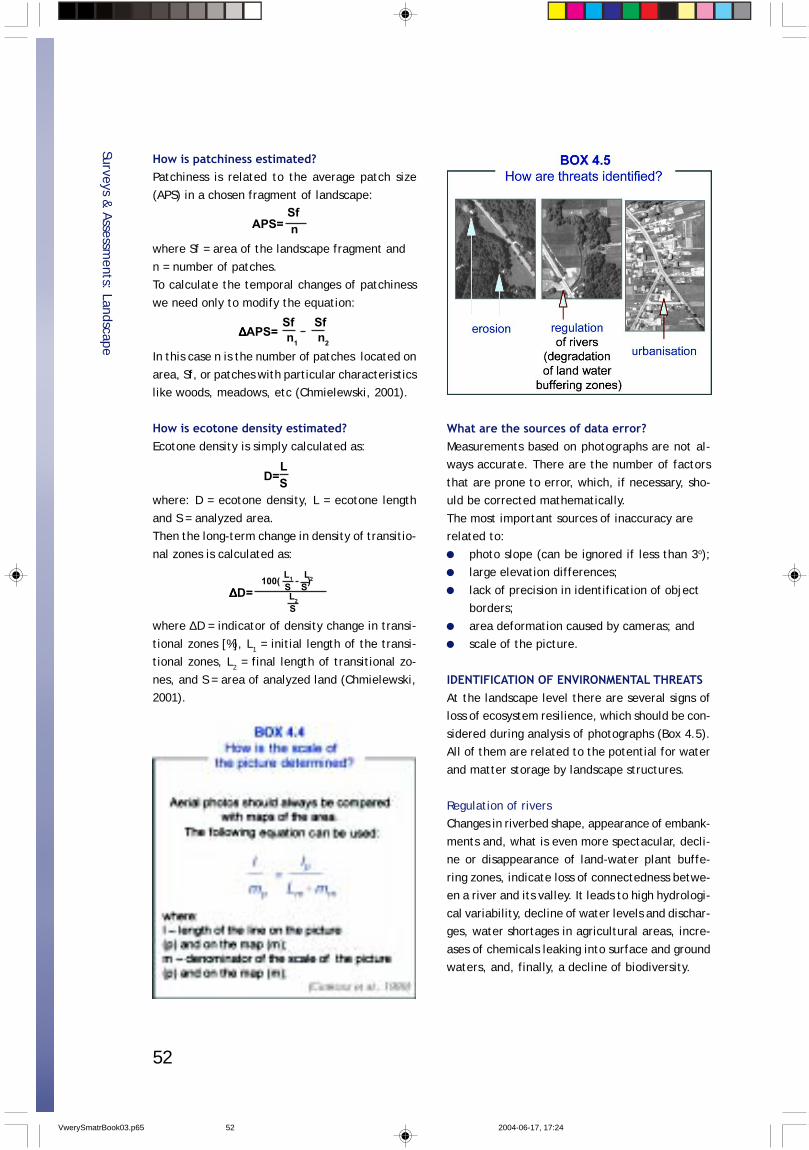
52
How is patchiness estimated?Patchiness is related to the average patch size
(APS) in a chosen fragment of landscape:
where Sf = area of the landscape fragment and
n = number of patches.To calculate the temporal changes of patchiness
we need only to modify the equation:
In this case n is the number of patches located on
area, Sf, or patches with particular characteristicslike woods, meadows, etc (Chmielewski, 2001).
How is ecotone density estimated?Ecotone density is simply calculated as:
where: D = ecotone density, L = ecotone length
and S = analyzed area.Then the long-term change in density of transitio-
nal zones is calculated as:
where ∆D = indicator of density change in transi-
tional zones [%], L1 = initial length of the transi-tional zones, L2 = final length of transitional zo-
nes, and S = area of analyzed land (Chmielewski,2001).Surveys &
Assessments: Landscape
What are the sources of data error?Measurements based on photographs are not al-ways accurate. There are the number of factors
that are prone to error, which, if necessary, sho-uld be corrected mathematically.
The most important sources of inaccuracy arerelated to:
photo slope (can be ignored if less than 3o);large elevation differences;
lack of precision in identification of objectborders;
area deformation caused by cameras; andscale of the picture.
IDENTIFICATION OF ENVIRONMENTAL THREATSAt the landscape level there are several signs ofloss of ecosystem resilience, which should be con-
sidered during analysis of photographs (Box 4.5).All of them are related to the potential for water
and matter storage by landscape structures.
Regulation of riversChanges in riverbed shape, appearance of embank-
ments and, what is even more spectacular, decli-ne or disappearance of land-water plant buffe-
ring zones, indicate loss of connectedness betwe-en a river and its valley. It leads to high hydrologi-
cal variability, decline of water levels and dischar-ges, water shortages in agricultural areas, incre-
ases of chemicals leaking into surface and groundwaters, and, finally, a decline of biodiversity.
APS=Sfn
∆∆∆∆∆APS=Sf Sfn1 n2
D=LS
100( )∆∆∆∆∆D=
L1 L2
S SL2S
VwerySmatrBook03.p65 2004-06-17, 17:2452
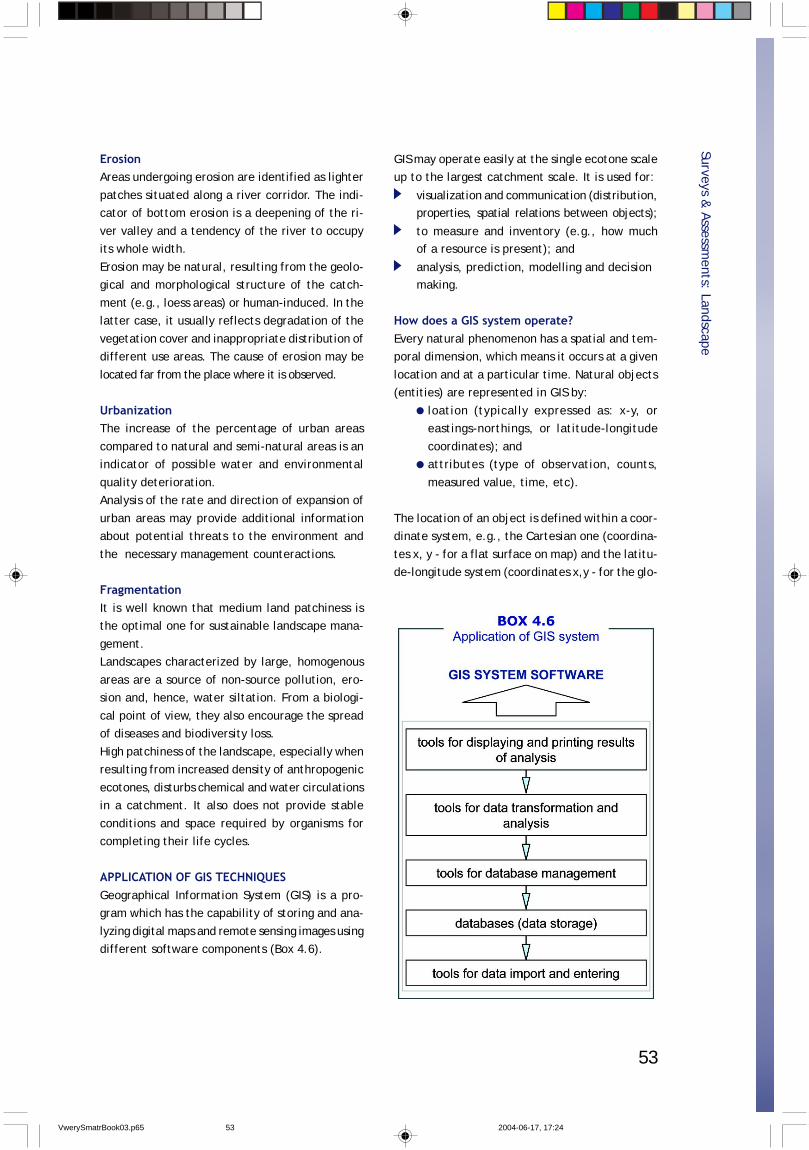
53
ErosionAreas undergoing erosion are identified as lighter
patches situated along a river corridor. The indi-cator of bottom erosion is a deepening of the ri-
ver valley and a tendency of the river to occupyits whole width.
Erosion may be natural, resulting from the geolo-gical and morphological structure of the catch-
ment (e.g., loess areas) or human-induced. In thelatter case, it usually reflects degradation of the
vegetation cover and inappropriate distribution ofdifferent use areas. The cause of erosion may be
located far from the place where it is observed.
UrbanizationThe increase of the percentage of urban areas
compared to natural and semi-natural areas is anindicator of possible water and environmental
quality deterioration.Analysis of the rate and direction of expansion of
urban areas may provide additional informationabout potential threats to the environment and
the necessary management counteractions.
FragmentationIt is well known that medium land patchiness isthe optimal one for sustainable landscape mana-
gement.Landscapes characterized by large, homogenous
areas are a source of non-source pollution, ero-sion and, hence, water siltation. From a biologi-
cal point of view, they also encourage the spreadof diseases and biodiversity loss.
High patchiness of the landscape, especially whenresulting from increased density of anthropogenic
ecotones, disturbs chemical and water circulationsin a catchment. It also does not provide stable
conditions and space required by organisms forcompleting their life cycles.
APPLICATION OF GIS TECHNIQUESGeographical Information System (GIS) is a pro-gram which has the capability of storing and ana-
lyzing digital maps and remote sensing images usingdifferent software components (Box 4.6).
GIS may operate easily at the single ecotone scaleup to the largest catchment scale. It is used for:
visualization and communication (distribution,properties, spatial relations between objects);
to measure and inventory (e.g., how muchof a resource is present); and
analysis, prediction, modelling and decisionmaking.
How does a GIS system operate?Every natural phenomenon has a spatial and tem-poral dimension, which means it occurs at a given
location and at a particular time. Natural objects(entities) are represented in GIS by:
loation (typically expressed as: x-y, oreastings-northings, or latitude-longitude
coordinates); andattributes (type of observation, counts,
measured value, time, etc).
The location of an object is defined within a coor-dinate system, e.g., the Cartesian one (coordina-
tes x, y - for a flat surface on map) and the latitu-de-longitude system (coordinates x,y - for the glo-
Surveys & Assessm
ents: Landscape
VwerySmatrBook03.p65 2004-06-17, 17:2453
54
be and in GPS (satellite positioning systems). Datadescribed in orthogonal cartographic coordinates
make it possible to perform cartometric calcula-tions of object length, area or volume. Attribute
data can be a name, number, class value or quali-tative description (verbal, pictorial or numerical).
Geometric representation of an object in a givencoordinate system is a point, line, or surface.
Point does not have a topological dimension,but in GIS programs it can be displayed as a
symbol (for example, sampling point, sourceof pollution).
Line is a sequence of points (segment), inwhich we may distinguish start and end po
ints and nodes at an intersection of lines.Lines can be additionally described by code.
For instance, elevation of a contour line. Li-nes may be used to represent linear featu-
res like streams, roads, and boundaries.
Surface represents two-dimensional objects(lake, forest). Three-dimensional objects are re-presented as a surface, which have an elevation
attribute (for instance, a digital terrain model).
Data visualization - analysis
In computer graphics there are two data modelsto represent the geometry of objects - vector and
raster.
Lines written in vector format may be usedto represent networks (for example, riversystem), connected lines may enclose poly-
gons or areas that are homogenous, e.g., landunit;
A raster is a regular matrix of elementarycells or pixels. The location of each pixel is
determined by the size of the grid and thepixel size or resolution. Each pixel stores the
attribute data for that particular location.Many GIS programs use both types of data formats.
Both raster and vector layers should be registeredin the same coordinate system. During registra-
tion a relationship between raster coordinates (i -row, j - column) and cartographic coordinates (x -
Surveys & Assessm
ents: Landscape
eastings, y - northings) are calculated. In hybridgraphics it is possible to perform conversions be-
tween data types called vectorization or rasteri-zation.The most common method of representing thecomplex nature of the real environment in com-
puters is to use thematic layers.Mathematical operations used for data processing
can be performed on one or many thematic lay-ers, including a third dimension written in a DTM.
Spatial data analysis can include processing ofobject attributes and/or object geometry. Arith-
metic operators (+, -, *, /, ^, sqr) are used in car-tometric calculations (distance, area, volume, di-
rection) and in processing object attributes. Rela-tional operators (=, <, >, =<, >=, <>) are used for
processing attributes and are useful for selectingcertain objects according to given criteria. Logi-
cal operators (OR, AND, NOT, NOR) are used forfinding objects belonging to many thematic layers
according to specified conditions. Statistical ope-rators are concerned mainly with attribute valu-
es. They are used to calculate, histograms, va-riance, distribution and attribute value correla-tions. More advanced methods are cluster analy-
sis, semivariogram, and econometric functions.In addition to simple operators we may perform
more complicated analyses like map overlays (cros-sing) and proximity analysis (buffer zones, network
functions). GIS is also a good environment for datapreparation for external mathematical models and
visualization of the modelling results.
DATA INTERPRETATION FOR ESTIMATIONOF LANDSCAPE SENSITIVITYThe capacity of the landscape to absorb anthro-pogenic pressures may differ due to geomorpho-
logy, precipitation pattern, structure of plant co-ver, land use and its intensity, number of inhabi-
tants, etc.
VwerySmatrBook03.p65 2004-06-17, 17:2454

55
Although there is no precise recipe for optimalland use, one can easily identify symptoms of dec-
lining landscape resistance:land fragmentation;
rapid development of urban areas;increased erosion;
water siltation;decrease of forested areas, shrubs, tree
lines; anddegradation of land/water plant buffering
zones and wetlands.
MAKE SURE TO CHECK THESE RESOURCES:
Surveys & Assessm
ents: Landscape
Identification of these processes and their quanti-fication, together with more detailed studies inc-
luding analyses of water chemistry and biota, mayallow for the elaboration of effective landscape
management strategies based on phytotechnolo-gical and ecohydrological approaches.
Guidelines: chapters 3.A-3.G, 4.A-4.E, 4.Ghttp://www.eman-rese.ca/eman/ecotools/protocols/terrestrial/vegetation/glossary.html
http://www.thewaterpage.com/aq_eco_july_01.htmhttp://rst.gsfc.nasa.gov/Front/tofc.html
http://www.esri.com/software/arcview/index.html
VwerySmatrBook03.p65 2004-06-17, 17:2455
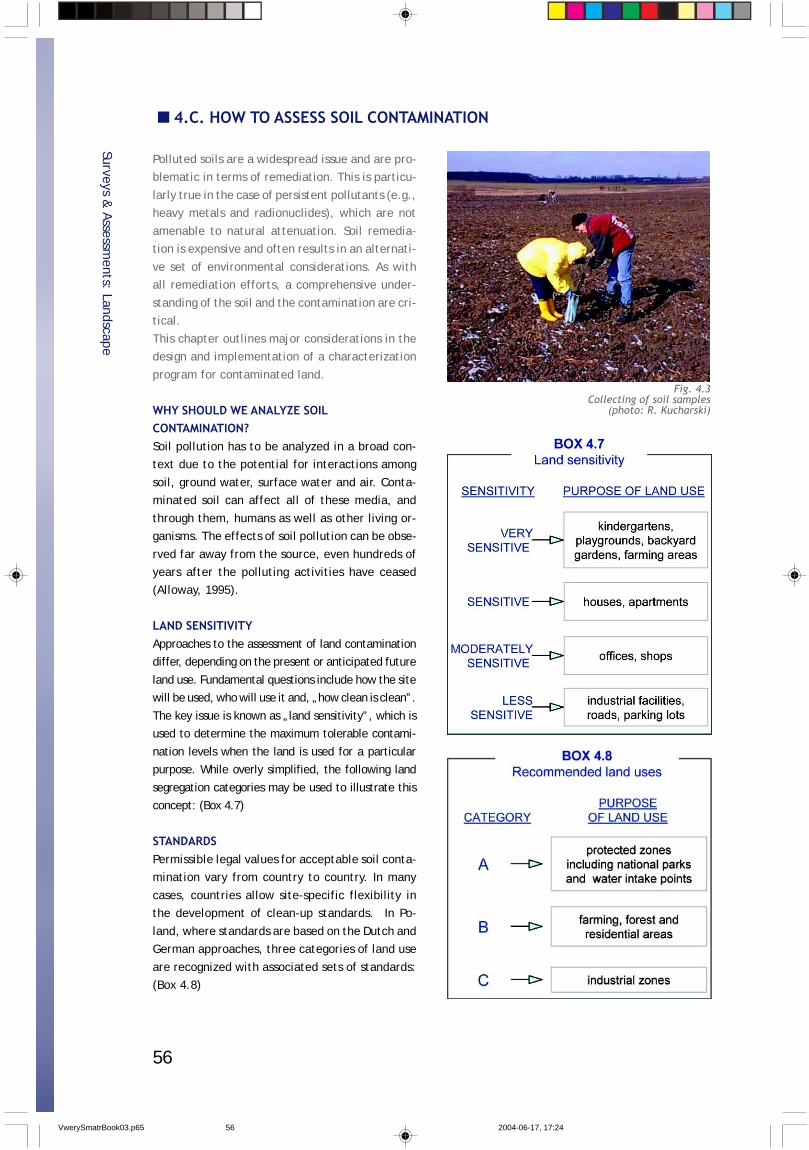
56
Polluted soils are a widespread issue and are pro-blematic in terms of remediation. This is particu-
larly true in the case of persistent pollutants (e.g.,heavy metals and radionuclides), which are not
amenable to natural attenuation. Soil remedia-tion is expensive and often results in an alternati-
ve set of environmental considerations. As withall remediation efforts, a comprehensive under-
standing of the soil and the contamination are cri-tical.
This chapter outlines major considerations in thedesign and implementation of a characterization
program for contaminated land.
WHY SHOULD WE ANALYZE SOILCONTAMINATION?Soil pollution has to be analyzed in a broad con-text due to the potential for interactions among
soil, ground water, surface water and air. Conta-minated soil can affect all of these media, and
through them, humans as well as other living or-ganisms. The effects of soil pollution can be obse-
rved far away from the source, even hundreds ofyears after the polluting activities have ceased(Alloway, 1995).
LAND SENSITIVITYApproaches to the assessment of land contaminationdiffer, depending on the present or anticipated future
land use. Fundamental questions include how the sitewill be used, who will use it and, „how clean is clean”.
The key issue is known as „land sensitivity”, which isused to determine the maximum tolerable contami-
nation levels when the land is used for a particularpurpose. While overly simplified, the following land
segregation categories may be used to illustrate thisconcept: (Box 4.7)
STANDARDSPermissible legal values for acceptable soil conta-mination vary from country to country. In many
cases, countries allow site-specific flexibility inthe development of clean-up standards. In Po-
land, where standards are based on the Dutch andGerman approaches, three categories of land use
are recognized with associated sets of standards:(Box 4.8)
4.C. HOW TO ASSESS SOIL CONTAMINATION
Surveys & Assessm
ents: Landscape
Fig. 4.3Collecting of soil samples
(photo: R. Kucharski)
VwerySmatrBook03.p65 2004-06-17, 17:2456
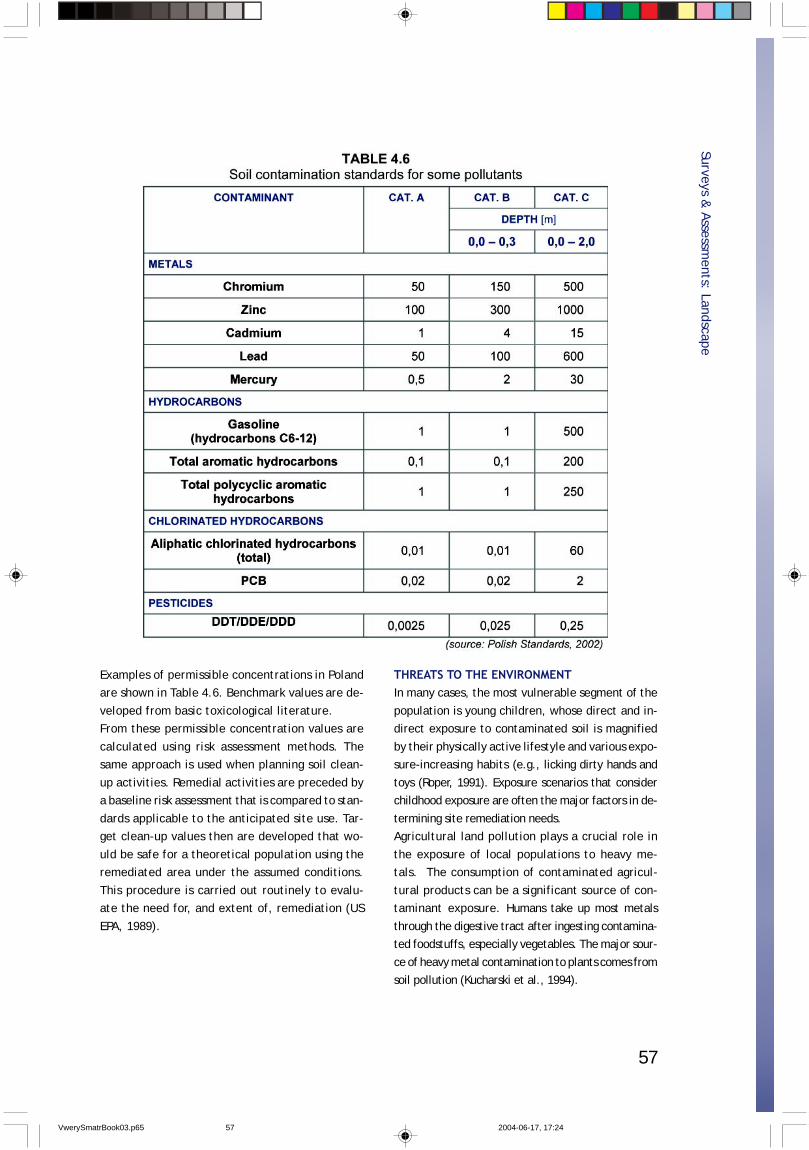
57
Examples of permissible concentrations in Polandare shown in Table 4.6. Benchmark values are de-
veloped from basic toxicological literature.From these permissible concentration values are
calculated using risk assessment methods. Thesame approach is used when planning soil clean-
up activities. Remedial activities are preceded bya baseline risk assessment that is compared to stan-
dards applicable to the anticipated site use. Tar-get clean-up values then are developed that wo-
uld be safe for a theoretical population using theremediated area under the assumed conditions.
This procedure is carried out routinely to evalu-ate the need for, and extent of, remediation (US
EPA, 1989).
THREATS TO THE ENVIRONMENTIn many cases, the most vulnerable segment of the
population is young children, whose direct and in-direct exposure to contaminated soil is magnified
by their physically active lifestyle and various expo-sure-increasing habits (e.g., licking dirty hands and
toys (Roper, 1991). Exposure scenarios that considerchildhood exposure are often the major factors in de-
termining site remediation needs.Agricultural land pollution plays a crucial role in
the exposure of local populations to heavy me-tals. The consumption of contaminated agricul-
tural products can be a significant source of con-taminant exposure. Humans take up most metals
through the digestive tract after ingesting contamina-ted foodstuffs, especially vegetables. The major sour-
ce of heavy metal contamination to plants comes fromsoil pollution (Kucharski et al., 1994).
Surveys & Assessm
ents: Landscape
VwerySmatrBook03.p65 2004-06-17, 17:2457
58
Another important exposure scenario involves siteexcavation, either for routine activities or for re-
medial purposes. Such a scenario envisions wor-kers in direct contact with subsurface soils.
BIOAVAILABILITY OF POLLUTANTS CONTAINED IN SOILSContaminants can exist in soils in a variety of che-
mical forms. These forms have varying uptake ra-tes by living organisms (bioavailability). Bioava-
ilability describes the ability of a specific chemi-cal form to cross biological membranes (i.e., ac-
tually enter an organism). For example, very lit-tle of the metallic form of mercury is taken up
following ingestion, while organic forms of mer-cury readily cross gastrointestinal membranes.
Bioavailability of soil contaminants influences therisk posed to living beings and, thus, the need for,
and extent of, remediation required to insure thesafety of exposed populations. In soils, bioavaila-
bility is influenced by physical, chemical and bio-logical factors (including root, bacterial and fun-
gal activities), as well as mechanisms of absorp-tion into plants or animals (Brümmer et. al., 1986).Sequential chemical soil analysis is used to descri-
be the speciation or bioavailability of metals. Ho-wever, most legal regulations address only total
concentrations of contaminants and do not takeinto consideration chemical speciation. However,
this information can be used to evaluate the po-tential for adverse impacts from soil contamina-
tion on the food chain (Tessier et. al., 1979).
HOW IS SOIL CONTAMINATION ASSESSED?What is the goal of site characterization?
The goal of site characterization is the develop-ment of a conceptual site model that will be used
to determine the need for, develop and guide, siteremediation. The data generated from the che-
mical analysis of soil samples is further processedusing statistical and visualization (e.g., GIS) pro-
cesses.Careful planning and implementation of site cha-
racterization is vital to the effective clean-up of acontaminated site. The initial involvement of all
members of the remedial team (e.g., field per-sonnel, soil scientists, chemists, statisticians and
toxicologists) when planning site characterizationactivities will streamline the process, reduce the
need for additional characterization efforts andresult in more effective remediation.
How to collect representative samplesA sampling grid typically is used to determine thespatial variation of contaminants at a site. The
sampling scheme needs to determine the extent(in both area and depth) and spatial variability of
contaminants at the site, initially and during re-medial activities. The number and location of sam-
ples will be site specific. Soil sampling patternsdepend on a number of factors including site hi-
story, expected data needs and planned remedialstrategy. There are a number of possible patterns
for site characterization, e.g., circular grid, ran-dom, stratified, zigzag, transverse sampling and
systematic (Box 4.9, ISO/CD/10381-5). For initialcharacterization of soil contamination (i.e., scre-
ening), samples are obtained using a sampling grid.An example of a field data sheet is shown in Ap-
pendix 1. which facilitates the systematic sam-pling and handling of samples (US EPA, 1989a)
How deep should we sample?The depth of samples is important to consider and
should be based, in part, on the history of thesite. It is important to remember the old adage
that „one will not find that which is not sought”.Initial soil sampling often screens samples from
several depth ranges (e.g., 0-15, 15-30, 30-45 cm).The top 30 centimeters of soil generally is consi-
dered when evaluating the threat posed to livingorganisms by contaminated soil (see chapter 9A).
In some cases, e.g., construction purposes, wheredeeper layers of the ground will be exposed, a
different and more extensive set of considerationswill need to be applied.
Once the depth of contamination is known, fur-ther sampling can be concentrated in that depth
range. Soil samples should be collected using equ-ipment that is compatible with the physical and
chemical needs of the sampling plan (e.g., distur-bed vs. undisturbed, spot vs. composite samples).
Plastic samplers or tubes generally are used forsamples intended for metal analysis, while metal
Surveys & Assessm
ents: Landscape
VwerySmatrBook03.p65 2004-06-17, 17:2458
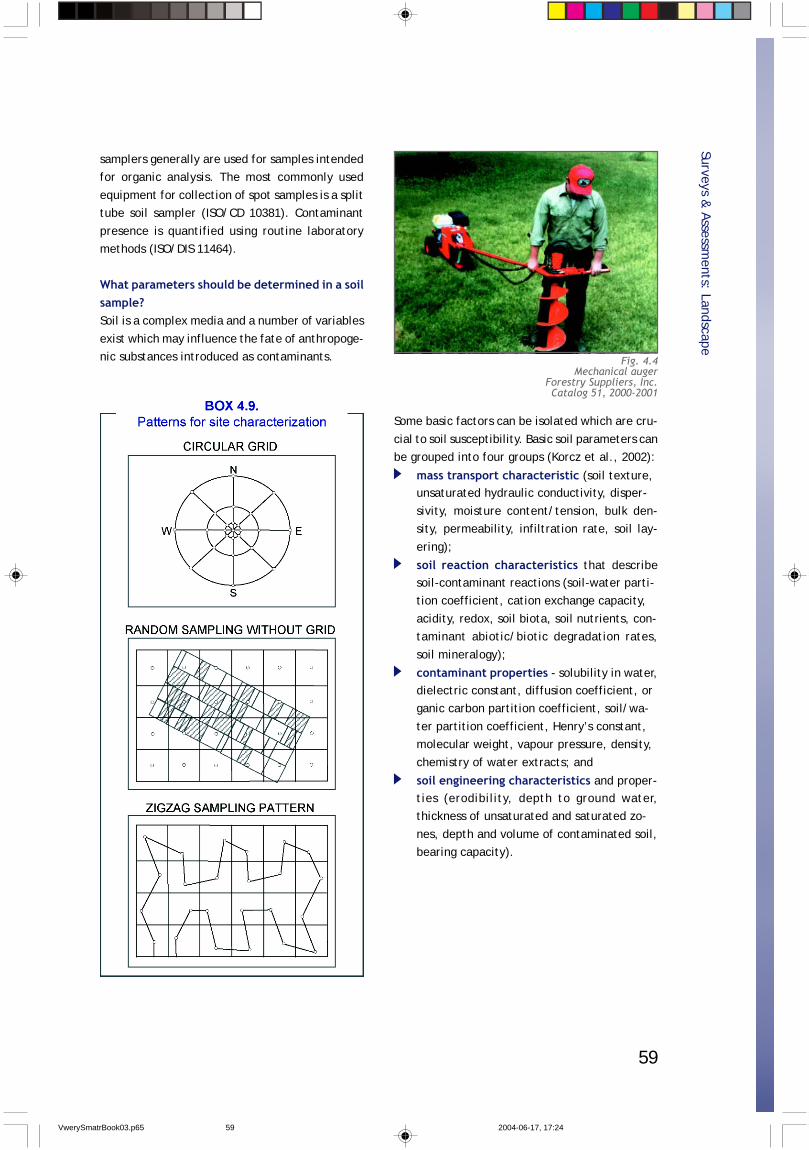
59
samplers generally are used for samples intendedfor organic analysis. The most commonly used
equipment for collection of spot samples is a splittube soil sampler (ISO/CD 10381). Contaminant
presence is quantified using routine laboratorymethods (ISO/DIS 11464).
What parameters should be determined in a soilsample?Soil is a complex media and a number of variables
exist which may influence the fate of anthropoge-nic substances introduced as contaminants.
Some basic factors can be isolated which are cru-
cial to soil susceptibility. Basic soil parameters canbe grouped into four groups (Korcz et al., 2002):
mass transport characteristic (soil texture,unsaturated hydraulic conductivity, disper-
sivity, moisture content/tension, bulk den-sity, permeability, infiltration rate, soil lay-
ering);
soil reaction characteristics that describesoil-contaminant reactions (soil-water parti-tion coefficient, cation exchange capacity,
acidity, redox, soil biota, soil nutrients, con-taminant abiotic/biotic degradation rates,
soil mineralogy);
contaminant properties - solubility in water,dielectric constant, diffusion coefficient, organic carbon partition coefficient, soil/wa-
ter partition coefficient, Henry’s constant,molecular weight, vapour pressure, density,
chemistry of water extracts; and
soil engineering characteristics and proper-ties (erodibility, depth to ground water,thickness of unsaturated and saturated zo-
nes, depth and volume of contaminated soil,bearing capacity).
Surveys & Assessm
ents: Landscape
Fig. 4.4Mechanical auger
Forestry Suppliers, Inc.Catalog 51, 2000-2001
VwerySmatrBook03.p65 2004-06-17, 17:2459

60
To obtain basic information on soil properties, thefollowing analyses are routinely made:
soil type, texture;conductivity;
pH;content of organic matter;
concentration of pollutants in question;fertility (vegetative capability);
depth to ground water;surface runoff; and
permeability.
Surveys & Assessm
ents: Landscape
Photo 4.5Various types of soilsampling equipment
Forestry Suppliers, Inc.Catalog 51, 2000-2001
MAKE SURE TO CHECK THESE RESOURCES:
Guidelines: chapter 5.B
VwerySmatrBook03.p65 2004-06-17, 17:2460
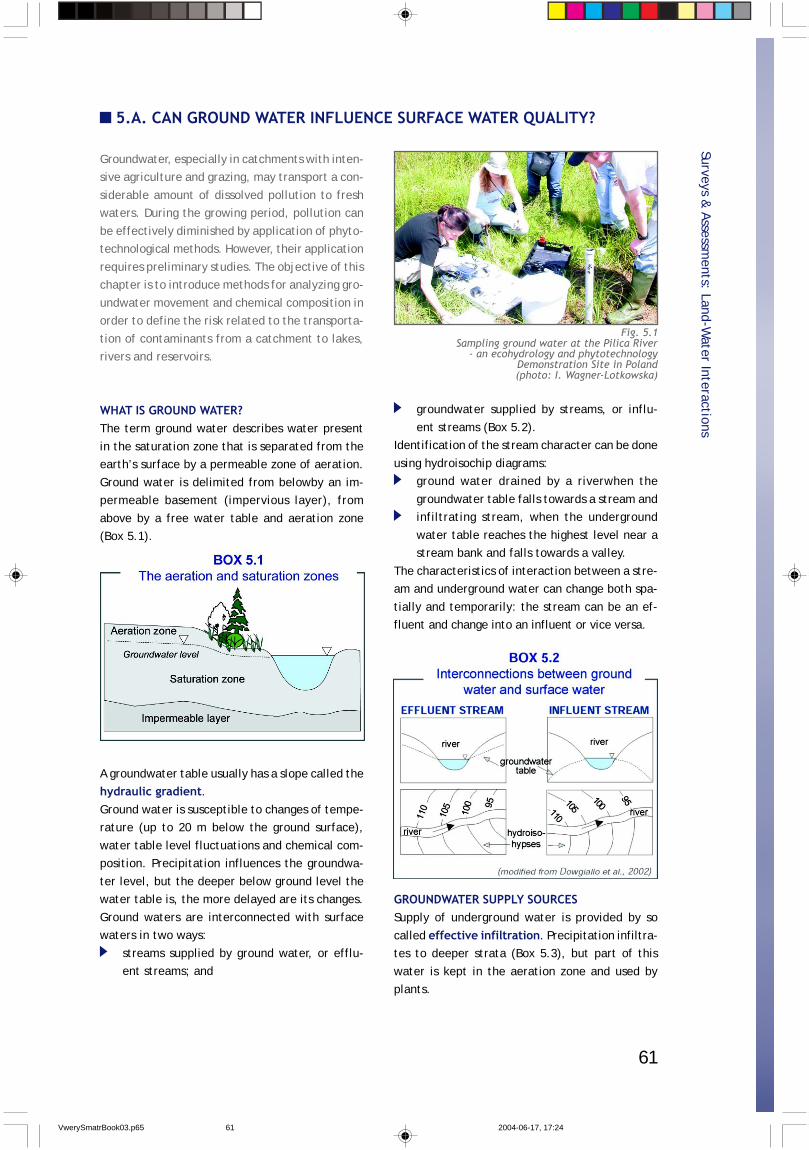
61
Groundwater, especially in catchments with inten-sive agriculture and grazing, may transport a con-
siderable amount of dissolved pollution to freshwaters. During the growing period, pollution can
be effectively diminished by application of phyto-technological methods. However, their application
requires preliminary studies. The objective of thischapter is to introduce methods for analyzing gro-
undwater movement and chemical composition inorder to define the risk related to the transporta-
tion of contaminants from a catchment to lakes,rivers and reservoirs.
WHAT IS GROUND WATER?The term ground water describes water present
in the saturation zone that is separated from theearth’s surface by a permeable zone of aeration.
Ground water is delimited from belowby an im-permeable basement (impervious layer), from
above by a free water table and aeration zone(Box 5.1).
5.A. CAN GROUND WATER INFLUENCE SURFACE WATER QUALITY?
groundwater supplied by streams, or influ-
ent streams (Box 5.2).Identification of the stream character can be done
using hydroisochip diagrams:ground water drained by a riverwhen the
groundwater table falls towards a stream andinfiltrating stream, when the underground
water table reaches the highest level near astream bank and falls towards a valley.
The characteristics of interaction between a stre-am and underground water can change both spa-
tially and temporarily: the stream can be an ef-fluent and change into an influent or vice versa.
Surveys & Assessm
ents: Land-Water Interactions
A groundwater table usually has a slope called thehydraulic gradient.Ground water is susceptible to changes of tempe-rature (up to 20 m below the ground surface),
water table level fluctuations and chemical com-position. Precipitation influences the groundwa-
ter level, but the deeper below ground level thewater table is, the more delayed are its changes.
Ground waters are interconnected with surfacewaters in two ways:
streams supplied by ground water, or efflu-ent streams; and
Fig. 5.1Sampling ground water at the Pilica River
- an ecohydrology and phytotechnologyDemonstration Site in Poland(photo: I. Wagner-Lotkowska)
GROUNDWATER SUPPLY SOURCESSupply of underground water is provided by so
called effective infiltration. Precipitation infiltra-tes to deeper strata (Box 5.3), but part of this
water is kept in the aeration zone and used byplants.
VwerySmatrBook03.p65 2004-06-17, 17:2461
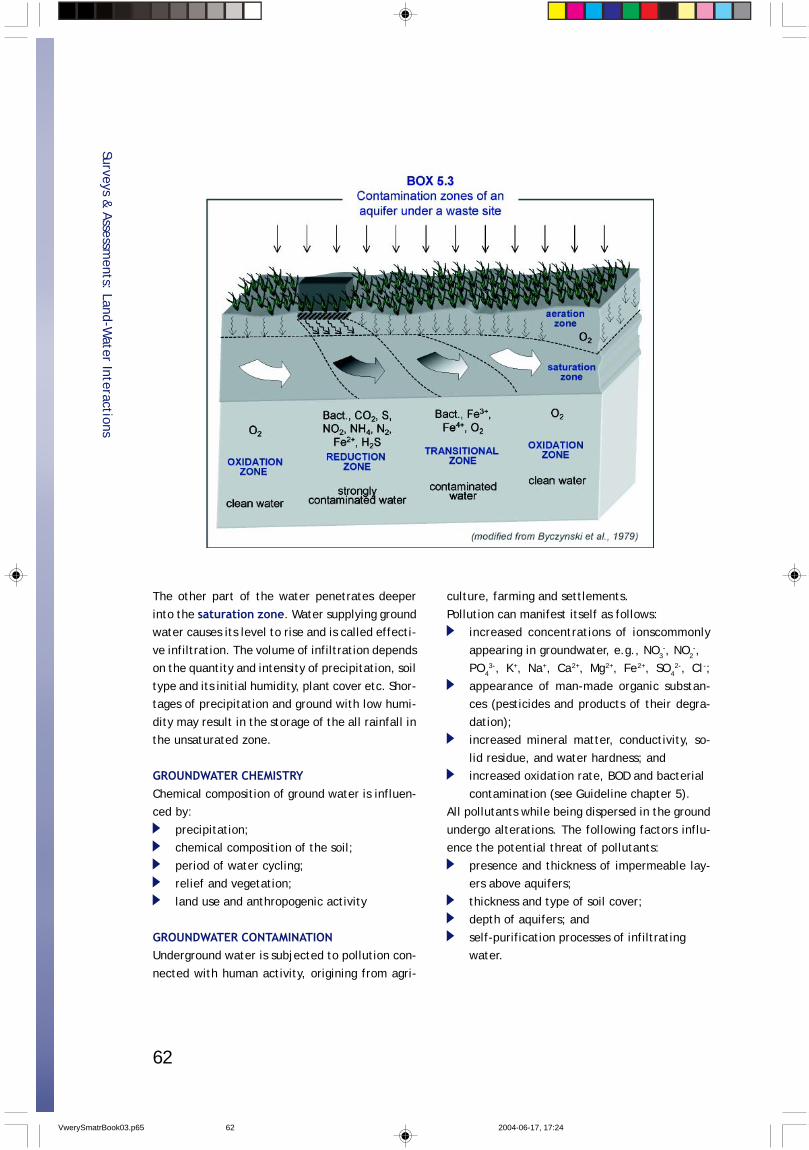
62
culture, farming and settlements.
Pollution can manifest itself as follows:increased concentrations of ionscommonly
appearing in groundwater, e.g., NO3-, NO2
-,PO4
3-, K+, Na+, Ca2+, Mg2+, Fe2+, SO42-, Cl-;
appearance of man-made organic substan-ces (pesticides and products of their degra-
dation);increased mineral matter, conductivity, so-
lid residue, and water hardness; andincreased oxidation rate, BOD and bacterial
contamination (see Guideline chapter 5).All pollutants while being dispersed in the ground
undergo alterations. The following factors influ-ence the potential threat of pollutants:
presence and thickness of impermeable lay-ers above aquifers;
thickness and type of soil cover;depth of aquifers; and
self-purification processes of infiltratingwater.
The other part of the water penetrates deeper
into the saturation zone. Water supplying groundwater causes its level to rise and is called effecti-
ve infiltration. The volume of infiltration dependson the quantity and intensity of precipitation, soil
type and its initial humidity, plant cover etc. Shor-tages of precipitation and ground with low humi-
dity may result in the storage of the all rainfall inthe unsaturated zone.
GROUNDWATER CHEMISTRYChemical composition of ground water is influen-ced by:
precipitation;chemical composition of the soil;
period of water cycling;relief and vegetation;
land use and anthropogenic activity
GROUNDWATER CONTAMINATIONUnderground water is subjected to pollution con-
nected with human activity, origining from agri-
Surveys & Assessm
ents: Land-Water Interactions
VwerySmatrBook03.p65 2004-06-17, 17:2462
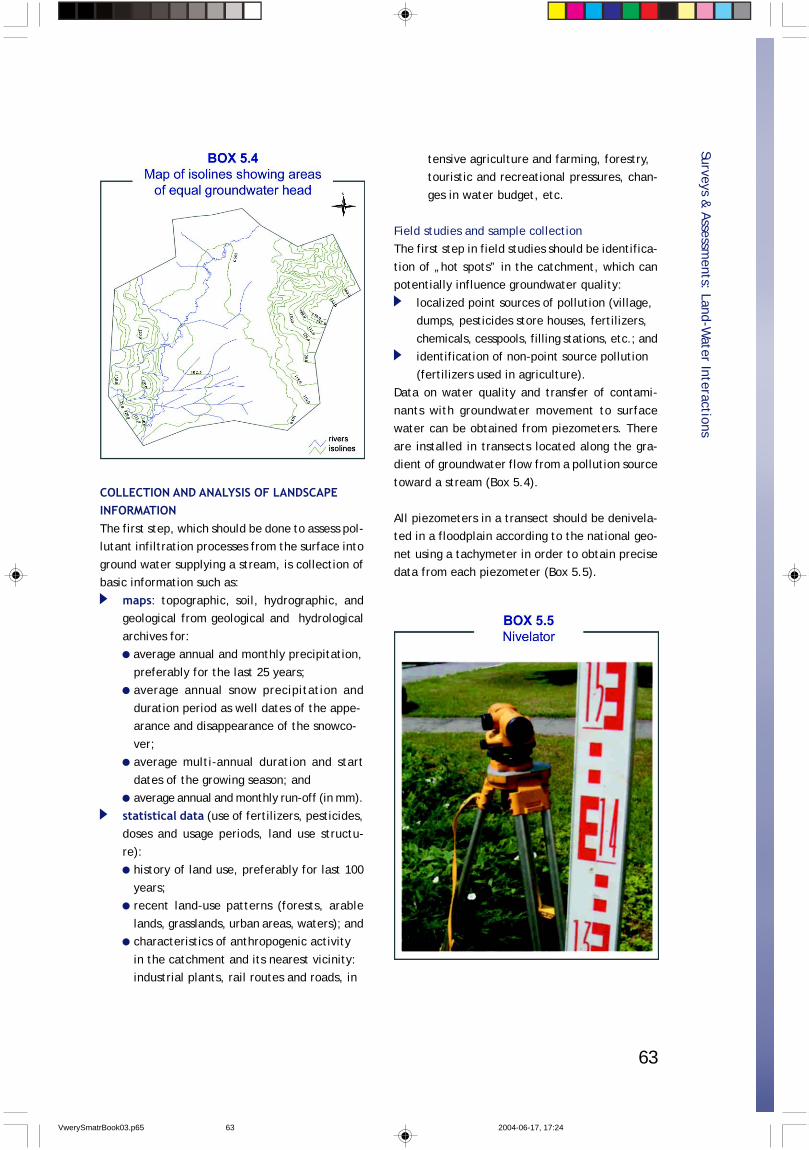
63
tensive agriculture and farming, forestry,touristic and recreational pressures, chan-
ges in water budget, etc.
Field studies and sample collectionThe first step in field studies should be identifica-
tion of „hot spots” in the catchment, which canpotentially influence groundwater quality:
localized point sources of pollution (village,dumps, pesticides store houses, fertilizers,
chemicals, cesspools, filling stations, etc.; andidentification of non-point source pollution
(fertilizers used in agriculture).Data on water quality and transfer of contami-
nants with groundwater movement to surfacewater can be obtained from piezometers. There
are installed in transects located along the gra-dient of groundwater flow from a pollution source
toward a stream (Box 5.4).
All piezometers in a transect should be denivela-ted in a floodplain according to the national geo-
net using a tachymeter in order to obtain precisedata from each piezometer (Box 5.5).
COLLECTION AND ANALYSIS OF LANDSCAPEINFORMATIONThe first step, which should be done to assess pol-lutant infiltration processes from the surface into
ground water supplying a stream, is collection ofbasic information such as:
maps: topographic, soil, hydrographic, andgeological from geological and hydrological
archives for: average annual and monthly precipitation,
preferably for the last 25 years;average annual snow precipitation and
duration period as well dates of the appe-arance and disappearance of the snowco-
ver;average multi-annual duration and start
dates of the growing season; andaverage annual and monthly run-off (in mm).
statistical data (use of fertilizers, pesticides,doses and usage periods, land use structu-
re):history of land use, preferably for last 100
years;recent land-use patterns (forests, arable
lands, grasslands, urban areas, waters); andcharacteristics of anthropogenic activity
in the catchment and its nearest vicinity:industrial plants, rail routes and roads, in
Surveys & Assessm
ents: Land-Water Interactions
VwerySmatrBook03.p65 2004-06-17, 17:2463
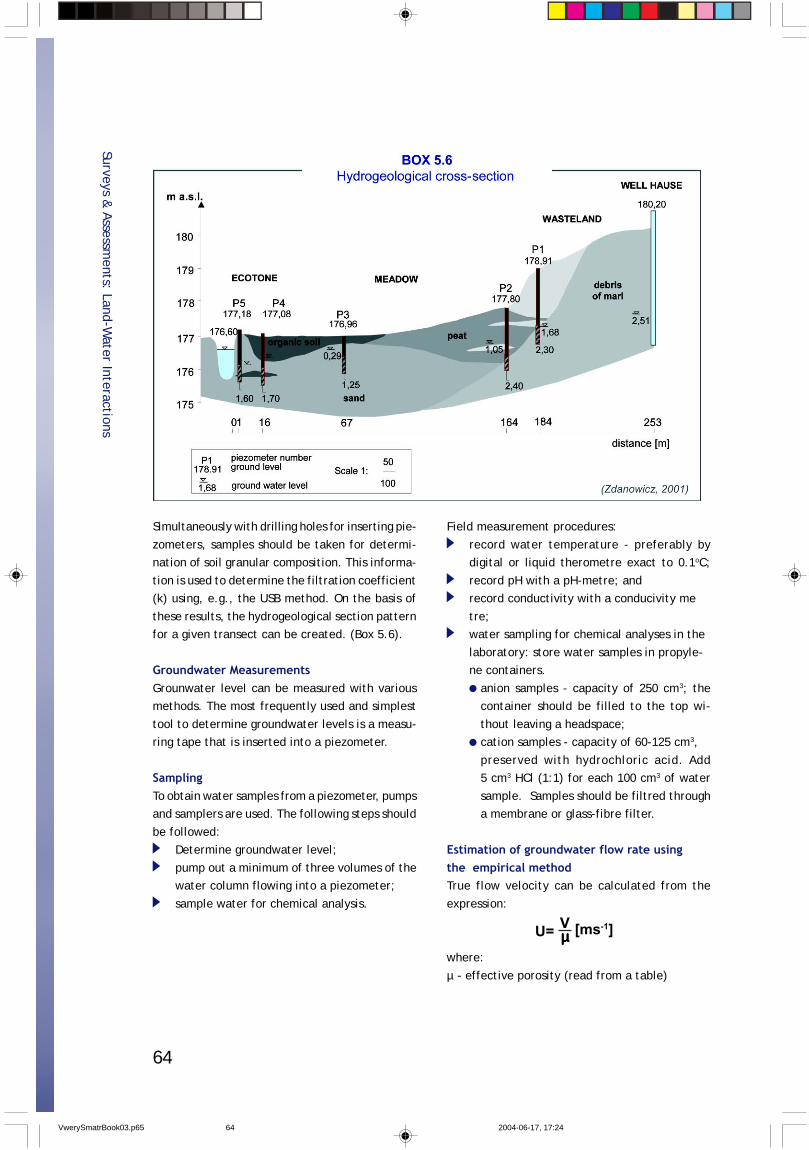
64
Surveys & Assessm
ents: Land-Water Interactions
Simultaneously with drilling holes for inserting pie-
zometers, samples should be taken for determi-nation of soil granular composition. This informa-
tion is used to determine the filtration coefficient(k) using, e.g., the USB method. On the basis of
these results, the hydrogeological section patternfor a given transect can be created. (Box 5.6).
Groundwater MeasurementsGrounwater level can be measured with variousmethods. The most frequently used and simplest
tool to determine groundwater levels is a measu-ring tape that is inserted into a piezometer.
SamplingTo obtain water samples from a piezometer, pumpsand samplers are used. The following steps should
be followed:Determine groundwater level;
pump out a minimum of three volumes of thewater column flowing into a piezometer;
sample water for chemical analysis.
Field measurement procedures:
record water temperature - preferably bydigital or liquid therometre exact to 0.1oC;
record pH with a pH-metre; andrecord conductivity with a conducivity me
tre;water sampling for chemical analyses in the
laboratory: store water samples in propyle-ne containers.
anion samples - capacity of 250 cm3; thecontainer should be filled to the top wi-
thout leaving a headspace;cation samples - capacity of 60-125 cm3,
preserved with hydrochloric acid. Add5 cm3 HCl (1:1) for each 100 cm3 of water
sample. Samples should be filtred througha membrane or glass-fibre filter.
Estimation of groundwater flow rate usingthe empirical methodTrue flow velocity can be calculated from the
expression:
where:
µ - effective porosity (read from a table)
U= Vµµµµµ [ms-1]
VwerySmatrBook03.p65 2004-06-17, 17:2464
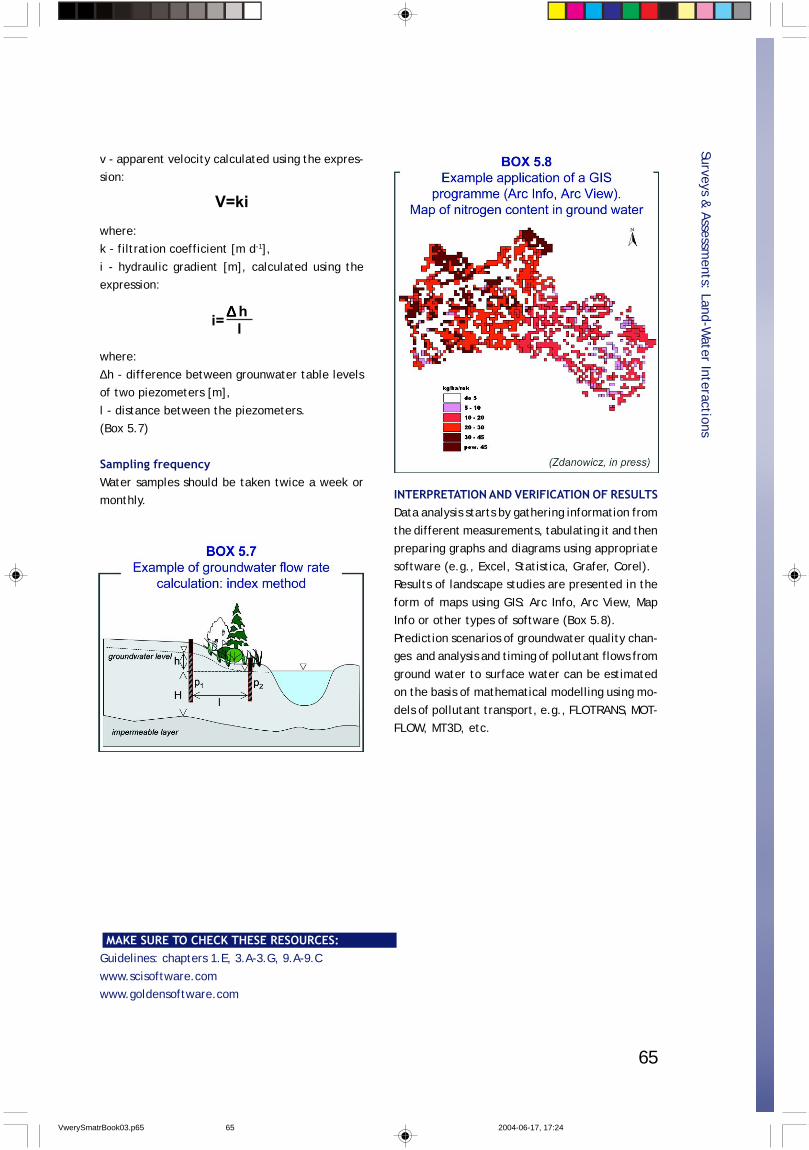
65
MAKE SURE TO CHECK THESE RESOURCES:
v - apparent velocity calculated using the expres-sion:
where:k - filtration coefficient [m d-1],
i - hydraulic gradient [m], calculated using theexpression:
where:
∆h - difference between grounwater table levelsof two piezometers [m],
l - distance between the piezometers.(Box 5.7)
Sampling frequencyWater samples should be taken twice a week ormonthly.
Surveys & Assessm
ents: Land-Water Interactions
V=ki
INTERPRETATION AND VERIFICATION OF RESULTSData analysis starts by gathering information from
the different measurements, tabulating it and thenpreparing graphs and diagrams using appropriate
software (e.g., Excel, Statistica, Grafer, Corel).Results of landscape studies are presented in the
form of maps using GIS: Arc Info, Arc View, MapInfo or other types of software (Box 5.8).
Prediction scenarios of groundwater quality chan-ges and analysis and timing of pollutant flows from
ground water to surface water can be estimatedon the basis of mathematical modelling using mo-
dels of pollutant transport, e.g., FLOTRANS, MOT-FLOW, MT3D, etc.
Guidelines: chapters 1.E, 3.A-3.G, 9.A-9.C
www.scisoftware.comwww.goldensoftware.com
i= ∆ ∆ ∆ ∆ ∆ hl
VwerySmatrBook03.p65 2004-06-17, 17:2465
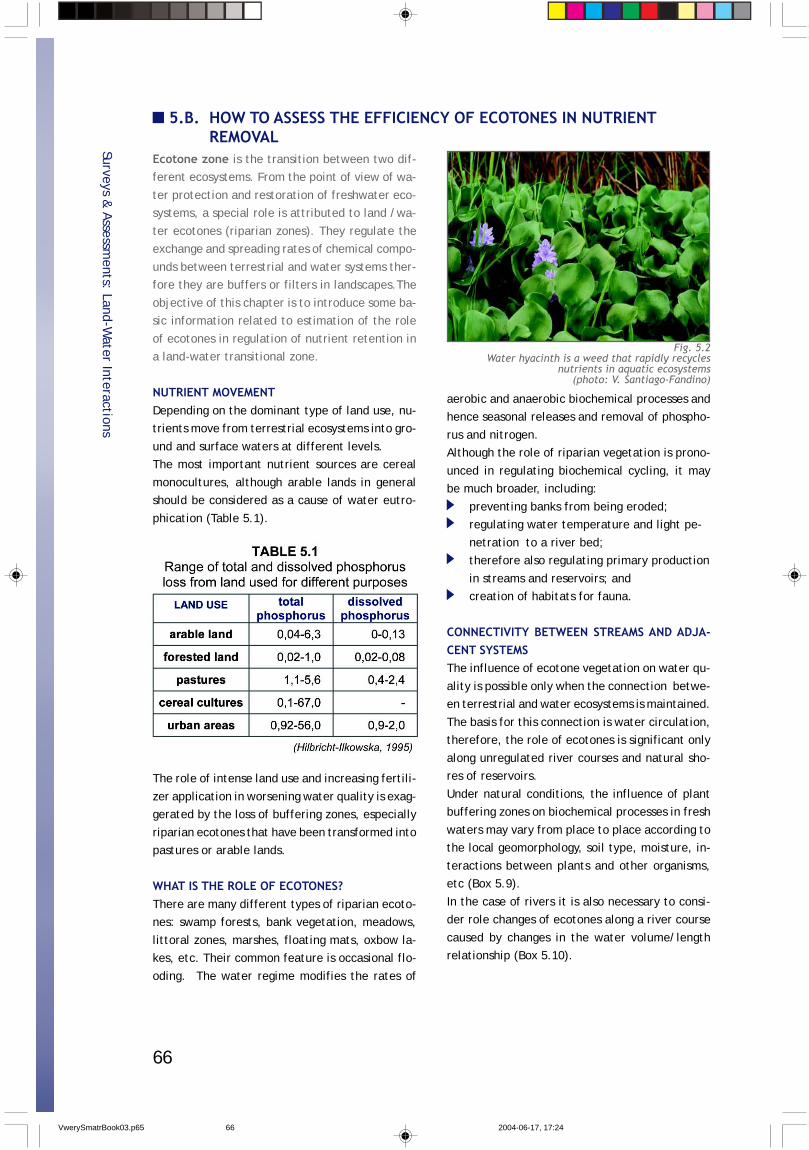
66
5.B. HOW TO ASSESS THE EFFICIENCY OF ECOTONES IN NUTRIENTREMOVAL
Ecotone zone is the transition between two dif-ferent ecosystems. From the point of view of wa-
ter protection and restoration of freshwater eco-systems, a special role is attributed to land /wa-
ter ecotones (riparian zones). They regulate theexchange and spreading rates of chemical compo-
unds between terrestrial and water systems ther-fore they are buffers or filters in landscapes.The
objective of this chapter is to introduce some ba-sic information related to estimation of the role
of ecotones in regulation of nutrient retention ina land-water transitional zone.
NUTRIENT MOVEMENTDepending on the dominant type of land use, nu-trients move from terrestrial ecosystems into gro-
und and surface waters at different levels.The most important nutrient sources are cereal
monocultures, although arable lands in generalshould be considered as a cause of water eutro-
phication (Table 5.1).
The role of intense land use and increasing fertili-
zer application in worsening water quality is exag-gerated by the loss of buffering zones, especially
riparian ecotones that have been transformed intopastures or arable lands.
WHAT IS THE ROLE OF ECOTONES?There are many different types of riparian ecoto-nes: swamp forests, bank vegetation, meadows,
littoral zones, marshes, floating mats, oxbow la-kes, etc. Their common feature is occasional flo-
oding. The water regime modifies the rates of
aerobic and anaerobic biochemical processes andhence seasonal releases and removal of phospho-
rus and nitrogen.Although the role of riparian vegetation is prono-
unced in regulating biochemical cycling, it maybe much broader, including:
preventing banks from being eroded;regulating water temperature and light pe-
netration to a river bed;therefore also regulating primary production
in streams and reservoirs; andcreation of habitats for fauna.
CONNECTIVITY BETWEEN STREAMS AND ADJA-CENT SYSTEMSThe influence of ecotone vegetation on water qu-
ality is possible only when the connection betwe-en terrestrial and water ecosystems is maintained.
The basis for this connection is water circulation,therefore, the role of ecotones is significant only
along unregulated river courses and natural sho-res of reservoirs.
Under natural conditions, the influence of plantbuffering zones on biochemical processes in fresh
waters may vary from place to place according tothe local geomorphology, soil type, moisture, in-
teractions between plants and other organisms,etc (Box 5.9).
In the case of rivers it is also necessary to consi-der role changes of ecotones along a river course
caused by changes in the water volume/lengthrelationship (Box 5.10).
Surveys & Assessm
ents: Land-Water Interactions
Fig. 5.2Water hyacinth is a weed that rapidly recycles
nutrients in aquatic ecosystems(photo: V. Santiago-Fandino)
VwerySmatrBook03.p65 2004-06-17, 17:2466
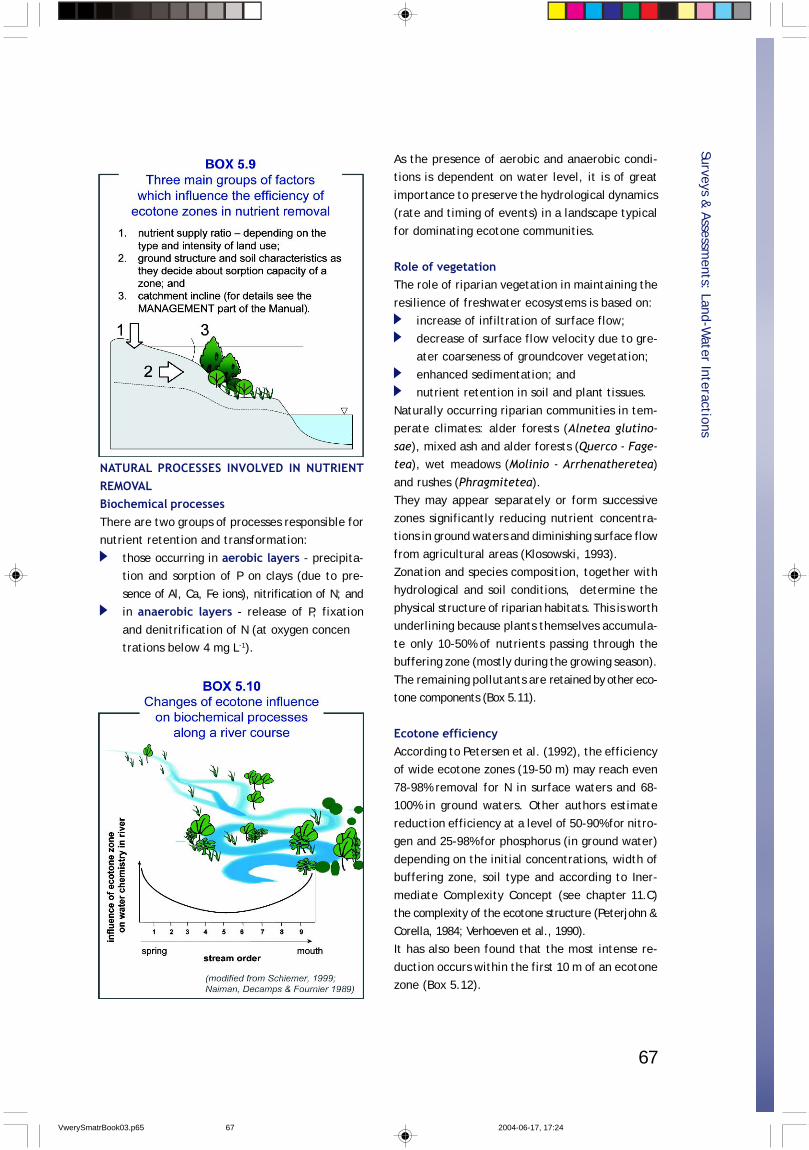
67
As the presence of aerobic and anaerobic condi-tions is dependent on water level, it is of great
importance to preserve the hydrological dynamics(rate and timing of events) in a landscape typical
for dominating ecotone communities.
Role of vegetationThe role of riparian vegetation in maintaining the
resilience of freshwater ecosystems is based on:increase of infiltration of surface flow;
decrease of surface flow velocity due to gre-ater coarseness of groundcover vegetation;
enhanced sedimentation; andnutrient retention in soil and plant tissues.
Naturally occurring riparian communities in tem-perate climates: alder forests (Alnetea glutino-
sae), mixed ash and alder forests (Querco - Fage-tea), wet meadows (Molinio - Arrhenatheretea)
and rushes (Phragmitetea).They may appear separately or form successive
zones significantly reducing nutrient concentra-tions in ground waters and diminishing surface flow
from agricultural areas (Klosowski, 1993).Zonation and species composition, together withhydrological and soil conditions, determine the
physical structure of riparian habitats. This is worthunderlining because plants themselves accumula-
te only 10-50% of nutrients passing through thebuffering zone (mostly during the growing season).
The remaining pollutants are retained by other eco-tone components (Box 5.11).
Ecotone efficiencyAccording to Petersen et al. (1992), the efficiencyof wide ecotone zones (19-50 m) may reach even
78-98% removal for N in surface waters and 68-100% in ground waters. Other authors estimate
reduction efficiency at a level of 50-90% for nitro-gen and 25-98% for phosphorus (in ground water)
depending on the initial concentrations, width ofbuffering zone, soil type and according to Iner-
mediate Complexity Concept (see chapter 11.C)the complexity of the ecotone structure (Peterjohn &
Corella, 1984; Verhoeven et al., 1990).It has also been found that the most intense re-
duction occurs within the first 10 m of an ecotonezone (Box 5.12).
NATURAL PROCESSES INVOLVED IN NUTRIENTREMOVALBiochemical processesThere are two groups of processes responsible fornutrient retention and transformation:
those occurring in aerobic layers - precipita-tion and sorption of P on clays (due to pre-
sence of Al, Ca, Fe ions), nitrification of N; andin anaerobic layers - release of P, fixation
and denitrification of N (at oxygen concentrations below 4 mg L-1).
Surveys & Assessm
ents: Land-Water Interactions
VwerySmatrBook03.p65 2004-06-17, 17:2467
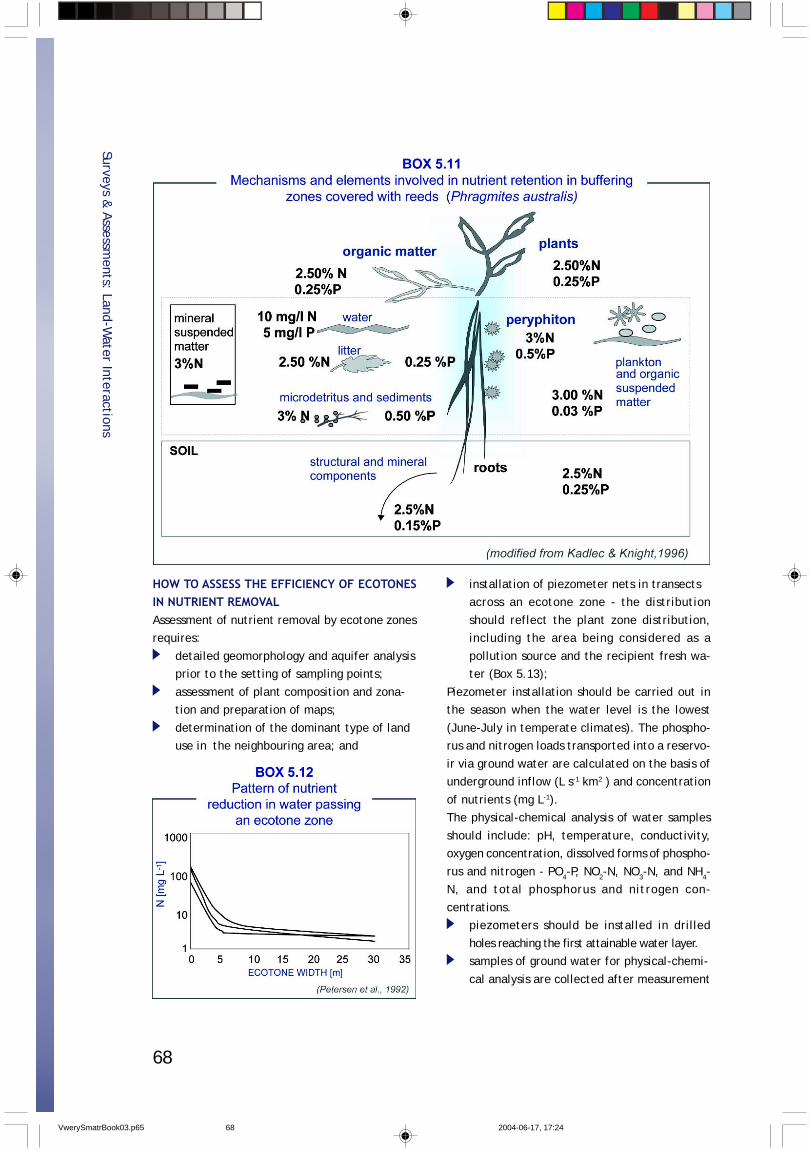
68
HOW TO ASSESS THE EFFICIENCY OF ECOTONESIN NUTRIENT REMOVALAssessment of nutrient removal by ecotone zonesrequires:
detailed geomorphology and aquifer analysisprior to the setting of sampling points;
assessment of plant composition and zona-tion and preparation of maps;
determination of the dominant type of landuse in the neighbouring area; and
installation of piezometer nets in transectsacross an ecotone zone - the distribution
should reflect the plant zone distribution,including the area being considered as a
pollution source and the recipient fresh wa-ter (Box 5.13);
Piezometer installation should be carried out inthe season when the water level is the lowest
(June-July in temperate climates). The phospho-rus and nitrogen loads transported into a reservo-
ir via ground water are calculated on the basis ofunderground inflow (L s-1 km2 ) and concentration
of nutrients (mg L-1).The physical-chemical analysis of water samples
should include: pH, temperature, conductivity,oxygen concentration, dissolved forms of phospho-
rus and nitrogen - PO4-P, NO2-N, NO3-N, and NH4-N, and total phosphorus and nitrogen con-
centrations.piezometers should be installed in drilled
holes reaching the first attainable water layer.samples of ground water for physical-chemi-
cal analysis are collected after measurement
Surveys & Assessm
ents: Land-Water Interactions
VwerySmatrBook03.p65 2004-06-17, 17:2468
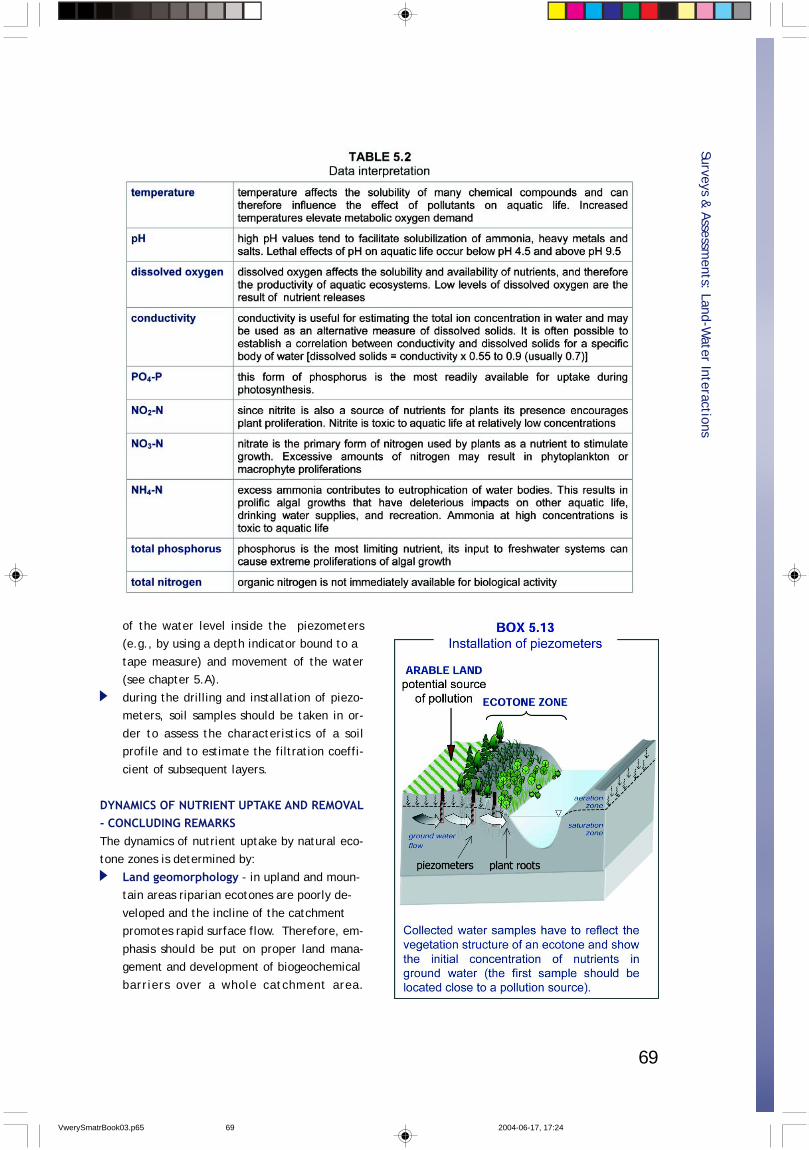
69
of the water level inside the piezometers(e.g., by using a depth indicator bound to a
tape measure) and movement of the water(see chapter 5.A).
during the drilling and installation of piezo-meters, soil samples should be taken in or-
der to assess the characteristics of a soilprofile and to estimate the filtration coeffi-
cient of subsequent layers.
DYNAMICS OF NUTRIENT UPTAKE AND REMOVAL- CONCLUDING REMARKSThe dynamics of nutrient uptake by natural eco-tone zones is determined by:
Land geomorphology - in upland and moun-tain areas riparian ecotones are poorly de-
veloped and the incline of the catchmentpromotes rapid surface flow. Therefore, em-
phasis should be put on proper land mana-gement and development of biogeochemical
barriers over a whole catchment area.
Surveys & Assessm
ents: Land-Water Interactions
VwerySmatrBook03.p65 2004-06-17, 17:2469

70
Nutrient load - it was found that P removalrate exceeds 50% only when loading rates
were lower than 50kg ha-1 year-1.Season - it was estimated that in temperate
zones vegetation works as a trap for nu-trients for 9 months on average; effective-
ness for N-trapping is higher and prolongeddue to high microbial involvement in trans-
formation processes.
MAKE SURE TO CHECK THESE RESOURCES:
Surveys & Assessm
ents: Land-Water Interactions
Plant composition - herbaceous vegetationis more active in nutrient uptake and accu
mulation due to dynamic growth, while tre-es and shrubs block nutrients for longer pe-
riods and require less conservation.Finally, it has to be stressed that natural ecotones
and riparian wetlands in many cases play not onlythe role of nutrient barriers, but also transfor-
mers - they import inorganic forms of nutrientsand export organic ones and also buffer and smo-
oth nutrient pulses.
Guidelines: chapters 5.D-5.Ehttp://www.thewaterpage.com/aq_eco_groundw.htm
http://srmwww.gov.bc.ca/risc/pubs/aquatic/design/index.htmhttp://www.thewaterpage.com/aq_eco_july_01.htm
VwerySmatrBook03.p65 2004-06-17, 17:2570
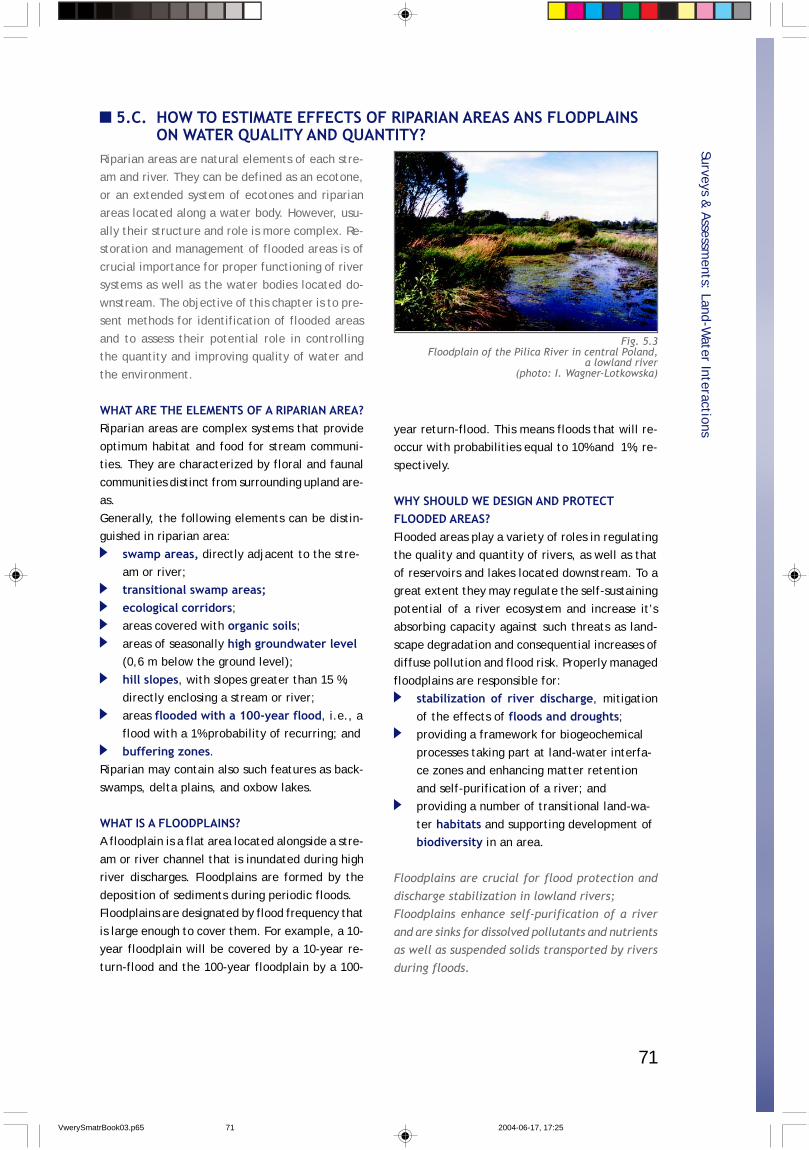
71
5.C. HOW TO ESTIMATE EFFECTS OF RIPARIAN AREAS ANS FLODPLAINSON WATER QUALITY AND QUANTITY?
Riparian areas are natural elements of each stre-am and river. They can be defined as an ecotone,
or an extended system of ecotones and riparianareas located along a water body. However, usu-
ally their structure and role is more complex. Re-storation and management of flooded areas is of
crucial importance for proper functioning of riversystems as well as the water bodies located do-
wnstream. The objective of this chapter is to pre-sent methods for identification of flooded areas
and to assess their potential role in controllingthe quantity and improving quality of water and
the environment.
WHAT ARE THE ELEMENTS OF A RIPARIAN AREA?Riparian areas are complex systems that provide
optimum habitat and food for stream communi-ties. They are characterized by floral and faunal
communities distinct from surrounding upland are-as.
Generally, the following elements can be distin-guished in riparian area:
swamp areas, directly adjacent to the stre-am or river;transitional swamp areas;ecological corridors;areas covered with organic soils;areas of seasonally high groundwater level(0,6 m below the ground level);
hill slopes, with slopes greater than 15 %,directly enclosing a stream or river;
areas flooded with a 100-year flood, i.e., aflood with a 1% probability of recurring; and
buffering zones.Riparian may contain also such features as back-
swamps, delta plains, and oxbow lakes.
WHAT IS A FLOODPLAINS?A floodplain is a flat area located alongside a stre-
am or river channel that is inundated during highriver discharges. Floodplains are formed by the
deposition of sediments during periodic floods.Floodplains are designated by flood frequency that
is large enough to cover them. For example, a 10-year floodplain will be covered by a 10-year re-
turn-flood and the 100-year floodplain by a 100-
year return-flood. This means floods that will re-occur with probabilities equal to 10% and 1%, re-
spectively.
WHY SHOULD WE DESIGN AND PROTECTFLOODED AREAS?Flooded areas play a variety of roles in regulatingthe quality and quantity of rivers, as well as that
of reservoirs and lakes located downstream. To agreat extent they may regulate the self-sustaining
potential of a river ecosystem and increase it’sabsorbing capacity against such threats as land-
scape degradation and consequential increases ofdiffuse pollution and flood risk. Properly managed
floodplains are responsible for:stabilization of river discharge, mitigation
of the effects of floods and droughts;providing a framework for biogeochemical
processes taking part at land-water interfa-ce zones and enhancing matter retention
and self-purification of a river; andproviding a number of transitional land-wa-
ter habitats and supporting development ofbiodiversity in an area.
Floodplains are crucial for flood protection and
discharge stabilization in lowland rivers;Floodplains enhance self-purification of a river
and are sinks for dissolved pollutants and nutrientsas well as suspended solids transported by rivers
during floods.
Surveys & Assessm
ents: Land-Water Interactions
Fig. 5.3Floodplain of the Pilica River in central Poland,
a lowland river(photo: I. Wagner-Lotkowska)
VwerySmatrBook03.p65 2004-06-17, 17:2571

72
HOW TO IDENTIFY A FLOODED ZONERecognitionDepending on the scale of a river, the first stepfor identifying flooded areas and estimating their
potential for water and pollutant retention, sho-uld be an analysis of maps and aerial photographs
of a river corridor and adjacent areas located alongit’s channel (see chapter 4.B). If possible, it sho-
uld be supported with direct observations in the field.
Data neededThe following information can be of importance
for the preliminary work:topographic and geological characteristics
of an area with special emphasis on the landlocated along a river;
hydrological characteristics of a river andadjacent areas, including discharges of a ri-
ver, distribution and density of other freshwater bodies and groundwater levels, if po
ssible; andexisting information about land use and de-velopment of an area.
The following materials, if available, can be use-ful for estimating the extent of a flooded area
and their potential role for flood mitigation andwater quality improvement:
maps of the areatopographic maps - 1:10 000 scale (river-
bed and adjacent floodplain areas);topographic maps - 1:25 000 scale (flo-
odplain and adjacent catchment);topographic maps - 1:100 000 scale
(catchment area for general overview oflandscape use and structure); and
soil maps - 1: 5 000 scale.hydrological and meteorological data
yearly distribution of precipitation, snowcover, air temperature, potential evapotran-
spiration, in order to calculated mesoscalewater circulation in the catchment; and
discharges with given probability of exce-eding calculated values on the basis of a
long term series of maximum dischargesfrom gauged basins or determined by em-
pirical methods in case of ungauged ba-sins.
hydraulics data - roughness coefficient de-termined on the basis of inventory, land use
maps, aerial photofraphs, and literaturegeodesy data
river cross-sections; andcross-sections of existing hydrotechni-
cal infrastructure.others
photographs of a river, river corridor andfloodplains;
aerial photographs of potentially floodedzones; and
video documentation of historical floods,if available.
FIELD STUDIES AND MEASUREMENTSTo identify and assess the ecological potential offlooded zones for retention of water and matter,
it is also necessary to carry out additional fieldmeasurements.
The basic information to be collected should co-ver the following:
characteristics of a riverbed with detailedinformation about hydrotechnical construc-tion and infrastructure; and
detailed information about the ecological va-lue of an area.
Characteristics of a riverbedSpecial attention should be given to the naturalstructure of a riverbed. The following parameters
should be listed for river sections of interest forpotential management of flooded areas:
distribution, length and characteristics of na-tural river sections;distribution, length and characteristics of re-gulated and canalized river sections;
width, depth and cross sections of a river inall characteristic areas, with special empha-
sis on the section where flooded zones areto be restored and adjacent upstream and
downstream floodplain sections;cover and stability of a riverbed grain- sizedistribution; andexisting and planned hydrotechnical con-structions along a river.
Surveys & Assessm
ents: Land-Water Interactions
VwerySmatrBook03.p65 2004-06-17, 17:2572
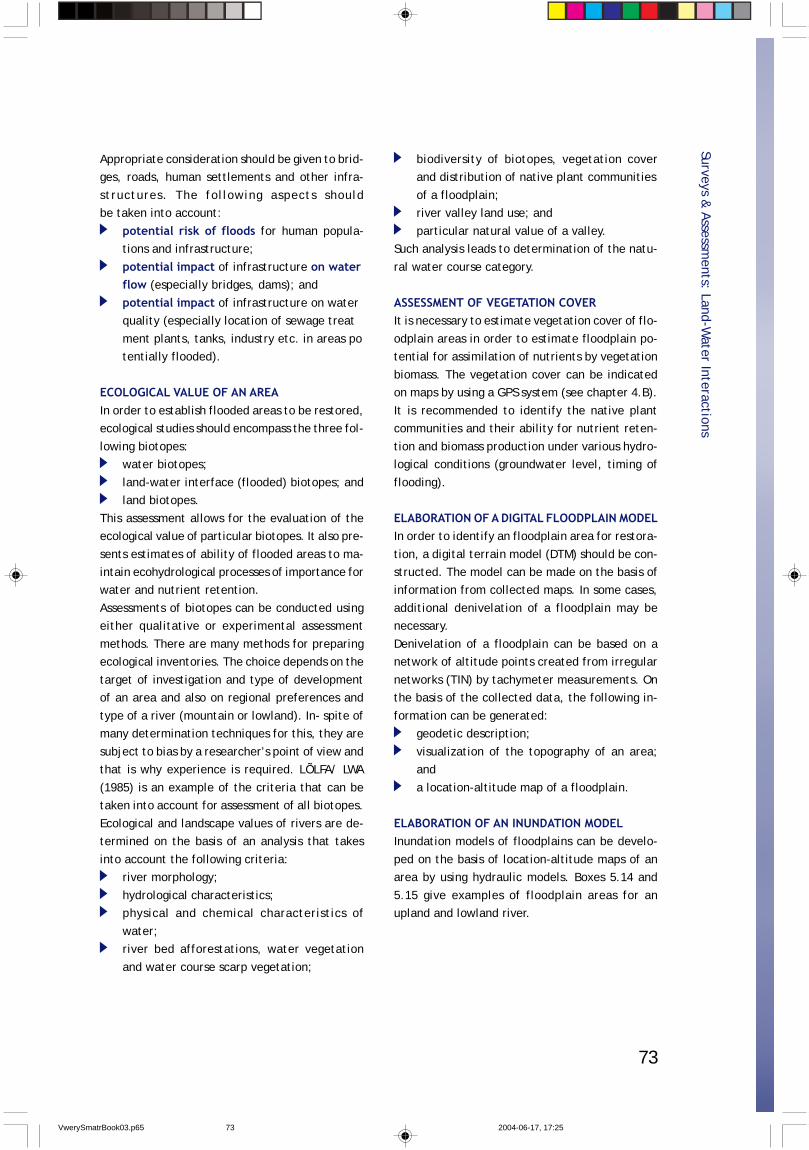
73
Appropriate consideration should be given to brid-ges, roads, human settlements and other infra-
structures. The following aspects shouldbe taken into account:
potential risk of floods for human popula-tions and infrastructure;
potential impact of infrastructure on waterflow (especially bridges, dams); and
potential impact of infrastructure on waterquality (especially location of sewage treat
ment plants, tanks, industry etc. in areas potentially flooded).
ECOLOGICAL VALUE OF AN AREAIn order to establish flooded areas to be restored,ecological studies should encompass the three fol-
lowing biotopes:water biotopes;
land-water interface (flooded) biotopes; andland biotopes.
This assessment allows for the evaluation of theecological value of particular biotopes. It also pre-
sents estimates of ability of flooded areas to ma-intain ecohydrological processes of importance forwater and nutrient retention.
Assessments of biotopes can be conducted usingeither qualitative or experimental assessment
methods. There are many methods for preparingecological inventories. The choice depends on the
target of investigation and type of developmentof an area and also on regional preferences and
type of a river (mountain or lowland). In- spite ofmany determination techniques for this, they are
subject to bias by a researcher’s point of view andthat is why experience is required. LÕLFA/ LWA
(1985) is an example of the criteria that can betaken into account for assessment of all biotopes.
Ecological and landscape values of rivers are de-termined on the basis of an analysis that takes
into account the following criteria:river morphology;
hydrological characteristics;physical and chemical characteristics of
water;river bed afforestations, water vegetation
and water course scarp vegetation;
biodiversity of biotopes, vegetation coverand distribution of native plant communities
of a floodplain;river valley land use; and
particular natural value of a valley.Such analysis leads to determination of the natu-
ral water course category.
ASSESSMENT OF VEGETATION COVERIt is necessary to estimate vegetation cover of flo-
odplain areas in order to estimate floodplain po-tential for assimilation of nutrients by vegetation
biomass. The vegetation cover can be indicatedon maps by using a GPS system (see chapter 4.B).
It is recommended to identify the native plantcommunities and their ability for nutrient reten-
tion and biomass production under various hydro-logical conditions (groundwater level, timing of
flooding).
ELABORATION OF A DIGITAL FLOODPLAIN MODELIn order to identify an floodplain area for restora-
tion, a digital terrain model (DTM) should be con-structed. The model can be made on the basis ofinformation from collected maps. In some cases,
additional denivelation of a floodplain may benecessary.
Denivelation of a floodplain can be based on anetwork of altitude points created from irregular
networks (TIN) by tachymeter measurements. Onthe basis of the collected data, the following in-
formation can be generated:geodetic description;
visualization of the topography of an area;and
a location-altitude map of a floodplain.
ELABORATION OF AN INUNDATION MODELInundation models of floodplains can be develo-
ped on the basis of location-altitude maps of anarea by using hydraulic models. Boxes 5.14 and
5.15 give examples of floodplain areas for anupland and lowland river.
MAKE SURE TO CHECK THESE RESOURCES:
Surveys & Assessm
ents: Land-Water Interactions
VwerySmatrBook03.p65 2004-06-17, 17:2573
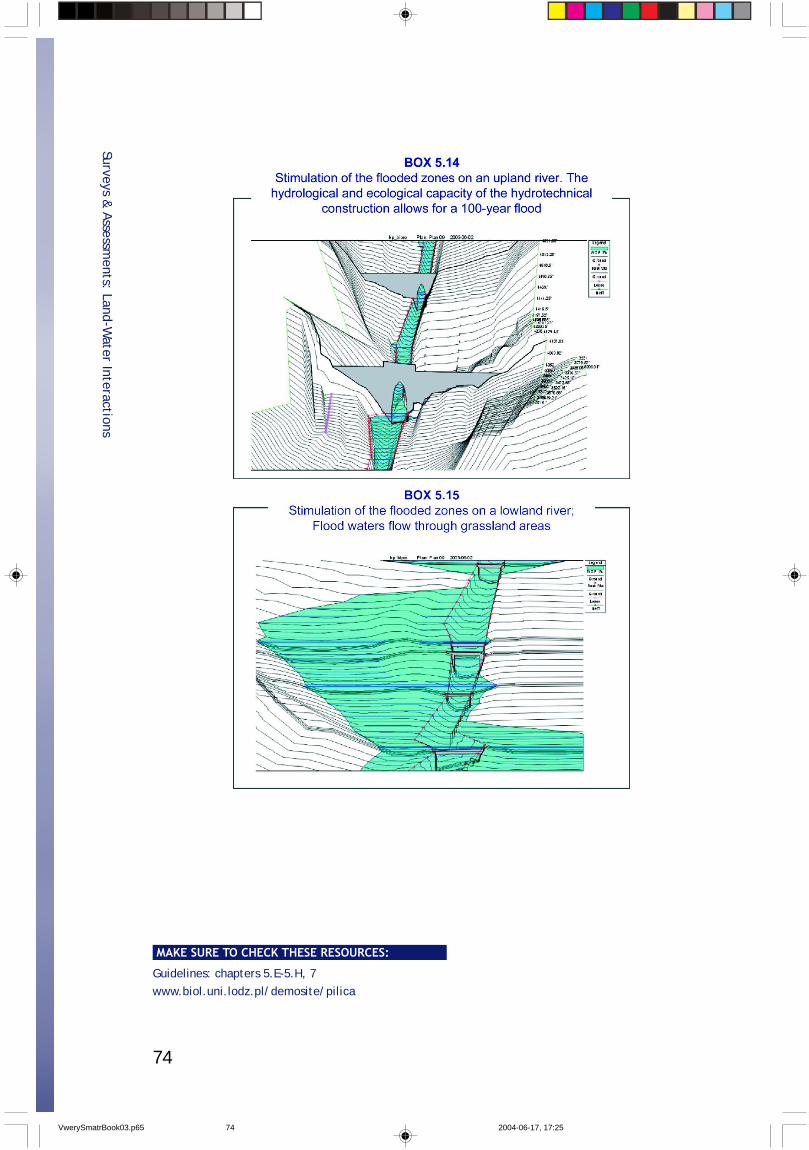
74
Surveys & Assessm
ents: Land-Water Interactions
Guidelines: chapters 5.E-5.H, 7www.biol.uni.lodz.pl/demosite/pilica
MAKE SURE TO CHECK THESE RESOURCES:
VwerySmatrBook03.p65 2004-06-17, 17:2574
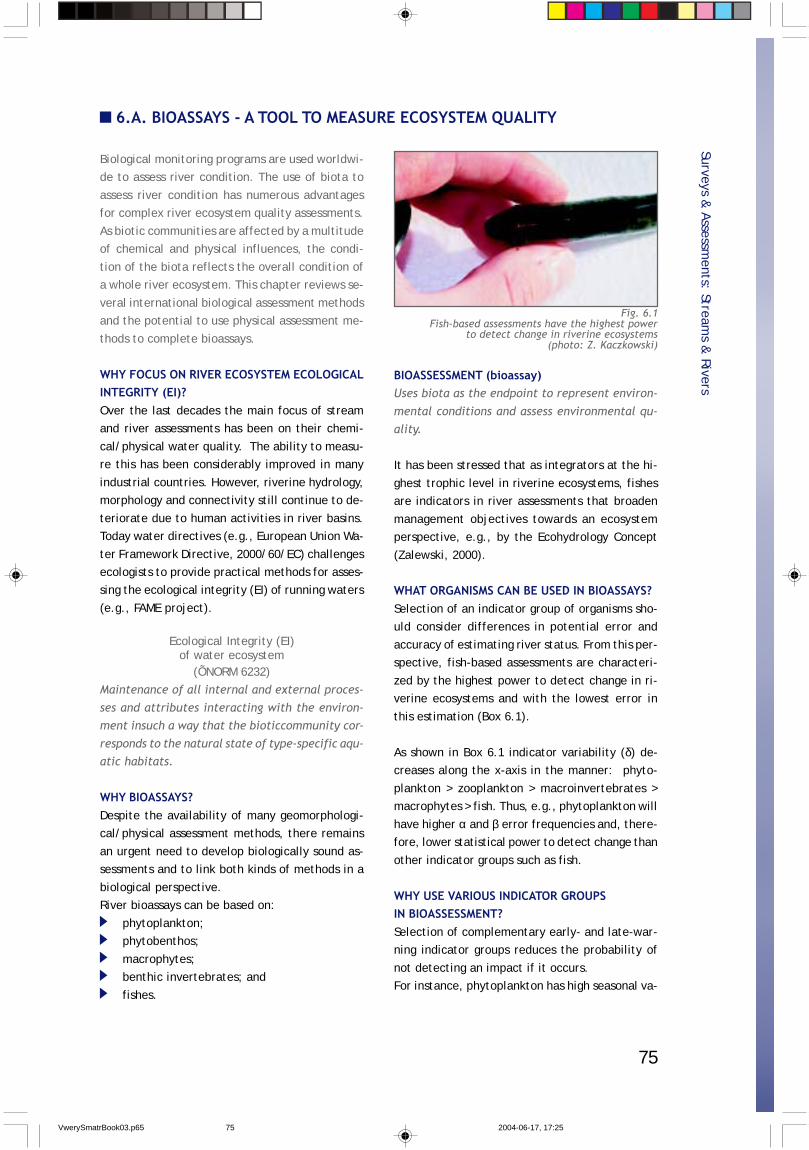
75
Biological monitoring programs are used worldwi-de to assess river condition. The use of biota to
assess river condition has numerous advantagesfor complex river ecosystem quality assessments.
As biotic communities are affected by a multitudeof chemical and physical influences, the condi-
tion of the biota reflects the overall condition ofa whole river ecosystem. This chapter reviews se-
veral international biological assessment methodsand the potential to use physical assessment me-
thods to complete bioassays.
WHY FOCUS ON RIVER ECOSYSTEM ECOLOGICALINTEGRITY (EI)?Over the last decades the main focus of streamand river assessments has been on their chemi-
cal/physical water quality. The ability to measu-re this has been considerably improved in many
industrial countries. However, riverine hydrology,morphology and connectivity still continue to de-
teriorate due to human activities in river basins.Today water directives (e.g., European Union Wa-
ter Framework Directive, 2000/60/EC) challengesecologists to provide practical methods for asses-sing the ecological integrity (EI) of running waters
(e.g., FAME project).
Ecological Integrity (EI)of water ecosystem
(ÕNORM 6232)Maintenance of all internal and external proces-
ses and attributes interacting with the environ-ment insuch a way that the bioticcommunity cor-
responds to the natural state of type-specific aqu-atic habitats.
WHY BIOASSAYS?Despite the availability of many geomorphologi-cal/physical assessment methods, there remains
an urgent need to develop biologically sound as-sessments and to link both kinds of methods in a
biological perspective.River bioassays can be based on:
phytoplankton;phytobenthos;
macrophytes;benthic invertebrates; and
fishes.
6.A. BIOASSAYS - A TOOL TO MEASURE ECOSYSTEM QUALITY
BIOASSESSMENT (bioassay)Uses biota as the endpoint to represent environ-
mental conditions and assess environmental qu-ality.
It has been stressed that as integrators at the hi-
ghest trophic level in riverine ecosystems, fishesare indicators in river assessments that broaden
management objectives towards an ecosystemperspective, e.g., by the Ecohydrology Concept
(Zalewski, 2000).
WHAT ORGANISMS CAN BE USED IN BIOASSAYS?Selection of an indicator group of organisms sho-uld consider differences in potential error and
accuracy of estimating river status. From this per-spective, fish-based assessments are characteri-
zed by the highest power to detect change in ri-verine ecosystems and with the lowest error in
this estimation (Box 6.1).
As shown in Box 6.1 indicator variability (δ) de-creases along the x-axis in the manner: phyto-
plankton > zooplankton > macroinvertebrates >macrophytes > fish. Thus, e.g., phytoplankton will
have higher α and β error frequencies and, there-fore, lower statistical power to detect change than
other indicator groups such as fish.
WHY USE VARIOUS INDICATOR GROUPSIN BIOASSESSMENT?Selection of complementary early- and late-war-ning indicator groups reduces the probability of
not detecting an impact if it occurs.For instance, phytoplankton has high seasonal va-
Surveys & Assessm
ents: Streams &
Rivers
Fig. 6.1Fish-based assessments have the highest power
to detect change in riverine ecosystems(photo: Z. Kaczkowski)
VwerySmatrBook03.p65 2004-06-17, 17:2575
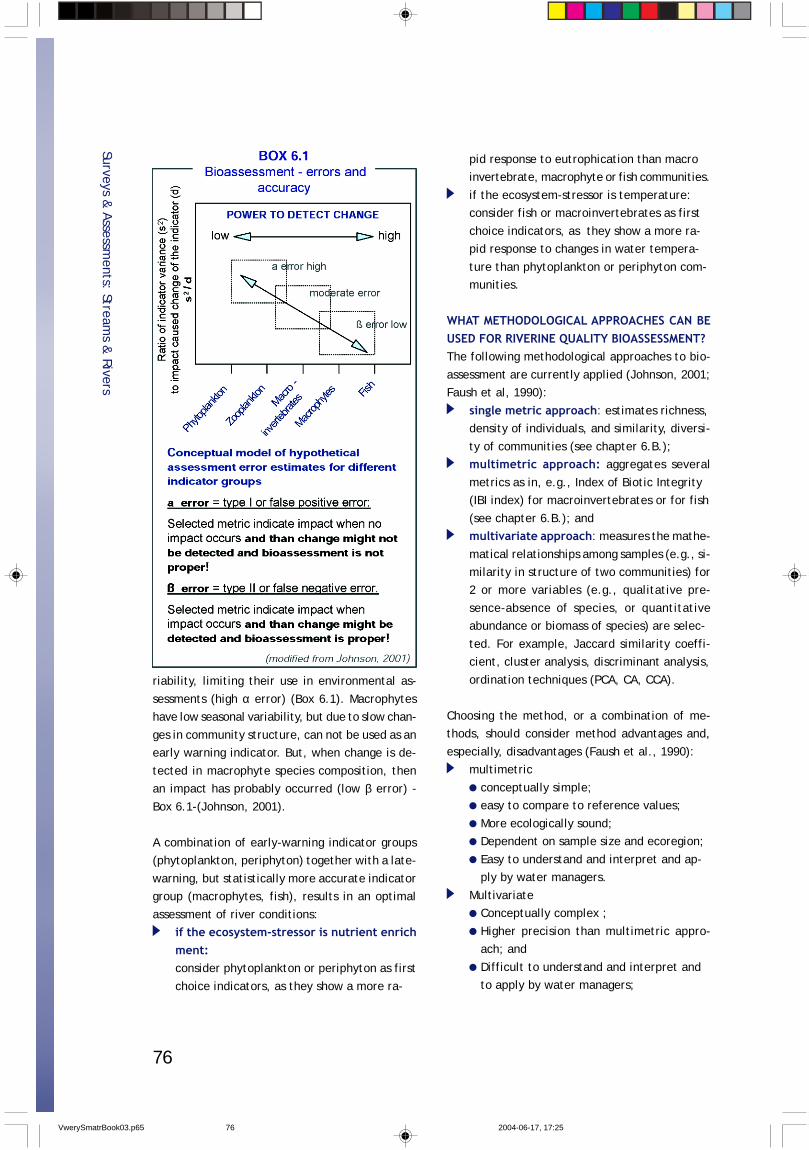
76
riability, limiting their use in environmental as-
sessments (high α error) (Box 6.1). Macrophyteshave low seasonal variability, but due to slow chan-
ges in community structure, can not be used as anearly warning indicator. But, when change is de-
tected in macrophyte species composition, thenan impact has probably occurred (low β error) -
Box 6.1-(Johnson, 2001).
A combination of early-warning indicator groups(phytoplankton, periphyton) together with a late-
warning, but statistically more accurate indicatorgroup (macrophytes, fish), results in an optimal
assessment of river conditions:if the ecosystem-stressor is nutrient enrichment:consider phytoplankton or periphyton as first
choice indicators, as they show a more ra-
pid response to eutrophication than macroinvertebrate, macrophyte or fish communities.
if the ecosystem-stressor is temperature:consider fish or macroinvertebrates as first
choice indicators, as they show a more ra-pid response to changes in water tempera-
ture than phytoplankton or periphyton com-munities.
WHAT METHODOLOGICAL APPROACHES CAN BEUSED FOR RIVERINE QUALITY BIOASSESSMENT?The following methodological approaches to bio-
assessment are currently applied (Johnson, 2001;Faush et al, 1990):
single metric approach: estimates richness,density of individuals, and similarity, diversi-
ty of communities (see chapter 6.B.);multimetric approach: aggregates several
metrics as in, e.g., Index of Biotic Integrity(IBI index) for macroinvertebrates or for fish
(see chapter 6.B.); andmultivariate approach: measures the mathe-
matical relationships among samples (e.g., si-milarity in structure of two communities) for2 or more variables (e.g., qualitative pre-
sence-absence of species, or quantitativeabundance or biomass of species) are selec-
ted. For example, Jaccard similarity coeffi-cient, cluster analysis, discriminant analysis,
ordination techniques (PCA, CA, CCA).
Choosing the method, or a combination of me-thods, should consider method advantages and,
especially, disadvantages (Faush et al., 1990):multimetric
conceptually simple;easy to compare to reference values;
More ecologically sound;Dependent on sample size and ecoregion;
Easy to understand and interpret and ap-ply by water managers.
MultivariateConceptually complex ;
Higher precision than multimetric appro-ach; and
Difficult to understand and interpret andto apply by water managers;
Surveys & Assessm
ents: Streams &
Rivers
VwerySmatrBook03.p65 2004-06-17, 17:2576
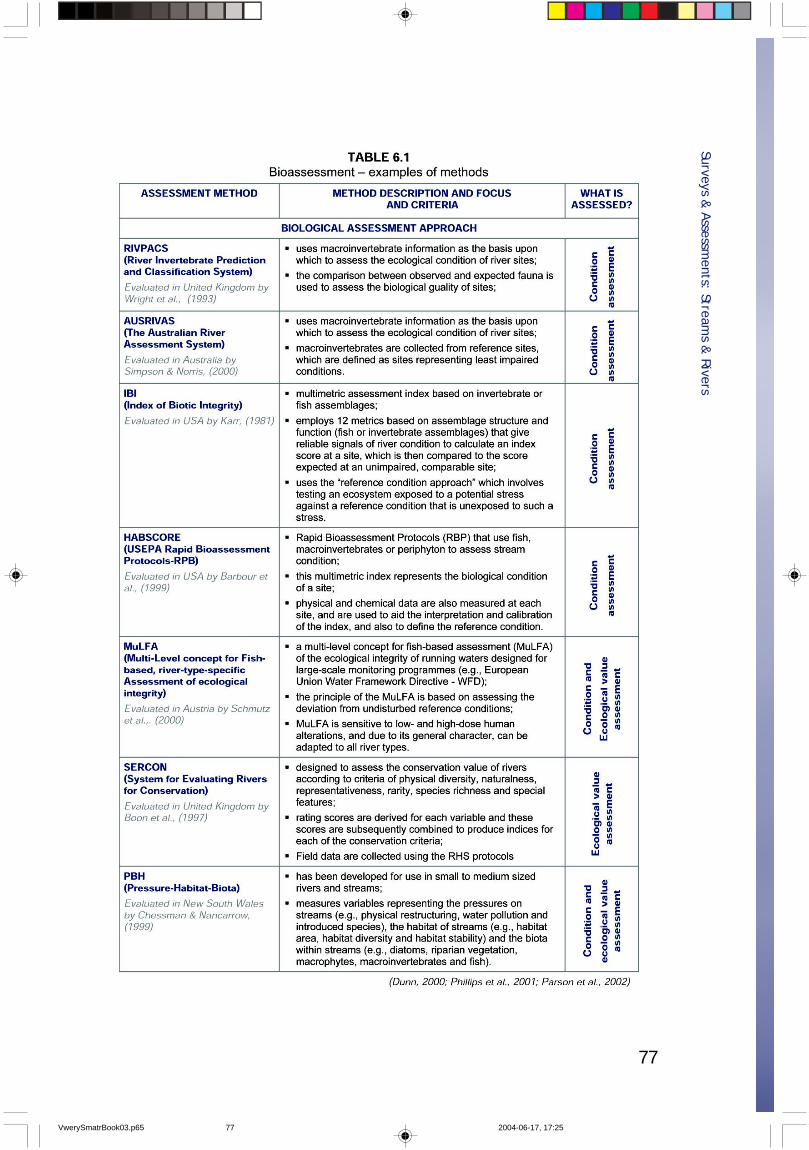
77
Surveys & Assessm
ents: Streams &
Rivers
VwerySmatrBook03.p65 2004-06-17, 17:2577
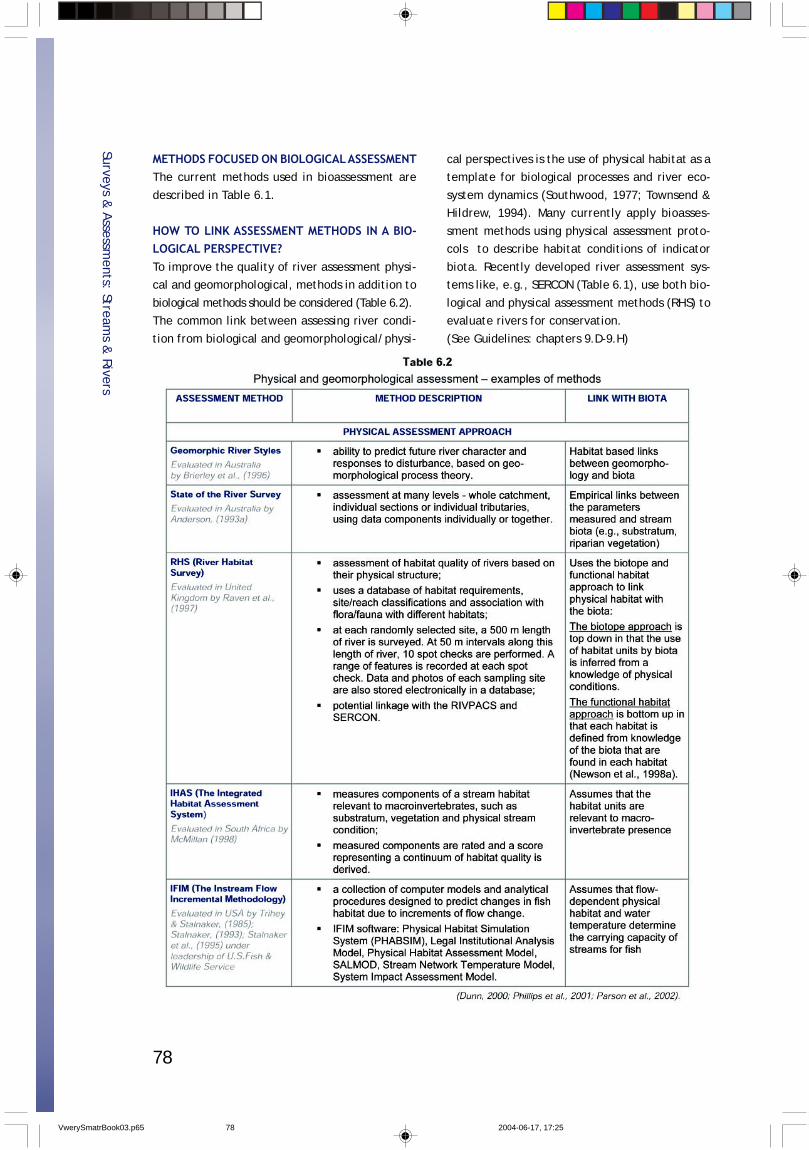
78
Surveys & Assessm
ents: Streams &
Rivers
METHODS FOCUSED ON BIOLOGICAL ASSESSMENTThe current methods used in bioassessment are
described in Table 6.1.
HOW TO LINK ASSESSMENT METHODS IN A BIO-LOGICAL PERSPECTIVE?To improve the quality of river assessment physi-cal and geomorphological, methods in addition to
biological methods should be considered (Table 6.2).The common link between assessing river condi-
tion from biological and geomorphological/physi-
cal perspectives is the use of physical habitat as atemplate for biological processes and river eco-
system dynamics (Southwood, 1977; Townsend &Hildrew, 1994). Many currently apply bioasses-
sment methods using physical assessment proto-cols to describe habitat conditions of indicator
biota. Recently developed river assessment sys-tems like, e.g., SERCON (Table 6.1), use both bio-
logical and physical assessment methods (RHS) toevaluate rivers for conservation.
(See Guidelines: chapters 9.D-9.H)
VwerySmatrBook03.p65 2004-06-17, 17:2578

79
6.B. FISH COMMUNITIES - INDICATORS OF RIVERINE DEGRADATION
Fish attributes clearly distinguish fishes from otheraquatic organisms and underline their significan-
ce as essential indicators to assess the ecologicalintegrity of running waters and to estimate their
degradation. This chapter presents historical andrecent approaches to correctly use fish as a tool
in riverine bioassesment.
WHY FISH-BASED RIVER ASSESSMENTS?„Fish communities reflect watershed conditions”,which means that a fish community is a sensitive
condition indicator of both an aquatic ecosystemand its surrounding watershed. Because of this,
fish communities can be used in biological moni-toring to assess environmental degradation
(Karr 1987).
Several attributes of fishes underline their essen-tial role as indicators of the ecological integrity
(EI) of running waters (after Schmutz et al. 2000a):presence in almost all water bodies;well known taxonomy;
well known life history;well known ecological requirements;
available historical information;high habitat preferences make them indica-
tive for habitat quality;migratory behavior makes them indicative of
river continuum/river connectivity condi-tions;
as top predators, subsume trophic conditions across a food chain;
as members of a specific trophic guild, pro-vide detailed information on respective tro-
phic levels;longevity makes them indicative for long time
periods;fishery and sport fishing has a long tradition
in which fishes have been used as indicatorsfor water quality; and
economic and aesthetic value helpful in riverha-bitat protection and conservation planning.
WHAT ARE FISH-BASED ASSESSMENT CONCEPTS?The framework on how to use fish communities to
describe levels of river degradation is well docu-mented in the multi-level concept for fish-based,
river-type-specific assessment of ecological inte-grity (MuLFA) (Schmutz et al., 2000a). The con-
cept of this assessment method is based on thehierarchical organization of biota (Odum, 1971)
and the linkages of the various organizational le-vels to temporal/spatial scales (Frissell et al.,
1986; see: chapter 11.A). According to that the-oretical principle, higher levels (fauna or river
basin) are more persistent compared to lower le-vels (individual or microhabitat) and, thereby, less
sensitive to degradation than smaller ones. Thus,only a set of assessment criteria selected from
different hierarchical levels can guarantee thatvarious human alterations can be detected.
Why taking into account the fish-based river as-sessment, It should be also considered that , rive-
rine fish community is regulated by a continuumof abiotic-biotic factors, which pressure changes
along river continuum and strongly depends ongeographical area of the world (Box 6.9). The
model described by Zalewski & Naiman (1985) con-siders a hydrology, slope and climate as major
abiotic, and river productivity, predation and com-petition as major biotic factors. The general as-
sumption of the model is that abiotic factors areof the main importance in all world river types,
however while they become stable and predicta-ble the biotic factors start to manifest themse-
lves. Thus, with increase in river spatial hetero-
Surveys & Assessm
ents: Streams &
Rivers
Fig. 6.2Fish communities reflect watershed conditions
(photo: Z. Kaczkowski)
VwerySmatrBook03.p65 2004-06-17, 17:2579
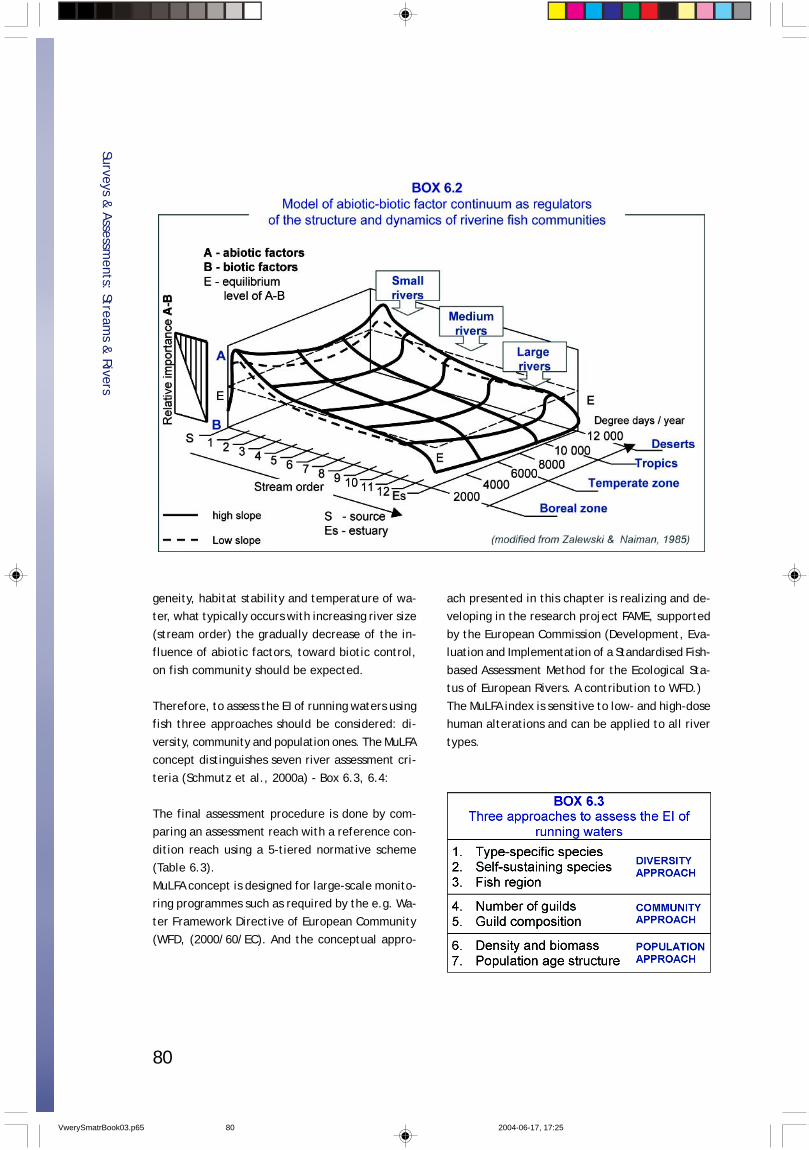
80
geneity, habitat stability and temperature of wa-ter, what typically occurs with increasing river size
(stream order) the gradually decrease of the in-fluence of abiotic factors, toward biotic control,
on fish community should be expected.
Therefore, to assess the EI of running waters usingfish three approaches should be considered: di-
versity, community and population ones. The MuLFAconcept distinguishes seven river assessment cri-
teria (Schmutz et al., 2000a) - Box 6.3, 6.4:
The final assessment procedure is done by com-paring an assessment reach with a reference con-
dition reach using a 5-tiered normative scheme(Table 6.3).
MuLFA concept is designed for large-scale monito-ring programmes such as required by the e.g. Wa-
ter Framework Directive of European Community(WFD, (2000/60/EC). And the conceptual appro-
Surveys & Assessm
ents: Streams &
Rivers
ach presented in this chapter is realizing and de-veloping in the research project FAME, supported
by the European Commission (Development, Eva-luation and Implementation of a Standardised Fish-
based Assessment Method for the Ecological Sta-tus of European Rivers. A contribution to WFD.)
The MuLFA index is sensitive to low- and high-dosehuman alterations and can be applied to all river
types.
VwerySmatrBook03.p65 2004-06-17, 17:2580
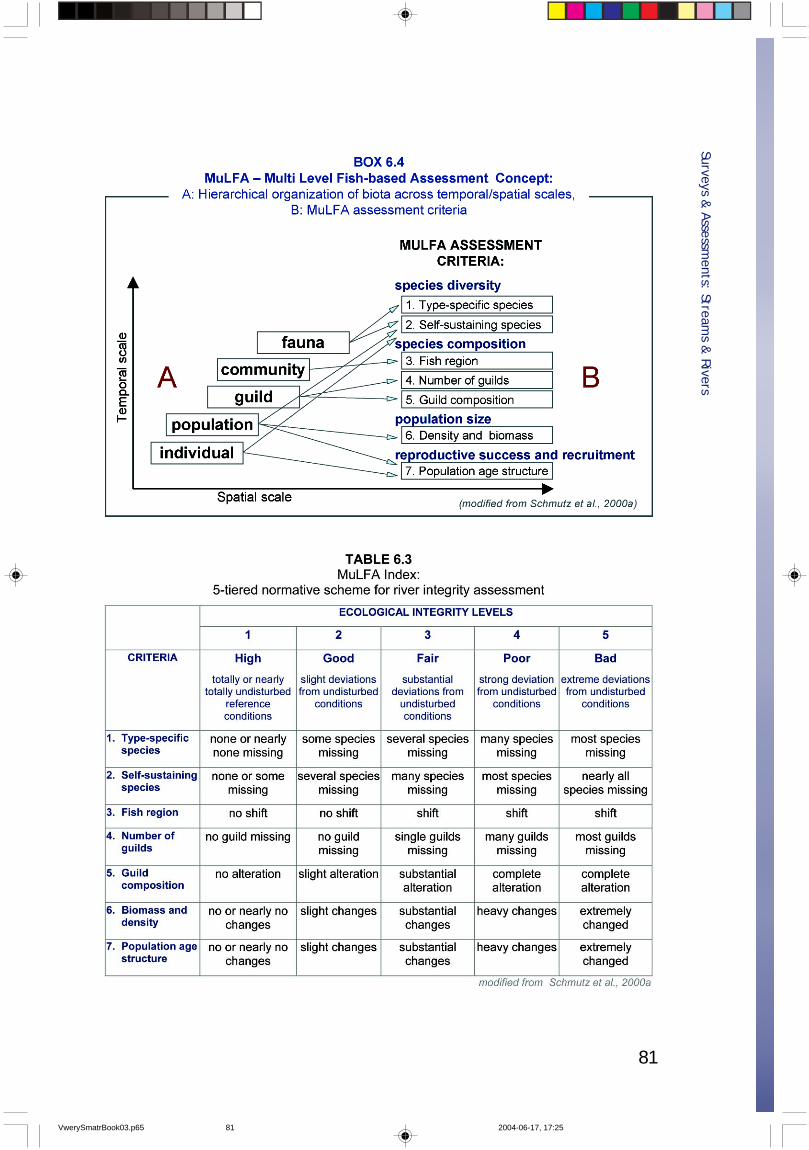
81
Surveys & Assessm
ents: Streams &
Rivers
VwerySmatrBook03.p65 2004-06-17, 17:2581
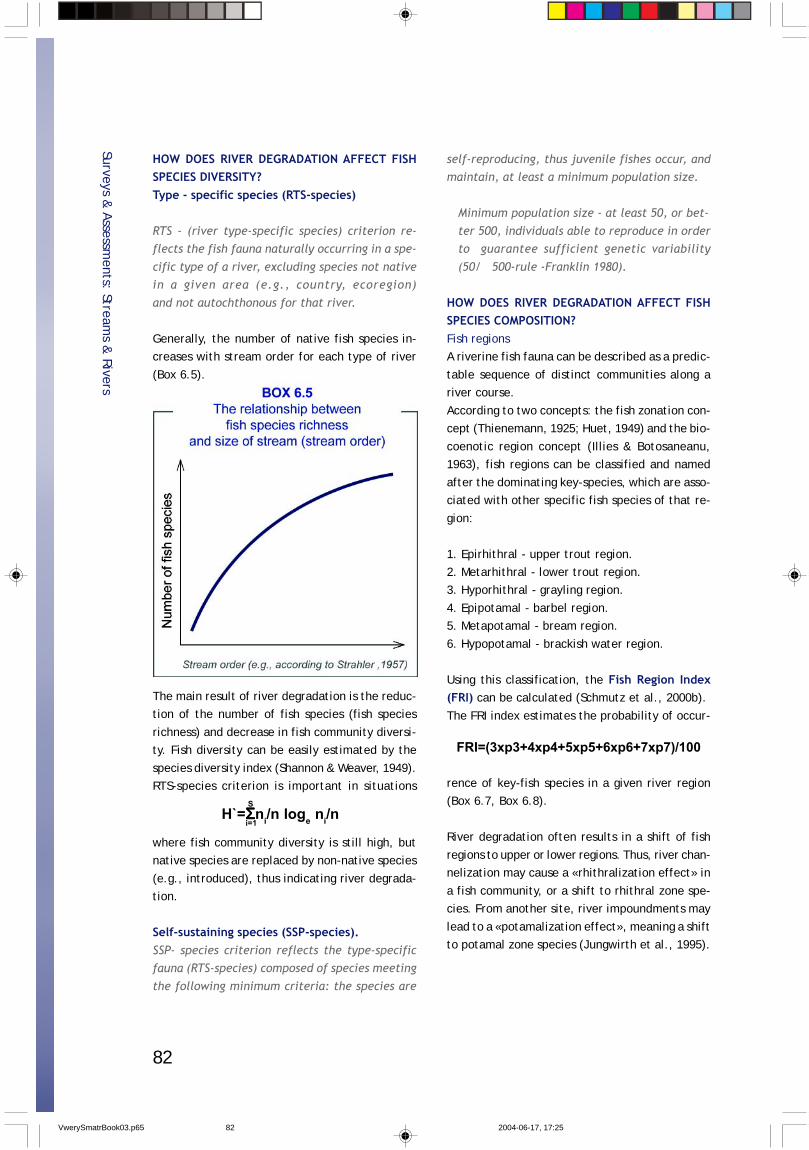
82
HOW DOES RIVER DEGRADATION AFFECT FISHSPECIES DIVERSITY?Type - specific species (RTS-species)
RTS - (river type-specific species) criterion re-flects the fish fauna naturally occurring in a spe-
cific type of a river, excluding species not nativein a given area (e.g., country, ecoregion)
and not autochthonous for that river.
Generally, the number of native fish species in-creases with stream order for each type of river
(Box 6.5).
The main result of river degradation is the reduc-tion of the number of fish species (fish species
richness) and decrease in fish community diversi-ty. Fish diversity can be easily estimated by the
species diversity index (Shannon & Weaver, 1949).RTS-species criterion is important in situations
self-reproducing, thus juvenile fishes occur, andmaintain, at least a minimum population size.
Minimum population size - at least 50, or bet-
ter 500, individuals able to reproduce in orderto guarantee sufficient genetic variability
(50/ 500-rule -Franklin 1980).
HOW DOES RIVER DEGRADATION AFFECT FISHSPECIES COMPOSITION?Fish regionsA riverine fish fauna can be described as a predic-
table sequence of distinct communities along ariver course.
According to two concepts: the fish zonation con-cept (Thienemann, 1925; Huet, 1949) and the bio-
coenotic region concept (Illies & Botosaneanu,1963), fish regions can be classified and named
after the dominating key-species, which are asso-ciated with other specific fish species of that re-
gion:
1. Epirhithral - upper trout region.2. Metarhithral - lower trout region.3. Hyporhithral - grayling region.
4. Epipotamal - barbel region.5. Metapotamal - bream region.
6. Hypopotamal - brackish water region.
Using this classification, the Fish Region Index(FRI) can be calculated (Schmutz et al., 2000b).
The FRI index estimates the probability of occur-Surveys &
Assessments: Stream
s & Rivers
where fish community diversity is still high, butnative species are replaced by non-native species
(e.g., introduced), thus indicating river degrada-tion.
Self-sustaining species (SSP-species).SSP- species criterion reflects the type-specificfauna (RTS-species) composed of species meeting
the following minimum criteria: the species are
rence of key-fish species in a given river region(Box 6.7, Box 6.8).
River degradation often results in a shift of fish
regions to upper or lower regions. Thus, river chan-nelization may cause a «rhithralization effect» in
a fish community, or a shift to rhithral zone spe-cies. From another site, river impoundments may
lead to a «potamalization effect», meaning a shiftto potamal zone species (Jungwirth et al., 1995).
H`=ΣΣΣΣΣni/n loge ni/nS
i=1
FRI=(3xp3+4xp4+5xp5+6xp6+7xp7)/100
VwerySmatrBook03.p65 2004-06-17, 17:2582
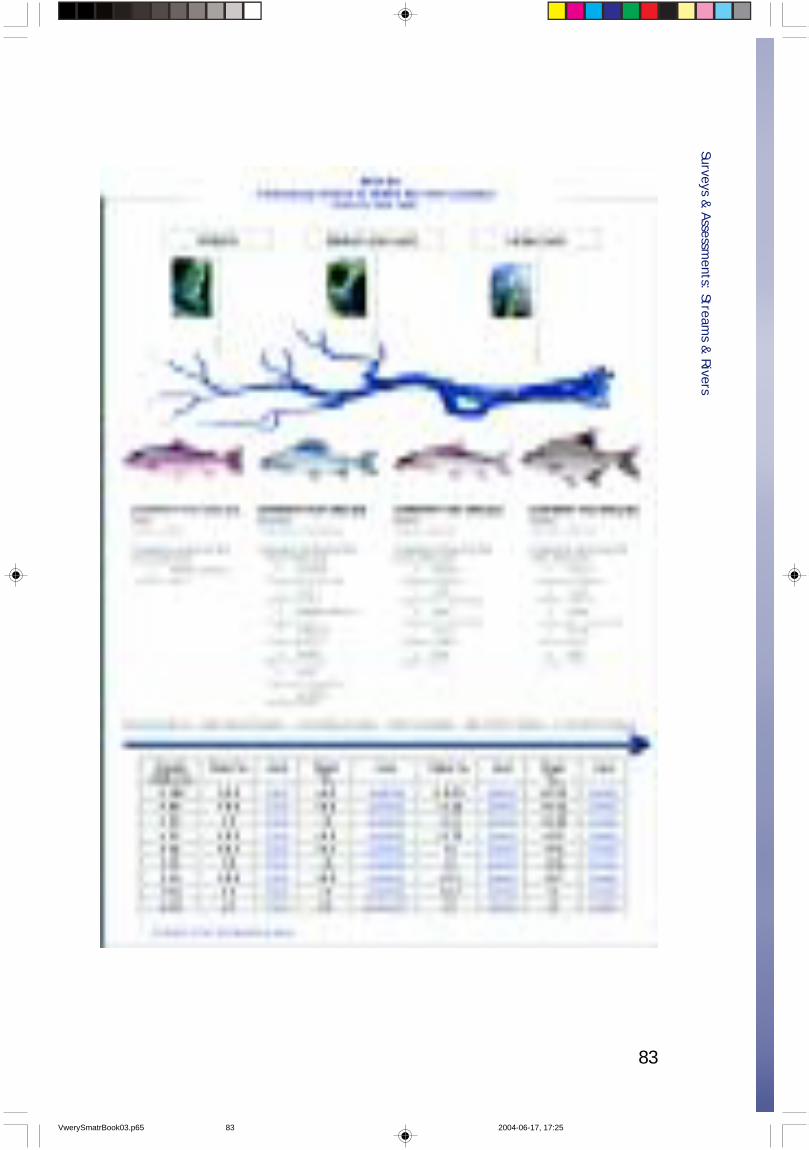
83
Surveys & Assessm
ents: Streams &
Rivers
VwerySmatrBook03.p65 2004-06-17, 17:2583
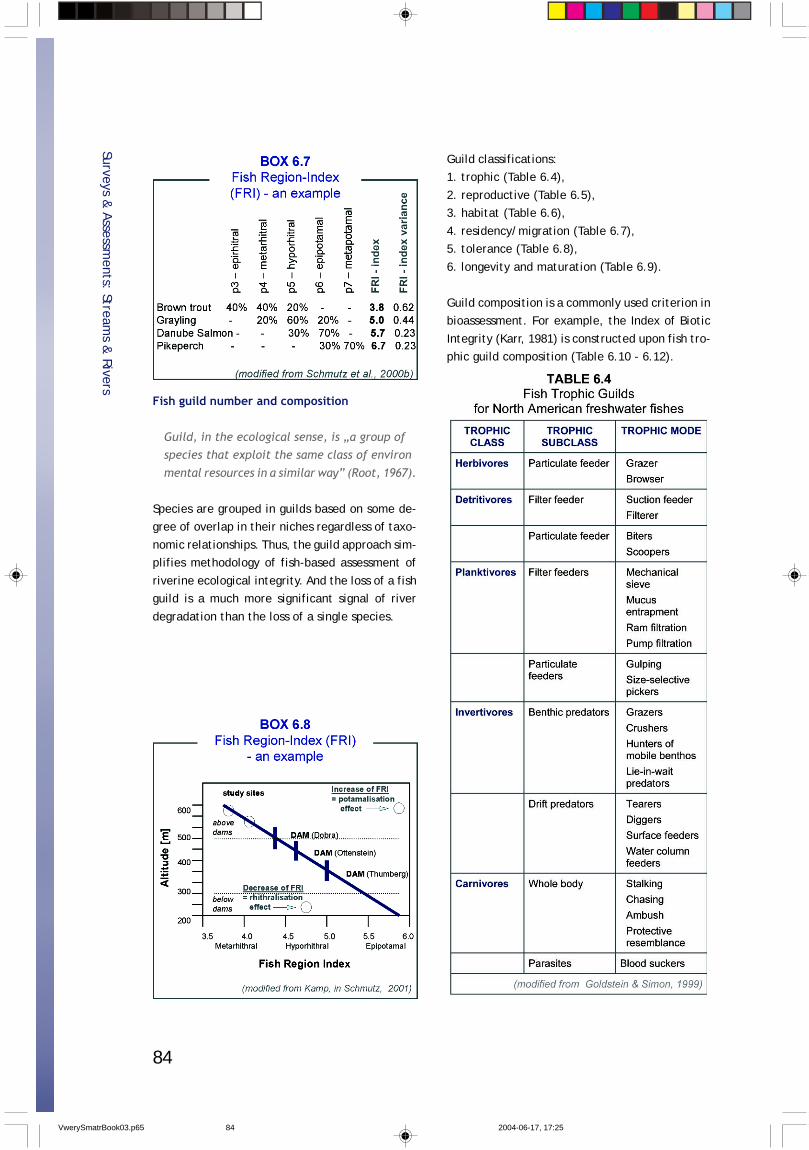
84
Fish guild number and composition
Guild, in the ecological sense, is „a group ofspecies that exploit the same class of environ
mental resources in a similar way” (Root, 1967).
Species are grouped in guilds based on some de-gree of overlap in their niches regardless of taxo-
nomic relationships. Thus, the guild approach sim-plifies methodology of fish-based assessment of
riverine ecological integrity. And the loss of a fishguild is a much more significant signal of river
degradation than the loss of a single species.
Guild classifications:1. trophic (Table 6.4),
2. reproductive (Table 6.5),3. habitat (Table 6.6),
4. residency/migration (Table 6.7),5. tolerance (Table 6.8),
6. longevity and maturation (Table 6.9).
Guild composition is a commonly used criterion inbioassessment. For example, the Index of Biotic
Integrity (Karr, 1981) is constructed upon fish tro-phic guild composition (Table 6.10 - 6.12).
Surveys & Assessm
ents: Streams &
Rivers
VwerySmatrBook03.p65 2004-06-17, 17:2584
85
Surveys & Assessm
ents: Streams &
Rivers
For the European fish communities the originalAmerican IBI should be modified (Table 6.11).
The main effects of river degradation on fish com-munities in the context of the IBI index are sum-
marized in Table 6.13.
HOW RIVER DEGRADATION MAY AFFECTFISH POPULATION SIZEDensity and biomassFish population size (density and biomass) can re-
flect river degradation before these impacts startto limit the existence of fish species.
Human alterations can most often be detected asa decrease of population size. But an increase can
also be observed (e.g., caused by eutrophication).The population size of a species should be charac-
terized by quantitative measures - density andbiomass per area or river length.
VwerySmatrBook03.p65 2004-06-17, 17:2585
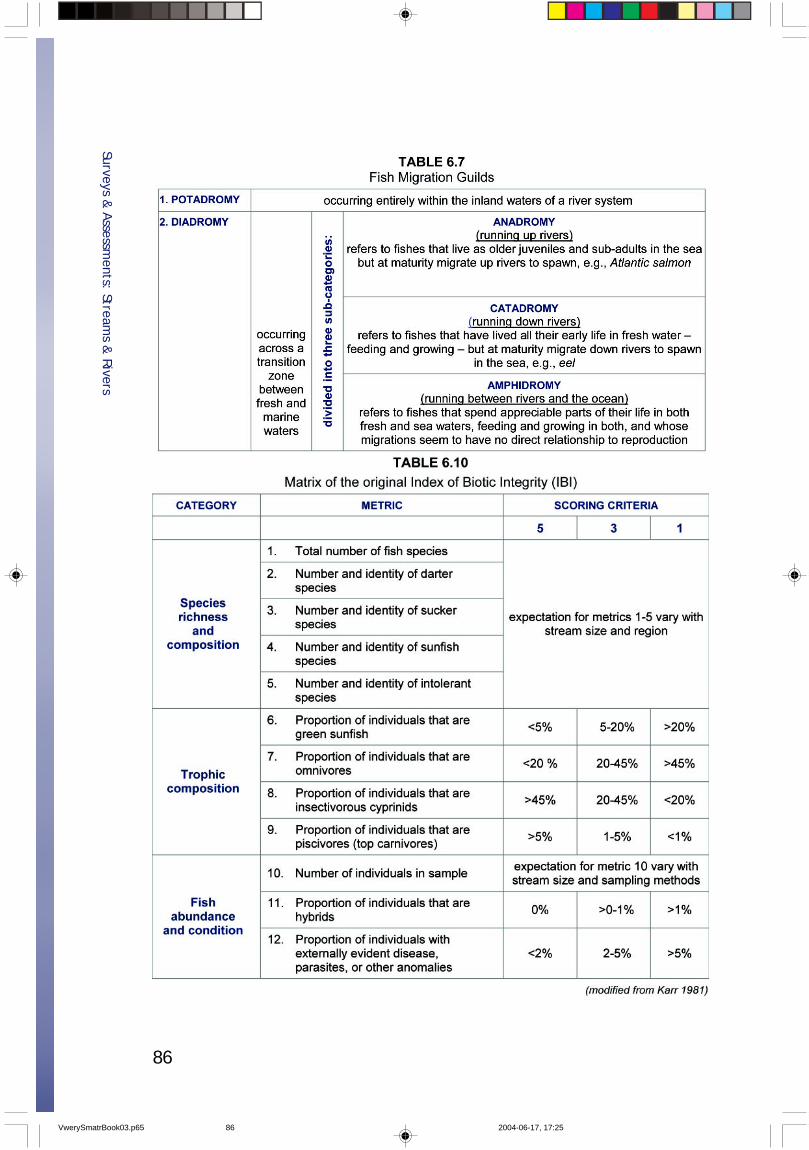
86
Surveys & Assessm
ents: Streams &
Rivers
VwerySmatrBook03.p65 2004-06-17, 17:2586
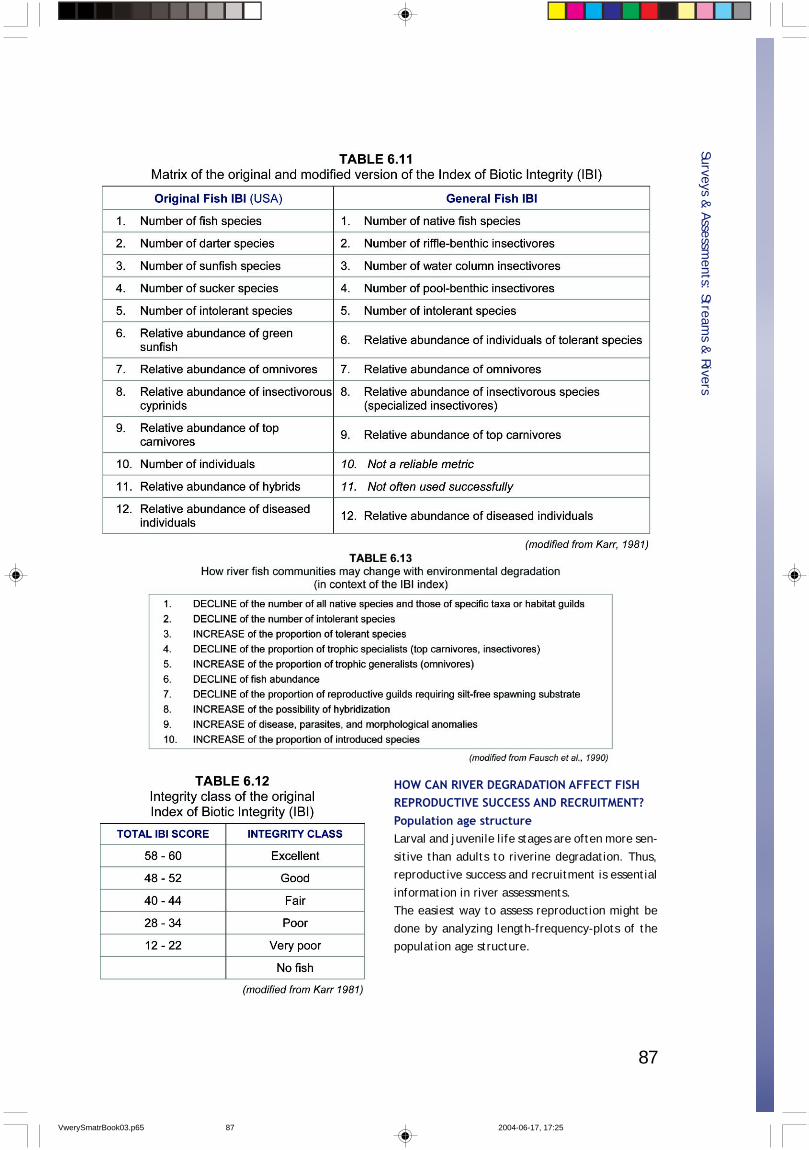
87
Surveys & Assessm
ents: Streams &
Rivers
HOW CAN RIVER DEGRADATION AFFECT FISHREPRODUCTIVE SUCCESS AND RECRUITMENT?Population age structureLarval and juvenile life stages are often more sen-
sitive than adults to riverine degradation. Thus,reproductive success and recruitment is essential
information in river assessments.The easiest way to assess reproduction might be
done by analyzing length-frequency-plots of thepopulation age structure.
VwerySmatrBook03.p65 2004-06-17, 17:2587
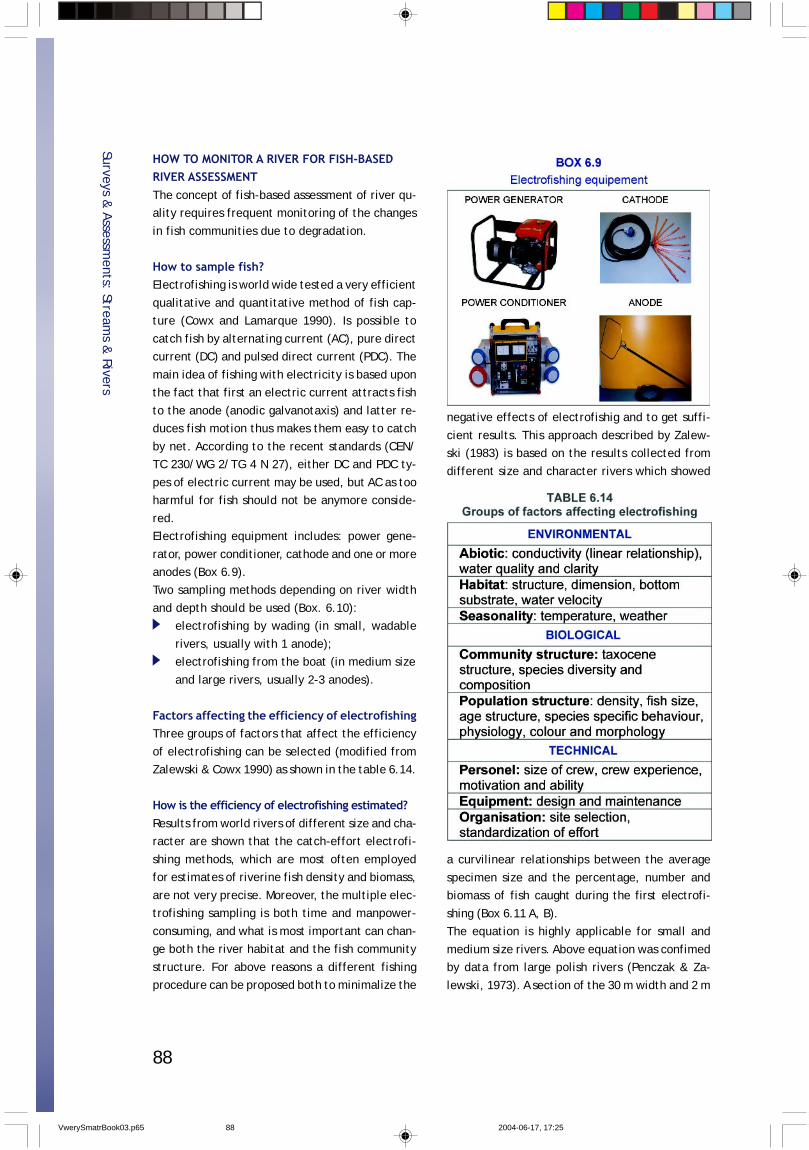
88
HOW TO MONITOR A RIVER FOR FISH-BASEDRIVER ASSESSMENTThe concept of fish-based assessment of river qu-ality requires frequent monitoring of the changes
in fish communities due to degradation.
How to sample fish?Electrofishing is world wide tested a very efficient
qualitative and quantitative method of fish cap-ture (Cowx and Lamarque 1990). Is possible to
catch fish by alternating current (AC), pure directcurrent (DC) and pulsed direct current (PDC). The
main idea of fishing with electricity is based uponthe fact that first an electric current attracts fish
to the anode (anodic galvanotaxis) and latter re-duces fish motion thus makes them easy to catch
by net. According to the recent standards (CEN/TC 230/WG 2/TG 4 N 27), either DC and PDC ty-
pes of electric current may be used, but AC as tooharmful for fish should not be anymore conside-
red.Electrofishing equipment includes: power gene-
rator, power conditioner, cathode and one or moreanodes (Box 6.9).Two sampling methods depending on river width
and depth should be used (Box. 6.10):electrofishing by wading (in small, wadable
rivers, usually with 1 anode);electrofishing from the boat (in medium size
and large rivers, usually 2-3 anodes).
Factors affecting the efficiency of electrofishingThree groups of factors that affect the efficiency
of electrofishing can be selected (modified fromZalewski & Cowx 1990) as shown in the table 6.14.
How is the efficiency of electrofishing estimated?Results from world rivers of different size and cha-racter are shown that the catch-effort electrofi-
shing methods, which are most often employedfor estimates of riverine fish density and biomass,
are not very precise. Moreover, the multiple elec-trofishing sampling is both time and manpower-
consuming, and what is most important can chan-ge both the river habitat and the fish community
structure. For above reasons a different fishingprocedure can be proposed both to minimalize the
Surveys & Assessm
ents: Streams &
Rivers
negative effects of electrofishig and to get suffi-
cient results. This approach described by Zalew-ski (1983) is based on the results collected from
different size and character rivers which showed
a curvilinear relationships between the average
specimen size and the percentage, number andbiomass of fish caught during the first electrofi-
shing (Box 6.11 A, B).The equation is highly applicable for small and
medium size rivers. Above equation was confimedby data from large polish rivers (Penczak & Za-
lewski, 1973). A section of the 30 m width and 2 m
VwerySmatrBook03.p65 2004-06-17, 17:2588
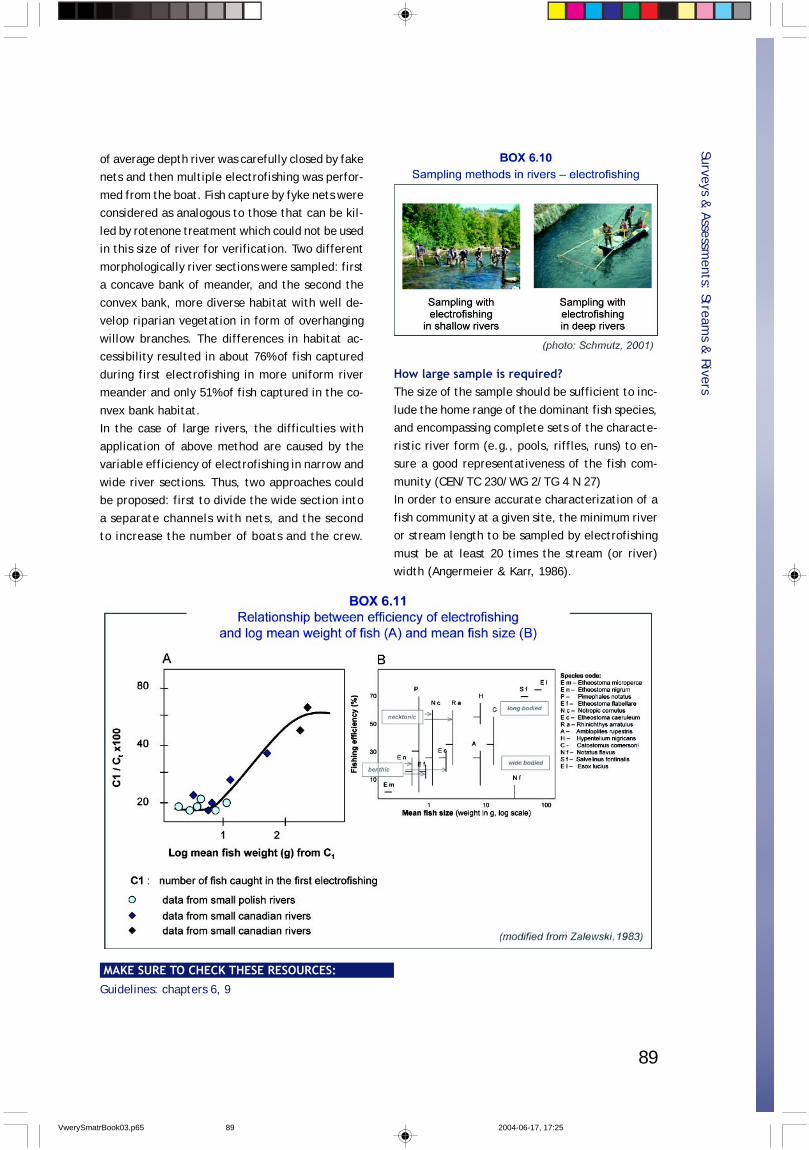
89
Surveys & Assessm
ents: Streams &
Rivers
of average depth river was carefully closed by fakenets and then multiple electrofishing was perfor-
med from the boat. Fish capture by fyke nets wereconsidered as analogous to those that can be kil-
led by rotenone treatment which could not be usedin this size of river for verification. Two different
morphologically river sections were sampled: firsta concave bank of meander, and the second the
convex bank, more diverse habitat with well de-velop riparian vegetation in form of overhanging
willow branches. The differences in habitat ac-cessibility resulted in about 76% of fish captured
during first electrofishing in more uniform rivermeander and only 51% of fish captured in the co-
nvex bank habitat.In the case of large rivers, the difficulties with
application of above method are caused by thevariable efficiency of electrofishing in narrow and
wide river sections. Thus, two approaches couldbe proposed: first to divide the wide section into
a separate channels with nets, and the secondto increase the number of boats and the crew.
How large sample is required?The size of the sample should be sufficient to inc-
lude the home range of the dominant fish species,and encompassing complete sets of the characte-
ristic river form (e.g., pools, riffles, runs) to en-sure a good representativeness of the fish com-
munity (CEN/TC 230/WG 2/TG 4 N 27)In order to ensure accurate characterization of a
fish community at a given site, the minimum riveror stream length to be sampled by electrofishing
must be at least 20 times the stream (or river)width (Angermeier & Karr, 1986).
MAKE SURE TO CHECK THESE RESOURCES:
Guidelines: chapters 6, 9
VwerySmatrBook03.p65 2004-06-17, 17:2589
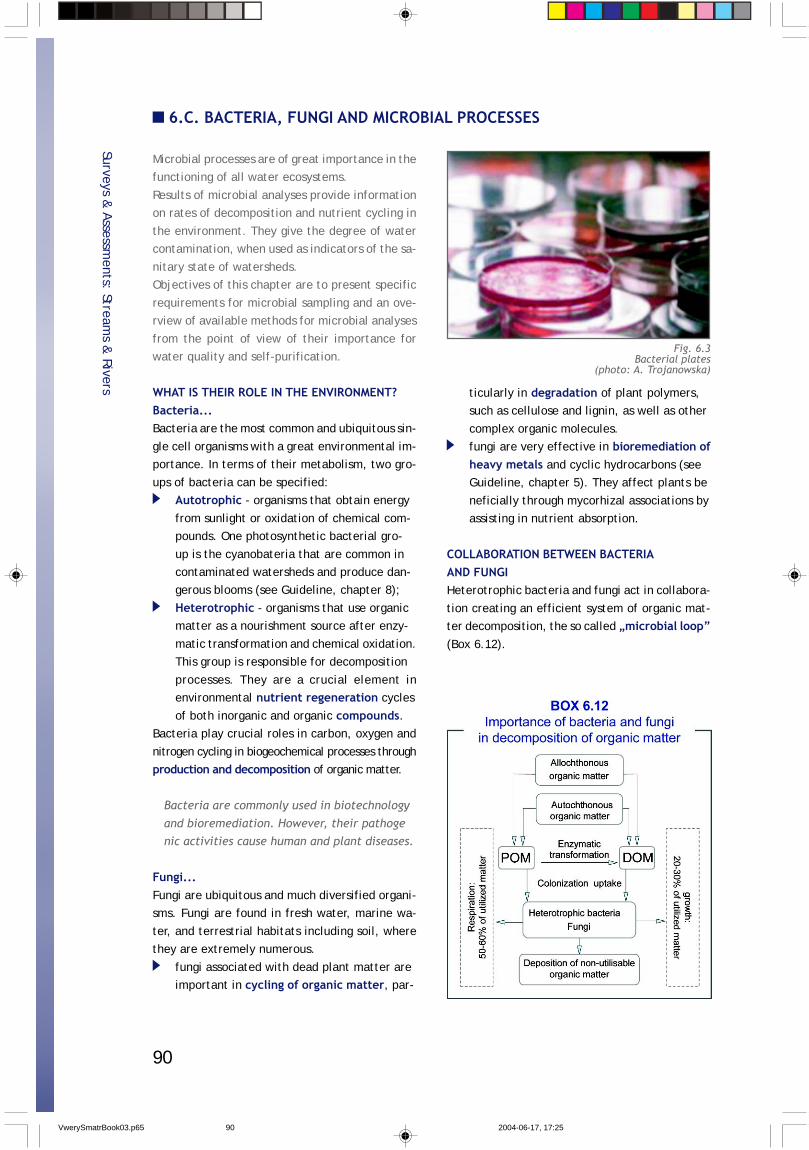
90
6.C. BACTERIA, FUNGI AND MICROBIAL PROCESSES
Microbial processes are of great importance in thefunctioning of all water ecosystems.
Results of microbial analyses provide informationon rates of decomposition and nutrient cycling in
the environment. They give the degree of watercontamination, when used as indicators of the sa-
nitary state of watersheds.Objectives of this chapter are to present specific
requirements for microbial sampling and an ove-rview of available methods for microbial analyses
from the point of view of their importance forwater quality and self-purification.
WHAT IS THEIR ROLE IN THE ENVIRONMENT?Bacteria...Bacteria are the most common and ubiquitous sin-
gle cell organisms with a great environmental im-portance. In terms of their metabolism, two gro-
ups of bacteria can be specified:Autotrophic - organisms that obtain energy
from sunlight or oxidation of chemical com-pounds. One photosynthetic bacterial gro-
up is the cyanobateria that are common incontaminated watersheds and produce dan-gerous blooms (see Guideline, chapter 8);
Heterotrophic - organisms that use organicmatter as a nourishment source after enzy-
matic transformation and chemical oxidation.This group is responsible for decomposition
processes. They are a crucial element inenvironmental nutrient regeneration cycles
of both inorganic and organic compounds.Bacteria play crucial roles in carbon, oxygen and
nitrogen cycling in biogeochemical processes throughproduction and decomposition of organic matter.
Bacteria are commonly used in biotechnology
and bioremediation. However, their pathogenic activities cause human and plant diseases.
Fungi...Fungi are ubiquitous and much diversified organi-sms. Fungi are found in fresh water, marine wa-
ter, and terrestrial habitats including soil, wherethey are extremely numerous.
fungi associated with dead plant matter areimportant in cycling of organic matter, par-
ticularly in degradation of plant polymers,such as cellulose and lignin, as well as other
complex organic molecules.fungi are very effective in bioremediation ofheavy metals and cyclic hydrocarbons (seeGuideline, chapter 5). They affect plants be
neficially through mycorhizal associations byassisting in nutrient absorption.
COLLABORATION BETWEEN BACTERIAAND FUNGIHeterotrophic bacteria and fungi act in collabora-
tion creating an efficient system of organic mat-ter decomposition, the so called „microbial loop”(Box 6.12).
Surveys & Assessm
ents: Streams &
Rivers
Fig. 6.3Bacterial plates
(photo: A. Trojanowska)
VwerySmatrBook03.p65 2004-06-17, 17:2590
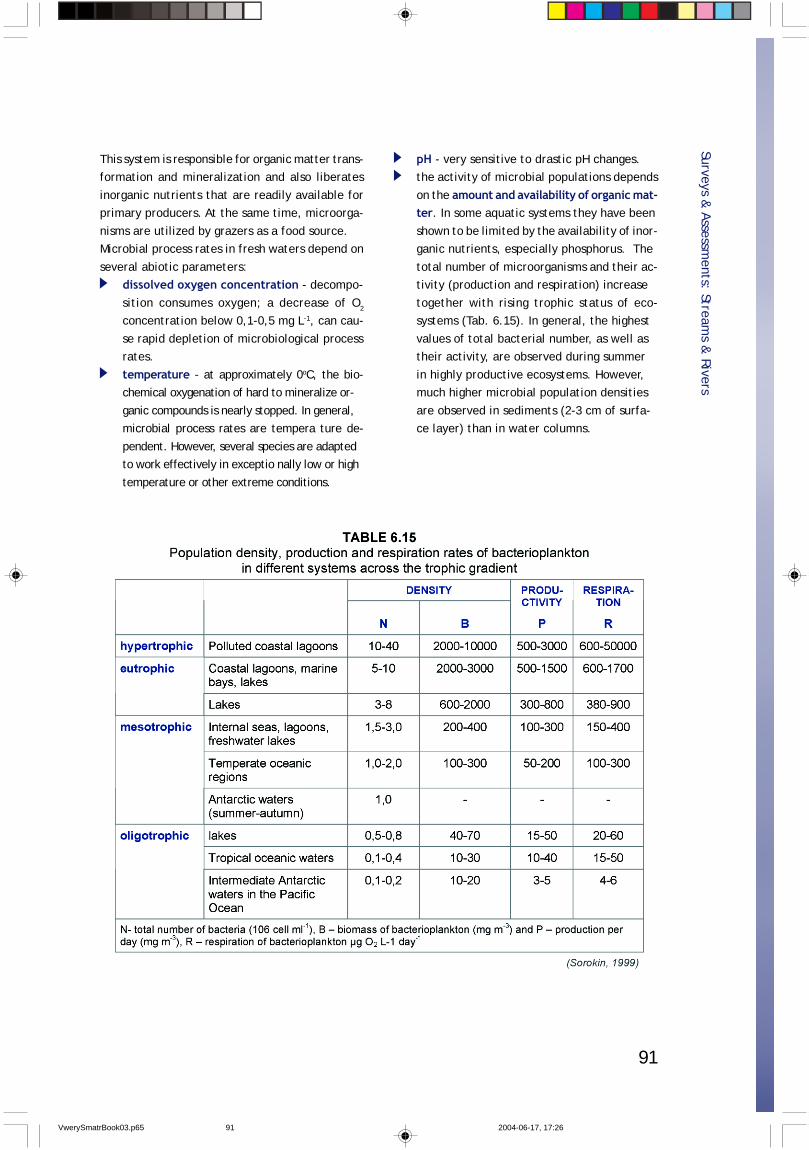
91
This system is responsible for organic matter trans-formation and mineralization and also liberates
inorganic nutrients that are readily available forprimary producers. At the same time, microorga-
nisms are utilized by grazers as a food source.Microbial process rates in fresh waters depend on
several abiotic parameters:dissolved oxygen concentration - decompo-
sition consumes oxygen; a decrease of O2
concentration below 0,1-0,5 mg L-1, can cau-
se rapid depletion of microbiological processrates.
temperature - at approximately 0oC, the bio-chemical oxygenation of hard to mineralize or-
ganic compounds is nearly stopped. In general,microbial process rates are tempera ture de-
pendent. However, several species are adaptedto work effectively in exceptio nally low or high
temperature or other extreme conditions.
Surveys & Assessm
ents: Streams &
Rivers
pH - very sensitive to drastic pH changes.the activity of microbial populations depends
on the amount and availability of organic mat-ter. In some aquatic systems they have been
shown to be limited by the availability of inor-ganic nutrients, especially phosphorus. The
total number of microorganisms and their ac-tivity (production and respiration) increase
together with rising trophic status of eco-systems (Tab. 6.15). In general, the highest
values of total bacterial number, as well astheir activity, are observed during summer
in highly productive ecosystems. However,much higher microbial population densities
are observed in sediments (2-3 cm of surfa-ce layer) than in water columns.
VwerySmatrBook03.p65 2004-06-17, 17:2691
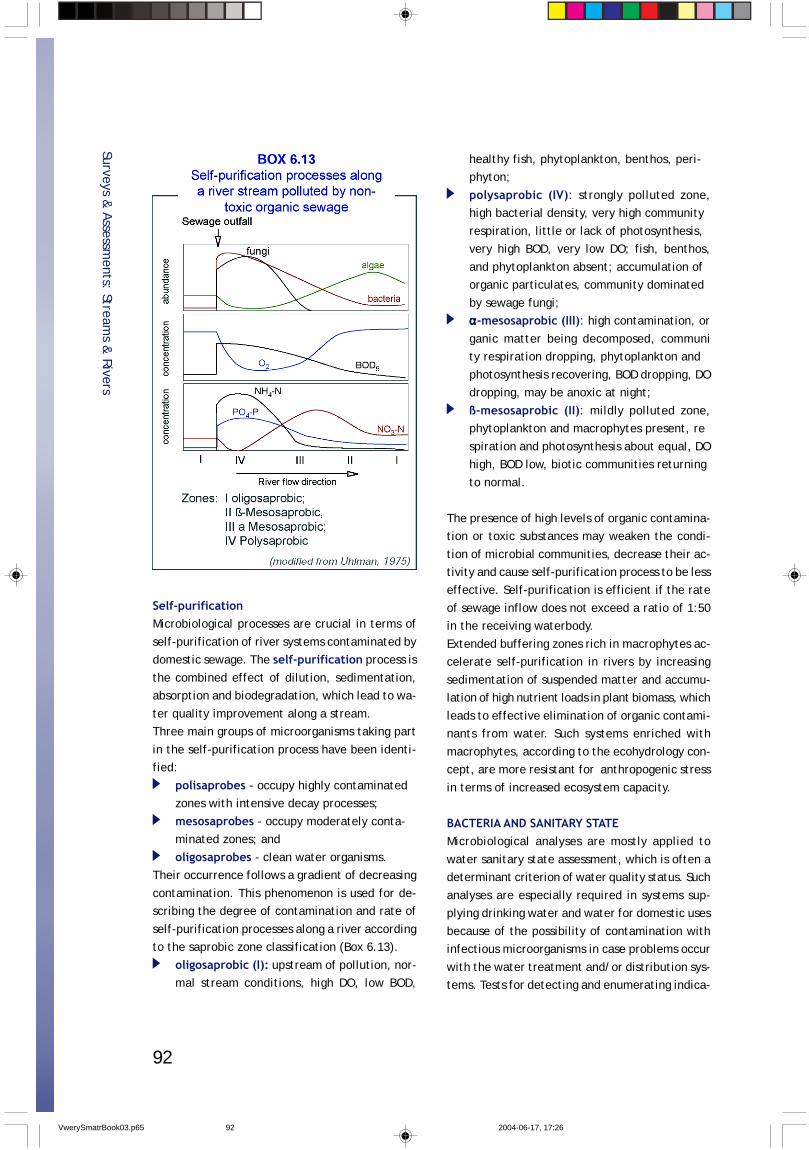
92
Self-purificationMicrobiological processes are crucial in terms of
self-purification of river systems contaminated bydomestic sewage. The self-purification process is
the combined effect of dilution, sedimentation,absorption and biodegradation, which lead to wa-
ter quality improvement along a stream.Three main groups of microorganisms taking part
in the self-purification process have been identi-fied:
polisaprobes - occupy highly contaminatedzones with intensive decay processes;
mesosaprobes - occupy moderately conta-minated zones; and
oligosaprobes - clean water organisms.Their occurrence follows a gradient of decreasing
contamination. This phenomenon is used for de-scribing the degree of contamination and rate of
self-purification processes along a river accordingto the saprobic zone classification (Box 6.13).
oligosaprobic (I): upstream of pollution, nor-mal stream conditions, high DO, low BOD,
healthy fish, phytoplankton, benthos, peri-phyton;
polysaprobic (IV): strongly polluted zone,high bacterial density, very high community
respiration, little or lack of photosynthesis,very high BOD, very low DO; fish, benthos,
and phytoplankton absent; accumulation oforganic particulates, community dominated
by sewage fungi;
ααααα-mesosaprobic (III): high contamination, or
ganic matter being decomposed, community respiration dropping, phytoplankton and
photosynthesis recovering, BOD dropping, DOdropping, may be anoxic at night;
ß-mesosaprobic (II): mildly polluted zone,phytoplankton and macrophytes present, re
spiration and photosynthesis about equal, DOhigh, BOD low, biotic communities returning
to normal.
The presence of high levels of organic contamina-tion or toxic substances may weaken the condi-
tion of microbial communities, decrease their ac-tivity and cause self-purification process to be lesseffective. Self-purification is efficient if the rate
of sewage inflow does not exceed a ratio of 1:50in the receiving waterbody.
Extended buffering zones rich in macrophytes ac-celerate self-purification in rivers by increasing
sedimentation of suspended matter and accumu-lation of high nutrient loads in plant biomass, which
leads to effective elimination of organic contami-nants from water. Such systems enriched with
macrophytes, according to the ecohydrology con-cept, are more resistant for anthropogenic stress
in terms of increased ecosystem capacity.
BACTERIA AND SANITARY STATEMicrobiological analyses are mostly applied to
water sanitary state assessment, which is often adeterminant criterion of water quality status. Such
analyses are especially required in systems sup-plying drinking water and water for domestic uses
because of the possibility of contamination withinfectious microorganisms in case problems occur
with the water treatment and/or distribution sys-tems. Tests for detecting and enumerating indica-
Surveys & Assessm
ents: Streams &
Rivers
VwerySmatrBook03.p65 2004-06-17, 17:2692
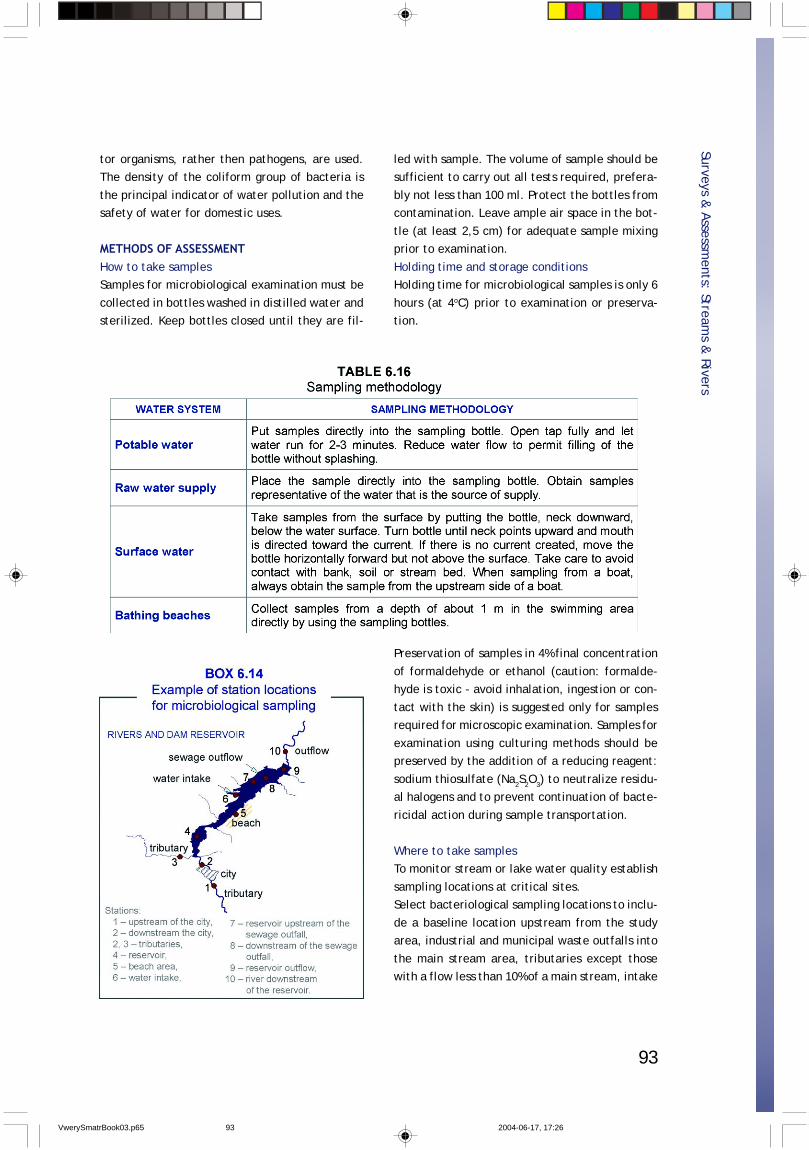
93
tor organisms, rather then pathogens, are used.The density of the coliform group of bacteria is
the principal indicator of water pollution and thesafety of water for domestic uses.
METHODS OF ASSESSMENTHow to take samplesSamples for microbiological examination must be
collected in bottles washed in distilled water andsterilized. Keep bottles closed until they are fil-
led with sample. The volume of sample should besufficient to carry out all tests required, prefera-
bly not less than 100 ml. Protect the bottles fromcontamination. Leave ample air space in the bot-
tle (at least 2,5 cm) for adequate sample mixingprior to examination.
Holding time and storage conditionsHolding time for microbiological samples is only 6
hours (at 4oC) prior to examination or preserva-tion.
Preservation of samples in 4% final concentration
of formaldehyde or ethanol (caution: formalde-hyde is toxic - avoid inhalation, ingestion or con-
tact with the skin) is suggested only for samplesrequired for microscopic examination. Samples for
examination using culturing methods should bepreserved by the addition of a reducing reagent:
sodium thiosulfate (Na2S2O3) to neutralize residu-al halogens and to prevent continuation of bacte-
ricidal action during sample transportation.
Where to take samplesTo monitor stream or lake water quality establish
sampling locations at critical sites.Select bacteriological sampling locations to inclu-
de a baseline location upstream from the studyarea, industrial and municipal waste outfalls into
the main stream area, tributaries except thosewith a flow less than 10% of a main stream, intake
Surveys & Assessm
ents: Streams &
Rivers
VwerySmatrBook03.p65 2004-06-17, 17:2693
94
points for municipal or industrial purposes, down-stream of wastewater outfalls and recreational
areas. Notice that sampling downstream of wa-stewater outfalls should be preliminarily made in
horizontal and vertical cross sections to determi-ne the rate of contaminant dispersion (Box 6.14).
Frequency of measurementsFrequency of sampling should be governed by theaim of a study. However, it is recommended to
consider a seasonal model of sampling to take intoaccount periods of drastic changes of environmen-
tal conditions such as hydrological patterns, tem-perature, and mixing.
The EPA monitoring requirements for sampling fre-quency for regulated microbiological contaminants
vary depending on the type and size of the sys-
tem: seasonal for recreational waters and dailyfor water supply intakes. It is recommended to
consider a geometric mean value of at least 5 sam-ples taken over 30 days.
Field and laboratory equipmentAll the field and laboratory equipment used formicrobiological examination should be washed
thoroughly and sterilized.
Sampling apparatusTo collect water samples from depths of a lake or
reservoir, ZoBell or Niskin samplers are used. Forbottom sediments a standard Van Donsel or any
other similar sediment sampler constructed of sta-inless steel, is applicable.
Surveys & Assessm
ents: Streams &
Rivers
VwerySmatrBook03.p65 2004-06-17, 17:2694
95
Surveys & Assessm
ents: Streams &
Rivers
Sample bottlesUse glass or plastic bottles than can be sterilized.
For some applications pre-sterilized plastic bagsmight be used.
Laboratory methodsThere are several precise and quick methods cur-rently available for:
estimation of number of live microorganisms- cultural methods;
direct counting of microorganisms - micro-scopic methods; and
microbial activity assessments.However, their limitations must be understood
thoroughly (Table 6.17).Microbial analyses should be done by a professio-
nal microbiologist or by a person who was specifi-
cally trained and is periodically supervised by amicrobiologist.
INTERPRETATION AND VERIFICATION OF RESULTSExamination of routine bacteriological samplescannot be regarded as providing complete infor-
mation concerning water quality. Interpretationof the results should be made in conjunction with
chemical and toxicological results obtained at thesame time.
VwerySmatrBook03.p65 2004-06-17, 17:2695
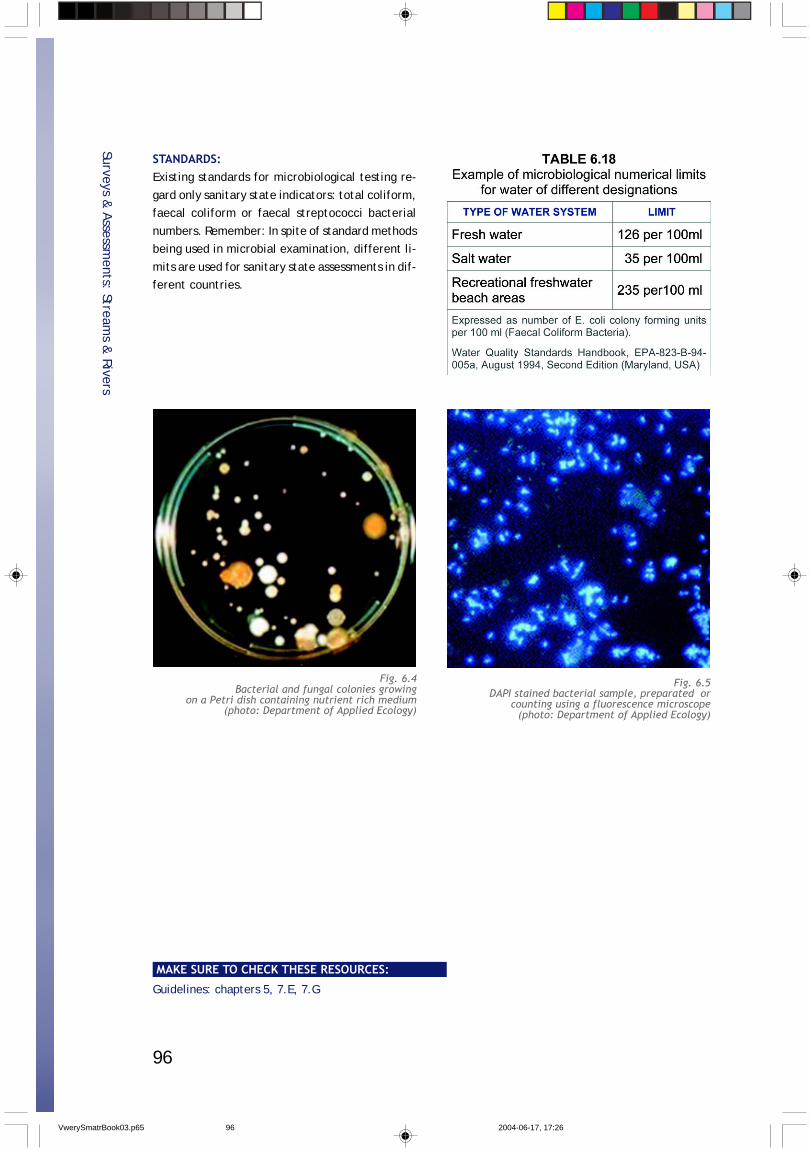
96
Surveys & Assessm
ents: Streams &
Rivers
STANDARDS:Existing standards for microbiological testing re-
gard only sanitary state indicators: total coliform,faecal coliform or faecal streptococci bacterial
numbers. Remember: In spite of standard methodsbeing used in microbial examination, different li-
mits are used for sanitary state assessments in dif-ferent countries.
Fig. 6.4Bacterial and fungal colonies growing
on a Petri dish containing nutrient rich medium(photo: Department of Applied Ecology)
Fig. 6.5DAPI stained bacterial sample, preparated or
counting using a fluorescence microscope(photo: Department of Applied Ecology)
MAKE SURE TO CHECK THESE RESOURCES:
Guidelines: chapters 5, 7.E, 7.G
VwerySmatrBook03.p65 2004-06-17, 17:2696
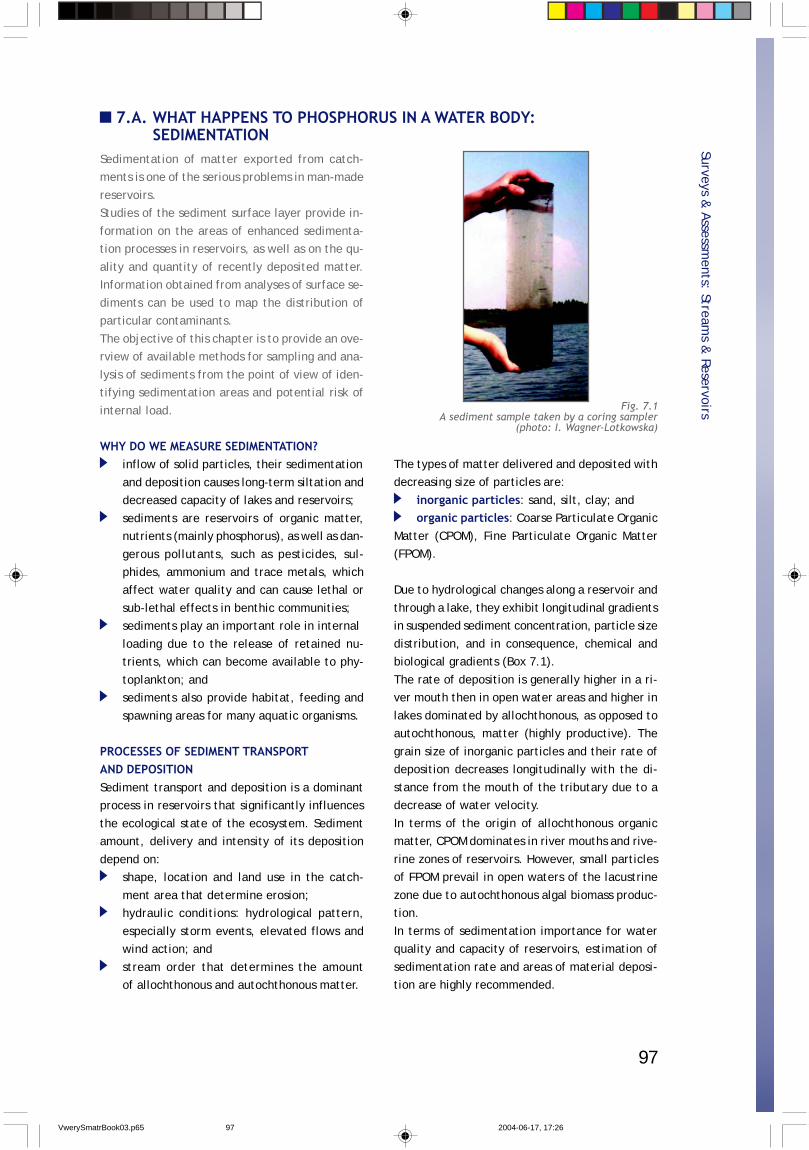
97
7.A. WHAT HAPPENS TO PHOSPHORUS IN A WATER BODY:SEDIMENTATION
Sedimentation of matter exported from catch-ments is one of the serious problems in man-made
reservoirs.Studies of the sediment surface layer provide in-
formation on the areas of enhanced sedimenta-tion processes in reservoirs, as well as on the qu-
ality and quantity of recently deposited matter.Information obtained from analyses of surface se-
diments can be used to map the distribution ofparticular contaminants.
The objective of this chapter is to provide an ove-rview of available methods for sampling and ana-
lysis of sediments from the point of view of iden-tifying sedimentation areas and potential risk of
internal load.
WHY DO WE MEASURE SEDIMENTATION?inflow of solid particles, their sedimentation
and deposition causes long-term siltation anddecreased capacity of lakes and reservoirs;
sediments are reservoirs of organic matter,nutrients (mainly phosphorus), as well as dan-
gerous pollutants, such as pesticides, sul-phides, ammonium and trace metals, whichaffect water quality and can cause lethal or
sub-lethal effects in benthic communities;sediments play an important role in internal
loading due to the release of retained nu-trients, which can become available to phy-
toplankton; andsediments also provide habitat, feeding and
spawning areas for many aquatic organisms.
PROCESSES OF SEDIMENT TRANSPORTAND DEPOSITIONSediment transport and deposition is a dominantprocess in reservoirs that significantly influences
the ecological state of the ecosystem. Sedimentamount, delivery and intensity of its deposition
depend on:shape, location and land use in the catch-
ment area that determine erosion;hydraulic conditions: hydrological pattern,
especially storm events, elevated flows andwind action; and
stream order that determines the amountof allochthonous and autochthonous matter.
The types of matter delivered and deposited withdecreasing size of particles are:
inorganic particles: sand, silt, clay; andorganic particles: Coarse Particulate Organic
Matter (CPOM), Fine Particulate Organic Matter(FPOM).
Due to hydrological changes along a reservoir and
through a lake, they exhibit longitudinal gradientsin suspended sediment concentration, particle size
distribution, and in consequence, chemical andbiological gradients (Box 7.1).
The rate of deposition is generally higher in a ri-ver mouth then in open water areas and higher in
lakes dominated by allochthonous, as opposed toautochthonous, matter (highly productive). The
grain size of inorganic particles and their rate ofdeposition decreases longitudinally with the di-
stance from the mouth of the tributary due to adecrease of water velocity.
In terms of the origin of allochthonous organicmatter, CPOM dominates in river mouths and rive-
rine zones of reservoirs. However, small particlesof FPOM prevail in open waters of the lacustrine
zone due to autochthonous algal biomass produc-tion.
In terms of sedimentation importance for waterquality and capacity of reservoirs, estimation of
sedimentation rate and areas of material deposi-tion are highly recommended.
Surveys & Assessm
ents: Streams &
ReservoirsFig. 7.1A sediment sample taken by a coring sampler
(photo: I. Wagner-Lotkowska)
VwerySmatrBook03.p65 2004-06-17, 17:2697
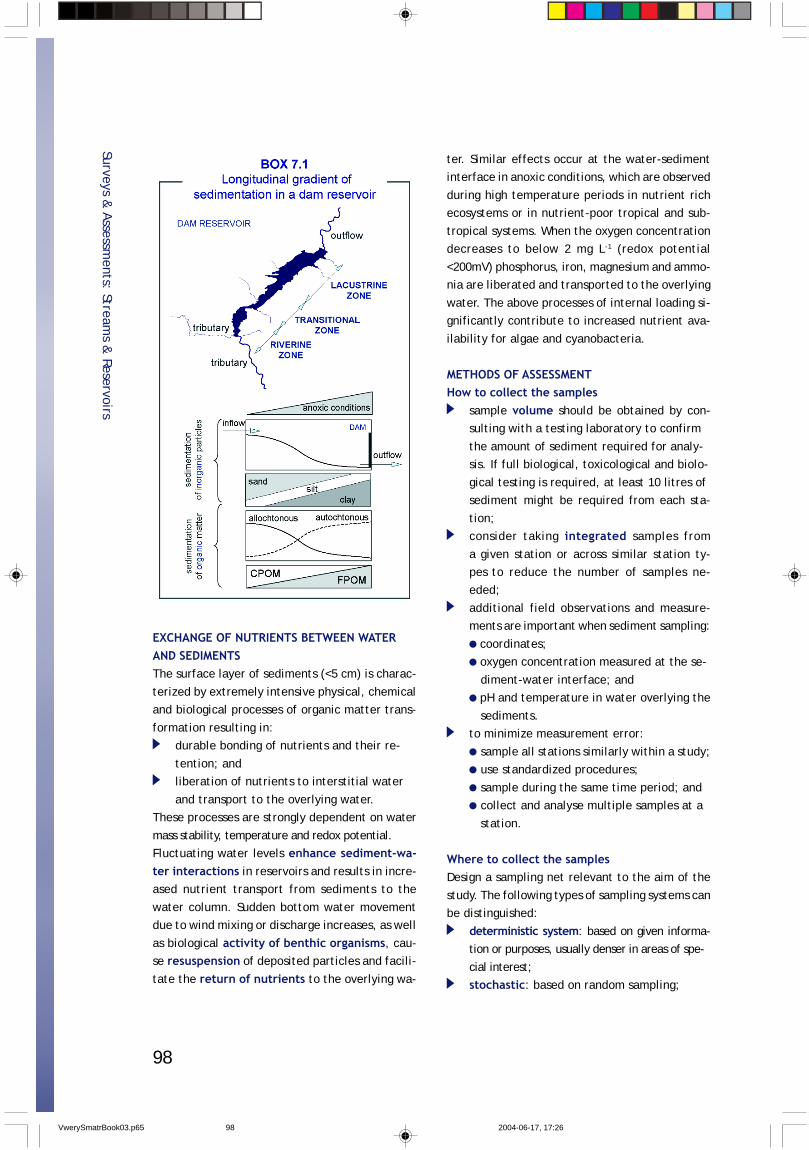
98
EXCHANGE OF NUTRIENTS BETWEEN WATERAND SEDIMENTSThe surface layer of sediments (<5 cm) is charac-
terized by extremely intensive physical, chemicaland biological processes of organic matter trans-
formation resulting in:durable bonding of nutrients and their re-
tention; andliberation of nutrients to interstitial water
and transport to the overlying water.These processes are strongly dependent on water
mass stability, temperature and redox potential.Fluctuating water levels enhance sediment-wa-ter interactions in reservoirs and results in incre-ased nutrient transport from sediments to the
water column. Sudden bottom water movementdue to wind mixing or discharge increases, as well
as biological activity of benthic organisms, cau-se resuspension of deposited particles and facili-
tate the return of nutrients to the overlying wa-
ter. Similar effects occur at the water-sedimentinterface in anoxic conditions, which are observed
during high temperature periods in nutrient richecosystems or in nutrient-poor tropical and sub-
tropical systems. When the oxygen concentrationdecreases to below 2 mg L-1 (redox potential
<200mV) phosphorus, iron, magnesium and ammo-nia are liberated and transported to the overlying
water. The above processes of internal loading si-gnificantly contribute to increased nutrient ava-
ilability for algae and cyanobacteria.
METHODS OF ASSESSMENTHow to collect the samples
sample volume should be obtained by con-sulting with a testing laboratory to confirm
the amount of sediment required for analy-sis. If full biological, toxicological and biolo-
gical testing is required, at least 10 litres ofsediment might be required from each sta-
tion;consider taking integrated samples from
a given station or across similar station ty-pes to reduce the number of samples ne-eded;
additional field observations and measure-ments are important when sediment sampling:
coordinates; oxygen concentration measured at the se-
diment-water interface; and pH and temperature in water overlying the
sediments.to minimize measurement error:
sample all stations similarly within a study;use standardized procedures;
sample during the same time period; andcollect and analyse multiple samples at a
station.
Where to collect the samplesDesign a sampling net relevant to the aim of the
study. The following types of sampling systems canbe distinguished:
deterministic system: based on given informa-tion or purposes, usually denser in areas of spe-
cial interest;stochastic: based on random sampling;
Surveys & Assessm
ents: Streams &
Reservoirs
VwerySmatrBook03.p65 2004-06-17, 17:2698
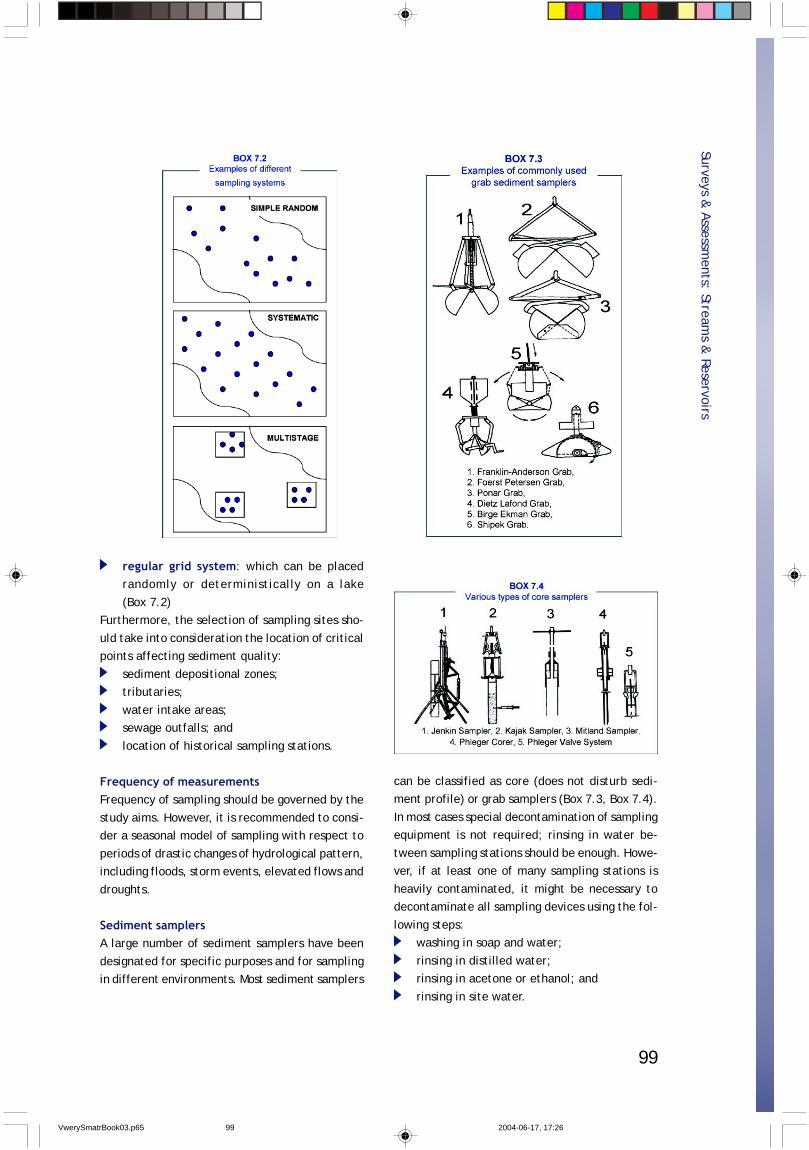
99
regular grid system: which can be placedrandomly or deterministically on a lake
(Box 7.2)Furthermore, the selection of sampling sites sho-
uld take into consideration the location of criticalpoints affecting sediment quality:
sediment depositional zones;tributaries;
water intake areas;sewage outfalls; and
location of historical sampling stations.
Frequency of measurementsFrequency of sampling should be governed by the
study aims. However, it is recommended to consi-der a seasonal model of sampling with respect to
periods of drastic changes of hydrological pattern,including floods, storm events, elevated flows and
droughts.
Sediment samplersA large number of sediment samplers have been
designated for specific purposes and for samplingin different environments. Most sediment samplers
can be classified as core (does not disturb sedi-ment profile) or grab samplers (Box 7.3, Box 7.4).
In most cases special decontamination of samplingequipment is not required; rinsing in water be-
tween sampling stations should be enough. Howe-ver, if at least one of many sampling stations is
heavily contaminated, it might be necessary todecontaminate all sampling devices using the fol-
lowing steps:washing in soap and water;
rinsing in distilled water;rinsing in acetone or ethanol; and
rinsing in site water.
Surveys & Assessm
ents: Streams &
Reservoirs
VwerySmatrBook03.p65 2004-06-17, 17:2699
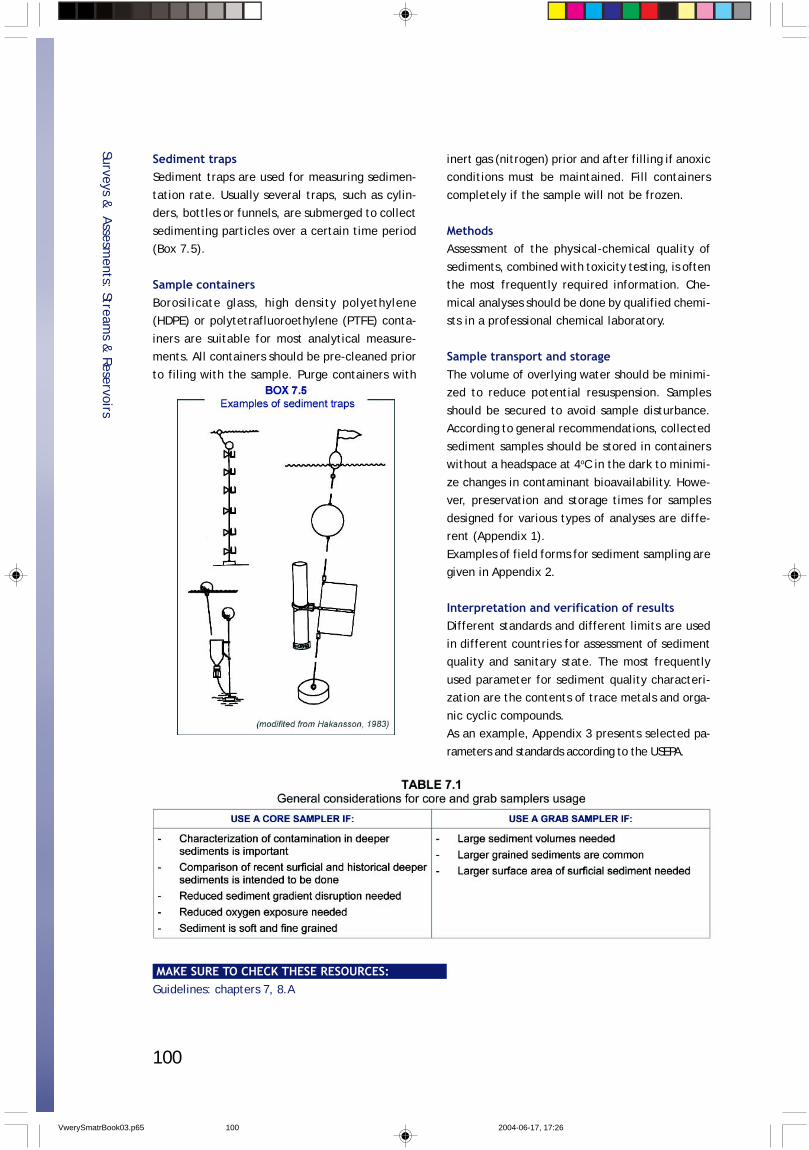
100
Sediment trapsSediment traps are used for measuring sedimen-
tation rate. Usually several traps, such as cylin-ders, bottles or funnels, are submerged to collect
sedimenting particles over a certain time period(Box 7.5).
Sample containersBorosilicate glass, high density polyethylene(HDPE) or polytetrafluoroethylene (PTFE) conta-
iners are suitable for most analytical measure-ments. All containers should be pre-cleaned prior
to filing with the sample. Purge containers with
inert gas (nitrogen) prior and after filling if anoxicconditions must be maintained. Fill containers
completely if the sample will not be frozen.
MethodsAssessment of the physical-chemical quality of
sediments, combined with toxicity testing, is oftenthe most frequently required information. Che-
mical analyses should be done by qualified chemi-sts in a professional chemical laboratory.
Sample transport and storageThe volume of overlying water should be minimi-zed to reduce potential resuspension. Samples
should be secured to avoid sample disturbance.According to general recommendations, collected
sediment samples should be stored in containerswithout a headspace at 4oC in the dark to minimi-
ze changes in contaminant bioavailability. Howe-ver, preservation and storage times for samples
designed for various types of analyses are diffe-rent (Appendix 1).
Examples of field forms for sediment sampling aregiven in Appendix 2.
Interpretation and verification of resultsDifferent standards and different limits are used
in different countries for assessment of sedimentquality and sanitary state. The most frequently
used parameter for sediment quality characteri-zation are the contents of trace metals and orga-
nic cyclic compounds.As an example, Appendix 3 presents selected pa-
rameters and standards according to the USEPA.
Surveys & Assesm
ents: Streams &
Reservoirs
MAKE SURE TO CHECK THESE RESOURCES:Guidelines: chapters 7, 8.A
VwerySmatrBook03.p65 2004-06-17, 17:26100
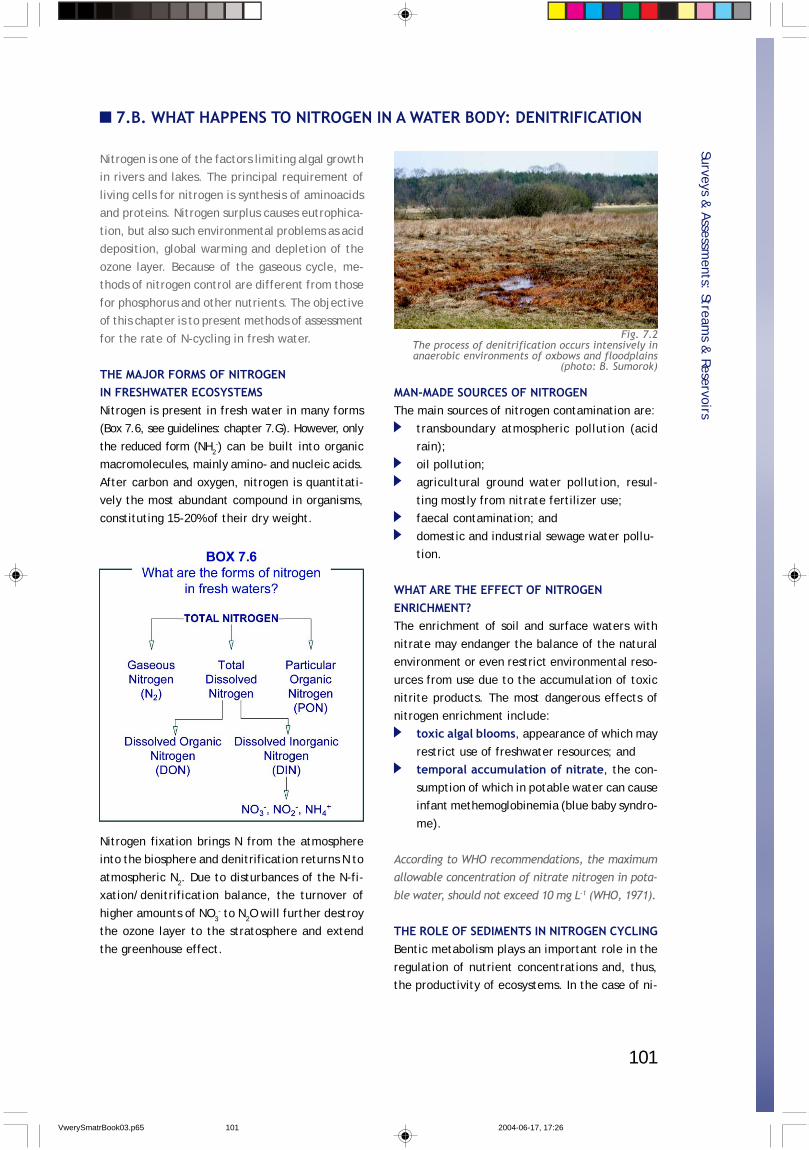
101
7.B. WHAT HAPPENS TO NITROGEN IN A WATER BODY: DENITRIFICATION
Nitrogen is one of the factors limiting algal growthin rivers and lakes. The principal requirement of
living cells for nitrogen is synthesis of aminoacidsand proteins. Nitrogen surplus causes eutrophica-
tion, but also such environmental problems as aciddeposition, global warming and depletion of the
ozone layer. Because of the gaseous cycle, me-thods of nitrogen control are different from those
for phosphorus and other nutrients. The objectiveof this chapter is to present methods of assessment
for the rate of N-cycling in fresh water.
THE MAJOR FORMS OF NITROGENIN FRESHWATER ECOSYSTEMSNitrogen is present in fresh water in many forms(Box 7.6, see guidelines: chapter 7.G). However, only
the reduced form (NH2-) can be built into organic
macromolecules, mainly amino- and nucleic acids.
After carbon and oxygen, nitrogen is quantitati-vely the most abundant compound in organisms,
constituting 15-20% of their dry weight.
Nitrogen fixation brings N from the atmosphereinto the biosphere and denitrification returns N to
atmospheric N2. Due to disturbances of the N-fi-xation/denitrification balance, the turnover of
higher amounts of NO3- to N2O will further destroy
the ozone layer to the stratosphere and extend
the greenhouse effect.
MAN-MADE SOURCES OF NITROGENThe main sources of nitrogen contamination are:
transboundary atmospheric pollution (acidrain);
oil pollution;agricultural ground water pollution, resul-
ting mostly from nitrate fertilizer use;faecal contamination; and
domestic and industrial sewage water pollu-tion.
WHAT ARE THE EFFECT OF NITROGENENRICHMENT?The enrichment of soil and surface waters with
nitrate may endanger the balance of the naturalenvironment or even restrict environmental reso-
urces from use due to the accumulation of toxicnitrite products. The most dangerous effects of
nitrogen enrichment include:toxic algal blooms, appearance of which may
restrict use of freshwater resources; andtemporal accumulation of nitrate, the con-
sumption of which in potable water can causeinfant methemoglobinemia (blue baby syndro-
me).
According to WHO recommendations, the maximumallowable concentration of nitrate nitrogen in pota-
ble water, should not exceed 10 mg L-1 (WHO, 1971).
THE ROLE OF SEDIMENTS IN NITROGEN CYCLINGBentic metabolism plays an important role in the
regulation of nutrient concentrations and, thus,the productivity of ecosystems. In the case of ni-
Surveys & Assessm
ents: Streams &
Reservoirs
Fig. 7.2The process of denitrification occurs intensively inanaerobic environments of oxbows and floodplains
(photo: B. Sumorok)
VwerySmatrBook03.p65 2004-06-17, 17:26101
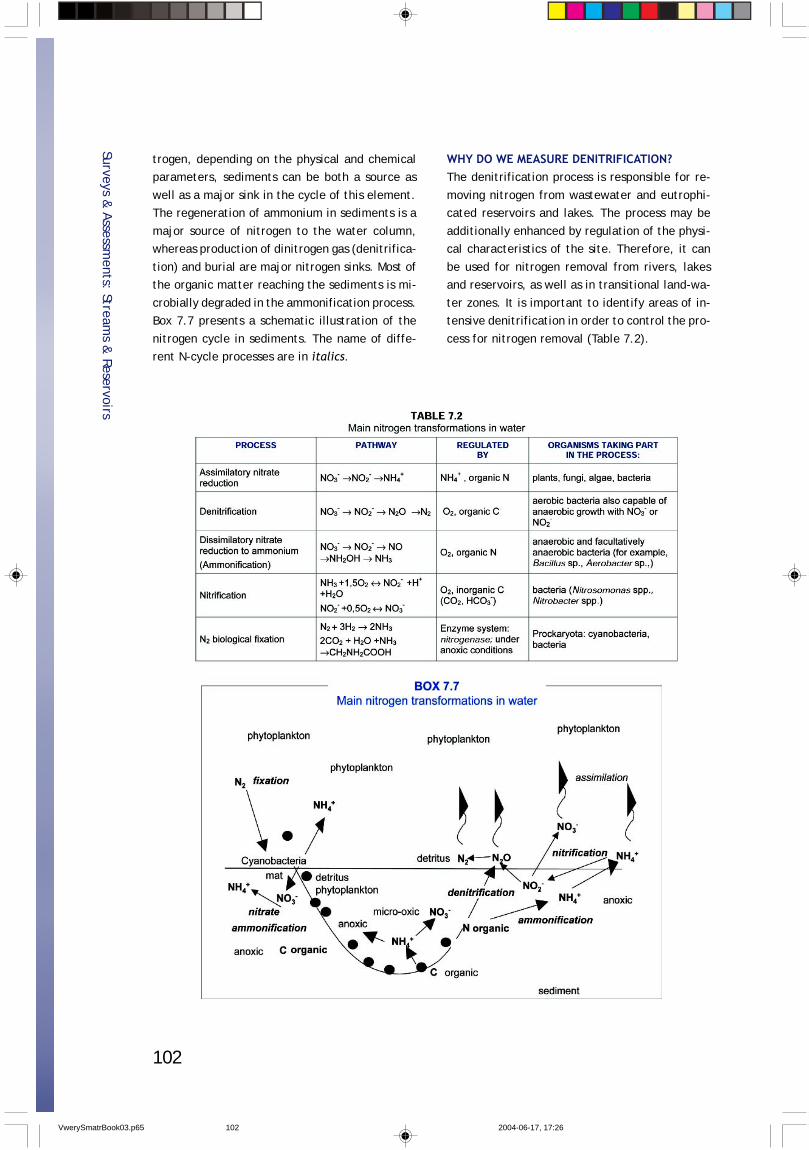
102
trogen, depending on the physical and chemicalparameters, sediments can be both a source as
well as a major sink in the cycle of this element.The regeneration of ammonium in sediments is a
major source of nitrogen to the water column,whereas production of dinitrogen gas (denitrifica-
tion) and burial are major nitrogen sinks. Most ofthe organic matter reaching the sediments is mi-
crobially degraded in the ammonification process.Box 7.7 presents a schematic illustration of the
nitrogen cycle in sediments. The name of diffe-rent N-cycle processes are in italics.
WHY DO WE MEASURE DENITRIFICATION?The denitrification process is responsible for re-
moving nitrogen from wastewater and eutrophi-cated reservoirs and lakes. The process may be
additionally enhanced by regulation of the physi-cal characteristics of the site. Therefore, it can
be used for nitrogen removal from rivers, lakesand reservoirs, as well as in transitional land-wa-
ter zones. It is important to identify areas of in-tensive denitrification in order to control the pro-
cess for nitrogen removal (Table 7.2).
Surveys & Assessm
ents: Streams &
Reservoirs
VwerySmatrBook03.p65 2004-06-17, 17:26102
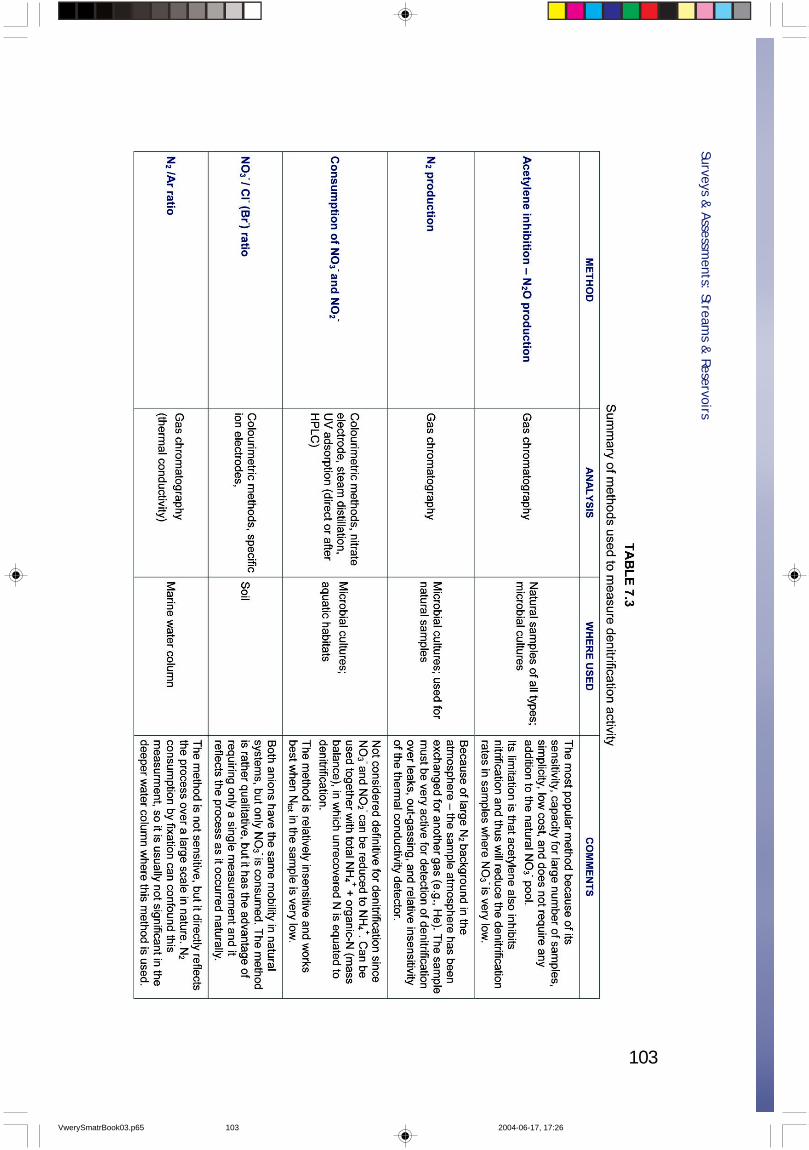
103
Surveys & Assessm
ents: Streams &
Reservoirs
VwerySmatrBook03.p65 2004-06-17, 17:26103
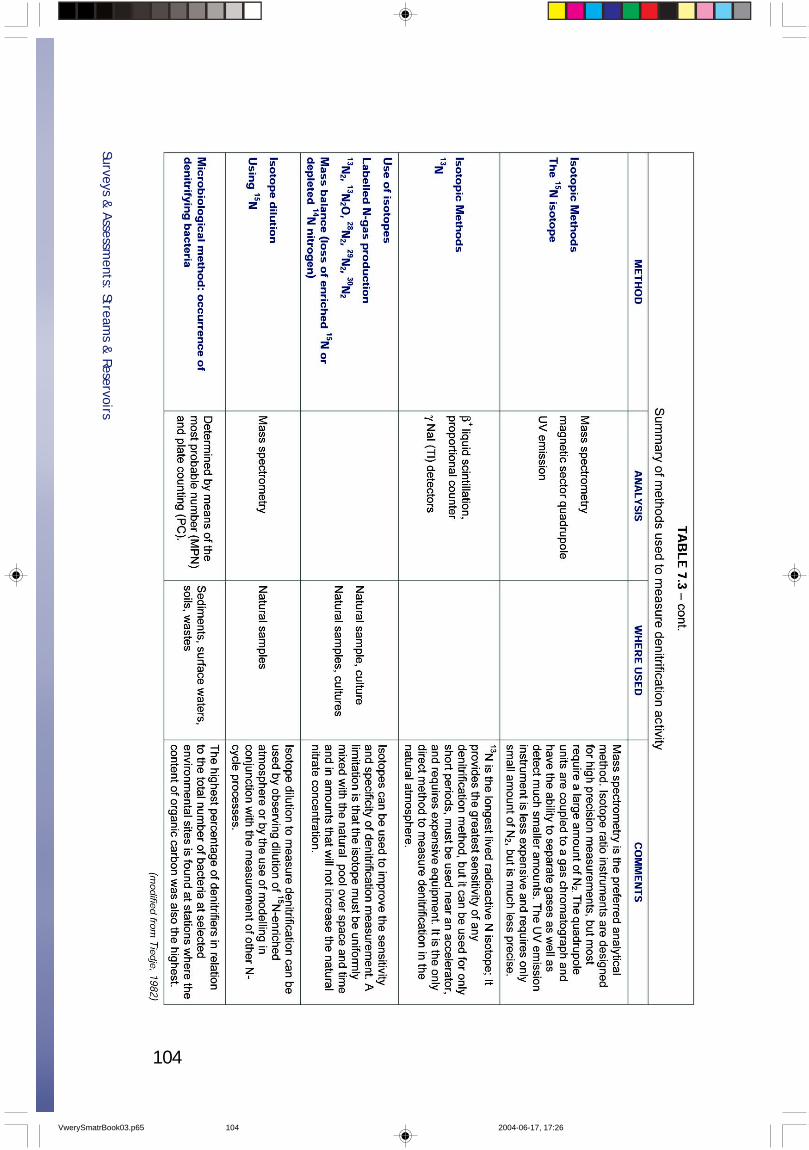
104
Surveys & Assessm
ents: Streams &
Reservoirs
VwerySmatrBook03.p65 2004-06-17, 17:26104
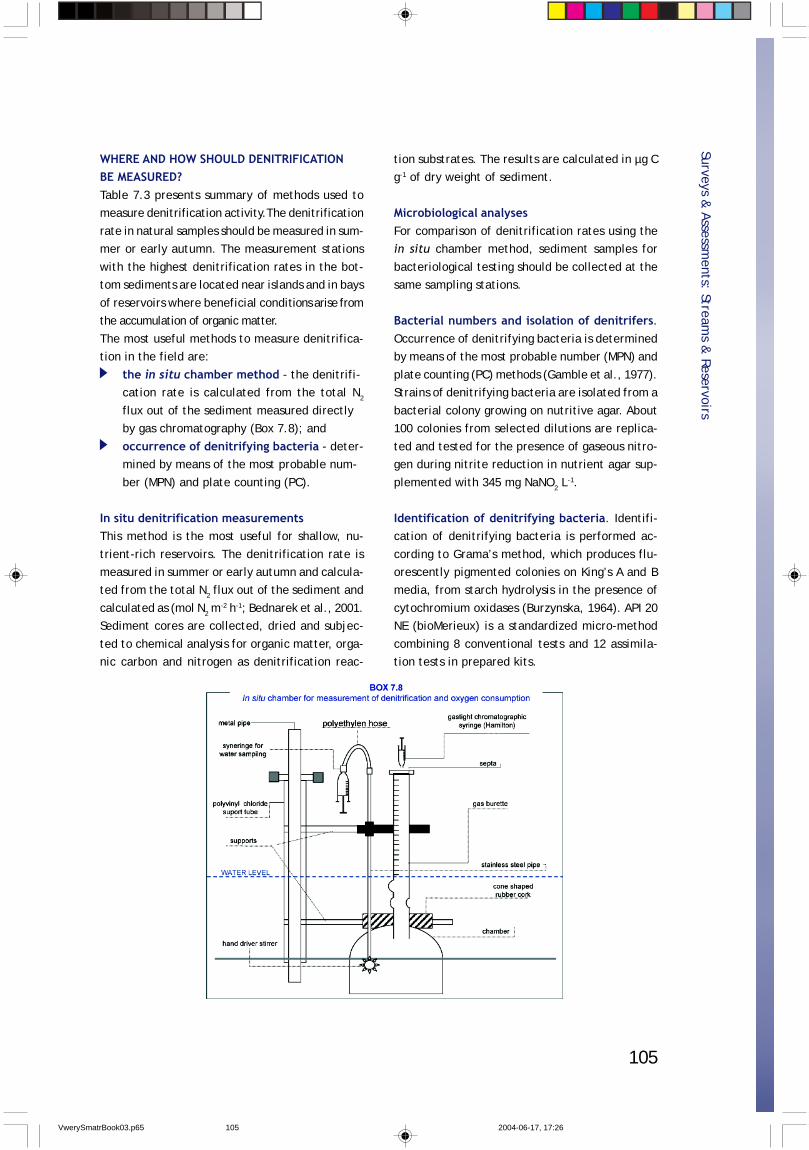
105
WHERE AND HOW SHOULD DENITRIFICATIONBE MEASURED?Table 7.3 presents summary of methods used tomeasure denitrification activity.The denitrification
rate in natural samples should be measured in sum-mer or early autumn. The measurement stations
with the highest denitrification rates in the bot-tom sediments are located near islands and in bays
of reservoirs where beneficial conditions arise fromthe accumulation of organic matter.
The most useful methods to measure denitrifica-tion in the field are:
the in situ chamber method - the denitrifi-cation rate is calculated from the total N2
flux out of the sediment measured directlyby gas chromatography (Box 7.8); and
occurrence of denitrifying bacteria - deter-mined by means of the most probable num-
ber (MPN) and plate counting (PC).
In situ denitrification measurementsThis method is the most useful for shallow, nu-
trient-rich reservoirs. The denitrification rate ismeasured in summer or early autumn and calcula-ted from the total N2 flux out of the sediment and
calculated as (mol N2 m-2 h-1; Bednarek et al., 2001.
Sediment cores are collected, dried and subjec-
ted to chemical analysis for organic matter, orga-nic carbon and nitrogen as denitrification reac-
tion substrates. The results are calculated in µg Cg-1 of dry weight of sediment.
Microbiological analysesFor comparison of denitrification rates using thein situ chamber method, sediment samples for
bacteriological testing should be collected at thesame sampling stations.
Bacterial numbers and isolation of denitrifers.Occurrence of denitrifying bacteria is determinedby means of the most probable number (MPN) and
plate counting (PC) methods (Gamble et al., 1977).Strains of denitrifying bacteria are isolated from a
bacterial colony growing on nutritive agar. About100 colonies from selected dilutions are replica-
ted and tested for the presence of gaseous nitro-gen during nitrite reduction in nutrient agar sup-
plemented with 345 mg NaNO2 L-1.
Identification of denitrifying bacteria. Identifi-cation of denitrifying bacteria is performed ac-
cording to Grama’s method, which produces flu-orescently pigmented colonies on King’s A and Bmedia, from starch hydrolysis in the presence of
cytochromium oxidases (Burzynska, 1964). API 20NE (bioMerieux) is a standardized micro-method
combining 8 conventional tests and 12 assimila-tion tests in prepared kits.
Surveys & Assessm
ents: Streams &
Reservoirs
VwerySmatrBook03.p65 2004-06-17, 17:26105
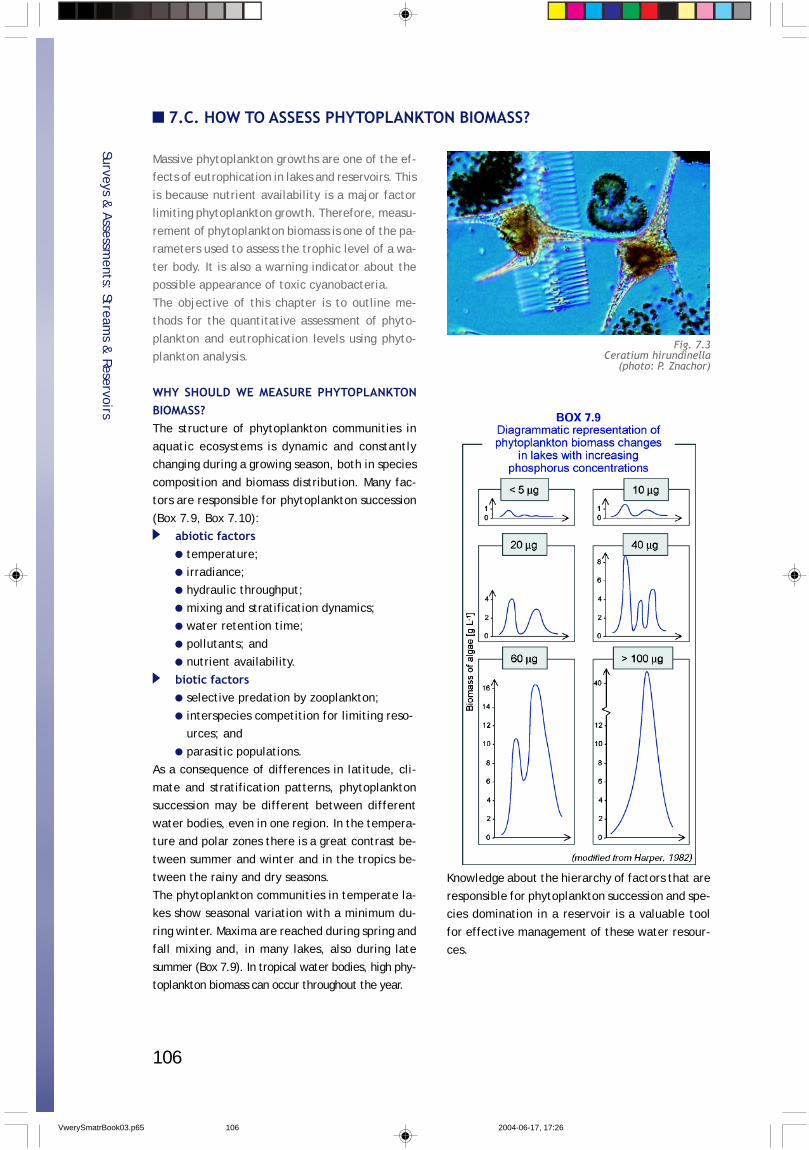
106
7.C. HOW TO ASSESS PHYTOPLANKTON BIOMASS?
Massive phytoplankton growths are one of the ef-fects of eutrophication in lakes and reservoirs. This
is because nutrient availability is a major factorlimiting phytoplankton growth. Therefore, measu-
rement of phytoplankton biomass is one of the pa-rameters used to assess the trophic level of a wa-
ter body. It is also a warning indicator about thepossible appearance of toxic cyanobacteria.
The objective of this chapter is to outline me-thods for the quantitative assessment of phyto-
plankton and eutrophication levels using phyto-plankton analysis.
WHY SHOULD WE MEASURE PHYTOPLANKTONBIOMASS?The structure of phytoplankton communities in
aquatic ecosystems is dynamic and constantlychanging during a growing season, both in species
composition and biomass distribution. Many fac-tors are responsible for phytoplankton succession
(Box 7.9, Box 7.10):abiotic factors
temperature;irradiance;hydraulic throughput;
mixing and stratification dynamics;water retention time;
pollutants; andnutrient availability.
biotic factorsselective predation by zooplankton;
interspecies competition for limiting reso-urces; and
parasitic populations.As a consequence of differences in latitude, cli-
mate and stratification patterns, phytoplanktonsuccession may be different between different
water bodies, even in one region. In the tempera-ture and polar zones there is a great contrast be-
tween summer and winter and in the tropics be-tween the rainy and dry seasons.
The phytoplankton communities in temperate la-kes show seasonal variation with a minimum du-
ring winter. Maxima are reached during spring andfall mixing and, in many lakes, also during late
summer (Box 7.9). In tropical water bodies, high phy-toplankton biomass can occur throughout the year.
Knowledge about the hierarchy of factors that are
responsible for phytoplankton succession and spe-cies domination in a reservoir is a valuable tool
for effective management of these water resour-ces.
Surveys & Assessm
ents: Streams &
Reservoirs
Fig. 7.3Ceratium hirundinella
(photo: P. Znachor)
VwerySmatrBook03.p65 2004-06-17, 17:26106
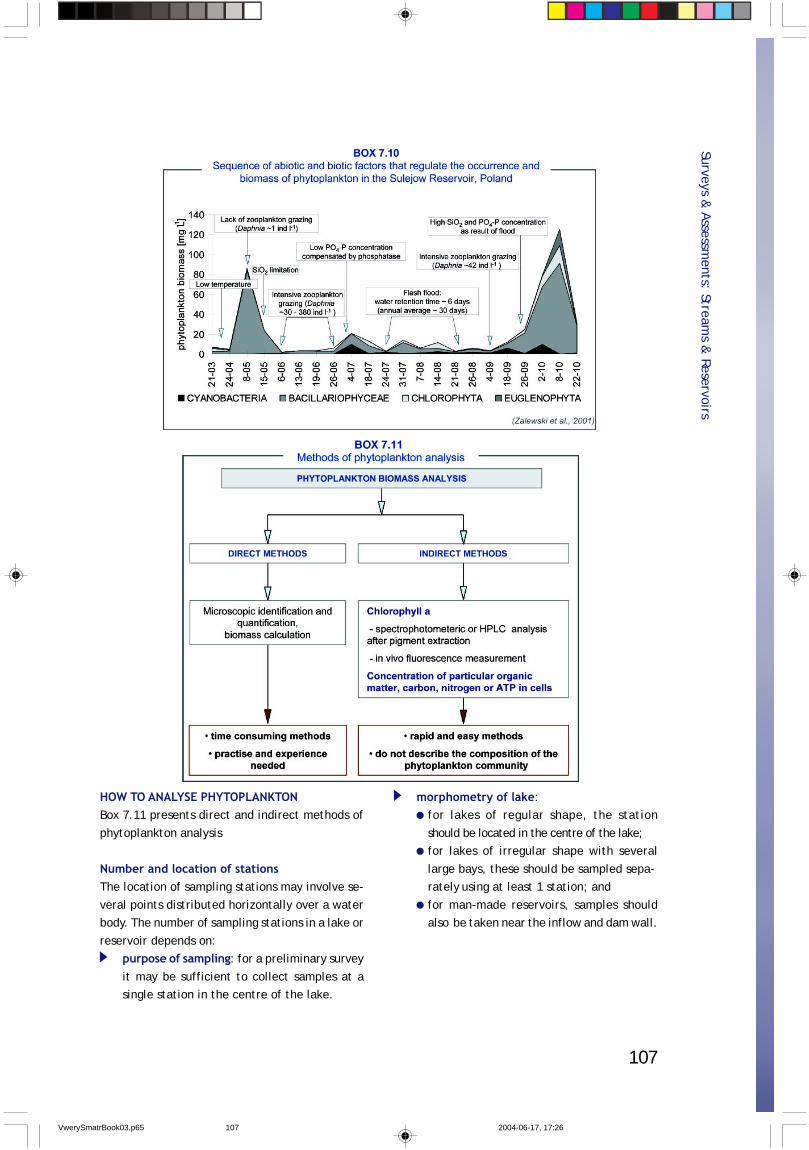
107
HOW TO ANALYSE PHYTOPLANKTONBox 7.11 presents direct and indirect methods of
phytoplankton analysis
Number and location of stationsThe location of sampling stations may involve se-
veral points distributed horizontally over a waterbody. The number of sampling stations in a lake or
reservoir depends on:purpose of sampling: for a preliminary survey
it may be sufficient to collect samples at asingle station in the centre of the lake.
morphometry of lake:for lakes of regular shape, the station
should be located in the centre of the lake;for lakes of irregular shape with several
large bays, these should be sampled sepa-rately using at least 1 station; and
for man-made reservoirs, samples shouldalso be taken near the inflow and dam wall.
Surveys & Assessm
ents: Streams &
Reservoirs
VwerySmatrBook03.p65 2004-06-17, 17:26107
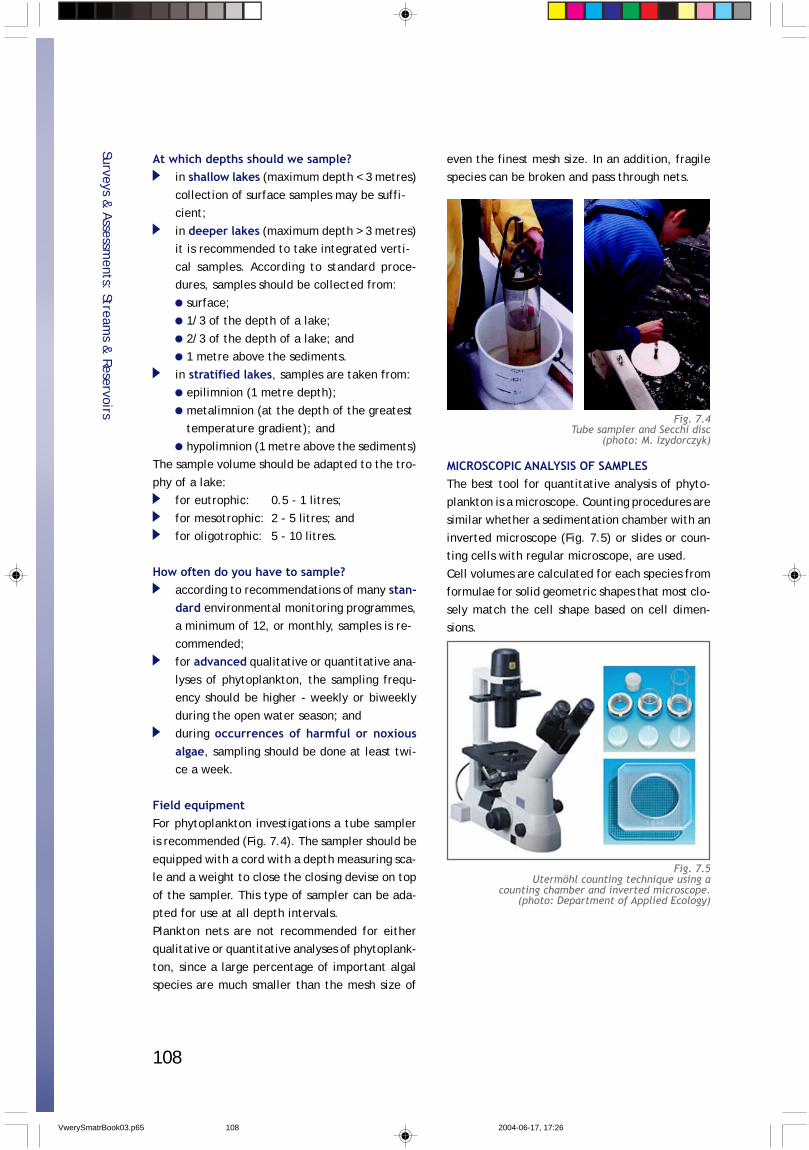
108
At which depths should we sample?in shallow lakes (maximum depth < 3 metres)
collection of surface samples may be suffi-cient;
in deeper lakes (maximum depth > 3 metres)it is recommended to take integrated verti-
cal samples. According to standard proce-dures, samples should be collected from:
surface;1/3 of the depth of a lake;
2/3 of the depth of a lake; and1 metre above the sediments.
in stratified lakes, samples are taken from:epilimnion (1 metre depth);
metalimnion (at the depth of the greatesttemperature gradient); and
hypolimnion (1 metre above the sediments)The sample volume should be adapted to the tro-
phy of a lake:for eutrophic: 0.5 - 1 litres;
for mesotrophic: 2 - 5 litres; andfor oligotrophic: 5 - 10 litres.
How often do you have to sample?according to recommendations of many stan-dard environmental monitoring programmes,a minimum of 12, or monthly, samples is re-
commended;for advanced qualitative or quantitative ana-
lyses of phytoplankton, the sampling frequ-ency should be higher - weekly or biweekly
during the open water season; andduring occurrences of harmful or noxiousalgae, sampling should be done at least twi-ce a week.
Field equipmentFor phytoplankton investigations a tube sampleris recommended (Fig. 7.4). The sampler should be
equipped with a cord with a depth measuring sca-le and a weight to close the closing devise on top
of the sampler. This type of sampler can be ada-pted for use at all depth intervals.
Plankton nets are not recommended for eitherqualitative or quantitative analyses of phytoplank-
ton, since a large percentage of important algalspecies are much smaller than the mesh size of
even the finest mesh size. In an addition, fragilespecies can be broken and pass through nets.
MICROSCOPIC ANALYSIS OF SAMPLESThe best tool for quantitative analysis of phyto-
plankton is a microscope. Counting procedures aresimilar whether a sedimentation chamber with an
inverted microscope (Fig. 7.5) or slides or coun-ting cells with regular microscope, are used.
Cell volumes are calculated for each species fromformulae for solid geometric shapes that most clo-
sely match the cell shape based on cell dimen-sions.
Surveys & Assessm
ents: Streams &
Reservoirs
Fig. 7.4Tube sampler and Secchi disc
(photo: M. Izydorczyk)
Fig. 7.5Utermöhl counting technique using a
counting chamber and inverted microscope.(photo: Department of Applied Ecology)
VwerySmatrBook03.p65 2004-06-17, 17:26108
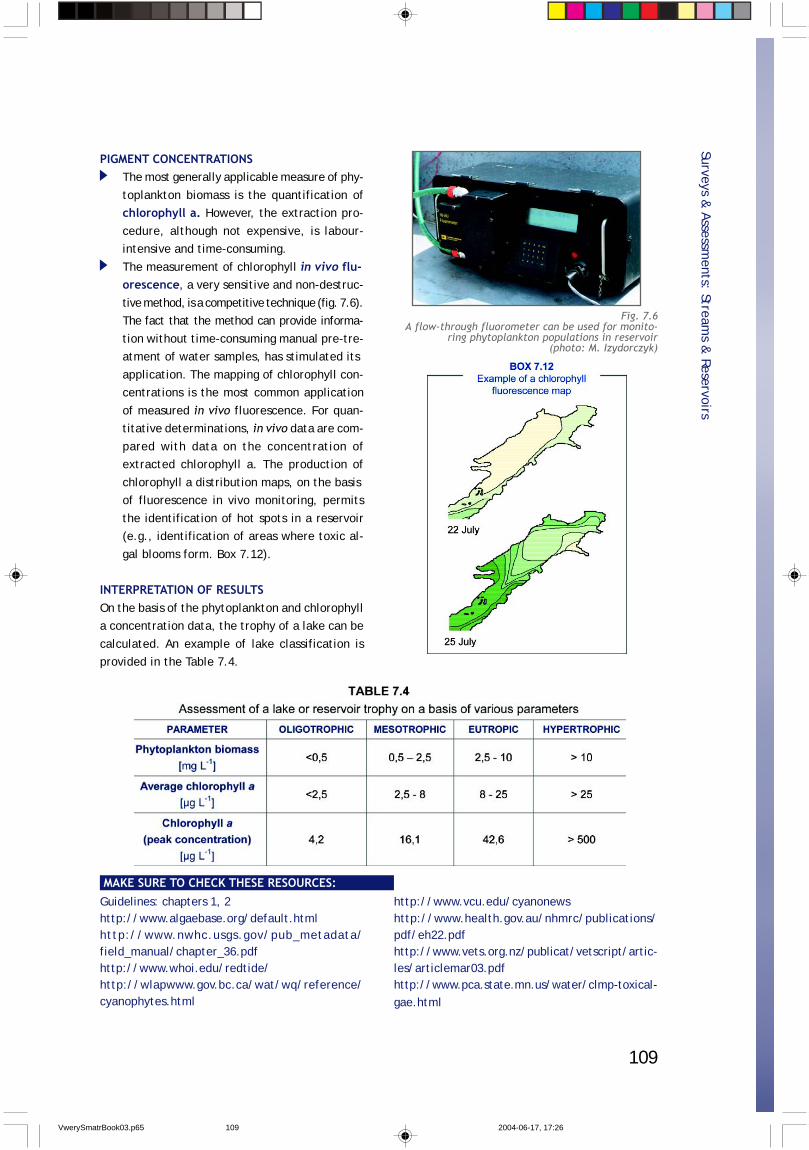
109
Surveys & Assessm
ents: Streams &
Reservoirs
Fig. 7.6A flow-through fluorometer can be used for monito-
ring phytoplankton populations in reservoir(photo: M. Izydorczyk)
Guidelines: chapters 1, 2http://www.algaebase.org/default.htmlhttp://www.nwhc.usgs.gov/pub_metadata/field_manual/chapter_36.pdfhttp://www.whoi.edu/redtide/http://wlapwww.gov.bc.ca/wat/wq/reference/cyanophytes.html
MAKE SURE TO CHECK THESE RESOURCES:http://www.vcu.edu/cyanonewshttp://www.health.gov.au/nhmrc/publications/pdf/eh22.pdfhttp://www.vets.org.nz/publicat/vetscript/artic-les/articlemar03.pdfhttp://www.pca.state.mn.us/water/clmp-toxical-gae.html
PIGMENT CONCENTRATIONSThe most generally applicable measure of phy-
toplankton biomass is the quantification ofchlorophyll a. However, the extraction pro-
cedure, although not expensive, is labour-intensive and time-consuming.
The measurement of chlorophyll in vivo flu-orescence, a very sensitive and non-destruc-
tive method, is a competitive technique (fig. 7.6).The fact that the method can provide informa-
tion without time-consuming manual pre-tre-atment of water samples, has stimulated its
application. The mapping of chlorophyll con-centrations is the most common application
of measured in vivo fluorescence. For quan-titative determinations, in vivo data are com-
pared with data on the concentration ofextracted chlorophyll a. The production of
chlorophyll a distribution maps, on the basisof fluorescence in vivo monitoring, permits
the identification of hot spots in a reservoir(e.g., identification of areas where toxic al-
gal blooms form. Box 7.12).
INTERPRETATION OF RESULTSOn the basis of the phytoplankton and chlorophylla concentration data, the trophy of a lake can be
calculated. An example of lake classification isprovided in the Table 7.4.
VwerySmatrBook03.p65 2004-06-17, 17:26109
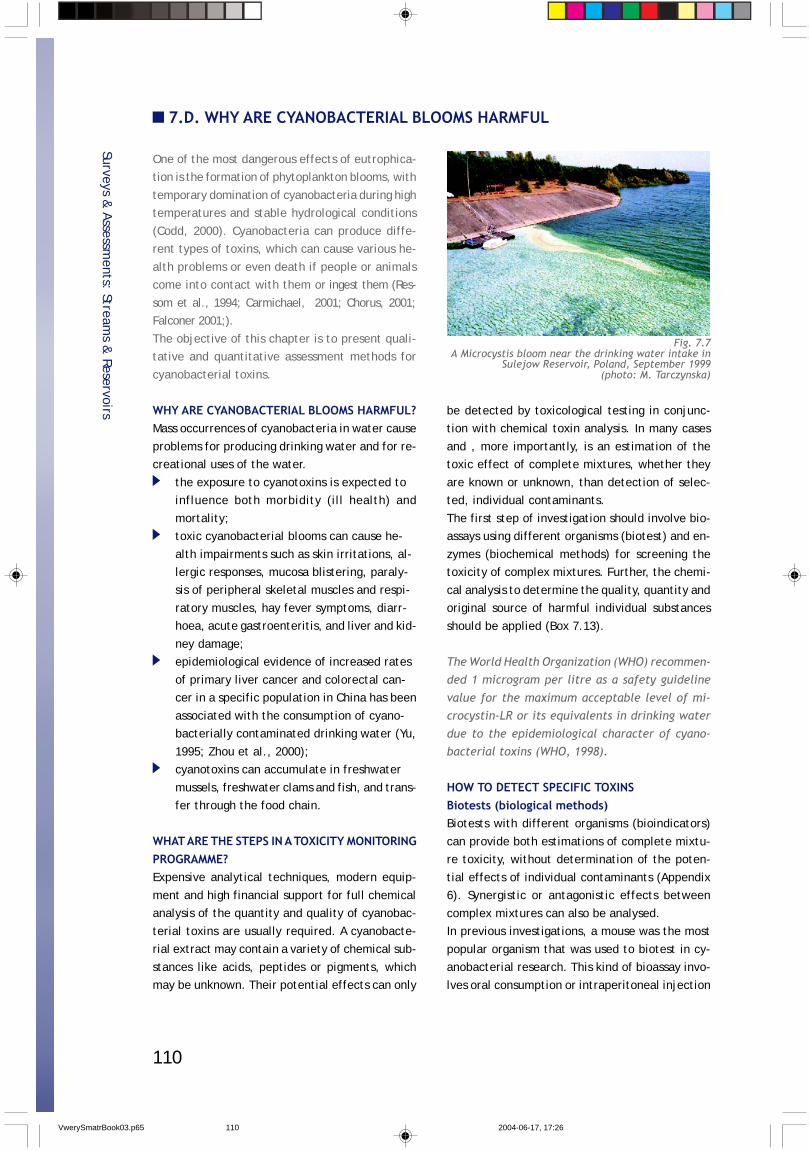
110
7.D. WHY ARE CYANOBACTERIAL BLOOMS HARMFUL
One of the most dangerous effects of eutrophica-tion is the formation of phytoplankton blooms, with
temporary domination of cyanobacteria during hightemperatures and stable hydrological conditions
(Codd, 2000). Cyanobacteria can produce diffe-rent types of toxins, which can cause various he-
alth problems or even death if people or animalscome into contact with them or ingest them (Res-
som et al., 1994; Carmichael, 2001; Chorus, 2001;Falconer 2001;).
The objective of this chapter is to present quali-tative and quantitative assessment methods for
cyanobacterial toxins.
WHY ARE CYANOBACTERIAL BLOOMS HARMFUL?Mass occurrences of cyanobacteria in water cause
problems for producing drinking water and for re-creational uses of the water.
the exposure to cyanotoxins is expected toinfluence both morbidity (ill health) and
mortality;toxic cyanobacterial blooms can cause he-
alth impairments such as skin irritations, al-lergic responses, mucosa blistering, paraly-sis of peripheral skeletal muscles and respi-
ratory muscles, hay fever symptoms, diarr-hoea, acute gastroenteritis, and liver and kid-
ney damage;epidemiological evidence of increased rates
of primary liver cancer and colorectal can-cer in a specific population in China has been
associated with the consumption of cyano-bacterially contaminated drinking water (Yu,
1995; Zhou et al., 2000);cyanotoxins can accumulate in freshwater
mussels, freshwater clams and fish, and trans-fer through the food chain.
WHAT ARE THE STEPS IN A TOXICITY MONITORINGPROGRAMME?Expensive analytical techniques, modern equip-
ment and high financial support for full chemicalanalysis of the quantity and quality of cyanobac-
terial toxins are usually required. A cyanobacte-rial extract may contain a variety of chemical sub-
stances like acids, peptides or pigments, whichmay be unknown. Their potential effects can only
be detected by toxicological testing in conjunc-tion with chemical toxin analysis. In many cases
and , more importantly, is an estimation of thetoxic effect of complete mixtures, whether they
are known or unknown, than detection of selec-ted, individual contaminants.
The first step of investigation should involve bio-assays using different organisms (biotest) and en-
zymes (biochemical methods) for screening thetoxicity of complex mixtures. Further, the chemi-
cal analysis to determine the quality, quantity andoriginal source of harmful individual substances
should be applied (Box 7.13).
The World Health Organization (WHO) recommen-ded 1 microgram per litre as a safety guideline
value for the maximum acceptable level of mi-crocystin-LR or its equivalents in drinking water
due to the epidemiological character of cyano-bacterial toxins (WHO, 1998).
HOW TO DETECT SPECIFIC TOXINSBiotests (biological methods)Biotests with different organisms (bioindicators)
can provide both estimations of complete mixtu-re toxicity, without determination of the poten-
tial effects of individual contaminants (Appendix6). Synergistic or antagonistic effects between
complex mixtures can also be analysed.In previous investigations, a mouse was the most
popular organism that was used to biotest in cy-anobacterial research. This kind of bioassay invo-
lves oral consumption or intraperitoneal injection
Surveys & Assessm
ents: Streams &
Reservoirs
Fig. 7.7A Microcystis bloom near the drinking water intake in
Sulejow Reservoir, Poland, September 1999(photo: M. Tarczynska)
VwerySmatrBook03.p65 2004-06-17, 17:26110
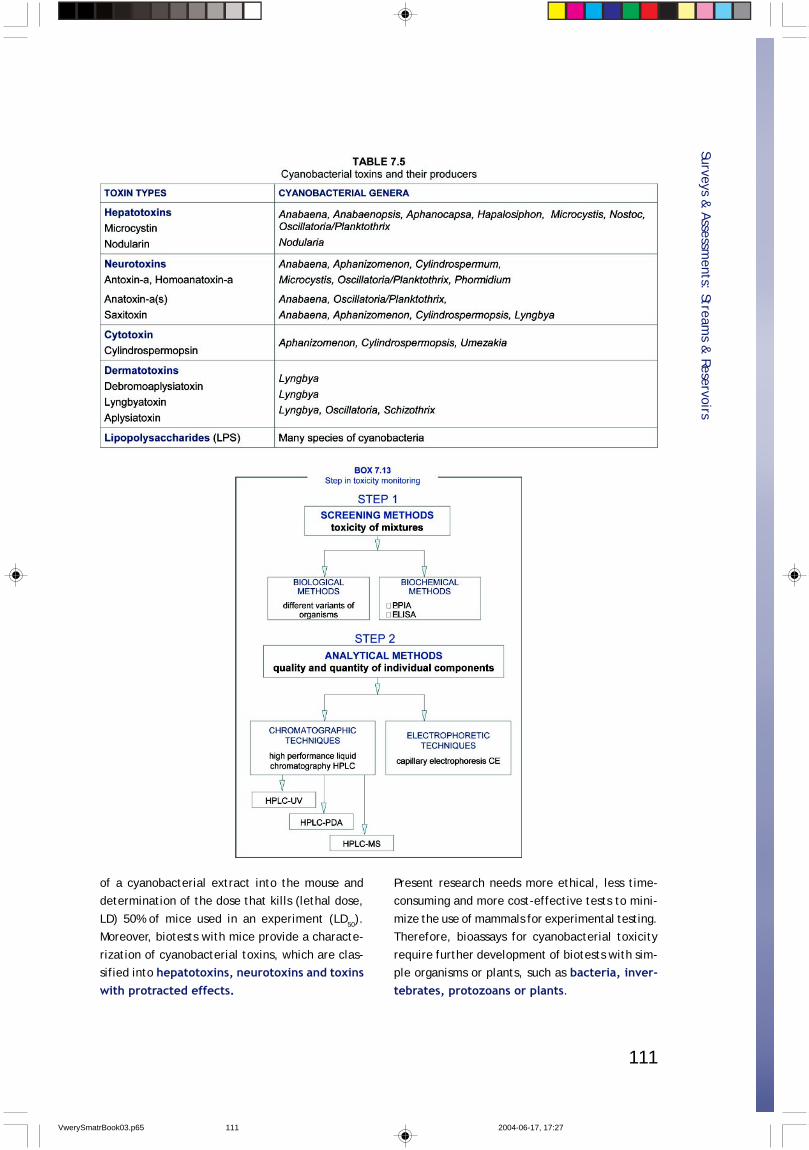
111
of a cyanobacterial extract into the mouse anddetermination of the dose that kills (lethal dose,
LD) 50% of mice used in an experiment (LD50).Moreover, biotests with mice provide a characte-
rization of cyanobacterial toxins, which are clas-sified into hepatotoxins, neurotoxins and toxinswith protracted effects.
Present research needs more ethical, less time-consuming and more cost-effective tests to mini-
mize the use of mammals for experimental testing.Therefore, bioassays for cyanobacterial toxicity
require further development of biotests with sim-ple organisms or plants, such as bacteria, inver-tebrates, protozoans or plants.
Surveys & Assessm
ents: Streams &
Reservoirs
VwerySmatrBook03.p65 2004-06-17, 17:27111
112
What conditions have to be met by the organi-sms used as bioindicators?For organisms to be widely used as bioindicators anumber of conditions have to met (Persoone &
Gillett, 1990; Suess, 1982).have to be available over the whole year;
should be genetically uniform;have to be healthy and in good condition at
the time of testing;test reactions have to be evident and
repeatable, easy to observe and interpretand have a statistical background;
in environmental analysis the organisms sho-uld be typical of a specific country or re-
gion; andin heavy contamination conditions they sho-
uld be sensitive to a broad spectrum of to-xic substances.
The sensitivity of these tests with microorganismsor plants should correlate with the sensitivity of
vertebrates.Examples of invertebrates used for testing inclu-
de Drosophila melanogaster and different speciesof mosquitoes, such as Culex pipiens, Aedes aegyp-ti, and Culiseta longiareolata. Despite the high
sensitivity of these organisms, they are not oftenused because the methods need continuous cultu-
res of test organisms.
Bacterial testsBacterial tests as a cost-effective and rapid me-
thod are a useful tool for toxicity assessment. Flu-orescent bacteria, Vibrio fisheri, have been pro-
posed as suitable microorganisms for determiningcyanobacterial toxicity (Appendix 6). Biolumine-
scent tests, such as Microtox, have shown thatVibrio fisheri can be used to analyze the toxicity
of purified cyanobacterial extracts. ToxAlert, asecond toxicity test kit (or toxikit) with Vibrio fi-
sheri, has given positive signals in determining thetoxicity of crude and purified cyanobacterial
extracts. The other effective bacterial test fordetermining cyanobacterial toxicity is ToxiChro-
moPad that uses Escherichia coli as the test orga-nism (Appendix 6).
Plant testsThe toxicity of cyanobacterial blooms can be de-
termined using water plants, e.g., Spirodela oli-gorrhiza or Lemna minor L. Plants are easier to
handle than animals and have proved to be usefulin monitoring contamination of water by heavy
metals and algal toxins. Cyanobacterial hepatoto-xins inhibit the growth of S. oligorrhiza by redu-
cing the number of fronds and decreasing chloro-phyll (a + b) concentrations.
There is a need to develop new, and evaluate lesswell known, biotests utilizing higher plants, parti-
cularly seeds and seedlings of plants and watermacrophytes.
Advantages of water plants (macrophytes)as bioindicators of water pollutionSeveral authors (Landolt & Kandeler, 1986; Lewis,
1995; Swanson et al., 1991; Wang, 1989) have no-ted the advantages of using macrophytes as bioin-
dicators of water pollution:macrophytes are more sensitive to contami-
nants than algae;they are very sensitive to pesticides;they have high reproductive rates (1-4 days),
small size and are easier to propagate thanother plants;
water plants (Lemnaceae) are more sensiti-ve than invertebrates that were usually used
until now;easy to use in laboratory conditions; and
results of laboratory evaluations are compa-rable to tests conducted in natural condi-
tions.
Advantages of seeds bioindicatorsof water pollutionThe use of seeds as bioindicators produce less pro-blems than fishes, algae and crustacea and their
advantages include:seeds, typical of a specific climate or envi-
ronment, are easily available in each geogra-phic location and there are no problems with
their transport, storage and preparation fortests;
seeds can be stored for many years withoutchanges in vigour and physiological condition;
Surveys & Assessm
ents: Streams &
Reservoirs
VwerySmatrBook03.p65 2004-06-17, 17:27112
113
the physiology and morphology of seeds iswell known, which makes their use in bioin-
dicator tests easier;seeds of higher plants and their seedlings
are sensitive to a broad range of environ-mental contaminants;
due to the small dimensions of seeds andtheir uniformity and low weight, small water
samples can be tested;test reactions are repeatable and easy to
observe, measure and apply;for seed tests no expensive equipment is
necessary nor is filtration of water samples;and
seed tests are easy to conduct and are morehumanitarian than those on, e.g., fishes.
It is believed that biotests, which make use of se-eds and macrophytes, thanks to their low cost,
easy procedures and permanent availability of bio-logical material, can play an important role in the
bioindication of water pollution, including bioin-dication of toxic cyanobacterial blooms. Thanks
to the high sensitivity of water plants from theLemnaceae family, information on water toxicitycan be obtained within 24 hours.
ToxikitsQuick tests should become an integral part of waterquality assessment. To ensure repeatability of results
uniform conditions of testing, as well as rearing proce-dures for test organisms, are essential. In recent years,
complete kits for toxicity tests have become availablecommercially (so-called Toxkits). They include all ma-
terials, along with test organisms, necessary for con-ducting rapid and accurate tests.
Such kits eliminate the problems with the delive-ry and culturing of enough organisms from the same
source in similar conditions. Moreover, organismsin each toxikit have the same sensitivity to toxins.
Proper selection of organisms and exposure timesenables results to be obtained within a few minu-
tes or hours. The materials and reagents conta-ined in the kit reduce test preparation time and
eliminate errors that may occur during reagentpreparation. Toxikits guarantee standardization and
validation of bioassays. Unfortunately, Toxkits are veryexpensive and require a high number of replications.
Biochemical methodsProtein phosphatase inhibition assay (PPIA) and
enzyme-linked immunosorbent assay (ELISA) arerapid (2 hour treatment times) and sensitive scre-
ening methods for detection of hepatotoxins anddetermination of their toxicity (Appendix: 7). Both
methods enable detection of very low doses ofmicrocystins, even directly from drinking water
supplies below 1 µg L-1 microcystin-LR.A colourimetric protein phosphatase inhibitionassay with enzyme protein phosphatase 1 (PP1)and the substrate p-nitrophenylphosphate (p-NPP) is a useful tool for determining the toxicityof microcystins and nodularins contained in cy-
anobacterial samples.However, a protein phosphatase inhibition assay,
using 32P-radiolabelled phosphorylase as a substra-te, has proved to be more sensitive for detecting
and determining the toxicity of hepatotoxins thanthe colourimetric protein phosphatase assay. This
radiolabelled assay can use both protein phospha-tase 1 and 2A (PP1 and PP2). Unfortunately, equ-
ipment requirements for the radiolabelled prote-in phosphatase assay (e.g., a liquid scintillationcounter) are higher than for the colourimetric as-
say.Enzyme-linked immunosorbent assay, such as the
protein phosphatase inhibition assay, is useful forinitial toxicity screening. Commercially the ELISA
kit (EnviroGard, EnviroLogix) is available for qu-antifying microcystins. The estimation of micro-
cystin concentrations by this colourimetric methodrequires specific antibodies, which are fixed to
the walls of tubes or wells in a microplate.Both the PPIA and ELISA colourimetric methods
need a plate reader to measure the results of boththe p-nitrophenyl (p-NP) (PPIA) and microcystin-
enzyme conjugate (ELISA), assays.
Analytical methods (chemical analysis)Analytical methods are based on the physical and
chemical properties of cyanotoxins, such as mole-cular weight, chromophores and reactivation pro-
ducts due to the functional groups in the molecu-les. A summary of chromatographic methods usu-
ally used for the detection of cyanotoxins is givenin Appendix 8.
Surveys &Assessm
ents: Streams &
Reservoirs
VwerySmatrBook03.p65 2004-06-17, 17:27113
114
The most common analytical procedure for the de-termination of microcystins (intracellular and extra-
cellular) is high performance liquid chromatogra-phy (HPLC), which provides identification of mi-
crocystins using their characteristic spectrum at anabsorption of 238 nm. The HPLC method can be
used for monitoring toxic cyanobacterial blooms inwater.
High performance liquid chromatography combinedwith UV detection has been used extensively for
the detection of microcystins. But, because thismethod relies on retention time for identification,
microcystin standards are required. Detection byUV can be made more specific by using a photodio-
de array (PDA) detector, but it has very limited abi-lity to identify individual microcystins because al-
most all microcystins have a similar UV spectrum(Box 7.14).
To further confirm and identify cyanotoxins analy-tical methods coupled with mass spectrometry are
used. For example, liquid chromatography coupledwith mass spectrometry (LC-MS) is a very promising
method for the simultaneous separation and iden-tification of microcystins in mixtures. Identificationof the microcystin characteristic ion at m/z 135,
derived from Adda (a unique amino acid, which se-rves as the key structural component for the biolo-
gical activities of microcystins), has proven to beuseful for discriminating microcystins from other
types of compounds.Also other similar techniques such as capillary elec-trophoresis (CE) and related techniques must alsobe considered for the separation and quantifica-
tion of peptide hepatotoxins. CE coupled with massspectrometry gives a low limit of detection and in-
creased sensitivity method for determining micro-cystins. However, due to poor result replication this
method requires further evaluation.High performance liquid chromatography, as well
as capillary electrophoresis, are the only analytical
techniques that can separate and identify cyano-toxins simultaneous (Meriluotoo et al., 1998). Ana-
lytical techniques based on either HPLC or LC-MScan also be used for determining saxitioxins, anato-
xins or cylindrospermopsin in water.A physical and chemical screening method that is
based on the detection of 2-methyl-3-methoxy-4-phenylbutyric acid (MMPB) as an oxidation product
of microcystins, has been reported. Gas chromato-graphy (GC) coupled with mass spectrometry, or
HPLC coupled with fluorescence detection, are usedto identify microcystin oxidation products.
Despite the number of techniques used for identifi-cation of microcystins, only high performance liqu-
id chromatography finds application in qualitativeand quantitative determinations of cyanotoxins in
water and cyanobacterial cells with regards to sim-plicity, high sensitivity, selectivity and, almost as
importantly, high precision. Unfortunately, in situ-ations when standards are commercially unavaila-
ble for the majority of toxins the HPLC method can-not be used.
Biological methods of toxin detection (e.g., mi-crobiotest with bacteria and invertebrates) are use-
ful as an initial toxicity screening method for cy-anobacterial detection. However, because of low
sensitivity and high detection limits for cyanoto-xins, they cannot replace biochemical methods
(e.g., PPIA and ELISA) or chemical methods (e.g.,HPLC).
For the detection of very low concentrations ofhepatotoxins, the PPIA or ELISA test should be used.
For qualitative and quantitative chemical analysisof cyanobacterial toxins, HPLC is needed. Becauseof our still incomplete knowledge about cyano-bacterial toxins and their toxicity, biological, bio-chemical and chemical methods should be appliedjointly.
Surveys & Assessm
ents: Streams &
Reservoirs
VwerySmatrBook03.p65 2004-06-17, 17:27114
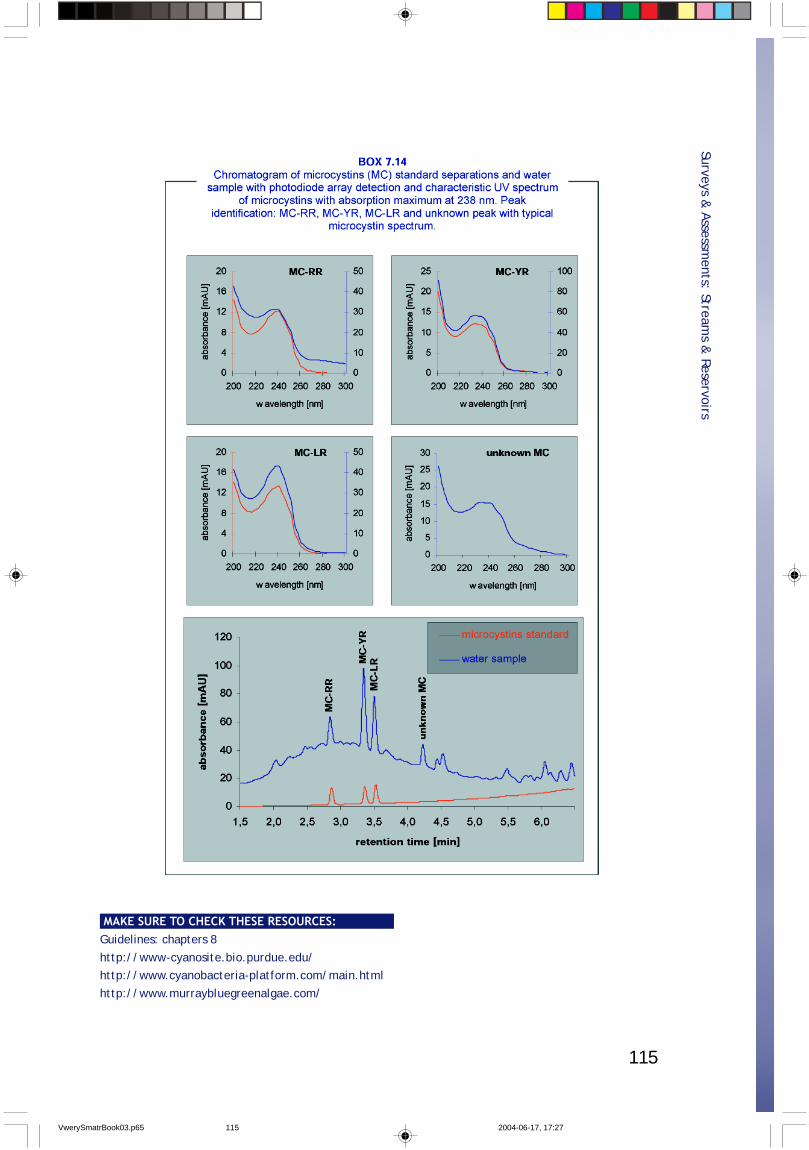
115
Surveys & Assessm
ents: Streams &
Reservoirs
Guidelines: chapters 8
http://www-cyanosite.bio.purdue.edu/http://www.cyanobacteria-platform.com/main.html
http://www.murraybluegreenalgae.com/
MAKE SURE TO CHECK THESE RESOURCES:
VwerySmatrBook03.p65 2004-06-17, 17:27115
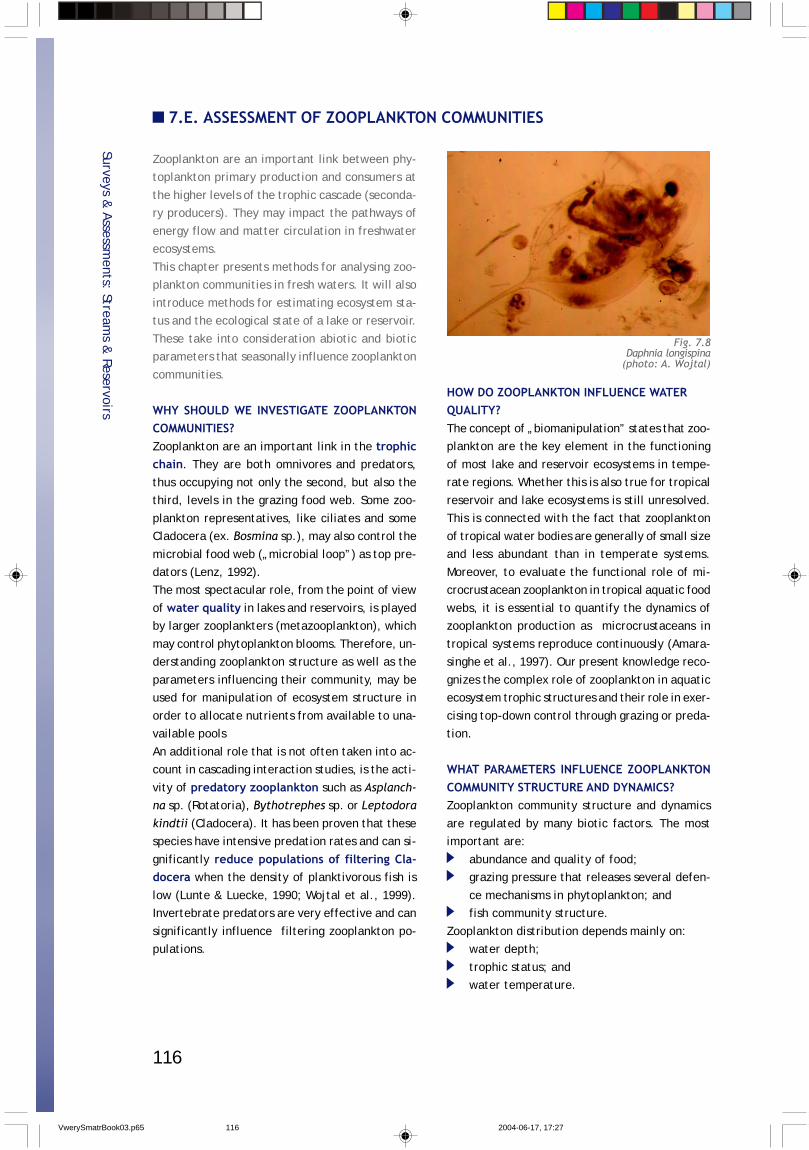
116
7.E. ASSESSMENT OF ZOOPLANKTON COMMUNITIES
Zooplankton are an important link between phy-toplankton primary production and consumers at
the higher levels of the trophic cascade (seconda-ry producers). They may impact the pathways of
energy flow and matter circulation in freshwaterecosystems.
This chapter presents methods for analysing zoo-plankton communities in fresh waters. It will also
introduce methods for estimating ecosystem sta-tus and the ecological state of a lake or reservoir.
These take into consideration abiotic and bioticparameters that seasonally influence zooplankton
communities.
WHY SHOULD WE INVESTIGATE ZOOPLANKTONCOMMUNITIES?Zooplankton are an important link in the trophicchain. They are both omnivores and predators,
thus occupying not only the second, but also thethird, levels in the grazing food web. Some zoo-
plankton representatives, like ciliates and someCladocera (ex. Bosmina sp.), may also control the
microbial food web („microbial loop”) as top pre-dators (Lenz, 1992).The most spectacular role, from the point of view
of water quality in lakes and reservoirs, is playedby larger zooplankters (metazooplankton), which
may control phytoplankton blooms. Therefore, un-derstanding zooplankton structure as well as the
parameters influencing their community, may beused for manipulation of ecosystem structure in
order to allocate nutrients from available to una-vailable pools
An additional role that is not often taken into ac-count in cascading interaction studies, is the acti-
vity of predatory zooplankton such as Asplanch-na sp. (Rotatoria), Bythotrephes sp. or Leptodora
kindtii (Cladocera). It has been proven that thesespecies have intensive predation rates and can si-
gnificantly reduce populations of filtering Cla-docera when the density of planktivorous fish is
low (Lunte & Luecke, 1990; Wojtal et al., 1999).Invertebrate predators are very effective and can
significantly influence filtering zooplankton po-pulations.
HOW DO ZOOPLANKTON INFLUENCE WATERQUALITY?The concept of „biomanipulation” states that zoo-plankton are the key element in the functioning
of most lake and reservoir ecosystems in tempe-rate regions. Whether this is also true for tropical
reservoir and lake ecosystems is still unresolved.This is connected with the fact that zooplankton
of tropical water bodies are generally of small sizeand less abundant than in temperate systems.
Moreover, to evaluate the functional role of mi-crocrustacean zooplankton in tropical aquatic food
webs, it is essential to quantify the dynamics ofzooplankton production as microcrustaceans in
tropical systems reproduce continuously (Amara-singhe et al., 1997). Our present knowledge reco-
gnizes the complex role of zooplankton in aquaticecosystem trophic structures and their role in exer-
cising top-down control through grazing or preda-tion.
WHAT PARAMETERS INFLUENCE ZOOPLANKTONCOMMUNITY STRUCTURE AND DYNAMICS?Zooplankton community structure and dynamics
are regulated by many biotic factors. The mostimportant are:
abundance and quality of food;grazing pressure that releases several defen-
ce mechanisms in phytoplankton; andfish community structure.
Zooplankton distribution depends mainly on:water depth;
trophic status; andwater temperature.
Surveys & Assessm
ents: Streams &
Reservoirs
Fig. 7.8Daphnia longispina
(photo: A. Wojtal)
VwerySmatrBook03.p65 2004-06-17, 17:27116
117
An interesting feature of zooplankton is their da-ily horizontal and vertical migrations, which oc-
cur at dusk and dawn. Vertical migrations, evenup to several hundred metres (Calanus sp.), are
characteristic of deep lakes, while in shallow la-kes, horizontal migration is observed.
Species diversity is generally governed by the tem-perature regime. The highest diversity is found in
tropical and subtropical regions and the lowest inextreme environments, such as polar zones and
brackish water areas. Temperature is also the mostimportant external factor governing the growth
and metabolic rates of zooplankton.Another significant factor is food availability,
which varies with season. Thus, the majority oforganisms have adapted their life cycle in such a
way that they encounter optimal conditions du-ring their reproductive period. Under optimal food
conditions, the highest turnover rate is observedin small organisms in the tropics and the lowest in
large organisms in polar regions (Harris et al.,2000).
Tropical lakes differ in at least two fundamentalproperties from temperate lakes: high annual ir-radiance, and low daily and annual variations in
irradiance. These result in a limited number ofeffects, of which high water temperature, low
variation in water temperature and high primaryproduction, are the most important to secondary
production (Amarasinghe et al., 1997).
THE ROLE OF HYDROLOGICAL PARAMETERSAND NUTRIENT AVAILABILITYImportant factors regulating the intensity of pri-mary production and, thus food availability for
zooplankton, are high phosphorus loads and lowN:P ratios. Daphnia spp. are known to have much
lower C:P (around 80:1 to 100:1) and N:P ratios intheir stoichiometry than most other freshwater
zooplankton studied so far (Andersen & Hessen,1991). The high demand for P has two consequen-
ces: cladocerans have to minimize P-losses viaexcretion when algal food is short in P (Elser &
Urabe, 1999). This leads to an enhancement of P-limitation of algae. Second, cladocerans might
become P-limited if food is abundant but poor inP (Sommer, 1992). The threshold for P-limitation
for Daphnia seems to be at a food C:P ratio ofapprox. 300:1 (Sommer & Stibor, 2002). Copepods
have a much lower tissue P-content and, conse-quently, higher C:P and N:P ratios than cladoce-
rans (Andersen & Hessen, 1991).External nutrient loads to reservoirs depend on
catchment geomorphology and use, climatic con-ditions and consequent hydrological factors of the
reservoir and its tributaries. The pattern of tribu-tary discharges also alter abiotic conditions in a
reservoir, such as water retention time, watertransparency and water column stability. The sup-
ply of high matter loads to reservoirs is also im-portant for the development of small filtrator
(e.g., Bosmina sp.) populations and may regulatethe microbial loop.
METHODS OF ZOOPLANKTON COMMUNITYASSESSMENTNumber and location of stationsThe number and location of stations depends onthe degree of diversity of a study site.
Stations should be located in sites with differentcharacteristics, which includes hydraulic parame-ters, water inflow, bottom structure (also presen-
ce of submerged macrophytes), depth, physical-chemical factors, predatory pressures, quantity
and quality of food (phytoplankton, bacterioplank-ton, picoplankton), and anthropogenic pressures.
For advanced ecological analysis of a water bodystatus, samples should be taken together with
water samples for chemistry and phytoplanktonbiomass assessment (see chapter 7.C).
Sampling methodologyIn order to collect zooplankton the following sam-plers may be used:
water bottle samplers, for taking discretesamples or relatively small volumes of water
(a few litres);pumping systems that sample intermediate
volumes of water (tens of litres to tens ofcubic metres);
nets of many different shapes and sizes thatare towed vertically, horizontally or obliqu-
Surveys & Assessm
ents: Streams &
Reservoirs
VwerySmatrBook03.p65 2004-06-17, 17:27117
118
ely and sample much larger volumes ofwater (tens to thousands of cubic metres),
apply mainly to oceanography studies.A detailed description of plankton samplers was
given by, e.g., Harris et al., (2000).The type of preservative used to fix zooplankton
samples will depend on the purpose for which thesamples were taken. In general, zooplankton are
preserved in 4% Lugol’s solution or in 4% formal-dehyde. The various techniques for zooplankton
fixation and preservation are given in „Zooplank-ton fixation and preservation” edited by Steed-
man (1976).
Time and frequency of samplingFor advanced analysis, zooplankton should be sam-
pled weekly or bimonthly starting at the begin-ning of the summer season (April-May in tempera-
te regions) up to October, with three replicatesfor each sampling date.
However, adequate assessment of zooplanktoncommunities can never be conducted on the basis
of a single sampling because of the high seasonalfluctuations of zooplankton density and commu-nity structure. Therefore, interpretations of the
results will very much depend on the degree ofunderstanding of these processes.
UNDERSTANDING SEASONAL ZOOPLANKTONFLUCTUATIONS FOR INTERPRETATION OF RE-SULTSA scheme of seasonal fluctuations of phyto- andzooplankton is represented in the PEG Model
(Plankton Ecology Group), which was constructedon the basis of the results from 24 eutrophic la-
kes. In the case of oligotrophic lakes, fluctuationsproceed at a slower rate and insom ecosystems do
not include all stages (e.g., clear water phase) - Box7.14.
According to the PEG Model this is a typical speci-fic sequence of plankton succession and includes
the following stages (Sommer et al., 1986; Som-mer & Stibor, 2002) (Box 7.15):
biomass accumulation during spring -the firstphytoplankton biomass maximum due to high
biomass of edible phytoplankton (rarely ap-pear in oligotrophic lakes).
phytoplankton spring bloom is followed by aclear water phase, with low phytoplankton
biomass caused by zooplankton grazing.decrease of metabolic rate (decreasing of
P:B relationship) of phytoplankton. This pro-cess is discontinued during the clear water
phase;decrease of zooplankton density is observedbecause of enhanced competition resultingfrom food limitation;
in summer strong pressure of invertebrateand vertebrate (fish) predators may be ob-
served; andbiomass decrease of large filterers (Daph-
nia sp.) may appear in summer because offood limitation. High biomass of inedible al-
gae (e.g., Cyanobacteria).
Clear water phases usually do not occur duringsummer when there is an abundance of less edi-
ble algae that can compensate by growth for thelosses of more edible algae. Thus, the top-downimpact of zooplankton during summer will main-
ly be reflected by the taxonomic and size classcomposition of phytoplankton.
switch from phytovorous to detritovorousmodes of feeding. Inedible algae are partlyexploited by parasites and detritovorous ani-
mals.
INTERPRETATION OF RESULTSThe schemes presented in Box 7.16 should be help-
ful in interpretation of your results. It shows thevariability of processes in eutrophic lakes where
they are mainly dependent on winter temperatu-re, as well as in such systems where processes
depend on biotic interactions (mainly predatorypressure). If you find similar results, you should
follow the arrows to identify the processes regu-lating zooplankton communities in your ecosystem.
Surveys & Assessm
ents: Streams &
Reservoirs
VwerySmatrBook03.p65 2004-06-17, 17:27118
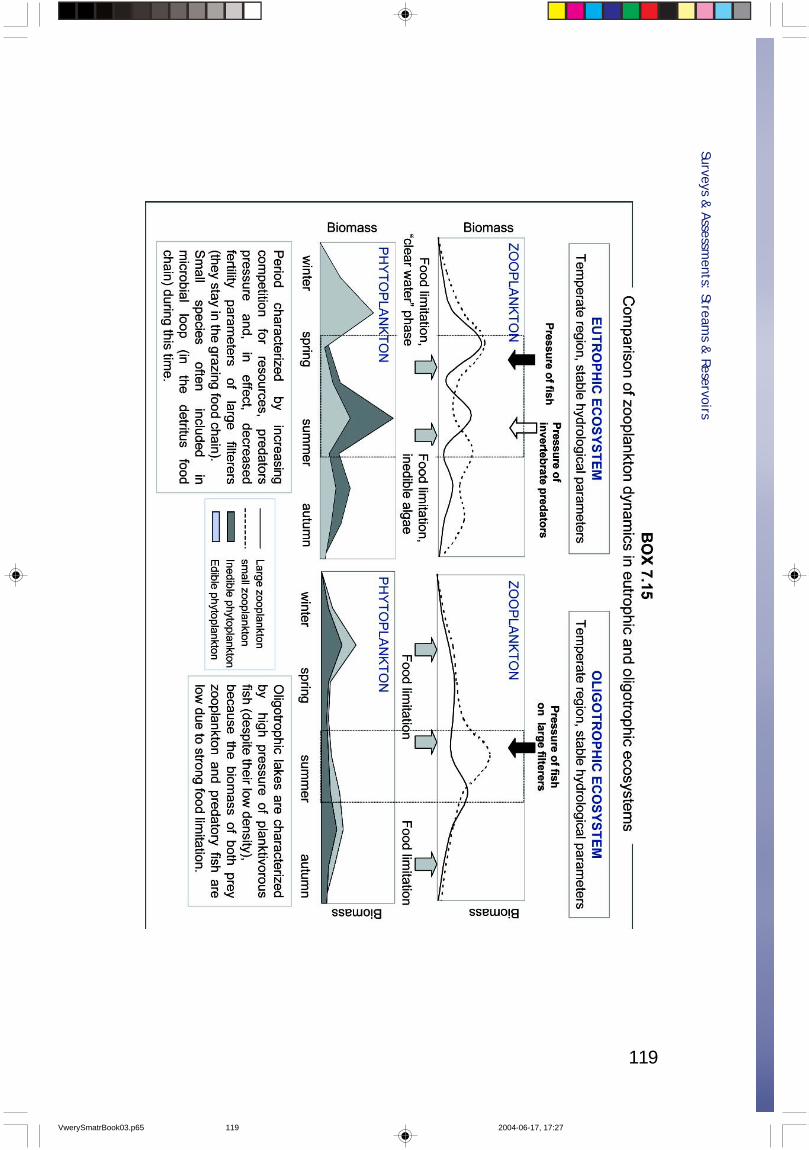
119
Surveys & Assessm
ents: Streams &
Reservoirs
VwerySmatrBook03.p65 2004-06-17, 17:27119
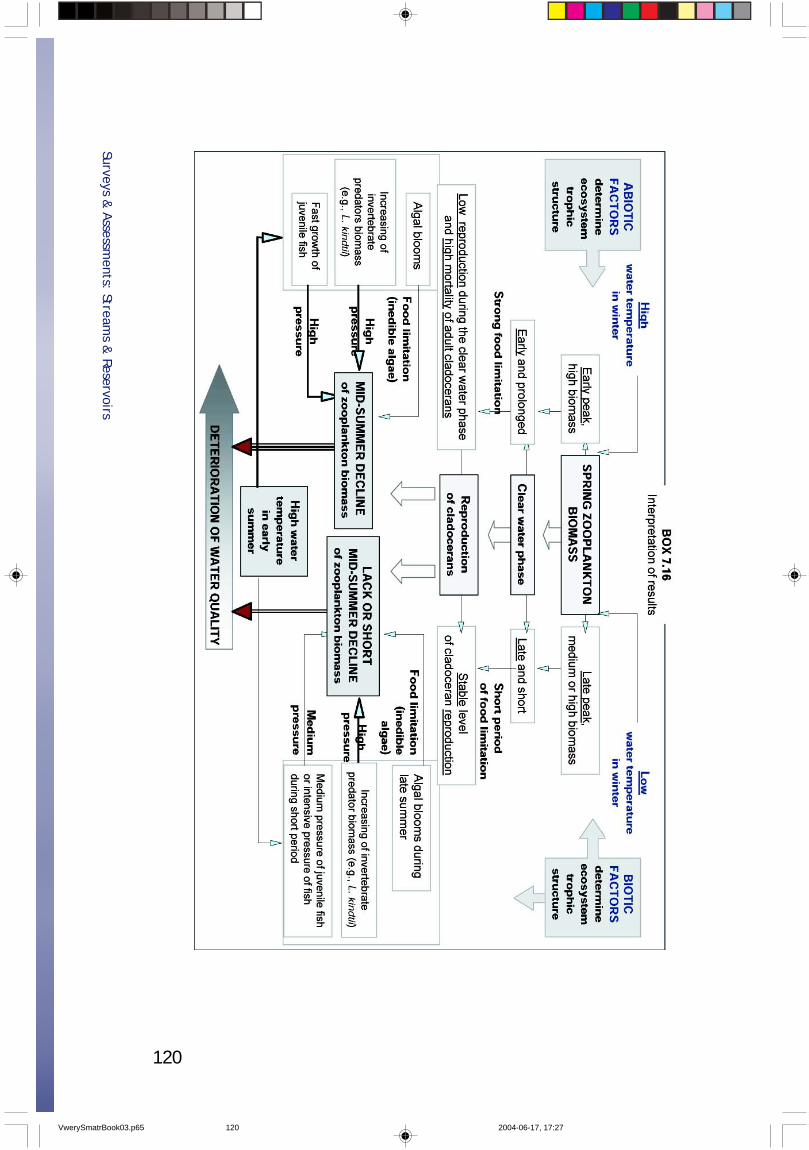
120
Surveys & Assessm
ents: Streams &
Reservoirs
VwerySmatrBook03.p65 2004-06-17, 17:27120
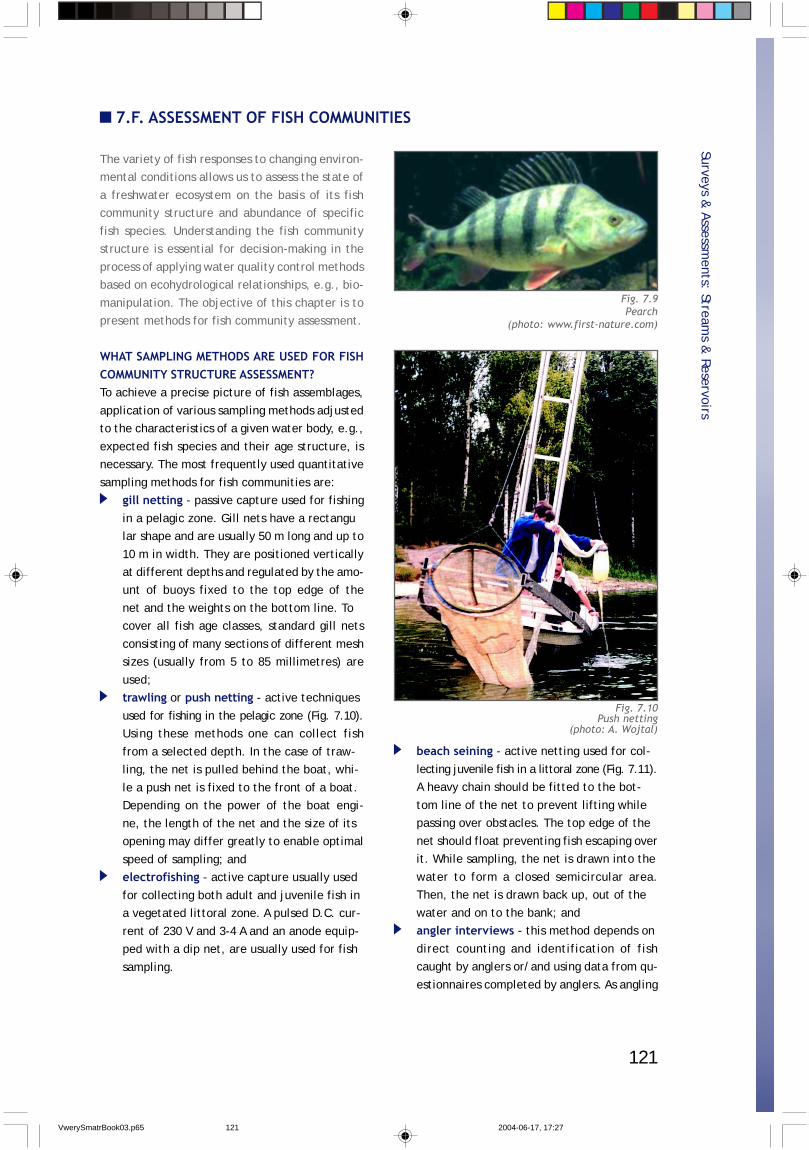
121
7.F. ASSESSMENT OF FISH COMMUNITIES
The variety of fish responses to changing environ-mental conditions allows us to assess the state of
a freshwater ecosystem on the basis of its fishcommunity structure and abundance of specific
fish species. Understanding the fish communitystructure is essential for decision-making in the
process of applying water quality control methodsbased on ecohydrological relationships, e.g., bio-
manipulation. The objective of this chapter is topresent methods for fish community assessment.
WHAT SAMPLING METHODS ARE USED FOR FISHCOMMUNITY STRUCTURE ASSESSMENT?To achieve a precise picture of fish assemblages,
application of various sampling methods adjustedto the characteristics of a given water body, e.g.,
expected fish species and their age structure, isnecessary. The most frequently used quantitative
sampling methods for fish communities are:gill netting - passive capture used for fishing
in a pelagic zone. Gill nets have a rectangular shape and are usually 50 m long and up to
10 m in width. They are positioned verticallyat different depths and regulated by the amo-unt of buoys fixed to the top edge of the
net and the weights on the bottom line. Tocover all fish age classes, standard gill nets
consisting of many sections of different meshsizes (usually from 5 to 85 millimetres) are
used;trawling or push netting - active techniques
used for fishing in the pelagic zone (Fig. 7.10).Using these methods one can collect fish
from a selected depth. In the case of traw-ling, the net is pulled behind the boat, whi-
le a push net is fixed to the front of a boat.Depending on the power of the boat engi-
ne, the length of the net and the size of itsopening may differ greatly to enable optimal
speed of sampling; andelectrofishing - active capture usually used
for collecting both adult and juvenile fish ina vegetated littoral zone. A pulsed D.C. cur-
rent of 230 V and 3-4 A and an anode equip-ped with a dip net, are usually used for fish
sampling.
beach seining - active netting used for col-
lecting juvenile fish in a littoral zone (Fig. 7.11).A heavy chain should be fitted to the bot-
tom line of the net to prevent lifting whilepassing over obstacles. The top edge of the
net should float preventing fish escaping overit. While sampling, the net is drawn into the
water to form a closed semicircular area.Then, the net is drawn back up, out of the
water and on to the bank; andangler interviews - this method depends on
direct counting and identification of fishcaught by anglers or/and using data from qu-
estionnaires completed by anglers. As angling
Surveys & Assessm
ents: Streams &
Reservoirs
Fig. 7.10Push netting
(photo: A. Wojtal)
Fig. 7.9Pearch
(photo: www.first-nature.com)
VwerySmatrBook03.p65 2004-06-17, 17:27121
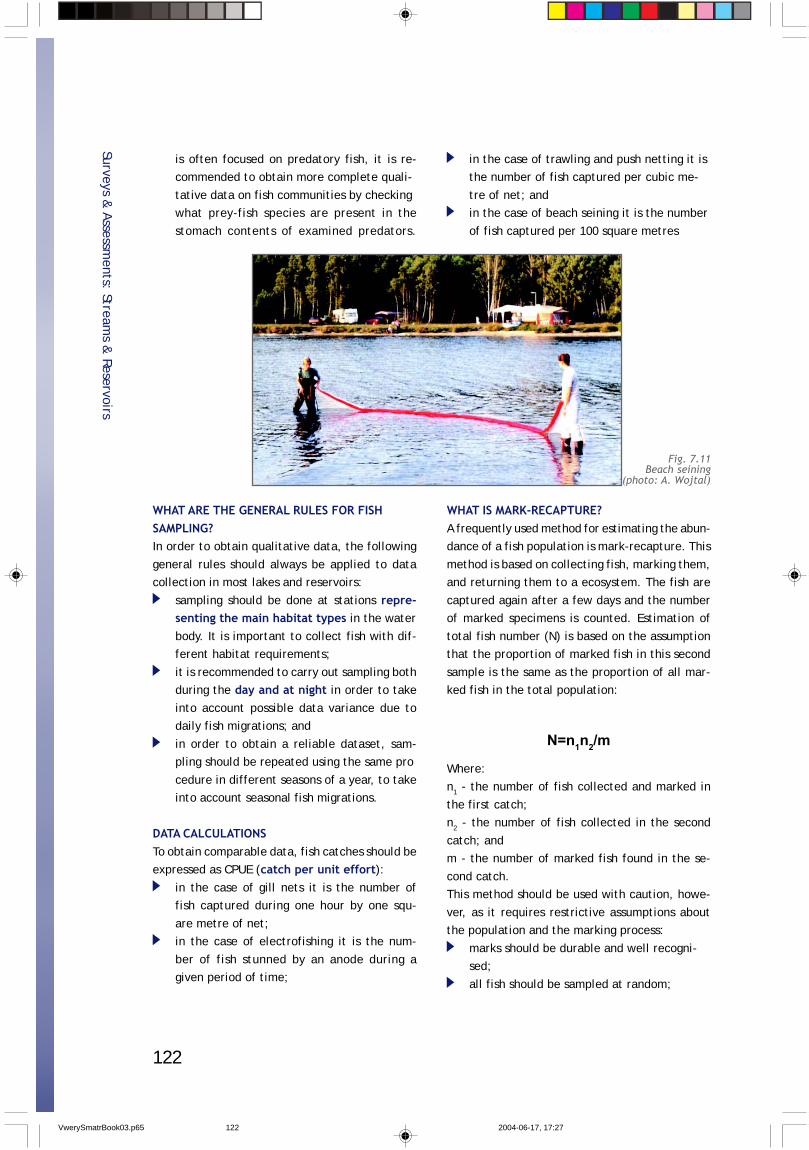
122
is often focused on predatory fish, it is re-commended to obtain more complete quali-
tative data on fish communities by checkingwhat prey-fish species are present in the
stomach contents of examined predators.
in the case of trawling and push netting it isthe number of fish captured per cubic me-
tre of net; andin the case of beach seining it is the number
of fish captured per 100 square metres
WHAT ARE THE GENERAL RULES FOR FISHSAMPLING?In order to obtain qualitative data, the following
general rules should always be applied to datacollection in most lakes and reservoirs:
sampling should be done at stations repre-senting the main habitat types in the water
body. It is important to collect fish with dif-ferent habitat requirements;
it is recommended to carry out sampling bothduring the day and at night in order to take
into account possible data variance due todaily fish migrations; and
in order to obtain a reliable dataset, sam-pling should be repeated using the same pro
cedure in different seasons of a year, to takeinto account seasonal fish migrations.
DATA CALCULATIONSTo obtain comparable data, fish catches should beexpressed as CPUE (catch per unit effort):
in the case of gill nets it is the number offish captured during one hour by one squ-
are metre of net;in the case of electrofishing it is the num-
ber of fish stunned by an anode during agiven period of time;
WHAT IS MARK-RECAPTURE?A frequently used method for estimating the abun-dance of a fish population is mark-recapture. This
method is based on collecting fish, marking them,and returning them to a ecosystem. The fish are
captured again after a few days and the numberof marked specimens is counted. Estimation of
total fish number (N) is based on the assumptionthat the proportion of marked fish in this second
sample is the same as the proportion of all mar-ked fish in the total population:
Surveys & Assessm
ents: Streams &
Reservoirs
Fig. 7.11Beach seining
(photo: A. Wojtal)
N=n1n2/m
Where:n1 - the number of fish collected and marked in
the first catch;n2 - the number of fish collected in the second
catch; andm - the number of marked fish found in the se-
cond catch.This method should be used with caution, howe-
ver, as it requires restrictive assumptions aboutthe population and the marking process:
marks should be durable and well recogni-sed;
all fish should be sampled at random;
VwerySmatrBook03.p65 2004-06-17, 17:27122
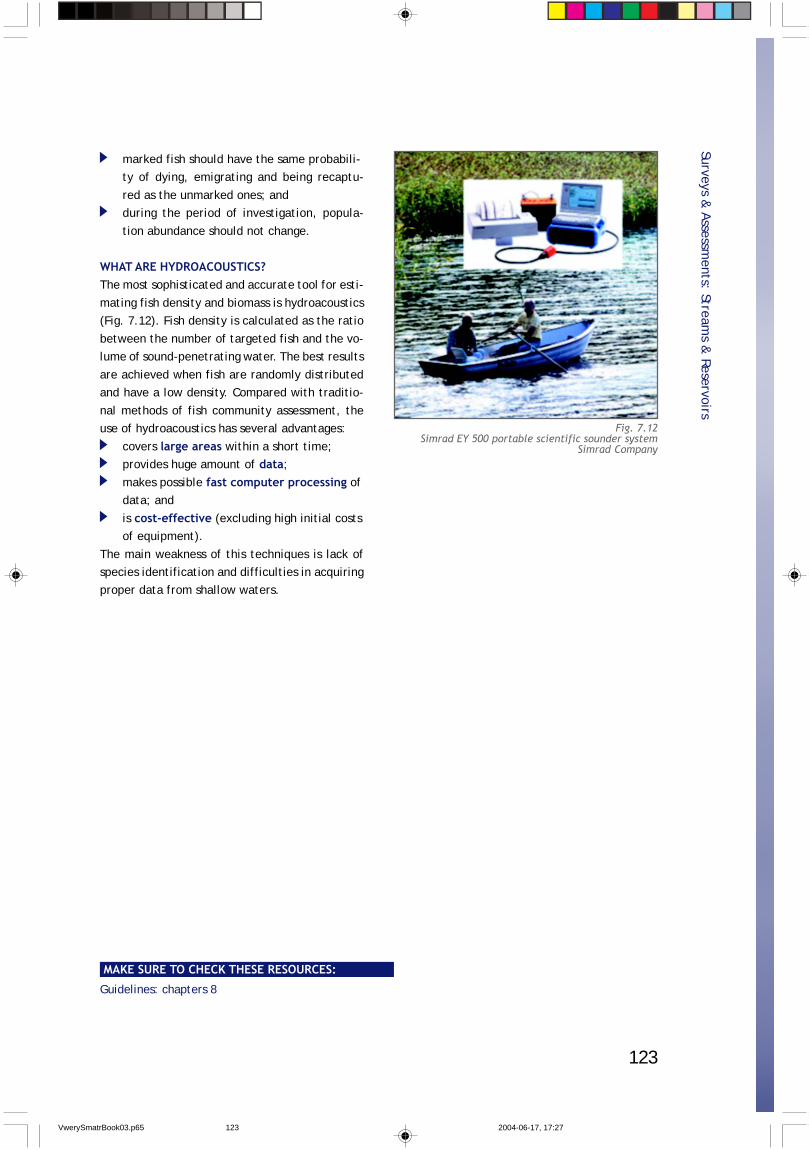
123
marked fish should have the same probabili-ty of dying, emigrating and being recaptu-
red as the unmarked ones; andduring the period of investigation, popula-
tion abundance should not change.
WHAT ARE HYDROACOUSTICS?The most sophisticated and accurate tool for esti-
mating fish density and biomass is hydroacoustics(Fig. 7.12). Fish density is calculated as the ratio
between the number of targeted fish and the vo-lume of sound-penetrating water. The best results
are achieved when fish are randomly distributedand have a low density. Compared with traditio-
nal methods of fish community assessment, theuse of hydroacoustics has several advantages:
covers large areas within a short time;provides huge amount of data;
makes possible fast computer processing ofdata; and
is cost-effective (excluding high initial costsof equipment).
The main weakness of this techniques is lack ofspecies identification and difficulties in acquiringproper data from shallow waters.
Surveys & Assessm
ents: Streams &
Reservoirs
Fig. 7.12Simrad EY 500 portable scientific sounder system
Simrad Company
MAKE SURE TO CHECK THESE RESOURCES:
Guidelines: chapters 8
VwerySmatrBook03.p65 2004-06-17, 17:27123
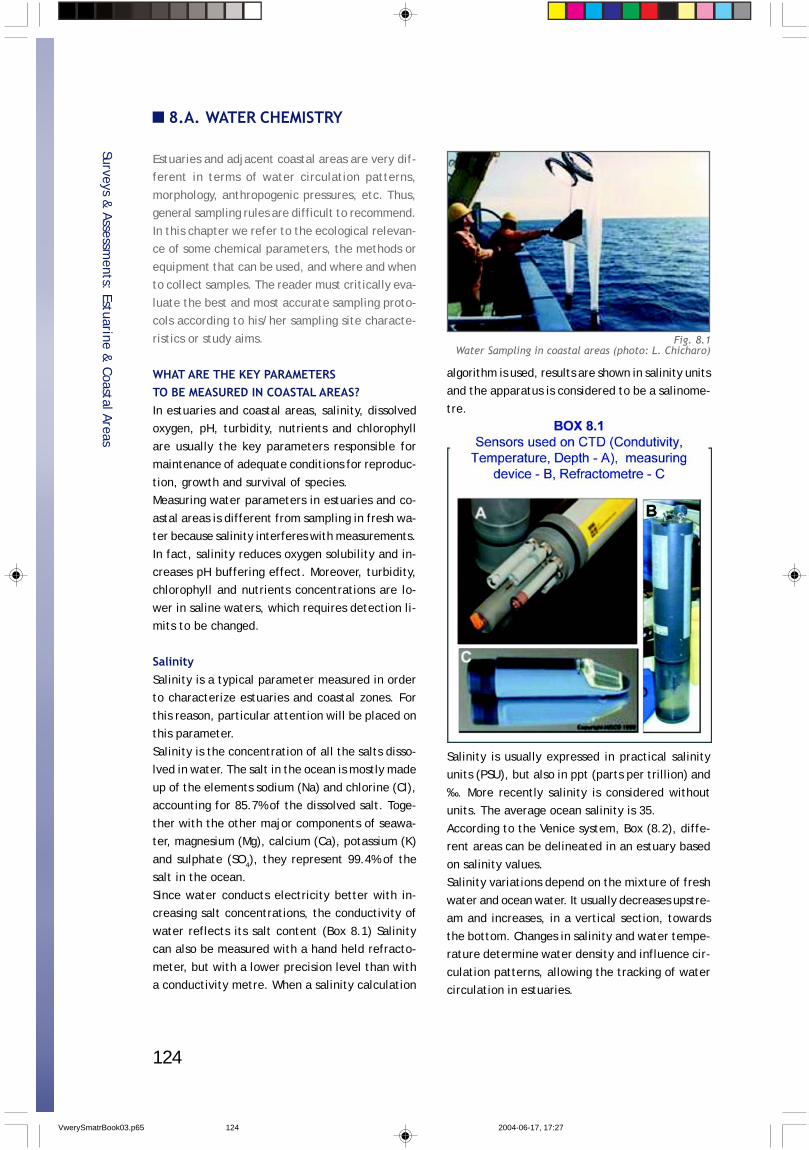
124
Estuaries and adjacent coastal areas are very dif-ferent in terms of water circulation patterns,
morphology, anthropogenic pressures, etc. Thus,general sampling rules are difficult to recommend.
In this chapter we refer to the ecological relevan-ce of some chemical parameters, the methods or
equipment that can be used, and where and whento collect samples. The reader must critically eva-
luate the best and most accurate sampling proto-cols according to his/her sampling site characte-
ristics or study aims.
WHAT ARE THE KEY PARAMETERSTO BE MEASURED IN COASTAL AREAS?In estuaries and coastal areas, salinity, dissolvedoxygen, pH, turbidity, nutrients and chlorophyll
are usually the key parameters responsible formaintenance of adequate conditions for reproduc-
tion, growth and survival of species.Measuring water parameters in estuaries and co-
astal areas is different from sampling in fresh wa-ter because salinity interferes with measurements.
In fact, salinity reduces oxygen solubility and in-creases pH buffering effect. Moreover, turbidity,chlorophyll and nutrients concentrations are lo-
wer in saline waters, which requires detection li-mits to be changed.
SalinitySalinity is a typical parameter measured in orderto characterize estuaries and coastal zones. For
this reason, particular attention will be placed onthis parameter.
Salinity is the concentration of all the salts disso-lved in water. The salt in the ocean is mostly made
up of the elements sodium (Na) and chlorine (Cl),accounting for 85.7% of the dissolved salt. Toge-
ther with the other major components of seawa-ter, magnesium (Mg), calcium (Ca), potassium (K)
and sulphate (SO4), they represent 99.4% of thesalt in the ocean.
Since water conducts electricity better with in-creasing salt concentrations, the conductivity of
water reflects its salt content (Box 8.1) Salinitycan also be measured with a hand held refracto-
meter, but with a lower precision level than witha conductivity metre. When a salinity calculation
8.A. WATER CHEMISTRY
algorithm is used, results are shown in salinity unitsand the apparatus is considered to be a salinome-
tre.
Salinity is usually expressed in practical salinityunits (PSU), but also in ppt (parts per trillion) and
‰. More recently salinity is considered withoutunits. The average ocean salinity is 35.
According to the Venice system, Box (8.2), diffe-rent areas can be delineated in an estuary based
on salinity values.Salinity variations depend on the mixture of fresh
water and ocean water. It usually decreases upstre-am and increases, in a vertical section, towards
the bottom. Changes in salinity and water tempe-rature determine water density and influence cir-
culation patterns, allowing the tracking of watercirculation in estuaries.
Surveys & Assessm
ents: Estuarine & Coastal Areas
Fig. 8.1Water Sampling in coastal areas (photo: L. Chicharo)
VwerySmatrBook03.p65 2004-06-17, 17:27124
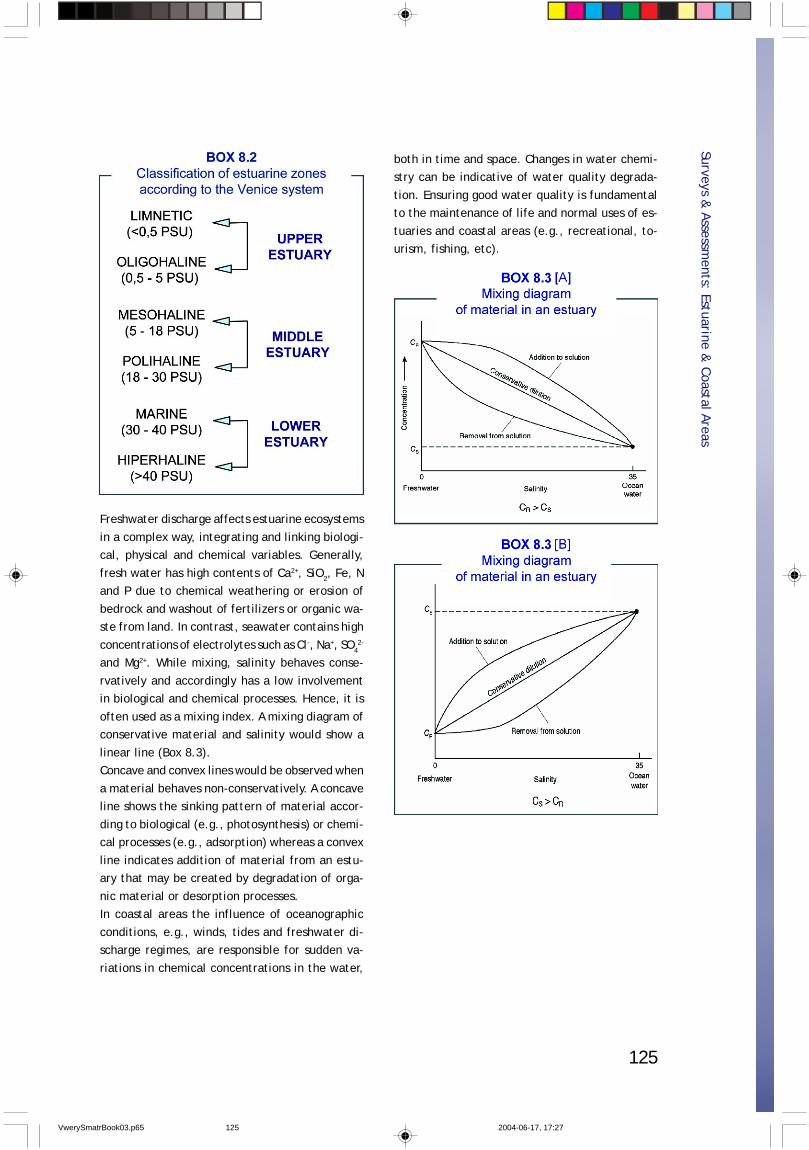
125
Freshwater discharge affects estuarine ecosystems
in a complex way, integrating and linking biologi-cal, physical and chemical variables. Generally,
fresh water has high contents of Ca2+, SiO2, Fe, Nand P due to chemical weathering or erosion of
bedrock and washout of fertilizers or organic wa-ste from land. In contrast, seawater contains high
concentrations of electrolytes such as Cl-, Na+, SO42-
and Mg2+. While mixing, salinity behaves conse-
rvatively and accordingly has a low involvementin biological and chemical processes. Hence, it is
often used as a mixing index. A mixing diagram ofconservative material and salinity would show a
linear line (Box 8.3).Concave and convex lines would be observed when
a material behaves non-conservatively. A concaveline shows the sinking pattern of material accor-
ding to biological (e.g., photosynthesis) or chemi-cal processes (e.g., adsorption) whereas a convex
line indicates addition of material from an estu-ary that may be created by degradation of orga-
nic material or desorption processes.In coastal areas the influence of oceanographic
conditions, e.g., winds, tides and freshwater di-scharge regimes, are responsible for sudden va-
riations in chemical concentrations in the water,
Surveys & Assessm
ents: Estuarine & Coastal Areas
both in time and space. Changes in water chemi-stry can be indicative of water quality degrada-
tion. Ensuring good water quality is fundamentalto the maintenance of life and normal uses of es-
tuaries and coastal areas (e.g., recreational, to-urism, fishing, etc).
VwerySmatrBook03.p65 2004-06-17, 17:27125
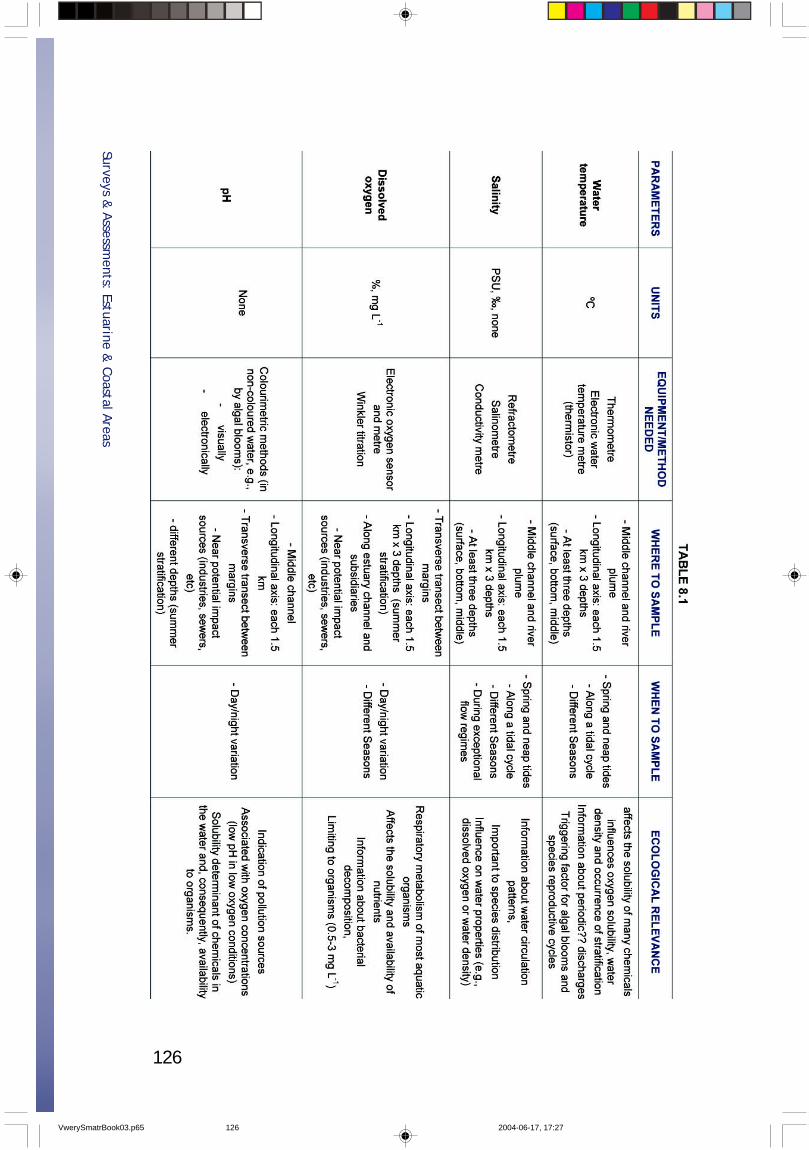
126
Surveys & Assessm
ents: Estuarine & Coastal Areas
VwerySmatrBook03.p65 2004-06-17, 17:27126
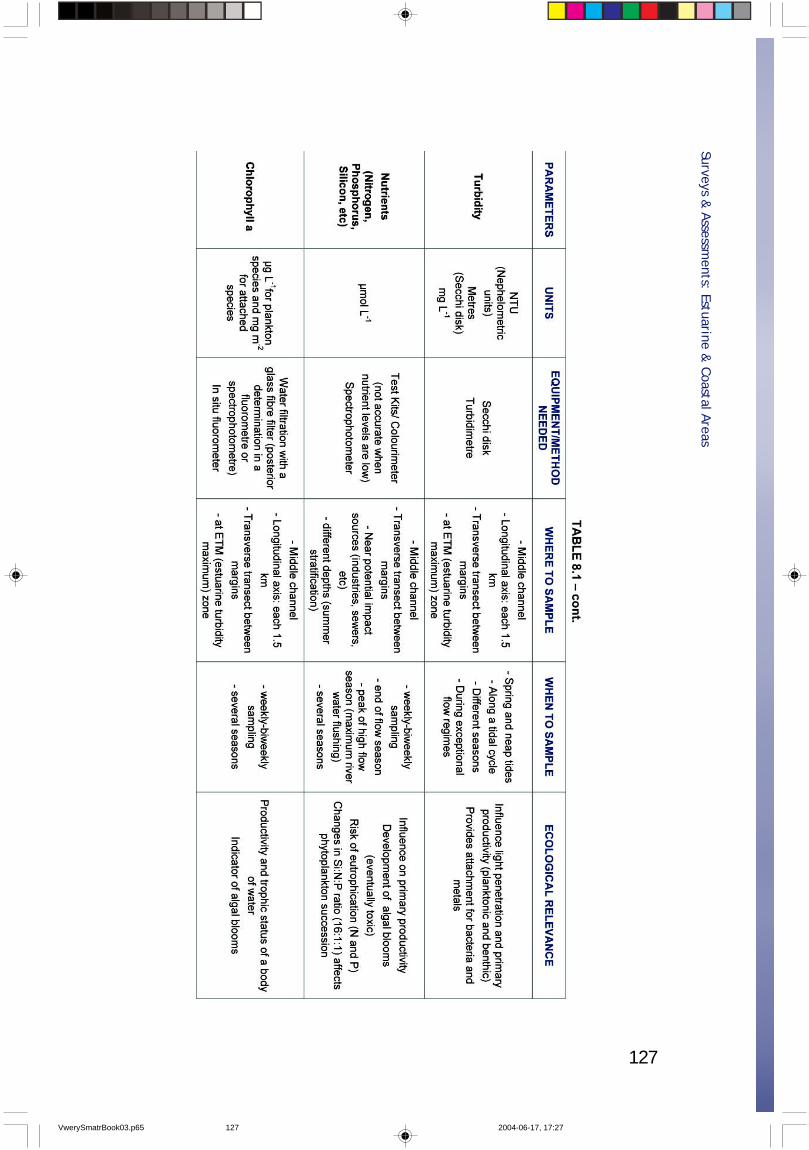
127
Surveys & Assessm
ents: Estuarine & Coastal Areas
VwerySmatrBook03.p65 2004-06-17, 17:27127
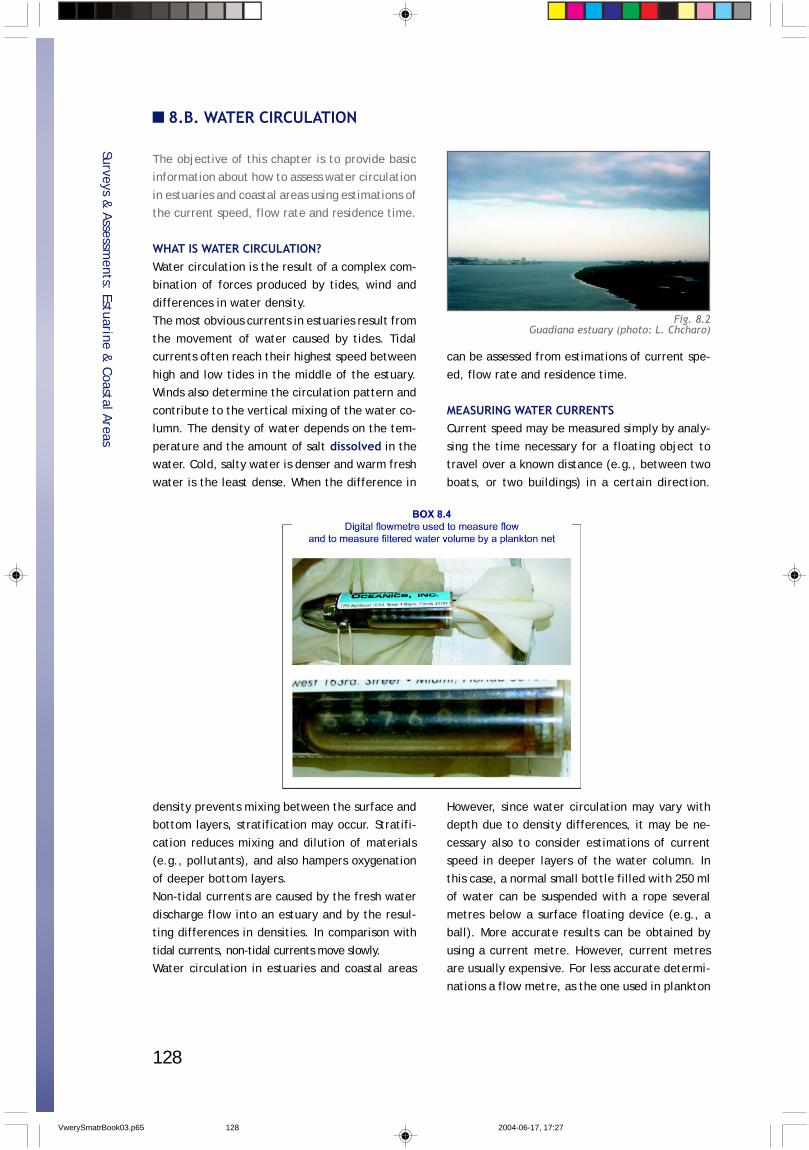
128
The objective of this chapter is to provide basicinformation about how to assess water circulation
in estuaries and coastal areas using estimations ofthe current speed, flow rate and residence time.
WHAT IS WATER CIRCULATION?Water circulation is the result of a complex com-bination of forces produced by tides, wind and
differences in water density.The most obvious currents in estuaries result from
the movement of water caused by tides. Tidalcurrents often reach their highest speed between
high and low tides in the middle of the estuary.Winds also determine the circulation pattern and
contribute to the vertical mixing of the water co-lumn. The density of water depends on the tem-
perature and the amount of salt dissolved in thewater. Cold, salty water is denser and warm fresh
water is the least dense. When the difference in
8.B. WATER CIRCULATION
density prevents mixing between the surface andbottom layers, stratification may occur. Stratifi-
cation reduces mixing and dilution of materials(e.g., pollutants), and also hampers oxygenation
of deeper bottom layers.Non-tidal currents are caused by the fresh water
discharge flow into an estuary and by the resul-ting differences in densities. In comparison with
tidal currents, non-tidal currents move slowly.Water circulation in estuaries and coastal areas
can be assessed from estimations of current spe-
ed, flow rate and residence time.
MEASURING WATER CURRENTSCurrent speed may be measured simply by analy-
sing the time necessary for a floating object totravel over a known distance (e.g., between two
boats, or two buildings) in a certain direction.
However, since water circulation may vary withdepth due to density differences, it may be ne-
cessary also to consider estimations of currentspeed in deeper layers of the water column. In
this case, a normal small bottle filled with 250 mlof water can be suspended with a rope several
metres below a surface floating device (e.g., aball). More accurate results can be obtained by
using a current metre. However, current metresare usually expensive. For less accurate determi-
nations a flow metre, as the one used in plankton
Surveys & Assessm
ents: Estuarine & Coastal Areas
Fig. 8.2Guadiana estuary (photo: L. Chcharo)
VwerySmatrBook03.p65 2004-06-17, 17:27128
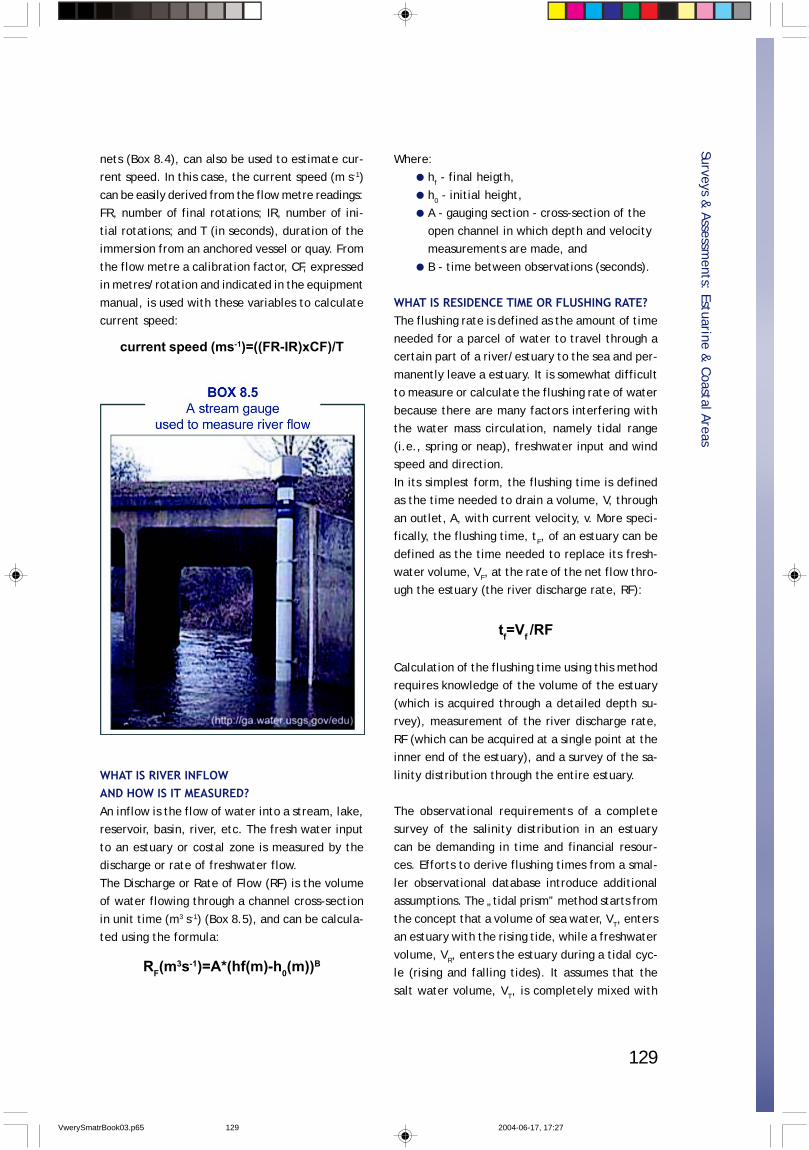
129
nets (Box 8.4), can also be used to estimate cur-rent speed. In this case, the current speed (m s-1)
can be easily derived from the flow metre readings:FR, number of final rotations; IR, number of ini-
tial rotations; and T (in seconds), duration of theimmersion from an anchored vessel or quay. From
the flow metre a calibration factor, CF, expressedin metres/rotation and indicated in the equipment
manual, is used with these variables to calculatecurrent speed:
WHAT IS RIVER INFLOWAND HOW IS IT MEASURED?An inflow is the flow of water into a stream, lake,reservoir, basin, river, etc. The fresh water input
to an estuary or costal zone is measured by thedischarge or rate of freshwater flow.
The Discharge or Rate of Flow (RF) is the volumeof water flowing through a channel cross-section
in unit time (m3 s-1) (Box 8.5), and can be calcula-ted using the formula:
Where:hf - final heigth,
h0 - initial height,A - gauging section - cross-section of the
open channel in which depth and velocitymeasurements are made, and
B - time between observations (seconds).
WHAT IS RESIDENCE TIME OR FLUSHING RATE?The flushing rate is defined as the amount of time
needed for a parcel of water to travel through acertain part of a river/estuary to the sea and per-
manently leave a estuary. It is somewhat difficultto measure or calculate the flushing rate of water
because there are many factors interfering withthe water mass circulation, namely tidal range
(i.e., spring or neap), freshwater input and windspeed and direction.
In its simplest form, the flushing time is definedas the time needed to drain a volume, V, through
an outlet, A, with current velocity, v. More speci-fically, the flushing time, tF, of an estuary can be
defined as the time needed to replace its fresh-water volume, VF, at the rate of the net flow thro-ugh the estuary (the river discharge rate, RF):
Calculation of the flushing time using this methodrequires knowledge of the volume of the estuary
(which is acquired through a detailed depth su-rvey), measurement of the river discharge rate,
RF (which can be acquired at a single point at theinner end of the estuary), and a survey of the sa-
linity distribution through the entire estuary.
The observational requirements of a completesurvey of the salinity distribution in an estuary
can be demanding in time and financial resour-ces. Efforts to derive flushing times from a smal-
ler observational database introduce additionalassumptions. The „tidal prism” method starts from
the concept that a volume of sea water, VT, entersan estuary with the rising tide, while a freshwater
volume, VR, enters the estuary during a tidal cyc-le (rising and falling tides). It assumes that the
salt water volume, VT, is completely mixed with
Surveys & Assessm
ents: Estuarine & Coastal Areas
current speed (ms-1)=((FR-IR)xCF)/T
RF(m3s-1)=A*(hf(m)-h0(m))B
tf=Vf /RF
VwerySmatrBook03.p65 2004-06-17, 17:27129
130
the freshwater volume, VR, at high tide, and thatthe combined volume, VT+VR, representing the
mixture leaves the estuary during the falling tide.The salinity of the freshwater volume, VR, is zero.
If the salinity of the salt water brought in by therising tide is S0, the salinity, S*, of the mixed water
in the volume, VT + VR, is easily calculated from:
(VT+VR)S*=VTS0
and found to be:
S*=S0VT/(VT+VR)
This gives the freshwater fraction:
f*=(S0-S*)/S0=1-S*/S0
as:
f*=VR/(VT+VR)
The flushing time was previously defined as:
tF=(f*V)/RF
where:
RF- the river discharge rate or freshwater volumeper unit time.
In the tidal prism method the unit of time is thetidal period, T, so RF = VR / T. Using the result for
the freshwater fraction obtained under the as-sumptions of the tidal prism method:
tF=TV/(VT+VR)
The combined volume, VT + VR, represents the dif-
ference between high water and low water, the-refore often being called the tidal prism. It is the
only quantity (besides knowledge of the estuarinevolume) required to calculate the flushing time
with this method and can be easily obtained fromtidal gauge records.
However, the assumptions of the tidal prism me-thod are never completely met in real estuaries.
Mixing of the two volumes, VT and VR, is nevercomplete and some of the mixed water that le-
aves the estuary with the ebb tide will enter itagain with the rising tide. The flushing time deri-
ved from the tidal prism method represents theshortest possible time during which the entire fre-
shwater fraction of an estuary can be removed; inother words, it represents a lower limit for anyflushing time calculation.
Surveys & Assessm
ents: Estuarine & Coastal Areas
VwerySmatrBook03.p65 2004-06-17, 17:27130
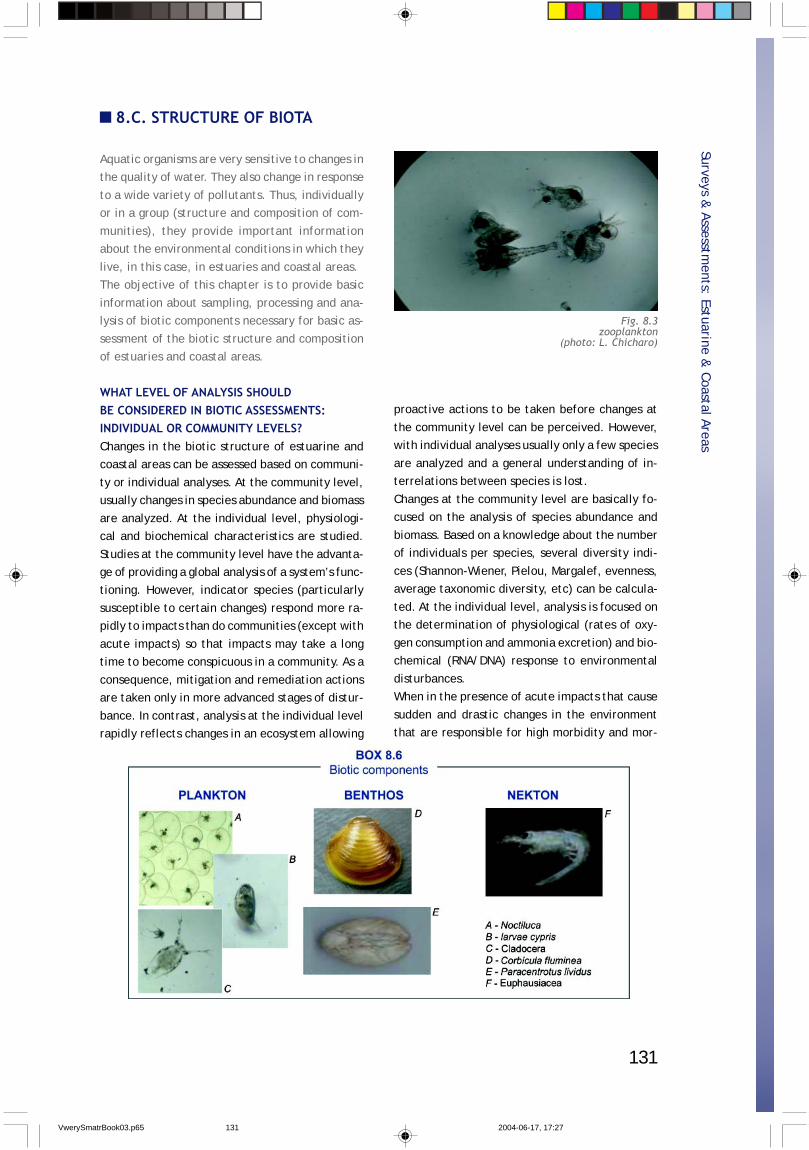
131
8.C. STRUCTURE OF BIOTA
Aquatic organisms are very sensitive to changes inthe quality of water. They also change in response
to a wide variety of pollutants. Thus, individuallyor in a group (structure and composition of com-
munities), they provide important informationabout the environmental conditions in which they
live, in this case, in estuaries and coastal areas.The objective of this chapter is to provide basic
information about sampling, processing and ana-lysis of biotic components necessary for basic as-
sessment of the biotic structure and compositionof estuaries and coastal areas.
WHAT LEVEL OF ANALYSIS SHOULDBE CONSIDERED IN BIOTIC ASSESSMENTS:INDIVIDUAL OR COMMUNITY LEVELS?Changes in the biotic structure of estuarine andcoastal areas can be assessed based on communi-
ty or individual analyses. At the community level,usually changes in species abundance and biomass
are analyzed. At the individual level, physiologi-cal and biochemical characteristics are studied.
Studies at the community level have the advanta-ge of providing a global analysis of a system’s func-tioning. However, indicator species (particularly
susceptible to certain changes) respond more ra-pidly to impacts than do communities (except with
acute impacts) so that impacts may take a longtime to become conspicuous in a community. As a
consequence, mitigation and remediation actionsare taken only in more advanced stages of distur-
bance. In contrast, analysis at the individual levelrapidly reflects changes in an ecosystem allowing
proactive actions to be taken before changes at
the community level can be perceived. However,with individual analyses usually only a few species
are analyzed and a general understanding of in-terrelations between species is lost.
Changes at the community level are basically fo-cused on the analysis of species abundance and
biomass. Based on a knowledge about the numberof individuals per species, several diversity indi-
ces (Shannon-Wiener, Pielou, Margalef, evenness,average taxonomic diversity, etc) can be calcula-
ted. At the individual level, analysis is focused onthe determination of physiological (rates of oxy-
gen consumption and ammonia excretion) and bio-chemical (RNA/DNA) response to environmental
disturbances.When in the presence of acute impacts that cause
sudden and drastic changes in the environmentthat are responsible for high morbidity and mor-
Surveys & Assesstm
ents: Estuarine & Coastal Areas
Fig. 8.3zooplankton
(photo: L. Chicharo)
VwerySmatrBook03.p65 2004-06-17, 17:27131
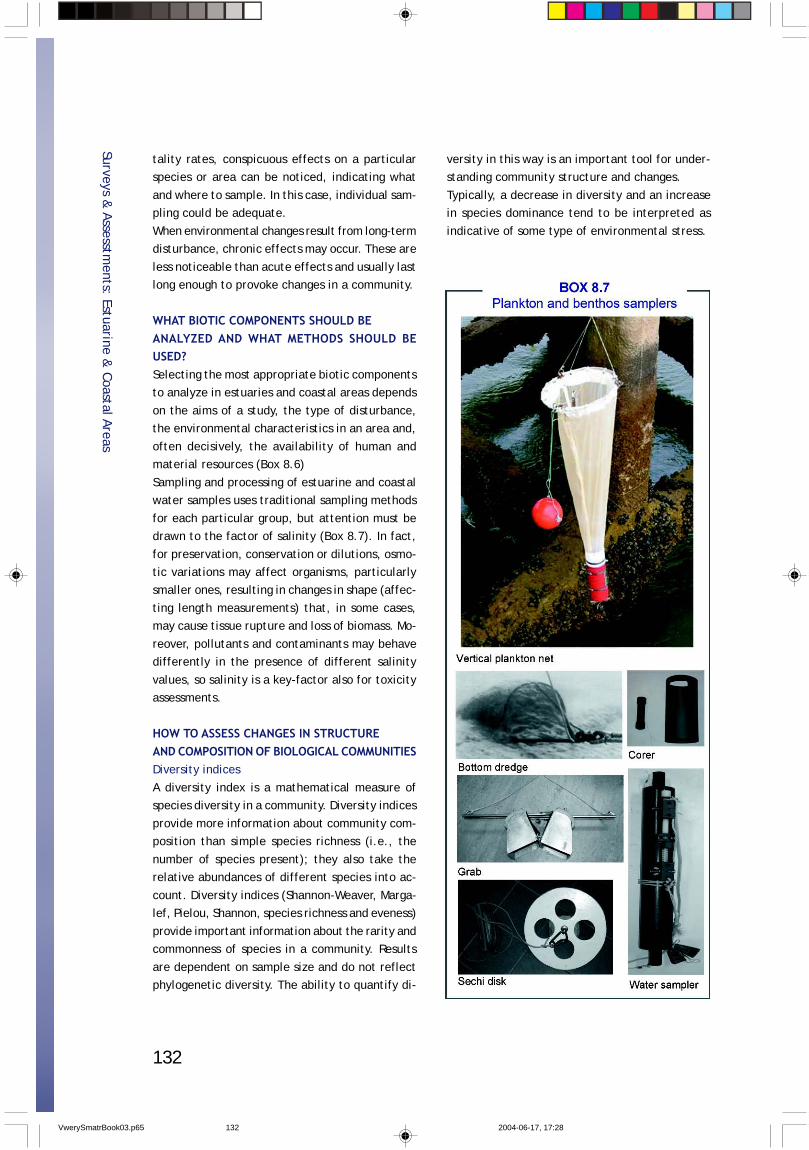
132
tality rates, conspicuous effects on a particularspecies or area can be noticed, indicating what
and where to sample. In this case, individual sam-pling could be adequate.
When environmental changes result from long-termdisturbance, chronic effects may occur. These are
less noticeable than acute effects and usually lastlong enough to provoke changes in a community.
WHAT BIOTIC COMPONENTS SHOULD BEANALYZED AND WHAT METHODS SHOULD BEUSED?Selecting the most appropriate biotic componentsto analyze in estuaries and coastal areas depends
on the aims of a study, the type of disturbance,the environmental characteristics in an area and,
often decisively, the availability of human andmaterial resources (Box 8.6)
Sampling and processing of estuarine and coastalwater samples uses traditional sampling methods
for each particular group, but attention must bedrawn to the factor of salinity (Box 8.7). In fact,
for preservation, conservation or dilutions, osmo-tic variations may affect organisms, particularlysmaller ones, resulting in changes in shape (affec-
ting length measurements) that, in some cases,may cause tissue rupture and loss of biomass. Mo-
reover, pollutants and contaminants may behavedifferently in the presence of different salinity
values, so salinity is a key-factor also for toxicityassessments.
HOW TO ASSESS CHANGES IN STRUCTUREAND COMPOSITION OF BIOLOGICAL COMMUNITIESDiversity indices
A diversity index is a mathematical measure ofspecies diversity in a community. Diversity indices
provide more information about community com-position than simple species richness (i.e., the
number of species present); they also take therelative abundances of different species into ac-
count. Diversity indices (Shannon-Weaver, Marga-lef, Pielou, Shannon, species richness and eveness)
provide important information about the rarity andcommonness of species in a community. Results
are dependent on sample size and do not reflectphylogenetic diversity. The ability to quantify di-
versity in this way is an important tool for under-standing community structure and changes.
Typically, a decrease in diversity and an increasein species dominance tend to be interpreted as
indicative of some type of environmental stress.
Surveys & Assesstm
ents: Estuarine & Coastal Areas
VwerySmatrBook03.p65 2004-06-17, 17:28132
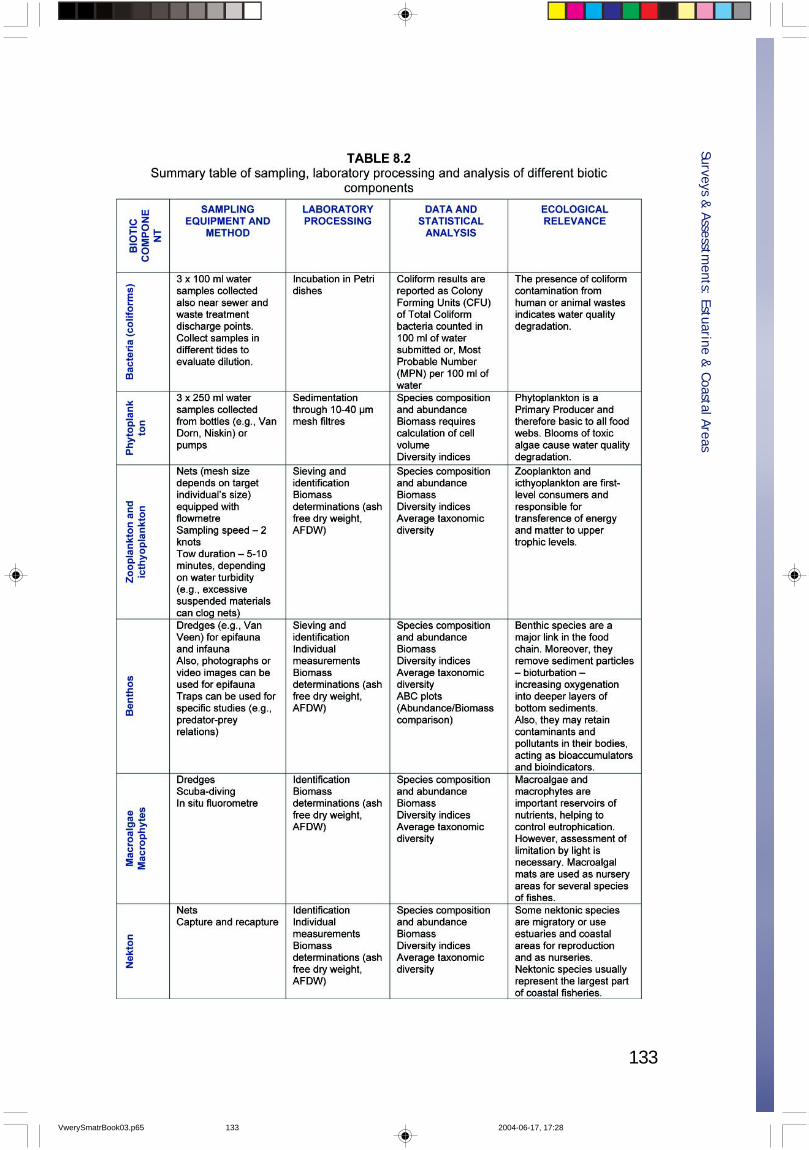
133
Surveys & Assesstm
ents: Estuarine & Coastal Areas
VwerySmatrBook03.p65 2004-06-17, 17:28133
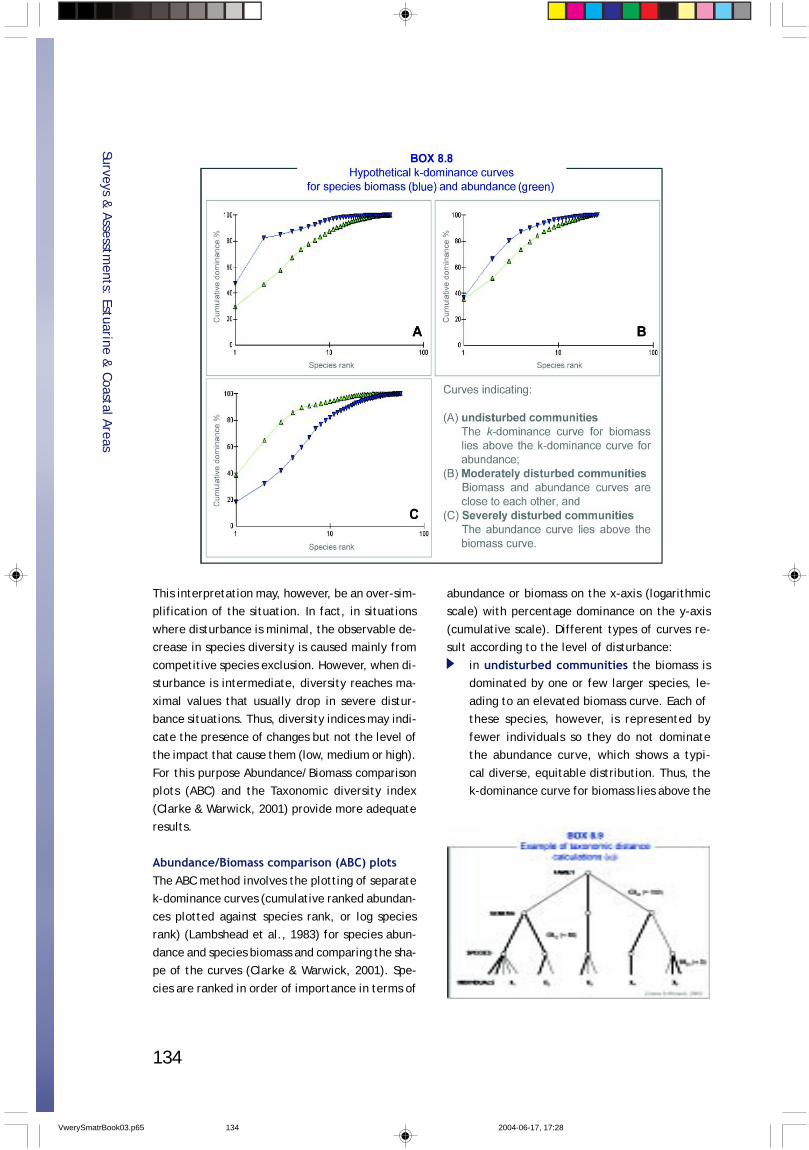
134
This interpretation may, however, be an over-sim-plification of the situation. In fact, in situations
where disturbance is minimal, the observable de-crease in species diversity is caused mainly from
competitive species exclusion. However, when di-sturbance is intermediate, diversity reaches ma-
ximal values that usually drop in severe distur-bance situations. Thus, diversity indices may indi-
cate the presence of changes but not the level ofthe impact that cause them (low, medium or high).
For this purpose Abundance/Biomass comparisonplots (ABC) and the Taxonomic diversity index
(Clarke & Warwick, 2001) provide more adequateresults.
Abundance/Biomass comparison (ABC) plotsThe ABC method involves the plotting of separatek-dominance curves (cumulative ranked abundan-
ces plotted against species rank, or log speciesrank) (Lambshead et al., 1983) for species abun-
dance and species biomass and comparing the sha-pe of the curves (Clarke & Warwick, 2001). Spe-
cies are ranked in order of importance in terms of
abundance or biomass on the x-axis (logarithmicscale) with percentage dominance on the y-axis
(cumulative scale). Different types of curves re-sult according to the level of disturbance:
in undisturbed communities the biomass isdominated by one or few larger species, le-
ading to an elevated biomass curve. Each ofthese species, however, is represented by
fewer individuals so they do not dominatethe abundance curve, which shows a typi-
cal diverse, equitable distribution. Thus, thek-dominance curve for biomass lies above the
Surveys & Assesstm
ents: Estuarine & Coastal Areas
VwerySmatrBook03.p65 2004-06-17, 17:28134
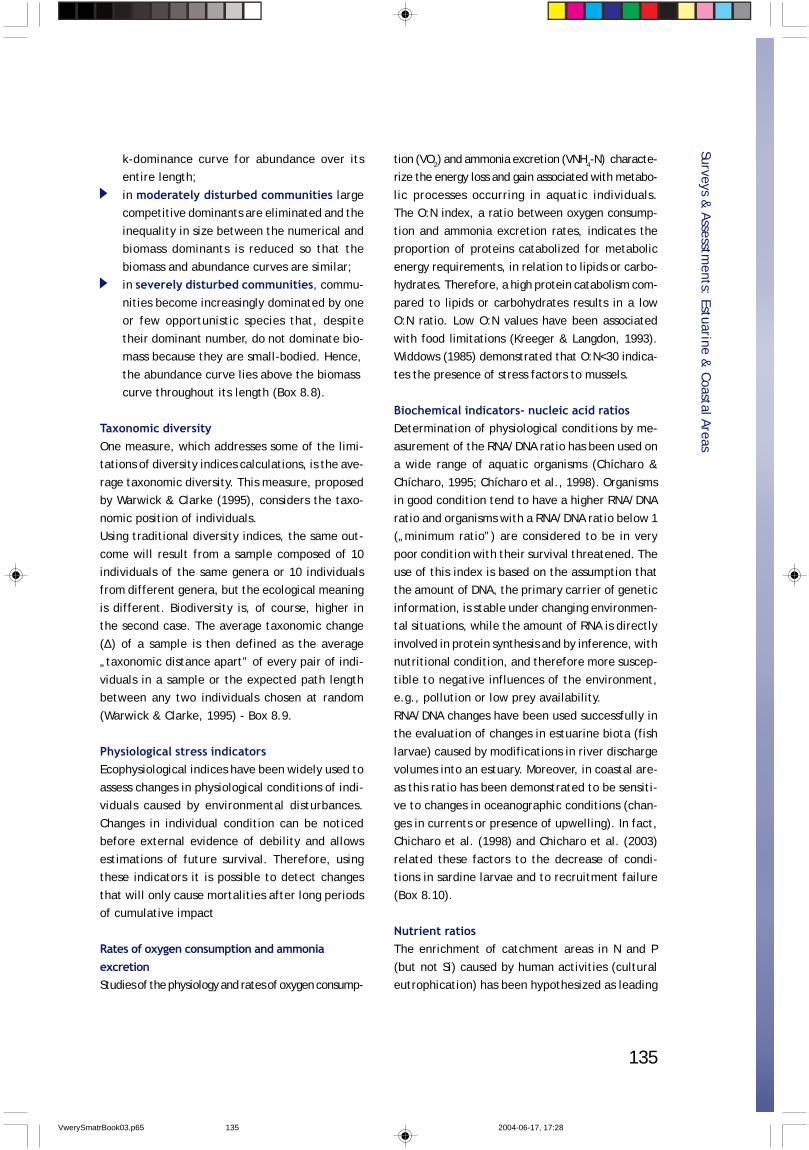
135
k-dominance curve for abundance over itsentire length;
in moderately disturbed communities largecompetitive dominants are eliminated and the
inequality in size between the numerical andbiomass dominants is reduced so that the
biomass and abundance curves are similar;in severely disturbed communities, commu-
nities become increasingly dominated by oneor few opportunistic species that, despite
their dominant number, do not dominate bio-mass because they are small-bodied. Hence,
the abundance curve lies above the biomasscurve throughout its length (Box 8.8).
Taxonomic diversityOne measure, which addresses some of the limi-tations of diversity indices calculations, is the ave-
rage taxonomic diversity. This measure, proposedby Warwick & Clarke (1995), considers the taxo-
nomic position of individuals.Using traditional diversity indices, the same out-
come will result from a sample composed of 10individuals of the same genera or 10 individualsfrom different genera, but the ecological meaning
is different. Biodiversity is, of course, higher inthe second case. The average taxonomic change
(∆) of a sample is then defined as the average„taxonomic distance apart” of every pair of indi-
viduals in a sample or the expected path lengthbetween any two individuals chosen at random
(Warwick & Clarke, 1995) - Box 8.9.
Physiological stress indicatorsEcophysiological indices have been widely used to
assess changes in physiological conditions of indi-viduals caused by environmental disturbances.
Changes in individual condition can be noticedbefore external evidence of debility and allows
estimations of future survival. Therefore, usingthese indicators it is possible to detect changes
that will only cause mortalities after long periodsof cumulative impact
Rates of oxygen consumption and ammoniaexcretionStudies of the physiology and rates of oxygen consump-
tion (VO2) and ammonia excretion (VNH4-N) characte-rize the energy loss and gain associated with metabo-
lic processes occurring in aquatic individuals.The O:N index, a ratio between oxygen consump-
tion and ammonia excretion rates, indicates theproportion of proteins catabolized for metabolic
energy requirements, in relation to lipids or carbo-hydrates. Therefore, a high protein catabolism com-
pared to lipids or carbohydrates results in a lowO:N ratio. Low O:N values have been associated
with food limitations (Kreeger & Langdon, 1993).Widdows (1985) demonstrated that O:N<30 indica-
tes the presence of stress factors to mussels.
Biochemical indicators- nucleic acid ratiosDetermination of physiological conditions by me-
asurement of the RNA/DNA ratio has been used ona wide range of aquatic organisms (Chícharo &
Chícharo, 1995; Chícharo et al., 1998). Organismsin good condition tend to have a higher RNA/DNA
ratio and organisms with a RNA/DNA ratio below 1(„minimum ratio”) are considered to be in very
poor condition with their survival threatened. Theuse of this index is based on the assumption thatthe amount of DNA, the primary carrier of genetic
information, is stable under changing environmen-tal situations, while the amount of RNA is directly
involved in protein synthesis and by inference, withnutritional condition, and therefore more suscep-
tible to negative influences of the environment,e.g., pollution or low prey availability.
RNA/DNA changes have been used successfully inthe evaluation of changes in estuarine biota (fish
larvae) caused by modifications in river dischargevolumes into an estuary. Moreover, in coastal are-
as this ratio has been demonstrated to be sensiti-ve to changes in oceanographic conditions (chan-
ges in currents or presence of upwelling). In fact,Chicharo et al. (1998) and Chicharo et al. (2003)
related these factors to the decrease of condi-tions in sardine larvae and to recruitment failure
(Box 8.10).
Nutrient ratiosThe enrichment of catchment areas in N and P
(but not Si) caused by human activities (culturaleutrophication) has been hypothesized as leading
Surveys & Assesstm
ents: Estuarine & Coastal Areas
VwerySmatrBook03.p65 2004-06-17, 17:28135
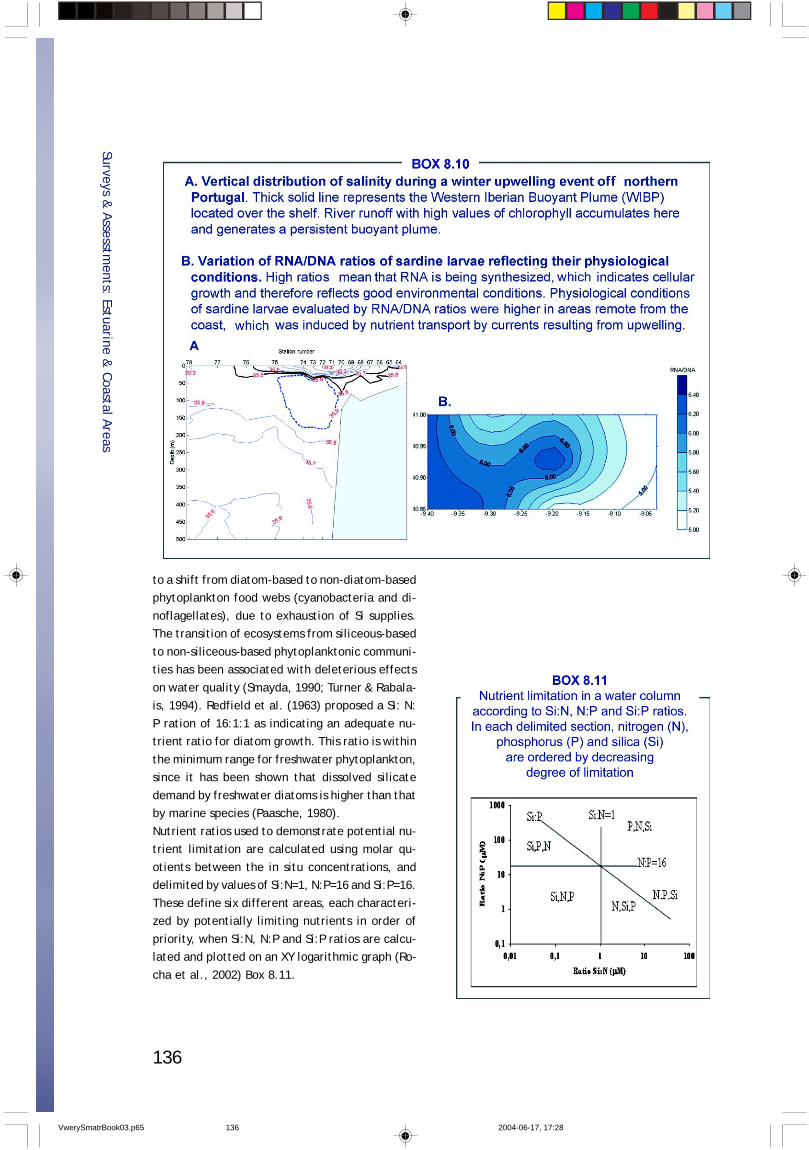
136
to a shift from diatom-based to non-diatom-basedphytoplankton food webs (cyanobacteria and di-
noflagellates), due to exhaustion of Si supplies.The transition of ecosystems from siliceous-based
to non-siliceous-based phytoplanktonic communi-ties has been associated with deleterious effects
on water quality (Smayda, 1990; Turner & Rabala-is, 1994). Redfield et al. (1963) proposed a Si: N:
P ration of 16:1:1 as indicating an adequate nu-trient ratio for diatom growth. This ratio is within
the minimum range for freshwater phytoplankton,since it has been shown that dissolved silicate
demand by freshwater diatoms is higher than thatby marine species (Paasche, 1980).
Nutrient ratios used to demonstrate potential nu-trient limitation are calculated using molar qu-
otients between the in situ concentrations, anddelimited by values of Si:N=1, N:P=16 and Si:P=16.
These define six different areas, each characteri-zed by potentially limiting nutrients in order of
priority, when Si:N, N:P and Si:P ratios are calcu-lated and plotted on an XY logarithmic graph (Ro-
cha et al., 2002) Box 8.11.
Surveys & Assesstm
ents: Estuarine & Coastal Areas
VwerySmatrBook03.p65 2004-06-17, 17:28136

137
VwerySmatrBook03.p65 2004-06-17, 17:36137

138
VwerySmatrBook03.p65 2004-06-17, 17:36138
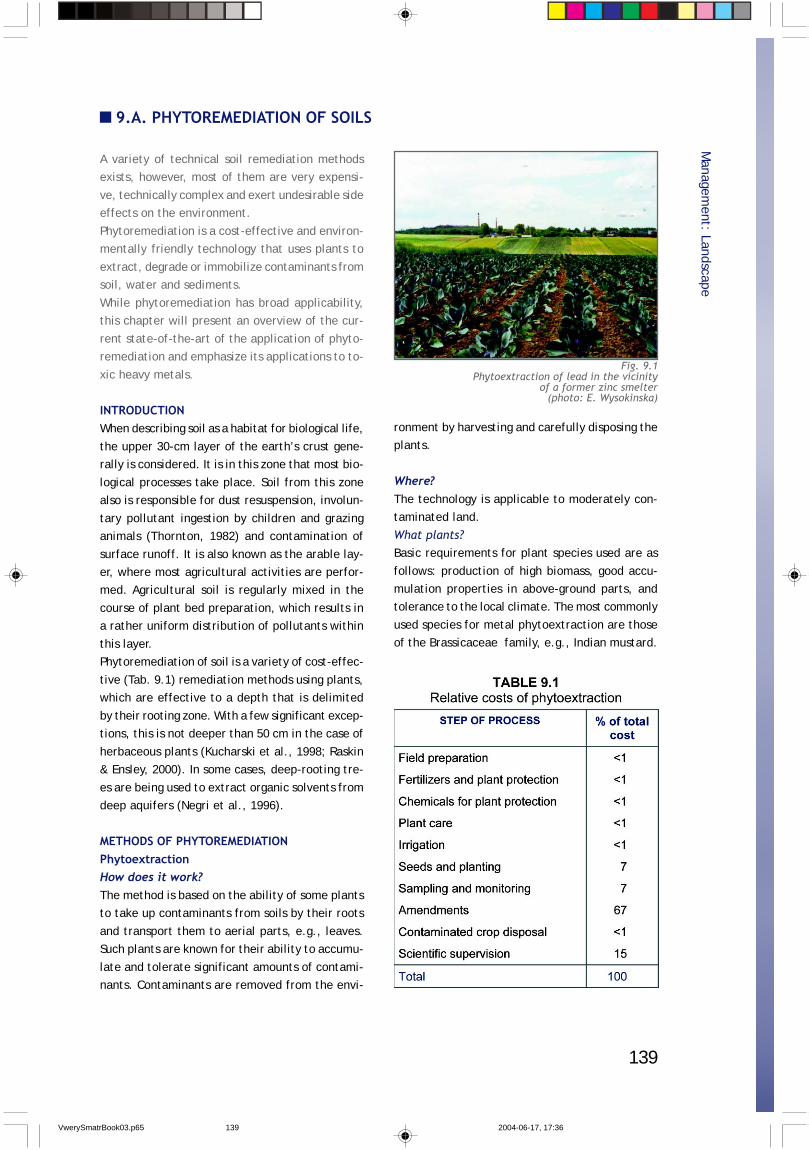
139
A variety of technical soil remediation methodsexists, however, most of them are very expensi-
ve, technically complex and exert undesirable sideeffects on the environment.
Phytoremediation is a cost-effective and environ-mentally friendly technology that uses plants to
extract, degrade or immobilize contaminants fromsoil, water and sediments.
While phytoremediation has broad applicability,this chapter will present an overview of the cur-
rent state-of-the-art of the application of phyto-remediation and emphasize its applications to to-
xic heavy metals.
INTRODUCTIONWhen describing soil as a habitat for biological life,
the upper 30-cm layer of the earth’s crust gene-rally is considered. It is in this zone that most bio-
logical processes take place. Soil from this zonealso is responsible for dust resuspension, involun-
tary pollutant ingestion by children and grazinganimals (Thornton, 1982) and contamination of
surface runoff. It is also known as the arable lay-er, where most agricultural activities are perfor-med. Agricultural soil is regularly mixed in the
course of plant bed preparation, which results ina rather uniform distribution of pollutants within
this layer.Phytoremediation of soil is a variety of cost-effec-
tive (Tab. 9.1) remediation methods using plants,which are effective to a depth that is delimited
by their rooting zone. With a few significant excep-tions, this is not deeper than 50 cm in the case of
herbaceous plants (Kucharski et al., 1998; Raskin& Ensley, 2000). In some cases, deep-rooting tre-
es are being used to extract organic solvents fromdeep aquifers (Negri et al., 1996).
METHODS OF PHYTOREMEDIATIONPhytoextractionHow does it work?The method is based on the ability of some plantsto take up contaminants from soils by their roots
and transport them to aerial parts, e.g., leaves.Such plants are known for their ability to accumu-
late and tolerate significant amounts of contami-nants. Contaminants are removed from the envi-
9.A. PHYTOREMEDIATION OF SOILS
ronment by harvesting and carefully disposing theplants.
Where?The technology is applicable to moderately con-taminated land.
What plants?Basic requirements for plant species used are as
follows: production of high biomass, good accu-mulation properties in above-ground parts, andtolerance to the local climate. The most commonly
used species for metal phytoextraction are thoseof the Brassicaceae family, e.g., Indian mustard.
Managem
ent: Landscape
Fig. 9.1Phytoextraction of lead in the vicinity
of a former zinc smelter(photo: E. Wysokinska)
VwerySmatrBook03.p65 2004-06-17, 17:36139
140
How to apply?The efficiency of this technology depends on bio-
mass production and contaminant concentration.These factors in turn are dependent upon com-
plex interactions among plant physiology, soil che-mistry, hydrogeology and climate. The effective-
ness of phytoextraction is often enhanced thro-ugh the use of soil and plant amendments. The
role of soil amendments is to facilitate the uptakeof metals from soils to plants. Usually various che-
lators are used for that purpose (EDTA, DTPA, HED-TA) followed by organic (citric or
acetic) acids.
PhytostabilizationHow does it work?This method converts soil contaminants into in-ert, immobile elements using metal tolerating
plants. The mechanism may include absorption,adsorption, accumulation, precipitation or physi-
cal stabilization of contaminants in the root zone.Plants with well-developed root systems prevent
contaminant migration via wind and runoff thro-ugh the soil profile. Plant root biochemical activi-ties can change soil pH as well as convert metals
from a soluble to insoluble form.Where?Phytostabilization may be applicable to large are-as of contaminated soil, sludge and sediments that
are not amenable to alternative forms of treat-ment; and for remediation of heavily polluted si-
tes.What plants?The best are carefully selected indigenous spe-cies of grass and shrubs, which develop a dense
and strong root system. Good results were achie-ved using, e.g., Deschampsia caespitosa, in the
case of heavily metal-polluted soils.How to apply?Phytostabilization of heavily polluted sites may beachieved using a combination of chemical and bio-
logical methods.the upper layer of soil is treated first with
chemicals (e.g., lime, commercial fertilizersas needed) to adjust soil pH, fertilize, and
to transform metal compounds into non-soluble forms;
the next step is to develop a robust plantcover to reinforce the soil surface, to main-
tain the desired soil chemical conditions andto minimize soil transport processes (e.g.,
erosion and wind transport) (Vangronsveldet al., 1995, Kucharski & Nowosielska, 2002).
RhizofiltrationThis method is applicable to surface water, wa-stewater and (extracted) ground water contami-
nated with low concentrations of contaminants.For this purpose, aquatic plants or terrestrial plants
(grown hydroponically) are used. The mechanismof rhizofiltration is based on adsorption or preci-
pitation of contaminants onto plant root surfacesor bioaccumulation in plant tissues. Contaminants
are then removed by physically removing and di-sposing of the plants (US EPA, 1997).
RhizodegradationThis method uses plants to degrade organic con-taminants in soil by microbial activity in the
rhizosphere (root zone). In this application, itis often the microbial community associatedwith the rhizosphere that is responsible for the
chemical degradation. Plant roots can affectthis process by increasing soil aeration and
changing soil moisture content. Rhizodegrada-tion is also known as plant assisted biodegra-
dation (US EPA, 1997).
PhytodegradationThis method uses plants to degrade organic con-
taminants within plant tissues by metabolic pro-cesses. It may be applicable in situations where
poor soil conditions or the concentrations of soilcontaminants preclude the actions of natural bio-
degradation (US EPA, 1997).
PhytovolatilizationThis method uses plants to volatilize or transpire
contaminants. Contaminants are transported fromwater or soil through plants to the atmosphere
(US EPA, 1997). This approach is applicable in si-tuations where reduced risks associated with at-
mospheric volatilization justify the transfer fromone environmental compartment to another.
Managem
ent: Landscape
VwerySmatrBook03.p65 2004-06-17, 17:36140
141
Land farmingThis method is a relatively simple, cost effective
method of soil clean up that is achieved throughroutine agricultural practices performed on con-
taminated land. The functional process in this caseis natural attenuation, i.e., oxidation of pollutants,
microbial decomposition in the root zone and pol-lutant destruction by UV radiation.
This approach is implemented with or without theuse of plants and uses standard agricultural ope-
rations such as plowing, harrowing, seedbed pre-paration and harvesting. The procedure is repe-
ated, exposing new layers of pollutant-contami-nated soil to aeration and solar radiation. Crops
grown in such situations are not to be consumed.This method is used for cleaning large areas of
land that are contaminated with biodegradableorganic compounds such as oil, gasoline and other
organic chemicals. The approach can be appliedeither in situ or ex situ using prepared beds. The
advantages of this technology are simplicity andcost effectiveness. (Reisinger et al., 1996).
PRACTICAL IMPLEMENTATIONOF PHYTOREMEDIATIONPhytoremediation appears to be a „natural tech-nology” - simple and uncomplicated. However,
phytoremediation is relatively new and continuesto evolve. There are some important factors that
should be observed carefully in order to achievethe expected results and to avoid disappointments:
plant species used for phytoremediation willbe different depending on the purpose;
it is desirable to use an indigenous species,one that is locally adapted and resistant to
the substances polluting the soil;optimally, the selected plant should not re-quire special care, should be tolerant to na-turally variable weather conditions and sho-
uld grow well on the type of soil to be reme-diated;
for optimal performance, regular wateringand fertilizing may be necessary; and
the use of exotic plant species, even thoseshown to be very effective elsewhere, is po-
tentially problematic. Cultivation procedures will need to be developed specifically
for the plant/environment (Kucharski etal.,1998). This developmental process can be
time consuming and expensive.
Treatability studyFull-scale phytoremediation projects are general-
ly preceded by preliminary experiments, knownas „treatability studies”, performed under a con-
trolled environment in laboratories, growth cham-bers or greenhouses. The experiments are carried
out in pots containing the contaminated soil to becleaned-up or stabilized. These studies seek to:
identify the plant species that will grow wellon the target soil, tolerate the contamina-
tion and perform appropriately in terms oftreatment;
calculate the optimal cultivation conditions(e.g., fertilizing and irrigation); and
calculate the amount of soil amendments tobe added in order to mobilize contaminants
(in the case of phytoextraction) or to immo-bilize contaminants (in the case of phytosta-
bilization).When the distribution of contaminants in the tar-get area is suspected to be non-homogenous, a
strip test for verification of phytoextraction effi-ciency in natural conditions is recommended (Sas-
Nowosielska et al., 2001).These measures are suggested to optimize the
potential for successful phytoremediation by con-sidering critical points in the decision-making pro-
cess (Box 9.1).
IMPLEMENTATION OF PHYTOEXTRACTIONAND PHYTOSTABILIZATIONConsidering the practical aim of this manual, onlyphytostabilization and phytoextraction are curren-
tly ready for widespread, full-scale application.
PhytoextractionPhytoextraction will be most applicable in largeareas that are slightly above regulatory limits.Once it has been shown to be practical by treata-
bility tests, a number of field-scale factors needto be considered including:
site characterization;seedbed preparation;
Managem
ent: Landscape
VwerySmatrBook03.p65 2004-06-17, 17:36141
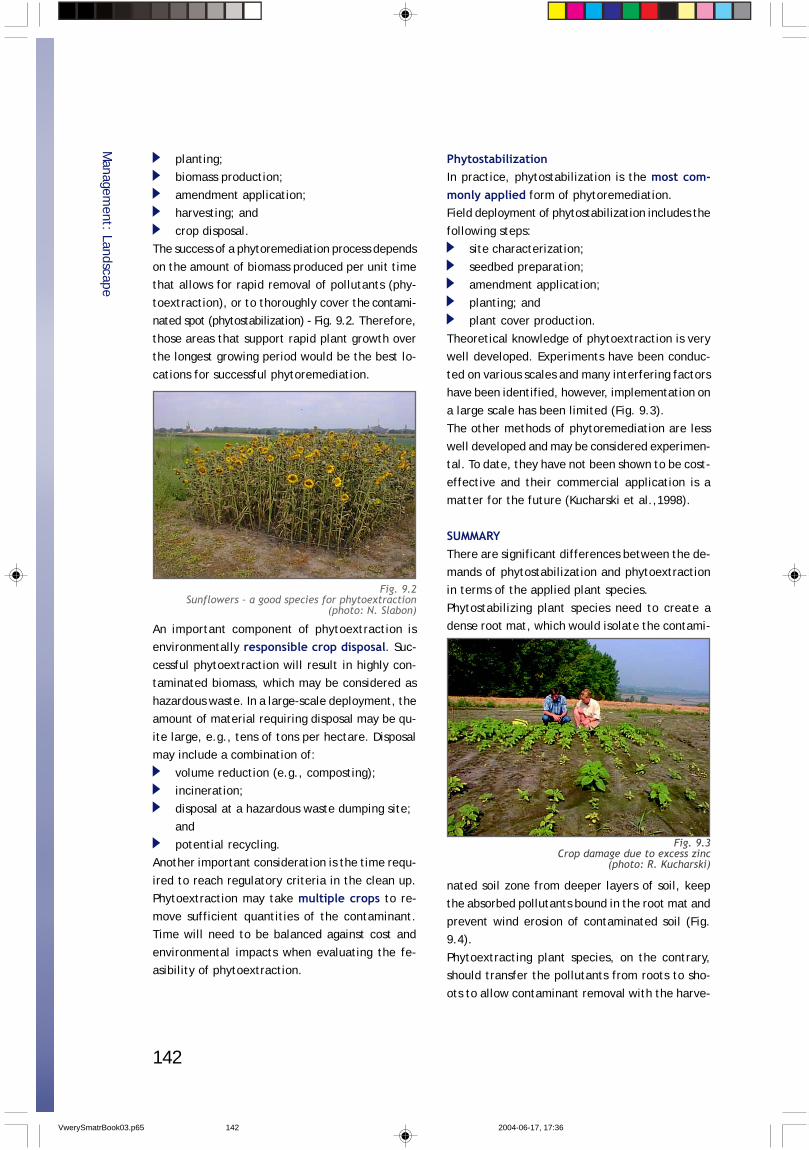
142
planting;biomass production;
amendment application;harvesting; and
crop disposal.The success of a phytoremediation process depends
on the amount of biomass produced per unit timethat allows for rapid removal of pollutants (phy-
toextraction), or to thoroughly cover the contami-nated spot (phytostabilization) - Fig. 9.2. Therefore,
those areas that support rapid plant growth overthe longest growing period would be the best lo-
cations for successful phytoremediation.
An important component of phytoextraction isenvironmentally responsible crop disposal. Suc-
cessful phytoextraction will result in highly con-taminated biomass, which may be considered as
hazardous waste. In a large-scale deployment, theamount of material requiring disposal may be qu-
ite large, e.g., tens of tons per hectare. Disposalmay include a combination of:
volume reduction (e.g., composting);incineration;
disposal at a hazardous waste dumping site;and
potential recycling.Another important consideration is the time requ-
ired to reach regulatory criteria in the clean up.Phytoextraction may take multiple crops to re-
move sufficient quantities of the contaminant.Time will need to be balanced against cost and
environmental impacts when evaluating the fe-asibility of phytoextraction.
PhytostabilizationIn practice, phytostabilization is the most com-monly applied form of phytoremediation.Field deployment of phytostabilization includes the
following steps:site characterization;
seedbed preparation;amendment application;
planting; andplant cover production.
Theoretical knowledge of phytoextraction is verywell developed. Experiments have been conduc-
ted on various scales and many interfering factorshave been identified, however, implementation on
a large scale has been limited (Fig. 9.3).The other methods of phytoremediation are less
well developed and may be considered experimen-tal. To date, they have not been shown to be cost-
effective and their commercial application is amatter for the future (Kucharski et al.,1998).
SUMMARYThere are significant differences between the de-mands of phytostabilization and phytoextractionin terms of the applied plant species.
Phytostabilizing plant species need to create adense root mat, which would isolate the contami-
nated soil zone from deeper layers of soil, keepthe absorbed pollutants bound in the root mat and
prevent wind erosion of contaminated soil (Fig.9.4).
Phytoextracting plant species, on the contrary,should transfer the pollutants from roots to sho-
ots to allow contaminant removal with the harve-
Managem
ent: Landscape
Fig. 9.2Sunflowers – a good species for phytoextraction
(photo: N. Slabon)
Fig. 9.3Crop damage due to excess zinc
(photo: R. Kucharski)
VwerySmatrBook03.p65 2004-06-17, 17:36142
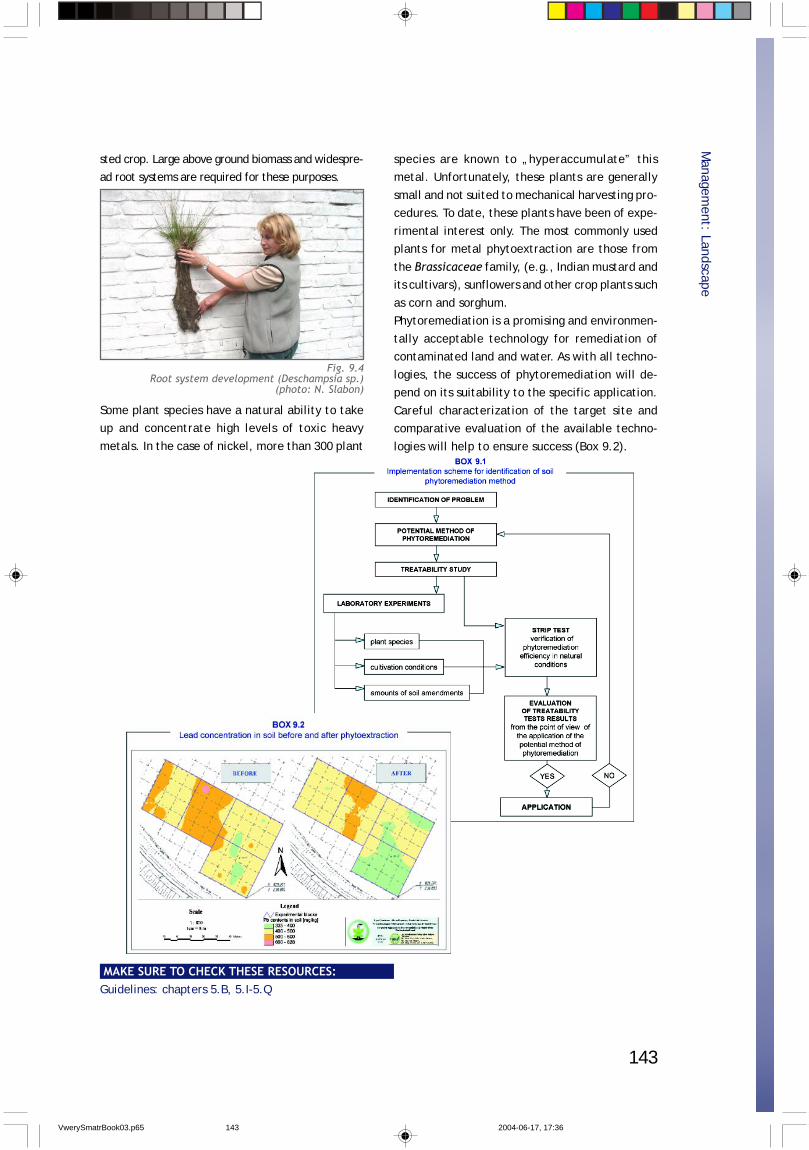
143
sted crop. Large above ground biomass and widespre-ad root systems are required for these purposes.
Some plant species have a natural ability to takeup and concentrate high levels of toxic heavy
metals. In the case of nickel, more than 300 plant
species are known to „hyperaccumulate” thismetal. Unfortunately, these plants are generally
small and not suited to mechanical harvesting pro-cedures. To date, these plants have been of expe-
rimental interest only. The most commonly usedplants for metal phytoextraction are those from
the Brassicaceae family, (e.g., Indian mustard andits cultivars), sunflowers and other crop plants such
as corn and sorghum.Phytoremediation is a promising and environmen-
tally acceptable technology for remediation ofcontaminated land and water. As with all techno-
logies, the success of phytoremediation will de-pend on its suitability to the specific application.
Careful characterization of the target site andcomparative evaluation of the available techno-
logies will help to ensure success (Box 9.2).
Managem
ent: Landscape
Fig. 9.4Root system development (Deschampsia sp.)
(photo: N. Slabon)
MAKE SURE TO CHECK THESE RESOURCES:Guidelines: chapters 5.B, 5.I-5.Q
VwerySmatrBook03.p65 2004-06-17, 17:36143
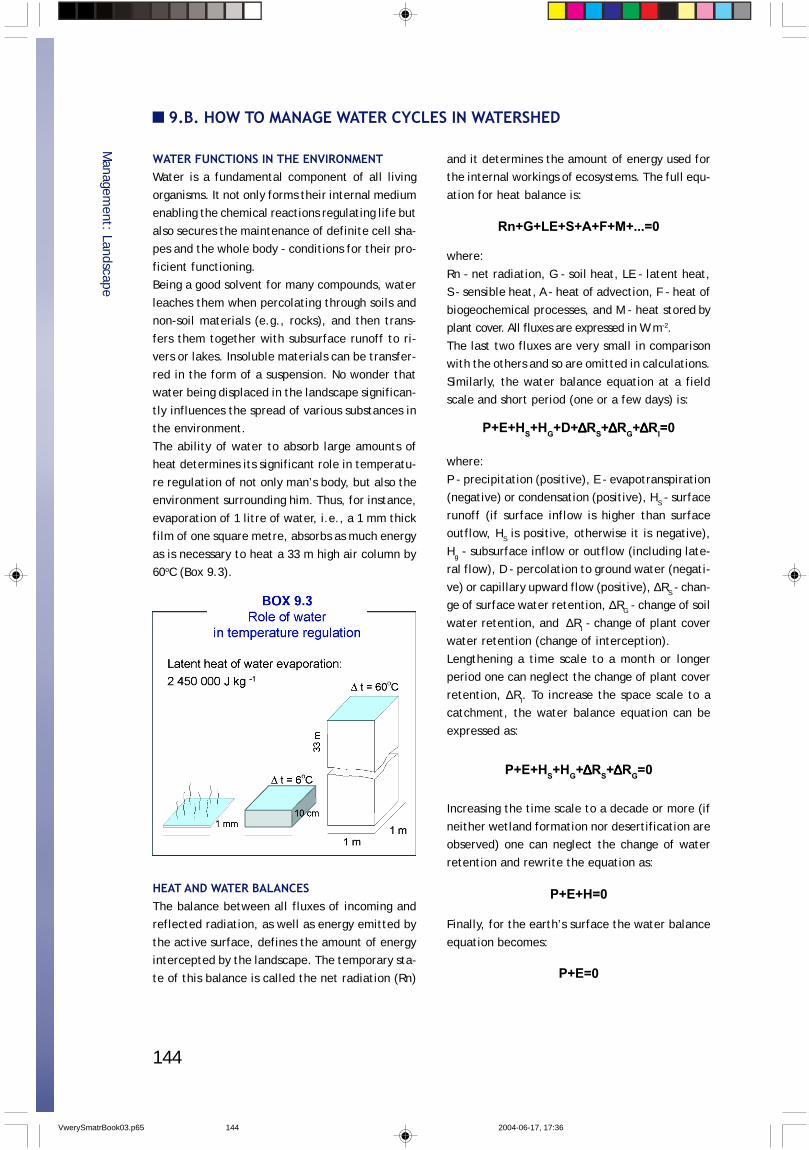
144
9.B. HOW TO MANAGE WATER CYCLES IN WATERSHED
WATER FUNCTIONS IN THE ENVIRONMENTWater is a fundamental component of all living
organisms. It not only forms their internal mediumenabling the chemical reactions regulating life but
also secures the maintenance of definite cell sha-pes and the whole body - conditions for their pro-
ficient functioning.Being a good solvent for many compounds, water
leaches them when percolating through soils andnon-soil materials (e.g., rocks), and then trans-
fers them together with subsurface runoff to ri-vers or lakes. Insoluble materials can be transfer-
red in the form of a suspension. No wonder thatwater being displaced in the landscape significan-
tly influences the spread of various substances inthe environment.
The ability of water to absorb large amounts ofheat determines its significant role in temperatu-
re regulation of not only man’s body, but also theenvironment surrounding him. Thus, for instance,
evaporation of 1 litre of water, i.e., a 1 mm thickfilm of one square metre, absorbs as much energy
as is necessary to heat a 33 m high air column by60oC (Box 9.3).
HEAT AND WATER BALANCESThe balance between all fluxes of incoming andreflected radiation, as well as energy emitted by
the active surface, defines the amount of energyintercepted by the landscape. The temporary sta-
te of this balance is called the net radiation (Rn)
and it determines the amount of energy used forthe internal workings of ecosystems. The full equ-
ation for heat balance is:
where:
Rn - net radiation, G - soil heat, LE - latent heat,S - sensible heat, A - heat of advection, F - heat of
biogeochemical processes, and M - heat stored byplant cover. All fluxes are expressed in W m-2.
The last two fluxes are very small in comparisonwith the others and so are omitted in calculations.
Similarly, the water balance equation at a fieldscale and short period (one or a few days) is:
where:
P - precipitation (positive), E - evapotranspiration(negative) or condensation (positive), HS - surface
runoff (if surface inflow is higher than surfaceoutflow, HS is positive, otherwise it is negative),
Hg - subsurface inflow or outflow (including late-ral flow), D - percolation to ground water (negati-
ve) or capillary upward flow (positive), ∆RS - chan-ge of surface water retention, ∆RG - change of soil
water retention, and ∆RI - change of plant coverwater retention (change of interception).
Lengthening a time scale to a month or longerperiod one can neglect the change of plant cover
retention, ∆RI. To increase the space scale to acatchment, the water balance equation can be
expressed as:
Increasing the time scale to a decade or more (if
neither wetland formation nor desertification areobserved) one can neglect the change of water
retention and rewrite the equation as:
Finally, for the earth’s surface the water balance
equation becomes:
Managem
ent: Landscape
Rn+G+LE+S+A+F+M+...=0
P+E+HS+HG+D+∆∆∆∆∆RS+∆∆∆∆∆RG+∆∆∆∆∆RI=0
P+E+HS+HG+∆∆∆∆∆RS+∆∆∆∆∆RG=0
P+E+H=0
P+E=0
VwerySmatrBook03.p65 2004-06-17, 17:36144
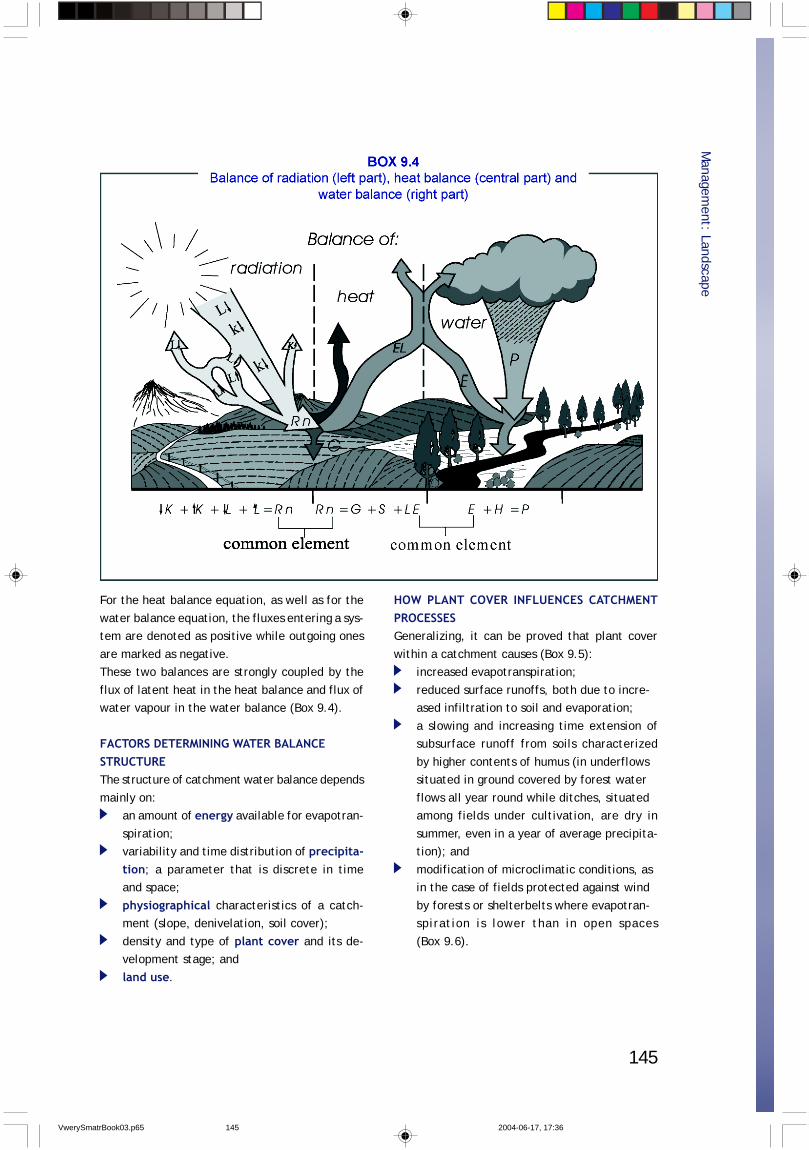
145
For the heat balance equation, as well as for the
water balance equation, the fluxes entering a sys-tem are denoted as positive while outgoing ones
are marked as negative.These two balances are strongly coupled by the
flux of latent heat in the heat balance and flux ofwater vapour in the water balance (Box 9.4).
FACTORS DETERMINING WATER BALANCESTRUCTUREThe structure of catchment water balance depends
mainly on:an amount of energy available for evapotran-
spiration;variability and time distribution of precipita-tion; a parameter that is discrete in timeand space;
physiographical characteristics of a catch-ment (slope, denivelation, soil cover);
density and type of plant cover and its de-velopment stage; and
land use.
HOW PLANT COVER INFLUENCES CATCHMENTPROCESSESGeneralizing, it can be proved that plant cover
within a catchment causes (Box 9.5):increased evapotranspiration;
reduced surface runoffs, both due to incre-ased infiltration to soil and evaporation;
a slowing and increasing time extension ofsubsurface runoff from soils characterized
by higher contents of humus (in underflowssituated in ground covered by forest water
flows all year round while ditches, situatedamong fields under cultivation, are dry in
summer, even in a year of average precipita-tion); and
modification of microclimatic conditions, asin the case of fields protected against wind
by forests or shelterbelts where evapotran-spiration is lower than in open spaces
(Box 9.6).
Managem
ent: Landscape
VwerySmatrBook03.p65 2004-06-17, 17:36145
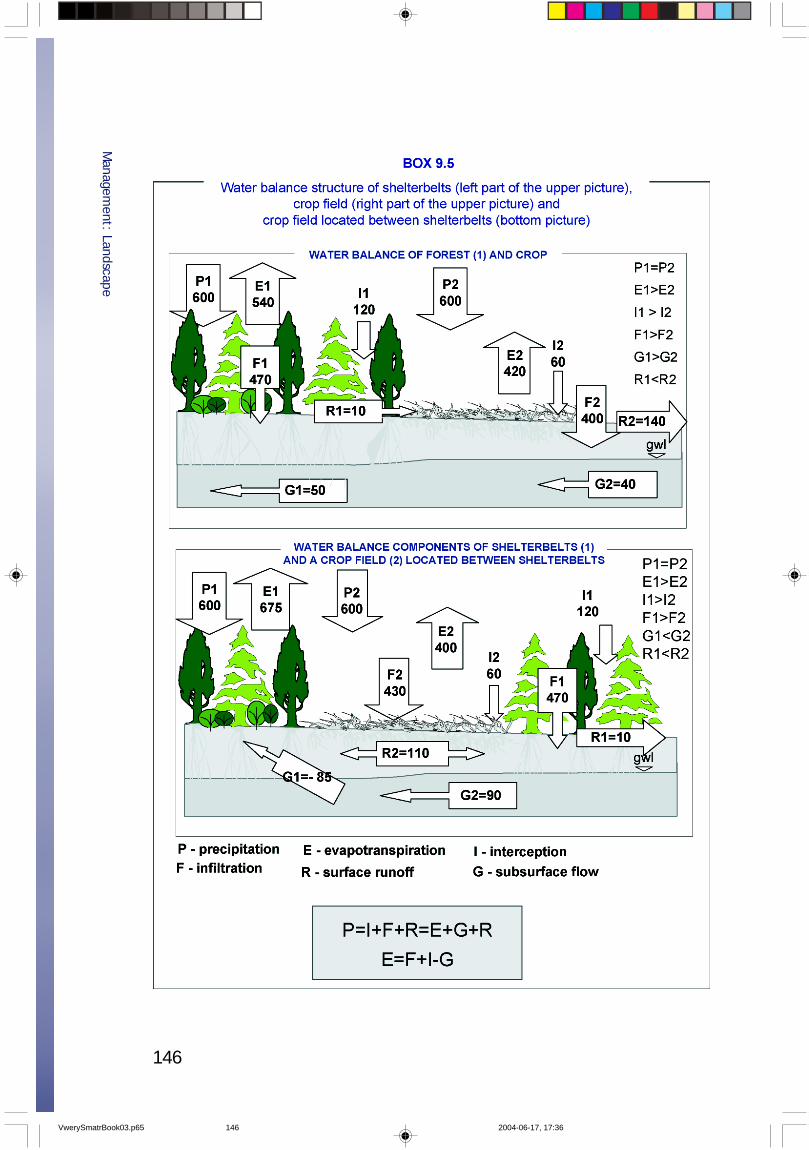
146
Managem
ent: Landscape
VwerySmatrBook03.p65 2004-06-17, 17:36146
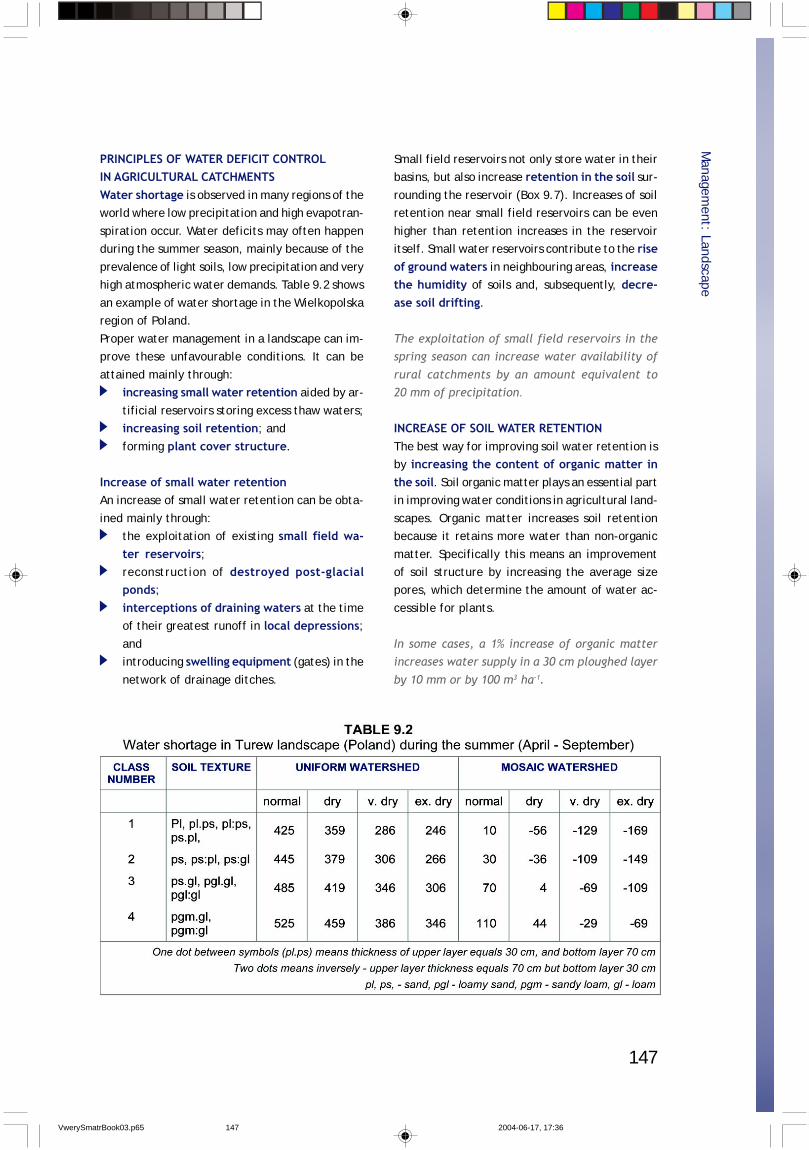
147
PRINCIPLES OF WATER DEFICIT CONTROLIN AGRICULTURAL CATCHMENTSWater shortage is observed in many regions of theworld where low precipitation and high evapotran-
spiration occur. Water deficits may often happenduring the summer season, mainly because of the
prevalence of light soils, low precipitation and veryhigh atmospheric water demands. Table 9.2 shows
an example of water shortage in the Wielkopolskaregion of Poland.
Proper water management in a landscape can im-prove these unfavourable conditions. It can be
attained mainly through:increasing small water retention aided by ar-
tificial reservoirs storing excess thaw waters;increasing soil retention; and
forming plant cover structure.
Increase of small water retentionAn increase of small water retention can be obta-
ined mainly through:the exploitation of existing small field wa-ter reservoirs;reconstruction of destroyed post-glacialponds;interceptions of draining waters at the timeof their greatest runoff in local depressions;andintroducing swelling equipment (gates) in the
network of drainage ditches.
Managem
ent: Landscape
Small field reservoirs not only store water in theirbasins, but also increase retention in the soil sur-
rounding the reservoir (Box 9.7). Increases of soilretention near small field reservoirs can be even
higher than retention increases in the reservoiritself. Small water reservoirs contribute to the riseof ground waters in neighbouring areas, increasethe humidity of soils and, subsequently, decre-ase soil drifting.
The exploitation of small field reservoirs in thespring season can increase water availability of
rural catchments by an amount equivalent to20 mm of precipitation.
INCREASE OF SOIL WATER RETENTIONThe best way for improving soil water retention isby increasing the content of organic matter inthe soil. Soil organic matter plays an essential partin improving water conditions in agricultural land-
scapes. Organic matter increases soil retentionbecause it retains more water than non-organic
matter. Specifically this means an improvementof soil structure by increasing the average sizepores, which determine the amount of water ac-
cessible for plants.
In some cases, a 1% increase of organic matterincreases water supply in a 30 cm ploughed layer
by 10 mm or by 100 m3 ha-1.
VwerySmatrBook03.p65 2004-06-17, 17:36147
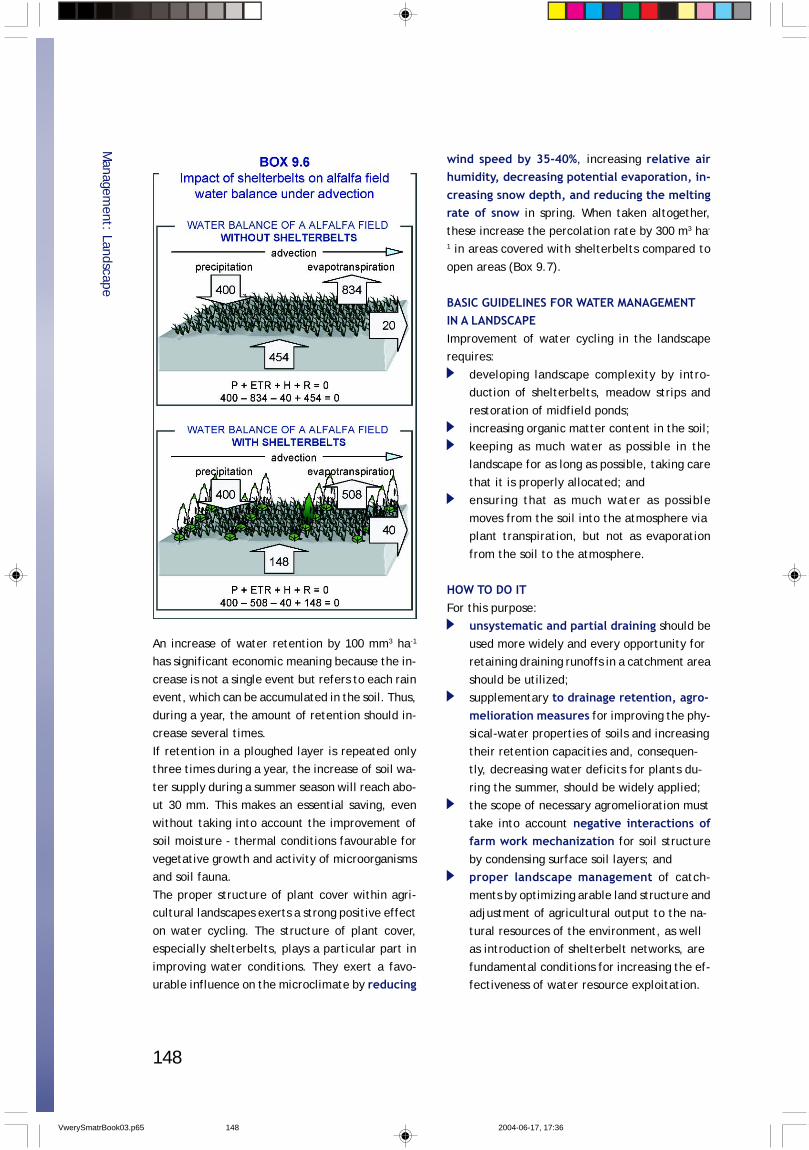
148
An increase of water retention by 100 mm3 ha-1
has significant economic meaning because the in-
crease is not a single event but refers to each rainevent, which can be accumulated in the soil. Thus,
during a year, the amount of retention should in-crease several times.
If retention in a ploughed layer is repeated onlythree times during a year, the increase of soil wa-
ter supply during a summer season will reach abo-ut 30 mm. This makes an essential saving, even
without taking into account the improvement ofsoil moisture - thermal conditions favourable for
vegetative growth and activity of microorganismsand soil fauna.
The proper structure of plant cover within agri-cultural landscapes exerts a strong positive effect
on water cycling. The structure of plant cover,especially shelterbelts, plays a particular part in
improving water conditions. They exert a favo-urable influence on the microclimate by reducing
wind speed by 35-40%, increasing relative airhumidity, decreasing potential evaporation, in-creasing snow depth, and reducing the meltingrate of snow in spring. When taken altogether,
these increase the percolation rate by 300 m3 ha-
1 in areas covered with shelterbelts compared to
open areas (Box 9.7).
BASIC GUIDELINES FOR WATER MANAGEMENTIN A LANDSCAPEImprovement of water cycling in the landscaperequires:
developing landscape complexity by intro-duction of shelterbelts, meadow strips and
restoration of midfield ponds;increasing organic matter content in the soil;
keeping as much water as possible in thelandscape for as long as possible, taking care
that it is properly allocated; andensuring that as much water as possible
moves from the soil into the atmosphere viaplant transpiration, but not as evaporation
from the soil to the atmosphere.
HOW TO DO ITFor this purpose:
unsystematic and partial draining should be
used more widely and every opportunity forretaining draining runoffs in a catchment area
should be utilized;supplementary to drainage retention, agro-melioration measures for improving the phy-sical-water properties of soils and increasing
their retention capacities and, consequen-tly, decreasing water deficits for plants du-
ring the summer, should be widely applied;the scope of necessary agromelioration must
take into account negative interactions offarm work mechanization for soil structure
by condensing surface soil layers; andproper landscape management of catch-
ments by optimizing arable land structure andadjustment of agricultural output to the na-
tural resources of the environment, as wellas introduction of shelterbelt networks, are
fundamental conditions for increasing the ef-fectiveness of water resource exploitation.
Managem
ent: Landscape
VwerySmatrBook03.p65 2004-06-17, 17:36148
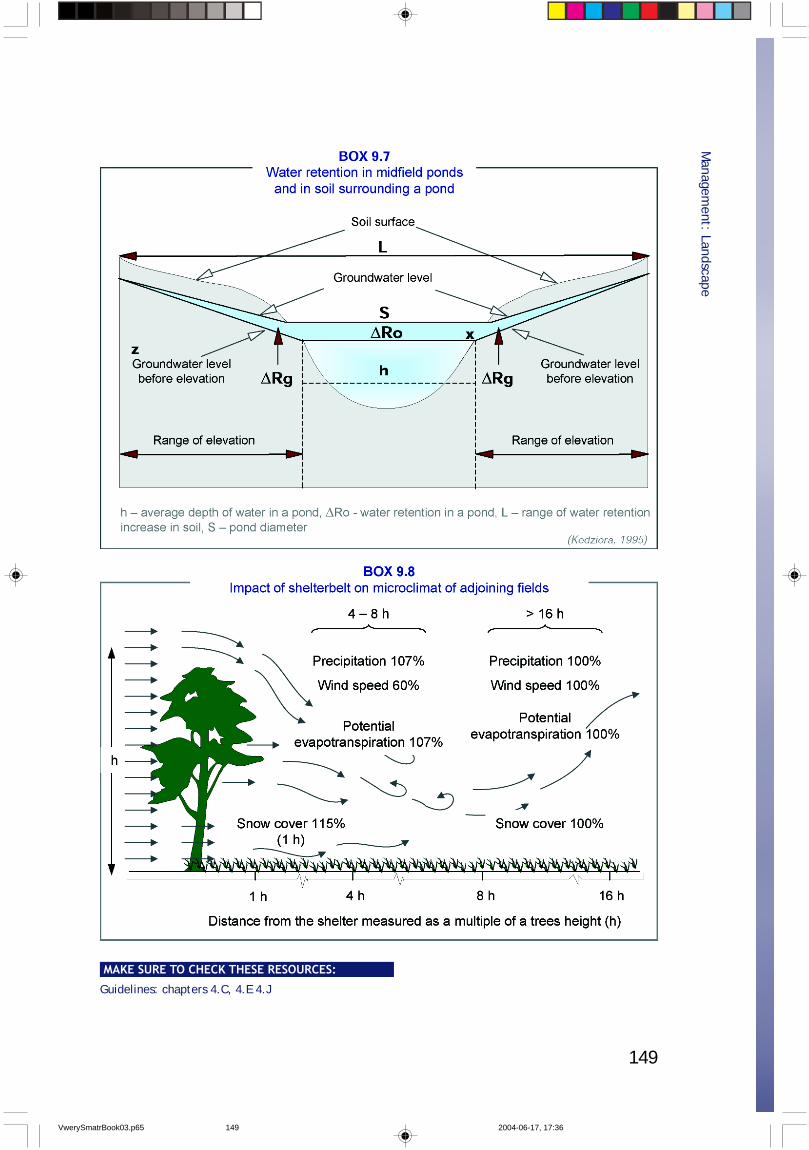
149
Managem
ent: Landscape
MAKE SURE TO CHECK THESE RESOURCES:
Guidelines: chapters 4.C, 4.E 4.J
VwerySmatrBook03.p65 2004-06-17, 17:36149
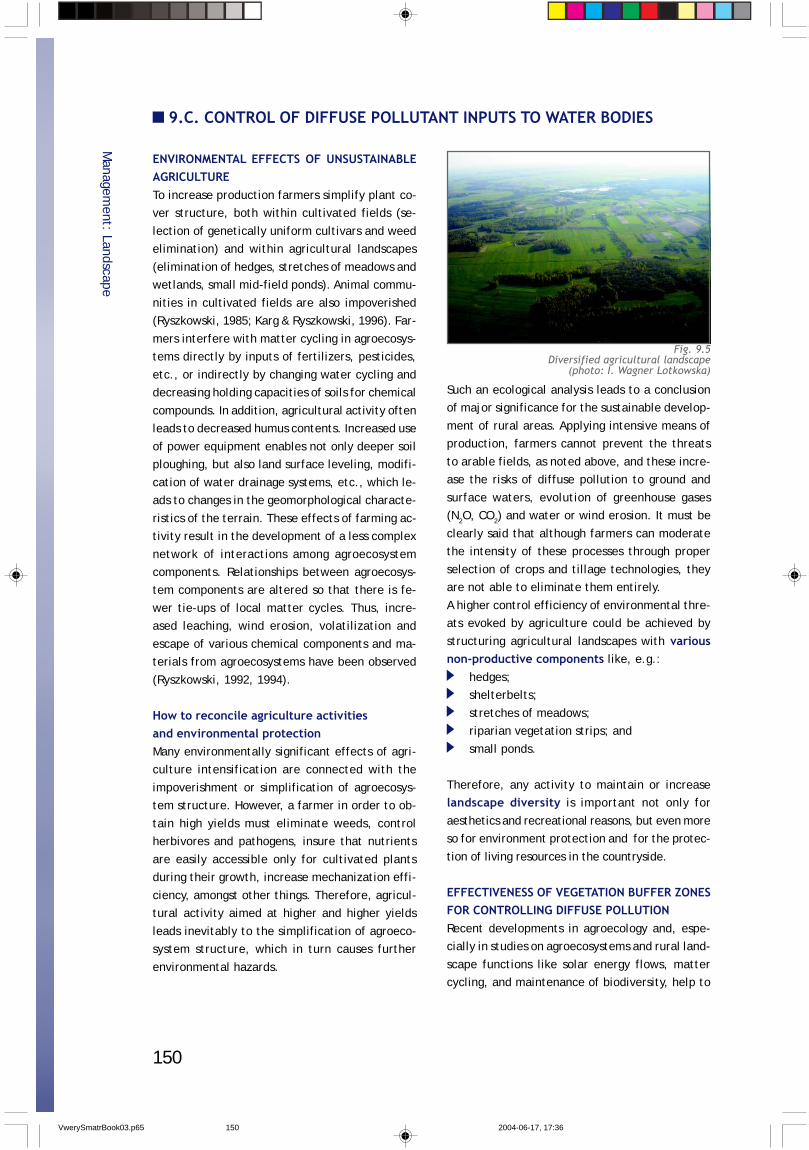
150
9.C. CONTROL OF DIFFUSE POLLUTANT INPUTS TO WATER BODIES
ENVIRONMENTAL EFFECTS OF UNSUSTAINABLEAGRICULTURETo increase production farmers simplify plant co-ver structure, both within cultivated fields (se-
lection of genetically uniform cultivars and weedelimination) and within agricultural landscapes
(elimination of hedges, stretches of meadows andwetlands, small mid-field ponds). Animal commu-
nities in cultivated fields are also impoverished(Ryszkowski, 1985; Karg & Ryszkowski, 1996). Far-
mers interfere with matter cycling in agroecosys-tems directly by inputs of fertilizers, pesticides,
etc., or indirectly by changing water cycling anddecreasing holding capacities of soils for chemical
compounds. In addition, agricultural activity oftenleads to decreased humus contents. Increased use
of power equipment enables not only deeper soilploughing, but also land surface leveling, modifi-
cation of water drainage systems, etc., which le-ads to changes in the geomorphological characte-
ristics of the terrain. These effects of farming ac-tivity result in the development of a less complex
network of interactions among agroecosystemcomponents. Relationships between agroecosys-tem components are altered so that there is fe-
wer tie-ups of local matter cycles. Thus, incre-ased leaching, wind erosion, volatilization and
escape of various chemical components and ma-terials from agroecosystems have been observed
(Ryszkowski, 1992, 1994).
How to reconcile agriculture activitiesand environmental protectionMany environmentally significant effects of agri-culture intensification are connected with the
impoverishment or simplification of agroecosys-tem structure. However, a farmer in order to ob-
tain high yields must eliminate weeds, controlherbivores and pathogens, insure that nutrients
are easily accessible only for cultivated plantsduring their growth, increase mechanization effi-
ciency, amongst other things. Therefore, agricul-tural activity aimed at higher and higher yields
leads inevitably to the simplification of agroeco-system structure, which in turn causes further
environmental hazards.
Such an ecological analysis leads to a conclusionof major significance for the sustainable develop-
ment of rural areas. Applying intensive means ofproduction, farmers cannot prevent the threats
to arable fields, as noted above, and these incre-ase the risks of diffuse pollution to ground and
surface waters, evolution of greenhouse gases(N2O, CO2) and water or wind erosion. It must be
clearly said that although farmers can moderatethe intensity of these processes through proper
selection of crops and tillage technologies, theyare not able to eliminate them entirely.
A higher control efficiency of environmental thre-ats evoked by agriculture could be achieved by
structuring agricultural landscapes with variousnon-productive components like, e.g.:
hedges;shelterbelts;
stretches of meadows;riparian vegetation strips; and
small ponds.
Therefore, any activity to maintain or increaselandscape diversity is important not only for
aesthetics and recreational reasons, but even moreso for environment protection and for the protec-
tion of living resources in the countryside.
EFFECTIVENESS OF VEGETATION BUFFER ZONESFOR CONTROLLING DIFFUSE POLLUTIONRecent developments in agroecology and, espe-cially in studies on agroecosystems and rural land-
scape functions like solar energy flows, mattercycling, and maintenance of biodiversity, help to
Managem
ent: Landscape
Fig. 9.5Diversified agricultural landscape
(photo: I. Wagner Lotkowska)
VwerySmatrBook03.p65 2004-06-17, 17:36150
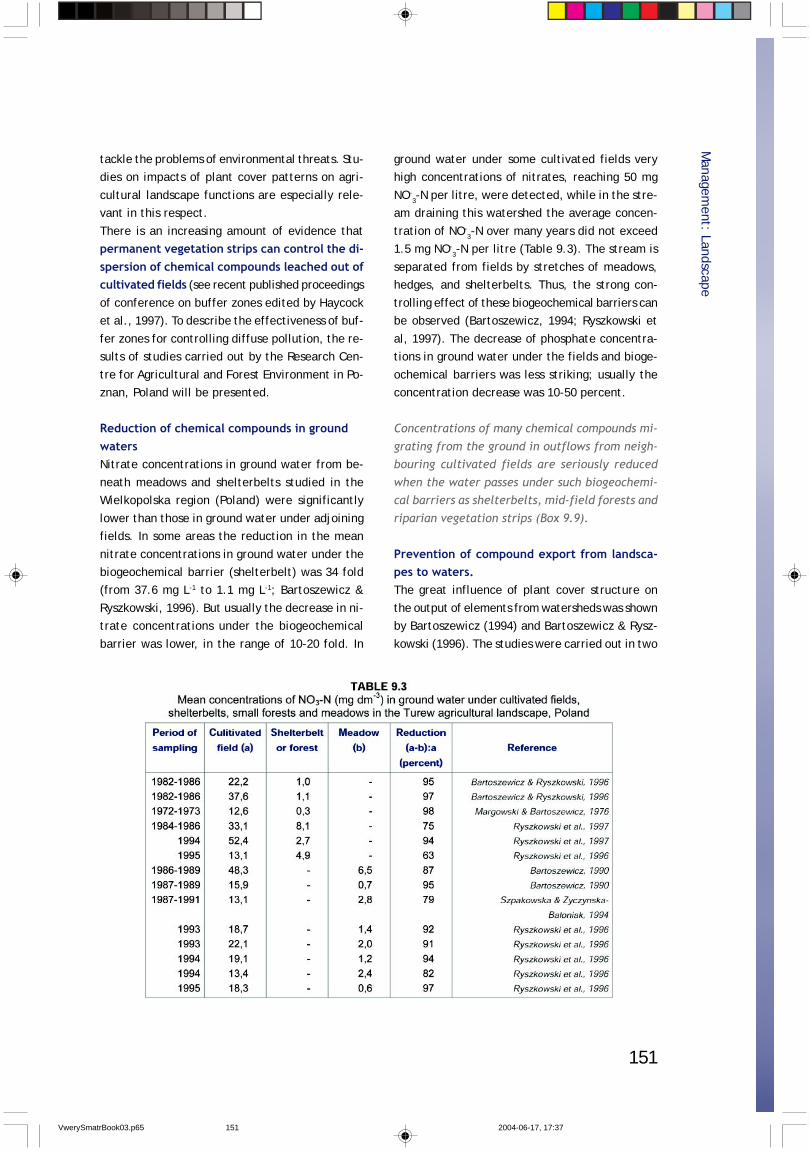
151
tackle the problems of environmental threats. Stu-dies on impacts of plant cover patterns on agri-
cultural landscape functions are especially rele-vant in this respect.
There is an increasing amount of evidence thatpermanent vegetation strips can control the di-spersion of chemical compounds leached out ofcultivated fields (see recent published proceedings
of conference on buffer zones edited by Haycocket al., 1997). To describe the effectiveness of buf-
fer zones for controlling diffuse pollution, the re-sults of studies carried out by the Research Cen-
tre for Agricultural and Forest Environment in Po-znan, Poland will be presented.
Reduction of chemical compounds in groundwatersNitrate concentrations in ground water from be-
neath meadows and shelterbelts studied in theWielkopolska region (Poland) were significantly
lower than those in ground water under adjoiningfields. In some areas the reduction in the mean
nitrate concentrations in ground water under thebiogeochemical barrier (shelterbelt) was 34 fold(from 37.6 mg L-1 to 1.1 mg L-1; Bartoszewicz &
Ryszkowski, 1996). But usually the decrease in ni-trate concentrations under the biogeochemical
barrier was lower, in the range of 10-20 fold. In
ground water under some cultivated fields veryhigh concentrations of nitrates, reaching 50 mg
NO-3-N per litre, were detected, while in the stre-
am draining this watershed the average concen-
tration of NO-3-N over many years did not exceed
1.5 mg NO-3-N per litre (Table 9.3). The stream is
separated from fields by stretches of meadows,hedges, and shelterbelts. Thus, the strong con-
trolling effect of these biogeochemical barriers canbe observed (Bartoszewicz, 1994; Ryszkowski et
al, 1997). The decrease of phosphate concentra-tions in ground water under the fields and bioge-
ochemical barriers was less striking; usually theconcentration decrease was 10-50 percent.
Concentrations of many chemical compounds mi-
grating from the ground in outflows from neigh-bouring cultivated fields are seriously reduced
when the water passes under such biogeochemi-cal barriers as shelterbelts, mid-field forests and
riparian vegetation strips (Box 9.9).
Prevention of compound export from landsca-pes to waters.The great influence of plant cover structure on
the output of elements from watersheds was shownby Bartoszewicz (1994) and Bartoszewicz & Rysz-
kowski (1996). The studies were carried out in two
Managem
ent: Landscape
VwerySmatrBook03.p65 2004-06-17, 17:37151
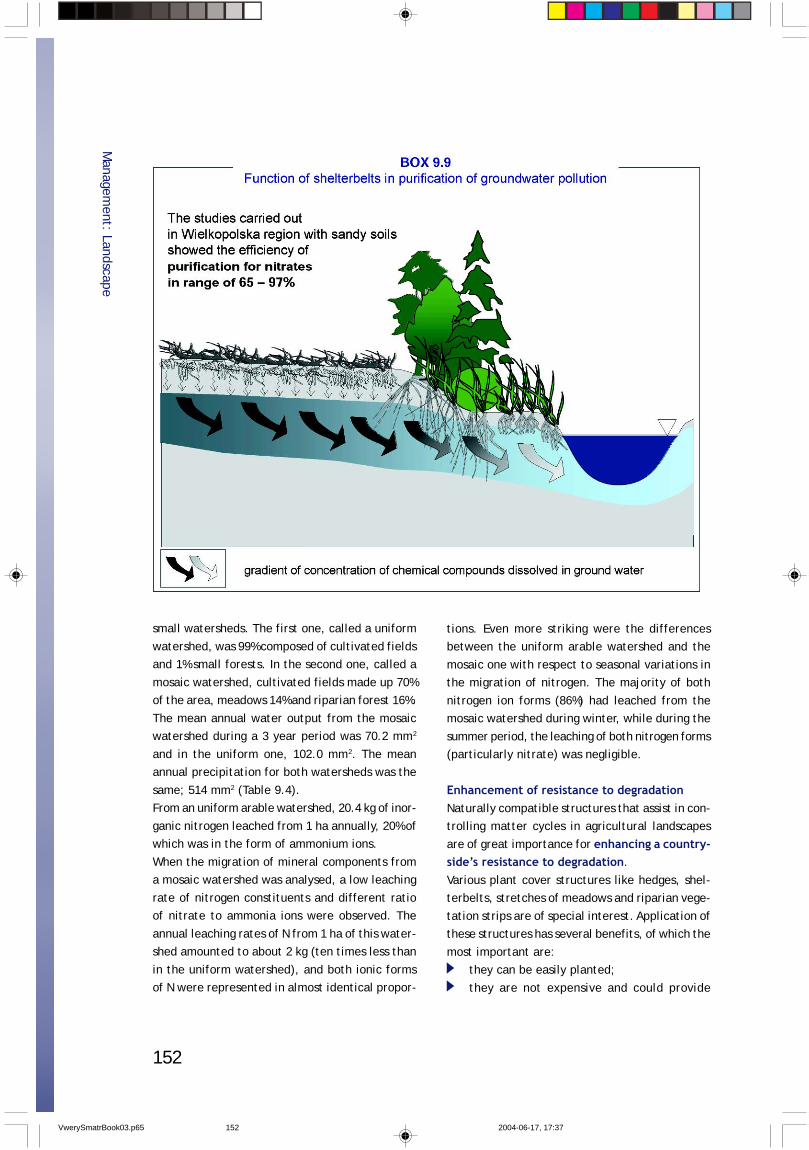
152
small watersheds. The first one, called a uniform
watershed, was 99% composed of cultivated fieldsand 1% small forests. In the second one, called a
mosaic watershed, cultivated fields made up 70%of the area, meadows 14% and riparian forest 16%.
The mean annual water output from the mosaicwatershed during a 3 year period was 70.2 mm2
and in the uniform one, 102.0 mm2. The meanannual precipitation for both watersheds was the
same; 514 mm2 (Table 9.4).From an uniform arable watershed, 20.4 kg of inor-
ganic nitrogen leached from 1 ha annually, 20% ofwhich was in the form of ammonium ions.
When the migration of mineral components froma mosaic watershed was analysed, a low leaching
rate of nitrogen constituents and different ratioof nitrate to ammonia ions were observed. The
annual leaching rates of N from 1 ha of this water-shed amounted to about 2 kg (ten times less than
in the uniform watershed), and both ionic formsof N were represented in almost identical propor-
tions. Even more striking were the differencesbetween the uniform arable watershed and the
mosaic one with respect to seasonal variations inthe migration of nitrogen. The majority of both
nitrogen ion forms (86%) had leached from themosaic watershed during winter, while during the
summer period, the leaching of both nitrogen forms(particularly nitrate) was negligible.
Enhancement of resistance to degradationNaturally compatible structures that assist in con-trolling matter cycles in agricultural landscapes
are of great importance for enhancing a country-side’s resistance to degradation.
Various plant cover structures like hedges, shel-terbelts, stretches of meadows and riparian vege-
tation strips are of special interest. Application ofthese structures has several benefits, of which the
most important are:they can be easily planted;
they are not expensive and could provide
Managem
ent: Landscape
VwerySmatrBook03.p65 2004-06-17, 17:37152
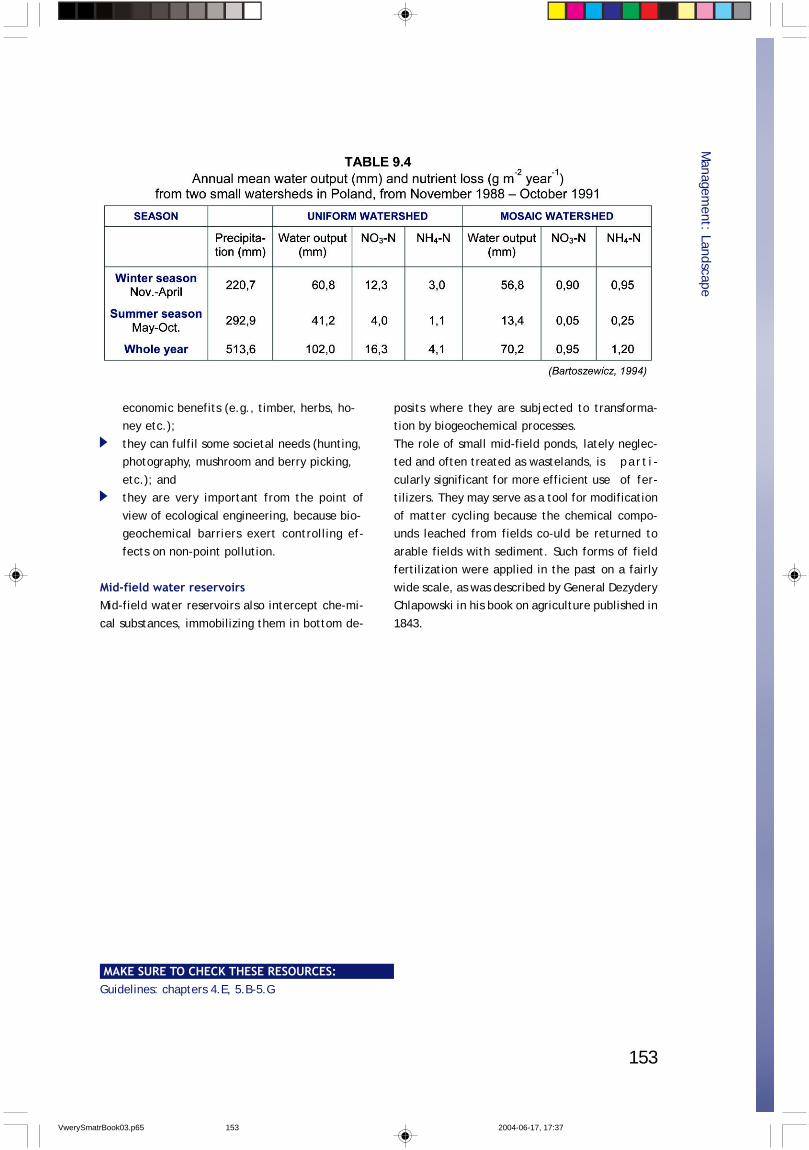
153
economic benefits (e.g., timber, herbs, ho-ney etc.);
they can fulfil some societal needs (hunting,photography, mushroom and berry picking,
etc.); andthey are very important from the point of
view of ecological engineering, because bio-geochemical barriers exert controlling ef-
fects on non-point pollution.
Mid-field water reservoirsMid-field water reservoirs also intercept che-mi-
cal substances, immobilizing them in bottom de-
posits where they are subjected to transforma-tion by biogeochemical processes.
The role of small mid-field ponds, lately neglec-ted and often treated as wastelands, is part i -
cularly significant for more efficient use of fer-tilizers. They may serve as a tool for modification
of matter cycling because the chemical compo-unds leached from fields co-uld be returned to
arable fields with sediment. Such forms of fieldfertilization were applied in the past on a fairly
wide scale, as was described by General DezyderyChlapowski in his book on agriculture published in
1843.
Managem
ent: Landscape
MAKE SURE TO CHECK THESE RESOURCES:Guidelines: chapters 4.E, 5.B-5.G
VwerySmatrBook03.p65 2004-06-17, 17:37153
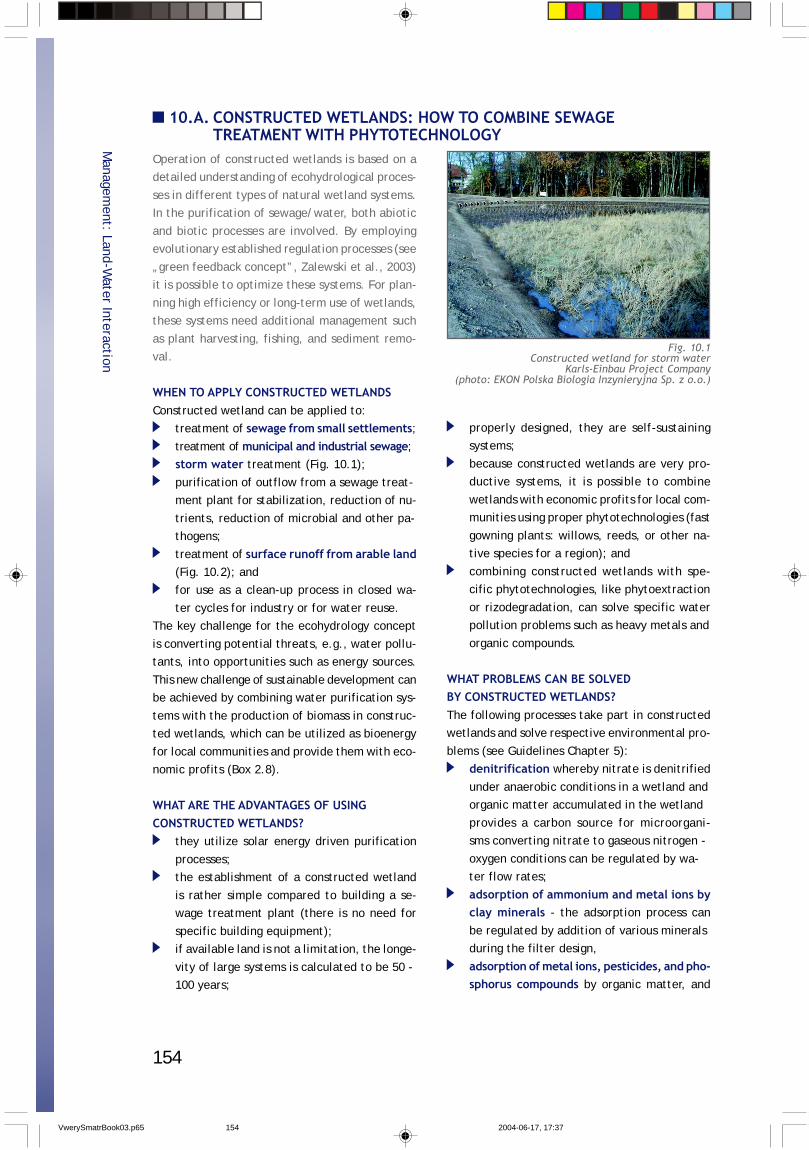
154
Operation of constructed wetlands is based on adetailed understanding of ecohydrological proces-
ses in different types of natural wetland systems.In the purification of sewage/water, both abiotic
and biotic processes are involved. By employingevolutionary established regulation processes (see
„green feedback concept”, Zalewski et al., 2003)it is possible to optimize these systems. For plan-
ning high efficiency or long-term use of wetlands,these systems need additional management such
as plant harvesting, fishing, and sediment remo-val.
WHEN TO APPLY CONSTRUCTED WETLANDSConstructed wetland can be applied to:
treatment of sewage from small settlements;treatment of municipal and industrial sewage;storm water treatment (Fig. 10.1);
purification of outflow from a sewage treat-ment plant for stabilization, reduction of nu-
trients, reduction of microbial and other pa-thogens;
treatment of surface runoff from arable land(Fig. 10.2); andfor use as a clean-up process in closed wa-
ter cycles for industry or for water reuse.The key challenge for the ecohydrology concept
is converting potential threats, e.g., water pollu-tants, into opportunities such as energy sources.
This new challenge of sustainable development canbe achieved by combining water purification sys-
tems with the production of biomass in construc-ted wetlands, which can be utilized as bioenergy
for local communities and provide them with eco-nomic profits (Box 2.8).
WHAT ARE THE ADVANTAGES OF USINGCONSTRUCTED WETLANDS?
they utilize solar energy driven purification
processes;the establishment of a constructed wetland
is rather simple compared to building a se-wage treatment plant (there is no need for
specific building equipment);if available land is not a limitation, the longe-
vity of large systems is calculated to be 50 -100 years;
10.A. CONSTRUCTED WETLANDS: HOW TO COMBINE SEWAGETREATMENT WITH PHYTOTECHNOLOGY
properly designed, they are self-sustainingsystems;
because constructed wetlands are very pro-ductive systems, it is possible to combine
wetlands with economic profits for local com-munities using proper phytotechnologies (fast
gowning plants: willows, reeds, or other na-tive species for a region); and
combining constructed wetlands with spe-cific phytotechnologies, like phytoextraction
or rizodegradation, can solve specific waterpollution problems such as heavy metals and
organic compounds.
WHAT PROBLEMS CAN BE SOLVEDBY CONSTRUCTED WETLANDS?The following processes take part in constructedwetlands and solve respective environmental pro-
blems (see Guidelines Chapter 5):denitrification whereby nitrate is denitrified
under anaerobic conditions in a wetland andorganic matter accumulated in the wetland
provides a carbon source for microorgani-sms converting nitrate to gaseous nitrogen -
oxygen conditions can be regulated by wa-ter flow rates;
adsorption of ammonium and metal ions byclay minerals - the adsorption process can
be regulated by addition of various mineralsduring the filter design,
adsorption of metal ions, pesticides, and pho-sphorus compounds by organic matter, and
Managem
ent: Land-Water Interaction
Fig. 10.1Constructed wetland for storm water
Karls-Einbau Project Company(photo: EKON Polska Biologia Inzynieryjna Sp. z o.o.)
VwerySmatrBook03.p65 2004-06-17, 17:37154
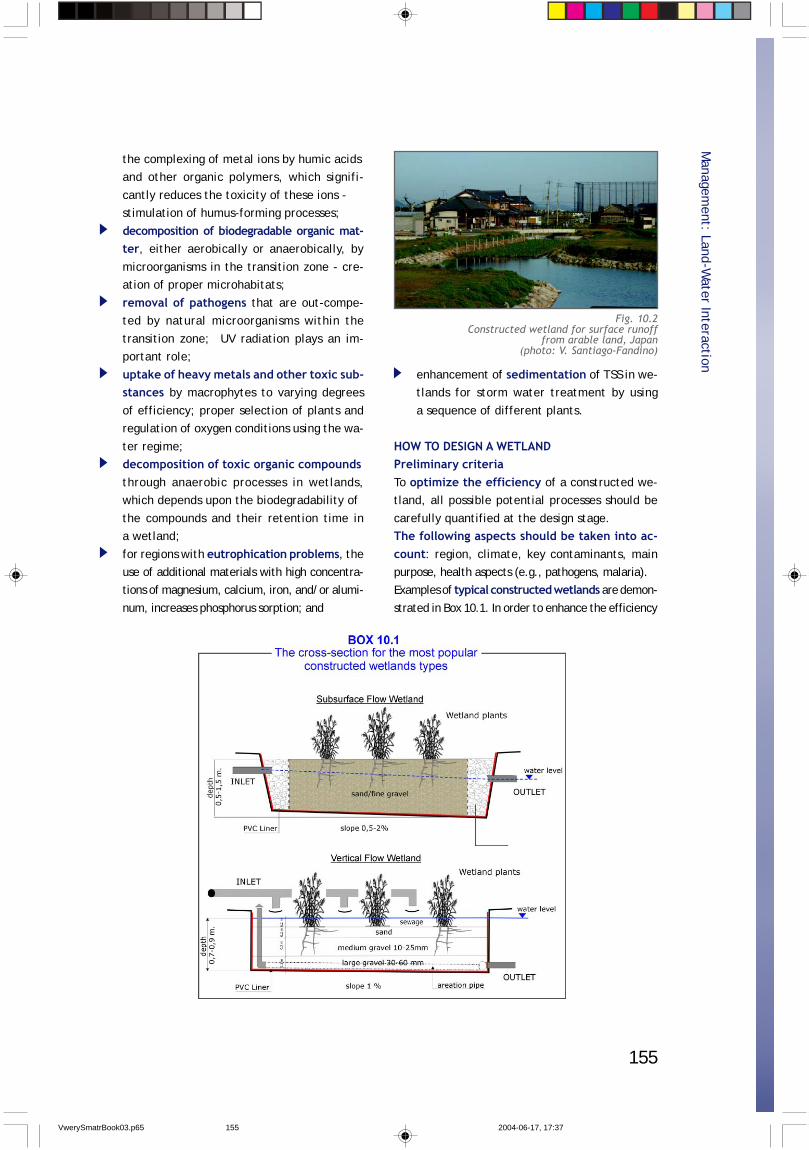
155
the complexing of metal ions by humic acidsand other organic polymers, which signifi-
cantly reduces the toxicity of these ions -stimulation of humus-forming processes;
decomposition of biodegradable organic mat-ter, either aerobically or anaerobically, by
microorganisms in the transition zone - cre-ation of proper microhabitats;
removal of pathogens that are out-compe-ted by natural microorganisms within the
transition zone; UV radiation plays an im-portant role;
uptake of heavy metals and other toxic sub-stances by macrophytes to varying degrees
of efficiency; proper selection of plants andregulation of oxygen conditions using the wa-
ter regime;decomposition of toxic organic compoundsthrough anaerobic processes in wetlands,which depends upon the biodegradability of
the compounds and their retention time ina wetland;
for regions with eutrophication problems, theuse of additional materials with high concentra-tions of magnesium, calcium, iron, and/or alumi-
num, increases phosphorus sorption; and
enhancement of sedimentation of TSS in we-tlands for storm water treatment by using
a sequence of different plants.
HOW TO DESIGN A WETLANDPreliminary criteriaTo optimize the efficiency of a constructed we-tland, all possible potential processes should be
carefully quantified at the design stage.The following aspects should be taken into ac-count: region, climate, key contaminants, mainpurpose, health aspects (e.g., pathogens, malaria).Examples of typical constructed wetlands are demon-
strated in Box 10.1. In order to enhance the efficiency
Managem
ent: Land-Water Interaction
Fig. 10.2Constructed wetland for surface runoff
from arable land, Japan(photo: V. Santiago-Fandino)
VwerySmatrBook03.p65 2004-06-17, 17:37155
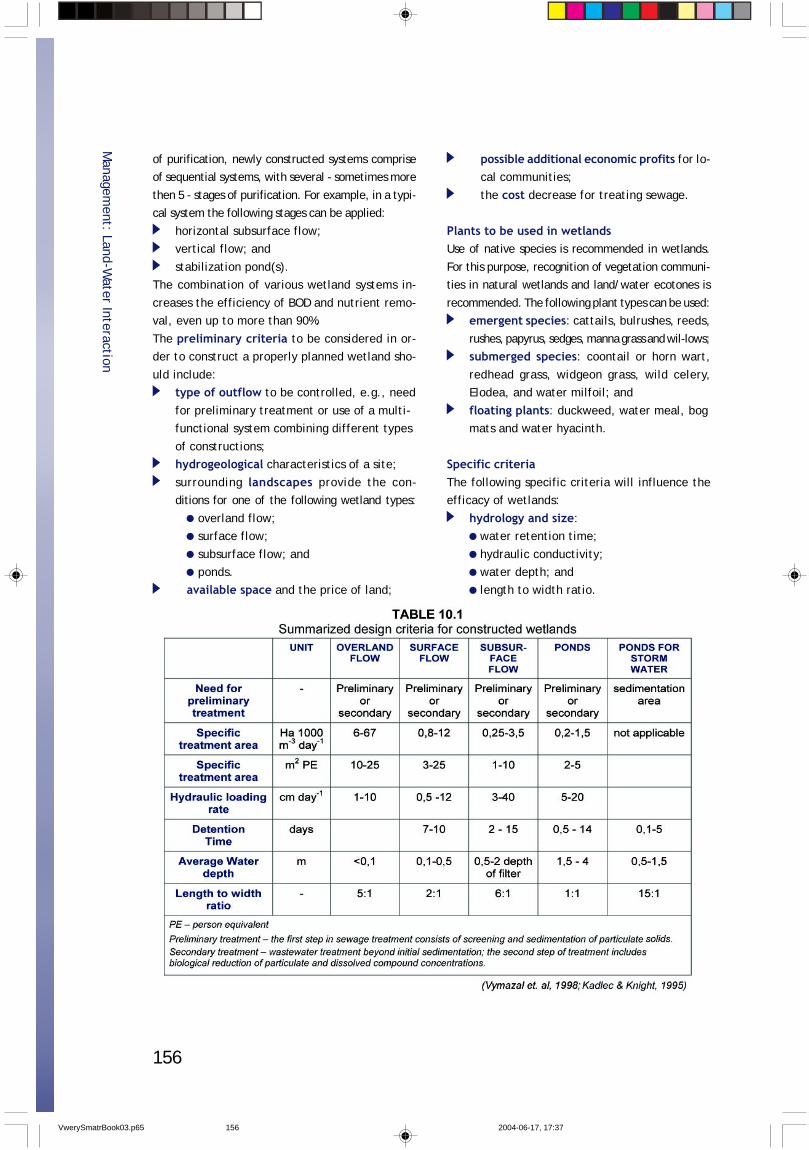
156
of purification, newly constructed systems compriseof sequential systems, with several - sometimes more
then 5 - stages of purification. For example, in a typi-cal system the following stages can be applied:
horizontal subsurface flow;vertical flow; and
stabilization pond(s).The combination of various wetland systems in-
creases the efficiency of BOD and nutrient remo-val, even up to more than 90%.
The preliminary criteria to be considered in or-der to construct a properly planned wetland sho-
uld include:type of outflow to be controlled, e.g., need
for preliminary treatment or use of a multi-functional system combining different types
of constructions;hydrogeological characteristics of a site;
surrounding landscapes provide the con-ditions for one of the following wetland types:
overland flow;surface flow;
subsurface flow; andponds.
available space and the price of land;
possible additional economic profits for lo-cal communities;
the cost decrease for treating sewage.
Plants to be used in wetlandsUse of native species is recommended in wetlands.
For this purpose, recognition of vegetation communi-ties in natural wetlands and land/water ecotones is
recommended. The following plant types can be used:emergent species: cattails, bulrushes, reeds,
rushes, papyrus, sedges, manna grass and wil-lows;submerged species: coontail or horn wart,
redhead grass, widgeon grass, wild celery,Elodea, and water milfoil; and
floating plants: duckweed, water meal, bogmats and water hyacinth.
Specific criteriaThe following specific criteria will influence theefficacy of wetlands:
hydrology and size: water retention time;
hydraulic conductivity; water depth; and length to width ratio.
Managem
ent: Land-Water Interaction
VwerySmatrBook03.p65 2004-06-17, 17:37156
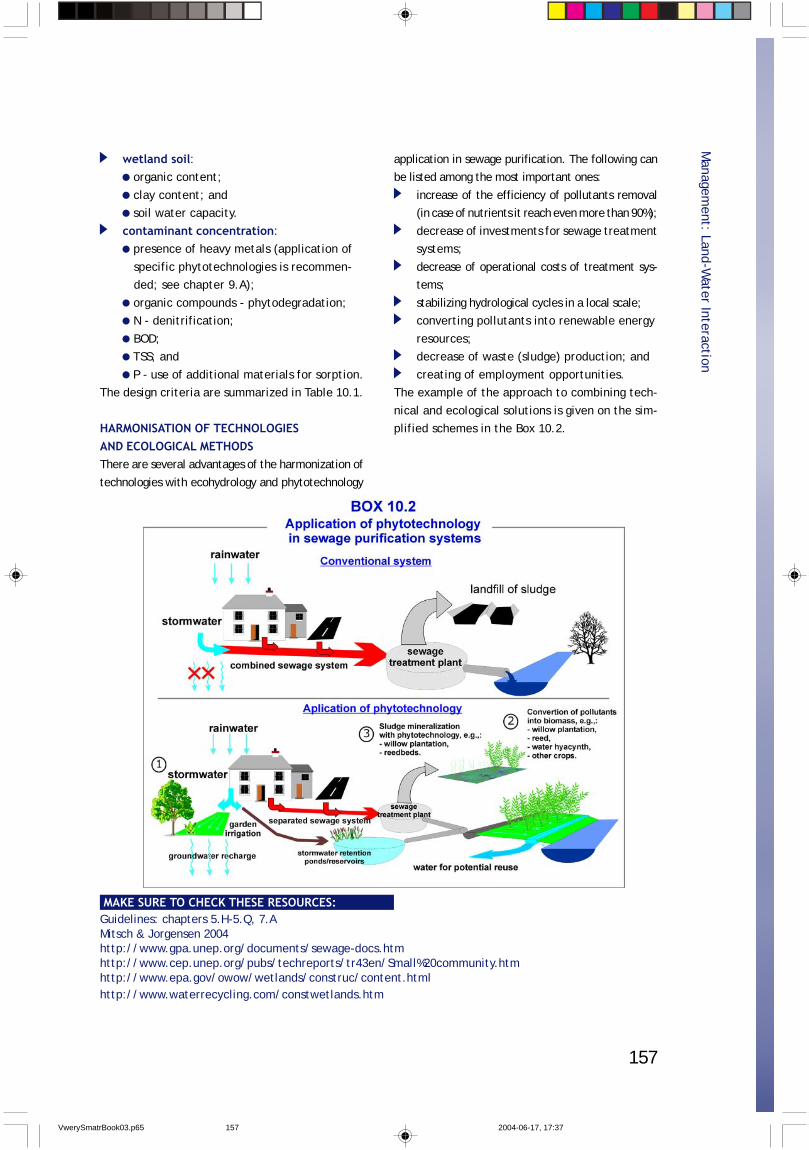
157
Managem
ent: Land-Water Interaction
wetland soil: organic content;
clay content; and soil water capacity.
contaminant concentration: presence of heavy metals (application of
specific phytotechnologies is recommen-ded; see chapter 9.A);
organic compounds - phytodegradation; N - denitrification;
BOD; TSS; and
P - use of additional materials for sorption.The design criteria are summarized in Table 10.1.
HARMONISATION OF TECHNOLOGIESAND ECOLOGICAL METHODSThere are several advantages of the harmonization of
technologies with ecohydrology and phytotechnology
MAKE SURE TO CHECK THESE RESOURCES:
application in sewage purification. The following canbe listed among the most important ones:
increase of the efficiency of pollutants removal(in case of nutrients it reach even more than 90%);
decrease of investments for sewage treatmentsystems;
decrease of operational costs of treatment sys-tems;
stabilizing hydrological cycles in a local scale;converting pollutants into renewable energy
resources;decrease of waste (sludge) production; and
creating of employment opportunities.The example of the approach to combining tech-
nical and ecological solutions is given on the sim-plified schemes in the Box 10.2.
Guidelines: chapters 5.H-5.Q, 7.AMitsch & Jorgensen 2004http://www.gpa.unep.org/documents/sewage-docs.htmhttp://www.cep.unep.org/pubs/techreports/tr43en/Small%20community.htmhttp://www.epa.gov/owow/wetlands/construc/content.htmlhttp://www.waterrecycling.com/constwetlands.htm
VwerySmatrBook03.p65 2004-06-17, 17:37157
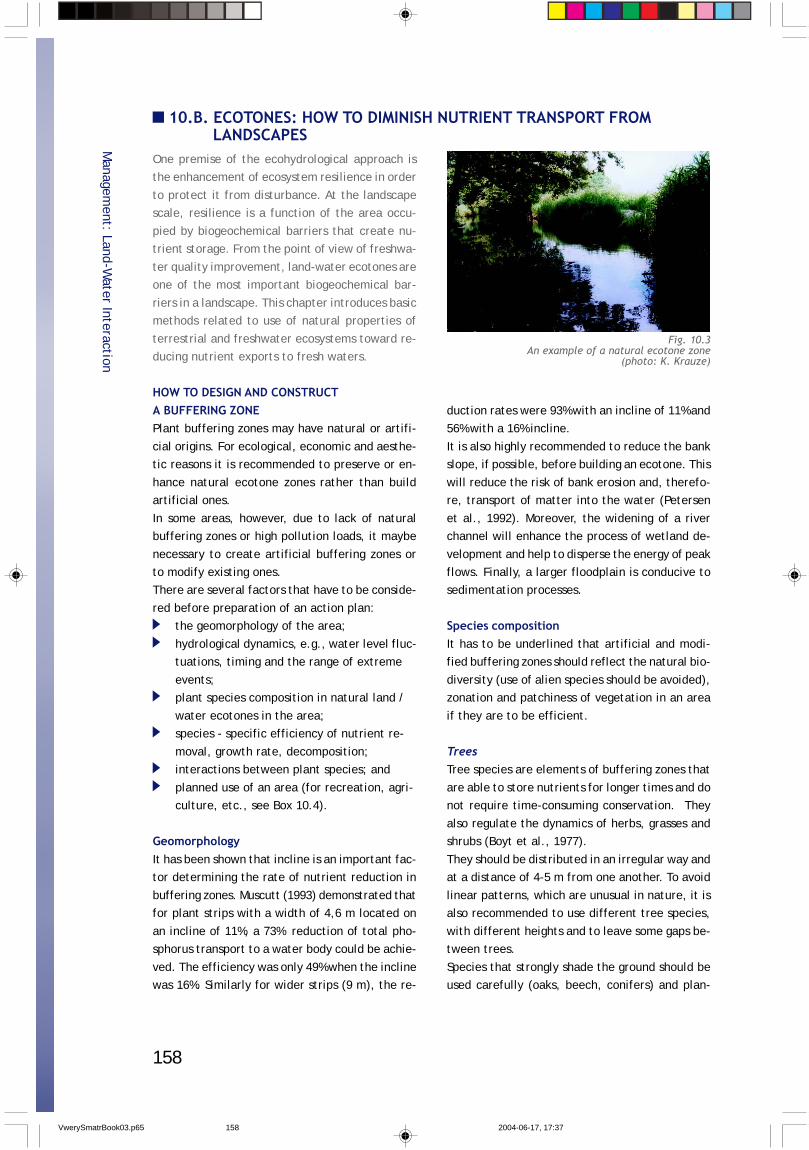
158
One premise of the ecohydrological approach isthe enhancement of ecosystem resilience in order
to protect it from disturbance. At the landscapescale, resilience is a function of the area occu-
pied by biogeochemical barriers that create nu-trient storage. From the point of view of freshwa-
ter quality improvement, land-water ecotones areone of the most important biogeochemical bar-
riers in a landscape. This chapter introduces basicmethods related to use of natural properties of
terrestrial and freshwater ecosystems toward re-ducing nutrient exports to fresh waters.
HOW TO DESIGN AND CONSTRUCTA BUFFERING ZONEPlant buffering zones may have natural or artifi-
cial origins. For ecological, economic and aesthe-tic reasons it is recommended to preserve or en-
hance natural ecotone zones rather than buildartificial ones.
In some areas, however, due to lack of naturalbuffering zones or high pollution loads, it maybe
necessary to create artificial buffering zones orto modify existing ones.There are several factors that have to be conside-
red before preparation of an action plan:the geomorphology of the area;
hydrological dynamics, e.g., water level fluc-tuations, timing and the range of extreme
events;plant species composition in natural land /
water ecotones in the area;species - specific efficiency of nutrient re-
moval, growth rate, decomposition;interactions between plant species; and
planned use of an area (for recreation, agri-culture, etc., see Box 10.4).
GeomorphologyIt has been shown that incline is an important fac-tor determining the rate of nutrient reduction in
buffering zones. Muscutt (1993) demonstrated thatfor plant strips with a width of 4,6 m located on
an incline of 11%, a 73% reduction of total pho-sphorus transport to a water body could be achie-
ved. The efficiency was only 49% when the inclinewas 16%. Similarly for wider strips (9 m), the re-
10.B. ECOTONES: HOW TO DIMINISH NUTRIENT TRANSPORT FROMLANDSCAPES
duction rates were 93% with an incline of 11% and56% with a 16% incline.
It is also highly recommended to reduce the bankslope, if possible, before building an ecotone. This
will reduce the risk of bank erosion and, therefo-re, transport of matter into the water (Petersen
et al., 1992). Moreover, the widening of a riverchannel will enhance the process of wetland de-
velopment and help to disperse the energy of peakflows. Finally, a larger floodplain is conducive tosedimentation processes.
Species compositionIt has to be underlined that artificial and modi-fied buffering zones should reflect the natural bio-
diversity (use of alien species should be avoided),zonation and patchiness of vegetation in an area
if they are to be efficient.
TreesTree species are elements of buffering zones that
are able to store nutrients for longer times and donot require time-consuming conservation. They
also regulate the dynamics of herbs, grasses andshrubs (Boyt et al., 1977).
They should be distributed in an irregular way andat a distance of 4-5 m from one another. To avoid
linear patterns, which are unusual in nature, it isalso recommended to use different tree species,
with different heights and to leave some gaps be-tween trees.
Species that strongly shade the ground should beused carefully (oaks, beech, conifers) and plan-
Managem
ent: Land-Water Interaction
Fig. 10.3An example of a natural ecotone zone
(photo: K. Krauze)
VwerySmatrBook03.p65 2004-06-17, 17:37158
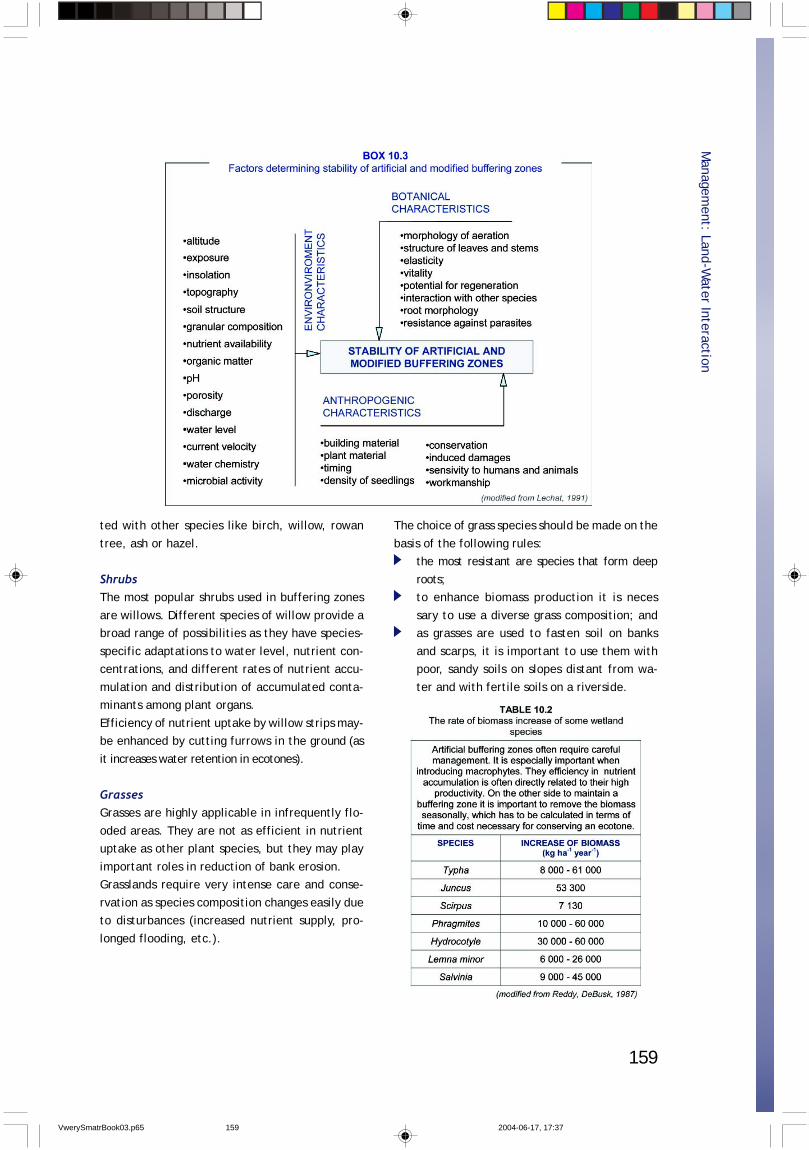
159
ted with other species like birch, willow, rowan
tree, ash or hazel.
ShrubsThe most popular shrubs used in buffering zones
are willows. Different species of willow provide abroad range of possibilities as they have species-
specific adaptations to water level, nutrient con-centrations, and different rates of nutrient accu-
mulation and distribution of accumulated conta-minants among plant organs.
Efficiency of nutrient uptake by willow strips may-be enhanced by cutting furrows in the ground (as
it increases water retention in ecotones).
GrassesGrasses are highly applicable in infrequently flo-
oded areas. They are not as efficient in nutrientuptake as other plant species, but they may play
important roles in reduction of bank erosion.Grasslands require very intense care and conse-
rvation as species composition changes easily dueto disturbances (increased nutrient supply, pro-
longed flooding, etc.).
The choice of grass species should be made on the
basis of the following rules:the most resistant are species that form deep
roots;to enhance biomass production it is neces
sary to use a diverse grass composition; andas grasses are used to fasten soil on banks
and scarps, it is important to use them withpoor, sandy soils on slopes distant from wa-
ter and with fertile soils on a riverside.
Managem
ent: Land-Water Interaction
VwerySmatrBook03.p65 2004-06-17, 17:37159
160
MacrophytesThe most popular species of macrophytes are
emergent ones, like reeds. They are valuable inbuilding biochemical barriers because they not
only accumulate nutrients, which can be easilyremoved after plant harvesting, but some of them
are able to oxygenate sediments (e.g., Phragmi-tes, Typha). In this way they enhance develop-
ment of microorganisms and increase oxidationprocess rates.
There are several factors which one should consi-der when planning to use macrophytes in ecotone
zones. The most important are:growth rate;
nutrient uptake and accumulation rate;hydroperiod ; and
decomposition rate (Tables 10.2-10.4).
In generalThere are several components which are used in
constructing wetlands along rivers and reservoirshores. The most common are:
sedimentation ponds;by-passes;
ditches for surface flow collection;willow zones;
tree and shrub zones;floating macrophytes zones;
submerged macrophytes zones; andembankments, etc.
Their sequence has to be planned according tolocal requirements (Box 10.4).
TROUBLESHOOTINGThere is little or no influence of ecotones onthe chemistry of watersSometimes it may happen that plant communitiesdo not influence the chemistry of ground water
passing an ecotone. One of the common reasons isthe geological structure of the area. Due to the
arrangement of different water permeability layers,pollution may, instead of passing a plant root zone,go with ground water directly to the river, or rese-rvoir. The only way of avoiding this problem is to know
the geology of the region and distribution of point andnon-point sources of pollution.
Buffering zones release nutrientsThere are three common reasons for this pheno-menon:
1. Biogens are stored in plant biomass and soilstructures. Prolonged nutrient inflow to a buffe-
ring zone may occasionally cause a decline of bio-
Managem
ent: Land-Water Interaction
VwerySmatrBook03.p65 2004-06-17, 17:37160
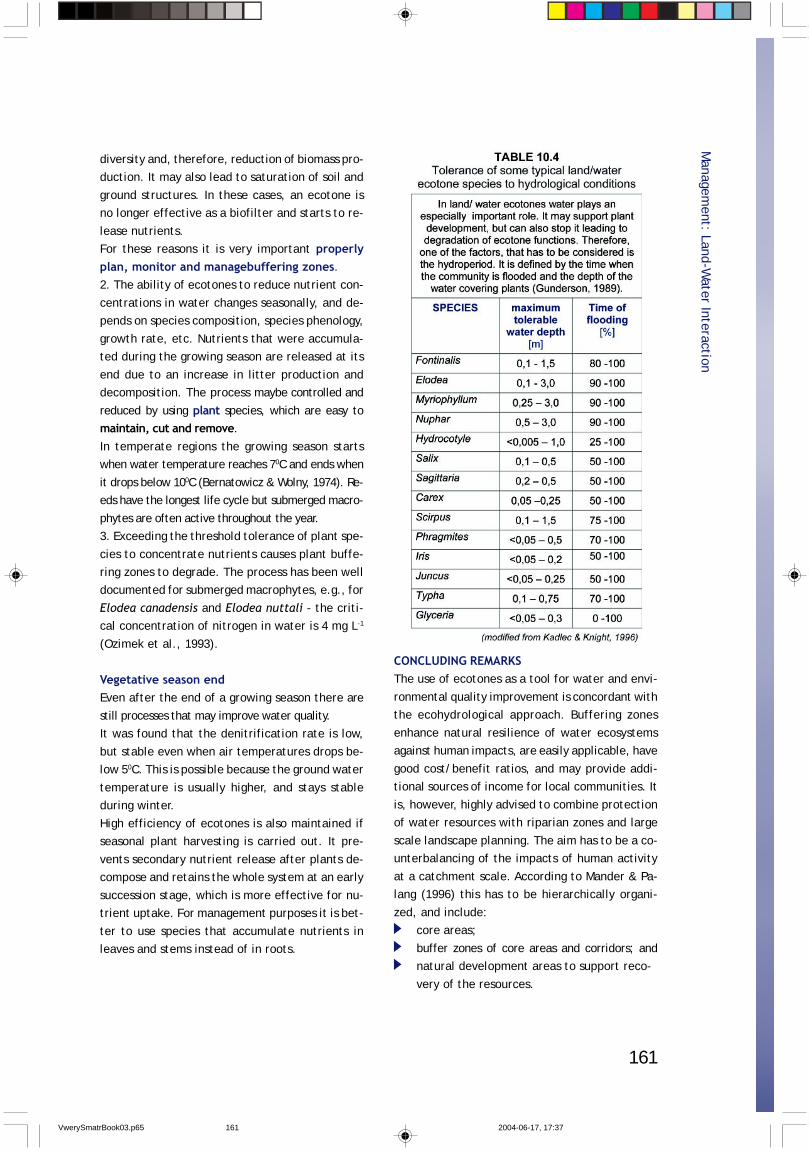
161
diversity and, therefore, reduction of biomass pro-duction. It may also lead to saturation of soil and
ground structures. In these cases, an ecotone isno longer effective as a biofilter and starts to re-
lease nutrients.For these reasons it is very important properlyplan, monitor and managebuffering zones.2. The ability of ecotones to reduce nutrient con-
centrations in water changes seasonally, and de-pends on species composition, species phenology,
growth rate, etc. Nutrients that were accumula-ted during the growing season are released at its
end due to an increase in litter production anddecomposition. The process maybe controlled and
reduced by using plant species, which are easy tomaintain, cut and remove.
In temperate regions the growing season startswhen water temperature reaches 70C and ends when
it drops below 100C (Bernatowicz & Wolny, 1974). Re-eds have the longest life cycle but submerged macro-
phytes are often active throughout the year.3. Exceeding the threshold tolerance of plant spe-
cies to concentrate nutrients causes plant buffe-ring zones to degrade. The process has been welldocumented for submerged macrophytes, e.g., for
Elodea canadensis and Elodea nuttali - the criti-cal concentration of nitrogen in water is 4 mg L-1
(Ozimek et al., 1993).
Vegetative season endEven after the end of a growing season there are
still processes that may improve water quality.It was found that the denitrification rate is low,
but stable even when air temperatures drops be-low 50C. This is possible because the ground water
temperature is usually higher, and stays stableduring winter.
High efficiency of ecotones is also maintained ifseasonal plant harvesting is carried out. It pre-
vents secondary nutrient release after plants de-compose and retains the whole system at an early
succession stage, which is more effective for nu-trient uptake. For management purposes it is bet-
ter to use species that accumulate nutrients inleaves and stems instead of in roots.
CONCLUDING REMARKSThe use of ecotones as a tool for water and envi-
ronmental quality improvement is concordant withthe ecohydrological approach. Buffering zones
enhance natural resilience of water ecosystemsagainst human impacts, are easily applicable, have
good cost/benefit ratios, and may provide addi-tional sources of income for local communities. It
is, however, highly advised to combine protectionof water resources with riparian zones and large
scale landscape planning. The aim has to be a co-unterbalancing of the impacts of human activity
at a catchment scale. According to Mander & Pa-lang (1996) this has to be hierarchically organi-
zed, and include:core areas;
buffer zones of core areas and corridors; andnatural development areas to support reco-
very of the resources.
Managem
ent: Land-Water Interaction
VwerySmatrBook03.p65 2004-06-17, 17:37161
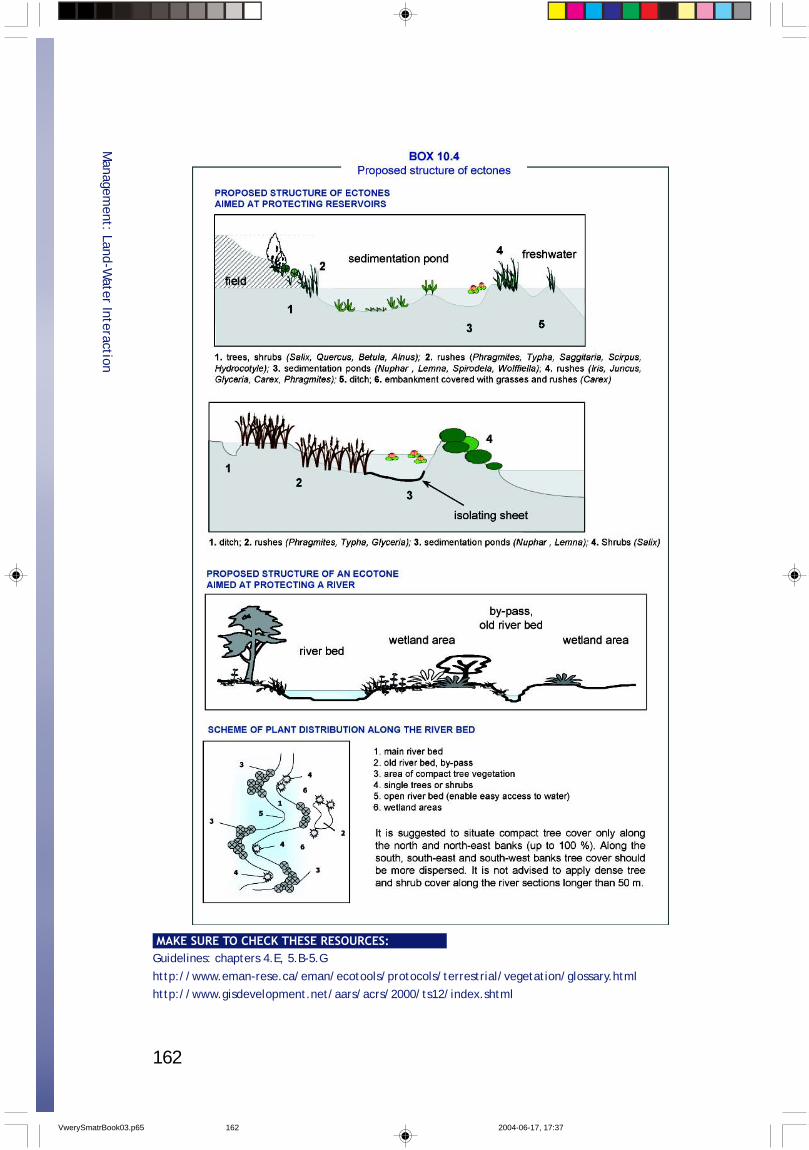
162
Guidelines: chapters 4.E, 5.B-5.G
http://www.eman-rese.ca/eman/ecotools/protocols/terrestrial/vegetation/glossary.htmlhttp://www.gisdevelopment.net/aars/acrs/2000/ts12/index.shtml
Managem
ent: Land-Water Interaction
MAKE SURE TO CHECK THESE RESOURCES:
VwerySmatrBook03.p65 2004-06-17, 17:37162
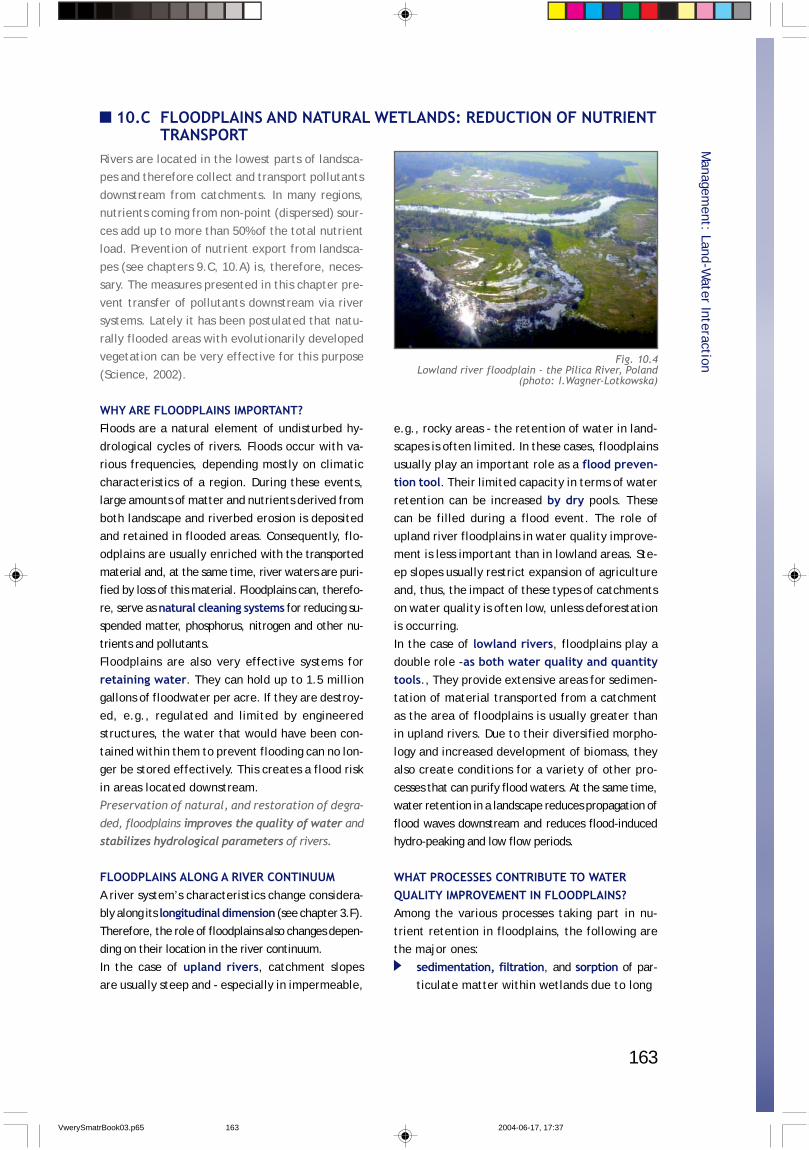
163
Managem
ent: Land-Water Interaction
Rivers are located in the lowest parts of landsca-pes and therefore collect and transport pollutants
downstream from catchments. In many regions,nutrients coming from non-point (dispersed) sour-
ces add up to more than 50% of the total nutrientload. Prevention of nutrient export from landsca-
pes (see chapters 9.C, 10.A) is, therefore, neces-sary. The measures presented in this chapter pre-
vent transfer of pollutants downstream via riversystems. Lately it has been postulated that natu-
rally flooded areas with evolutionarily developedvegetation can be very effective for this purpose
(Science, 2002).
WHY ARE FLOODPLAINS IMPORTANT?Floods are a natural element of undisturbed hy-
drological cycles of rivers. Floods occur with va-rious frequencies, depending mostly on climatic
characteristics of a region. During these events,large amounts of matter and nutrients derived from
both landscape and riverbed erosion is depositedand retained in flooded areas. Consequently, flo-
odplains are usually enriched with the transportedmaterial and, at the same time, river waters are puri-fied by loss of this material. Floodplains can, therefo-
re, serve as natural cleaning systems for reducing su-spended matter, phosphorus, nitrogen and other nu-
trients and pollutants.Floodplains are also very effective systems for
retaining water. They can hold up to 1.5 milliongallons of floodwater per acre. If they are destroy-
ed, e.g., regulated and limited by engineeredstructures, the water that would have been con-
tained within them to prevent flooding can no lon-ger be stored effectively. This creates a flood risk
in areas located downstream.Preservation of natural, and restoration of degra-
ded, floodplains improves the quality of water andstabilizes hydrological parameters of rivers.
FLOODPLAINS ALONG A RIVER CONTINUUMA river system’s characteristics change considera-bly along its longitudinal dimension (see chapter 3.F).
Therefore, the role of floodplains also changes depen-ding on their location in the river continuum.
In the case of upland rivers, catchment slopesare usually steep and - especially in impermeable,
10.C FLOODPLAINS AND NATURAL WETLANDS: REDUCTION OF NUTRIENTTRANSPORT
e.g., rocky areas - the retention of water in land-scapes is often limited. In these cases, floodplains
usually play an important role as a flood preven-tion tool. Their limited capacity in terms of water
retention can be increased by dry pools. Thesecan be filled during a flood event. The role of
upland river floodplains in water quality improve-ment is less important than in lowland areas. Ste-
ep slopes usually restrict expansion of agricultureand, thus, the impact of these types of catchments
on water quality is often low, unless deforestationis occurring.
In the case of lowland rivers, floodplains play adouble role -as both water quality and quantitytools., They provide extensive areas for sedimen-tation of material transported from a catchment
as the area of floodplains is usually greater thanin upland rivers. Due to their diversified morpho-
logy and increased development of biomass, theyalso create conditions for a variety of other pro-
cesses that can purify flood waters. At the same time,water retention in a landscape reduces propagation of
flood waves downstream and reduces flood-inducedhydro-peaking and low flow periods.
WHAT PROCESSES CONTRIBUTE TO WATERQUALITY IMPROVEMENT IN FLOODPLAINS?Among the various processes taking part in nu-
trient retention in floodplains, the following arethe major ones:
sedimentation, filtration, and sorption of par-ticulate matter within wetlands due to long
Fig. 10.4Lowland river floodplain - the Pilica River, Poland
(photo: I.Wagner-Lotkowska)
VwerySmatrBook03.p65 2004-06-17, 17:37163
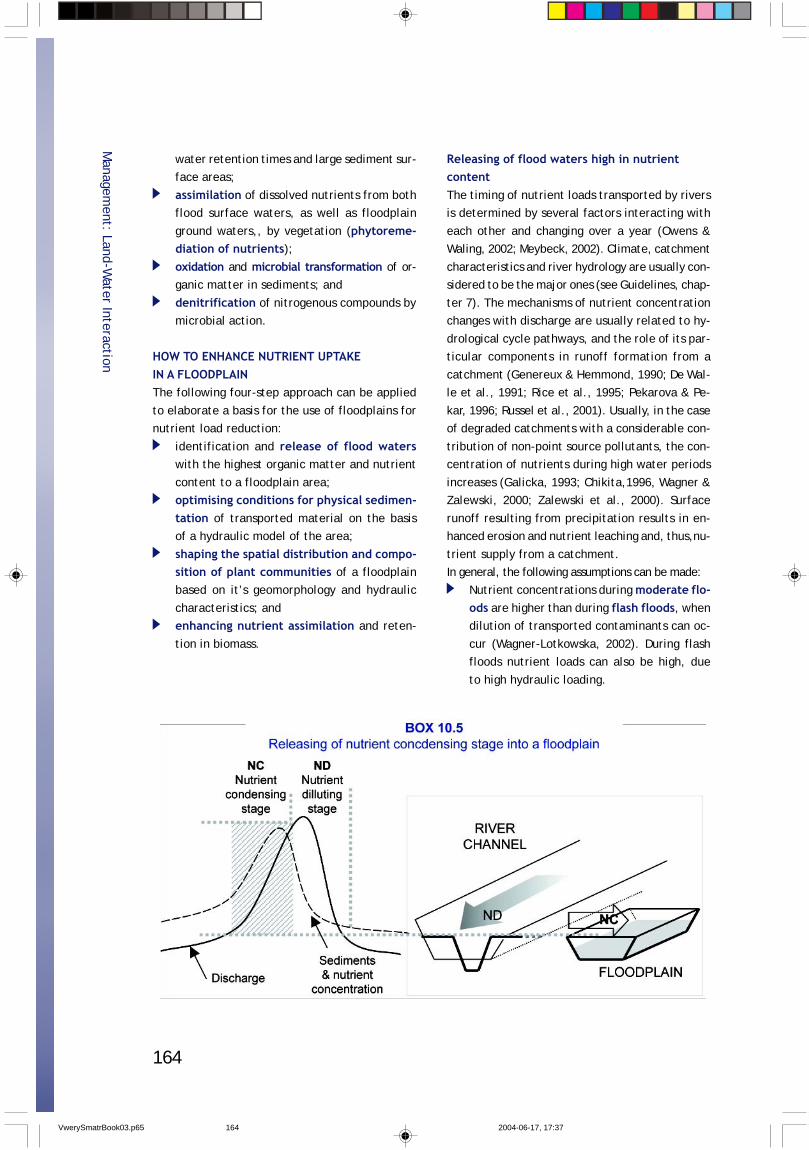
164
Managem
ent: Land-Water Interaction
water retention times and large sediment sur-face areas;
assimilation of dissolved nutrients from bothflood surface waters, as well as floodplain
ground waters,, by vegetation (phytoreme-diation of nutrients);oxidation and microbial transformation of or-ganic matter in sediments; and
denitrification of nitrogenous compounds bymicrobial action.
HOW TO ENHANCE NUTRIENT UPTAKEIN A FLOODPLAINThe following four-step approach can be applied
to elaborate a basis for the use of floodplains fornutrient load reduction:
identification and release of flood waterswith the highest organic matter and nutrient
content to a floodplain area;optimising conditions for physical sedimen-tation of transported material on the basisof a hydraulic model of the area;
shaping the spatial distribution and compo-sition of plant communities of a floodplainbased on it’s geomorphology and hydraulic
characteristics; andenhancing nutrient assimilation and reten-
tion in biomass.
Releasing of flood waters high in nutrientcontentThe timing of nutrient loads transported by riversis determined by several factors interacting with
each other and changing over a year (Owens &Waling, 2002; Meybeck, 2002). Climate, catchment
characteristics and river hydrology are usually con-sidered to be the major ones (see Guidelines, chap-
ter 7). The mechanisms of nutrient concentrationchanges with discharge are usually related to hy-
drological cycle pathways, and the role of its par-ticular components in runoff formation from a
catchment (Genereux & Hemmond, 1990; De Wal-le et al., 1991; Rice et al., 1995; Pekarova & Pe-
kar, 1996; Russel et al., 2001). Usually, in the caseof degraded catchments with a considerable con-
tribution of non-point source pollutants, the con-centration of nutrients during high water periods
increases (Galicka, 1993; Chikita,1996, Wagner &Zalewski, 2000; Zalewski et al., 2000). Surface
runoff resulting from precipitation results in en-hanced erosion and nutrient leaching and, thus,nu-
trient supply from a catchment.In general, the following assumptions can be made:
Nutrient concentrations during moderate flo-ods are higher than during flash floods, whendilution of transported contaminants can oc-
cur (Wagner-Lotkowska, 2002). During flashfloods nutrient loads can also be high, due
to high hydraulic loading.
VwerySmatrBook03.p65 2004-06-17, 17:37164
165
Managem
ent: Land-Water Interaction
Nutrient concentrations within a given riverare greater during frequent moderate flo-ods than during events of longer duration,lower variability and comparable hydraulic
load. Nutrient loads transported in the firstcase are usually higher (Wagner-Lotkowska,
2002).The highest nutrient concentrations and lo-
ads during medium floods occur during thefirst phase of a flood, while the flood wa-
ters are rising (nutrient-condensing stage).In this phase of a flood, nutrient loads trans
ported by a river are the highest (Wagner &Zalewski, 2000).
Before river discharge reaches its maximum,nutrient concentrations and loads start to
decrease and continue to decrease duringthe period following the flood peak (nutrient-dilution stage). The relationship betweennutrient concentration and discharge often
has the form of a clockwise hysteresis (Za-lewski et al. 2000).
According to the above assumptions, in order toimprove the quality of water, floodplains shouldbe designed to retain nutrient and contaminant
masses during the nutrient-condensing stage ofmoderate flow events (Box 10.5). Flooding can be
controlled by adjusting the height of the thresholdbetween a river and flooded area so that the in-
flow to the floodplain occurs at a specific levelwhen nutrient concentrations start to increase
during a rising hydrograph. This level should bedetermined empirically.
How to calculate nutrient loadA nutrient/pollutant load is the total amount ofthe nutrient/pollutant transported by a river, en-
tering/leaving a lake or reservoir via a river, orfrom a pollution source over time.
L = C * QL - nutrient/pollutant load [mg day-1]
C - concentration [mg L-1]Q - hydraulic load [L day-1]
Optimizing conditions for physical sedimentation
Morphology of a floodplain determines the hydrau-lics during inundation of an area. The hydraulics
determines not only water retention, but also abo-ut efficiency of sedimentation. Development of a
hydrodynamic model of a floodplain, or an areabeing considered for use as a tool to improve wa-
ter retention and quality, is important in the firststage of planning. Sedimentation can be enhan-
ced by modification of the physical structure ofan area and management of its vegetation cover.
Shaping the spatial distribution and compositionof plant communitiesUnderstanding and applying phytotechnologies onfloodplains is important for two reasons: first,vegetation distribution determines the hydraulicsof an area, and second, plant community compo-sition controls the efficiency of dissolved nutrientuptake and retention.Natural distribution and predomination of indivi-
dual plant species is to a great extent dependenton the frequency of inundation and groundwater
level (Box 10.6). Grass communities and rush ve-getation usually appear on the highest parts of a
floodplain. In periodically wet areas, hay meadowsoccur. Reedy rushes (e.g., Caricetum gracilis andCarrex vesicaria) occur in small mid-meadow hol-
lows. Common reeds (Phragmitetum australis),with common reeds (Phragmites australis) as the
dominant species, appear in places consistentlycovered by water, such as old river beds, where
they form extensive monotypic aggregations.Maintenance of this biodiversity enhances the eco-
logical stability of a floodplain ecosystem, as wellas the efficiency of purification. Each of the com-
munities is usually most effective in terms of bio-mass production and nutrient uptake under their
optimal conditions.
Enhancement of nutrient assimilation processesKnowing the potential capability of certain spe-
cies of specific plants to sequester nutrients isvery important for estimating the amount of nu-
trients that can be accumulated per surface unit.This capability depends on biomass productionand percentage of nutrient accumulation.As water and temperature are the major driving
forces for biological processes, the greatest incre-ase in biomass takes place in summer (temperate re-
VwerySmatrBook03.p65 2004-06-17, 17:37165
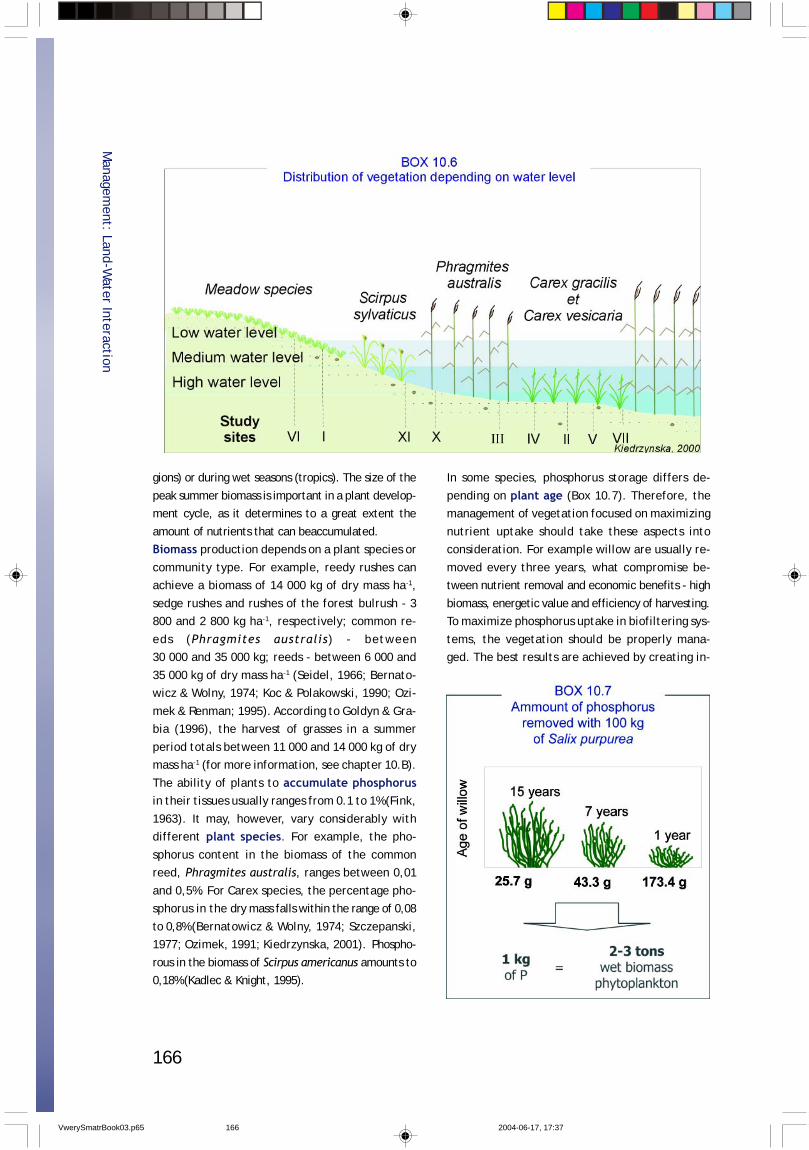
166
Managem
ent: Land-Water Interaction
gions) or during wet seasons (tropics). The size of the
peak summer biomass is important in a plant develop-ment cycle, as it determines to a great extent the
amount of nutrients that can beaccumulated.Biomass production depends on a plant species or
community type. For example, reedy rushes canachieve a biomass of 14 000 kg of dry mass ha-1,
sedge rushes and rushes of the forest bulrush - 3800 and 2 800 kg ha-1, respectively; common re-
eds (Phragmites australis) - between30 000 and 35 000 kg; reeds - between 6 000 and
35 000 kg of dry mass ha-1 (Seidel, 1966; Bernato-wicz & Wolny, 1974; Koc & Polakowski, 1990; Ozi-
mek & Renman; 1995). According to Goldyn & Gra-bia (1996), the harvest of grasses in a summer
period totals between 11 000 and 14 000 kg of drymass ha-1 (for more information, see chapter 10.B).
The ability of plants to accumulate phosphorusin their tissues usually ranges from 0.1 to 1% (Fink,
1963). It may, however, vary considerably withdifferent plant species. For example, the pho-
sphorus content in the biomass of the commonreed, Phragmites australis, ranges between 0,01
and 0,5%. For Carex species, the percentage pho-sphorus in the dry mass falls within the range of 0,08
to 0,8% (Bernatowicz & Wolny, 1974; Szczepanski,1977; Ozimek, 1991; Kiedrzynska, 2001). Phospho-
rous in the biomass of Scirpus americanus amounts to0,18% (Kadlec & Knight, 1995).
In some species, phosphorus storage differs de-
pending on plant age (Box 10.7). Therefore, themanagement of vegetation focused on maximizing
nutrient uptake should take these aspects intoconsideration. For example willow are usually re-
moved every three years, what compromise be-tween nutrient removal and economic benefits - high
biomass, energetic value and efficiency of harvesting.To maximize phosphorus uptake in biofiltering sys-
tems, the vegetation should be properly mana-ged. The best results are achieved by creating in-
VwerySmatrBook03.p65 2004-06-17, 17:37166
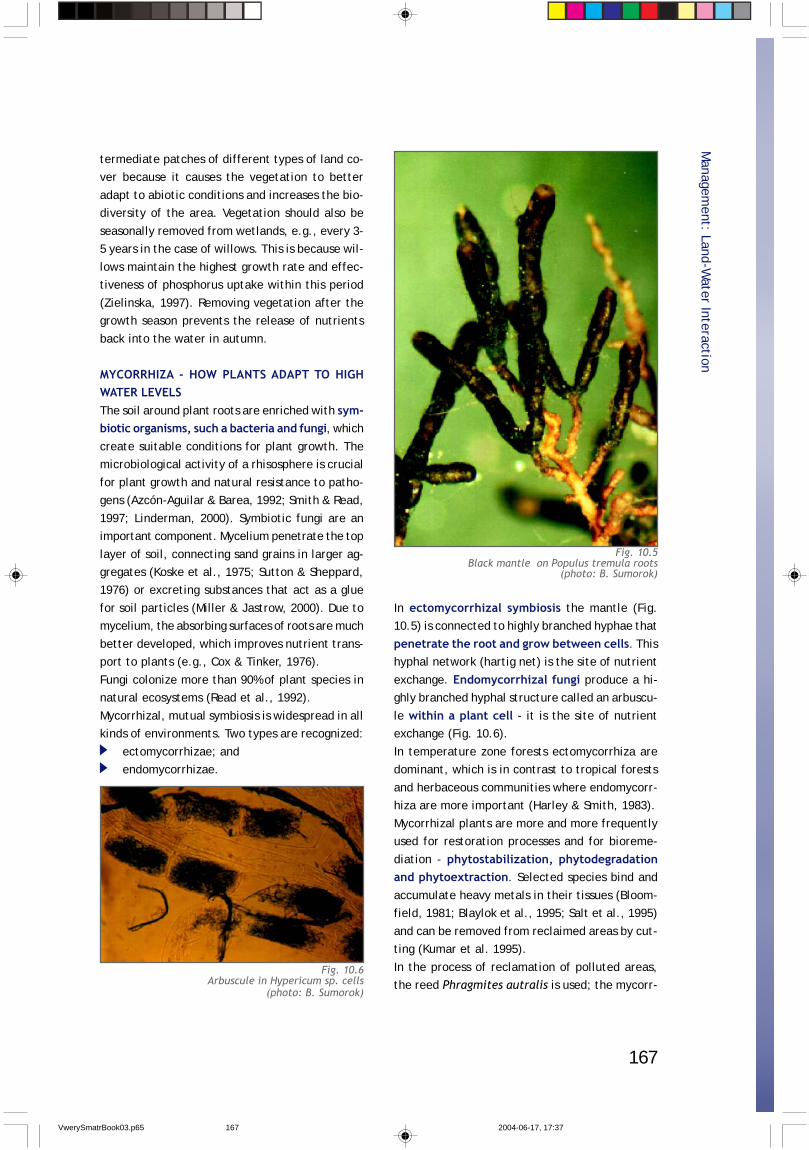
167
termediate patches of different types of land co-ver because it causes the vegetation to better
adapt to abiotic conditions and increases the bio-diversity of the area. Vegetation should also be
seasonally removed from wetlands, e.g., every 3-5 years in the case of willows. This is because wil-
lows maintain the highest growth rate and effec-tiveness of phosphorus uptake within this period
(Zielinska, 1997). Removing vegetation after thegrowth season prevents the release of nutrients
back into the water in autumn.
MYCORRHIZA - HOW PLANTS ADAPT TO HIGHWATER LEVELSThe soil around plant roots are enriched with sym-biotic organisms, such a bacteria and fungi, which
create suitable conditions for plant growth. Themicrobiological activity of a rhisosphere is crucial
for plant growth and natural resistance to patho-gens (Azcón-Aguilar & Barea, 1992; Smith & Read,
1997; Linderman, 2000). Symbiotic fungi are animportant component. Mycelium penetrate the top
layer of soil, connecting sand grains in larger ag-gregates (Koske et al., 1975; Sutton & Sheppard,1976) or excreting substances that act as a glue
for soil particles (Miller & Jastrow, 2000). Due tomycelium, the absorbing surfaces of roots are much
better developed, which improves nutrient trans-port to plants (e.g., Cox & Tinker, 1976).
Fungi colonize more than 90% of plant species innatural ecosystems (Read et al., 1992).
Mycorrhizal, mutual symbiosis is widespread in allkinds of environments. Two types are recognized:
ectomycorrhizae; andendomycorrhizae.
Managem
ent: Land-Water Interaction
In ectomycorrhizal symbiosis the mantle (Fig.10.5) is connected to highly branched hyphae that
penetrate the root and grow between cells. Thishyphal network (hartig net) is the site of nutrient
exchange. Endomycorrhizal fungi produce a hi-ghly branched hyphal structure called an arbuscu-
le within a plant cell - it is the site of nutrientexchange (Fig. 10.6).
In temperature zone forests ectomycorrhiza aredominant, which is in contrast to tropical forests
and herbaceous communities where endomycorr-hiza are more important (Harley & Smith, 1983).
Mycorrhizal plants are more and more frequentlyused for restoration processes and for bioreme-
diation - phytostabilization, phytodegradationand phytoextraction. Selected species bind and
accumulate heavy metals in their tissues (Bloom-field, 1981; Blaylok et al., 1995; Salt et al., 1995)
and can be removed from reclaimed areas by cut-ting (Kumar et al. 1995).
In the process of reclamation of polluted areas,the reed Phragmites autralis is used; the mycorr-
Fig. 10.6Arbuscule in Hypericum sp. cells
(photo: B. Sumorok)
Fig. 10.5Black mantle on Populus tremula roots
(photo: B. Sumorok)
VwerySmatrBook03.p65 2004-06-17, 17:37167
168
hizal status of this plant can vary from non-my-corrhizal to mycorrhizal (Harley & Harley, 1987;
Willby et al,. 2000, Oliveira et al., 2001). Theplants most frequently used as biofilters are dif-
ferent species and varieties of willow, which canbe either ecto- or endomicorrhizal (Harley & Har-
ley 1987).
RECOMMENDATIONS FOR PHYTOTECHNOLOGICALAPPLICATIONS IN FLOODPLAIN AREASResults obtained in the first year of implementa-tion of the UNESCO/UNEP Demonstration Project
on Application of Ecohydrology and Phytotechno-logy in IWM (Pilica River, Poland) provided infor-
mation on the application of phytotechnology infloodplain areas.
The following recommendations have been formu-lated for willow planting:
Recommendations for willow plantingonly extensive willow planting can be applied
in floodplain areas;no, or only shallow, ploughing is to be ap-
plied prior to establishment of willow pat-ches in order to minimize soil erosion andleaching of nutrients;
no fertilizers and other agents can be ap-plied so as to prevent an increase of eutro-
phication, or nutrient pollution;monocultures of energetic species can not
be planted in order to preserve the naturalbiodiversity in river corridors. The struc-
ture of patches of autochthonous vegeta-tion and autochthonous/energetic willows(if allowed in a given region) should be main-tained. Controlled patches of energetic wil
low should not exceed 30% of a floodplain
area. Results of research on the rate ofgrowth and phosphorus accumulation by va-
rious vegetation communities and willow spe-cies showed that application of various ve-
getation patches enhances phytoremediationprocesses. This results from adaptation and
optimum growth of particular species in va-rious environmental conditions. In order to
optimize biomass growth and phosphorus ac-cumulation, vegetation should be adapted
to the timing of flooding and number of dayswith high ground water and surface water
levels.
Socio-economic aspectsFloodplain areas are natural, self-sustaining sys-
tems where purification processes are driven bynatural forces. Combining water purification, due
to specific phytotechnologies like phytoextractionor rizodegradation, can not only solve specific
water pollution problems, but also provide otherbenefits. Using fast gowning plants (willows, re-
eds, or other native species in a region) can provi-de economic profits for local communities. Accor-ding to the ecohydrology concept, potential thre-
ats, e.g., water pollutants, can be converted intoopportunities such as energy sources. Biomass pro-
duction, which can be later utilized for bioener-gy, is such an example.
Development of the logistics for bioenergy utili-zation in a region can involve not only the biomass
produced on a floodplain, but also that from fore-stry and agricultural overproduction (e.g., strawsurplus). An alternative solution can be the intro-duction of specialized energy crops - especially
willow - in areas remote from river corridors.
Managem
ent: Land-Water Interaction
MAKE SURE TO CHECK THESE RESOURCES:
Guidelines: chapter 7
VwerySmatrBook03.p65 2004-06-17, 17:37168
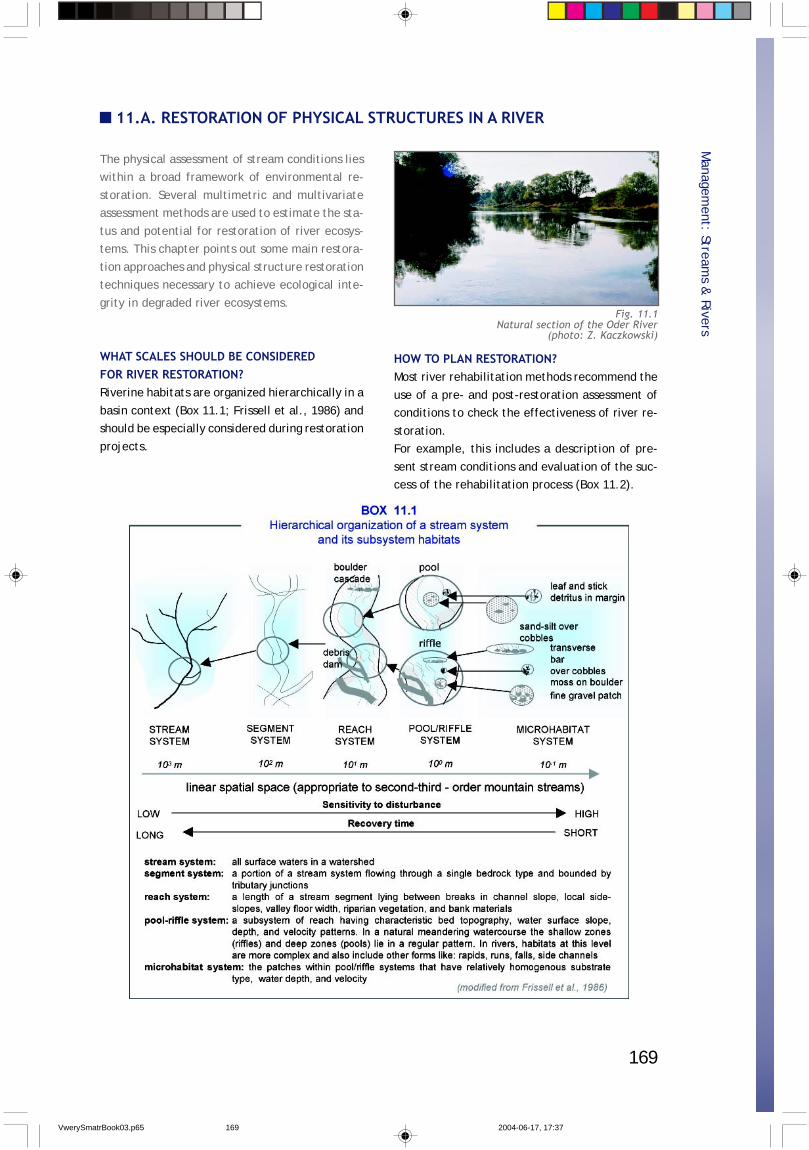
169
11.A. RESTORATION OF PHYSICAL STRUCTURES IN A RIVER
The physical assessment of stream conditions lieswithin a broad framework of environmental re-
storation. Several multimetric and multivariateassessment methods are used to estimate the sta-
tus and potential for restoration of river ecosys-tems. This chapter points out some main restora-
tion approaches and physical structure restorationtechniques necessary to achieve ecological inte-
grity in degraded river ecosystems.
WHAT SCALES SHOULD BE CONSIDEREDFOR RIVER RESTORATION?Riverine habitats are organized hierarchically in a
basin context (Box 11.1; Frissell et al., 1986) andshould be especially considered during restoration
projects.
Managem
ent: Streams &
Rivers
Fig. 11.1Natural section of the Oder River
(photo: Z. Kaczkowski)
HOW TO PLAN RESTORATION?Most river rehabilitation methods recommend the
use of a pre- and post-restoration assessment ofconditions to check the effectiveness of river re-
storation.For example, this includes a description of pre-
sent stream conditions and evaluation of the suc-cess of the rehabilitation process (Box 11.2).
VwerySmatrBook03.p65 2004-06-17, 17:37169
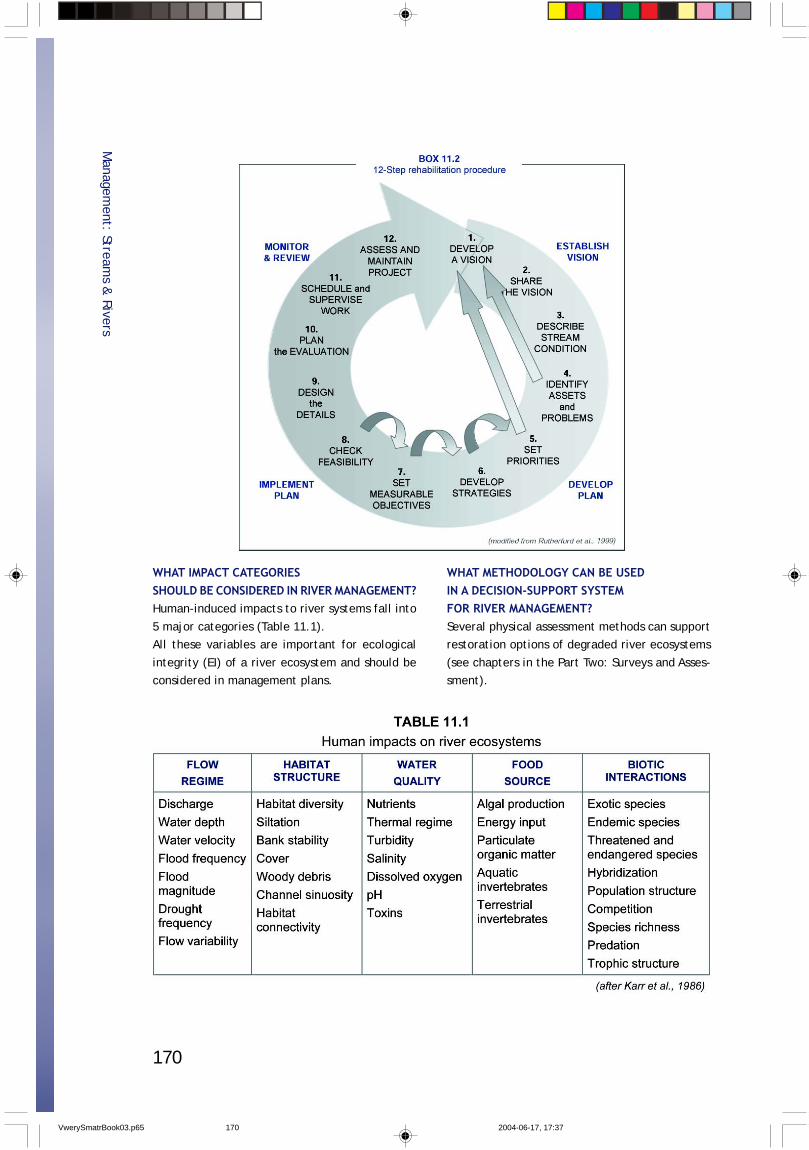
170
Managem
ent: Streams &
Rivers
WHAT IMPACT CATEGORIESSHOULD BE CONSIDERED IN RIVER MANAGEMENT?Human-induced impacts to river systems fall into
5 major categories (Table 11.1).All these variables are important for ecological
integrity (EI) of a river ecosystem and should beconsidered in management plans.
WHAT METHODOLOGY CAN BE USEDIN A DECISION-SUPPORT SYSTEMFOR RIVER MANAGEMENT?Several physical assessment methods can supportrestoration options of degraded river ecosystems
(see chapters in the Part Two: Surveys and Asses-sment).
VwerySmatrBook03.p65 2004-06-17, 17:37170
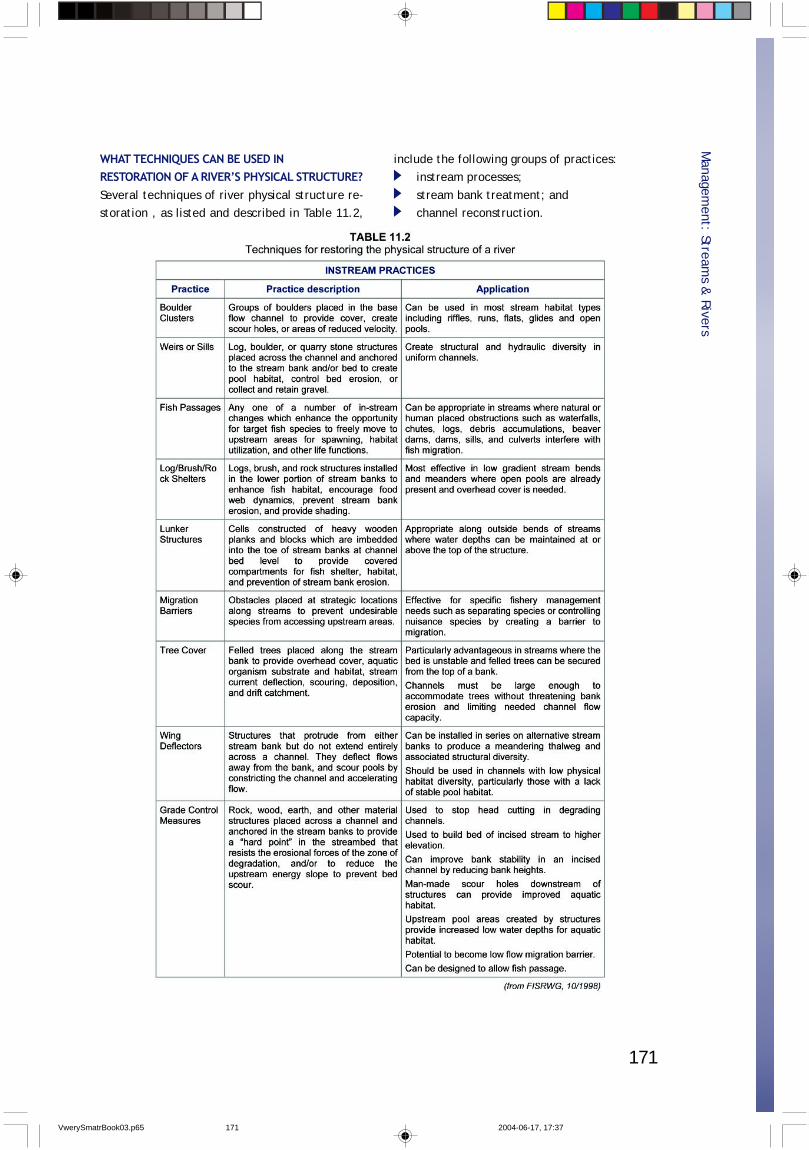
171
Managem
ent: Streams &
Rivers
WHAT TECHNIQUES CAN BE USED INRESTORATION OF A RIVER’S PHYSICAL STRUCTURE?Several techniques of river physical structure re-storation , as listed and described in Table 11.2,
include the following groups of practices:instream processes;
stream bank treatment; andchannel reconstruction.
VwerySmatrBook03.p65 2004-06-17, 17:37171
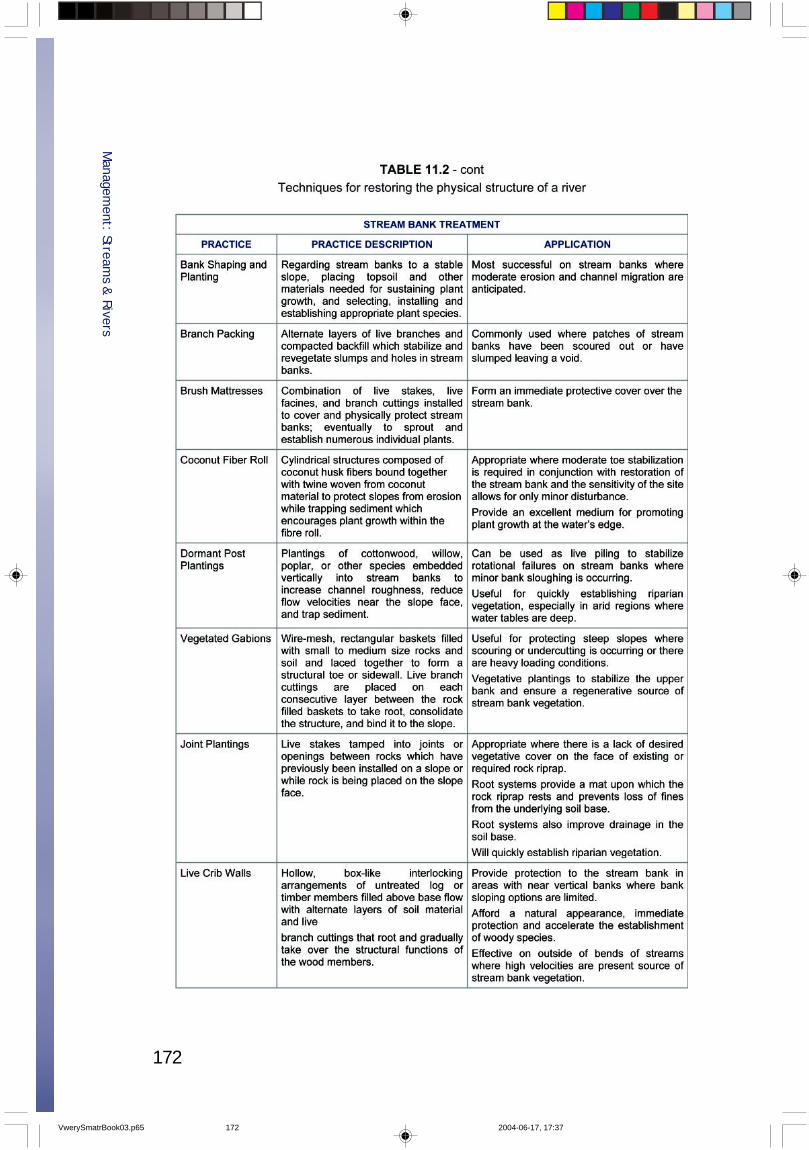
172
Managem
ent: Streams &
Rivers
VwerySmatrBook03.p65 2004-06-17, 17:37172
173
Managem
ent: Streams &
Rivers
VwerySmatrBook03.p65 2004-06-17, 17:37173
174
Managem
ent: Streams &
Rivers
MAKE SURE TO CHECK THESE RESOURCES:
Guidelines: chapter 6
VwerySmatrBook03.p65 2004-06-17, 17:38174
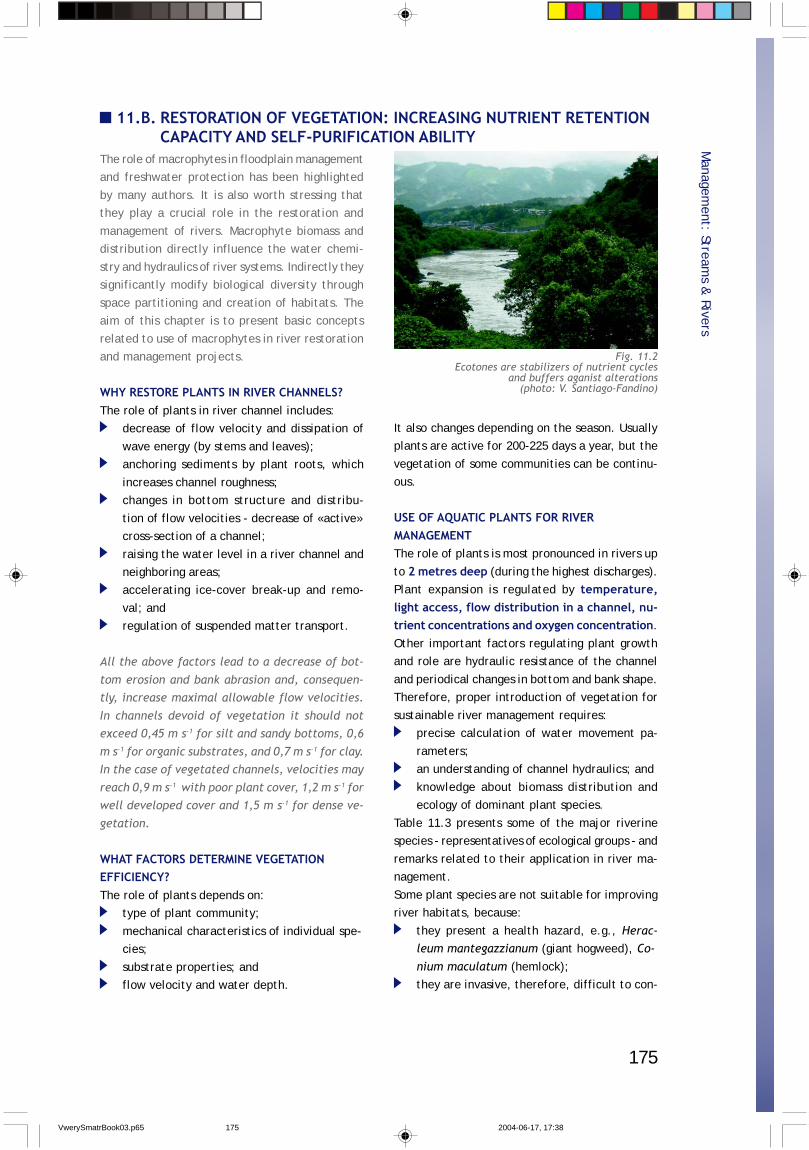
175
11.B. RESTORATION OF VEGETATION: INCREASING NUTRIENT RETENTIONCAPACITY AND SELF-PURIFICATION ABILITY
The role of macrophytes in floodplain managementand freshwater protection has been highlighted
by many authors. It is also worth stressing thatthey play a crucial role in the restoration and
management of rivers. Macrophyte biomass anddistribution directly influence the water chemi-
stry and hydraulics of river systems. Indirectly theysignificantly modify biological diversity through
space partitioning and creation of habitats. Theaim of this chapter is to present basic concepts
related to use of macrophytes in river restorationand management projects.
WHY RESTORE PLANTS IN RIVER CHANNELS?The role of plants in river channel includes:
decrease of flow velocity and dissipation of
wave energy (by stems and leaves);anchoring sediments by plant roots, which
increases channel roughness;changes in bottom structure and distribu-
tion of flow velocities - decrease of «active»cross-section of a channel;
raising the water level in a river channel andneighboring areas;accelerating ice-cover break-up and remo-
val; andregulation of suspended matter transport.
All the above factors lead to a decrease of bot-
tom erosion and bank abrasion and, consequen-tly, increase maximal allowable flow velocities.
In channels devoid of vegetation it should notexceed 0,45 m s-1 for silt and sandy bottoms, 0,6
m s-1 for organic substrates, and 0,7 m s-1 for clay.In the case of vegetated channels, velocities may
reach 0,9 m s-1 with poor plant cover, 1,2 m s-1 forwell developed cover and 1,5 m s-1 for dense ve-
getation.
WHAT FACTORS DETERMINE VEGETATIONEFFICIENCY?The role of plants depends on:
type of plant community;
mechanical characteristics of individual spe-cies;
substrate properties; andflow velocity and water depth.
It also changes depending on the season. Usuallyplants are active for 200-225 days a year, but the
vegetation of some communities can be continu-ous.
USE OF AQUATIC PLANTS FOR RIVERMANAGEMENTThe role of plants is most pronounced in rivers up
to 2 metres deep (during the highest discharges).Plant expansion is regulated by temperature,light access, flow distribution in a channel, nu-trient concentrations and oxygen concentration.
Other important factors regulating plant growthand role are hydraulic resistance of the channel
and periodical changes in bottom and bank shape.Therefore, proper introduction of vegetation for
sustainable river management requires:precise calculation of water movement pa-
rameters;an understanding of channel hydraulics; and
knowledge about biomass distribution andecology of dominant plant species.
Table 11.3 presents some of the major riverinespecies - representatives of ecological groups - and
remarks related to their application in river ma-nagement.
Some plant species are not suitable for improvingriver habitats, because:
they present a health hazard, e.g., Herac-leum mantegazzianum (giant hogweed), Co-
nium maculatum (hemlock);they are invasive, therefore, difficult to con-
Managem
ent: Streams &
Rivers
Fig. 11.2Ecotones are stabilizers of nutrient cycles
and buffers aganist alterations(photo: V. Santiago-Fandino)
VwerySmatrBook03.p65 2004-06-17, 17:38175
176
trol, e.g., Reynoutria japonica (Japanese kno-tweed), Stratiotes aloides (water soldier), Im-
patiens glandulifera (Himalayan balam), Nym-phoides peltata (fringed water lily); and
Phragmites australis (Norfolk reed), Typhalatifolia (bullrush) are suitable only for large
rivers (NRA Severn-Trent Region).
MAINTENANCEThe role of plants, as components modifying and
preparing in-stream conditions for organisms, issometimes questioned because they may decrease
channel flow capacity and increase the risk of floods.
What has to be considered before plant remo-val?Decisions about mechanical removal of plants sho-uld be taken carefully after analyzing:
possible threat of valley flooding if existingvegetation is left undisturbed;
retentiveness of river bed and valley duringrising discharges;
water levels at which plants are removedfrom the channel by currents; and
natural mechanisms limiting plant growth andexpansion.
Also very important is an assessment of the influ-ence of chemical and mechanical plant removal
methods on the microflora and microfauna, mat-ter accumulation and rate of biomass decay. Even-
tually these processes may lead to ecological ca-tastrophes downstream due to oxygen depletion
and degradation of habitats.
What are the advantages of vegetation control?In some situations it is impossible to avoid main-
taining removal operations. Control of in-streamvegetation is important because:
it stops the rise of water level caused byflow impedance;
it opens areas of clear water important fororganisms, habitat diversity and users of wa-
ter bodies; andin autumn it prevents the blockage of cu-
lverts, pumps and sluices with washed-outplants.
Control of riparian vegetation:encourages root development - enhance-ment of bank stability;
prevents invasion of shrubs;
Managem
ent: Streams &
Rivers
VwerySmatrBook03.p65 2004-06-17, 17:38176
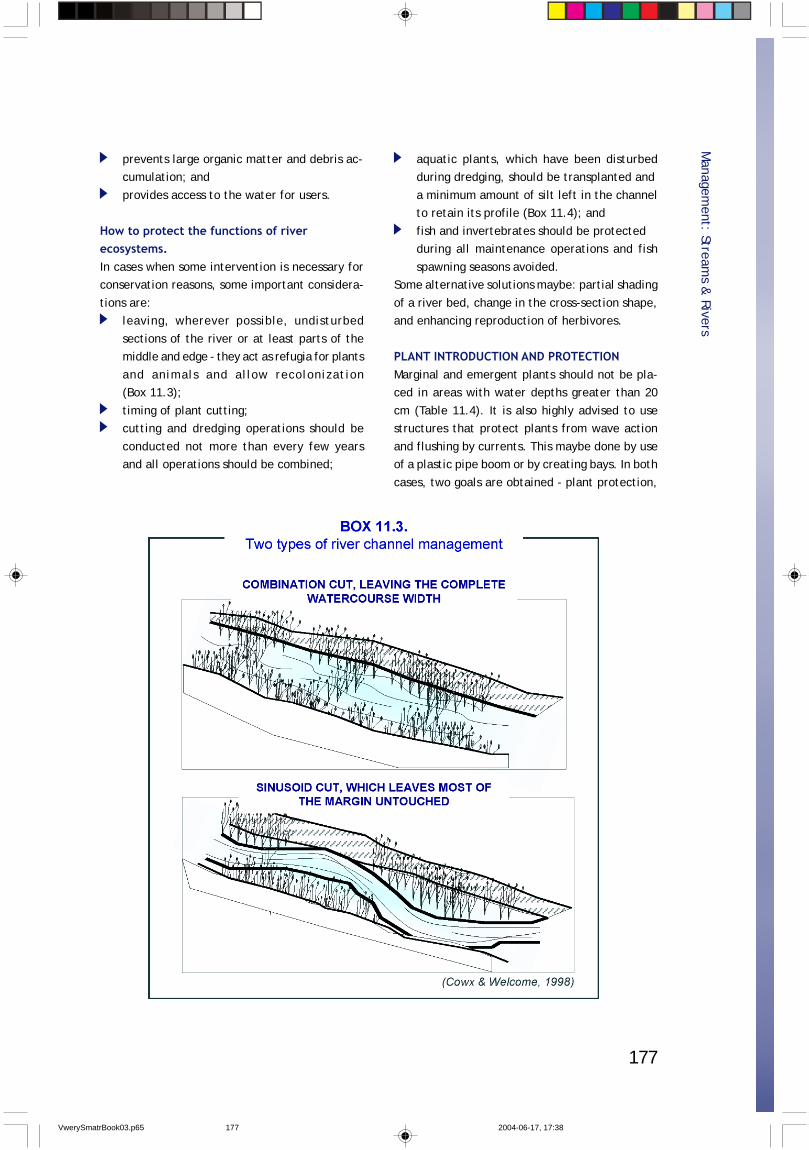
177
prevents large organic matter and debris ac-cumulation; and
provides access to the water for users.
How to protect the functions of riverecosystems.In cases when some intervention is necessary forconservation reasons, some important considera-
tions are:leaving, wherever possible, undisturbed
sections of the river or at least parts of themiddle and edge - they act as refugia for plants
and animals and allow recolonization(Box 11.3);
timing of plant cutting;cutting and dredging operations should be
conducted not more than every few yearsand all operations should be combined;
aquatic plants, which have been disturbedduring dredging, should be transplanted and
a minimum amount of silt left in the channelto retain its profile (Box 11.4); and
fish and invertebrates should be protectedduring all maintenance operations and fish
spawning seasons avoided.Some alternative solutions maybe: partial shading
of a river bed, change in the cross-section shape,and enhancing reproduction of herbivores.
PLANT INTRODUCTION AND PROTECTIONMarginal and emergent plants should not be pla-ced in areas with water depths greater than 20
cm (Table 11.4). It is also highly advised to usestructures that protect plants from wave action
and flushing by currents. This maybe done by useof a plastic pipe boom or by creating bays. In both
cases, two goals are obtained - plant protection,
Managem
ent: Streams &
Rivers
VwerySmatrBook03.p65 2004-06-17, 17:38177
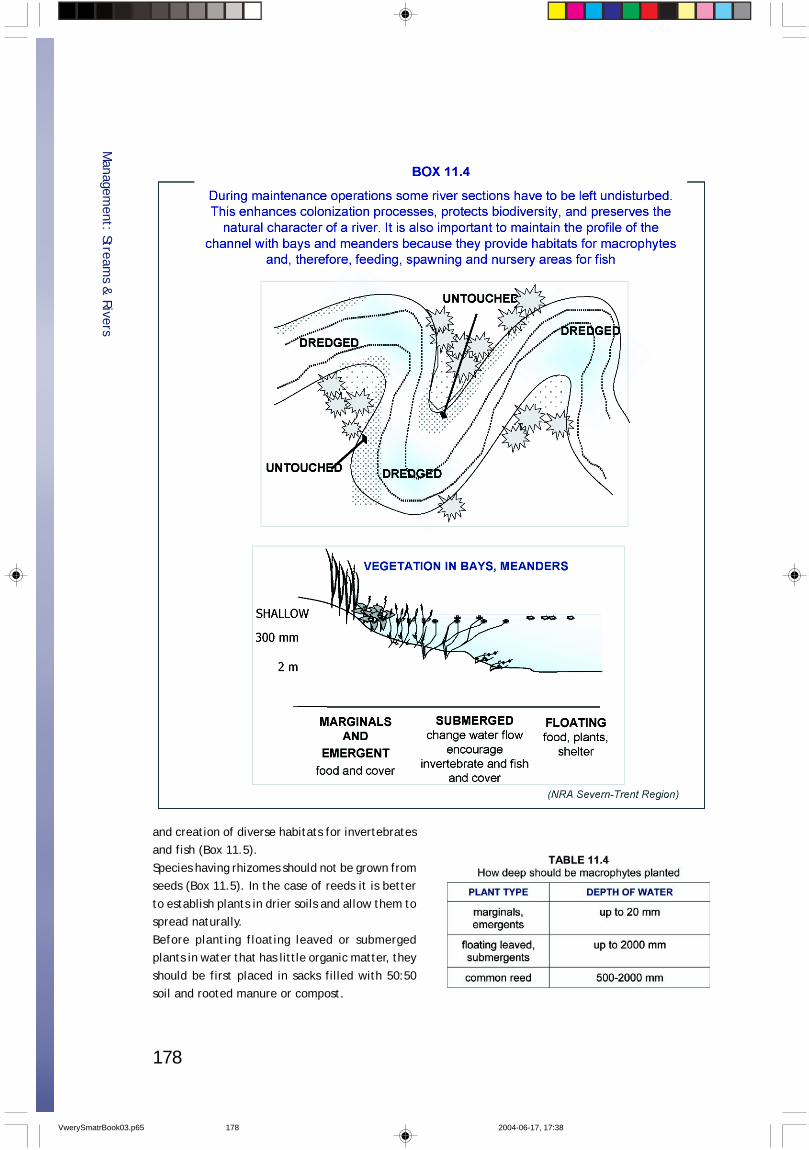
178
and creation of diverse habitats for invertebratesand fish (Box 11.5).
Species having rhizomes should not be grown fromseeds (Box 11.5). In the case of reeds it is better
to establish plants in drier soils and allow them tospread naturally.
Before planting floating leaved or submergedplants in water that has little organic matter, they
should be first placed in sacks filled with 50:50soil and rooted manure or compost.
Managem
ent: Streams &
Rivers
VwerySmatrBook03.p65 2004-06-17, 17:38178
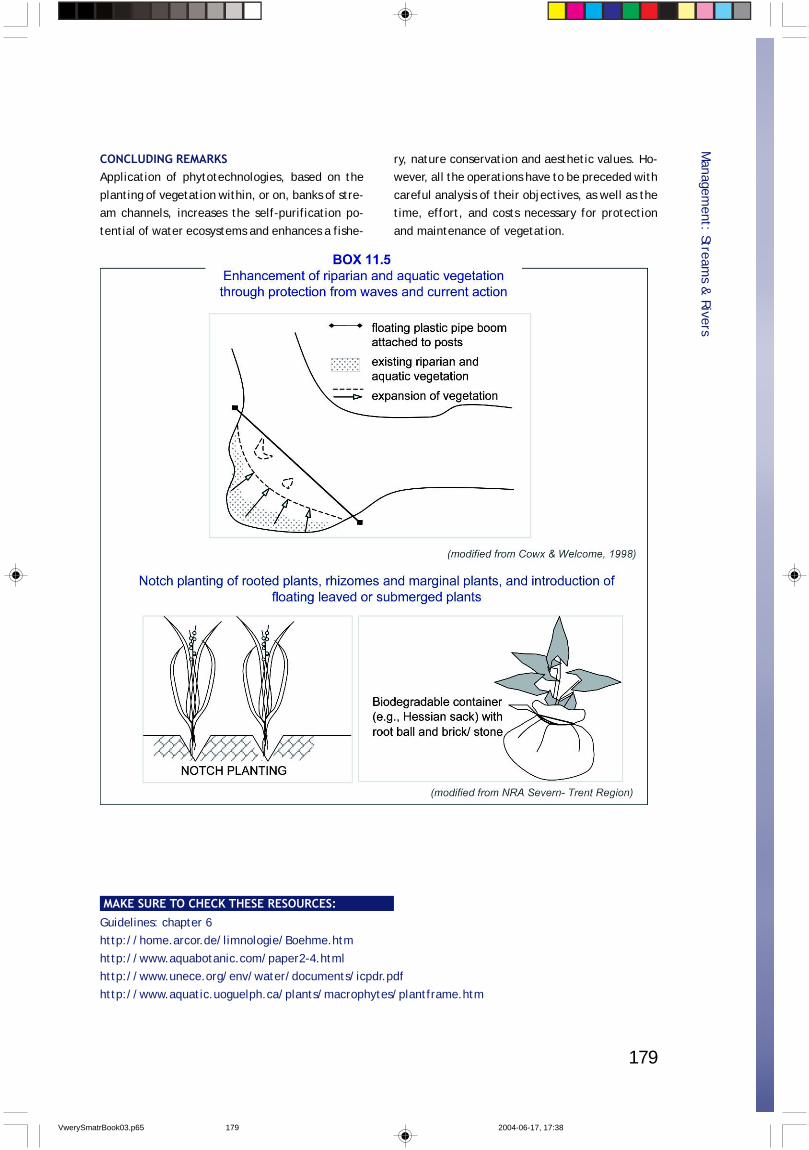
179
CONCLUDING REMARKSApplication of phytotechnologies, based on the
planting of vegetation within, or on, banks of stre-am channels, increases the self-purification po-
tential of water ecosystems and enhances a fishe-
Managem
ent: Streams &
Rivers
MAKE SURE TO CHECK THESE RESOURCES:
ry, nature conservation and aesthetic values. Ho-wever, all the operations have to be preceded with
careful analysis of their objectives, as well as thetime, effort, and costs necessary for protection
and maintenance of vegetation.
Guidelines: chapter 6http://home.arcor.de/limnologie/Boehme.htm
http://www.aquabotanic.com/paper2-4.htmlhttp://www.unece.org/env/water/documents/icpdr.pdf
http://www.aquatic.uoguelph.ca/plants/macrophytes/plantframe.htm
VwerySmatrBook03.p65 2004-06-17, 17:38179
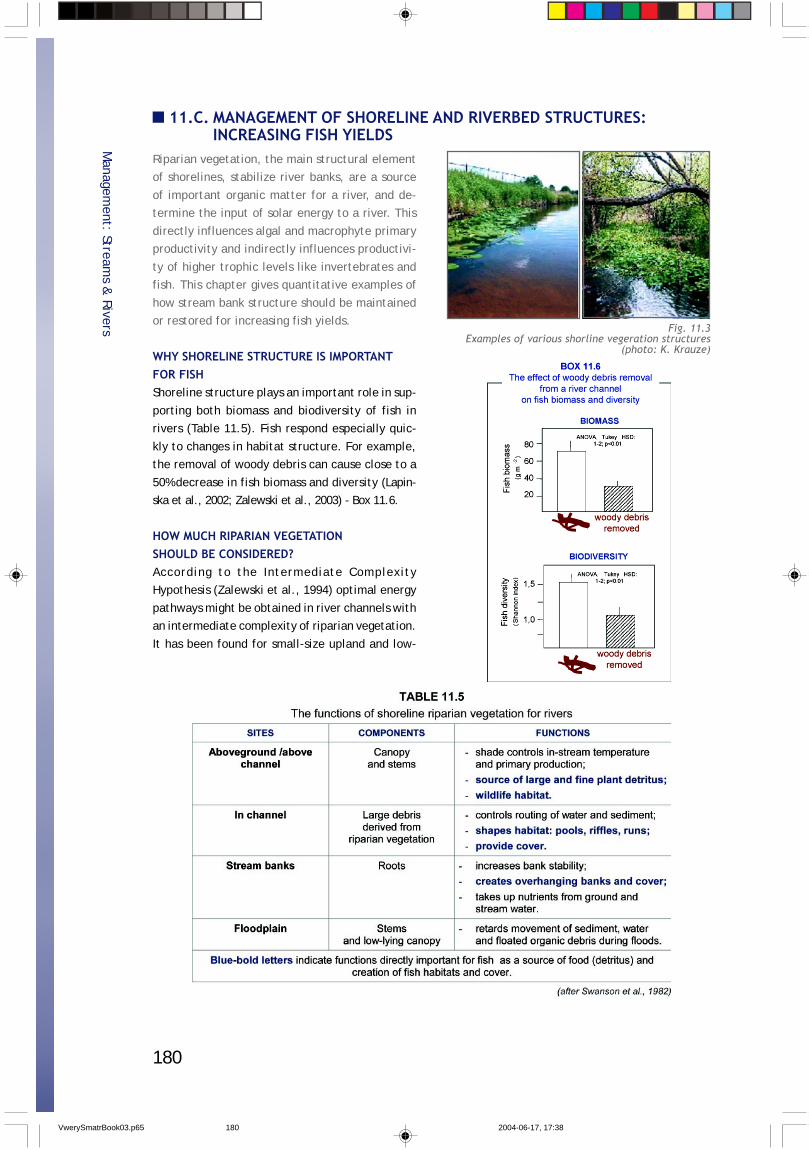
180
11.C. MANAGEMENT OF SHORELINE AND RIVERBED STRUCTURES:INCREASING FISH YIELDS
Riparian vegetation, the main structural elementof shorelines, stabilize river banks, are a source
of important organic matter for a river, and de-termine the input of solar energy to a river. This
directly influences algal and macrophyte primaryproductivity and indirectly influences productivi-
ty of higher trophic levels like invertebrates andfish. This chapter gives quantitative examples of
how stream bank structure should be maintainedor restored for increasing fish yields.
WHY SHORELINE STRUCTURE IS IMPORTANTFOR FISHShoreline structure plays an important role in sup-
porting both biomass and biodiversity of fish inrivers (Table 11.5). Fish respond especially quic-
kly to changes in habitat structure. For example,the removal of woody debris can cause close to a
50% decrease in fish biomass and diversity (Lapin-ska et al., 2002; Zalewski et al., 2003) - Box 11.6.
HOW MUCH RIPARIAN VEGETATIONSHOULD BE CONSIDERED?According to the Intermediate ComplexityHypothesis (Zalewski et al., 1994) optimal energy
pathways might be obtained in river channels withan intermediate complexity of riparian vegetation.
It has been found for small-size upland and low-
Managem
ent: Streams &
Rivers Fig. 11.3Examples of various shorline vegeration structures
(photo: K. Krauze)
VwerySmatrBook03.p65 2004-06-17, 17:38180
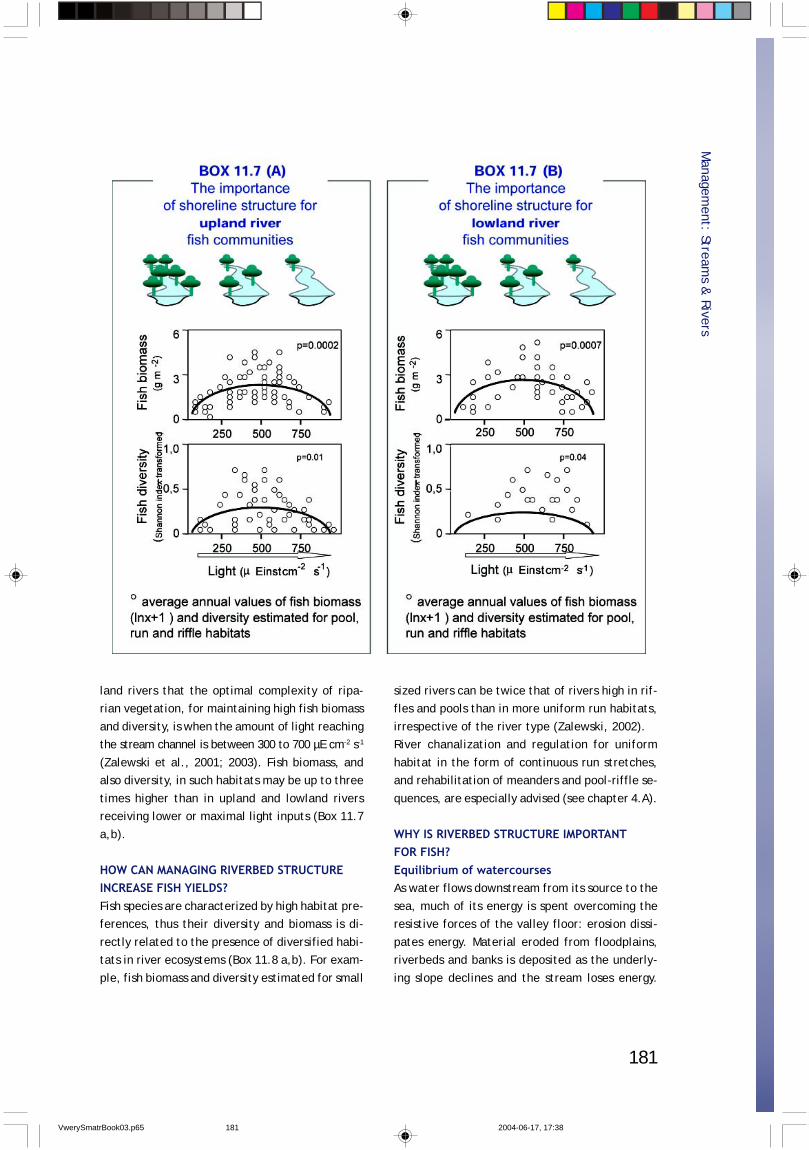
181
land rivers that the optimal complexity of ripa-rian vegetation, for maintaining high fish biomass
and diversity, is when the amount of light reachingthe stream channel is between 300 to 700 µE cm-2 s-1
(Zalewski et al., 2001; 2003). Fish biomass, andalso diversity, in such habitats may be up to three
times higher than in upland and lowland riversreceiving lower or maximal light inputs (Box 11.7
a,b).
HOW CAN MANAGING RIVERBED STRUCTUREINCREASE FISH YIELDS?Fish species are characterized by high habitat pre-ferences, thus their diversity and biomass is di-
rectly related to the presence of diversified habi-tats in river ecosystems (Box 11.8 a,b). For exam-
ple, fish biomass and diversity estimated for small
sized rivers can be twice that of rivers high in rif-fles and pools than in more uniform run habitats,
irrespective of the river type (Zalewski, 2002).River chanalization and regulation for uniform
habitat in the form of continuous run stretches,and rehabilitation of meanders and pool-riffle se-
quences, are especially advised (see chapter 4.A).
WHY IS RIVERBED STRUCTURE IMPORTANTFOR FISH?Equilibrium of watercoursesAs water flows downstream from its source to the
sea, much of its energy is spent overcoming theresistive forces of the valley floor: erosion dissi-
pates energy. Material eroded from floodplains,riverbeds and banks is deposited as the underly-
ing slope declines and the stream loses energy.
Managem
ent: Streams &
Rivers
VwerySmatrBook03.p65 2004-06-17, 17:38181
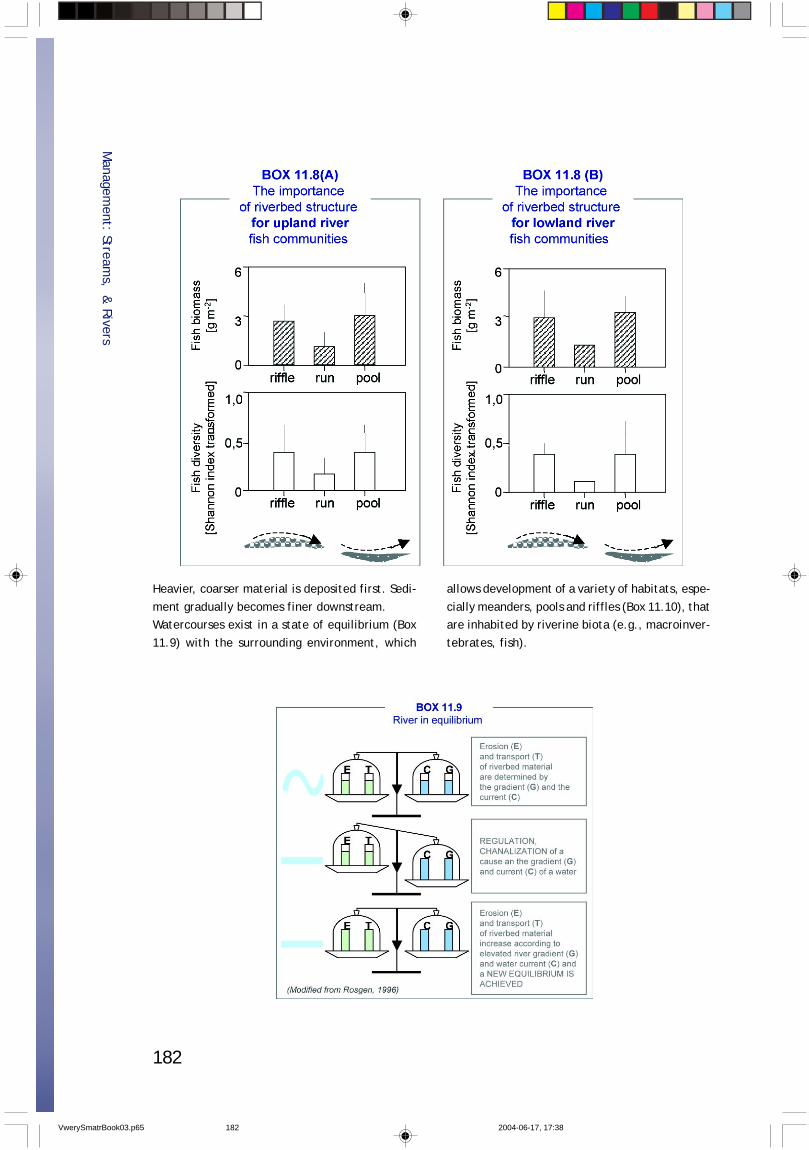
182
Heavier, coarser material is deposited first. Sedi-
ment gradually becomes finer downstream.Watercourses exist in a state of equilibrium (Box
11.9) with the surrounding environment, which
Managem
ent: Streams, &
Rivers
allows development of a variety of habitats, espe-
cially meanders, pools and riffles (Box 11.10), thatare inhabited by riverine biota (e.g., macroinver-
tebrates, fish).
VwerySmatrBook03.p65 2004-06-17, 17:38182
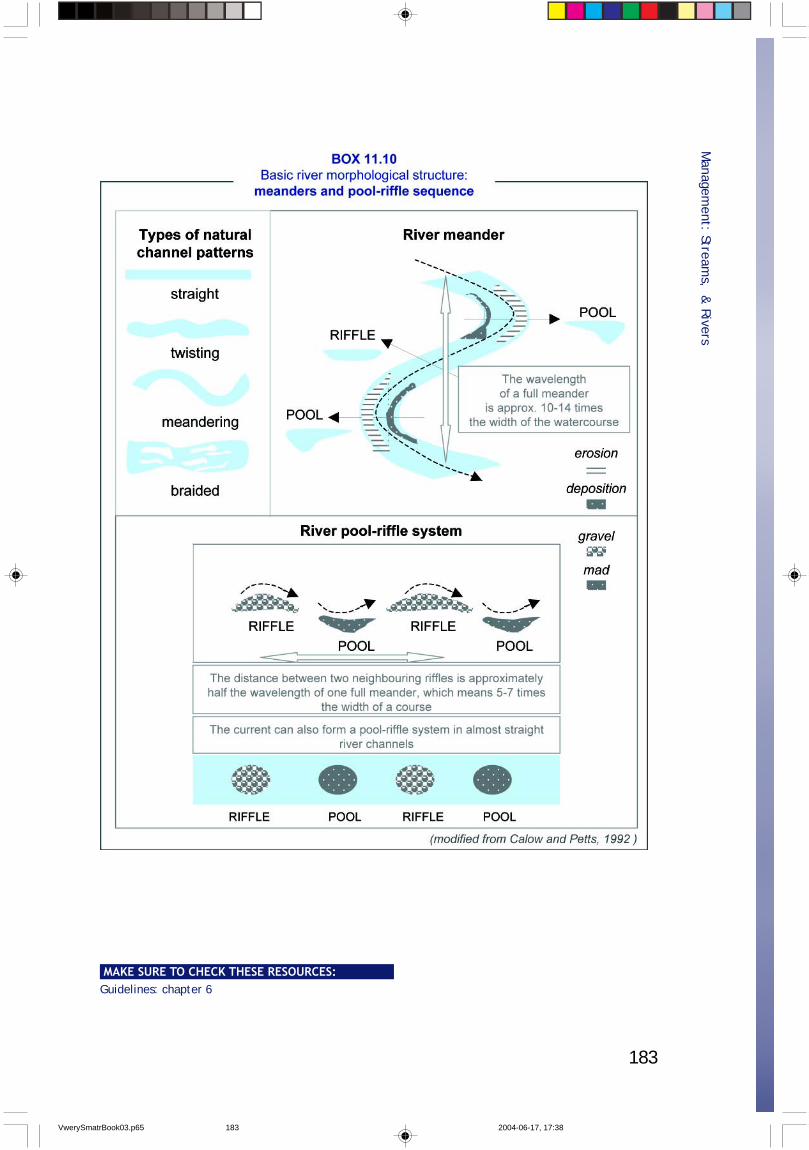
183
Managem
ent: Streams, &
Rivers
MAKE SURE TO CHECK THESE RESOURCES:Guidelines: chapter 6
VwerySmatrBook03.p65 2004-06-17, 17:38183
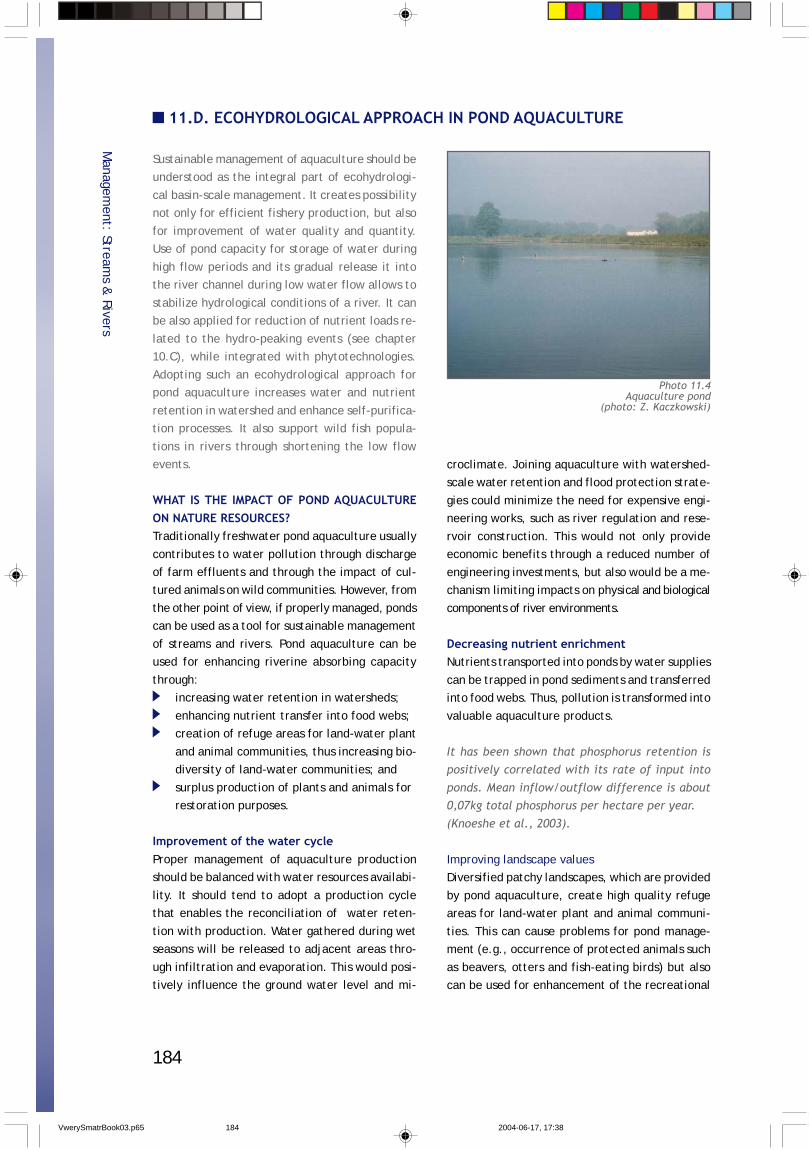
184
Sustainable management of aquaculture should beunderstood as the integral part of ecohydrologi-
cal basin-scale management. It creates possibilitynot only for efficient fishery production, but also
for improvement of water quality and quantity.Use of pond capacity for storage of water during
high flow periods and its gradual release it intothe river channel during low water flow allows to
stabilize hydrological conditions of a river. It canbe also applied for reduction of nutrient loads re-
lated to the hydro-peaking events (see chapter10.C), while integrated with phytotechnologies.
Adopting such an ecohydrological approach forpond aquaculture increases water and nutrient
retention in watershed and enhance self-purifica-tion processes. It also support wild fish popula-
tions in rivers through shortening the low flowevents.
WHAT IS THE IMPACT OF POND AQUACULTUREON NATURE RESOURCES?Traditionally freshwater pond aquaculture usually
contributes to water pollution through dischargeof farm effluents and through the impact of cul-tured animals on wild communities. However, from
the other point of view, if properly managed, pondscan be used as a tool for sustainable management
of streams and rivers. Pond aquaculture can beused for enhancing riverine absorbing capacity
through:increasing water retention in watersheds;
enhancing nutrient transfer into food webs;creation of refuge areas for land-water plant
and animal communities, thus increasing bio-diversity of land-water communities; and
surplus production of plants and animals forrestoration purposes.
Improvement of the water cycleProper management of aquaculture productionshould be balanced with water resources availabi-
lity. It should tend to adopt a production cyclethat enables the reconciliation of water reten-
tion with production. Water gathered during wetseasons will be released to adjacent areas thro-
ugh infiltration and evaporation. This would posi-tively influence the ground water level and mi-
11.D. ECOHYDROLOGICAL APPROACH IN POND AQUACULTURE
croclimate. Joining aquaculture with watershed-scale water retention and flood protection strate-
gies could minimize the need for expensive engi-neering works, such as river regulation and rese-
rvoir construction. This would not only provideeconomic benefits through a reduced number of
engineering investments, but also would be a me-chanism limiting impacts on physical and biological
components of river environments.
Decreasing nutrient enrichmentNutrients transported into ponds by water supplies
can be trapped in pond sediments and transferredinto food webs. Thus, pollution is transformed into
valuable aquaculture products.
It has been shown that phosphorus retention ispositively correlated with its rate of input into
ponds. Mean inflow/outflow difference is about0,07kg total phosphorus per hectare per year.
(Knoeshe et al., 2003).
Improving landscape valuesDiversified patchy landscapes, which are provided
by pond aquaculture, create high quality refugeareas for land-water plant and animal communi-
ties. This can cause problems for pond manage-ment (e.g., occurrence of protected animals such
as beavers, otters and fish-eating birds) but alsocan be used for enhancement of the recreational
Managem
ent: Streams &
Rivers
Photo 11.4Aquaculture pond
(photo: Z. Kaczkowski)
VwerySmatrBook03.p65 2004-06-17, 17:38184
185
value of a given area. This in turn should increaselocal labour demand and provide additional inco-
me from recreation. Such simultaneous existenceof a sustainable fishery and wildlife is possible
when management scenarios, balanced betweenaquaculture production and nature protection
needs, are created.
Active protection of animals and plantsAquaculture facilities can also be incorporated into
active protection of animals and plants (see Gu-idelines, chapter 6). At present this is especially
important for protecting heavily exploited fishstocks or stocks threatened with a disrupted re-
cruitment cycle (e.g., lack of spawning habitats).Additional production of fish for stocking purpo-
ses can significantly increase the financial effi-ciency of production when compared to typical
market production (e.g., polyculture of ide, Leuci-scus idus L., with carp in Poland).
WHAT PROBLEMS CAN BE EXPECTED?The main problem is to reconcile the goal of aqu-aculture, production and income enhancement,with increased environmental awareness and wa-
tershed management needs. This means that achie-ving the sustainable ecohydrological development
of aquaculture is possible only when producers aresupported with scientific information and additio-
nal financial funds for investments are available.Such help should be provided by local or central
governments and should be planned as a part ofwatershed protection scenarios. The most valu-
able help would be supporting the developmentof recreational attributes of a given facility. Some
possibilities are commercial fisheries, places forbird watching, hunting and water sports.
THREATS TO THE ENVIRONMENTUnsustainable freshwater pond aquaculture cancontribute to water pollution through discharge
of fish farm effluents and the impact of culturedanimals on wild communities. Usually the impact
of wastewaters created by pond aquaculture is li-mited mostly to the period of drying and harve-
sting the fish. This pollution is related especiallyto the bottom layer of water (0 - 0,25 m above
the sediments), which takes on the quality of ho-usehold sewage and mostly consists of suspended
solids and different forms of nitrate and phosphorus.Wastewater quality can be specific to a given cul-
ture through introduced substances such as anti-biotics, feeds and other chemical substances.
Other kinds of pollution connected with culturedanimals that can threaten native communities are
introduction of non-native species, genetic impactson native populations or transfer of diseases and
parasites. Escaped cultured animals can influence na-tive populations also through predation and competi-
tion for food and space (see Guideline, chapter 6).
HOW TO MITIGATE THE THREATS?Fish farm effluents should be brought into areas
covered by sedimentation pools and artificial we-tlands (Box 11.11):
the outflow of sediment can be regulatedby flow speed. The threshold flow speed
to minimize sediment outflow is 50 mm s-1
(180 m h-1) - Imhoff & Imhoff, 1982;
specific weight of suspended solids for ef-fluents from fishery facilities range between1,00 and 1,20 N m-3 (Karpinski, 1999). For very
small flock solids the flow limit is 72 mm h-1
(Table 11.6);
fish faeces sedimentation reaches 90% if flowspeed is lower than 0,033 m s-1 (Jenssen,
1972). This process is more effective if efflu-ents have low turbidity, which prevents crum
bling of faecal flocks; andthe best results for enhancing suspended
solids retention are achieved if water retention time is at its highest and the flow (V) atits lowest. Estimation of these two valuescan be calculated from the following equ-
ation:
where:V (m h-1) = flow (m3 h-1) / transverse surface profi-
le of the sedimentation pool (m2).For example, to achieve good results, a well desi-
gned sediment pools for flow of 250 L s-1 shouldcover an area of 1100 m2 (Karpinski, 1999).
Managem
ent: Streams &
Rivers
Water Retention Time (h) =volume of sedimentary pool (m3) / flow(m3h-1)
VwerySmatrBook03.p65 2004-06-17, 17:38185
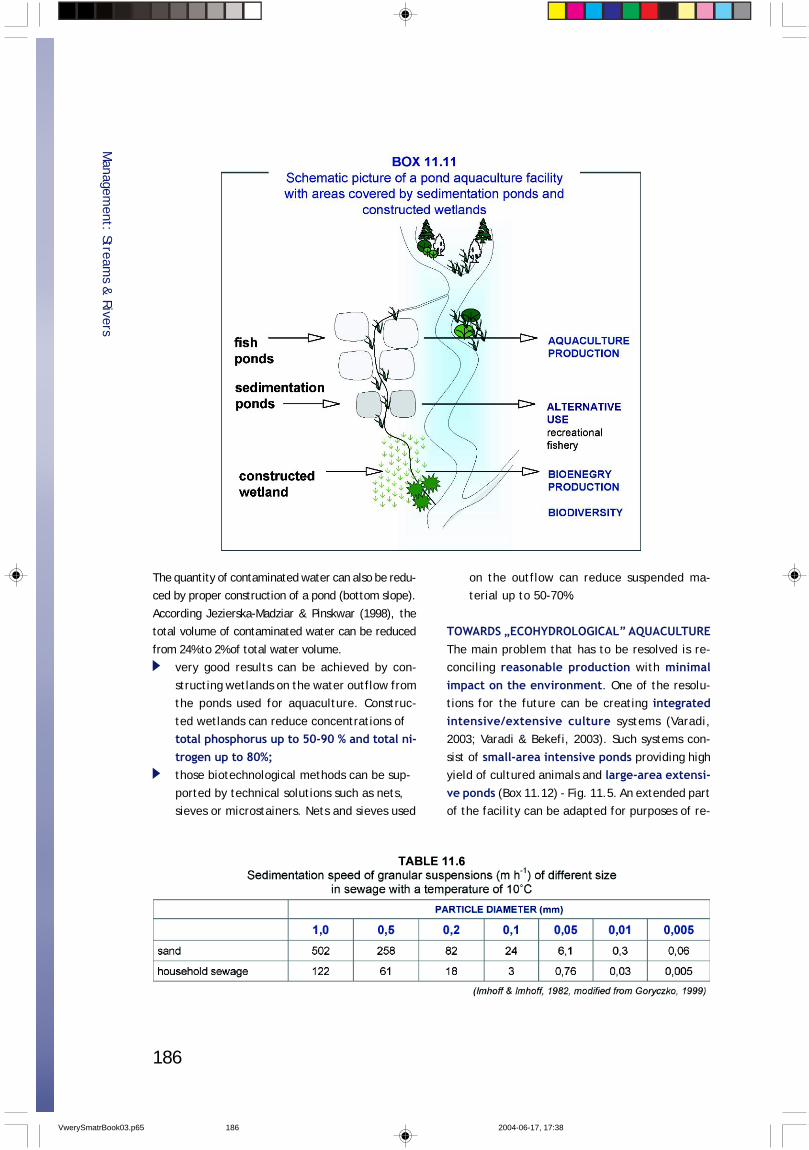
186
The quantity of contaminated water can also be redu-ced by proper construction of a pond (bottom slope).
According Jezierska-Madziar & Pinskwar (1998), thetotal volume of contaminated water can be reduced
from 24% to 2% of total water volume.very good results can be achieved by con-
structing wetlands on the water outflow fromthe ponds used for aquaculture. Construc-
ted wetlands can reduce concentrations oftotal phosphorus up to 50-90 % and total ni-trogen up to 80%;those biotechnological methods can be sup-
ported by technical solutions such as nets,sieves or microstainers. Nets and sieves used
on the outflow can reduce suspended ma-terial up to 50-70%.
TOWARDS „ECOHYDROLOGICAL” AQUACULTUREThe main problem that has to be resolved is re-conciling reasonable production with minimalimpact on the environment. One of the resolu-tions for the future can be creating integratedintensive/extensive culture systems (Varadi,2003; Varadi & Bekefi, 2003). Such systems con-
sist of small-area intensive ponds providing highyield of cultured animals and large-area extensi-ve ponds (Box 11.12) - Fig. 11.5. An extended partof the facility can be adapted for purposes of re-
Managem
ent: Streams &
Rivers
VwerySmatrBook03.p65 2004-06-17, 17:38186
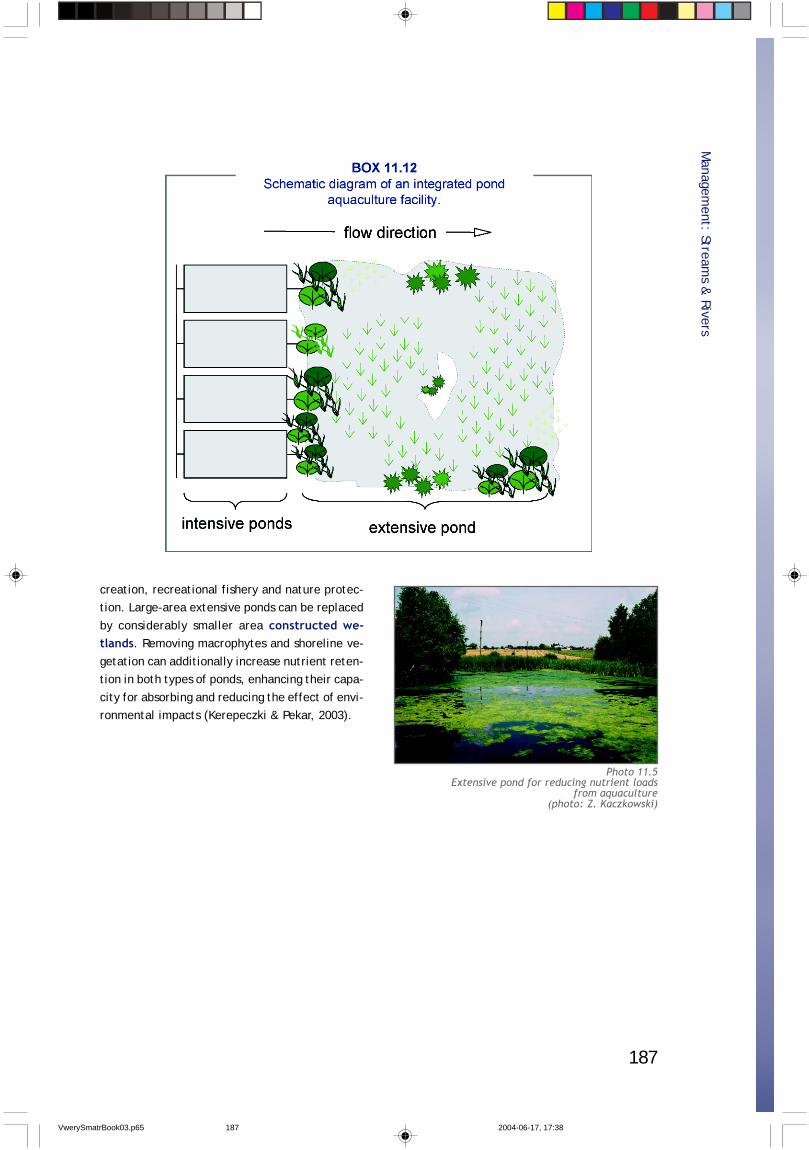
187
Managem
ent: Streams &
Rivers
creation, recreational fishery and nature protec-tion. Large-area extensive ponds can be replaced
by considerably smaller area constructed we-tlands. Removing macrophytes and shoreline ve-
getation can additionally increase nutrient reten-tion in both types of ponds, enhancing their capa-
city for absorbing and reducing the effect of envi-ronmental impacts (Kerepeczki & Pekar, 2003).
Photo 11.5Extensive pond for reducing nutrient loads
from aquaculture(photo: Z. Kaczkowski)
VwerySmatrBook03.p65 2004-06-17, 17:38187
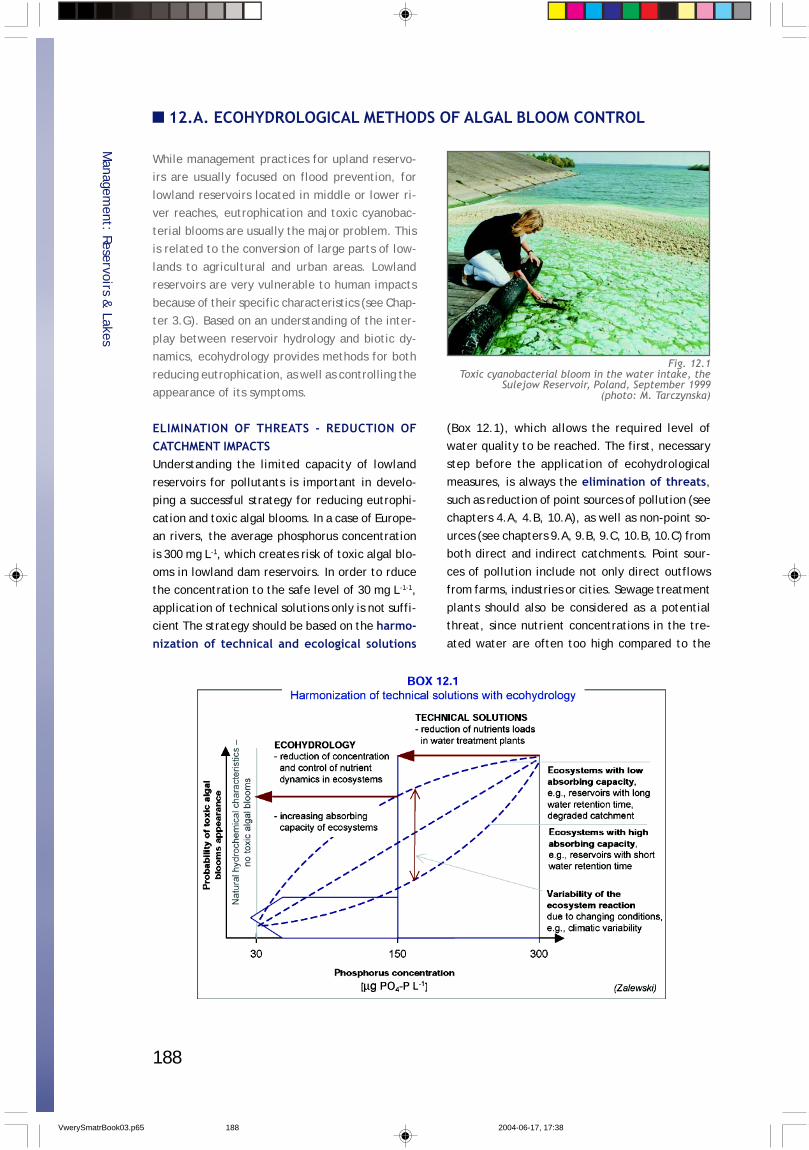
188
12.A. ECOHYDROLOGICAL METHODS OF ALGAL BLOOM CONTROL
While management practices for upland reservo-irs are usually focused on flood prevention, for
lowland reservoirs located in middle or lower ri-ver reaches, eutrophication and toxic cyanobac-
terial blooms are usually the major problem. Thisis related to the conversion of large parts of low-
lands to agricultural and urban areas. Lowlandreservoirs are very vulnerable to human impacts
because of their specific characteristics (see Chap-ter 3.G). Based on an understanding of the inter-
play between reservoir hydrology and biotic dy-namics, ecohydrology provides methods for both
reducing eutrophication, as well as controlling theappearance of its symptoms.
ELIMINATION OF THREATS - REDUCTION OFCATCHMENT IMPACTSUnderstanding the limited capacity of lowland
reservoirs for pollutants is important in develo-ping a successful strategy for reducing eutrophi-
cation and toxic algal blooms. In a case of Europe-an rivers, the average phosphorus concentration
is 300 mg L-1, which creates risk of toxic algal blo-oms in lowland dam reservoirs. In order to rducethe concentration to the safe level of 30 mg L-1-1,
application of technical solutions only is not suffi-cient The strategy should be based on the harmo-nization of technical and ecological solutions
(Box 12.1), which allows the required level ofwater quality to be reached. The first, necessary
step before the application of ecohydrologicalmeasures, is always the elimination of threats,such as reduction of point sources of pollution (seechapters 4.A, 4.B, 10.A), as well as non-point so-
urces (see chapters 9.A, 9.B, 9.C, 10.B, 10.C) fromboth direct and indirect catchments. Point sour-
ces of pollution include not only direct outflowsfrom farms, industries or cities. Sewage treatment
plants should also be considered as a potentialthreat, since nutrient concentrations in the tre-
ated water are often too high compared to the
Managem
ent: Reservoirs & Lakes
Fig. 12.1Toxic cyanobacterial bloom in the water intake, the
Sulejow Reservoir, Poland, September 1999(photo: M. Tarczynska)
VwerySmatrBook03.p65 2004-06-17, 17:38188
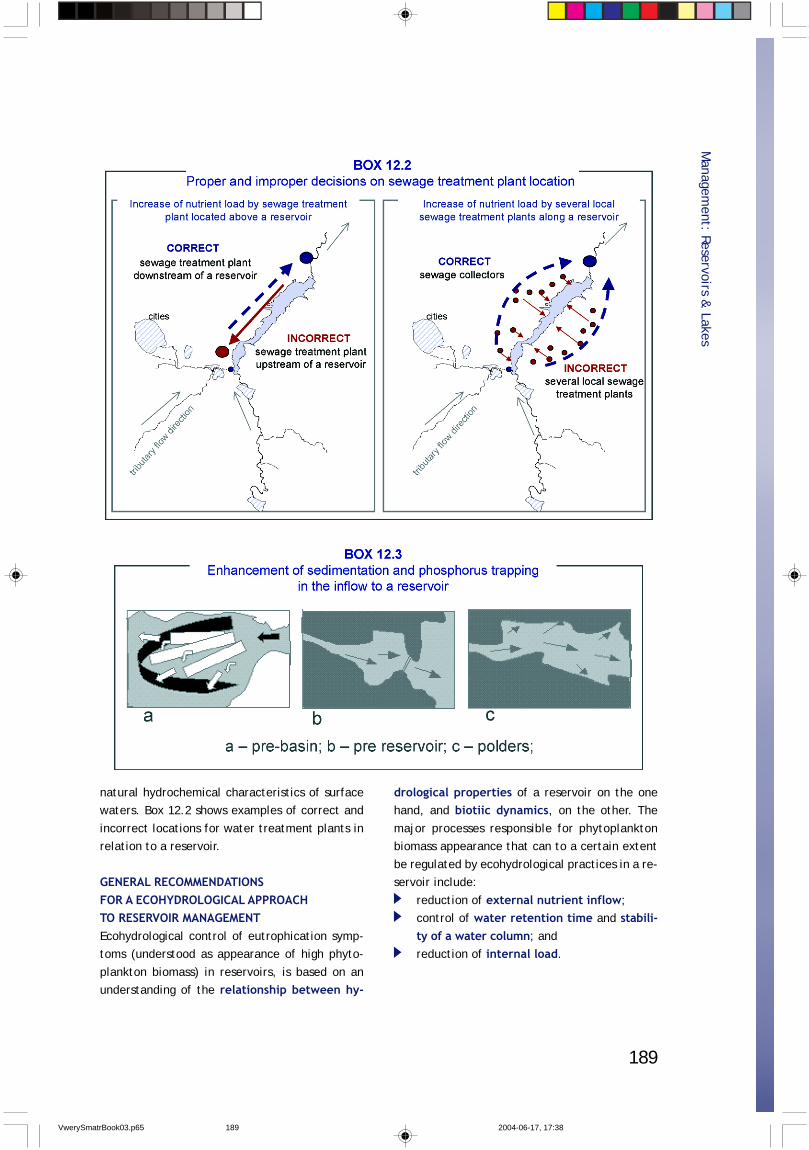
189
Managem
ent: Reservoirs & Lakes
natural hydrochemical characteristics of surfacewaters. Box 12.2 shows examples of correct and
incorrect locations for water treatment plants inrelation to a reservoir.
GENERAL RECOMMENDATIONSFOR A ECOHYDROLOGICAL APPROACHTO RESERVOIR MANAGEMENTEcohydrological control of eutrophication symp-toms (understood as appearance of high phyto-
plankton biomass) in reservoirs, is based on anunderstanding of the relationship between hy-
drological properties of a reservoir on the onehand, and biotiic dynamics, on the other. The
major processes responsible for phytoplanktonbiomass appearance that can to a certain extent
be regulated by ecohydrological practices in a re-servoir include:
reduction of external nutrient inflow;control of water retention time and stabili-ty of a water column; andreduction of internal load.
VwerySmatrBook03.p65 2004-06-17, 17:38189
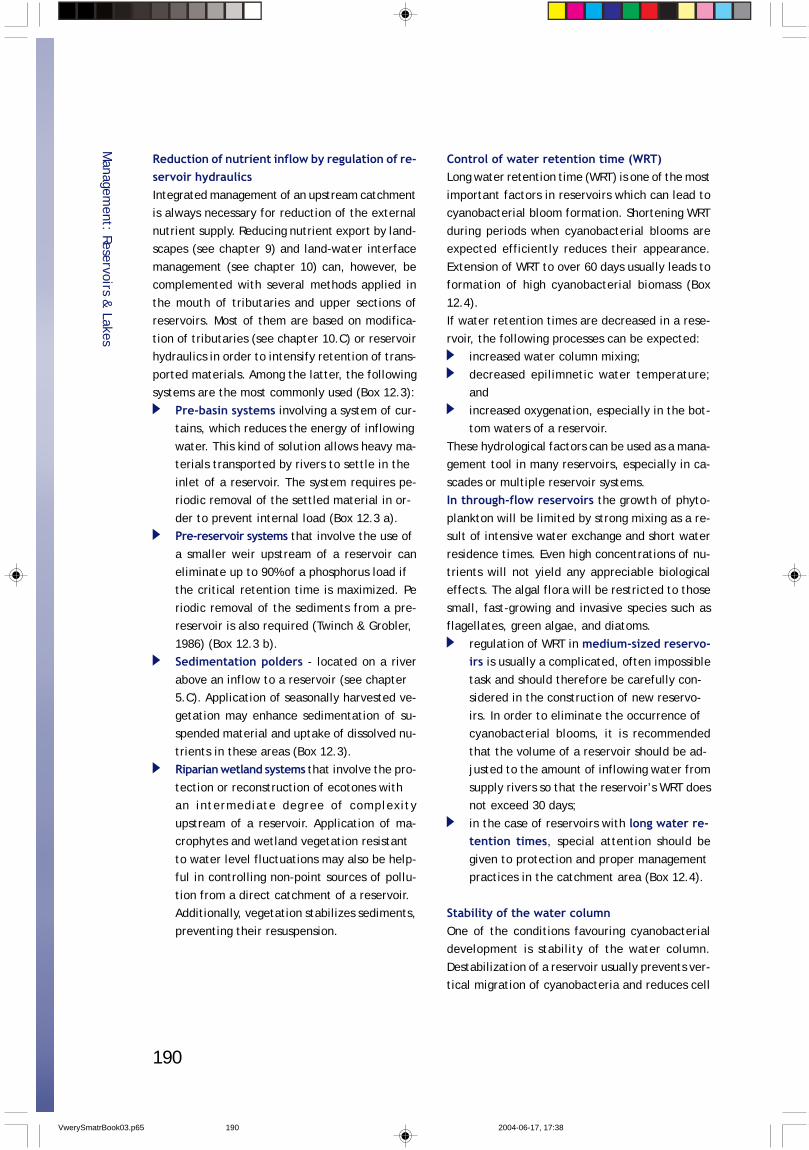
190
Reduction of nutrient inflow by regulation of re-servoir hydraulicsIntegrated management of an upstream catchmentis always necessary for reduction of the external
nutrient supply. Reducing nutrient export by land-scapes (see chapter 9) and land-water interface
management (see chapter 10) can, however, becomplemented with several methods applied in
the mouth of tributaries and upper sections ofreservoirs. Most of them are based on modifica-
tion of tributaries (see chapter 10.C) or reservoirhydraulics in order to intensify retention of trans-
ported materials. Among the latter, the followingsystems are the most commonly used (Box 12.3):
Pre-basin systems involving a system of cur-tains, which reduces the energy of inflowing
water. This kind of solution allows heavy ma-terials transported by rivers to settle in the
inlet of a reservoir. The system requires pe-riodic removal of the settled material in or-
der to prevent internal load (Box 12.3 a).Pre-reservoir systems that involve the use of
a smaller weir upstream of a reservoir caneliminate up to 90% of a phosphorus load ifthe critical retention time is maximized. Pe
riodic removal of the sediments from a pre-reservoir is also required (Twinch & Grobler,
1986) (Box 12.3 b).Sedimentation polders - located on a river
above an inflow to a reservoir (see chapter5.C). Application of seasonally harvested ve-
getation may enhance sedimentation of su-spended material and uptake of dissolved nu-
trients in these areas (Box 12.3).Riparian wetland systems that involve the pro-
tection or reconstruction of ecotones withan intermediate degree of complexity
upstream of a reservoir. Application of ma-crophytes and wetland vegetation resistant
to water level fluctuations may also be help-ful in controlling non-point sources of pollu-
tion from a direct catchment of a reservoir.Additionally, vegetation stabilizes sediments,
preventing their resuspension.
Control of water retention time (WRT)Long water retention time (WRT) is one of the most
important factors in reservoirs which can lead tocyanobacterial bloom formation. Shortening WRT
during periods when cyanobacterial blooms areexpected efficiently reduces their appearance.
Extension of WRT to over 60 days usually leads toformation of high cyanobacterial biomass (Box
12.4).If water retention times are decreased in a rese-
rvoir, the following processes can be expected:increased water column mixing;
decreased epilimnetic water temperature;and
increased oxygenation, especially in the bot-tom waters of a reservoir.
These hydrological factors can be used as a mana-gement tool in many reservoirs, especially in ca-
scades or multiple reservoir systems.In through-flow reservoirs the growth of phyto-
plankton will be limited by strong mixing as a re-sult of intensive water exchange and short water
residence times. Even high concentrations of nu-trients will not yield any appreciable biologicaleffects. The algal flora will be restricted to those
small, fast-growing and invasive species such asflagellates, green algae, and diatoms.
regulation of WRT in medium-sized reservo-irs is usually a complicated, often impossible
task and should therefore be carefully con-sidered in the construction of new reservo-
irs. In order to eliminate the occurrence ofcyanobacterial blooms, it is recommended
that the volume of a reservoir should be ad-justed to the amount of inflowing water from
supply rivers so that the reservoir’s WRT doesnot exceed 30 days;
in the case of reservoirs with long water re-tention times, special attention should be
given to protection and proper managementpractices in the catchment area (Box 12.4).
Stability of the water columnOne of the conditions favouring cyanobacterialdevelopment is stability of the water column.
Destabilization of a reservoir usually prevents ver-tical migration of cyanobacteria and reduces cell
Managem
ent: Reservoirs & Lakes
VwerySmatrBook03.p65 2004-06-17, 17:38190
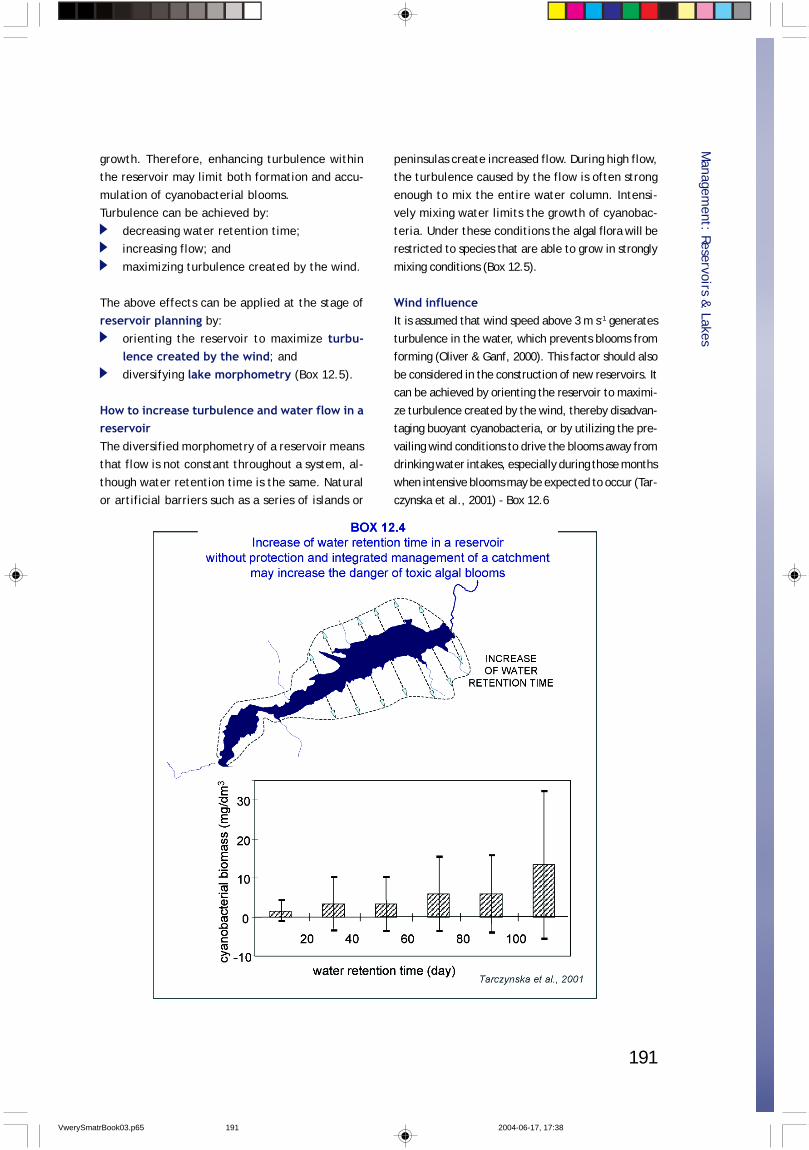
191
growth. Therefore, enhancing turbulence withinthe reservoir may limit both formation and accu-
mulation of cyanobacterial blooms.Turbulence can be achieved by:
decreasing water retention time;increasing flow; and
maximizing turbulence created by the wind.
The above effects can be applied at the stage ofreservoir planning by:
orienting the reservoir to maximize turbu-lence created by the wind; and
diversifying lake morphometry (Box 12.5).
How to increase turbulence and water flow in areservoirThe diversified morphometry of a reservoir meansthat flow is not constant throughout a system, al-
though water retention time is the same. Naturalor artificial barriers such as a series of islands or
peninsulas create increased flow. During high flow,the turbulence caused by the flow is often strong
enough to mix the entire water column. Intensi-vely mixing water limits the growth of cyanobac-
teria. Under these conditions the algal flora will berestricted to species that are able to grow in strongly
mixing conditions (Box 12.5).
Wind influenceIt is assumed that wind speed above 3 m s-1 generates
turbulence in the water, which prevents blooms fromforming (Oliver & Ganf, 2000). This factor should also
be considered in the construction of new reservoirs. Itcan be achieved by orienting the reservoir to maximi-
ze turbulence created by the wind, thereby disadvan-taging buoyant cyanobacteria, or by utilizing the pre-
vailing wind conditions to drive the blooms away fromdrinking water intakes, especially during those months
when intensive blooms may be expected to occur (Tar-czynska et al., 2001) - Box 12.6
Managem
ent: Reservoirs & Lakes
VwerySmatrBook03.p65 2004-06-17, 17:38191
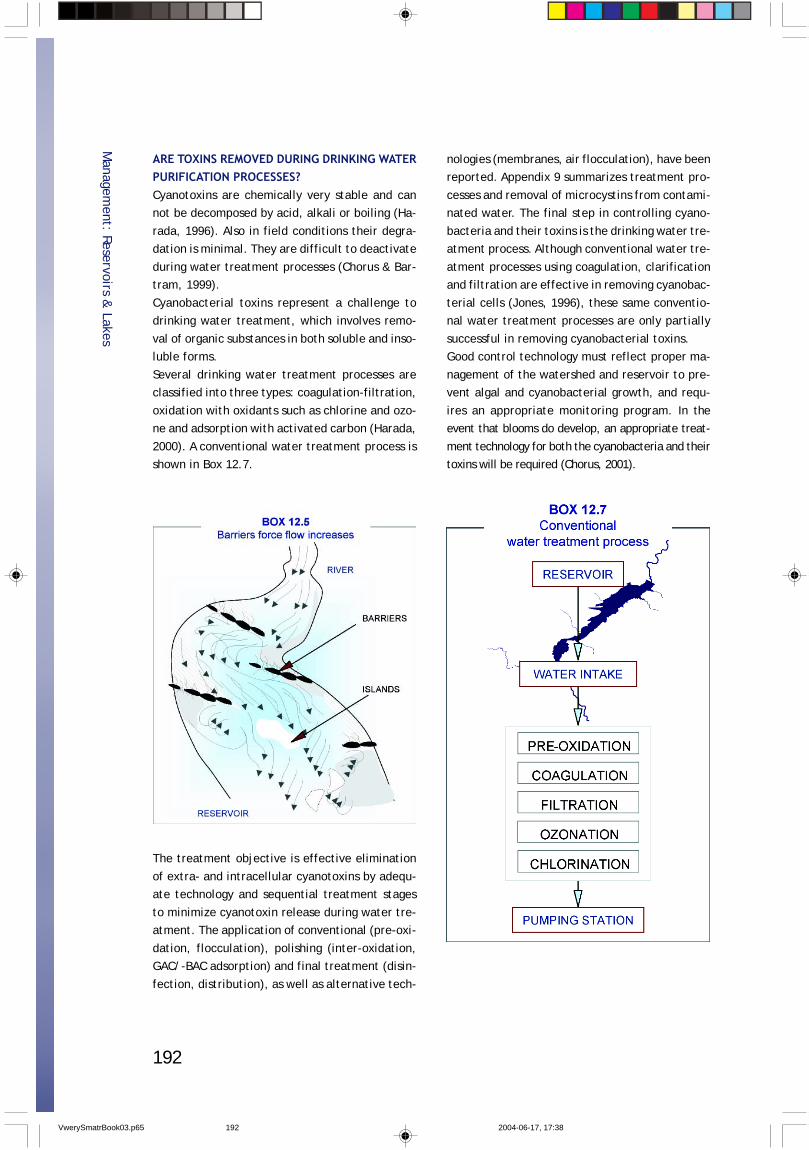
192
ARE TOXINS REMOVED DURING DRINKING WATERPURIFICATION PROCESSES?Cyanotoxins are chemically very stable and cannot be decomposed by acid, alkali or boiling (Ha-
rada, 1996). Also in field conditions their degra-dation is minimal. They are difficult to deactivate
during water treatment processes (Chorus & Bar-tram, 1999).
Cyanobacterial toxins represent a challenge todrinking water treatment, which involves remo-
val of organic substances in both soluble and inso-luble forms.
Several drinking water treatment processes areclassified into three types: coagulation-filtration,
oxidation with oxidants such as chlorine and ozo-ne and adsorption with activated carbon (Harada,
2000). A conventional water treatment process isshown in Box 12.7.
nologies (membranes, air flocculation), have beenreported. Appendix 9 summarizes treatment pro-
cesses and removal of microcystins from contami-nated water. The final step in controlling cyano-
bacteria and their toxins is the drinking water tre-atment process. Although conventional water tre-
atment processes using coagulation, clarificationand filtration are effective in removing cyanobac-
terial cells (Jones, 1996), these same conventio-nal water treatment processes are only partially
successful in removing cyanobacterial toxins.Good control technology must reflect proper ma-
nagement of the watershed and reservoir to pre-vent algal and cyanobacterial growth, and requ-
ires an appropriate monitoring program. In theevent that blooms do develop, an appropriate treat-
ment technology for both the cyanobacteria and theirtoxins will be required (Chorus, 2001).
The treatment objective is effective elimination
of extra- and intracellular cyanotoxins by adequ-ate technology and sequential treatment stages
to minimize cyanotoxin release during water tre-atment. The application of conventional (pre-oxi-
dation, flocculation), polishing (inter-oxidation,GAC/-BAC adsorption) and final treatment (disin-
fection, distribution), as well as alternative tech-
Managem
ent: Reservoirs & Lakes
VwerySmatrBook03.p65 2004-06-17, 17:38192
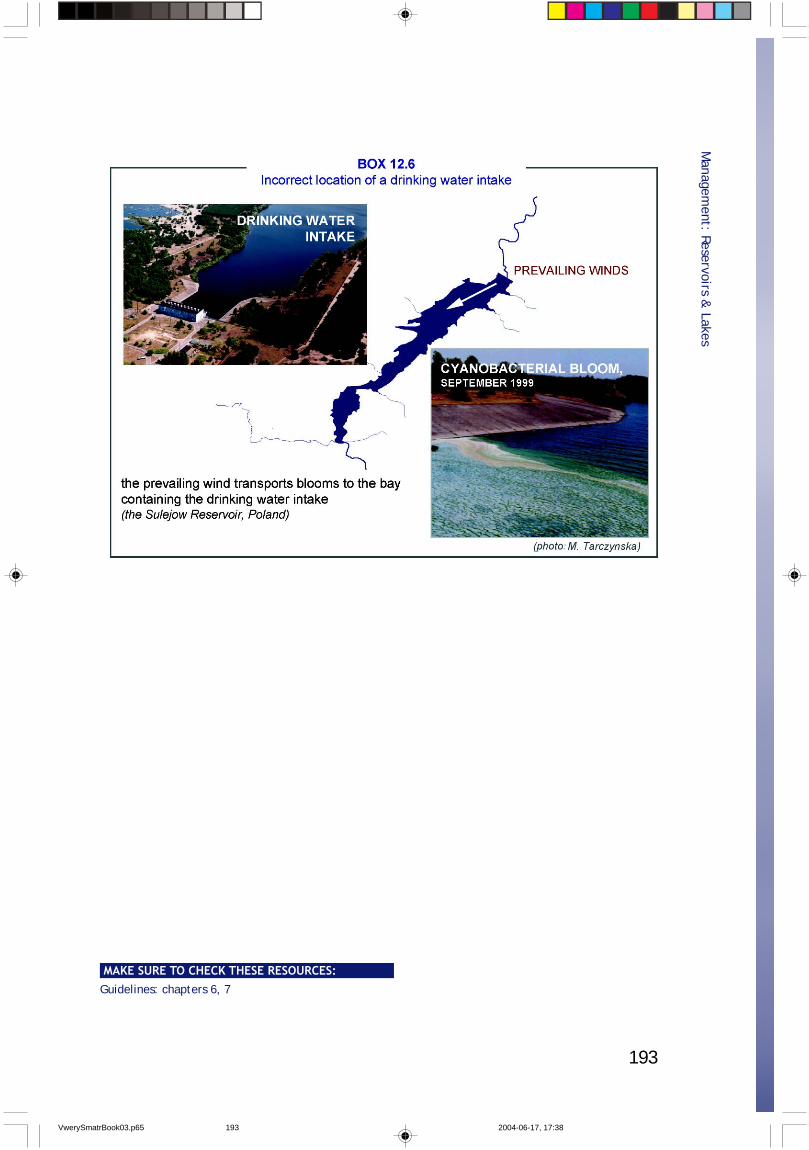
193
Managem
ent: Reservoirs & Lakes
MAKE SURE TO CHECK THESE RESOURCES:Guidelines: chapters 6, 7
VwerySmatrBook03.p65 2004-06-17, 17:38193
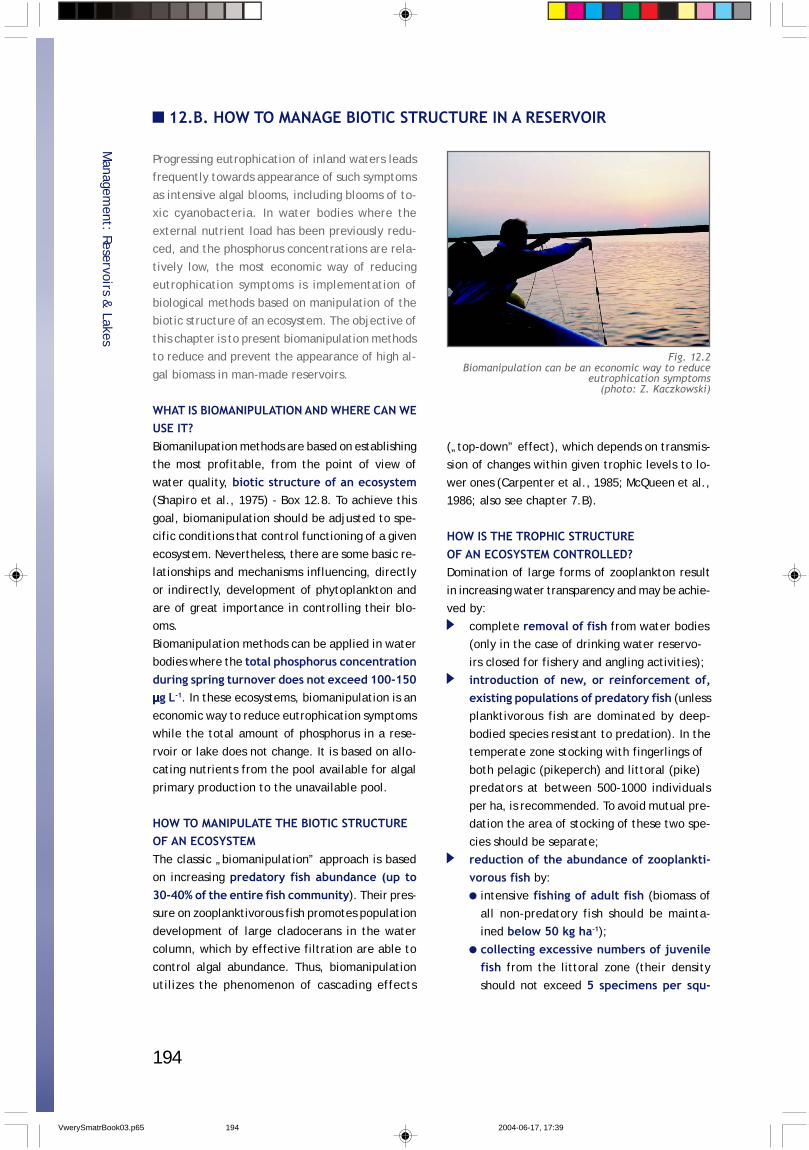
194
12.B. HOW TO MANAGE BIOTIC STRUCTURE IN A RESERVOIR
Progressing eutrophication of inland waters leadsfrequently towards appearance of such symptoms
as intensive algal blooms, including blooms of to-xic cyanobacteria. In water bodies where the
external nutrient load has been previously redu-ced, and the phosphorus concentrations are rela-
tively low, the most economic way of reducingeutrophication symptoms is implementation of
biological methods based on manipulation of thebiotic structure of an ecosystem. The objective of
this chapter is to present biomanipulation methodsto reduce and prevent the appearance of high al-
gal biomass in man-made reservoirs.
WHAT IS BIOMANIPULATION AND WHERE CAN WEUSE IT?Biomanilupation methods are based on establishingthe most profitable, from the point of view of
water quality, biotic structure of an ecosystem(Shapiro et al., 1975) - Box 12.8. To achieve this
goal, biomanipulation should be adjusted to spe-cific conditions that control functioning of a given
ecosystem. Nevertheless, there are some basic re-lationships and mechanisms influencing, directlyor indirectly, development of phytoplankton and
are of great importance in controlling their blo-oms.
Biomanipulation methods can be applied in waterbodies where the total phosphorus concentrationduring spring turnover does not exceed 100-150µµµµµg L-1. In these ecosystems, biomanipulation is an
economic way to reduce eutrophication symptomswhile the total amount of phosphorus in a rese-
rvoir or lake does not change. It is based on allo-cating nutrients from the pool available for algal
primary production to the unavailable pool.
HOW TO MANIPULATE THE BIOTIC STRUCTUREOF AN ECOSYSTEMThe classic „biomanipulation” approach is basedon increasing predatory fish abundance (up to30-40% of the entire fish community). Their pres-sure on zooplanktivorous fish promotes population
development of large cladocerans in the watercolumn, which by effective filtration are able to
control algal abundance. Thus, biomanipulationutilizes the phenomenon of cascading effects
(„top-down” effect), which depends on transmis-sion of changes within given trophic levels to lo-
wer ones (Carpenter et al., 1985; McQueen et al.,1986; also see chapter 7.B).
HOW IS THE TROPHIC STRUCTUREOF AN ECOSYSTEM CONTROLLED?Domination of large forms of zooplankton result
in increasing water transparency and may be achie-ved by:
complete removal of fish from water bodies(only in the case of drinking water reservo-
irs closed for fishery and angling activities);introduction of new, or reinforcement of,existing populations of predatory fish (unlessplanktivorous fish are dominated by deep-
bodied species resistant to predation). In thetemperate zone stocking with fingerlings of
both pelagic (pikeperch) and littoral (pike)predators at between 500-1000 individuals
per ha, is recommended. To avoid mutual pre-dation the area of stocking of these two spe-
cies should be separate;reduction of the abundance of zooplankti-vorous fish by:
intensive fishing of adult fish (biomass of
all non-predatory fish should be mainta-ined below 50 kg ha-1);
collecting excessive numbers of juvenilefish from the littoral zone (their density
should not exceed 5 specimens per squ-
Managem
ent: Reservoirs & Lakes
Fig. 12.2Biomanipulation can be an economic way to reduce
eutrophication symptoms(photo: Z. Kaczkowski)
VwerySmatrBook03.p65 2004-06-17, 17:39194
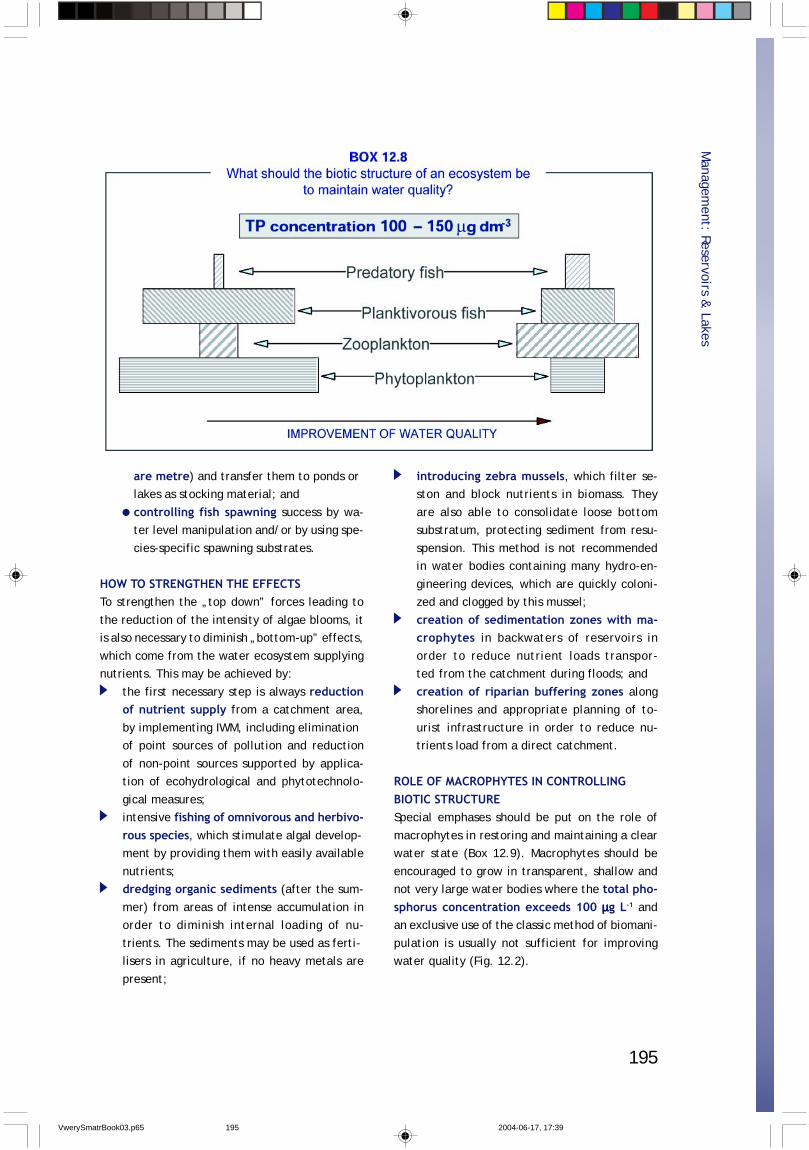
195
are metre) and transfer them to ponds orlakes as stocking material; and
controlling fish spawning success by wa-ter level manipulation and/or by using spe-
cies-specific spawning substrates.
HOW TO STRENGTHEN THE EFFECTSTo strengthen the „top down” forces leading to
the reduction of the intensity of algae blooms, itis also necessary to diminish „bottom-up” effects,
which come from the water ecosystem supplyingnutrients. This may be achieved by:
the first necessary step is always reductionof nutrient supply from a catchment area,
by implementing IWM, including eliminationof point sources of pollution and reduction
of non-point sources supported by applica-tion of ecohydrological and phytotechnolo-
gical measures;intensive fishing of omnivorous and herbivo-rous species, which stimulate algal develop-ment by providing them with easily available
nutrients;dredging organic sediments (after the sum-
mer) from areas of intense accumulation inorder to diminish internal loading of nu-
trients. The sediments may be used as ferti-lisers in agriculture, if no heavy metals are
present;
introducing zebra mussels, which filter se-ston and block nutrients in biomass. They
are also able to consolidate loose bottomsubstratum, protecting sediment from resu-
spension. This method is not recommendedin water bodies containing many hydro-en-
gineering devices, which are quickly coloni-zed and clogged by this mussel;
creation of sedimentation zones with ma-crophytes in backwaters of reservoirs in
order to reduce nutrient loads transpor-ted from the catchment during floods; and
creation of riparian buffering zones alongshorelines and appropriate planning of to-
urist infrastructure in order to reduce nu-trients load from a direct catchment.
ROLE OF MACROPHYTES IN CONTROLLINGBIOTIC STRUCTURESpecial emphases should be put on the role of
macrophytes in restoring and maintaining a clearwater state (Box 12.9). Macrophytes should be
encouraged to grow in transparent, shallow andnot very large water bodies where the total pho-sphorus concentration exceeds 100 µµµµµg L-1 andan exclusive use of the classic method of biomani-
pulation is usually not sufficient for improvingwater quality (Fig. 12.2).
Managem
ent: Reservoirs & Lakes
VwerySmatrBook03.p65 2004-06-17, 17:39195
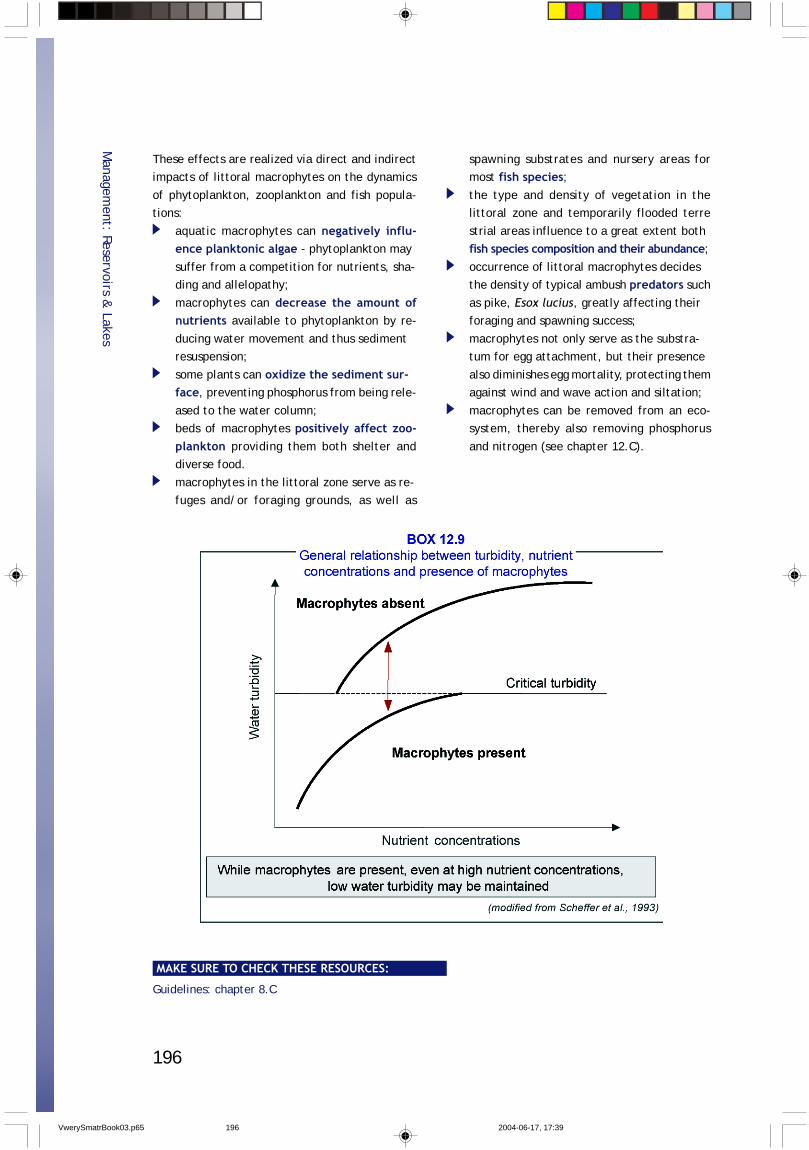
196
These effects are realized via direct and indirectimpacts of littoral macrophytes on the dynamics
of phytoplankton, zooplankton and fish popula-tions:
aquatic macrophytes can negatively influ-ence planktonic algae - phytoplankton may
suffer from a competition for nutrients, sha-ding and allelopathy;
macrophytes can decrease the amount ofnutrients available to phytoplankton by re-
ducing water movement and thus sedimentresuspension;
some plants can oxidize the sediment sur-face, preventing phosphorus from being rele-
ased to the water column;beds of macrophytes positively affect zoo-plankton providing them both shelter anddiverse food.
macrophytes in the littoral zone serve as re-fuges and/or foraging grounds, as well as
spawning substrates and nursery areas formost fish species;the type and density of vegetation in thelittoral zone and temporarily flooded terre
strial areas influence to a great extent bothfish species composition and their abundance;
occurrence of littoral macrophytes decidesthe density of typical ambush predators such
as pike, Esox lucius, greatly affecting theirforaging and spawning success;
macrophytes not only serve as the substra-tum for egg attachment, but their presence
also diminishes egg mortality, protecting themagainst wind and wave action and siltation;
macrophytes can be removed from an eco-system, thereby also removing phosphorus
and nitrogen (see chapter 12.C).
Managem
ent: Reservoirs & Lakes
MAKE SURE TO CHECK THESE RESOURCES:
Guidelines: chapter 8.C
VwerySmatrBook03.p65 2004-06-17, 17:39196
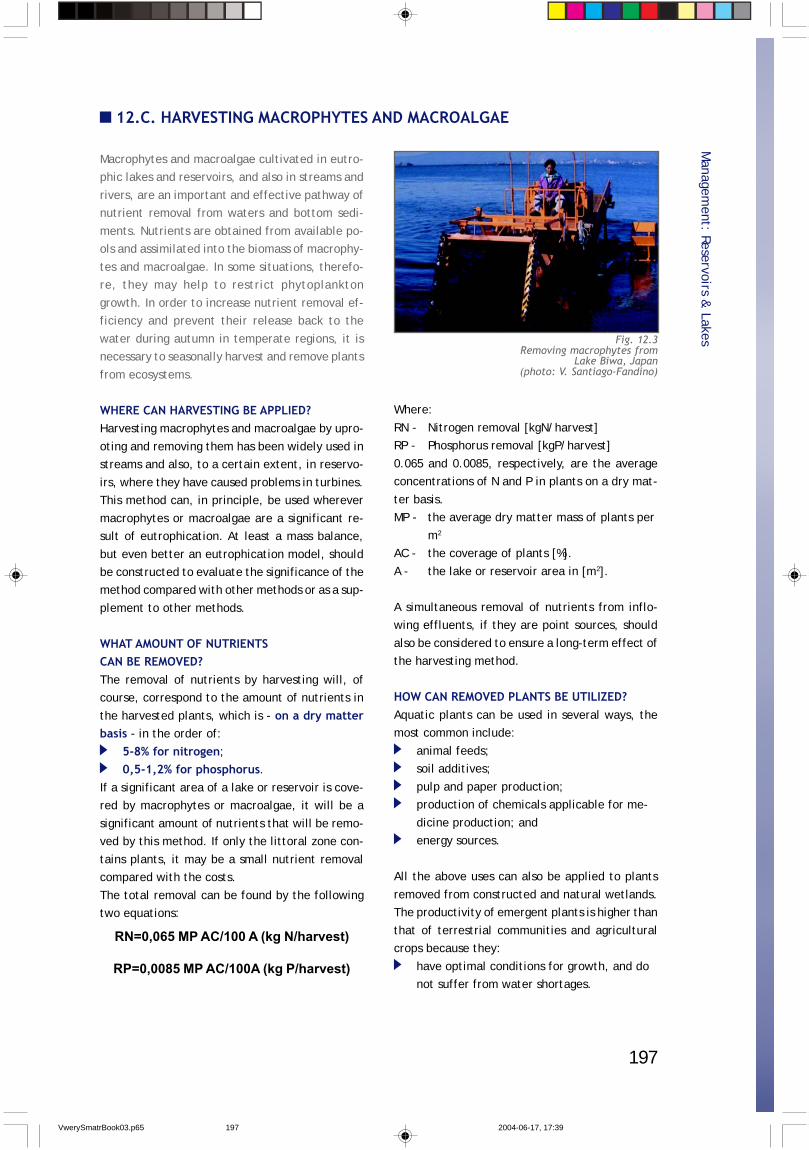
197
12.C. HARVESTING MACROPHYTES AND MACROALGAE
Macrophytes and macroalgae cultivated in eutro-phic lakes and reservoirs, and also in streams and
rivers, are an important and effective pathway ofnutrient removal from waters and bottom sedi-
ments. Nutrients are obtained from available po-ols and assimilated into the biomass of macrophy-
tes and macroalgae. In some situations, therefo-re, they may help to restrict phytoplankton
growth. In order to increase nutrient removal ef-ficiency and prevent their release back to the
water during autumn in temperate regions, it isnecessary to seasonally harvest and remove plants
from ecosystems.
WHERE CAN HARVESTING BE APPLIED?Harvesting macrophytes and macroalgae by upro-
oting and removing them has been widely used instreams and also, to a certain extent, in reservo-
irs, where they have caused problems in turbines.This method can, in principle, be used wherever
macrophytes or macroalgae are a significant re-sult of eutrophication. At least a mass balance,
but even better an eutrophication model, shouldbe constructed to evaluate the significance of themethod compared with other methods or as a sup-
plement to other methods.
WHAT AMOUNT OF NUTRIENTSCAN BE REMOVED?The removal of nutrients by harvesting will, ofcourse, correspond to the amount of nutrients in
the harvested plants, which is - on a dry matterbasis - in the order of:
5-8% for nitrogen;0,5-1,2% for phosphorus.
If a significant area of a lake or reservoir is cove-red by macrophytes or macroalgae, it will be a
significant amount of nutrients that will be remo-ved by this method. If only the littoral zone con-
tains plants, it may be a small nutrient removalcompared with the costs.
The total removal can be found by the followingtwo equations:
Where:
RN - Nitrogen removal [kgN/harvest]RP - Phosphorus removal [kgP/harvest]
0.065 and 0.0085, respectively, are the averageconcentrations of N and P in plants on a dry mat-
ter basis.MP - the average dry matter mass of plants per
m2
AC - the coverage of plants [%].
A - the lake or reservoir area in [m2].
A simultaneous removal of nutrients from inflo-wing effluents, if they are point sources, should
also be considered to ensure a long-term effect ofthe harvesting method.
HOW CAN REMOVED PLANTS BE UTILIZED?Aquatic plants can be used in several ways, themost common include:
animal feeds;soil additives;
pulp and paper production;production of chemicals applicable for me-
dicine production; andenergy sources.
All the above uses can also be applied to plants
removed from constructed and natural wetlands.The productivity of emergent plants is higher than
that of terrestrial communities and agriculturalcrops because they:
have optimal conditions for growth, and donot suffer from water shortages.
Managem
ent: Reservoirs & LakesFig. 12.3
Removing macrophytes fromLake Biwa, Japan
(photo: V. Santiago-Fandino)
RN=0,065 MP AC/100 A (kg N/harvest)
RP=0,0085 MP AC/100A (kg P/harvest)
VwerySmatrBook03.p65 2004-06-17, 17:39197
198
have high tolerances for fluctuations in envi-ronmental conditions.
have high photosynthetic efficiencies.
Animal feedsA problem with the use of aquatic plants as ani-
mal feed is the high moisture content, which cau-ses difficulties in processing, transportation and
storage. The process of silaging might become veryimportant in humid tropical and subtropical re-
gions where it is difficult to sun-dry the plantsdue to rapid spoilage.
The method has been used to restore, at leastpartially, several Chinese lakes where the harve-
sted plants were utilized as pig feed. Utilizationof harvested plants as feed for domestic animalsrequires a careful examination of the contamina-tion of the lake or reservoir by toxic substances,
as they may have bio-accumulated in the harve-sted plants.
Energy sourcesIf it is not recommended to utilize the plants asfeed for domestic animals instead the plants maybe incinerated. As the plants have a dry matter
content of only 10-20%, the amount of energy,which can be recovered by their incineration is
very modest. Sun drying before incineration is re-commended in countries with a warm climate.
Soil additivesPlants can be turned into soil additives either inthe form of mulch and organic fertilizers or by
burning the plants to form ash or using them tomake compost. For composting a moisture con-
tent of 50 - 70% is required. The relatively highnutrient content in emergent macrophytes favo-
urs microbes that produce compost. This methodis mostly used, however, for plants removed from
constructed wetlands (such as water hyacinth andreeds), where they can be mixed with, e.g., de-
watered sludge.
Pulp, paper and fibreDue to their relatively high crude fibre and cellu-
lose contents, common reeds (Phragmites) andcattails can be used as a source of paper pulp and
fibre. In Romania, reeds were converted into pulpto make printing paper, cellophane, cardboardand other products such as cemented reed blocksand compressed fibreboard, furfural, alcohol andfuel, insulation material and fertilizer (Poh-eng &
Polprasert, 1996)
Managem
ent: Reservoirs & Lakes
MAKE SURE TO CHECK THESE RESOURCES:
http://www.waste.nl/docpdf/WD10.pdf
http://www.unep.or.jp/ietc/Publications/Freshwater/FMS7/index.asp
VwerySmatrBook03.p65 2004-06-17, 17:39198
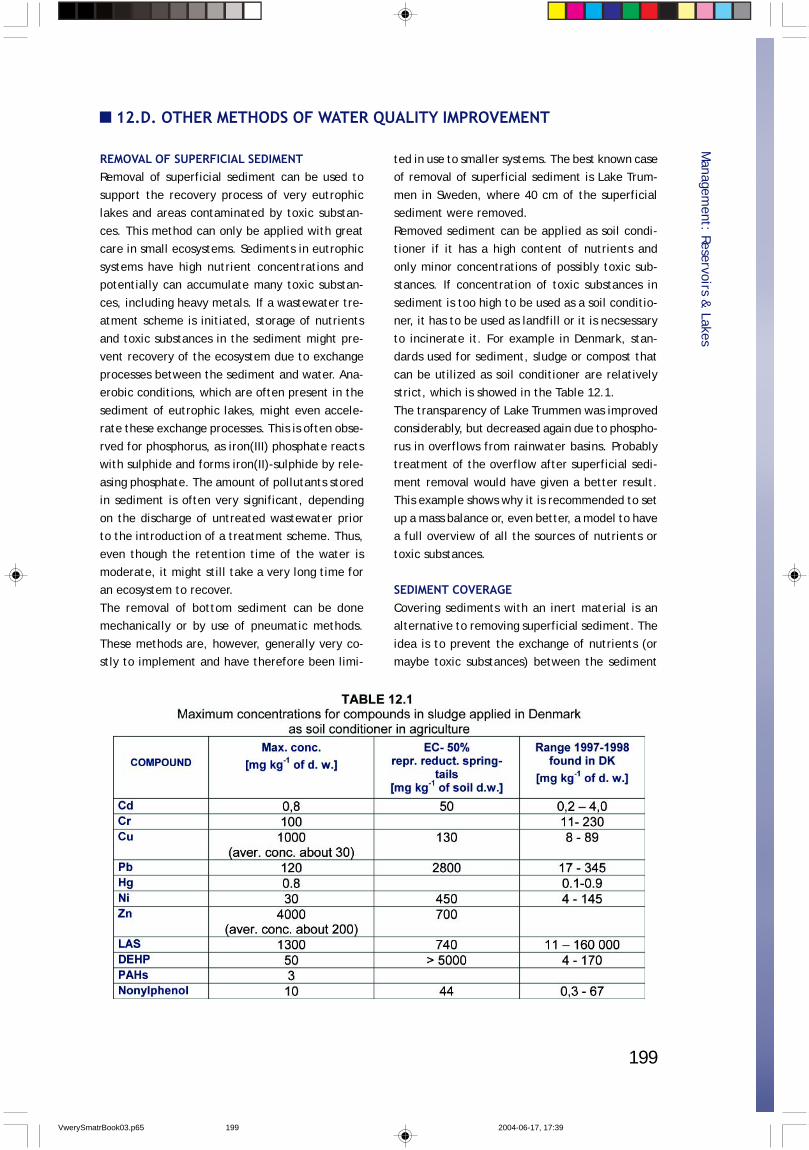
199
12.D. OTHER METHODS OF WATER QUALITY IMPROVEMENT
REMOVAL OF SUPERFICIAL SEDIMENTRemoval of superficial sediment can be used to
support the recovery process of very eutrophiclakes and areas contaminated by toxic substan-
ces. This method can only be applied with greatcare in small ecosystems. Sediments in eutrophic
systems have high nutrient concentrations andpotentially can accumulate many toxic substan-
ces, including heavy metals. If a wastewater tre-atment scheme is initiated, storage of nutrients
and toxic substances in the sediment might pre-vent recovery of the ecosystem due to exchange
processes between the sediment and water. Ana-erobic conditions, which are often present in the
sediment of eutrophic lakes, might even accele-rate these exchange processes. This is often obse-
rved for phosphorus, as iron(III) phosphate reactswith sulphide and forms iron(II)-sulphide by rele-
asing phosphate. The amount of pollutants storedin sediment is often very significant, depending
on the discharge of untreated wastewater priorto the introduction of a treatment scheme. Thus,
even though the retention time of the water ismoderate, it might still take a very long time foran ecosystem to recover.
The removal of bottom sediment can be donemechanically or by use of pneumatic methods.
These methods are, however, generally very co-stly to implement and have therefore been limi-
ted in use to smaller systems. The best known caseof removal of superficial sediment is Lake Trum-
men in Sweden, where 40 cm of the superficialsediment were removed.
Removed sediment can be applied as soil condi-tioner if it has a high content of nutrients and
only minor concentrations of possibly toxic sub-stances. If concentration of toxic substances in
sediment is too high to be used as a soil conditio-ner, it has to be used as landfill or it is necsessary
to incinerate it. For example in Denmark, stan-dards used for sediment, sludge or compost that
can be utilized as soil conditioner are relativelystrict, which is showed in the Table 12.1.
The transparency of Lake Trummen was improvedconsiderably, but decreased again due to phospho-
rus in overflows from rainwater basins. Probablytreatment of the overflow after superficial sedi-
ment removal would have given a better result.This example shows why it is recommended to set
up a mass balance or, even better, a model to havea full overview of all the sources of nutrients or
toxic substances.
SEDIMENT COVERAGECovering sediments with an inert material is analternative to removing superficial sediment. The
idea is to prevent the exchange of nutrients (ormaybe toxic substances) between the sediment
Managem
ent: Reservoirs & Lakes
VwerySmatrBook03.p65 2004-06-17, 17:39199
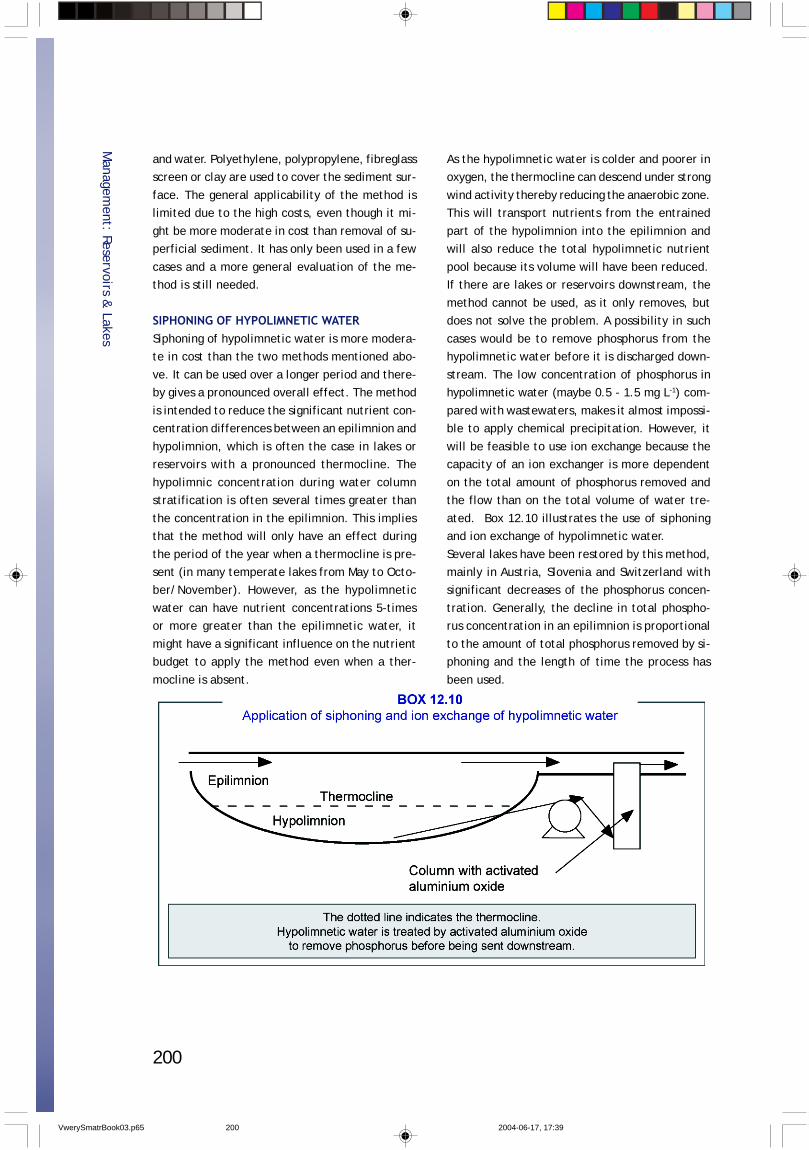
200
and water. Polyethylene, polypropylene, fibreglassscreen or clay are used to cover the sediment sur-
face. The general applicability of the method islimited due to the high costs, even though it mi-
ght be more moderate in cost than removal of su-perficial sediment. It has only been used in a few
cases and a more general evaluation of the me-thod is still needed.
SIPHONING OF HYPOLIMNETIC WATERSiphoning of hypolimnetic water is more modera-te in cost than the two methods mentioned abo-
ve. It can be used over a longer period and there-by gives a pronounced overall effect. The method
is intended to reduce the significant nutrient con-centration differences between an epilimnion and
hypolimnion, which is often the case in lakes orreservoirs with a pronounced thermocline. The
hypolimnic concentration during water columnstratification is often several times greater than
the concentration in the epilimnion. This impliesthat the method will only have an effect during
the period of the year when a thermocline is pre-sent (in many temperate lakes from May to Octo-ber/November). However, as the hypolimnetic
water can have nutrient concentrations 5-timesor more greater than the epilimnetic water, it
might have a significant influence on the nutrientbudget to apply the method even when a ther-
mocline is absent.
As the hypolimnetic water is colder and poorer inoxygen, the thermocline can descend under strong
wind activity thereby reducing the anaerobic zone.This will transport nutrients from the entrained
part of the hypolimnion into the epilimnion andwill also reduce the total hypolimnetic nutrient
pool because its volume will have been reduced.If there are lakes or reservoirs downstream, the
method cannot be used, as it only removes, butdoes not solve the problem. A possibility in such
cases would be to remove phosphorus from thehypolimnetic water before it is discharged down-
stream. The low concentration of phosphorus inhypolimnetic water (maybe 0.5 - 1.5 mg L-1) com-
pared with wastewaters, makes it almost impossi-ble to apply chemical precipitation. However, it
will be feasible to use ion exchange because thecapacity of an ion exchanger is more dependent
on the total amount of phosphorus removed andthe flow than on the total volume of water tre-
ated. Box 12.10 illustrates the use of siphoningand ion exchange of hypolimnetic water.
Several lakes have been restored by this method,mainly in Austria, Slovenia and Switzerland withsignificant decreases of the phosphorus concen-
tration. Generally, the decline in total phospho-rus concentration in an epilimnion is proportional
to the amount of total phosphorus removed by si-phoning and the length of time the process has
been used.
Managem
ent: Reservoirs & Lakes
VwerySmatrBook03.p65 2004-06-17, 17:39200
201
Managem
ent: Reservoirs & Lakes
The method has relatively low costs and is relati-vely effective, but the phosphorus must, of cour-
se, be removed from hypolimnetic water before itis discharged if there are other lakes downstream.
FLOCCULATIONFlocculation of phosphorus in a lake or reservoir isanother alternative. Either aluminium sulphate or
iron(III)-chloride can be used. Calcium hydroxidecannot be used, even though it is an excellent
precipitant for wastewater, as its effect is pH-de-pendent and a pH of 9.5 or higher is required. The
method is not generally recommended as:it is not certain that all flocs will settle and
thereby incorporate the phosphorus in thesediment; and
the phosphorus might be released from thesediment again at a later stage.
AERATIONAeration of lakes and reservoirs is a more directmethod to prevent anaerobic conditions from oc-
curring. Aeration of highly polluted rivers and stre-
ams has also been used to avoid anaerobic condi-tions. A wide spectrum of equipment is available
to provide the aeration.Pure oxygen has been used in Danish Lake Hald
instead of air. The water quality of the lake waspermanently improved after the oxygenation star-
ted. Lately, the method has also been applied forLake Fure close to Copenhagen. Pure oxygen was
pumped to the three deepest points of the lake.In some cases, however, the effect was not very
great or as permanent as with other techniques,for instance siphoning of hypolimnetic water.
CIRCULATION OF WATERInduced water circulation can be used to breakdown a thermocline. This might prevent the for-
mation of anaerobic zones and the release of pho-sphorus from sediments. Furthermore, circulation
is able to transfer phytoplankton from the photiczone to deeper waters where light conditions are
weaker and so photosynthesis is either considera-bly reduced or ceases, depending upon how long
the cells are kept out of the photic zone.
VwerySmatrBook03.p65 2004-06-17, 17:39201
202
13. ESTUARINE & COASTAL AREAS: HOW TO PREVENT DEGRADATIONAND RESTORE
ECOHYDROLOGY AND PHYTOTECHNOLOGYAS MANAGEMENT TOOLS FOR ESTUARIESAND COASTAL AREASBasic to any management plan is the need for a
complete knowledge about a system’s functioning,how it is structured, what are the key species and
determinant environmental factors, what were thepristine characteristics of the area (necessary to
establish restoration objectives), what are the di-sturbance factors and what are their consequen-
ces to the system (necessary for mitigation pur-poses). Ecohydrology relates hydrological factors
and ecological phenomena in a two-way perspec-tive, which enables the control of ecology thro-
ugh hydrology and vice-versa. Phytotechnologiesuse the ability of plants to retain sediments and
control nutrient fluxes to restore impacted areas.Ecohydrology and phytotechnology are environ-
mentally friendly techniques and can provide adequ-ate and sustainable solutions for a large number of
problems and impacts in estuaries and coastal areas.
MITIGATION AND REMEDIATION IN ESTUARIESAND COASTAL AREASEstuaries and coastal areas are well known for their
high productivity, high carrying capacity and abi-lity to support, apart from resident species, a va-
riety of migratory fish, birds and invertebrates.The maximization of this capacity depends on a
variety of interacting attributes, several of whichreflect the significance of processes in the catch-
ment and the need for a holistic approach for suc-cessful estuarine management. However, several
actions or activities are responsible for reducingthe capacity of estuaries and coastal areas to play
their role as highly productive and biodiverse eco-systems. When these actions or activities cause
modifications in habitat characteristics and ham-per the normal use by resident or migratory spe-
cies, including humans, remediation and mitiga-tion techniques may be applied to restore the sys-
tem to pre-disturbance conditions, or to as pristi-ne as possible. Mitigation and restoration involve
the same types of activities but are done for sli-ghtly different reasons. Mitigation is done to com-
pensate damage done by a recent new disturbingfactor and aims to replace the habitats and values
lost in a particular disturbed site. Restoration aimsto compensate historical losses and to re-establish
past values and provide an enhancement of estu-arine and coastal values. Typically, mitigation and
restoration actions involve creation, restorationor enhancement of estuarine and coastal areas.
Creation refers to the addition of a new area, forexample, construction of a salt marsh or tidal flat.
Restoration refers to the return of parts of an es-tuary or coastal area that formerly belonged to
those systems, such as can be achieved by remo-ving or breaching a dike to allow return of tidal
action. Enhancement refers to the improvementof the quality of an estuarine or coastal area and
is frequently linked with the need to increase flu-shing and water circulation, which can be achie-
ved by opening or enlarging channels for watercirculation. However, the final goal of estuarine
and coastal management is, by planning and mo-nitoring the activities and uses of estuarine and
coastal areas according to their physical, chemi-cal and biological characteristics, to eliminate the
need for mitigation or restoration.
PREVENTION OF DEGRADATION AND RESTORA-TION OF ESTUARIES AND COASTAL AREASDegradation of estuarine and coastal areas can be
caused by a large number of activities and actions,both natural and human, which should be avoided
or prevented because of their potential for imme-diate or long-term damage to estuarine and co-
astal systems. These include such processes assedimentation, nutrient loading and eutrophica-
tion, toxic algal blooms, pollution, degradation ofhabitats and introduction of exotic species.
PREVENTION OF EUTROPHICATIONUSING PHYTOTECHNOLOGYPrevention of eutrophication in estuaries and co-
astal areas includes control of nutrient loading inthe entire catchment area. Intensive agricultural
practices, tourism (e.g., golf) and manure resul-ting from cattle breeding provide excessive quan-
tities of nutrients that reach an estuary by runoffor via groundwater and should be carefully moni-
tored. Upstream riparian and downstream salt-marsh or mangrove vegetation play a role as buf-
Managem
ent: Estuarine & Coastal Areas
VwerySmatrBook03.p65 2004-06-17, 17:39202
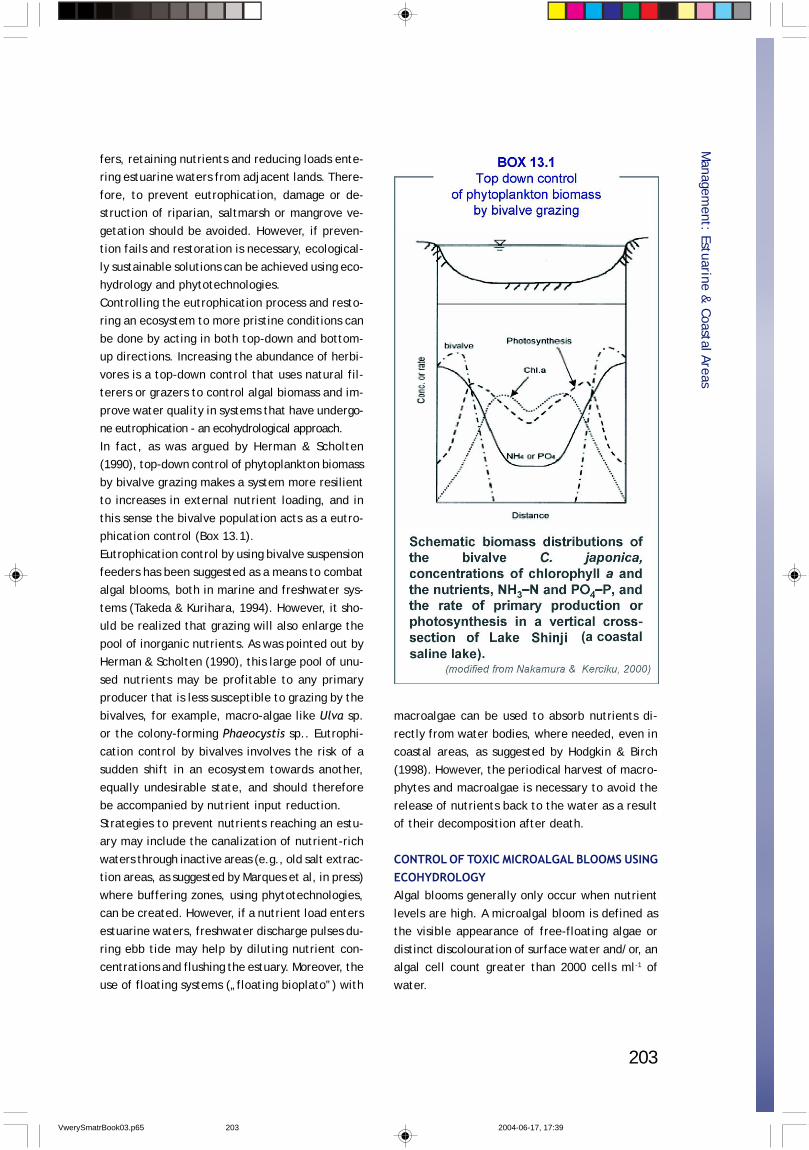
203
fers, retaining nutrients and reducing loads ente-ring estuarine waters from adjacent lands. There-
fore, to prevent eutrophication, damage or de-struction of riparian, saltmarsh or mangrove ve-
getation should be avoided. However, if preven-tion fails and restoration is necessary, ecological-
ly sustainable solutions can be achieved using eco-hydrology and phytotechnologies.
Controlling the eutrophication process and resto-ring an ecosystem to more pristine conditions can
be done by acting in both top-down and bottom-up directions. Increasing the abundance of herbi-
vores is a top-down control that uses natural fil-terers or grazers to control algal biomass and im-
prove water quality in systems that have undergo-ne eutrophication - an ecohydrological approach.
In fact, as was argued by Herman & Scholten(1990), top-down control of phytoplankton biomass
by bivalve grazing makes a system more resilientto increases in external nutrient loading, and in
this sense the bivalve population acts as a eutro-phication control (Box 13.1).
Eutrophication control by using bivalve suspensionfeeders has been suggested as a means to combatalgal blooms, both in marine and freshwater sys-
tems (Takeda & Kurihara, 1994). However, it sho-uld be realized that grazing will also enlarge the
pool of inorganic nutrients. As was pointed out byHerman & Scholten (1990), this large pool of unu-
sed nutrients may be profitable to any primaryproducer that is less susceptible to grazing by the
bivalves, for example, macro-algae like Ulva sp.or the colony-forming Phaeocystis sp.. Eutrophi-
cation control by bivalves involves the risk of asudden shift in an ecosystem towards another,
equally undesirable state, and should thereforebe accompanied by nutrient input reduction.
Strategies to prevent nutrients reaching an estu-ary may include the canalization of nutrient-rich
waters through inactive areas (e.g., old salt extrac-tion areas, as suggested by Marques et al, in press)
where buffering zones, using phytotechnologies,can be created. However, if a nutrient load enters
estuarine waters, freshwater discharge pulses du-ring ebb tide may help by diluting nutrient con-
centrations and flushing the estuary. Moreover, theuse of floating systems („floating bioplato”) with
macroalgae can be used to absorb nutrients di-
rectly from water bodies, where needed, even incoastal areas, as suggested by Hodgkin & Birch
(1998). However, the periodical harvest of macro-phytes and macroalgae is necessary to avoid the
release of nutrients back to the water as a resultof their decomposition after death.
CONTROL OF TOXIC MICROALGAL BLOOMS USINGECOHYDROLOGYAlgal blooms generally only occur when nutrient
levels are high. A microalgal bloom is defined asthe visible appearance of free-floating algae or
distinct discolouration of surface water and/or, analgal cell count greater than 2000 cells ml-1 of
water.
Managem
ent: Estuarine & Coastal Areas
VwerySmatrBook03.p65 2004-06-17, 17:39203
204
To prevent microalgal blooms the basic approachis to control nutrient loads and, indirectly, act on
the factors responsible for their excessive produc-tion. However, not only nutrient concentrations,
but also the ratio N:P:Si (1:1:16) should be moni-tored. In fact, particularly in dammed estuaries,
changes in the ratio occur, since nutrients are trap-ped in a dam, reducing silica availability down-
stream, while phosphorus and nitrogen concen-trations are re-established by anthropogenic di-
scharges (e.g., sewage, etc.). This decrease of Simay be limiting to diatom growth, the first stage
of phytoplanktonic succession (Rocha et al., 2002).A shift in the phytoplankton community may thus
occur, favouring the growth of cyanobacteria that,due to the availability of nutrients not used by
diatoms, may reach bloom concentrations. The factthat some cyanobacteria (e.g., Microcystis) and
dinoflagellates (e.g., Dinophysis) may become to-xic at high concentrations constitutes an added
problem to water quality degradation in estuari-ne and coastal zones. Also, changes in estuarine
and coastal water circulation (e.g., caused by con-struction of dykes, breakwaters, marinas) that mayreduce circulation or tidal effects in some areas,
promote nutrient accumulation. Therefore, pre-vention of microalgal blooms should include: con-
trol of factors responsible for nutrient productionand loading into water bodies, control of water
quantity retained by dams and control of activi-ties causing changes in water circulation in estu-
aries and coastal waters.Mitigation of microalgal bloom effects may inclu-
de control of nutrient loads into estuaries and co-astal waters by creating buffering zones with ri-
parian, salt marsh and mangrove vegetation. Nu-trient ratios can be maintained by management
of dam discharge. Such controlled discharge canalso contribute to stimulating zooplankton growth
and promote the top-down control of microalgae.In fact, pulses of freshwater discharge (short-term
inflows, 1-3 days) with their associated nutrientload, increases phytoplankton species diversity, as
estimated in modelling studies (Roelke, 2000) andobserved in microcosm experiments (Sommer,
1986) and field studies (Morais et al., 2003). Thisoccurs because disturbances over ranges of frequ-
ency and magnitude suppress competitive exclu-sion and promote high species diversity (Hutchin-
son, 1961). Because phytoplankton are often ableto respond more quickly to disturbance (physical-
chemical conditions) than zooplankton (Sommer,1986), succession from less edible, slower growing
k-selected phytoplankton species to more edibleand rapidly growing r-selected species, might oc-
cur. This will stimulate zooplankton growth resul-ting in a greater grazing pressure that will pre-
vent the excessive accumulation of phytoplank-ton and reduce the risk of algal blooms develo-
ping (Roelke, 2000). Zooplanktonic grazing pres-sure can also be increased by controlling and re-
ducing the abundance of zooplanktivorous fishes,as shown by Zalewski et al. (1990) in freshwater
systems. Similar interactions were observed in theGuadiana Estuary (south Portugal), where top-
down control of mesozooplankton and microzo-oplankton by fishes efficiently reduced grazing
upon phytoplankton (Box 13.2). Also, an increaseof bivalve species abundance, mainly filter-feeding
species, may reduce microalgal abundance andcontrol toxic blooms, as pointed out above. Final-ly, widening, opening or cleaning river and estu-
arine branches enables water circulation to dilutemicroalgal abundance and helps flush them to the open
ocean, reducing the risk of toxic algal blooms.
CONTROL OF ESTUARINE AND COASTAL EROSIONUSING PHYTOTECHNOLOGIESHuman activities in a river basin are often respon-sible for accelerated erosion of sediments that can
be transported to a river during rainy periods orfloods, contributing to sedimentation in estuaries
and coastal areas. Decreased river discharge intoan estuary, as in dammed rivers, promotes sedi-
ment transport from coastal areas into the estu-ary. Trapping of larger grain size sediments by dams
reduces sediment grain size in estuarine and co-astal areas, affects benthic habitats, reduces se-
diment stability for plants, affects salt marsh andsand dune stability, and causes an inward displa-
cement of the coast line (Box 13.3).In order to prevent such environmental consequ-
ences to estuarine and coastal ecosystems, activi-ties that interfere with sediment transport should
Managem
ent: Estuarine & Coastal Areas
VwerySmatrBook03.p65 2004-06-17, 17:39204
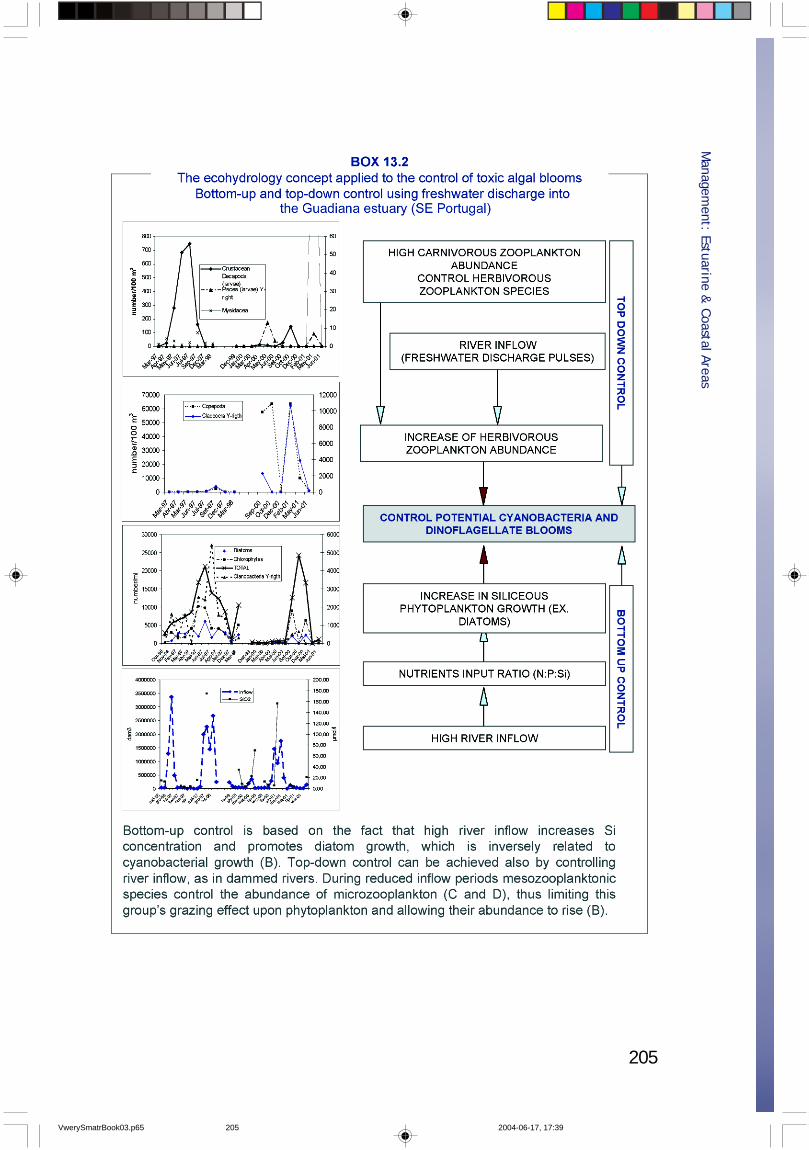
205
Managem
ent: Estuarine & Coastal Areas
VwerySmatrBook03.p65 2004-06-17, 17:39205
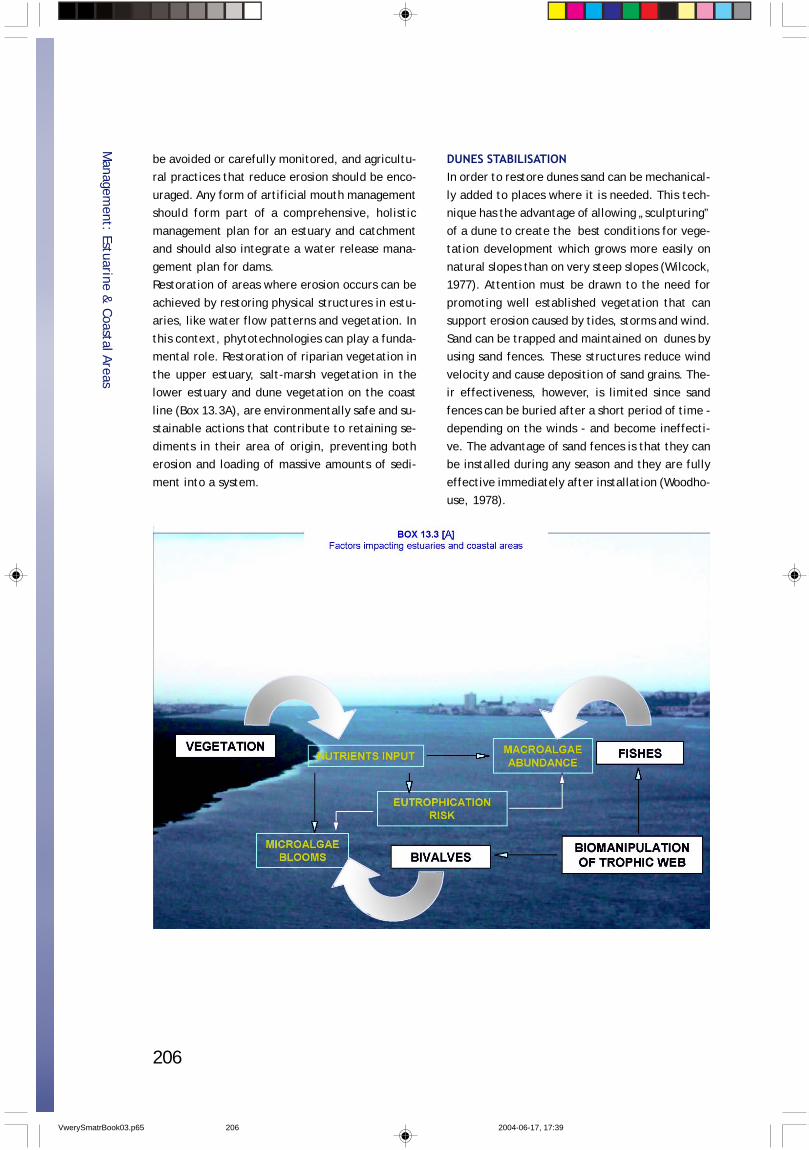
206
DUNES STABILISATIONIn order to restore dunes sand can be mechanical-
ly added to places where it is needed. This tech-nique has the advantage of allowing „sculpturing”
of a dune to create the best conditions for vege-tation development which grows more easily on
natural slopes than on very steep slopes (Wilcock,1977). Attention must be drawn to the need for
promoting well established vegetation that cansupport erosion caused by tides, storms and wind.
Sand can be trapped and maintained on dunes byusing sand fences. These structures reduce wind
velocity and cause deposition of sand grains. The-ir effectiveness, however, is limited since sand
fences can be buried after a short period of time -depending on the winds - and become ineffecti-
ve. The advantage of sand fences is that they canbe installed during any season and they are fully
effective immediately after installation (Woodho-use, 1978).
Managem
ent: Estuarine & Coastal Areas
be avoided or carefully monitored, and agricultu-ral practices that reduce erosion should be enco-
uraged. Any form of artificial mouth managementshould form part of a comprehensive, holistic
management plan for an estuary and catchmentand should also integrate a water release mana-
gement plan for dams.Restoration of areas where erosion occurs can be
achieved by restoring physical structures in estu-aries, like water flow patterns and vegetation. In
this context, phytotechnologies can play a funda-mental role. Restoration of riparian vegetation in
the upper estuary, salt-marsh vegetation in thelower estuary and dune vegetation on the coast
line (Box 13.3A), are environmentally safe and su-stainable actions that contribute to retaining se-
diments in their area of origin, preventing botherosion and loading of massive amounts of sedi-
ment into a system.
VwerySmatrBook03.p65 2004-06-17, 17:39206
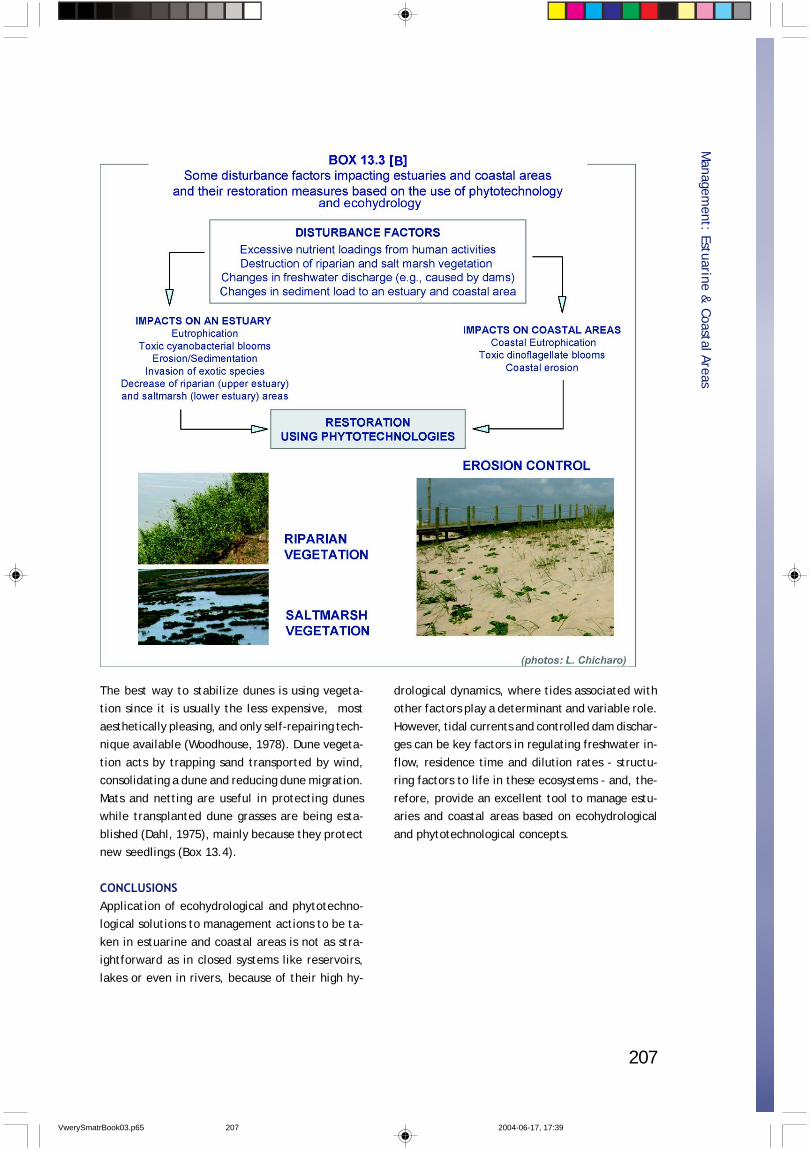
207
The best way to stabilize dunes is using vegeta-tion since it is usually the less expensive, most
aesthetically pleasing, and only self-repairing tech-nique available (Woodhouse, 1978). Dune vegeta-
tion acts by trapping sand transported by wind,consolidating a dune and reducing dune migration.
Mats and netting are useful in protecting duneswhile transplanted dune grasses are being esta-
blished (Dahl, 1975), mainly because they protectnew seedlings (Box 13.4).
CONCLUSIONSApplication of ecohydrological and phytotechno-logical solutions to management actions to be ta-
ken in estuarine and coastal areas is not as stra-ightforward as in closed systems like reservoirs,
lakes or even in rivers, because of their high hy-
drological dynamics, where tides associated withother factors play a determinant and variable role.
However, tidal currents and controlled dam dischar-ges can be key factors in regulating freshwater in-
flow, residence time and dilution rates - structu-ring factors to life in these ecosystems - and, the-
refore, provide an excellent tool to manage estu-aries and coastal areas based on ecohydrological
and phytotechnological concepts.
Managem
ent: Estuarine & Coastal Areas
VwerySmatrBook03.p65 2004-06-17, 17:39207
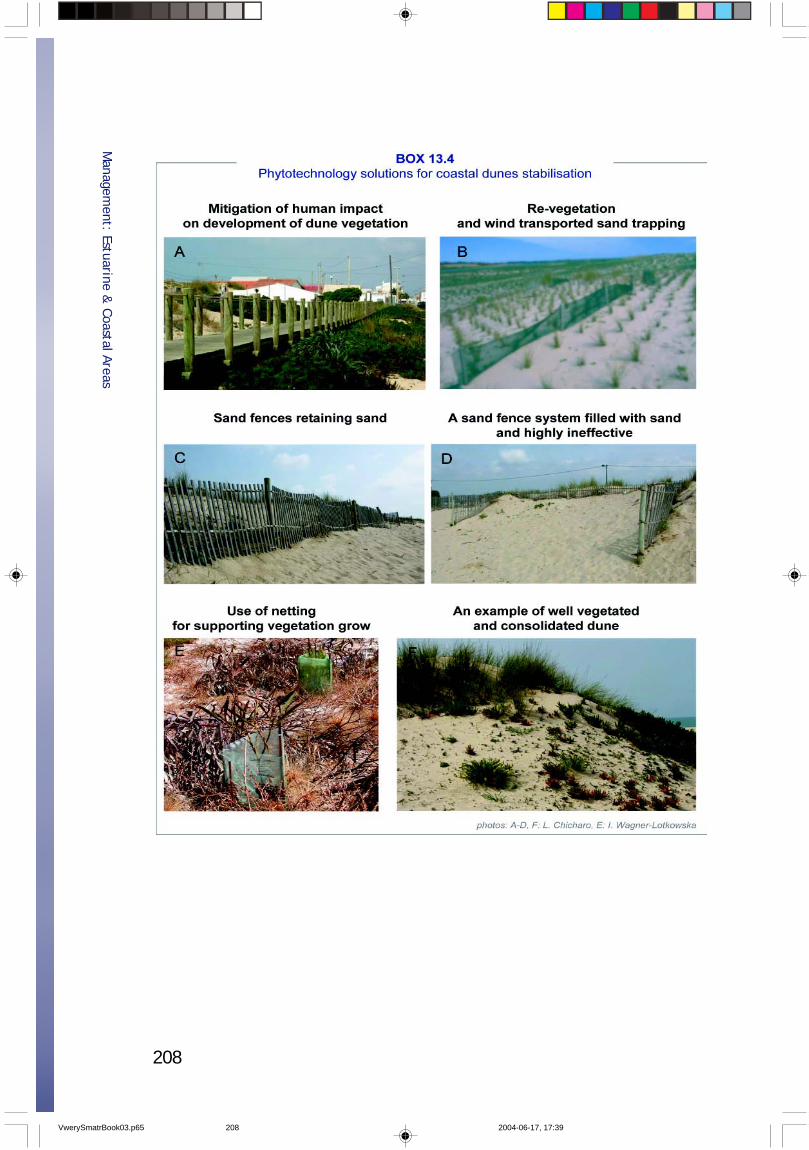
208
Managem
ent: Estuarine & Coastal Areas
VwerySmatrBook03.p65 2004-06-17, 17:39208
209
The maintenance of homeostatic equilibrium inan ecosystem in order to ensure its ability to con-
tinue to produce the desired resources, and topreserve and even enhance its resilience and car-
rying capacity to assimilate natural and anthropo-genic stresses, is a key element in achieving su-
stainable development. The ecohydrological ap-proach, by integrating knowledge of biota with
that of a wide range of hydrological processes atmedium or mesoscales (which includes microhabi-
tats, river systems, and catchment areas), provi-des the scientific background for maintaining the
integrity of ecological processes. This integrationis one of the three key considerations on which
the concept of sustainable development has beenbuilt, as depicted in Box 14.1.
Being that water is essential to human life andeconomic growth, sound management of water
resources is central to sustainable development.Ecohydrology, therefore, recognises that sustaina-
ble development is dependent on the ability of anecosystem to maintain evolutionary-established
processes and patterns of water and nutrient circula-tions and energy flows at a basin scale.
In promoting the integration of a catchment andit’s biota into a single entity, the use of ecosystem
properties becomes a management tool withinwhich ecohydrology can address fundamental
aspects of water resources management. In ef-fect, it provides the sound scientific basis for ad-
opting a watershed as the basic planning unit. Byincorporating the concept of improved ecosystem
resilience as a management tool, ecohydrologystrengthens the rationale for adopting a preventi-
ve, holistic, and global approach to the water-shed - as opposed to the reactive, sectoral, and
site specific approach typical of present exten-ded practices in water resources management. At
the same time, ecohydrology stresses the impor-tance of ecotechnological measures as an integral
component of water management, complementingstandard engineering approaches.
But water resources management goes beyondthese fundamental aspects understanding natural
processes and the adoption of technological ap-proaches to address the optimum development and
14.A. SOCIO-ECONOMIC ASPECTS OF ECOHYDROLOGY &PHYTOTECHNOLOGY APPLICATIONS IN INTEGRATED WATERSHEDMANAGEMENT IWM
use of water resources and their protection. Fur-ther, development, use, and protection, in terms
of an ecohydrological approach, extend to pre-sent and intergenerational equity concerns and a
full accounting for the economic, social, and envi-ronmental values of water. Thus, ecohydrology
involves policy, institutional, economic, social,environmental and legal issues, configuring a mul-
tidimensional space that needs to be integratedby means of sound management tools and approaches.
During recent decades, knowledge derived fromsuccesses and failures in the management of the
environment and natural resources, particularlywater, has contributed to the build up of a well
documented set of basic principles for sound ma-nagement of water and other natural resources,
and for the protection of the environment, parti-cularly aquatic ecosystems. These principles con-
stitute a rationale founded upon scientific know-ledge, which, according to generalized worldwi-
de experience, guarantee a better approach tothe global objective of „sustainable management
of water resources, including the protection of aqu-atic ecosystems and freshwater living resources”.
Mar del Plata 1977, Dublin 1992, Río de Janeiro1992, and many other renowned international
meetings are milestones at which some basic glo-bal understandings, such as the rational use of
water; integrated management of water resour-ces; use of the watershed as a basic planning unit;
the social and economic value of water; the roleof water in ecosystem protection; etc., have been
achieved. Together with the need for sound ma-nagement tools, such as proper regulatory frame-
works, the incorporation and transfer of „clean”technologies, environmental education, public
participation, access to information, use of eco-nomic and financial instruments, and the promo-
tion of sustainable practices, etc., these princi-ples have gained international consensus. In par-
ticular, Dublin’s principle 1 stands out among thembecause of its extended and complete recognition.
The international community, in its search for uni-versal truths and simplicity, attempted to sum-
marize this global knowledge in „paradigms”,which express in a few words, a complex set of
Other Aspects of W
atershed Managem
ent
VwerySmatrBook03.p65 2004-06-17, 17:39209
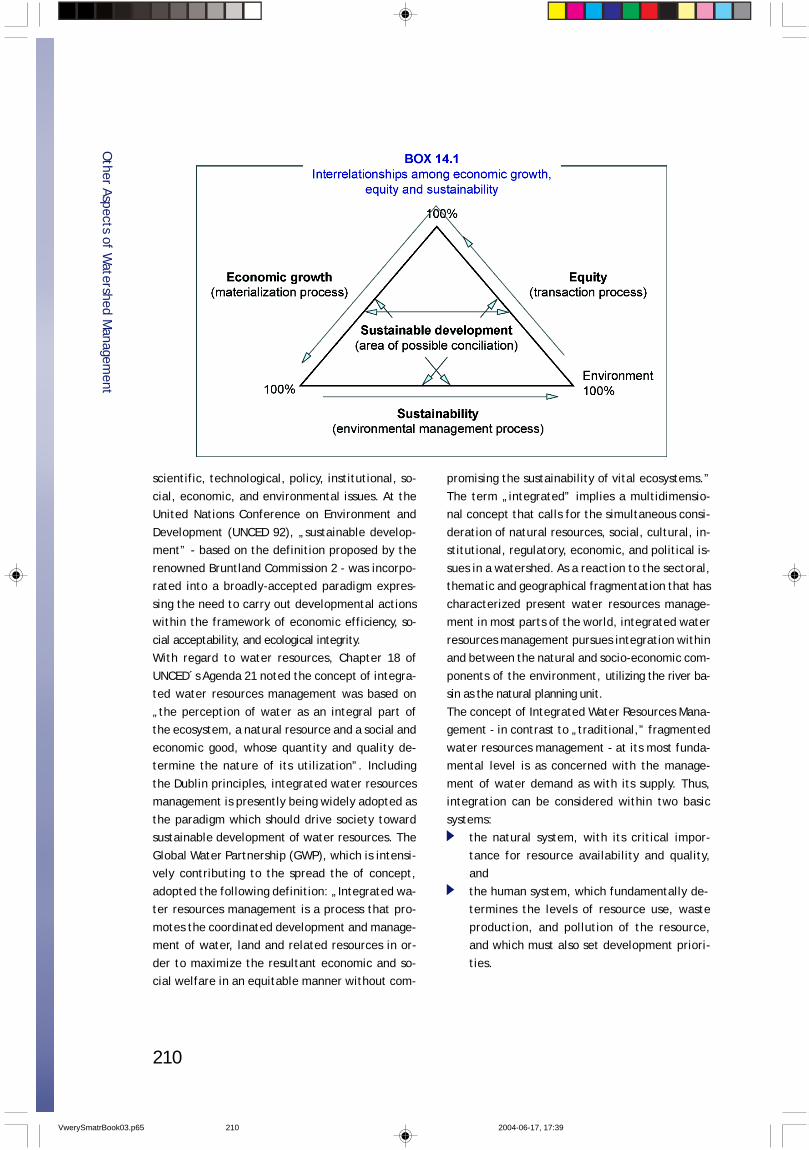
210
scientific, technological, policy, institutional, so-
cial, economic, and environmental issues. At theUnited Nations Conference on Environment and
Development (UNCED 92), „sustainable develop-ment” - based on the definition proposed by the
renowned Bruntland Commission 2 - was incorpo-rated into a broadly-accepted paradigm expres-
sing the need to carry out developmental actionswithin the framework of economic efficiency, so-
cial acceptability, and ecological integrity.With regard to water resources, Chapter 18 of
UNCED´s Agenda 21 noted the concept of integra-ted water resources management was based on
„the perception of water as an integral part ofthe ecosystem, a natural resource and a social and
economic good, whose quantity and quality de-termine the nature of its utilization”. Including
the Dublin principles, integrated water resourcesmanagement is presently being widely adopted as
the paradigm which should drive society towardsustainable development of water resources. The
Global Water Partnership (GWP), which is intensi-vely contributing to the spread the of concept,
adopted the following definition: „Integrated wa-ter resources management is a process that pro-
motes the coordinated development and manage-ment of water, land and related resources in or-
der to maximize the resultant economic and so-cial welfare in an equitable manner without com-
promising the sustainability of vital ecosystems.”
The term „integrated” implies a multidimensio-nal concept that calls for the simultaneous consi-
deration of natural resources, social, cultural, in-stitutional, regulatory, economic, and political is-
sues in a watershed. As a reaction to the sectoral,thematic and geographical fragmentation that has
characterized present water resources manage-ment in most parts of the world, integrated water
resources management pursues integration withinand between the natural and socio-economic com-
ponents of the environment, utilizing the river ba-sin as the natural planning unit.
The concept of Integrated Water Resources Mana-gement - in contrast to „traditional,” fragmented
water resources management - at its most funda-mental level is as concerned with the manage-
ment of water demand as with its supply. Thus,integration can be considered within two basic
systems:the natural system, with its critical impor-
tance for resource availability and quality,and
the human system, which fundamentally de-termines the levels of resource use, waste
production, and pollution of the resource,and which must also set development priori-
ties.
Other Aspects of W
atershed Managem
ent
VwerySmatrBook03.p65 2004-06-17, 17:39210
211
Integration has to occur both within and betweenthese categories, taking into account variability
in time and space.Ecohydrology is another „paradigm” which addres-
ses the integrated study and use of ecosystems,including their hydrological characteristics and
processes, and their combined potential to influ-ence water dynamics and quality, particularly at
the catchment scale. In terms of integrated wa-ter resources management, it addresses, and scien-
tifically strongly supports, integration within thenatural system as well as providing guiding princi-
ples and tools to integrate a consideration of eco-system components within the development fra-
mework. Furthermore, it enhances a preventiveapproach, through improvement of ecosystem re-
silience that amplifies opportunities for achievingsustainable development.
Within the context of integrated water resourcesmanagement, ecohydrology should be incorpora-
ted into the objectives and policy framework forwater management at the highest institutional
levels, as well as be disseminated at the commu-nity level to promote environmental awareness,enhance water resource values, and stimulate their
protection.Ecohydrology also provides scientific support for
the use of a watershed as the planning unit ofchoice for water resources management. In this
manner, ecohydrology contributes to building abasin approach to water resources management
at the community level. In effect, ecohydrologycreates a common watershed vision that is funda-
mental for promoting the active involvement andparticipation of stakeholders, and for putting into
effect a process of „social negotiation” that sho-uld be at the root of all decision-making within a
basin. Also, it facilitates the solution of downstre-am-upstream conflicts through enhancing so-cal-
led „hydro-solidarity”.Ecohydrology also helps to strengthen the incor-
poration of social and environmental values intostrategic water resources planning at the water-
shed level, facilitating technological approachesthat will contribute to sustainability and, making
use of ecosystem properties. Improved ecosystemresilience and ecotechnologies should be an inte-
gral part of pollution prevention and water quali-ty restoration programs and measures.
By simultaneously addressing both hydrological andbiotic processes at various levels (microhabitat,
river systems, entire watersheds) within an eco-system, ecohydrology provides a sound basis for
land and water use, as well as for integrated sur-face and groundwater management. Thus, ecohy-
drological principles may strongly influence theconceptual basis upon which regulatory and eco-
nomic instruments are devised to induce humanbehaviours compatible with the objectives and
goals of strategic, basin-scale planning (TAC Back-ground Papers No. 4. Global Water Partnership.
Technical Advisory Committee, 2000).Because of its holistic and basin-wide approaches,
ecohydrology requires a strong commitment fromgovernments and water users to strengthen the
knowledge base, in terms of monitoring, datamanagement, research and technological develop-ment. It also involves the joint efforts of govern-
mental agencies and stakeholders across variousjurisdictional boundaries within a basin to coordi-
nate data gathering, information exchange, andjoint interpretation of ecosystem functioning, root
cause analyses, and the effects of human inte-rventions on ecosystem components. It basically
requires that stakeholders, users, and civil socie-ty become aware of its principles and guidelines
for action, thus promoting a bottom-up processthat will instil ecohydrological principles into in-
stitutional and legal frameworks.Therefore, ecohydrology should evolve from a
scientific approach to an institutional approach,within the framework of integrated water resour-
ces management, incorporating the economic, fi-nancial and social dimensions that currently cha-
racterize globally-accepted paradigms.
Other Aspects of W
atershed Managem
ent
MAKE SURE TO CHECK THESE RESOURCES:Guidelines: chapters 1.D, 1.F, 10
VwerySmatrBook03.p65 2004-06-17, 17:39211
212
14.B. CAN GLOBAL CLIMATE CHANGES AFFECT MANAGEMENTOUTCOMES?
An assessment of potential water resources im-pacts associated with climate change, and the
evaluation of possible water management strate-gies, deserves increased attention of the world’s
community. Although „No global crisis is likely toshake the world the way the energy crisis of the
seventies did” [Postel 1992], the global and regio-nal food supply and economic development may
be affected by climate-induced changes in wateravailability in crop-producing regions and in large
urban agglomerations. The assessment of climatechange impacts on water resources management
attempts to portray how the range of possiblechanges in temperature, precipitation and runoff
is likely to affect the range of water uses and the-ir socio-economic implications.
It is still difficult to predict or quantitatively as-sess the impacts of climate perturbations on wa-
ter management. There is, moreover, no generalconsensus among most of national water institu-
tions on the possible adverse consequences ofchange in climatic processes caused by anthropo-
genic forcing. In spite of existing uncertainties,the impact of climate on water systems may cre-ate serious social problems, at least in vulnerable
regions of the world. In the long-term thinkingabout the Earth’s economic future, this issue sho-
uld not be neglected. Scenarios of possible trendsin demographic, economic, technological, and
geophysical processes must be investigated. Thecomplexity of the global atmospheric/hydrologic
system means that one cannot rule out abruptchanges, and the world’s water community sho-
uld be prepared to cope with them.The progress in assessing the implications of cli-
mate change on water supply and demand, andconsequently on management of catchment sys-
tems, as well as in assessing the impact of climateon physical, chemical and biological processes, is
evident. However, most of the relevant theoriesand models still need to be improved in order to
meet requirements of water resources practice.The IPCC reports (1996, 2001) outlined difficul-
ties in analyzing climate change impacts on watermanagement. Although a number of case studies
have been conducted in specific river basins - al-most exclusively in developed countries - the un-
certainties in climate change impact on watermanagement remain large. Climate model will tend
to estimate that the world as a whole become more„moist”, nevertheless some large areas may expe-
rience a decrease in precipitation, accompaniedby increased evapotranspiration due to higher tem-
peratures. It is necessary to distinguish betweenthe physical effects of climate change and the
impacts reflecting societal values placed on a chan-ge in hydrological quantities. This impact highly
depends on the level of development of the watersystem: in some cases large climate change-indu-
ced hydrological effects may lead to insignificantincreases of economic costs, while in water scar-
ce regions a small change may have dramatic con-sequences. A conjunctive use system involving se-
veral reservoirs, river regulation and groundwa-ter withdrawals will be affected differently than
a simple supply system based on direct water abs-tractions from a non-regulated river.
Studies that have considered possible changes inregional water management for a variety of cli-
mate scenarios fall into three categories. The firstinfers changes in potential water supply due tochanges in the water balance of a catchment. Pro-
blems in maintaining irrigation supplies from di-rect river abstractions may be inferred, for exam-
ple, if summer river flows are simulated to decli-ne. The second research group considered the sen-
sitivity of managed supply/demand systems - usu-ally containing storage reservoirs - to changes in
hydrologic inputs. The third group of studies exa-mined integrated water demand/supply systems,
additionally taking into account climate impactson physical and biological processes in rivers and
lakes.Demands may increase in all water-use sectors with
an increase of temperature - the broadly accep-ted consequence of global climate change. Unfor-
tunately, regional and local precipitation changes,having also important influences on water de-
mands, are much less clear. Studies on domesticand industrial water consumption show a great deal
of opportunity to adapt to changed climate. Manyof the responses being proposed to adapt to cli-
mate change require reduction of demands andreallocation of water among water users. The big-
Other Aspects of W
atershed Managem
ent
VwerySmatrBook03.p65 2004-06-17, 17:39212
213
gest current pressure on water resources is cau-sed by high population increases in some parts of
the world, and by progressing concentration ofeconomic activities in big urban agglomerations.
Results of investigations on domestic water usereported in the literature lead to the conclusion
that per capita water requirements will probablychange insignificantly in a warmer climate. The
amount of water needed for technological pro-cesses in industry is rather insensitive to changes
in temperature and precipitation, with the excep-tion of increased demand of water for cooling pur-
poses. Hydropower production will decrease withlower river flow.
Serious problems may arise in agriculture, whichis the largest consumer of water in the world, ac-
counting at present for 2/3 of global water with-drawals. As human populations in developing co-
untries increase during the next century, the amo-unt of irrigated croplands may have to increase to
guarantee global food security. Some recent stu-dies indicate that for a 1oC increase of air tempe-
rature one may expect a 12 to 25 percent incre-ase in irrigation demands. Another study shows thatfor a broad range of prescribed temperature in-
creases, irrigation demand may increase even incases of up to a 20% precipitation increase. Con-
sequently, on a global scale the amount of waterneeded for sustainable agricultural production may
double by the middle of the next century. This, inturn, may largely extend the number of countries
suffering chronic water scarcity. It is important toemphasize that the ultimate effect of global war-
ming on water demand for irrigation depends si-gnificantly on agricultural policy, food prices and
more equitable distribution of food among nations.At least for the next two decades, non-climatic
factors will probably dictate what kind of measu-res should be undertaken to secure sustainable
water supplies. Climate change predictions will,however, add a new highly uncertain component
to the challenge of managing water resources.There are still large uncertainties that are propa-
gated through the numerous levels of analysis asone moves from greenhouse gases scenarios; thro-
ugh the comparison of different global climatemodels outputs; transference of climatic data to
runoff and to other hydrologic variables; impactson water management decisions; and, finally, on
the socio-economic and incremental impacts ofresponse measures. In addition, incremental im-
pacts due exclusively to climate change should bedifferentiated from changes (sometimes also hi-
ghly uncertain) that would occur in the absenceof climate change.
Water management at present is frequently con-cerned with reconciling competing demands for
limited water resources. At present, these con-flicts are solved through legislation, prices, cu-
stoms or a system of priority water rights. A chan-ge in both the amount of water available and wa-
ter demanded is likely to lead to increased com-petition for resources. Conflicts may arise betwe-
en users, regions, and countries, and their possi-ble resolution depends highly on political and in-
stitutional arrangements in force. Because diffe-rent users have different priorities and risk tole-
rances, the balance point among them, in the faceof feasible climate change scenarios, may be qu-
ite different from now on (e.g., hydropower pro-duction and in-stream uses may be lost comparedto domestic and agriculture water supply). The
marginal costs of reducing additional incrementsof water scarcity risk rises rapidly in the case of
supply with required high reliability.Relatively few research results have assessed cli-
mate change effects on intensity and frequencyof extreme hydrological events: floods and dro-
ughts. Unfortunately, the state-of-the-art globalatmospheric models may have produced until re-
cently, scenarios at too coarse spatial and tempo-ral resolutions to be useful for assessing expected
changes in hydrological extremes. However, re-cently observed increased variability of some cli-
matic variables seems to have affected flood anddrought risks in many regions of the world. The
number of major flood disasters world-wide hasgrown in the past decades: six in the 1950s, seven
in the 1960s, eight in the 1970s, 18 in the 1980s,and 26 in the 1990s (Berz 2001). In the second
half of the 20th century there has been an incre-ased number of droughts in some areas. An obse-
rved upward trend in the number of deaths and inmaterial losses due to weather related disasters
Other Aspects of W
atershed Managem
ent
VwerySmatrBook03.p65 2004-06-17, 17:39213
214
might be at least partly explained by the non-sta-tionary nature of climatic processes.
The fundamental question is what kind of adapti-ve measures may be applied to cope with possible
negative consequences of climatic perturbations?The answer is not simple because of high uncerta-
inties accompanying the climate change issue. TheIPCC reports contain an extended discussion on
the philosophy of adaptation, and a list of ada-ptation options suited to the range of water ma-
nagement problems that are expected under cli-mate change. Based on a review of the most re-
cent literature, it may be stated that few additio-nal water management strategies, unique to cli-
mate change effects, have been proposed, otherthan to note that nations have to implement ac-
tion plans for sustainable water resources mana-gement as part of their obligation towards AGEN-
DA 21. The principles laid out in that documentmay serve as a guide for developing a policy that
would enable river basin authorities and waterstakeholders to prepare for the uncertain hydro-
logic and demand conditions that might accompa-ny global warming.There are many possibilities for adaptation me-
asures or actions. An overview of water supply anddemand management options is presented in IPCC
documents. A long-term strategy requires that aseries of plausible climate and development sce-
narios be formulated, based on different combi-nations of population and climate change predic-
tion, along with economic, social and environmen-tal objectives. After development strategies are
established, taking into account the possibility ofclimate change, a set of alternative long-term
water management policies might be formulatedthat consist of technical measures, policy instru-
ments and institutional arrangements, designedto meet the objectives of a particular develop-
ment setting.The range of response strategies must then be
compared and appraised, each with different le-vels of reliability, costs, environmental and socio-
economic impacts. Some of the water manage-ment strategies will be particularly well suited to
deal with climate change uncertainty - i.e., todevelop reliable, robust and resilient water sys-
tems focusing on environmental and economic su-stainability. The performance of water systems
should be tested under varying climatic conditions.After application of engineering design criteria to
various climate alternatives, the selection of anoptimal water resources plan must be based on
social preferences and political realities. It sho-uld be added that engineering design procedures
also evolve over time, and may be updated asmeteorological and hydrological records are exten-
ded.The nature of contemporary water resources ma-
nagement is such that countless factors, econo-mic criteria, and design standards are incorpora-
ted because of the complexity of integrated wa-ter management and objectives (reliability, costs
and safety). The key problem in responding topossible consequences of man-induced global war-
ming is to decide when and what kind of adaptivemeasures should be undertaken to assure reliabi-
lity of water supply and to protect against negati-ve economic effects of hydrologic extremes. Wa-
ter policy decisions always depend on local hydro-logic conditions, economic situations, and natio-nal priorities. There is, for example, no reason to
apply sophisticated decision-making techniques forriver systems abundant of water when the results
of any climate impact assessment will be trivial.On the other hand, even limited climatic distur-
bances may lead to a worsening water situation inarid and semi-arid regions, requiring urgent ada-
ptation decisions.There is no standard, prescribed approach. In
watersheds that have little or no control of natu-ral flows, and are largely dependent on precipita-
tion, a different set of water management ada-ptation strategies should be implemented than in
river basins with a high degree of control by sto-rage reservoirs, canals, levees etc. Rapidly urba-
nizing areas will require different responses thanagricultural regions. In general, if a rational wa-
ter management strategy is undertaken to dealwith reasonably foreseeable needs of a region in
the absence of climate change, such a strategymay also serve to offset much of the range of po-
ssible adverse consequences of climate change.Two approaches are advocated in dealing with
Other Aspects of W
atershed Managem
ent
VwerySmatrBook03.p65 2004-06-17, 17:39214

215
adaptation of water systems to changed climaticconditions (Waggoner 1990). Firstly, a „wait and
see” or „business as usual” strategy, which meansto postpone decisions on adaptation measures until
more reliable information on global atmosphericprocesses become available. Existing water sche-
mes remain unchanged then, and the new oneswill be planned and implemented according to
standard procedures. In the case of large hydrau-lic schemes a very long time is needed for their
planning and implementation. As a result, thisapproach may cause undesirable delays in taking
Other Aspects of W
atershed Managem
ent
necessary decisions. Secondly, a „minimum regret”approach, when policy decisions are taken to so-
lve current problems in the best possible way and,at the same time, to prepare water systems for
possible changes and surprises by making themmore robust, resilient and flexible for any future.
The latter approach assumes that optimality rulesshould be applied to a range of climatic scena-
rios. Final decisions may be taken by comparingcosts, benefits and losses for each scenario, and
on a somewhat subjective interpretation of expec-ted results.
MAKE SURE TO CHECK THESE RESOURCES:
Guidelines: chapters 4.H
VwerySmatrBook03.p65 2004-06-17, 17:39215

216
VwerySmatrBook03.p65 2004-06-17, 17:39216

217
VwerySmatrBook03.p65 2004-06-17, 17:43217

218
VwerySmatrBook03.p65 2004-06-17, 17:43218
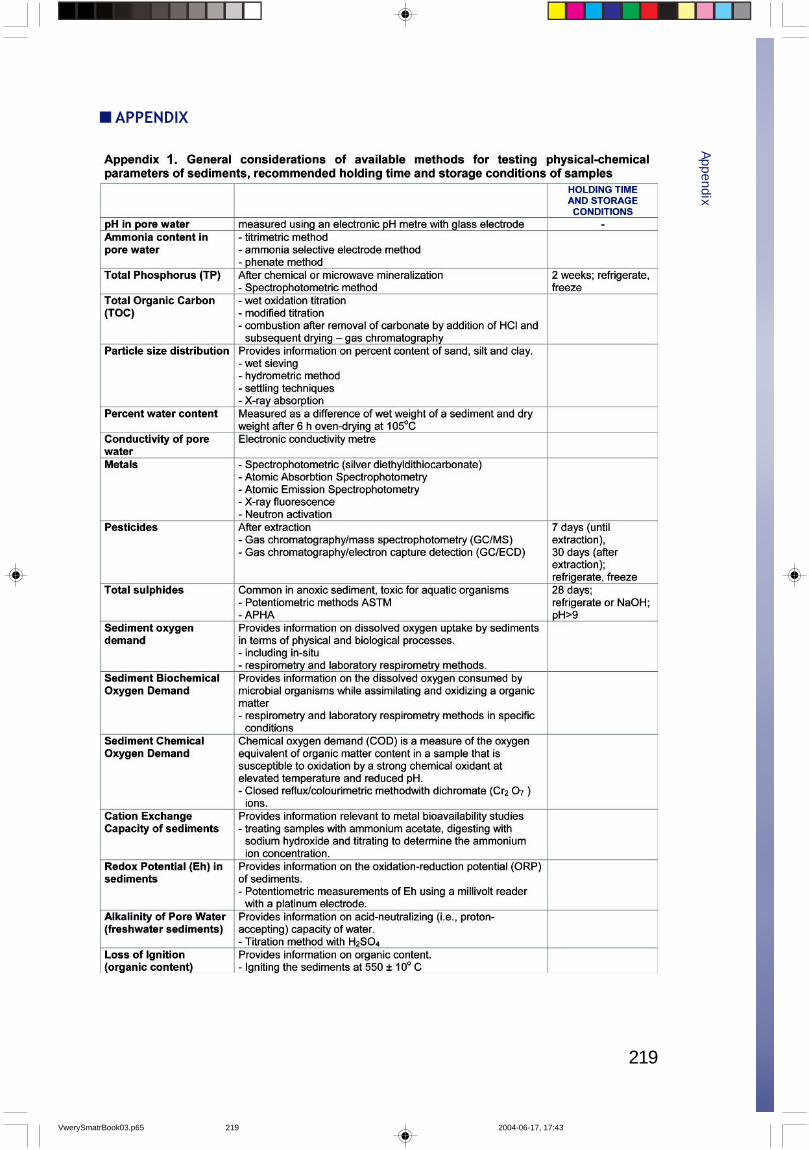
219
APPENDIXAppendix
VwerySmatrBook03.p65 2004-06-17, 17:43219

220
Appendix
VwerySmatrBook03.p65 2004-06-17, 17:43220
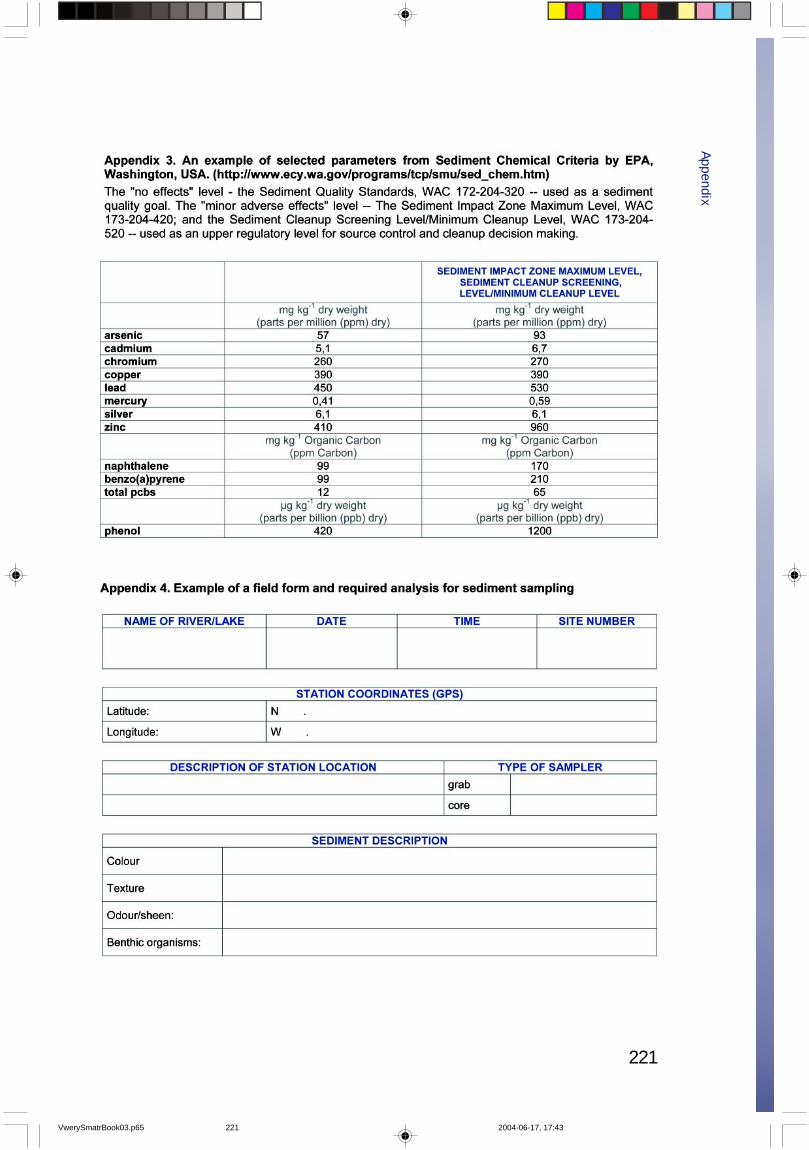
221
Appendix
VwerySmatrBook03.p65 2004-06-17, 17:43221
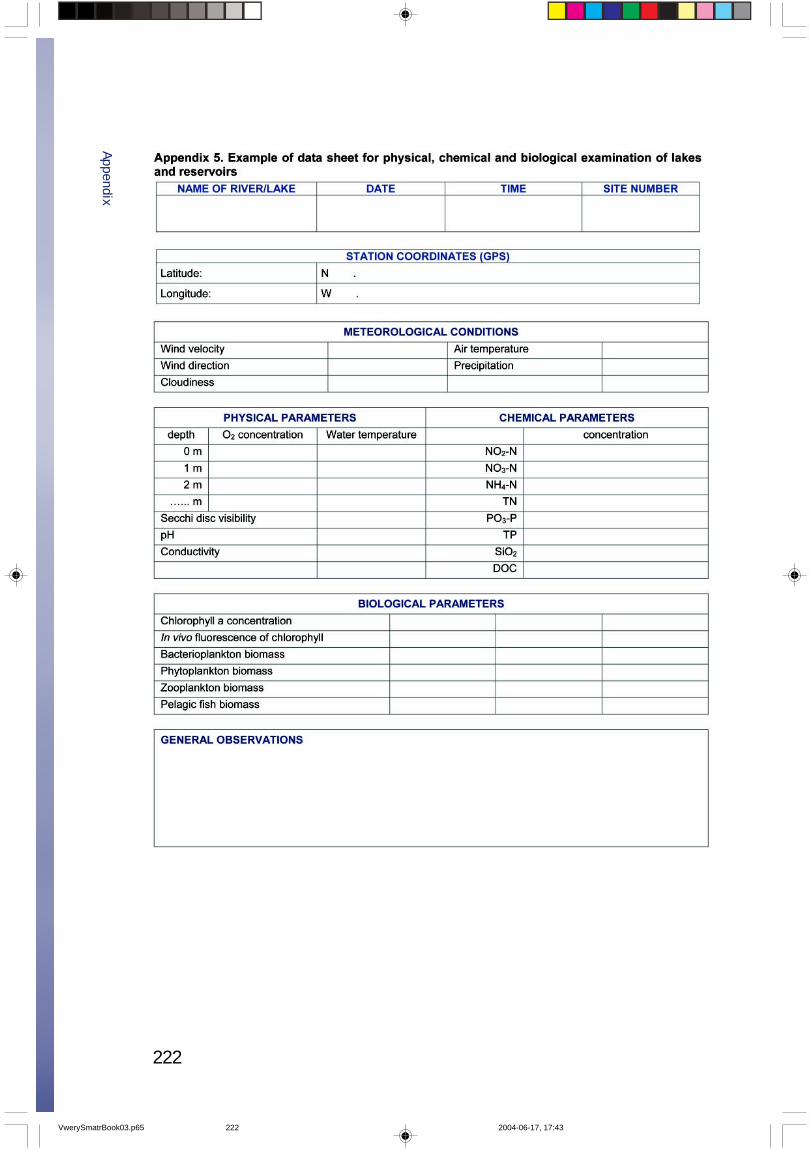
222
Appendix
VwerySmatrBook03.p65 2004-06-17, 17:43222
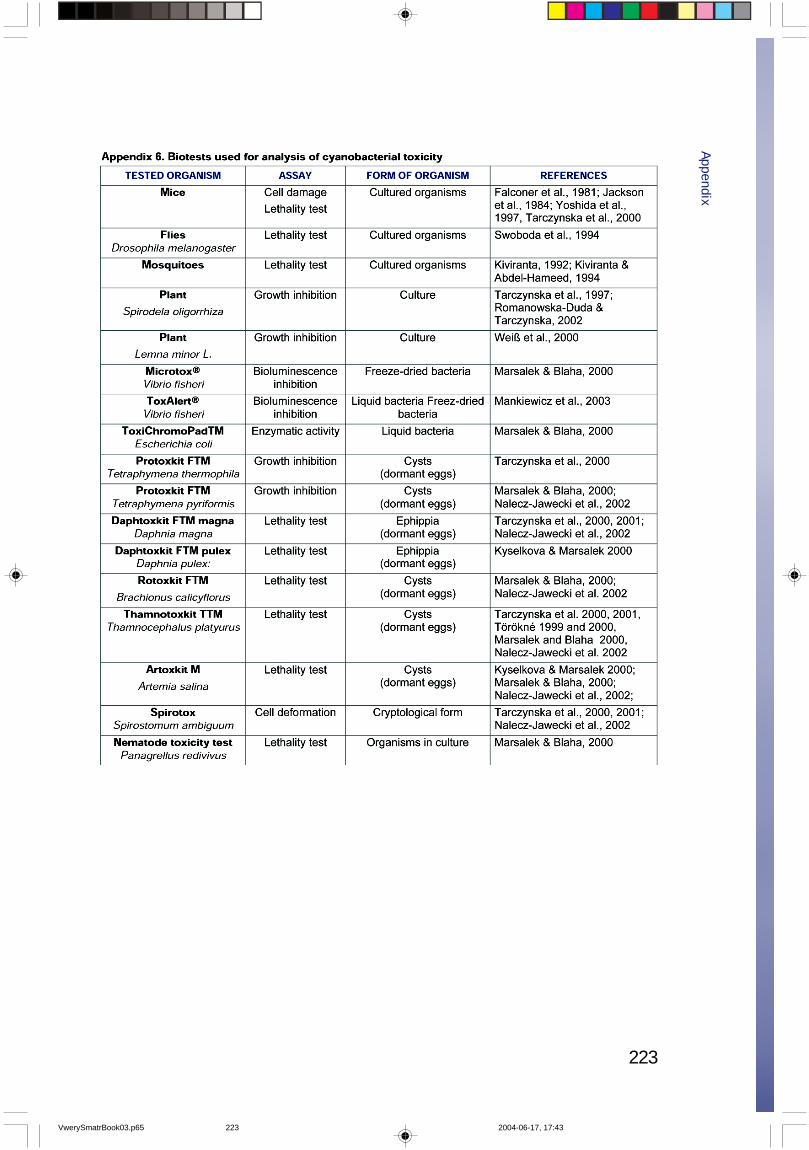
223
Appendix
VwerySmatrBook03.p65 2004-06-17, 17:43223

224
Appendix
VwerySmatrBook03.p65 2004-06-17, 17:43224
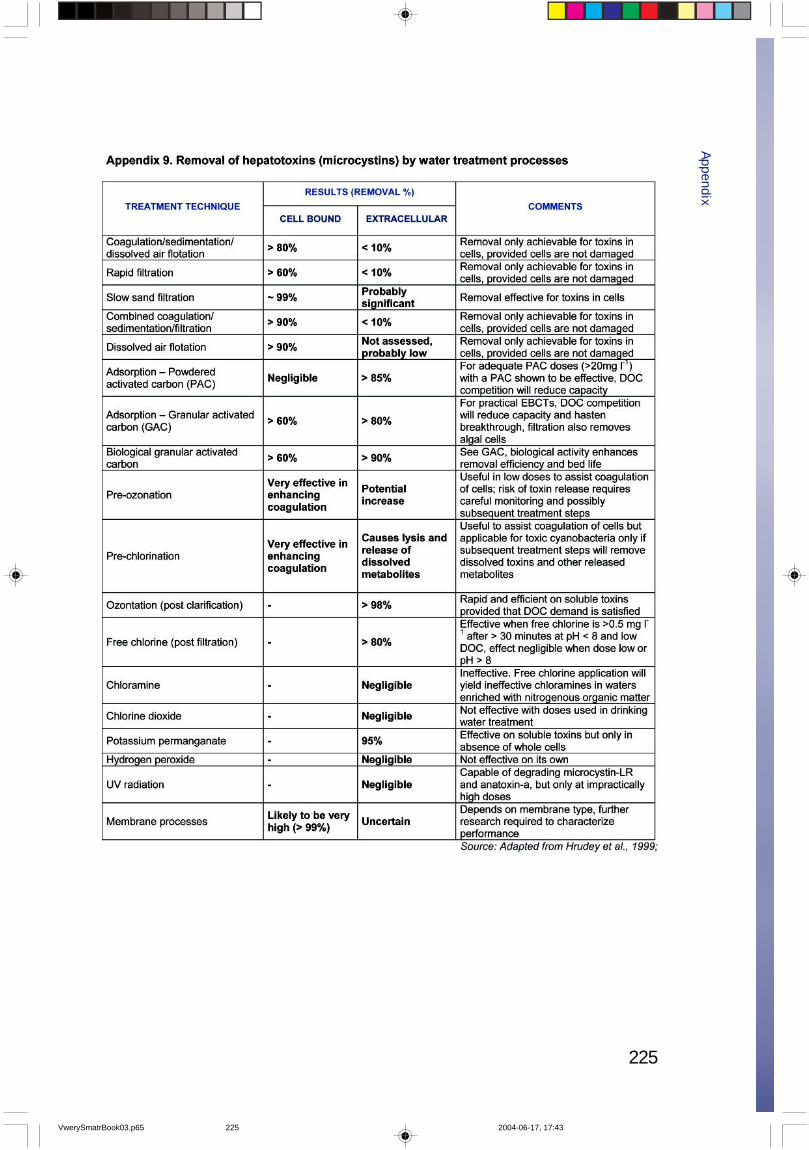
225
Appendix
VwerySmatrBook03.p65 2004-06-17, 17:43225
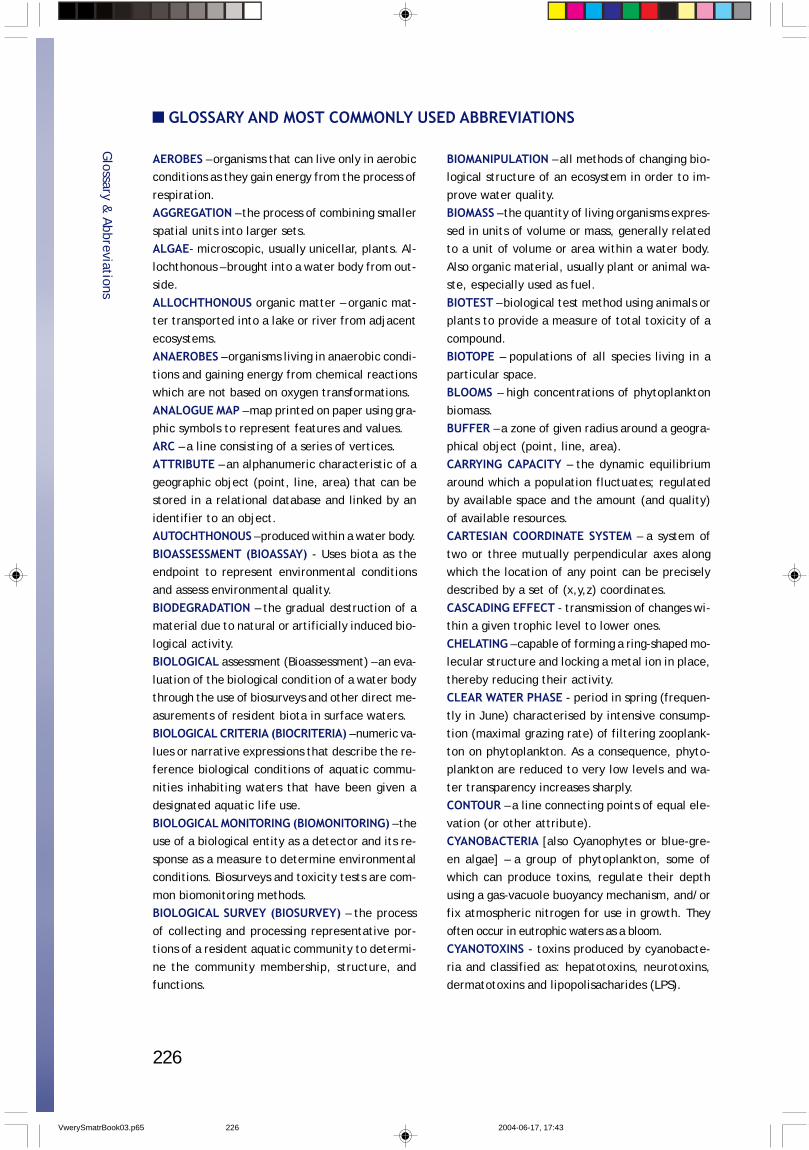
226
AEROBES – organisms that can live only in aerobicconditions as they gain energy from the process of
respiration.AGGREGATION – the process of combining smaller
spatial units into larger sets.ALGAE- microscopic, usually unicellar, plants. Al-
lochthonous – brought into a water body from out-side.
ALLOCHTHONOUS organic matter – organic mat-ter transported into a lake or river from adjacent
ecosystems.ANAEROBES – organisms living in anaerobic condi-
tions and gaining energy from chemical reactionswhich are not based on oxygen transformations.
ANALOGUE MAP – map printed on paper using gra-phic symbols to represent features and values.
ARC – a line consisting of a series of vertices.ATTRIBUTE – an alphanumeric characteristic of a
geographic object (point, line, area) that can bestored in a relational database and linked by an
identifier to an object.AUTOCHTHONOUS – produced within a water body.
BIOASSESSMENT (BIOASSAY) - Uses biota as theendpoint to represent environmental conditionsand assess environmental quality.
BIODEGRADATION – the gradual destruction of amaterial due to natural or artificially induced bio-
logical activity.BIOLOGICAL assessment (Bioassessment) – an eva-
luation of the biological condition of a water bodythrough the use of biosurveys and other direct me-
asurements of resident biota in surface waters.BIOLOGICAL CRITERIA (BIOCRITERIA) – numeric va-
lues or narrative expressions that describe the re-ference biological conditions of aquatic commu-
nities inhabiting waters that have been given adesignated aquatic life use.
BIOLOGICAL MONITORING (BIOMONITORING) – theuse of a biological entity as a detector and its re-
sponse as a measure to determine environmentalconditions. Biosurveys and toxicity tests are com-
mon biomonitoring methods.BIOLOGICAL SURVEY (BIOSURVEY) – the process
of collecting and processing representative por-tions of a resident aquatic community to determi-
ne the community membership, structure, andfunctions.
GLOSSARY AND MOST COMMONLY USED ABBREVIATIONS
BIOMANIPULATION – all methods of changing bio-logical structure of an ecosystem in order to im-
prove water quality.BIOMASS – the quantity of living organisms expres-
sed in units of volume or mass, generally relatedto a unit of volume or area within a water body.
Also organic material, usually plant or animal wa-ste, especially used as fuel.
BIOTEST – biological test method using animals orplants to provide a measure of total toxicity of a
compound.BIOTOPE – populations of all species living in a
particular space.BLOOMS – high concentrations of phytoplankton
biomass.BUFFER – a zone of given radius around a geogra-
phical object (point, line, area).CARRYING CAPACITY – the dynamic equilibrium
around which a population fluctuates; regulatedby available space and the amount (and quality)
of available resources.CARTESIAN COORDINATE SYSTEM – a system of
two or three mutually perpendicular axes alongwhich the location of any point can be preciselydescribed by a set of (x,y,z) coordinates.
CASCADING EFFECT - transmission of changes wi-thin a given trophic level to lower ones.
CHELATING – capable of forming a ring-shaped mo-lecular structure and locking a metal ion in place,
thereby reducing their activity.CLEAR WATER PHASE - period in spring (frequen-
tly in June) characterised by intensive consump-tion (maximal grazing rate) of filtering zooplank-
ton on phytoplankton. As a consequence, phyto-plankton are reduced to very low levels and wa-
ter transparency increases sharply.CONTOUR – a line connecting points of equal ele-
vation (or other attribute).CYANOBACTERIA [also Cyanophytes or blue-gre-
en algae] – a group of phytoplankton, some ofwhich can produce toxins, regulate their depth
using a gas-vacuole buoyancy mechanism, and/orfix atmospheric nitrogen for use in growth. They
often occur in eutrophic waters as a bloom.CYANOTOXINS - toxins produced by cyanobacte-
ria and classified as: hepatotoxins, neurotoxins,dermatotoxins and lipopolisacharides (LPS).
Glossary &
Abbreviations
VwerySmatrBook03.p65 2004-06-17, 17:43226
227
DATA – the basic element of information that canbe processed by a computer; may be alphanume-
ric or graphical.DATA MODEL – a formal method of arranging data
to represent an observed environment.DATABASE – a computer file containing data, or-
ganized, inter alia, as a set of tables or coordina-tes of the points and their attendant attributes.
DENITRIFICATION – the microbiologically-media-ted reduction of oxygenated nitrogen compounds
to gaseous nitrogen.DENITRIFYING BACTERIA – the group of bacteria
which utilize nitrate in one of three metabolicpathways:
a) without accumulating nitrite,b) with transient accumulation of nitrite, and
c) in a two-step denitrification process thattransforms nitrate into gaseous nitrogen.
DIATOMS [also Bacillariophytes] - a group of algaewith siliceous walls.
DIGITAL TERRAIN MODEL (DTM) – data which de-pict the relief of a given area of terrain using a
grid or irregular triangular network and contourelevations.DIGITIZE – a means of entering geographical data
into computerized databases from analogue maps.DINOFLAGELLATES – a group of phytoplankton with
flagella, or whip-like appendages, by which theorganisms have limited movement.
DIVERSITY OF FISH – the proportion of a givenfish species within a sample population. Diversity
may be calculated using the Shannon Index (H),where: H’= – 0pi lnpi . pi is the ratio of each com-
ponent (the % of a given species) to the total va-lue (all species=100%). The index may be scaled
from 0 to 1, where 0 is the lowest possible diver-sity and 1 is the maximum possible diversity by
dividing H’ by lnS, where S is the number of spe-cies having the indicated pi value (after Odum
1980).ECOLOGICAL INTEGRITY – the condition of the bio-
tic (biological community) and abiotic (non-biolo-gical; water chemistry and habitat) components
of unimpaired water bodies, as measured by as-semblage structure and function, water chemistry,
and habitat measures.
ECOREGIONS – a relatively homogeneous area de-fined by the similarity of climate, landform, soil,
potential natural vegetation, hydrology, or otherecologically relevant variables.
ECOTONE – the transition zone between two dif-ferent types of ecosystems, such as a river and a
meadow, characterized by very high biodiversity;ecotones may play an important role as buffers,
modifying and limiting flows of nutrients and pol-lutants between ecosystem components.
EFFICIENT INFILTRATION - the amount of precipi-tation water, which passes (percolates) from the
unsaturated zone into the ground water. Efficientinfiltration is sometimes called recharging infil-
tration.EH – ecohydrology (see: chapter 2.A).
ELISA (enzyme-linked immunosorbent assay) - sen-sitive biochemical method for detecting compo-
unds that interact with specific antibodies; usefulfor rapid sample screening for microcystins.
ENTITY – a discrete geographical object represen-ted as a digital data structure.
EX SITU – removed from its original location.FEATURE – a representation of a geographical ob-ject as a point, line, or polygon.
FILTER – a small matrix (mask) containing coeffi-cients used for modifying pixel values in a raster
image on a map using a variety of mathematicalprocedures.
FLUORESCENCE – the process whereby light is ab-sorbed at one wavelength and almost instantane-
ously emitted at new and longer wavelengths byan organic molecule, as in the case of photosyn-
thetic pigments.GENERALIZATION – the reduction of the volume
of geographical data; such reductions are usuallyused to construct a better graphical representa-
tion on a map or in image enhancement.GEOGRAPHIC OBJECT – a user-defined part of the
real world that can be represented using geogra-phical features and attributes.
GEOREFERENCE – the relationship between rasterdata and cartographic coordinates.
GREEN ALGAE [also Chlorophytes] – a group of al-gae which are usually a good food for zooplank-
ton.
Glossary &
Abbreviations
VwerySmatrBook03.p65 2004-06-17, 17:43227
228
GRID DATA – the structure of data used to repre-sent geographical objects, composed of square
cells of equal area, arranged in rows and columns.HEAT BALANCE – balance of all energy fluxes en-
tering and leaving an ecosystem or landscape.HPLC (high performance liquid chromatography)
- analytical method for separation and quantifica-tion of compounds in liquid solvents.
IMAGE – a graphic representation of an object pro-duced by an optical or electronic device. An ima-
ge is stored as raster data in the form of pixelvalues.
IN SITU – in the original location.IN VIVO – in living organisms.
INFILTRATION – the slow passage of water (perco-lation), which comes from precipitation, rivers,
water reservoirs and condensation of water vapo-ur on soil, through the unsaturated zone to the
saturated zone.INFILTRATION UNITS could be: l km-2 or mm year-1.
INTERPOLATION – making predictions based on me-asurements done only in a certain area.
IWM – Integrated Watershed Management.KRIGING – an interpolation technique based on atheory of the semivariogram.
LAYER – a logical set of thematic data coveringone subject.
MAP PROJECTION – a set of mathematical equ-ations for converting geographical coordinates to
Cartesian plane coordinates. The equations allowthe depiction of spherical, three-dimensional ob-
jects on a flat map.METRICS – a characteristic that changes in some
predictable way with increased human influence(e.g., a scoring system).
MIDSUMMER DECLINE - sudden midsummer decre-ase of large, filtering zooplankton (mainly Daph-
nia spp.) biomass.
MODEL – a simplification and abstraction of reali-ty. Models can be seen as a data set representing
the structure of geographical objects, as well as aset of logical expressions and mathematical equ-
ations used to simulate processes. Models may alsobe physical representations of geographic featu-
res.
MULTIMETRIC APPROACHES – an analysis techni-que using several measurable characteristics of a
biological assemblage.MULTISPECTRAL – the remote sensing technique
for obtaining images over a number of distinct nar-row bands of the electromagnetic spectrum.
MULTIVARIATE COMMUNITY ANALYSIS – statisti-cal methods (e.g., ordination or discriminant ana-
lysis) for analyzing physical and biological com-munity data using multiple variables (quantitative
or nominal).NODE – the end points of a line.
NON-POINT SOURCE POLLUTION – pollution en-tering water bodies from diffused sources, inclu-
ding surface and subsurface runoff, nutrient le-aching, and erosion, mainly from degraded land-
scapes (e.g., landscapes degraded due to agricul-ture, deforestation, etc.).
NUTRIENT CONCENTRATION – the amount of a nu-trient in a given volume of water.
NUTRIENT LOAD – the amount of a nutrient trans-ported into a water body by rivers, sewage di-
scharges, etc., over a given period of time, calcu-lated as concentration multiplied by discharge.NUTRIENTS - chemical elements necessary for
growth and development of vegetation. The mainnutrients are phosphorus, nitrogen, and carbon.
Increased nutrient concentrations stimulate theprocess of eutrophication in aquatic ecosystems.
PH – phytotechnology (see chapter: 2.B).PHOSPHATASE – a group of hydrolytic enzymes li-
berating the orthophosphate ion from organic com-pounds.
PHYCOCYANIN – a photosynthetic pigment charac-teristic of cyanobacteria.
PHYTOEXTRACTION – removal of chemical sub-stances by plants.
PHYTOPLANKTON – the algal component of plank-ton, which are free-living organisms within a aqu-
atic environment.PHYTOREMEDIATION – removal of contamination
through the natural process of plant uptake.PIEZOMETER – a pipe-like trap for ground waters
with perforated ends, placed in water bearing lay-ers to measure ground water elevations; when pla-
ced in fields, ground water flows can be measu-red using tracers.
Glossary &
Abbreviations
VwerySmatrBook03.p65 2004-06-17, 17:43228
229
PIXEL – one picture element (or cell) in a set ofgrid data.
POINT SOURCE POLLUTION – pollution enteringwater bodies from concentrated outflows (e.g.,
pipes transporting municipal and industrial sew-rage, water from purification plants, irrigation
channels, etc.).POLYGON – a vector representation of an enclo-
sed area written as a set of vertices or given by amathematical function.
PPIA (protein phosphatase inhibition assay) - sen-sitive biochemical method that uses biochemical
activity to measure the presence of microcystinand nodularin toxins.
PYROLYSIS – the breaking apart of complex mole-cules into simpler units by the use of heat.
RADICAL ZONE – the surface layers of the soil wi-thin the reach of plant roots.
RASTER – a computer readable format used forrepresenting images or grid data.
RASTERIZATION – the process of converting datafrom vector format to raster format.
REFERENCE CONDITION – the chemical, physical,or biological quality, exhibited at either a singlesite or an aggregation of sites, representing a semi-
natural or reasonably attainable condition at theleast impaired reference sites.
REFLECTANCE – the ratio of energy reflected by asurface to that incident upon it.
RETENTION TIME [also Water retention time, WRT]– the ratio of volume and flow of a reservoir or
lake.RETENTION TIME, WATER RETENTION TIME – the
ratio of volume and flow of a reservoir or lake.RTS - (river type-specific species) - criterion re-
flects the fish fauna naturally occurring in a spe-cific type of river, excluding species not native in
a given area (e.g., country, ecoregion) and notautochthonous for that river.
RUBBER SHEETING – the procedure for adjustingthe geometry of an image by non-uniform trans-
formations.SCALE – a relationship between the distance on a
map and in reality.SCANNING – the process by which analogue maps
are converted to raster format by an optical device.
SEMIVARIOGRAM – a graph showing the relation-ship between variance and separation for a pair
of data points.SHELTERBELT – a row of trees and shrubs planted
in the midst of a cultivated field.SHOAL – a large number of fish swimming toge-
ther.SPATIAL INTERPOLATION – the procedure of esti-
mating values in certain areas using existing obse-rvations.
SSP - species criterion reflects the type-specificfauna (RTS-species) composed of species meeting
the following minimum criteria: the species areself-reproducing, thus juvenile fishes occur, and
maintain, at least a minimum population size.STABILIZATION – a process designed to limit the
mobility of toxic chemicals.STREAM MICROHABITAT SYSTEM – the distribution
of pools, riffles, and runs, having relatively ho-mogenous substrate types, water depths, and ve-
locities, within a stream course.STREAM ORDER – the dendritic arrangement of
channels of a river throughout its drainage basin.The most popular hierarchy is defined such thatfirst order streams are those having no tributa-
ries, second order streams are those formed bythe union of two first order streams, third order
streams are those formed by the union of secondorder streams, and so on.
STREAM POOL-RIFFLE-RUN SYSTEM – a subsystemof a reach having characteristic bed topography,
water surface slope, depth, and velocity patterns.In a natural meandering watercourse, the shallow
zones or riffles and the deeper zones or pools liein a regular pattern connected by runs. The di-
stance between two neighbouring riffles or poolsis approximately one half of the wavelength of
one full meander, or about 5 to 7 times the widthof a watercourse. In-stream habitats at this level
are complex hydrological units.STREAM REACH – a length of stream or a stream
segment lying between breaks in channel slopes,local side slopes, valley floor widths, riparian ve-
getation, and bank materials.STREAM SEGMENT – the portion of a stream sys-
tem flowing through a single bedrock type and bo-
Glossary &
Abbreviations
VwerySmatrBook03.p65 2004-06-17, 17:43229

230
unded by tributary junctions or major waterfalls.STREAM SYSTEM – all running surface waters in a
watershed and standing waters within stream sys-tems that may be wetlands or lakes depending
upon their depth, hyrdologic conditions, soil ty-pes, and vegetation cover.
SUCCESSION – is a widely-accepted, biological con-cept implying a sequence in which species or gro-
up of species dominate a plant community.SUCCESSION – the biological concept implying a
sequence in which species or groups of species,dominate a community.
SURFACE – a representation of geographical ob-ject as a set of continuous data (also a data field).
Surface runoff – surface flow caused by rainfall,transporting solids, nutrients, and pollutants do-
wnhill into aquatic systems.THE SATURATED ZONE - is the zone below the
groundwater table where all pores are filled bywater.
THE UNSATURATED ZONE - is the zone immedia-tely below a land surface and above a water table
where pores contain both water and air and arenot totally saturated with water. The unsaturatedzone is sometimes called the vadose zone.
TOPOLOGY – the spatial relationship between no-des, lines, and polygons.
TREATABILITY STUDY – a study to determine theefficiency of one or more potential treatment
methods or processes for a given remediation pro-blem.
VECTOR – a data structure in which lines are re-presented as a list of ordered coordinates.
VECTORIZATION – the process of converting datafrom raster to vector formats.
VERTEX (VERTICES) – a point or series of pointswith given coordinates on a line.
WATER BALANCE - balance sheet of all water flu-xes entering and leaving an ecosystem or landsca-
pe.WATER DEFICIT – difference between evapotran-
spiration and water supplies (precipitation andwater retention) within agricultural landscapes.
WETLAND – a natural or constructed system, per-manently or periodically flooded, that can act as
water purification systems or nutrient sinks. Puri-fication is enhanced by the activity of vegetation
and variety of microbiological and biogeochemi-cal processes taking place within the substrate of
the wetland. Wetlands are defined by the presen-ce of hydric soils, characteristic types of vegeta-tion, and a high water table.
Glossary &
Abbreviations
VwerySmatrBook03.p65 2004-06-17, 17:44230
231
REFERENCESReferences
Agoshtino A. A., Gomez L. C., Zalewski M. 2001.The importance of floodplains for dynamics of fish
communies of upper river Parana In InternationalJournal of Ecohydrology & Hydrobiology Catchment
processes land/water ecotones and fish commu-nities (ed) Zalewski M.Scheimer F. Thrope J. Vol.
1 no 1-2 209-219Alloway B. J. 1995. Heavy metals in soils. 2nd
ed., Chapman & Hall, Glasgow. 340 pp.Amarasinghe P. B., Boersma M. & Vijverberg J.
1997. The effect of temperature, and food quan-tity and quality on the growth and development
rates in laboratory-cultured copepods and clado-cerans from a Sri Lankan reservoir. Hydrobiologia
350: 131-144.An, J.S. & Carmichael W.W. 1994. Use a colory-
metric protein phosphatase inhibition assay andenzyme linked immunosorbent assay for study of mi-
crocystins and nodularins. Toxicon 32: 1495-1507.Andersen T., Hessen D. O. 1991. Carbon, nitro-
gen and phosphorus content of freshwater zoo-plankton. Limnology and Oceanography 36: 807-814.
Anderson J. R. 1993. State of the Rivers Project.Report 1. Development and Validation of the Me-thodology. Department of Primary Industries, Qu-
eensland.Angermeier P. L., Karr J. R. 1986. Applying an
index of biotic integrity based on stream fish com-munities: considerations in sampling and interpre-
tation. North American Journal of Fisheries Mana-gement 6:418-429.
Azcón-Aguilar C. Barea J.M. 1992. Interactionsbetween mycorrhizal fungi and other rhizosphere
microorganisms. In: Allen MJ (Ed) Mycorrhizal func-tioning. An integrative plant-fungal process. Ro-
utledge, Chapman & Hall Inc., New York, pp. 163-198Azcón-Aguilar C. Barea J.M. 1992. Interactions
between mycorrhizal fungi and other rhizospheremicroorganisms. In: Allen MJ (Ed) Mycorrhizal func-
tioning. An integrative plant-fungal process. Ro-utledge, Chapman & Hall Inc., New York, pp. 163-
198Balon E.K. 1975. Reproductive guilds of fishes: A
proposal and definition. J.Fish.Res.Board Canada32, 821-864.
Balon E. K. 1981a. Reproductive guilds and the ulti-mate structure of fish taxocenes: amended contribu-
tion to the discussion presented at the mini-sympo-sium. Environmental Biology of Fishes 3: 149-152.
Balon E. K. 1981b. Additions and amendments tothe classification of reproductive styles in fishes.
Environmental Biology of Fishes 6: 377-389.Baird, A.J., Wilby R.L. (eds.). 1999. Eco-hydro-
logy . Plants and water in terrestrial and aquaticenvironments. Routledge, London, New York. 402pp
Barbour M. T., Gerritsen J., Snyder B. D. & Stri-bling J. B. 1999. Rapid bioassessment protocols
for use in streams and wadeable rivers: periphy-ton, benthic macroinvertebrates and fish. 2nd ed.
EPA 841-B-99-002. U.S. Environmental ProtectionAgency, Office of Water, Washington.
Bartoszewicz A. 1990. Chemical composition ofground waters in agricultural watershed under the
soil and climate conditions of Koœcian Plain. p:127-142 In: Obieg wody i bariery biogeochemicz-
ne w krajobrazie rolniczym (L. Ryszkowski, J. Mar-cinek & A. Kedziora, eds.). Wydawnictwo Nauko-
we Uniwersytetu A. Mickiewicza, Poznan (In Polish).Bartoszewicz A. 1994. The chemical compounds
in surface waters of agricultural catchments un-der the soil weather conditions of the Koscian low-land. Roczniki Akademii Rolniczej w Poznaniu 25:
5-68. (in Polish)Bartoszewicz A., Ryszkowski L. 1996. Influence
of shelterbelts and meadows on the chemistry ofground water. 98-109 In: Dynamics of an agricul-
tural landscape (L. Ryszkowski, N. R. French & A.Kedziora, eds). Zaklad Badan Srodowiska Rolnicze-
go i Lesnego PAN, Poznan.Bateman, K.P., Thibault, P., Douglas, D.J. & Whi-te, R.L. 1995. Mass spectral analyses of microcy-stins from toxic cyanobacteria using on-line chro-
matographic and electrophoretic separations. J.Chromatogr. A, 712: 253-268.
Bazan J. 1998. Seasonal changes of phosphorousconcentration in different macrophytes species.
MSc Theses. University of Lodz (in Polish).Bednarek A., Zalewski M., Blaszczyk M., Dabrow-ska E., Czerwieniec E. & Tomaszek J. 2001. De-nitrification processes in bottom sediment of the
Sulejow Reservoir - comparison two methods. Po-step w Inzynierii Srodowiska, II Ogolnopolska Kon-
feren. Naukowo-Techn., Rzeszow-Polanczyk 203-211. (in Polish)
VwerySmatrBook03.p65 2004-06-17, 17:44231

232
References
Bernatowicz S., Wolny P. 1974. Botany for fishe-ry science. PWRiL., Warszawa. (in Polish)
Berz G. A. 2001. Climate change: Effects on po-ssible responses by the insurance industry. 392-
399 In: Climate of the21st century (J. L. Lozan, H.Gral & P. Hupfer, eds). Hamburg.
Blaylock M.J., Zakharova O., Salt D.E., Raskin I.1995. Increasing heavy metal uptake through soil
amendments. The key to effective phytoremedia-tion. In: Agronomy abstracts. ASA, Madison, WI,
p. 218Bloomfield C. 1981. The translocation of metals
in soils. In: Greenland D.J.,Hayes MHB (ed.) TheChemistry of Soil Processes. John Wiley & Sons Ltd,
Chichester.Boon P. J., Wilkinson J. & Martin J. 1998. The
application of SERCON (System for Evaluating Ri-vers for Conservation) to a selection of rivers in
Britain. Aquatic Conservation: Marine and Fresh-water Ecosystems 8: 597-616.
Boyt F. L., Bayley S. E. & Zoltek J. Jr. 1977. Re-moval of nutrients from treated municipal waste-
water by wetland vegetation. J. Water Poll. Cont.Fed., 49 (5): 789-799.Brierley G., Fryirs K. & Cohen T. 1996. Develop-
ment of a generic geomorphic framework to as-sess catchment character. Part 1. A geomorphic
approach to catchment characterisation. WorkingPaper 9603, , Graduate School of the Environment,
Macquarie UniversityBrummer G. W., Gerth J. & Herms U. 1986. He-
avy metal species, mobility and availability in so-ils. Z.Pflanzenernaehr.Bodenk. 149:382-398.
Burzynska H. 1964: Methods of detection and iden-tification rod-bacterium in group Pseudomonas-
Achromobacter and similar. Roczniki PZH 15: 171-181. (in Polish)
Byczynski H., Blaszczyk T. & Witczak S. 1979.Pollution hazards and protection of groundwater.
Wydawnictwo Geologiczne Warszawa. (in Polish)Calow P., Petts G.E. (eds). 1992. The Rivers Hand-
book. Volume One. Hydrological and EcologicalPrinciples. Blacwell Science Ltd, 526 pp.
Carmichael W. W. 2001. Health effect of toxin-producing Cyanobacteria: „The CyanoHABs”. Hu-
man and Ecological Risk Assessment 7: 1393-1407.
Carpenter S. R., Kitchell J. F. & Hodgson J. R.1985 - Cascading trophic interac-tions and lake
productivity - BioScience 35: 634-639.CEN/TC 230/WG 2/TG 4 N 27. 2002. Work Item 230116,
Water analysis Sampling of fish with electricity.Chessman B., Nancarrow J. 1999. Draft pressu-
re-biota-habitat stream assessment. Report on Ade-long Creek field trial. New South Wales. Department
of Land and Water Conservation, Sydney.Chicharo L.M, Chicharo M.A. (1995). The RNA/
DNA ratio as a useful indicator of the nutritionalcondition in juveniles of Ruditapes decussatus. SCI
MAR 59, Suppl. 1: 95-101Chicharo M.A., Chicharo L, Valdes L, López-Ja-mar E., Ré P. (1998). Estimation of starvation anddiet variation of the RNA/DNA ratios in field-cau-
ght Sardina pilchardus larvae off the north of Spa-in Mar. Ecology Progress Ser 164: 273-283 1998
Chicharo M.A., Esteves E, Santos AMP, dos San-tos A, Peliz A, and Ré P. (2003) Nutricional condi-
tion, growth and food availability of sardine la-rvae during a winter upwelling event off northern
Portugal. Mar. Ecology Progress Ser.,257: 303-309Chikita, K.A. 1996. Suspended sediment dischar-ge from snowmelt: Ikushunbetsu River, Hokkaido,
Japan. J. Hydrol., 186: 295-313.Chlapowski D. 1943. Abot Agriculture. O rolnic-
twie. Druk Walentego Stefanskiego. Poznan. 164(In polish)
Chmielewski, T. J. 2001. Spatial Planning systemas a tool for harmonization of nature and manage-
ment. Politechnika Lubelska. 290pp. (in Polish)Chorus I., Bartram J. 1999. Toxic cyanobacteria
in water. A Guide to their public health consequences,monitoring and management. E&FN Spon, London.
Chorus I. 2001. In: I. Chorus, (Ed.), Cyanotoxins.Occurrence, causes, consequences: Springer-Ver-
lag Berlin Heidelberg, Germany.Ciolkosz. A., Miszalski, J., Oledzki, J.R., 1999.
Interpretation of aerial photograph. Interpretacjazdjec lotniczych. Wydawnictwo Naukowe PWN.
Warszawa. (in polish)Clarke, K. & Warwick R. (2001). Change in mari-
ne communities: an approach tostatistical analysis and interpretation. 2nd edition.
PRIMER-E:Plymouth
VwerySmatrBook03.p65 2004-06-17, 17:44232
233
References
Cloern, J.E.. 1987. Turbidity as a control on phy-toplankton biomass and productivity in estuaries:
Continental Shelf Research, v. 7, no. 11/12, p.1367-1381.
Codd, GA., 2000. Cyanobacterial toxin, the percep-tion of water quality, and the prioritisation if eutrophi-
cation control. Ecological Engineering 16: 51-60.Cowx I.G., Lamarque P. (eds). 1990. Fishing with
Electricity. Applications in Freswater FisheriesManagement. Fishing News Books. 248 pp.
Cowx I. G., Welcomme R. L. 1998. Rehabilitationof rivers for fish. Fishing News Books. Oxford.
Cox G. & Tinker B.B. 1976. Translocation andtransfer of nutrients in vesicular-arbuscular my-
cirrhizas I. The arbuscule and phosphorus trans-fer: quantitative ultrastruktural study. New Phy-
tologist 77: 371-378.Dahl B. E. & Fall B. A. 1975. Construction and
Stabilization of Coastal Foredunes With Vegeta-tion: Padre Island, Texas. U.S. Army Corp of Engi-
neers, Coastal Engineering Research Center. MP9-75: 51-174
Daily, G.C., Soderquist, T., Aniyar, S., Arrow, K.,Dasgupta, P., Ehrlich, P.R., Folke, C., Jansson,A., Jansson, B., Kautsky, N., Levin, S., Lubchen-co, J., Maler, K., Simpson, D., Starett, D., Ti-man, D., Walker, B., 2000. The Value of Nature
and the Nature of Value. Science 289:395-396Day, J. H. 1980. What is an estuary? South African
Journal of Science. 76: 198.Day, J. H. 1981. The nature, origin and classifica-
tion of estuaries. In Day, J. H. (Ed.) Estuarine Eco-logy with Particular Reference to Southern Africa.
Cape Town, A.A. Balkema. pp. 1-6.De Walle, D. R., B. R. Swistock, W. E. Shar-pe.1991. Tracer model for Storm flow on a smallAppalachian forested catchment - reply. J. Hydrol.,
117: 377 - 380.Dowgiallo J., Kleczkowski A., Macioszczyk T. &Rozkowski A. (eds.). 2002, Hydrological Dictio-nary. Panstwowy Instytut Geologiczny. Warszawa.
(in Polish)Dunn H. 2000. Identifying and protecting rivers of
high ecological value LWRRDC Occasional PaperNo.01/00.
Edwards, C., Lawton, L.A., Beattie, K.A., Codd,G.A., Pleasance, S., & Dear, G.J. 1993. Analysi-
sof microcystinsfrom cyanobacteria by liquid chro-matography with mass spectrometry using atmo-
spheric-pressure ionisation. Rapid Commun. MassSpectrom. 7: 714-719.
Ek van R., Witte J.-P. M., Runhaar Klijn F. 2001.Ecological effects of water management in the
Netherlands; the model DEM-NAT, In: EcologcalEngineering Vol. 16, No 1 127-143
Elser J. J., Urabe J. 1999. The stoichiometry ofconsumer-driven nutrient recycling: theory, obse-
rvations, and consequences. Ecology 80: 735-751.Falconer, IR. 2001. Toxic cyanobacterial bloom
problems in Australian waters: risks and impactson human health. Phycologia 40: 228-233.
Falconer, I.R., Jackson, A.R.B., Jangley, J. &Runnegar, M.T. 1981. Liver pathology in mice in
poisoning by the blue-green alga Microcystis aeru-ginosa. Aust. J. Biol. Sci. 34: 179-187.
FAME project. 2001-2004. Development, Evalu-ation and Implementation of a Standardised Fish-
based Assessment Method for the Ecological Sta-tus of European Rivers. A Contribution to the Wa-
ter Framework Directive (acronym: FAME). Rese-arch project contract no. EVK1-CT-2001-00094supported by the European Commission under the
Fifth Framework Programme, key action: Susta-inable Management and Quality of Water within
the Energy, Environment and Sustainable Develop-ment Programme (project co-ordinator
S.Schmutz). www.fame.boku.ac.at.FAO/Unesco.1973. Irrigation, Drainage and Salinity: An Inter-
national Source Book. London: Hutchinson&Co.Faush K. D., Lyons J., Karr J.R. & Angermeier P.L. 1990. fish communities as indicators of envi-ronmental degradation. American Fisheries Socie-
ty Symposium 8:123-144.Fink J., 1963, Introduction to biochemistry of plant
phosphorous. Wstep do biochemii fosforu roslin,Panstwowe Wydawnictwo Rolnicze i Lesne, War-
szawa, str. 241 (in polish)FISRWG 10. 1998. Stream Corridor Restoration:
Principles, Processes, and Practices. The FederalInteragency Stream Restoration Working Group
(FISRWG) GPO Item 0120-A; SuDocs No. A 57.6/2:EN3/PT.653. http://www.usda.gov/stream_re-
storation.
VwerySmatrBook03.p65 2004-06-17, 17:44233
234
References
Fladmark, K.E., Serres, M.H., Larsen, N.L., Yasu-moto, T., Aune, T. & Doskeland, S.O., 1998. Sen-
sitive detection of apoptogenic toxins in suspen-sion cultures of rat and salmon hepatocytes. Toxi-
con 36: 1101-1114.Flury, T., Heinze, R., Wirsing, B., Fastner, J., Neu-mann, U. & Weckesser, J. 2001. Comparative Evalu-ation of Methods for Assessing Microcystin Concentra-
tions with a Variety of Field Samples. p: 330-339 In: I.Chorus et al. (Eds), Cyanotoxins. Occurrence, Causes,
Consequences. Springer, Berlin, Germany.Franklin I. R. 1980. Evolutionary change in small
populations. p: 135-149 In An Evolutionary-Ecolo-gical Perspecitve (M. E. Soulé, B. A. Wilcox, eds),.
Sinauer, Sunderland Mass.Frissell C. A., Liss W .J., Warren C. E. & HurleyM. D. 1986. A hierarchical approach to classifying stre-am habitat features: viewing streams in a watershed
context. Environmental Management 10: 199-214.Galicka, W. 1993. Inflow of various forms of nitro-
gen to the Sulejów Reservoir in the years 1981-1984. Pol. Arch. Hydrobiol. 40. 2: 119-138.
Gamble T. N., Betlach M. R. & Tiedje J. M. 1977:Numerically dominant denitrifying bacteria fromworld soils. Applied Environmental Microbiology 33:
926-939.Genereux, D., H. F. Hemond. 1990. Three com-
ponent tracer model for stormflow on a small Ap-palachian catchment - comment. J. Hydrol., 117:
377 - 380.Gibert J. , Mathieu J., Fournier F., [eds] 1997.
Groundwater/Surface Water Ecotones: Biologicaland Hydrological Interaction and Management
Options UNESCO, International Hydrology Series,Cambrige University Press
Goldstein R. M., Simon T. P. 1999. Toward a Uni-ted Definition of Guild Structure for Feeding Eco-
logy of North American Freshwater Fishes. P: 123-220In: Assessing the Sustainability and Biological Integrity
of Water Resources Using Fish Communities. (T.P. Si-mon, ed.) CRC Press. Boca Raton, USA.
Goldyn R., Grabia J. 1996. Concept of application ofnatural method in purification of pollutants from Jaro-
cin. [W:] Kraska M., Blazjewski R. (red.), Oczyszczal-nie hydrobotaniczne, II Miedzynarodowa Konferencja
Naukowo-Techniczna, Poznan, 2-3 wrzesnia 1996.(inpolish)
Goryczko K. 1999. Water pollution through troutfisheries - treatment methods. In: Salmonid fish
culture and its influence on surface waters quali-ty. Instructional papers. Gdanska Fundacja Wody,
Gdansk, 8 pp. (in Polish)Gunderson L. H. 1989. Historical Hydropatterns
in wetland Communities of Everglades National Park.p: 1099-1111 In: Freshwater Wetlands and Wildlife.
(R. R. Sharitz, J. W. Gibbons, eds.) Oak Ridge, TN U.S.Harada K-I. 1996. Chemistry and Detection of Mi-
crocystins. p: In: Toxic Microcystis (M. F. Watana-be, K. I. Harada, W. W. Carmichael & H. Fujiki,
eds). CRC Pres. Inc., London.Harada K-I. 2000. Chemistry and detection of mi-
crocystins In: (Eds) Watanabe M.F., Harada K.-I.,Carmichael W.W., Fujiki H. Toxic Microcystis. CRC
Press Inc., Florida, p. 103-148.Harley J.L., Harley E.L. 1987. A check list of
mycorrhiza in British flora. New Phytol. 10 5(2): 1-102.Harper D. 1992. Eutrophication of Freshwaters.
Principles, problems and restoration. London-NewYork, Chapman and Hall.
Harris R. P., Wiebe P. H., Lenz J., Skjoldal H. R.& Huntley M. 2000. ICES Zooplankton Methodolo-gy Manual. Academic Press,. 667 pp.
Haycock N. E., Burt T. P., Goulding K. W. T.&Pinay G. (eds). 1997. Buffer zones: their proces-
ses and potential in water protection. Quest Envi-ronmental. Harpenden, U.K. 326 pp.
Herman, P.M.J., and Scholten, H. 1990. Can su-spensionfeeders stabilise estuarine ecosystems? In
TrophicRelationships in the Marine Environment,eds. M.Barnes and R.N. Gibson, pp. 104-l 16. Aber-
deen, UK: Aberdeen University Press.Hillbricht-Ilkowska A., Ryszkowski L. & SharpleyA.N. 1995. Phosphorus transfers and landscapestructure: riparian sites and diversified land use
patterns. p: 201-228 In: Phosphorus in a globalenvironment. (H. Tiessen, ed.) SCOPE.
Hodgkin, E. & Birch, P. 1998. No simple solutions:Proposing radical management options for an eutro-
phic estuaty. Marine Pollution Bulletin, 17(9): 399-404.Hrudey, S., Burch, M., Drikas, M. & Gregory, R.1999. In: I. Chorus & J. Bartram, (Eds.), Toxic Cy-anobacteria in Water: A Guide to Their Public He-
alth Consequences, Monitoring, and Management.E & FN Spon, London.
VwerySmatrBook03.p65 2004-06-17, 17:44234
235
References
Huet M. 1949. Apercu des relations entre la penteet les populations des eaux courantes. Schweize-
rische Zeitschrift fur Hydrologie 11, 333 351.Hutchinson, G.E. 1961. Paradox of the plankton.
American Naturalist 95:137-145.Illies J., Botosaneanu L. 1963. Problemes et
methodes de la classification et de la zonationecologique des eaux courantes, considerees sur-
tout de point de vue faunistique. Mitt. Internat.Verein. Theoret. Angew. Limnol. 12: 1-57.
Imhoff K., Imhoff K. R. 1982. City canalisationand sewage treatment. Guideline. Arkady, War-
szawa,. 382 pp. (in Polish):IPCC. 1996. Impacts, Adaptation, and Mitigation of
Climate Change. Cambridge University Press, 469-486IPCC. 2001. Impacts, Adaptation and Vulnerabili-
ty. Cambridge University Press, 193-233ISO/CD 10381 - 5. Soil quality - sampling.
ISO/DIS 11464. Soil quality Pretreatment of sam-ples for physical-chemical analyses
Jackson, A.R.B., Innes M.C. & Falconer, I.R. 1984.Clinical and pathological changes in animals expe-
rimentally poisoned by Microcystis aeruginosa. Vet.Pathol. 21: 102-123.Jenssen R. 1972. Taking care of wasters from the
trout farm. Am. Fishes U.S. Trout News, 17: 4 - 21.Jezierska - Madziar M., Pinskwar P. 1998. Inten-
sification of fishery production and protection ofenvironment Intensyfikacja produkcji rybackiej a
ochrona srodowiska. p: 33 - 40 In: 3rd Carp Produ-cers National Conference, Kazimierz Dolny, 12-
14.03.1998. IRS, Olsztyn. (in Polish)Johnson R. K. 2001. Indicator metrics and detec-
tion of impact. p: 41-44 In Monitoring and asses-sment of ecological status of aquatic environments.
(K. Karttunen, ed.) Nordic Council of Ministers,TemaNord 563
Jones G. 1996. Toxic algae study summary. Mani-toba Department of Environment.
Jorgensen, S.E. 1996. The application of ecosys-tem theory in limnology. Verh. Int. Verein Limnol.
26, 181-192.Jungwirth M., Muhar S. & Schmutz S. 1995. The
effects of recreated instream and ecotone struc-tures on the fish fauna of an epipotamal river.
Hydrobiologia 303: 195-206.
Kadlec R. H., Knight R. L. 1995. Treatmant We-tlands. Lewis Publishers, USA.
Karg J., Ryszkowski L. 1996. Animals of arableland. p: 138-172 In: Dynamics of an agricultural
landscape (L. Ryszkowski, N. R. French & A. Ke-dziora, eds). Zaklad Badan Srodowiska Rolniczego
i Lesnego PAN, Poznan.Karpinski A. 1999. Generating and treatment of
intensive salmonid fish farm effluent In: Salmonidfish culture and its influence on surface waters
quality. Instructional papers. Gdanska FundacjaWody, Gdansk. 8 pp. (in Polish)
Karr J. R. 1981 Assessment of biotic integrity usingfish communities. Fisheries Bethesda 6: 21 27.
Karr J.R., Fausch K. D., Angermeier P. L., YantP. R & Schlosser I. J. 1986. Assessing biological
integrity in running waters: a method and its ra-tionale. Illinois Natural History Survey, Special Pu-
blication 5, 28 pp.Kedziora A. 1996. Hydrological cycle in agricul-
tural landscapes. In: Dynamics of an agriculturallandscape. p: 65-78 In: (L. Ryszkowski, N. French
& A. Kedziora, eds.) PWRiL, PoznanKerepeczki E., Pekar F. 2003. Treatment of in-tensive fish farm effluent in polyculture fishponds
and wetlands. In: Beyond Monoculture (T. Chopin,H. Reinertsen, eds.). EAS Special Publication 33:
220 - 221.Keyfitz N. 1992. Science Fragmented. Options.
IASA.Kiedrzynska E. 2001. Comparison of Nutrient De-
position Rate in the Pilica River Floodplain of Dif-ferent Typology. Msc. Thesis. Tempo asymilacji
fosforu przez roslinnosci zroznicowanych typolo-gicznie obszarów zalewowych doliny Pilicy; [type-
script] (In polish)Kiviranta, J., Abdel-Hameed A. 1994. toxicity of
the blue-green alga Oscillatoria agatdhii to themosquito Aedes aegypti and the shrimp Artemia
salina. World J. Microbiol. Biotechnol. 10: 517-520.Kiviranta J. 1992. Larvicidal effect of toxic cy-
anobacteria on yellow fewer mosquito Aedesaegypti. Acta Pharmaceutica Fennica 101: 83-87.
Klosowski S. 1993. The shore vegetation in selec-ted lakeland areas in northeastern Poland. Hydro-
biologia 251: 227-237.
VwerySmatrBook03.p65 2004-06-17, 17:44235
236
References
Knoeshe R., Schreckenbach K., Pfeifer M., We-issenbach H., Jannurik E. & Szabo P. 2003. Nu-
trient balance of carp ponds and pathways of nu-trient load. p: 226 - 227 In: Beyond Monoculture.
(T. Chopin, H. Reinertsen, ed.) EAS Special Publi-cation 33.
Koc J. i Polakowski B., 1990. Charakterystyka za-glebien bezodplywowych na Poj. Mazurskim w
aspekcie przyrodniczym, urzadzeniowo rolnym irolniczym. [W:] Uzytki ekologiczne w krajobrazie
rolniczym, SGGW, Warszawa: 25-57.Kondo, F., Ikai, Y., Oka, H., Ishikawa, N., Wata-nabe, M.F., Watanabe, M., Harada, K-I. & Suzu-ki, M. 1992. Separation and identification of mi-
crocystins in cyanobacteria by frit-fast atom bom-bardment liquid chromatography/mass spectrome-
try. Toxicon 30: 227-237.Korcz M. et al. 2002. GIS development-site de-
scription in: WELCOME - EUK1-2001-00132 WP 4.1- GIS description - unpublished report, IETU.
Koske R.E, Sutton J.C., Sheppard B.R. 1975. Eco-logy of Endogone in Lake Huron sands dunes. Can.
J. Bot. 53: 87-93.Kreeger D. A & C. J. Langdon 1993. Effect of Die-tary Protein Content on Growth of Juvenile Mus-
sels, Mytilus trossulus (Gould 1850). Biol Bull 1993185: 123-139.
Kucharski R., Sas-Nowosielska A., Malkowski E.& Pogrzeba M. 1998. Report prepared for the U.S
Department of Energy. Integrated approach to theremediation of heavy metal-contaminated land.
IETU Katowice.Kucharski R., Marchwinska E. & Gzyl J. 1994.
Agricultural policy in polluted areas. Ecological En-gineering 3: 299-312
Kucharski R., Nowosielska A. 2002. A Decision Sup-port System to Qualify Cost/Benefit Relationship
of the Use of Vegetation in the Management ofHeavy Metal Polluted Soils and Dredged Sediments.
Draft annual report. EVK1-1999-00116.Kumar P., Duschenkov V., Motto H., Raskin I. 1995.
Phytoextraction: The use of plants to remove heavymetals from soils. Environm Sci Technol 29:1232-1238.
Kyselkova, I. & Marsalek, B. 2000. Use of Daphniapulex, Artemia salina and Tubifex tubifex for cyano-
bacterial microcystin detection. Biologia 55: 637 - 643.
Lambert, T.W., Boland, M.P., Holmes, C.F.B. &Hrudey, S.E. 1994. Quantitation of the microcy-
stins hepatotoxins in water at environmentallyrelevant concentrations with the protein phospha-
tase bioassay. Environ. Sci. Technol. 28: 735-755.Lambshead, P. J. D., Platt, H. M., and Shaw, K. M.1983. The detection of differences among assembla-ges of marine benthic species based on an assessment
of dominance and diversity. J. Nat. Hist. 17:859-874.Landolt E., Kandeler R., 1986. The family of Lemna-
ceae-amonographic study. Ver(ffentlichungen Geobot.Inst. ETH, Stiftung R(bel, Z(rich.vol .2.
Lapinska M., Kaczkowski Z., Zalewski M. 2002.Restoration of streams for water quality improve-
ment and fishery enhancement, s.113-125. In: M.Zalewski (red.) "Guidelines for the Integrated Ma-
nagement of the Watershed - Phytotechnology andEcohydrology. United Nations Environment Pro-
gramme, Division of Technology, Industry and Econo-mics. Freshwater Management, Series No.5, 188 s.
Lawton L. A., Edwards C. & Codd G. A. 1994. Extrac-tion and high-performance liquid chromatographic
method for the determination of microcystins in rawand treated waters. Analyst. 119: 1525-1530.Lechat B. 1991. Le cours d’eau. Conserva-
tion, entretien et aménagement. Serie aménage-ment et gestion no 2, Strasbourg
Lenz J. 1992. Microbial loop, microbial food weband classical food chain: their significance in pe-
lagic marine ecosystems. Archiv fur Hydrobiolo-gie, Beiheft, Ergebnisse der Limnologie 37: 265-278.
Lewis, 1995. Use of Freshwater Plants for Phytotoxici-ty Testing: a Review. Envir. Pollution 87: 319-336.
Linderman R.G. 2000. Effects of mycorrhizas on planttolerance to diseases. In: Kapulnik Y., Douds D.D. Jr
(ed.) Arbuscular mycorrhizas: physiology and functionKluwer Academic Publishers, Dordrecht, The Nether-
lands, 345-365.LOLFA/LWA 1985. Bewertung des õkoloigschen Zustands
von Fließgewässern. Landesamt für Wasser und Abfallin Nordrhein - Westfalen, Düsseldorf.
Lunte C. C., Luecke C. 1990. Trophic interactionsof Leptodora in Lake Mendota. Limnology and Oce-
anography 35 (5): 1091-1100.Mander U., Palang H. 1996. Landscape evolution
in Estonia. p: 111-122 In: Landscape diversity: achance for rural community to achieve a sustaina-
VwerySmatrBook03.p65 2004-06-17, 17:44236

237
References
ble future. (L. Ryszkowski, G. Pearson & S. Bala-zy, eds.) Research Centre for Agricultural and Fo-
rest Environment PAS. Poznan,.Mander U., Palang H. & Jagomagi J. 1995. Ecolo-
gical networks in Estonia. Impact of landscapechange. Landschap 3: 27-38
Mankiewicz J., Tarczynska M., Walter Z., Zalew-ski M. 2003. Natural Toxins from Cyanobacteria.
Act. Biol. Cracoviensia 45/2: 9-20Mankiewicz J., Tarczynska M., Jurczak T., Woj-tysiak-Staniaszczyk & Zalewski M. 2003. Test withluminescent bacteria for the toxicity assessment
of cyanobacterial bloom samples. FEB 12(8): 861-864.Marques, J.C., S.N. Nielsen, M. Pardal & S. Jorgen-sen (in press). Impact of eutrophication and river ma-nagement within a framework of ecosystem theories.
Ecological ModellingMarsalek B., Blaha L. 2000. Microbiotest for cy-
anobacterial toxins screening. p: 519-525 In: NewMicrobiotest for Routine Toxicity Screening and
Biomonitoring. (G. Personne et al., eds.) KluwerAcademic / Plenum Publishers, New York.
McMillan P. H. 1998. An integrated habitat asses-sment system (IHAS v2) for the rapid biologicalassessment of rivers and streams. Research Pro-
ject number ENV-P-I-98132. Council for Scientificand Industrial Research (CSIR), Water Resources
Management Programme, South Africa.McQueen D. J., Post J. R. & Mills E. L. 1986.
Trophic relationships in freshwater pelagic eco-systems. Canadian Journal Fisheries and Aquatic
Sciences 43: 1571-1581.Meriluoto J. 1997. Chromatography of microcy-
stins. Analyt. Chim. Acta, 352: 277-298.Meriluoto J., Eriksson J. 1988. Rapid analysis of pep-
tide toxins in cyanobacteri. J. Chromatog. 438,93-99.Meriluoto, J., Lawton, L., & Harada, K-I. 2000.
Isolation and detection of microcystins and nodu-larins, Cyanobacterial peptide hepatotoxins. p: 65-
87 In: O. Holst (Ed.), Bacterial Toxins: Methodsand Protocols. Totowa: Humana Press Inc.
Meybeck M. 2002. Riverine quality at the Anthro-pocene : Propositions for global space and time
analysis, illustrated by the Seine River. AquaticSciences, 64: 376-393.
Meybeck M. 2003. Global analysis of river systems: from earth system controls to Anthropocene con-
trols. Phil. Trans. Royal Acad. London B, 354: 1440.Mitsch W., Jorgensen S. E. 2004. Ecological Engi-
neering and Ecosystem Restoraton. John Wiley andSons. Inc. USA. 411 pgs.
Mitsch W. J., Jorgensen S. E. Hoboken, N.J. 2004.Ecological Engineering and Ecosystem Restoration:
Wiley, c2004. QH541.15.R45 M58 2004.Miller R.M., Jastrow J.D. 2000. Mycorrhizal fungi
influence soil structure. In:Y. Kapulnik., D.D. Do-uds (ed.) Arbuscular Mycorrhizas: Physiology and Func-
tion, Kluwer Academic Publishers, Netherlands, 3-18.Morais P, Chicharo, M.A. & Barbosa, A.. 2003
Phytoplankton Dynamics in a coastal saline lakeActa Oecologica 24:S87-S96
Nakamura Y. & F. Kerciku 2000 Effects of filter-feeding bivalves on the distribution of water qu-
ality and nutrient cycling in a eutrophic coastallagoon .Journal of Marine Systems 26 209–221
Nalecz-Jawecki, G., Taczynska, M. & Sawicki, J.2002. Evaluation of the toxicity of cyanobacterial
blooms in drinking water reservoirs with micro-biotest. FEB 11, 347 - 351.Naiman, R.J., Decamps, H., Fournier, F. (eds.),
1989. Role of land / inland water ecotones in landsca-pe management and restoration, proposals for colla-
borative research. UNESCO, Vendome, France.Natures Services. Societal Depenence on Natu-ral Ecosystems. 1997. ed. G.C. Daily. Island Press.USA. 392 pgs.
Negri M. C., Hinchman R. R., & Gatliff E. G. 1996.Phytoremediation: using green plants to clean up
contaminated soil, groundwater, and wastewater.p: In, Proceedings, International Topical Meeting
on Nuclear and Hazardous Waste Management,Spectrum 96. Seattle, WA, August 1996. American
Nuclear SocietyNewcomb D., Van Abs D. J. 2000, Riparian Me-
thodology. Methodology for defining and assesingriparian areas in the Raritan river basin. New Jer-
sey Water Supply Authority.Newson M.D., Harper D.M., Padmore C.L., KempJ.L. and Vogel B. 1998. A cost-effective approachfor linking habitats, flow types and species requ-
irements. Aquatic Conservation: Marine and Fre-shwater Ecosystems 8: 431-446.
VwerySmatrBook03.p65 2004-06-17, 17:44237

238
References
Nicholson, B.C. & Burch, M.D. 2001. Evaluationof analytical mathods for detection and quantifi-
cation of cyanotoxins in relation to Australian drin-king water guidelines. In: A report prepared for
the National Health and Research Council of Au-stralia, the Water Services Association of Austra-
lia, and the Cooperative Research Centre for Wa-ter Quality and Treatment. Australia.
NRA Severn - Trent Region F.R.C.N. Guidelines.Odum E. P. 1971. Fundamentals of Ecology. Saun-
ders, Philadelphia. 574 pp.Oliveira R..S., Dodd J.C., Castro P.M.L. 2001. The
mycorrhizal status of Phragmites australis in seve-ral polluted soils and sediments of an industriali-
sed region of Northern Portugal. Mycorrhiza 10:241-247
Oliver R.L., Granf G.G. 2000. Freshwater blooms.[in] Whitton B.A., Potts M. (eds.) The ecology of
cyanobacteria. Kluwer Academic Publishers: 149-194.ONORM M 6232. 1995. Richtlinien fur die okologi-
sche Untersuchung und Bewertung von Fliess-gewassern. Osterreichisches Normungsinstitut, Wien.
Onyewuenyi, N. & Hawkins, P. 1996. Separationof toxic peptides (microcystins) in capillary elec-trophoresis, with the aid of organic mobile phase
modifiers. J.Chromatog. A 749: 271-278.Owens P.N., D.E. Walling. 2002. The phosphorus
content of fluvial sediment in rural and industria-lised river basins. Water Research 36: 685-701.
Ozimek T. 1991. Macrophytes as biological filtresin sewage purification processes. Wiadomosci Eko-
logiczne 37:271-281.Ozimek T., Donk E., Gulati R., 1993 Growth and
nutrient uptake by two species of Elodea in expe-rimential conditio and their role In nutrient accu-
mulation in a macrophyte - dominated lake. Hy-drobiologie 251: 13-18
Ozimek T., Renman G., 1995. Used of macrophy-tes in unconventional sewage treatment plant.
Wykorzystanie makrofitów w niekonwencjonalnychoczyszczalniach œcieków. Wiad. Ekol. 41: 239-254.
(in polish)Paasche, E., 1980. Silicon content of five marine
plankton diatom species measured with a rapidfilter method, Limnol. Oceanogr., 25 (3), 474-480.
Parson M., Thomas M. & Norris R. 2002 Austra-lian River Assessment System: Review of Physical
River Assessment Methods - A Biological Perspecti-ve. Monitoring River Health Initiative Technical
Report 21, Environment Australia.Pekarova, P., J. Pekar. 1996. The impact of land
use on stream water quality in Slovakia. J. Hy-drol., 180: 333-350.
Penczak T. Zalewski M. 1973. Distribution of fishnumbers and biomass in barbel region of the river
and the adjoning old river-beds. Ekologia Polska22 1 107-119.
Perillo, G.M.E. 1995. Geomorphology and Sedi-mentology of Estuaries. Definitions and Geomor-
phologic Classifications of Estuaries, Developmentin Sedimentology 53.Pritchard, D. W. 1967. What
is an estuary: physical viewpoint. p. 3–5 in: G. H.Lauf (ed.) Estuaries, A.A.A.S. Publ. No. 83, Wa-
shington, D.C.Persoone G., J. Gillett, 1990. "Toxicological ver-
sus ecotoxicological testing". [w]: ed. P. Bourdeau"Short-term toxicity tests for non-genotoxic ef-
fects". SCOPE. wyd. Lohn Wiley & Sons. Ltd.Peterjohn W. T., Corella D. L. 1984. Nutrient dyna-
micsin an agricultural watershed: observation on therole of a riparian forest. Ecology 65:1466-1475.Petersen R. C., Petersen L. B.-M. & Lacoursiere J.1992. A building-block model for stream restora-tion. p: 293-309. In: River Conservation and Ma-
nagement (P. J. Boon, P. Calow & G.E. Petts, eds.)John Wiley & Sons Ltd., Chichester, New York, To-
ronto, Singapore.Phillips N., Bennett J. & Moulton D. 2001 Princi-
ples and tools for the protection of rivers, QueenslandEnvironmental Protection Agency report for LWA.
Phillips J.D. 1999. Earth surface systems. Blac-kwell, Oxford.
Poon, G.K., Griggs, L.J., Edwards, C., Beattie,K.A., Codd, G.A. 1993. Liquid chromatography-
electrospray ionisation-mass spectrometry of cy-anobacterial toxins. J. Chromatogr. 628: 215-233.
Postel S., 1992. Last Oasis - Facing Water Scarci-ty. W.W. Norton &Company, New York
Pritchard D. W. 1967. What is an estuary: physi-cal viewpoint. p. 3-5 in: G. H. Lauf (ed.) Estu-
aries, A.A.A.S. Publ. No. 83, Washington, D.C.Rapala, J., Erkomaa, K., Kukkonen, J., SivonenK. & Lahti, K. 2002. Detection of microcystins withprotein phosphatase inhibition assay, high-perfor-
VwerySmatrBook03.p65 2004-06-17, 17:44238
239
mance liquid chromatography-UV detection and en-zyme-linked immunosorbent assay, Comparision of
methods. Anal. Chim. Acta 466: 213-231.Raskin I., Ensley B. (eds.). 2000. Phytoremedia-
tion of Toxic Metals. Wiley Interscience N.Y.Raven P.J., Fox P., Everard M., Holmes N. T. H.& Dawson F.H. 1997. River habitat survey: a newsystem for classifying rivers according to their
habitat quality. p: 215-234 In: Freshwater Quali-ty: Defining the Indefinable? (P. J. Boon,. D. L.
Howell, eds) The Stationery Office, Edinburgh.Read, D.J., Lewis, D.H., Fitter, A.H., Alexander,I.J. 1992. Mycorrhizas in ecosystems. Oxford: CABInternational.
Reddy K. R., DeBusk W. F. 1987. Nutrient StorageCapabilities of Aquatic and Wetland Plants. p: 337-
357. In: Aquatic Plants for Waste Water Treatmentand Resource Recovery. (K. R. Reddy, W. H. Smith
eds.) Magnolia Publishing, Orlando FLRedfield, A. C., B. H. Ketchum, and F. A. Ri-chards. 1963. The influence of organisms on thecomposition of seawater. pp. 26-77. In M. N. Hill
(ed). The Sea. Vol. 2. The Composition of Seawa-ter. Wiley, New York.Reisinger H. J., Mountain S. A., Andreotti G.,Diluise G., Porta A., Hullman A. S., Ovens V.,Arlotti D. & Godfrey J. 1996. Bioremediation of a
Major Inland Oil Spill Using a Comprehensive Integra-ted Approach. Proceedings of Third International Sym-
posium and Exhibition on Environmental Contamina-tion in Central and Eastern Europe. Warsaw.
Ressom, R., San Soong, F., Fitzgerald, J., Tur-czynowicz, L., El Saadi, O., Roder, D., et al. 1994.
Health effects of toxic Cyanobacteria (Blue - Gre-en Algae). p: 27-69. Australian Govertnment Pu-
blishing Service, Canberra.Rice, K.C., O.P. Bricker. 1995. Seasonal cycles of
dissolved constituents in streamwater in two fo-rested catchments in the mid-Atlantic region of
the eastern USA. J. Hydrol., 170. 137-158.Rocha, C., Galvao, H., & Barbosa, A. (2002). Role
of transient silicon limitation in the developmentof cyanobacteria blooms in the Guadiana estuary, so-
uth-western Iberia. Mar. Ecol. Prog. Ser., 228, 35-45.Rodriguez-Iturbe I. 2000. Ecohydrology: a hydro-
logical perspective of climate-soil-vegetation dy-namics. Water Resources Research 36: 3-9.
References
Roelke, D.L. 2000. Copepod food quality thre-shold as a mechanism influencing phytoplankton
sucession and accumulation of biomass, and se-condary productivity: a modelling study with ma-
nagement implications. Ecological Modelling, 134:245-274
Romanowska-Duda, Z. & Tarczyñska, M. 2002.The influence of Microcystin-LR and hepatotoxic
cyanobacterial extract on water plant (Spirodelaoligorrhiza). Environ. Toxicol. 17(3): 383-390.
Root R.B. 1967. The niche exploitation patternof the blue-gray gnatcatcher. Ecological Monogra-
phs 37: 317 - 350.Roper W.L. 1991. Preventing Lead Poisoning in
Young Children. US Department of Health and Hu-man Services. Public Health Service, Center for
Disease Control.Rosgen D.L. 1996. Applied river morphology. Wil-
dland Hydrology.Colorado.Russell, M.A., D.E. Walling, R.A. Hodgkinson.2001. Suspended sediment sources in two smalllowland agricultural catchments in the UK. J. Hy-
drol., 252: 1-24.Rutherfurd I. D., Jerie K. & Marsh N. 1999. Arehabilitation manual for Australian streams, vol.
1 & 2, Land and Water Resources Research andDevelopment Corporation & CRC for Catchment
Hydrology, Canberra.Ryszkowski L. 1985. Impoverishment of soil fau-
na due to agriculture. Intecol Bulletin 12: 7-17.Ryszkowski L. 1992. Energy and Material Flows
Across Boundaries in Agricultural Landscapes. p:270-284 In: Landscape Boundaries: Consequences
for Biotic Diversity and Ecological Flows (J. An-drew Hansen Francesco di Castri eds). Springer-
Verlag. 13Ryszkowski L. 1994. The integrated development
of the countryside in central and eastern Europe-an countries. Nature and Environment 70, Council
of Europe Press. 39 pp.Ryszkowski L., Kedziora A. 1996. Ecological gu-
idelines for management of agricultural landsca-pe. In: Dynamics of an agricultural landscape. p:
213-223 (L. Ryszkowski, N. French & A. Kedziora,eds.) PWRiL, Poznan,.
Ryszkowski L., Bartoszewicz A. & Kedziora A.1997. The potential role of mid-field forests as
VwerySmatrBook03.p65 2004-06-17, 17:44239
240
buffer zones. p: 171-191 In: Buffer Zones: TheirProcesses and Potential in Water Protection (N.
Haycock, T. Burt, K. Goulding & G. Pinay, eds.).Quest Environmental. Harpenden, Hertfordshire, UK.
Salt D.E., Blaylock N., Kumar N., Dushenkov V., En-sley B.D., Chet I., Raskin I. 1995. Phytoremediation: A
novel strategy for the removal of toxic metals fromthe environment using plants. Biotechnol 13: 468-474.
Sano, T., Nohara, K. Shirai, F. & Kaya, K. 1992. Amethod for microdetection of total microcystin con-
tent in waterbloom of cyanobacteria (blue-green al-gae). Int. J. Environ. Analyt. Chem. 49:163-170.
Sas-Nowosielska A., Kucharski R. & Korcz M.2001. Optimizing of land characterization for phy-
toextraction of heavy metals. Obieg pierwiastkoww przyrodzie.Monografia t.1. IOS Warszawa: 345-348.
Scheffer M., Hosper S. H., Meijer M.-L., Moss B.& Jeppesen E. 1993 - Alternative equilibria in shal-
low lakes. Trends in Ecology and Evolution 8: 275-279.Schiemer F., Zalewski M., Thrope J.E., [eds] 1995
The Importance of Aquatic - Terrestrial Ecotones forFreshwater Fish Developments in Hydrobiology Kluwer
Academic PublishersSchiemer F., 1999. Limnological research in theDanube wetlands with emphasis on environmen-
tal management and restoration scenarios. StronyIn: Groundwater ecology. A tool for management
of water resources (D. L. Danielopol, C. Griebler,J. Gibert, H.P. Nachtnebel & J. Notenboom, eds.).
Lecture notes. Austrian Academy of Science - Instituteof Limnology. Vienna - Mondsee.
Schiemer F., Spindler T.1989. Endangered fishspecies of the Danube River in Austria. Regulated
Rivers. Research and Management 4:397-407.Schiemer F., Zalewski M. & Thorpe J.. (eds.). 1995.
The Importance of Aquatic-Terrestrial Ecotones forFreshwater Fish . Developments in Hydrobiology
105. Kluwer Academic Publishers,Schmutz S., Kaufmann M., Vogel B. & JungwirthM. (eds.). 2000b. Methodische Grundlagen Und Be-ispiele Zur Bewertung Der Fischokologischen Funk-
tionsfahigkeit Osterreichischer Fliessgewasser. In-stitut fur Wasservorsorge, Gewassergüte und Fi-
schereiwirtschaft Abteilung fur Hydrobiologie, Fi-schereiwirtschaft und Aquakultur Universitat fur
Bodenkultur, Wien, 211pp.
Schmutz S., Kaufmann M., Vogel B., JungwirthM. (eds.). 2000b. Methodische Grundlagen Und Be-
ispiele Zur Bewertung Der Fischökologischen Funk-tionsfähigkeit Österreichischer Fliessgewässer. In-
stitut für Wasservorsorge, Gewässergüte und Fi-schereiwirtschaft Abteilung für Hydrobiologie, Fi-
schereiwirtschaft und Aquakultur Universität fürBodenkultur Wien. 211pp.
Schmutz S., Kaufmann M., Vogel B., JungwirthM., & Muhar S. 2000a. A multi-level concept for
fish-based, river-type-specific assessment of eco-logical integrity. Hydrobiologia 422/423: 279-289.
Schumm S. A. 1977. The Fluvial System. John Wi-ley and Sons, New York.
Seidel K., 1966. Biologischer Seenschutz (W: Pflan-zen als Wasserfilter) - Foederation Europainscher
Gewasserschutz Symposium, 76: 357-369.Shannon, C. & W. Weaver: 1949. Mathematical
theory of communication, University of IllinoisPress, Urbana.
Shapiro J., Lamarra V., Lynch M. 1975. Biomani-pulation: an ecosystem approach to lake restora-
tion. p: 85-96 In: Proceedings of a Symposium onWater Quality Management Through BiologicalControl (P. L. Brezonik, J. L. Fox, eds.) University
of Florida.Simpson J. C., Norris R. H. 2000. Biological as-
sessment of river quality: development of AusRi-vAS models and outputs.p: 125-142 In: Assessing
the biological quality of freshwaters. (J. F. Wri-ght, D. W Sutcliffe & M.T. Furse, eds.) RIVPACS
and other techniques. Freshwater Biological Asso-ciation, Ambelside.
Smayda, T., 1990. Novel and nuisance phytoplank-ton blooms in the sea: Evidence for a global epi-
demic, in Toxic Marine Phytoplankton, edited byE. Graneli, B. Sundstrom, L. Edler, and D. M. An-
derson, Elsevier, New York.Smith S.E., Read D.J. 1997. Mycorrhizal Symbio-
sis. Academic Press, London. pp.605.Sommer, U. 1986. Phytoplankton competition
along a gradient of dilution. Oecologica, 68: 503-506.
Sommer U., Stibor H. 2002. Copepoda - Cladoce-ra - Tunicata: The role of the three major mezo-
zooplankton groups in pelagic food webs. Ecologi-cal Research 17: 161-174.
References
VwerySmatrBook03.p65 2004-06-17, 17:44240
241
Sommer U. 1992. Phosphorus limited Daphnia: in-traspecific facilitation instead of competition. Lim-
nology and Oceanography 37: 966-973.Sommer U., Gliwicz Z. M., Lampert W. & Dun-can A. 1986. The PEG-model of seasonal succes-sion of planktonic events in fresh waters. Archiv
fur Hydrobiologie 106: 433-471.Sorokin Y. I. 1999. Aquatic microbial ecology. Buc-
khys Publishers, Leiden.Southwood T. R. E. 1977. Habitat, the template
for ecological strategies. Journal Animal Ecology46: 337-365.
Stalnaker C. B. 1993. Fish habitat models in envi-ronmental assessments. p: 140-162 In: Environmen-
tal Analysis. The NEPA-Experience. (S.G. Hildebrand,J.B. Cannon, eds) CRC Press, Boca Raton. Fla.
Stalnaker C. B., Lamb B. L., Henriksen J., Bo-vee K., & Bartholow J. 1995. The Instream Flow
Incremental Methodology: A Primer for IFIM: Bio-logical Report 29, 45 pp.
Steedman H. F., 1976. Zooplankton fixation andpreservation. UNESCO Press, Paris, 350 pp.
Strahler A.N. 1964. Quantitative analysis of wa-tershed geomorphology. American GeophysicalUnion Transactions 38, 913-920.
Suess M.J. 1982. Examination of water for pollu-tion control. A reference handbook. Vol. 3. WHO.
Copenhagen. Pergamon Press, 251-255.Sutton, J.C., Sheppard, B.R. 1976. Aggregation
of sand-dune soil by endomycorrhizal fungi. Can.J. Bot. 54: 326-333.
Swanson F.J., Gregory S.V., Sedell J.R., CampbellA.G. 1982. Land-water interactions: the riparian zone.
P.267-291 In R.L. Edmonds (ed.), Analysis of coniferousforest ecosystems in the western United States. Hut-
chinson Ross, Stroudsburg, Pennsylvania, USA.Swenson S. M., C.P. Rickard, K. E. Freemark, P.Mac Quarrie 1991. Testing for Pesticide Toxicityto Aquatic Plants: recommendations for Test Spe-
cies. Plants for toxicity Assessment: second Volu-me, ASTM STP 1115, J. W. Gorsuch, W. R. Lower,
W. Wang and M. Lewis, Eds., American Society fortesting and materials, Philadelphia, 1991, 77-97.
Swoboda, U.K., Dow, C.S., Chaivimol, J., Smith,N. & Pound, B.P. 1994. Alternatives to the Mouse
Bioassay for Cyanobacterial Toxicity Assessment.p: 106-110 In: G.A. Codd et al. (Eds.), Detection
methods for cyanobacterial toxins. The Royal So-ciety of Chemistry, Cambridge, UK.
Szczepanski A., 1977. Limiting factors and productivi-ty of macrophytes. Folia geobot. Phytotax., 12 : 1-7.
Szpakowska B., Zyczynska-Baloniak I. 1994. Therole of biogeochemical barriers In water migra-
tion of humin substances. Polish Journal Environ-mental Studies 3 (2): 35-41.
Takeda S. & Kurihara Y. 1994. Preliminary studyof management of red tide water by the filter fe-
eder Mytilus edulis galloprovincialis*1, Marine Pol-lution Bulletin, 28(11): 662-667
Tarczynska, M., Romanowska-Duda, Z. & Zalew-ski, M. 1997. Spirodela ologorrhiza culture as bio-
test of cyanobacterial blooms toxicity. Acta Phy-siologiae Plantarum 19(2): 242-243.
Tarczynska, M. 1998. Causes of toxic cyanobacte-rial blooms appearance in the Sulejow Reservoir
and theirs effect of representatives of freshwater eco-systems. PhD. University of Lodz (in Polish)
Tarczynska M., Nalecz-Jawecki G., Romanowska-Duda Z., Sawicki J., Beattie K., Codd G. & Za-lewski M. 2001. Test for the Toxicity Assessmentof Cyanobacterial Bloom Samples. EnvironmentalToxicology 16: 383-390.
Tarczynska M., Romanowska-Duda Z., JurczakT., Zalewski M. 2001. Toxic cyanobacterial blo-
oms in drinking water reservoir - causes, consequ-ences and management strategy. Wat. Science and
Technology. Water Supply 1: 237-246.Tarczynska M., Nalecz-Jawecki G., Brzychcy M.,Zalewski M. & Sawicki J. 2000. The toxicity ofcyanobacterial blooms as determined by micro-
biotests and mouse assay. p: 527-532 In: New Mi-crobiotest for Routine Toxicity Screening and Bio-
monitoring. (G. Personne et al., eds.), Kluwer Aca-demic / Plenum Publishers, New York.
Tessier A., Campbell P G C & Bisson imie 1979:Sequential extraction procedure for the speciation of
particulate trace metals. Anal. Chem. 51: 844-850.Thienemann A. (ed.) 1925. Die Binnengewasser
1. Die Binnengewasser Mitteleuropas. Stuttgart:Schweitzerbart’sche Verlagsbuchhandlung.
Thornton J. A. (ed.) 1982. Lake McIlwaine: theeutrophication and recovery of a tropical African
man-made lake. Monographiae Biological vol. 49,Junk, The Hague. 251 pp.
References
VwerySmatrBook03.p65 2004-06-17, 17:44241
242
Tiedje J. M. 1982. Denitrification. p: 1011-1026In Method of soil analysis (A. L. Page, R.H. Miller
& D. R. Keeney, eds.) Pt. 2, Agronomy Monograph9, American Society of Agronomy, Madison, Wis.
Timchenko V., Oksiyuk O., Gore J., 2000. A mo-del of ecosystem state and water quality manage-
ment in the Dnieper Delta. Special Issue. Ecologi-cal Engineering 16: 119-126.
Todd N. J. & Todd J. 1993. From Eco-cites to Li-ving Machines. Principles of Ecological Design.
North Atlantic Books. USA. 197 pgs.Torokné, A. K. 2000. The potencial of the Tham-
notoxkit microbiotest for routine detection of cy-anobacterial toxins. p: 533-539 In: G. Personne et
al. (eds.). New Microbiotest for Routine ToxicityScreening and Biomonitoring. Kluwer Academic /
Plenum Publishers, New York.Townsend C. R., Hildrew A. G. 1994. Species tra-
its in relation to a habitat templet for river sys-tems. Freshwater Biology 31: 265-275.
Törökné, A. K. 1999 A new culture-free microbio-test for routine detection of cyanobacterial to-
xins. Environmental Toxicology Water Quality 1999,14: 466 - 472.Trihey E.W., Stalnaker C. B. 1985. Evolution and
application of instream flow methodologies tosmall hydropower development: An overview of
the issues. p:176-183 In: Proceedings of the sym-posium on small hydropower and fisheries. (F.W.
Olson, R.G. White & R.H. Hamre, eds). The Ame-rican Fisheries Society. Denwer, Colorado.
Turner, R. E. and N. N. Rabalais. 1994. Coastaleutrophication near the Mississippi River delta.
Nature 368: 619-621.Turner, R. E., and Rabalais N. N.. 1994. Changes
in Mississippi River nutrient supply and offshoresilicate-based phytoplankton community respon-
ses, p. 147–150. In K. R. Dyer and R. J. Orth [eds.],Changes in fluxes in estuaries: Implications from
science to management. Olsen & Olsen Fredens-borg.
Twinch A. J., Grobler D. C. 1986. Pre-impoundmentas a eutrophication management option: a simulation
study at Hartbeesport Dam. Water S.A. 12: 19-26.US EPA. 1989a. Remedial Investigation and Feasi-
bility Study at the Tonolli Corporation Site. Ne-squehoning, PA.
US EPA.1989. Risk Assessment Guidance for Superfund.Vol.1. Human Health Evaluation Manual. Parts A, B and
C. US EPA /540/1-89/002.Washington.U.S. EPA. 1997. Recent Developments for In situ
Treatment of Metal Contaminated Soils. 542-R-97-004Uhlman D. 1975 Hydrobiologie. Fischer, Studgart.
UNEP. 2000. Lakes and Reservoirs Similarities, Dif-ferences and Importance.Newsletter and Techni-
cal Publications Volume 1UNEP. 2003. Phytotechnologies. A Technical Ap-
proach in Environmental Management. UNEP, Di-vision of Technology, Industry and Economics. Fre-
shwater Management Series No.7UNEP/Wetlands International. 1997. Wetlands and
Integrated River Basin Management: experiencesin asia and the Pacific. asia Pacif-Kuala Lumbur.
Malaysia. 346 pgs.Van der Ryn S. & Cowan S. 1996. Ecological de-
sign. Island press. 201 pgs.Vangronsveld J., Van Assche F. & Clijsters H. 1995.
Reclamation of a bare industrial area contaminated bynon-ferrous metals: in situ metal immobilization and
revegetation.Environmental Pollution 87: 51-57.Varadi L. 2003. A review of extensive/semi-inten-sive integrated freshwater fish production systems
in Central and Eastern Europe. p: 88 - 91 In: Bey-ond Monoculture. (T.,Chopin, H. Reinertsen eds.)
EAS Special Publication 33.Varadi L., Bekefi E. 2003. Economic analysis of
combined intensive - extensive pond fish productionsystems. p: 348-349 In: Beyond Monoculture. (T.,Cho-
pin, H. Reinertsen eds.) EAS Special Publication 33.Verhoeven J. T. A., Maltby E.,& Schmitz M. B.1990. Nitrogen and phosphorus mineralization intens and bogs. Journal of Ecology 78: 713-726.
Vorosmary C. J., Fekete B., Meybeck M. & Lam-mers R. B. 2000. The global systems of rivers : its
role in organizing continental landmass and defi-ning land-to-ocean linkages. Global Biogeochemi-
cal Cycles, 14: 599-621. 100-Vorosmarty C.J., Sahagian D. 2000. Antropoge-
nic disturbance of the terrestrial water cycle. Bio-science 50:753-765.
Vymazal J., Brix H., Cooper P.F., Green M.B. andHabrel R. 1998. Constracted wetlands for waste
water treatment in Europe. Backhuys Publisher,Leiden, 366 pp.
References
VwerySmatrBook03.p65 2004-06-17, 17:44242

243
Waggoner P. E. 1990. Climate Change and U.S.Water Resources. John Wiley & Sons, New York
Wagner I., Zalewski M. 2000. Effect of hydrologi-cal patterns of tributaries on biotic processes in
lowland reservoir - consequences for restoration.Ekological Engineering, Vol.16, 79-90.
Wagner-Lotkowska I. 2002. Influence of the se-lected climatic, hydrological and biological factors on
eutrophication processes and symptoms in the Sule-jów Reservoir, PhD Thesis [typescript] (in polish)
Wang W. 1989. Literatur review on duckweed to-xicity testing. Environ Research 52:7-22.
Ward J.V. 1989. The four-dimensional nature oflotic ecosystems. J. N. Am. Benthol. Soc. 8: 2-8.
Ward, C.J., Beattie, K.A., Lee, E.Y.C. & Codd,G.A. 1997. Colorymetric protein phosphatase in-
hibition assay of laboratory strains and natural blo-oms of cyanobacteria: comparisons with high-per-
formance liquid chromatographic analysis for mi-crocystins. FEMS Microbiol. Let. 153: 465-473.
Warwick RM, Clarke KR (1995). New 'biodiversity'measures reveal a decrease in taxonomic distinct-
ness with increasing stress. Mar Ecol Prog Ser 129,301-305Water Framework Directive. 2000. Directive of
the European Parliment and of the Council 2000/60/EC Establishing a Framework for Community
Action in the Field of Water Policy, 1997/0067(COD), C5-0347/2000, LEX 224, PE-CONS
3639/1/00, REV1.Water Quality Standarts Handbook 1994., EPA-
83-B-94-005a, secondo Edition (Maryland, USA)Weiß, J., Libert, H. P. & Braune, W. 2000. Influ-
ence of Microcystin-RR on growth and photosyn-thetic capacity of the duckweed Lemna minor L.
J. Appl. Bot. 74:100-105.Widdows, J. 1985. Physiological Procedures. In:
The Effects of Stress and Pollution on Marine Ani-mals. B.L. Bayne et al. (Eds.). Toronto: Praeger
Press. pp. 161-178.Willby N.J., Abernethy V.J., Demars B.O.L. 2000.
Attribute-based classification of European hydro-phyte and its relationship to habitat utilization.
Freshwater Biology 43: 43-74.Wilcock F.A. & Carter R.W.G. 1977. An Environ-
mental Approach to the Restoration of Badly ErodedSand Dunes. Biological conservation. Vol.77: 279-291
Wojtal A., Frankiewicz P. & Zalewski M. 1999.The role of the invertebrate predator Leptodora
kindti in the trophic cascade of a lowland reservo-ir. Hydrobiologia 416: 215-223.
Wolanski E., Boorman L. A., Chicharo L., Langlois-Saliou E., Lara R., Plater A. J., Uncles R. J. & Zalew-ski M. 2004. (in press). Ecohydrology as a new tool forsustainable management of estuaries and coastal wa-
ters. Wetlands Ecology and Management.Woodhouse W.W.Jr. 1978. Dune Building and Sta-
bilization With vegetation. U.S. Army Corp of en-gineers. Vol.3: 9-104.
Wootton R. 1990 - Ecology of Teleost Fishes. Lon-don New York. Chapman and Hall. 404 pp.
World Health Organization, 1971. InternationalStandards for Drinking-water, 3rd ed., Geneva,
World Health Organization. 1998. Guidelines fordrinking water quality, 2nd ed., Addendum to Vol.
2, Health criteria and other supporting informa-tion. Geneva.
Wright J.F., Furse M. T. & Armitage P. D. 1993.RIVPACS - a technique for evaluating the biological
quality of rivers in the U.K. Water Research 3: 15-25.Yoshida, T., Makita, Y., Nagata, S., Tsutsumi, T., Yoshi-da, F., Sekijiima, M. 1997. Acute oral toxicity of mi-
crocystin-LR, a cyanobacterial hepatotoxin, in mice.Natural Toxins 5: 91-95.
Yu S. Z. 1995. Primary prevention of hepatocellu-lar carcinoma. Journal Gastroenterology and He-
patology 10: 674-682.Zalewski M. 1983. The influence of fish communi-
ty structure on the efficiency of electrofishing.Fish Management 14(4):177-186.
Zalewski M., 2000. Ecohydrology-the scientificbackground to use ecosystem properties as manage-
ment tools toward sustainability of water resources.Guest Editorial Ecological Engineering 16:1-8.
Zalewski M. (ed.) 2002. Guidelines for the Inte-grated Management of the Watershed. Phytotech-
nology and Ecohydrology. UNEP, Division of Tech-nology, Industry and Economics. Freshwater Ma-
nagement Series No.5., 188 pp.Zalewski M., Cowx I.G. 1990. Factors Affecting
the Efficiency of Electric Fishing. Chapter 4, pp.89-111,in: I.G. Cowx and P. lamarque (eds) Fishing
with Electricity. Applications in Freswater Fishe-ries Management. Fishing News Books. 248 pp.
References
VwerySmatrBook03.p65 2004-06-17, 17:44243
244
Zalewski, M., Brewinka-Zaras, B., Frankiewicz,P. & Kalinowski, S., 1990. The potential for bio-
manipulation using fry communities in low landreservoirs: concordance between water quality and
optimal recruitment. Hydrobiologica 200/201: 549-556.
Zalewski M., Naiman R. J. 1985.The regulationof riverine fish communitiesby a continuum of abio-
tic-biotic factors. P: 3-9 in Habitat modificationand freshwater fisheries. (J. S. Alabaster,ed.) FAO
UN, Butterworths,London.Zalewski M., Brewinska - Zaras B., FrankiewiczP. & Kalinowski S. 1990. The potential for bioma-nipulationusing fry communities in a lowland re-
servoir: between water quality and optimal re-cruitment. Hydrobiology 200/201: 549-556
Zalewski M., Puchalski W., Frankiewicz P. & BisB. 1994. Riparian ecotones and fish communities
in rivers - intermediate complexity hypothesis. p:152-160 In: Rehabilitation of Freshwater Fisheries.
(I.G. Cowx, ed.) Fishing News Books.Zalewski M., Janauer G. S. & Jolankai G. (eds.).1997. Ecohydrology - A new Paradigm for the Su-stainable Use of Aquatic Resources. InternationalHydrological Programme UNESCO. Technical Do-
cument on Hydrology No 7. Paris, 58 pp.Zalewski M., Tarczynska M., Wagner-LotkowskaI. 2001. Ecohydrological approach for eliminationof toxic algal blooms in lowland reservoir. Verh.
Internat. Verein. Limnol. 27 1-8Zalewski M., Bis B., Frankiewicz P., Lapinska M.& Puchalski W. 2001. Riparian ecotone as a keyfactor for stream restoration. Ecohydrology & Hy-
drobiology 1 (1-2): 245-251.
Zalewski M., Lapinska M. & Bayley P. B. 2003.Fish Relationships with wood in large rivers. p: 195-
211. In: Ecology and Management of Wood in WorldRivers (S. Gregory ed.) American Fisheries Socie-
ty. Bethsda, Maryland.Zalewski M., Robarts R. 2003. Ecohydrology a
new Paradigm for Integrated Water Resources Ma-nagement. SIL News 40:1-5
Zalewski M. Wagner-Lotkowska I. Tarczynska M.2000. Ecological approaches to the elimination of
toxic algal blooms in a lowland reservoir. Limnolo-gy 27 3176-3183.
Zdanowicz A. 2001. Influence of riparian ecotonezones on the nutrients concentration in groundwa-
ter. Falenty IMUZ, PhD thesis. (in Polish)Zdanowicz A. 2004. Analizis of non-point sources
pollution movement conditions in the Grabia ri-ver catchment. Woda-Srodowisko-Obszary Wiej-
skie in press. (in Polish)Zielinska K., 1997. Analizis of phosphorous kon-
tent In different willow species from the shore ofSulejów Reservoir. Msc. Thesis. Analiza zawartosci
fosforu w róznych gatunkach wierzb rosnacych nadZalewem Sulejowskim. Praca magisterska, Kate-dra Ekologii Stosowanej Uniwersytetu Lodzkiego,
Lodz, [typescript] (In polish)Zhou, L., Yu, D., Yu, H. et al. 2000. Drinking
water types, microcystins and colorectal cancer.Zhonghua Yu Fang Yi Xue Za Zhi 34(4): 224-226.
References
VwerySmatrBook03.p65 2004-06-17, 17:44244

245
INTERNET RESOURCEShttp://www.unep.or.jp/ietc/Publications/Freshwater/FMS1/index.asp
http://www.unep.or.jp/ietc/Publications/Freshwater/FMS2/index.asphttp://www.unep.or.jp/ietc/Publications/Freshwater/FMS5/index.asp
http://www.unep.or.jp/ietc/Publications/Freshwater/FMS7/index.asphttp://www.unep.or.jp/ietc/Publications/Freshwater/SB_summary/index.asp
http://www.unep.or.jp/ietc/Publications/index.asphttp://www.unep.or.jp/ietc/Publications/index.asp
http://www.unep.or.jp/ietc/Publications/Integrative/EnTA/AEET/index.asphttp://www.unep.or.jp/ietc/Publications/Short_Series/LakeReservoirs-4/index.asp
http://www.unep.or.jp/ietc/Publications/Short_Series/LakeReservoirs-3/index.asphttp://www.unep.or.jp/ietc/Publications/Short_Series/LakeReservoirs-2/index.asp
http://www.unep.or.jp/ietc/Publications/TechPublications/TechPub-15/main_index.asphttp://www.unep.or.jp/ietc/Publications/TechPublications/TechPub-17/index.asp
http://www.unep.or.jp/ietc/Publications/TechPublications/TechPub-12/index.asphttp://www.unep.or.jp/ietc/Publications/techpublications/TechPub-11/index.asp
http://www.unep.or.jp/ietc/Publications/techpublications/TechPub-8b/index.asphttp://www.unep.or.jp/ietc/Publications/techpublications/TechPub-7/index.asp
http://www.unep.or.jp/ietc/Publications/techpublications/TechPub-5/index.asp
References
VwerySmatrBook03.p65 2004-06-17, 17:44245

246
Maciej ZalewskiInternational Centre of Ecology,Polish Academy of SciencesWarsaw, Dziekanow Lesny 1 Konopnickiej Str.,05-092 Lomianki, Poland
Iwona Wagner-LotkowskaCentre for Ecohydrological Studies,University of Lodz,12/16 Banacha Str.,90-237 Lodz, Poland
Richard D. RobartsGEMS/Water Programmec/o National Water Research Institute11 Innovation Blvd.Saskatoon, SK, CANADA S7N 3H5
Philippe PypaertUNESCO -ROSTEPalazzo Zorzi, Castello 493030122 Venice, Italy
Vicente Santiago-FandinoUNEP - IETC1091 Oroshimo-cho, Kusatsu-City,Shiga 525-0001, Japan
CONTRIBUTING AUTHORS
Agnieszka Bednarek,Piotr Frankiewicz,Tomasz Jurczak,Zbigniew Kaczkowski,Edyta Kiedrzynska,Malgorzata Lapinska,Malgorzata Tarczynska,Adrianna Trojanowska,Adrianna Wojtal,Centre for Ecohydrological Studies,University of Lodz,12/16 Banacha Str., 90-237 Lodz, Poland
Jan Bocian,Katarzyna Izydorczyk,Kinga Krauze,Joanna Mankiewicz,Beata Sumorok,International Centre of Ecology,Polish Academy of SciencesWarsaw, Dziekanow Lesny, 1 Konopnickiej Str.,05-092 Lomianki, Poland
Alberto T. CalcagnoArgentine Institute of Water Resources;Faculty of Engineering University ofBuenos AiresAzcuenaga 1360 P7 „15” - C1115AAlBuenos Aires, Argentina
Alexandra Chicharo,Luis Chicharo,University of Alagarve,CCMAR, Campus de Gambelas (FCMA),8000-810 Faro, Portugal
Sven E. JorgensenDepartment of Analytical ChemistryUniversitetsparken 2DK-2100 CopenhagenDenmark
Zdzislaw Kaczmarek,Institute of Geophysics,Polish Academy of Sciences64 Ks. Janusza Str., 01-452 Warsaw, Poland
Rafal Kucharski,Aleksandra Sas-Nowosielska,Institute for Ecology of Industrial Areas,6 Kossutha Str., 40-933 Katowice, Poland
J.Michael Kuperberg,Florida State University226 Morgan Building, 2035 E. Paul DiracDrive Tallahassee, FL 32310-3700
Artur Magnuszewski,Faculty of Geography and Regional Studies,University of Warsaw,30 Krakowskie Przedmiescie Str.,00-927 Warsaw, Poland
Joanna MarkowskaJacek MarkowskiDepartment of Agricultural Bases for Environ-mental Development,Faculty Computer Laboratory,Agricultural University of Wroclaw24 Plac Grunwaldzki Str.50-363, Wroclaw, Poland
Zdzislawa Romanowska-Duda,Department of Plant Growth Regulation,University of Lodz,12/16 Banacha Str., 90-237 Lodz, Poland
Lech Ryszkowski,Andrzej Kedziora,Research Center for Agriculturaland Forest Environments,Polish Academy of Sciences,Agricultural Academy of A. Cieszkowski19 Bukowska Str., 60-809 Poznan, Poland
Anna Zdanowicz,Institute for Land Reclamationand Grassland Farming,Falenty, 05-090 Raszyn, Poland
Contributing Authors
VwerySmatrBook03.p65 2004-06-17, 17:44246
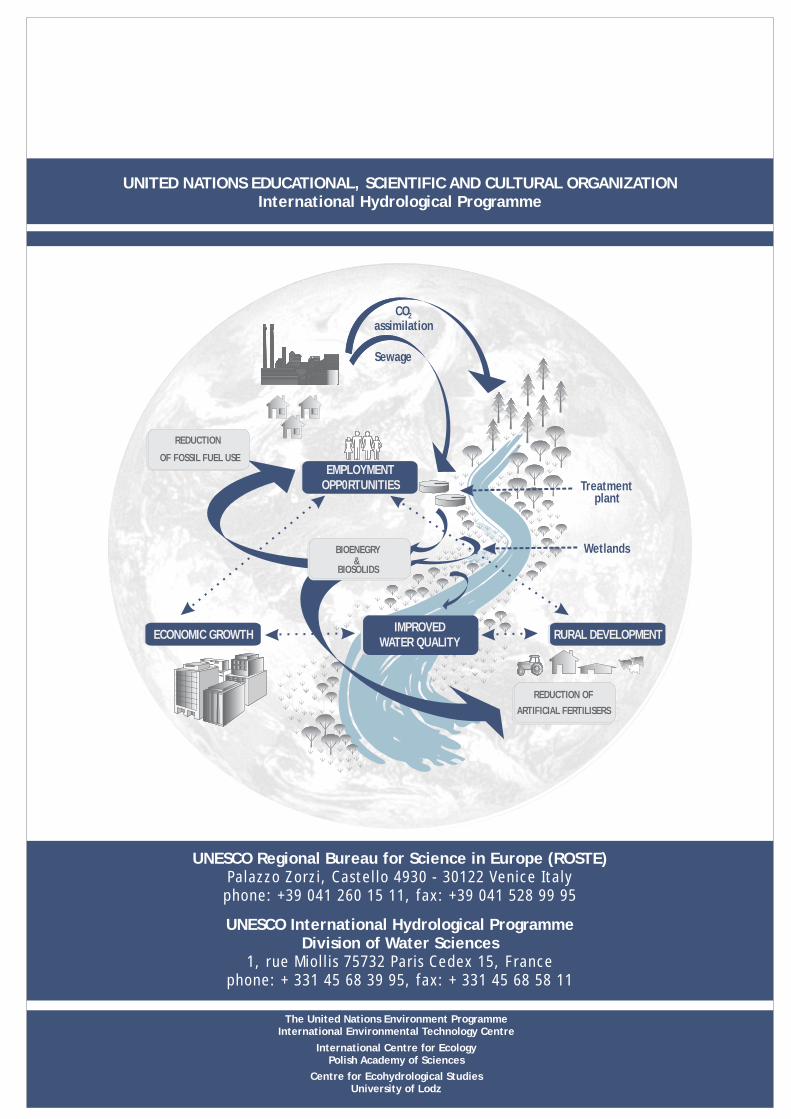
UNITED NATIONS EDUCATIONAL, SCIENTIFIC AND CULTURAL ORGANIZATIONInternational Hydrological Programme
The United Nations Environment ProgrammeInternational Environmental Technology Centre
Centre for Ecohydrological StudiesUniversity of Lodz
International Centre for EcologyPolish Academy of Sciences
UNESCO Regional Bureau for Science in Europe (ROSTE)Palazzo Zorzi, Castello 4930 - 30122 Venice Italyphone: +39 041 260 15 11, fax: +39 041 528 99 95
UNESCO International Hydrological ProgrammeDivision of Water Sciences
1, rue Miollis 75732 Paris Cedex 15, Francephone: + 331 45 68 39 95, fax: + 331 45 68 58 11
Treatmentplant
Sewage
COassimilation
2
Wetlands
REDUCTION
OF FOSSIL FUEL USE
BIOENEGRY&
BIOSOLIDS
REDUCTION OF
ARTIFICIAL FERTILISERS
ECONOMIC GROWTH RURAL DEVELOPMENT
EMPLOYMENTOPP0RTUNITIES
IMPROVEDWATER QUALITY
Related Documents


