Guidelines for Developing a Marginal Abatement Cost Curve (MACC) August 2014

Welcome message from author
This document is posted to help you gain knowledge. Please leave a comment to let me know what you think about it! Share it to your friends and learn new things together.
Transcript

Guidelines for Developing a Marginal Abatement Cost Curve (MACC)
August 2014

Guidelines for Developing a Marginal Abatement Cost Curve August 2014
2
Contents
Purpose and Structure of the Document ............................................................................ 3
SECTION A: ABOUT MACCS ................................................................................................ 4
Definitions ......................................................................................................................... 4
Introduction ...................................................................................................................... 5 Understanding MACCs ............................................................................................................... 5 Using MACCs to assist with decision making ............................................................................... 6
What information is needed to generate a MACC .............................................................. 7 Determining the Project Lifetime ............................................................................................... 7 Determining the Full Project Cost ............................................................................................... 7 Determining Project Savings ....................................................................................................... 8 Determining Emissions Abated .................................................................................................. 10
Calculating Marginal Abatement Cost .............................................................................. 11
Example 1: Kitchen urn timers ......................................................................................... 11
Example 2: Switching the vehicle fleet to hybrid vehicles ................................................. 12
Generating the MACC ...................................................................................................... 13
Other considerations when selecting abatement options ................................................ 14
SECTION B: USING THE MACC TOOL ................................................................................. 15
Overview ......................................................................................................................... 15
Using the Project Template worksheet ............................................................................ 15 Entering Project Details ............................................................................................................. 16
To add a new project ....................................................................................................... 16
Using the Config worksheet ............................................................................................. 16 To change the Discount Rate ..................................................................................................... 17 To change the Chart Scaling Factor ............................................................................................ 17 To add a Carbon Price ............................................................................................................... 17 Customising the MACC Tool ...................................................................................................... 17
Guidelines for Developing a Marginal Abatement Cost Curve August 2014
3
Purpose and Structure of the Document The purpose of this document is to provide guidance for Local Government Agencies and other similar organisations in developing a Marginal Abatement Cost Curve (MACC) and as such, to assist with identifying cost effective abatement actions as part of the agency’s efforts to reduce their greenhouses gas emissions
This document is intended as supplementary guideline to the Project Manager’s Guide to Reducing Greenhouse Gas Emissions.
This document has been divided into 2 sections, and is accompanied by a Microsoft Excel tool designed to assist the user to develop their own MACC:
Section A provides an overview of how to develop a MACC and select abatement actions on the basis of this.
Section B provides an overview of the MACC Tool and how to modify it to generate a MACC specific to the agency in question.
The MACC Tool provides a worked example of the evaluation completed on a series of abatement projects and the resulting MACC. The spreadsheet can be modified to assess an agency’s own abatement projects and produce a customized MACC for the agency.
This guideline and associated MACC Tool was developed by Greensense for distribution by the Western Australian Local Government Association to its members.
The tool has been released ‘as is’ and is intended as an example tool that can be modified for your own purposed.
If you have any questions or feedback on the tool, please contact the WALGA Climate Change Coordinator on 08 9213 2049.
Guidelines for Developing a Marginal Abatement Cost Curve August 2014
4
SECTION A: ABOUT MACCS
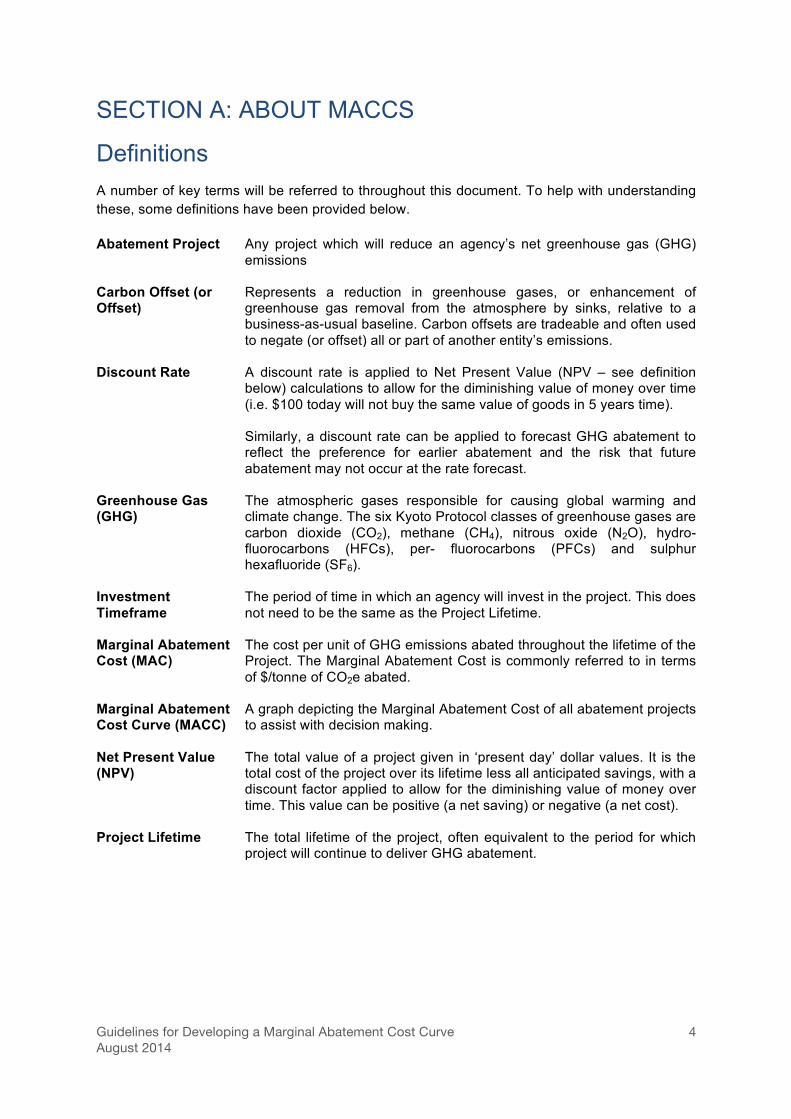
Definitions A number of key terms will be referred to throughout this document. To help with understanding these, some definitions have been provided below.
Abatement Project Any project which will reduce an agency’s net greenhouse gas (GHG) emissions
Carbon Offset (or Offset)
Represents a reduction in greenhouse gases, or enhancement of greenhouse gas removal from the atmosphere by sinks, relative to a business-as-usual baseline. Carbon offsets are tradeable and often used to negate (or offset) all or part of another entity’s emissions.
Discount Rate A discount rate is applied to Net Present Value (NPV – see definition below) calculations to allow for the diminishing value of money over time (i.e. $100 today will not buy the same value of goods in 5 years time).
Similarly, a discount rate can be applied to forecast GHG abatement to reflect the preference for earlier abatement and the risk that future abatement may not occur at the rate forecast.
Greenhouse Gas (GHG)
The atmospheric gases responsible for causing global warming and climate change. The six Kyoto Protocol classes of greenhouse gases are carbon dioxide (CO2), methane (CH4), nitrous oxide (N2O), hydro-fluorocarbons (HFCs), per- fluorocarbons (PFCs) and sulphur hexafluoride (SF6).
Investment Timeframe
The period of time in which an agency will invest in the project. This does not need to be the same as the Project Lifetime.
Marginal Abatement Cost (MAC)
The cost per unit of GHG emissions abated throughout the lifetime of the Project. The Marginal Abatement Cost is commonly referred to in terms of $/tonne of CO2e abated.
Marginal Abatement Cost Curve (MACC)
A graph depicting the Marginal Abatement Cost of all abatement projects to assist with decision making.
Net Present Value (NPV)
The total value of a project given in ‘present day’ dollar values. It is the total cost of the project over its lifetime less all anticipated savings, with a discount factor applied to allow for the diminishing value of money over time. This value can be positive (a net saving) or negative (a net cost).
Project Lifetime The total lifetime of the project, often equivalent to the period for which project will continue to deliver GHG abatement.

Guidelines for Developing a Marginal Abatement Cost Curve August 2014
5
Introduction Understanding MACCs
Quite often an agency will be faced with a number of abatement project options with different resourcing requirements. In this situation it is necessary to assess the projects and make a decision as to which one(s) to proceed with.
The MACC is an aid to decision making that provides a simple way of identifying which projects are the most cost effective per unit of CO2e abated and which options offer the greatest abatement potential. It is a visual representation of a group of greenhouse gas abatement projects listed from the most cost effective per tonne of carbon abated to the least cost effective.
An example MACC is provided in Figure 1 below.
Figure 1 Example MACC
From this MACC we can see that the first project, circled above (timers on kitchen urns) will offset a very small volume of emissions (22 t CO2e) at a negative cost of abatement of $196 per tonne of CO2e (outlined in red in Figure 1). While this project is great value in terms of cost of abatement, it abates very little emissions, as is evidenced by the narrow width of the bar on the chart.
Similarly, the second project (building energy efficiency) will offset a much larger volume of 2000 tonnes CO2e at a negative cost of $134 per tonne CO2e abated. Again, the agency will save money by implementing this project. That is, the cost of implementing the energy efficiency measures will be more than offset by the resulting reduction in electricity bills.

Guidelines for Developing a Marginal Abatement Cost Curve August 2014
6
Conversely, the third project (switching the vehicle fleet to hybrids) is the next least-cost but requires an investment of $16 per tonne CO2e abated. As we continue to move right along the MACC, each project becomes progressively more costly per tonne abated.
Using MACCs to assist with decision making
The MACC does not necessarily tell you which projects to implement and which ones not to. Rather, it provides an input into the decision making process. In the example above, it would make sense for the agency to implement the first two projects, as they will save the organisation money.
Should the agency decide to implement some of the remaining projects in order of least cost abatement, the MACC can also be used to determine the point at which an agency may choose to cease abating opportunities and instead choose to purchase offsets. For example, if an agency is able to purchase offsets at $25/t CO2e, it would make sense to implement the first three projects which can be implemented at a cost less than the purchase price of offsets. However, the fourth project, with a Marginal Abatement Cost of $39 may not be endorsed when offsets can be purchased instead. This can be visualised within the MACC by inserting a line representing the cost of offsets, as seen in Figure 2 below.
Figure 2 MACC with a price of carbon incorporated
Some agencies may value abatement activities more than offsets and may continue to invest in abatement projects even when offsets are cheaper per tonne of CO2e. It should also be noted that NPV calculations are sensitive to the time period over which the project’s costs and benefits are calculated. While the MACC does not show time-based abatement, it is possible, that by investing in some abatement opportunities, even above a current cost of offsets, an organisation may avoid having to purchase offsets in the future.

Guidelines for Developing a Marginal Abatement Cost Curve August 2014
7
Similar to offsets, a carbon price can also be factored into the MACC chart to represent the price at which carbon must be ‘paid’ for (either through permits or a carbon tax). However, a carbon price can be affect a MACC in a number of different ways and is discussed further in the ‘Other Considerations’ section.
What information is needed to generate a MACC To generate a MACC it is necessary to determine some financial details of the abatement projects and the expected volume of greenhouse gases abated over the projects’ lifetime. Specifically, the following details are required for each project being evaluated:
• The project lifetime • The total cost of the project (both capital and ongoing operational expenses) • Any expected savings to be delivered by the project • The volume of GHG emissions saved over the project lifetime
Sourcing this information may not be a simple process for all abatement projects. Some tips on how to find this information and other important points to consider have been provided below.
Determining the Project Lifetime
The project lifetime is the number of years for which the project is expected to deliver GHG abatement.
Abatement projects that include an infrastructure or asset component (ie, air conditioning upgrades, solar panel installations or tree planting) will often use the lifetime of the asset as the project lifetime. Projects that do not include any asset purchasing (such as behavioural change programs) generally consider the period of investment as the project lifetime.
Consider a project to install solar panels on a building. Talking to manufacturers, installers or other agencies that have undergone a similar project will help to identify the anticipated lifetime of the project infrastructure (solar panels and inverters) and therefore, the project lifetime.
Determining the lifetime of behavioural change programs can be more difficult. For example, consider a program to provide residents with compost bins to reduce the volume of organic waste going to landfill. In this instance, the investment in compost bins might be a once off in the project’s first year, but it is expected that residents will continue to use their bins over a longer period of time (perhaps 3-5 years). There are likely to be many variables in determining how effective the project is and how long people continue to use their compost bins. For example, some people may find that they stop using the bins after the ‘novelty factor’ wears off, others may struggle to use the compost bin effectively and choose to discontinue its use and others may continue to compost for years to come. In this instance, it may be simpler to assume a smaller project lifetime to ensure the abatement potential is not overestimated.
Determining the Full Project Cost
The project cost refers to the total implementation cost and any ongoing operational costs required for the life of the project. Consideration should be given to:
Guidelines for Developing a Marginal Abatement Cost Curve August 2014
8
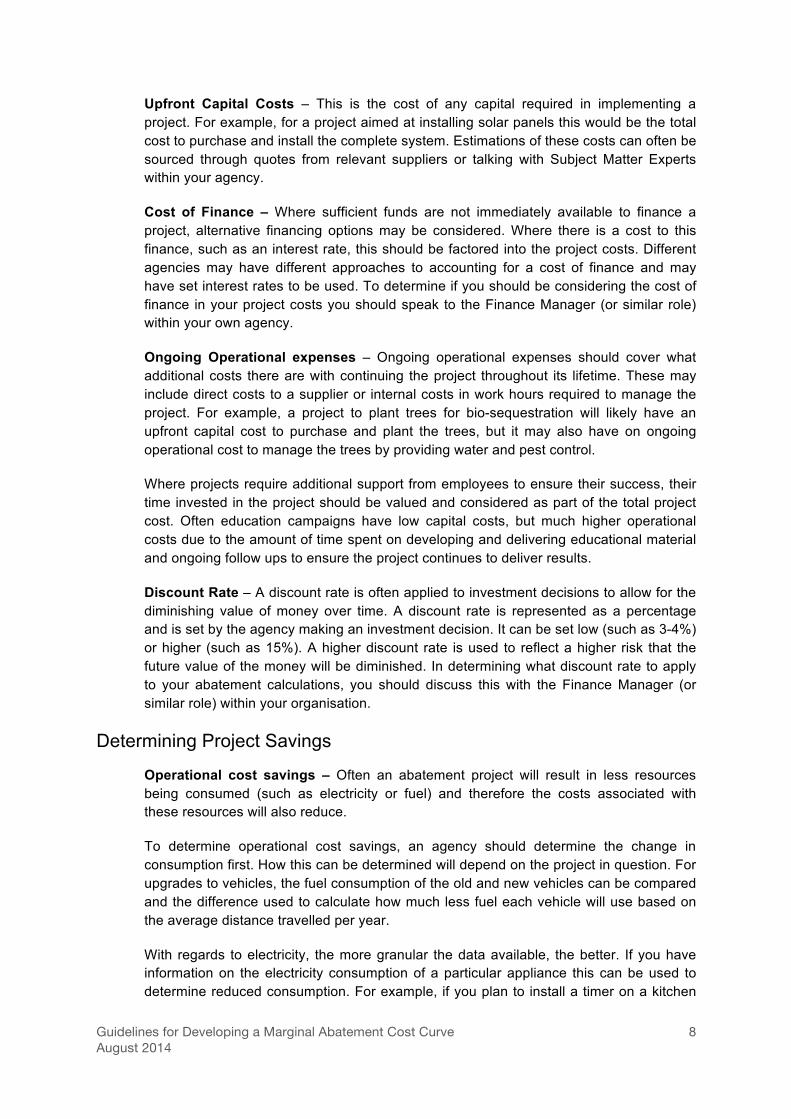
Upfront Capital Costs – This is the cost of any capital required in implementing a project. For example, for a project aimed at installing solar panels this would be the total cost to purchase and install the complete system. Estimations of these costs can often be sourced through quotes from relevant suppliers or talking with Subject Matter Experts within your agency.
Cost of Finance – Where sufficient funds are not immediately available to finance a project, alternative financing options may be considered. Where there is a cost to this finance, such as an interest rate, this should be factored into the project costs. Different agencies may have different approaches to accounting for a cost of finance and may have set interest rates to be used. To determine if you should be considering the cost of finance in your project costs you should speak to the Finance Manager (or similar role) within your own agency.
Ongoing Operational expenses – Ongoing operational expenses should cover what additional costs there are with continuing the project throughout its lifetime. These may include direct costs to a supplier or internal costs in work hours required to manage the project. For example, a project to plant trees for bio-sequestration will likely have an upfront capital cost to purchase and plant the trees, but it may also have on ongoing operational cost to manage the trees by providing water and pest control.
Where projects require additional support from employees to ensure their success, their time invested in the project should be valued and considered as part of the total project cost. Often education campaigns have low capital costs, but much higher operational costs due to the amount of time spent on developing and delivering educational material and ongoing follow ups to ensure the project continues to deliver results.
Discount Rate – A discount rate is often applied to investment decisions to allow for the diminishing value of money over time. A discount rate is represented as a percentage and is set by the agency making an investment decision. It can be set low (such as 3-4%) or higher (such as 15%). A higher discount rate is used to reflect a higher risk that the future value of the money will be diminished. In determining what discount rate to apply to your abatement calculations, you should discuss this with the Finance Manager (or similar role) within your organisation.
Determining Project Savings
Operational cost savings – Often an abatement project will result in less resources being consumed (such as electricity or fuel) and therefore the costs associated with these resources will also reduce.
To determine operational cost savings, an agency should determine the change in consumption first. How this can be determined will depend on the project in question. For upgrades to vehicles, the fuel consumption of the old and new vehicles can be compared and the difference used to calculate how much less fuel each vehicle will use based on the average distance travelled per year.
With regards to electricity, the more granular the data available, the better. If you have information on the electricity consumption of a particular appliance this can be used to determine reduced consumption. For example, if you plan to install a timer on a kitchen

Guidelines for Developing a Marginal Abatement Cost Curve August 2014
9
urn to turn it off 12 hours overnight and all of the weekend, you can calculate the estimated change in electricity consumption:
Firstly, we need to know how much energy the urn consumes. We can determine this by metering the urn or simply using the energy rating of the product. The energy rating of the product will be listed on the product in Watts. The number of Watts equates to its energy usage when at full capacity. This number, when represented in Watt-hours (Wh), gives the amount of energy consumed in 1 hour.
By metering the urn we know that it consumes 169Wh in 1 hour. By turning the urn off for 108 hours per week, 52 weeks of the year (12 hours on week nights and 48 hours over the weekend), we can calculate that this project will save 949.1Wh per annum. This can then be multiplied by an electricity tariff (say $0.18/kWh) to determine savings of $170.84 for the year.
Alternatively, you may need to determine an estimated percentage change in total consumption. For example, you may know that lighting contributes 25% of your total energy bill and a manufacturer claims that by changing your lighting you can save 10% of your lighting costs. In this case you would take 2.5% (10% of 25%) of your total consumption as your estimated change in consumption and subsequently costs.
By working off changes in consumption, you are able to apply various costs to the resource. While this may not be as relevant for short term projects, the cost of electricity can have a large impact on the assessment of long term projects. For example, the expected savings from a renewable energy project which is expected to last for 20 years will increase as actual electricity prices into the future increase. There is no explicit rule for how to allow for future resource costs in Marginal Abatement Cost calculations and you may like to seek some guidance from your Finance Manager on to account for this, to ensure you are consistent with other agency planning.
Project Revenue – In some instances an abatement project may result in revenue being obtained for the agency. For example, the installation of solar panels can result in the creation of Small-scale Technology Certificates, which can be sold for profit. Alternatively, should a renewable energy system generate excess electricity, this may be sold back to an energy retailer via the grid, thus creating an income stream for the agency.
Asset Salvage Value – If at the end of a project’s life, an asset remains that may be sold, the salvage value of the asset should be considered as a potential revenue source. For example, a project to upgrade a number of vehicles to hybrids might have a project lifetime of four years, as it is the agency’s policy not to keep vehicles for longer than four years. In this instance the residual value of the vehicles should be considered when determining NPV.
Forecasting asset salvage values can be difficult. Guidance can be sought from suppliers and manufacturers or even your agency’s Asset Manager or Finance Manager who may have had experience selling other assets in the past.

Guidelines for Developing a Marginal Abatement Cost Curve August 2014
10
Determining Emissions Abated
Determining emissions abated from an abatement project needn’t be a difficult task. We’ve already considered changes in consumption in order to calculate savings from the project. In most instances it is this change in consumption that leads to the change in emissions. Rather than multiplying the reduction in consumption by a cost, we simply multiply it by an emissions factor.
In the example of our kitchen urn, 949.1kWh would lead to 778kg CO2e being avoided (using an emissions factor of 0.82kg CO2e/kWh)
Emissions Factors can be sourced from the National Greenhouse Accounts (NGA) Factors or the National Greenhouse and Energy Reporting (NGER) documentation, both of which are available on the Clean Energy Regulator’s website: http://www.cleanenergyregulator.gov.au
Other Considerations
When assessing your projects and collecting information, there are some other things you may wish to consider. While this list is not exhaustive, some of these things are:
Secondary effects of abatement projects - When assessing your abatement projects it is important to consider any secondary effects of your project on costs, savings and emissions. For example, a project to go from fortnightly to weekly recycling bin collections is expected to increase the volume of recyclables collected, therefore reducing the volume of waste going to landfill and associated emissions. However, to implement weekly recycling bin collections, collection trucks will be used twice as frequently, thus requiring more fuel and increasing emissions. It is important that all these changes to costs and emissions are considered to ensure that the project assessment is accurate.
Avoided costs of offsets – A number of agencies are purchasing offsets to reduce the net effect of their emissions. If your agency does this, you may like to consider including the saving of not having to purchase this offset in your project assessment as a result of your reduced consumption and/or emissions.
Where this is the case, it is important to consider how your agency purchases this offset. If it is purchased as ‘Green Power’, a premium charge is likely built into your electricity tariff and is likely to be included in your operational cost savings. However, if you purchase any offsetting separately to your electricity purchases, than you can capture this avoided cost here.
Project dependencies – It is worth noting that not all projects in the MACC will be independent. Sometimes they will be linked and need to be implemented in a particular sequence or one may impact the assessment of another. For example, if you implement a project to divert organic waste from landfill, then your project to capture landfill gasses may have a lower abatement potential due to less methane being generated from the lower volume of organic waste.
Guidelines for Developing a Marginal Abatement Cost Curve August 2014
11
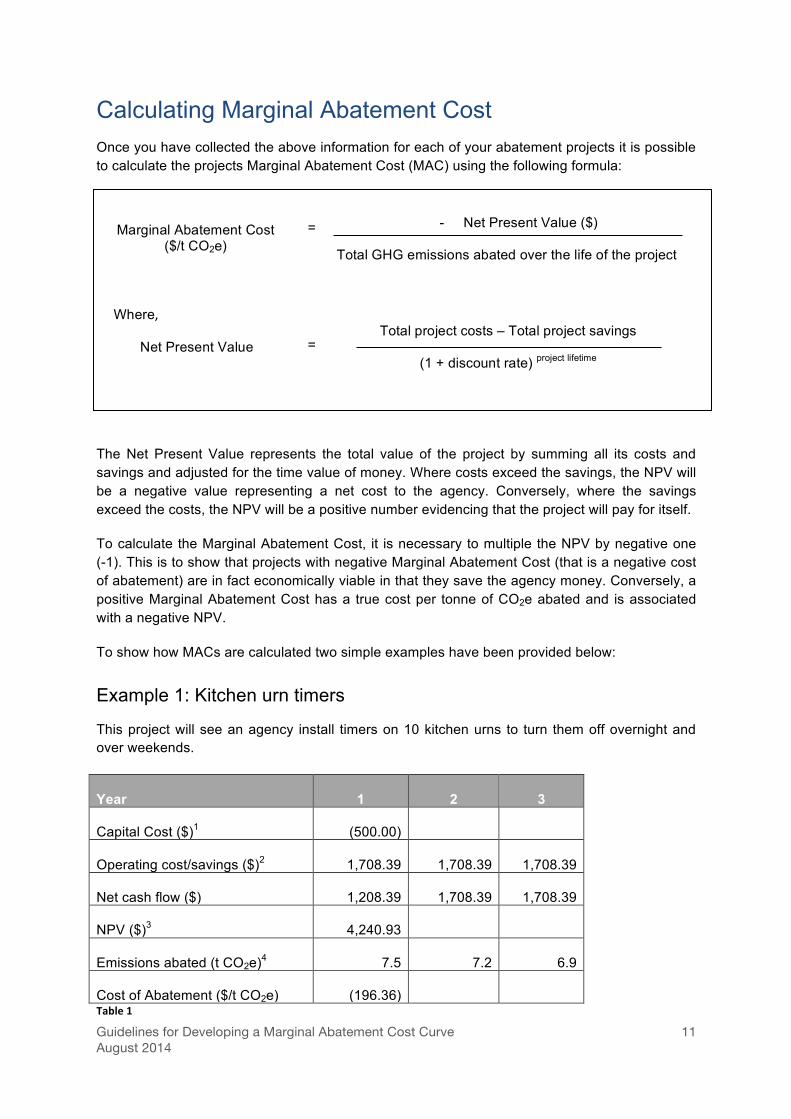
Calculating Marginal Abatement Cost Once you have collected the above information for each of your abatement projects it is possible to calculate the projects Marginal Abatement Cost (MAC) using the following formula:
The Net Present Value represents the total value of the project by summing all its costs and savings and adjusted for the time value of money. Where costs exceed the savings, the NPV will be a negative value representing a net cost to the agency. Conversely, where the savings exceed the costs, the NPV will be a positive number evidencing that the project will pay for itself.
To calculate the Marginal Abatement Cost, it is necessary to multiple the NPV by negative one (-1). This is to show that projects with negative Marginal Abatement Cost (that is a negative cost of abatement) are in fact economically viable in that they save the agency money. Conversely, a positive Marginal Abatement Cost has a true cost per tonne of CO2e abated and is associated with a negative NPV.
To show how MACs are calculated two simple examples have been provided below:
Example 1: Kitchen urn timers
This project will see an agency install timers on 10 kitchen urns to turn them off overnight and over weekends.
Year 1 2 3
Capital Cost ($)1 (500.00)
Operating cost/savings ($)2 1,708.39 1,708.39 1,708.39
Net cash flow ($) 1,208.39 1,708.39 1,708.39
NPV ($)3 4,240.93
Emissions abated (t CO2e)4 7.5 7.2 6.9
Cost of Abatement ($/t CO2e) (196.36) Table 1
Where,
Net Present Value
=
Marginal Abatement Cost
($/t CO2e)
- Net Present Value ($)
Total GHG emissions abated over the life of the project
=
Total project costs – Total project savings
(1 + discount rate) project lifetime

Guidelines for Developing a Marginal Abatement Cost Curve August 2014
12
Notes: 1. Each timer costs $50 each 2. Each timer saves 949.1kWh per annum at a cost of $0.18/kWh 3. Using a discount rate of 4% 4. Each urn abates 778kg CO2e (949.1kWh per annum using an emissions factor of 0.82kg
CO2e/kWh). Ongoing emissions abatement has been discounted in future years.
In this example, the project will save the agency money as is evidenced by a positive NPV and a negative marginal abatement cost.
Example 2: Switching the vehicle fleet to hybrid vehicles
This project will see 20 corporate vehicles (previously running on petrol) switched to hybrid vehicles.
Year 1 2 3 4 5
Capital Cost ($)1 0
Operating cost/savings ($)2 (1,000) (1,000) (1,000) (1,000) (1,000)
Net cash flow ($) (1,000) (1,000) (1,000) (1,000) (1,000)
NPV ($)3 (4,451.82)
Emissions abated (t CO2e)4 59.5 57.2 55.0 52.9 50.9
Cost of Abatement ($/t CO2e) 16.16 Table 2
Notes: 1. There are no capital costs as all vehicles are leased. 2. Each car will cost an additional $2,000 per annum to lease but will save $1,950 in fuel
(assuming 20,000km per annum per car; fuel efficiency improves from 11L per 100km to 4.5L/100km; fuel costs average $1.50/L). This results in an additional cost of $50 per vehicle.
3. Using a discount rate of 4% 4. Based on a fuel emissions factor of 2.38kg CO2e/L. Again, ongoing emissions have been
discounted using the same discount rate.
This project will cost the agency money as is evidenced by a negative NPV and a positive Marginal Abatement Cost.

Guidelines for Developing a Marginal Abatement Cost Curve August 2014
13
Generating the MACC To generate your MACC, you will need to collate the Marginal Abatement Cost and the total abatement for each of your projects, sorting them from lowest Marginal Abatement Cost to highest. Project Abatement can be summed to show the cumulative abatement of each successive project as you progress through your projects in order of least cost abatement.
Project MAC Project Abatement
Cumulative Abatement
Kitchen Urn Timers (196.36) 21.6 21.6
Hybrid Fleet 16.16 275.5 297.1 Table 3
These values can then be plotted on a graph with Marginal Abatement Costs on the Y-axis and total abatement on the X-axis. This is shown in the following chart.
Figure 3 Plotting values onto the MACC
There is no simple charting function with Microsoft Excel that can be used to generate a MACC easily and quickly from your project register. For this reason, a worked example in Microsoft Excel has been provided in the associated MACC Tool, which can be modified to generate a MACC for your own projects. Further information on how to use this can be found in Section B.

Guidelines for Developing a Marginal Abatement Cost Curve August 2014
14
Other considerations when selecting abatement options Whilst the MACC is an extremely effective tool in highlighting least and low-cost abatement options, it does have some limitations to what it can achieve and should not be used as the only tool when determining abatement opportunities to proceed with.
The MACC provides a lifetime view of NPV and abatement potential, which can make it difficult to compare projects of varying lifetimes, such as a 3 year behavioural change program and a solar panel installation program. While the solar panel project may appear to provide a much larger abatement opportunity, it should be remembered that this is in total over 20 years, and so may not help achieve any short term goals.
Similarly, it can be difficult to incorporate a cost of offsets into a MACC due to the lifetime nature of the MACC and the variable, market-based pricing of offsets. As the price of offsets changes, abatement projects may become more or less economically viable. When plotting offset prices on your MACC, it should be remembered that offset prices change over time and may result in your MACC requiring regular updating with updated offset prices.
To combat the time limitations of a MACC, it is possible to generate a MACC for a limited period of time (for example, only count abatement opportunities out five years) or for a given year only.

Guidelines for Developing a Marginal Abatement Cost Curve August 2014
15
SECTION B: USING THE MACC TOOL
Overview Despite the relative simplicity of the examples provided in Section A, not all abatement projects are easy to assess and quantify. The worked examples in the MACC Tool are more detailed examples of projects that local and state government agencies may be likely to investigate. All values provided are estimations only and should not be relied upon for any investment decisions.
Within the MACC Tool, there are five different types of worksheets:
Project Register – This is the list of all projects assessed using this tool, with key assessment details and a preview of the MACC. Projects should always be sorted in order of Marginal Abatement Cost (Column I) to ensure that the MACC displays projects in order of increasing MAC.
MACC Chart – This is the MACC for the abatement projects as listed on the Project Register. With the exception of changing the scale of the x-axis (which is controlled in the Config worksheet), you should not need to change any information on this worksheet.
Project Template – This is the form used to collect all abatement project details and is discussed further below. When adding a new project, you should first copy this worksheet and then change the worksheet name to the project name and add the project to the Project Register.
Config – This worksheet is used by Microsoft Excel to automate the functionality of the MACC Tool. It can be used to change the discount factor, the scale of the x-axis on the MACC and to add a price of carbon. Additionally, for those users who are competent in Microsoft Excel and who would like to modify the tool’s functionality, the Config worksheet can be used to do so.
Data – This worksheet is again required for the Tool to display the MACC in the appropriate format. This worksheet takes data from the Project Register and modifies it so that the MACC can be developed using Microsoft charting tools. As per the MACC Chart worksheet, you should not need to change any cells in this worksheet.
Using the Project Template worksheet The Project Template is used to capture all relevant data for each project and has been divided into three sections:
Project Details – Used to enter project information
Results of Calculation – This section is completely automated and will use the data entered into the project details to calculate the values necessary for the MACC development (such as NPV, marginal abatement cost etc)
Cashflow and Emissions – This section is also completely automated and outlines the project costs, savings, and emissions reductions over the life of the project given the set

Guidelines for Developing a Marginal Abatement Cost Curve August 2014
16
discount factor. It should be noted that the project emissions have had the same discount factor applied to them to allow for the preference for emissions reductions in earlier years (the same as for cashflow).
Entering Project Details
When assessing a project, the first step is to copy the Project Template and rename the worksheet with the project’s name. The project name should also be added to the Project Register.
All project details should entered into the white cells in Column C. Space has been provided to include notes on any assumptions or the source of any data (Column E) and direction on what each cell requires has also been included (Column F).
Not all cells are mandatory and their usage will be dependent on the type of project being assessed. However, each project must have a project lifetime, some emissions reduction and some associated costs.
The difference between capital costs and financing for the purposes of using this tool should be noted. The Capital Cost is to capture capital costs of a project where the agency is funding these directly. If financing is to be used for the project, no value should be entered under capital costs. Rather, the total cost of the finance over its lifetime, including any interest repayments should be calculated separately and divided by the term of the finance to develop an annual financing cost (entered in Cell C21). The length of the financing repayments in years should then be entered in Cell C23.
When all relevant cells have been completed for the project, the results of the calculations will appear in both the Project worksheet and the Project Register (providing the project has been manually added).
To add a new project To add a new project you should copy the blank Project Template worksheet, and rename it with your Project’s name. This Project should then be added to the Project Register, taking care that the Project name matches exactly how it is typed in the Project’s worksheet name.
Once you have entered all your project information, you will need to re-sort the Project Register by Marginal Abatement Cost (Column I) to ensure the MACC displays in the correct order.
Using the Config worksheet The Config worksheet serves two purposes: Firstly, it tells Microsoft Excel where to find the relevant project information for the Project Register worksheet. Secondly, it provides a means for the user to change values used within the calculations and charting. Details on how you might use these are provided below:

Guidelines for Developing a Marginal Abatement Cost Curve August 2014
17
To change the Discount Rate
The discount rate for the NPV calculations future emissions reductions is set in Cell B9 of the Config worksheet. If you would like to change this value, simply enter the percentage you would like to use as a decimal value.
To change the Chart Scaling Factor
The chart scaling factor is set in Cell B8 of the Config worksheet and is used to define the scale of the x-axis of the MACC. Depending on the size of your emissions profile and abatement opportunities you may need to adjust this scale to better portray your MACC. It is easiest to see the affect of this scaling factor by adjusting it to see what suits your MACC best. As a guide, if you have small abatement opportunities (ie projects abating less than 100 t CO2e over their lifetime), you may like to keep this value small. If all of your abatement projects are large, then increasing this value would make sense.
To add a Carbon or Offset Price
A Carbon or Offset Price can be used to reflect the cost of purchasing Offsets, Permits or paying for a carbon tax and will display a horizontal line on the MACC at the designated price point. To enter a Price, simply enter the desired amount in cell B10.
Carbon and Offset Prices are time dependent and can result in the MACC becoming outdated once this price is no longer valid. To enter a label for the Carbon Price as a reminder of the year and month the price relates to, enter these details in cells B11 and B12. Using this approach MACCs can be applied to current or predicted Prices
Customising the MACC Tool
If you are competent in the use of Microsoft excel and wish to change the set up of the Project Template worksheet, you should be aware of how Microsoft Excel is currently sourcing data for the Project Register and the MACC.
The Project Register sources data from each project sheet, which is then in turn used to update the Data worksheet and generate the MACC. The Config worksheet is used to tell the Project Register where the required cells are in the individual Project worksheets. For example, according to the Config worksheet, the total abatement potential of all projects will always be found in Cell C75 of every project worksheet.
If you wish to change the layout of the Project Template, you will need to ensure that the measurements listed within the Config worksheet reference the correct cell within the Project worksheets. Provided these always match, your Project Register and MACC will display correctly.
Related Documents