Guided Perturbations: Self-corrective Behavior in Convolutional Neural Networks Swami Sankaranarayanan * UMIACS, University of Maryland College Park [email protected] Arpit Jain GE Global Research Center Niskayuna NY [email protected] Ser Nam Lim GE Global Research Center Niskayuna NY [email protected] Abstract Convolutional Neural Networks have been a subject of great importance over the past decade and great strides have been made in their utility for producing state of the art performance in many computer vision problems. How- ever, the behavior of deep networks is yet to be fully under- stood and is still an active area of research. In this work, we present an intriguing behavior: pre-trained CNNs can be made to improve their predictions by structurally per- turbing the input. We observe that these perturbations - re- ferred as Guided Perturbations - enable a trained network to improve its prediction performance without any learn- ing or change in network weights. We perform various ab- lative experiments to understand how these perturbations affect the local context and feature representations. Fur- thermore, we demonstrate that this idea can improve per- formance of several existing approaches on semantic seg- mentation and scene labeling tasks on the PASCAL VOC dataset and supervised classification tasks on MNIST and CIFAR10 datasets. 1. Introduction Convolutional Neural Networks (CNNs) have achieved state of the art results on several computer vision bench- marks such as ILSVRC [15] and PASCAL VOC [4] over the past few years. Despite their overwhelming success, recent results have highlighted that they can be sensitive to small adversarial noise in the input [5] or can be eas- ily fooled using structured noise patterns [14]. To under- stand how a CNN can learn complex and meaningful rep- resentations but at the same time be easily fooled by sim- ple and imperceptible perturbations still remains an open research problem. The work of Goodfellow et. al. [5] and Szegedy et al. [17] among others, bring out the intrigu- * This work was done during the author’s internship at GE Global Re- search. Input Perturbed Input Forward / inference Forward / inference output Self-corrective Behavior Input Perturbed Input Forward / inference Forward / inference 8 6 output Self-corrective Behavior Figure 1: Self-corrective behavior due to Guided Perturba- tions for segmentation and classification tasks. ing properties of neural networks by introducing perturba- tions in either the hidden layer weights or the input image. While these approaches have focused on understanding the effect of adversarial noise in deep networks, in this work we present an interesting observation: input perturbations can enable a CNN to correct its mistakes. We find that these per- turbations exploit the local neighborhood information from network’s prediction which in turn results in contextually smooth predictions. In almost all the CNN based approaches, the output is obtained using a single forward pass during the prediction time. In the proposed approach, we use the prediction made by the network during the forward pass to generate pertur- bations at the input. Specifically, we backpropagate the gra- dient of the prediction error all the way to the input. We would like to emphasize that the error gradients are gener- ated purely based on the network’s prediction without any 3562

Welcome message from author
This document is posted to help you gain knowledge. Please leave a comment to let me know what you think about it! Share it to your friends and learn new things together.
Transcript
Guided Perturbations: Self-corrective Behavior in Convolutional Neural
Networks
Swami Sankaranarayanan∗
UMIACS, University of Maryland
College Park
Arpit Jain
GE Global Research Center
Niskayuna NY
Ser Nam Lim
GE Global Research Center
Niskayuna NY
Abstract
Convolutional Neural Networks have been a subject of
great importance over the past decade and great strides
have been made in their utility for producing state of the
art performance in many computer vision problems. How-
ever, the behavior of deep networks is yet to be fully under-
stood and is still an active area of research. In this work,
we present an intriguing behavior: pre-trained CNNs can
be made to improve their predictions by structurally per-
turbing the input. We observe that these perturbations - re-
ferred as Guided Perturbations - enable a trained network
to improve its prediction performance without any learn-
ing or change in network weights. We perform various ab-
lative experiments to understand how these perturbations
affect the local context and feature representations. Fur-
thermore, we demonstrate that this idea can improve per-
formance of several existing approaches on semantic seg-
mentation and scene labeling tasks on the PASCAL VOC
dataset and supervised classification tasks on MNIST and
CIFAR10 datasets.
1. Introduction
Convolutional Neural Networks (CNNs) have achieved
state of the art results on several computer vision bench-
marks such as ILSVRC [15] and PASCAL VOC [4] over
the past few years. Despite their overwhelming success,
recent results have highlighted that they can be sensitive
to small adversarial noise in the input [5] or can be eas-
ily fooled using structured noise patterns [14]. To under-
stand how a CNN can learn complex and meaningful rep-
resentations but at the same time be easily fooled by sim-
ple and imperceptible perturbations still remains an open
research problem. The work of Goodfellow et. al. [5] and
Szegedy et al. [17] among others, bring out the intrigu-
∗This work was done during the author’s internship at GE Global Re-
search.
Input
Perturbed Input
Forward / inference
Forward / inference
output
Self-corrective Behavior
Input
Perturbed Input
Forward / inference
Forward / inference
8
6
output
Self-corrective Behavior
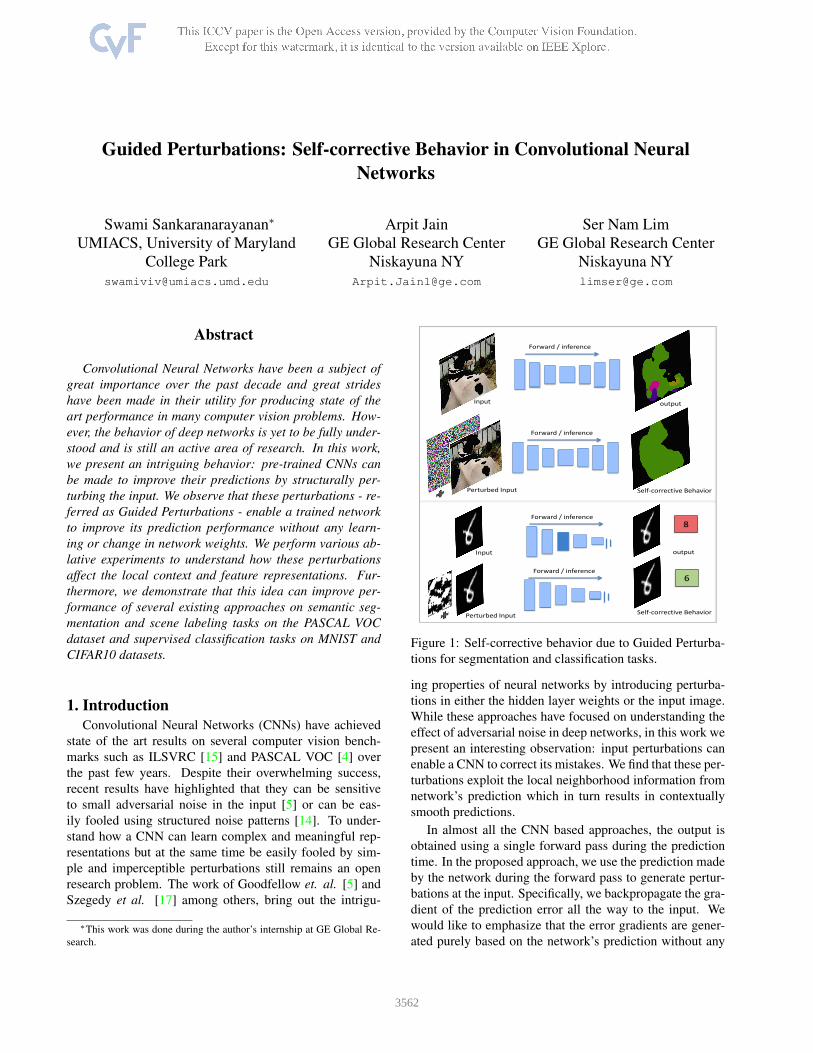
Figure 1: Self-corrective behavior due to Guided Perturba-
tions for segmentation and classification tasks.
ing properties of neural networks by introducing perturba-
tions in either the hidden layer weights or the input image.
While these approaches have focused on understanding the
effect of adversarial noise in deep networks, in this work we
present an interesting observation: input perturbations can
enable a CNN to correct its mistakes. We find that these per-
turbations exploit the local neighborhood information from
network’s prediction which in turn results in contextually
smooth predictions.
In almost all the CNN based approaches, the output is
obtained using a single forward pass during the prediction
time. In the proposed approach, we use the prediction made
by the network during the forward pass to generate pertur-
bations at the input. Specifically, we backpropagate the gra-
dient of the prediction error all the way to the input. We
would like to emphasize that the error gradients are gener-
ated purely based on the network’s prediction without any
3562

knowledge of ground truth. We perturb the input image by
adding to it a scaled version of the gradient signal. This is
fed back to the network again for prediction. Figure 1 shows
an example of the self-corrective behavior of the generated
perturbations for segmentation and classification tasks. This
example shows that these perturbations of the input image
could be viewed as a form of structured distortion that is
added to the input such that the context gets amplified in
each pixel’s neighborhood which enables the network to
correct its own mistakes. The proposed approach is sim-
ple and easy to implement and does not require retraining
or modification in network’s architecture.
Existing approaches to improve performance on segmen-
tation and classification tasks have been geared towards
novelties in network architecture or using large amount of
training data or both. While these are valid ways to im-
prove the networks performance, the proposed approach
highlights an inherent behavior of CNNs that can be used to
improve their prediction without requiring additional learn-
ing or training data. We would like to note here that while
the behavior of Guided Perturbations (GP) is similar to Con-
ditional Random Fields based approaches, the difference in
our case is that there is no explicit modeling of context or
neighborhood interactions. Since our approach is network
independent, this doesn’t preclude networks which model
context explicitly and we show improvements in such net-
works too.
To the best of our knowledge, this is the first approach to
show existence of a self-corrective behavior in CNNs and
use of such behavior for improvement in performance on
segmentation and classification tasks. To summarize, the
major contributions of this paper are:
• We present a novel and intriguing observation: there exist
structured perturbations which when used to perturb the
input leads to a corrective behavior in CNNs.
• We propose a generalized framework to improve the per-
formance of any pretrained CNN model that is architec-
ture independent and requires no learning assuming the
network is trained end-to-end.
2. Background
In recent years, there have been several approaches that
attempt to analyze the behavior of CNNs for classification
problems. Mahendran et al. [12] proposed an approach to
invert the function learned by the CNN in order to generate
as faithful a reconstruction of the input as possible. This is
performed by minimizing a regularized energy function that
approximates the representation function that is learned by
the deep network. Another interesting work in this direc-
tion is the Fooling Images work of Nguyen et al. [14] that is
further extended by Yosinski et al. [19]. The main objective
in both the approaches is to synthesize images to confuse
CNN by maximizing the activation of individual neurons
from different layers of a deep network. This leads to in-
teresting results such as images that look like random noise
but which the CNN classifies into different classes with high
confidence. The approaches that are closer in spirit to our
proposed approach are the ones that predate these recent
ones: Szegedy et al. [17] and Goodfellow et al. [5]. Their
study shows that there exist a lot of adversarial examples
which are the result of minor pertubations of the input that
causes the CNN to misclassify input images on classifica-
tion tasks; these examples can be generated by adding a
fraction of the gradient that is generated by wiggling the
classifier output in the direction of the target class.
One of the applications that this paper focuses on is se-
mantic segmentation. A lot of research have gone into un-
derstanding the expressive ability of CNNs for such prob-
lems. Recent methods for image segmentation such as Fully
Convolutional Networks (FCN) by Long et al. [16] have
provided an easy framework that casts the image segmen-
tation problem as a pixelwise label classification problem
The major difference in their work was the image level out-
put generation and backpropogation which was made pos-
sible by the work of Zeiler et al. [21]. This image level
back propogation provides a simple way to learn a discrim-
inative representation of classes at the pixel level. Several
recent approaches such as CRFasRNN by Zheng et al. [22],
DeepLab by Chen et al. [2] and GCRF by Vemulapalli et
al. [18] have improved the FCN framework by explicitly
modeling context. CRFasRNN casts the CRF iterations,
which has been traditionally used as a post processing func-
tion in image segmentation problem to ensure label compat-
ibility, as a Recurrent Neural Network. They formulate the
steps required to perform a mean field iteration in a CRF
including message passing and learning a label compatibil-
ity transform as a layer in a CNN, which is unrolled in time
over T iterations. The unary potentials are computed using
the FCN-8s network which is then refined using the RNN
strucure. By casting this as a CNN layer they perform end-
to-end training. More recently, Yu et al. [20] propose to
train a multiscale context aggregation module on top of a
modified FCN-8s network. This context module improves
the performance of the base network on its own or in com-
bination with CRF based approaches.
In this paper, we describe an interesting property of deep
networks about how it can change its predictions for the
better using minor perturbations of the input. Furthermore,
we provide useful applications of our approach by showing
how it can be used to improve prediction performance on
challenging computer vision tasks.
3. Our Approach
In this section, we describe our approach to generate
guided perturbations by using the gradient information ob-
3563

tained from the network’s output. We perform experiments
to study different aspects of these perturbations and how
they affect the network representations. Since our approach
to generate guided perturbation is different for segmentation
and classification tasks, we discuss them separately.
3.1. Semantic Segmentation
Figure 2 illustrates our approach for semantic segmenta-
tion task. Given an input image we perform a forward pass
to compute the output - which is usually the output of a soft-
max function that gives a class probability vector for each
pixel. The prediction output is then binarized by setting the
probability of the most confident class to one and the others
to zero. This is done for each pixel and the error gradient
is computed at the softmax layer by setting this modified
output as ground truth. Let X ∈ RM×N×Cin represent
the input image to the deep network, Y ∈ RM×N×Cout
represent ground truth labeling, where Cin is the num-
ber of input channels, Cout is the number of classes and
M ×N is the dimensionality of the input image. Let θ rep-
resent the parameters of the network and J (θ,X,Y) rep-
resent the loss function that is optimized during training.
During prediction time, let Ypred be the predicted label-
ing. In order to generate an error gradient for backpropa-
gation, we create a pseudo ground truth labeling Ypseudo
by modifying Ypred as follows: We initialize Ypseudo with
Ypred. Let the kth component of Ypseudo be represented as
yk = [yk1, .., ykCout
], which is a Cout-dimensional score
vector. We modify yk to be a 1-hot encoded vector with the
maximally confident class set to 1 and others to zero. Then,
the error gradient signal is computed based on the loss func-
tion J (θ,X,Ypseudo) and backpropagated through the net-
work up to the input. Let the backpropagated error gradient
signal at the input be represented as: ∇XJ (θ,X,Ypseudo).
Input
Forward / inference
21
FCN output
Class probabilities
. . . cow
ho
rse
cat
. . .
0.85
0.1 0.04
. . . cow
ho
rse
cat
. . .
0.25
0.7
0.03
. . . cow
ho
rse
cat
. . .
1.0
. . . cow
ho
rse
cat
. . .
1.0
Perturbed
Input
21
Our output
Backward
Forward / inference
perturbation
Step 1
Step 2
Step 3
Figure 2: Processing pipeline for the proposed approach for
semantic segmentation
The perturbed input in then generated as follows:
Xper = X+ ǫsign(∇XJ (θ,X,Ypseudo)), ǫ > 0 (1)
where ǫ is a non negative scaling factor that is model
dependent and sign(.) represents the signum function taken
elementwise. Xper is then fed into the network for a forward
pass to generate the final output.
It can be argued that the above method of generating gra-
dients using the network’s prediction can lead to inaccurate
gradient information propagated through the network espe-
cially in cases where the network’s output contains many
misclassified pixels. The key insight we provide in this
work is that despite misclassifications by the deep network,
the gradients at the input obtained from the network’s pre-
diction, in general, improve the final output of the deep net-
work.
pool 1
pool 2
pool 3
pool 4
pool 5
(a) (b) (c)
Figure 3: Visualization of filter responses showing how the
correct context is propagated along the FCN-32s network.
Column (a): filter responses during the forward pass using
the original input. Column (b): filter responses during the
forward pass using the perturbed input. Column (c): differ-
ence between (a) and (b)
3564

3.1.1 Understanding Guided Perturbations
In this section, we perform several experiments to provide
insight into different aspects of guided perturbations. Please
refer to Figure 2 for the steps (Step 1, Step 2, Step 3) men-
tioned in this section.
Impact of perturbations on filter responses: To get
a clear understanding of what happens during the forward
pass in Step 3 that vastly changes the network’s prediction,
we visualize the filter responses for the FCN-32s network
in Figure 3. This model was chosen due to its simpler ar-
chitecture but we observed similar behavior in other deep
architectures too. In Figure 3, we plot the average filter re-
sponses at different layers through the deep network after
upsampling them bilinearly to image size. As can be ob-
served, the influence of the added perturbations are not vi-
sually explicit until the pool5 layer but the difference of the
filter responses in Column (c) indicate that the information
propagates from layers as early as pool2.
Next, we analyze the pixels for which the network pre-
dictions changed from Step 1 to Step 3. Figure 4(c) shows
the pixels that were classified wrongly during the forward
pass in Step 1 but were correctly classified at the final out-
put. On the other hand, 4(d) shows the pixels that were
correctly classified in Step 1 but were incorrect at the final
output. Observe that, the correctly classified pixels between
Step 1 and Step 3 are mostly internal to the image where ad-
ditional contextual information is available for the network
to switch its prediction whereas the small number of mis-
classified pixels are largely concentrated along the bound-
ary regions of the image where the context is ambiguous.
We present more of such visualization examples in the sup-
plementary material.
Approximating ideal gradient direction: In this exper-
iment, we would like to answer the question: what are the
ideal perturbations that can be generated at the input? The
best one can do is to use the ground truth to generate error
gradients at the softmax layer which is then backpropagated
to generate the perturbed input. When this perturbed input
is fed back to the network, the result is a vastly improved
prediction as shown in Figure 5 (c). While perturbations
from ground truth significantly improve the performance,
this information is not available during prediction time. The
(a) (b) (c) (d)
Figure 4: (a) Output of FCN-32s network (b) Output from
the proposed approach (c) Pixels that were incorrectly clas-
sified by FCN-32s corrected by our approach (d) Pixels that
were incorrectly classified by our approach that FCN-32s
classified correctly.
novelty of the current work is that the ground truth gradi-
ent direction is being approximated well enough by the pre-
dicted gradient directions that are computed using only the
network’s prediction.
(a) (b)
(d) (e) (f)
(c)
Figure 5: (a) Output of FCN-32s (b)Ground truth labeling
(c) Output of perturbed input using ground truth gradients
(d)-(f) Output of perturbed input using guided perturbations
for iteration 1, 2 and 3 respectively.
To understand the extent of usefulness of the predicted
gradients, we performed an experiment where the three
steps outlined in our approach (Figure 2) is applied over
successive iterations Figure 5 (d) shows the output of our
approach obtained in the first iteration and Figure 5 (e)-(f)
show the output over successive iterations. This shows that
the most significant improvement happens at the first itera-
tion and the subsequent iterations yield little improvement.
We observe similar behavior on average over the PASCAL
VOC2012 validation set.
Intuition based on overlapping receptive fields: In a
CNN, the receptive fields of neighboring pixels define a
context for their interactions. The advantage of having over-
lapping receptive fields is that the neighborhood connectiv-
ity is established automatically without explicitly specify-
ing it. As long as the errors made by the CNN are sparse
with respect to each pixel’s receptive fields, the error gradi-
ents when accumulated over the entire network and used to
perturb the input image exhibit a corrective behavior. The
effect of GP can be seen as a type of residual information
that is propagated through the network which results in con-
textual smoothing. This is evident by looking at the filter re-
sponses in Figure 3, more specifically in Column 3, which
shows the difference in responses with and without GP. It
can be observed from the pool5 responses that the peak ac-
tivations occur around neighborhoods where there are com-
peting classes. GP perturb these neighborhoods the most
thus resulting in contextually smooth predictions in those
regions.
Analyzing GP in depth: In figure 6, we show how
guided perturbations impact the decisions made by the deep
network by considering a local region in the input image
and tracking its classification scores at score-fr layer (be-
fore upsampling layer) across different values of ǫ. In the
top half of figure 6a, the patch of interest in the RGB image
is marked by a red box and its corresponding region in the
3565

GE Internal
1
Epsilon=0 Epsilon=0.5 Epsilon=1 Epsilon=2Epsilon=-0.5Epsilon=-1 Epsilon=0.1Epsilon=-0.1
Output of score-fr layer
Epsilon=10Epsilon=-2
ae
rop
lan
e
ba
ckg
rou
nd
bic
ycle
bir
d
bo
at
bo
ttle
bu
s
car
cat
cha
ir
cow
din
ing
ta
ble
do
g
ho
rse
mo
torb
ike
pe
rso
n
po
tte
dp
lan
t
she
ep
sofa
tra
in
Tvm
on
ito
r
Gu
ide
d
Pe
rtu
rba
tio
ns
Pe
rtu
rbe
d
Pa
tch
Arg
ma
x
Sco
re la
yer
Mapping between receptive field in input image to 3x3 grid in score-fr layer
(a)
GE Internal
1
Background Bird Cow Dog Horse Background Bird Cow Dog Horse Background Bird Cow Dog Horse
Background Bird Cow Dog Horse Background Bird Cow Dog Horse Background Bird Cow Dog Horse
Background Bird Cow Dog Horse Background Bird Cow Dog Horse Background Bird Cow Dog Horse
(1,1) (1,2) (1,3)
(2,1) (2,2) (2,3)
(3,1) (3,2) (3,3)
(b)
Figure 6: (a) The top half shows an RGB patch in the input image and its corresponding patch in the score-fr layer output
of the FCN-32s network, before upsampling to image size. In the bottom half, we show, for different values of ǫ the guided
perturbations, the perturbed RGB patches and the score-fr output. Notice how the the scores become contextually smoother
for ǫ > 0. (b) The actual score values of the top-5 predicted classes for the 3x3 grid marked in blue in figure (a) are
plotted. Observe that for a range of positive values of ǫ, the correct class score (cow) dominates the others across the entire
neighborhood. The legend in (1,1) applies to all the plots. Best viewed in screen. Please zoom for clarity.
score-fr output is marked by a blue box. Immediately be-
low, the following are shown for different values of ǫ: (1)
Guided perturbations generated at the input (2) perturbed
RGB patches (3) output of the score-fr layer. Important ob-
servations that can be made from figure 6a are:
• Input perturbations corresponding to positive ǫ improve
the score output over a vast range of values. This visual-
ization shows how guided perturbations are able to oper-
ate at a local level by leveraging neighborhood contextual
information as can be directly observed from the images
of score layer shown in the bottom row.
• Even a small negative value of ǫ results in a large adverse
effect on the score output, without any perceptible change
in the perturbed RGB patch. This shows that a negative ǫ
corresponds to an adversarial setting.
This discussion motivates our choice of using ǫ > 0 to
generate GP. To further analyze how these input perturba-
tions affect the actual classifier score, we show in figure 6b,
the predictions of the deep network for the 3x3 grid in the
score-fr output from figure 6a, for different values of ǫ.
For clarity, we only show the predicted scores of the top-5
classes. From the score values of the grid position (2,2), we
can observe that as ǫ increases, the score of true class (cow)
keeps increasing while the scores of the confusing classes
do not vary much. The other plots show that this trend is
observed across the entire neighborhood of the 3x3 grid.
Thus, it can be inferred that perturbations at the input affect
the decision of the deep network in a contextually consis-
tent manner. We again observe that the score of the true
class drops significantly even for a small negative ǫ which
is consistent with our earlier observations.
Figure 7: Qualitative results on the PASCAL VOC2012 re-
duced validation set. In the top two rows, we compare our
result with the FCN-8s part of CRFasRNN that has been
trained on MS.COCO dataset [11] and publicly released by
[22]. In the bottom row, we compare with the complete
CRFasRNN framework[22]. More results can be found in
supplementary material.
4. Experiments
In this section, we perform several experiments show-
ing how our approach could be seamlessly applied on top
of several pretrained deep networks. We test our method
on the semantic segmentation task on PASCAL VOC2012
dataset [4], scene labeling task on the PASCAL Context 59-
class dataset [13] and classification tasks on the MNIST and
CIFAR10 datasets [9]. These results support how our ap-
proach is able to generalize across different types of prob-
3566

Table 1: Results on the reduced VOC2012 validation set
with 346 images. ’-coco’ denotes that the model was trained
on MS COCO data in addition to the SBD dataset. Numbers
in brackets show the magnitude of change compared to the
corresponding base models.
Method Base Base+GP
FCN-32s 62.10 64.71 (+2.6)
FCN-8s 63.97 66.97 (+3.0)
MS-COCO data
FCN-8s-coco 69.85 71.99 (+2.1)
CRFasRNN-coco 72.95 73.75 (+0.8)
Deeplab-VGG16 66.9 69.1 (+2.2)
Deeplab-ResNet101 74.1 75.3 (+1.2)
lems in computer vision and highlights the advantage that
it can be used with any pretrained model. For segmentation
problems, we evaluate our approach using the mean Inter-
section over Union (mIoU) metric commonly used for se-
mantic segmentation as reported in [16]. For MNIST and
CIFAR-10, we use classification accuracy as a metric to
compare against the baseline.
4.1. Semantic Segmentation
We use PASCAL VOC2012 dataset for evaluating our
approach for semantic segmentation task. It consists of 21
classes including background. We use the following pre-
trained models as baselines and show the improvement that
can be obtained using our approach for each of them:(1)
FCN-32s and FCN-8s [16]: these models are trained us-
ing the SBD dataset[6] that consists of 9,600 images. (2)
FCN-8s-coco and CRFasRNN [22]: these are trained using
the images from MS COCO[10] and the SBD dataset us-
ing a total of 77,784 images. (3) Deeplab [3]: We evaluate
on the Deeplab-VGG16 and ResNet101 models which use
atrous convolutions and multi scale evaluation. They are
also trained on MS COCO and the SBD datasets.
For all these methods, we use the publicly available mod-
els at the time of submission. We use a single NVIDIA Ti-
tanX GPU for our experiments and CAFFE library[7] for
implementation. The pretrained models used in this section
are obtained from the CAFFE Model Zoo [1] at the time of
submission. All the reported results are computed with 1 it-
eration of our approach unless mentioned otherwise. Table
1 shows the results of applying the proposed approach to
the different pretrained models during prediction time over
a reduced validation set of 346 images as done in [22]. As
can be observed, the proposed approach results in increased
performance over all the listed pretrained models. This re-
iterates the fact that our approach is indeed architecture in-
dependent and can be easily integrated even with complex
feedforward architectures like CRFasRNN. Table 3 shows
the evaluation of our approach on PASCAL VOC2012 test
set using FCN-8s pretrained network as the base model to
demonstrate the improvement shown by our method in an
unbiased setting. The ǫ value used for the test set was tuned
on the validation set.
4.2. Scene Labeling
The scene labeling task is a dense pixel labeling task
that is evaluated on the PASCAL Context dataset. While
there are more than 400 classes defined, the challenge en-
tails evaluating on the 59 classes that are specified as most
frequent [13]. The labeled classes contain scene elements
in addition to objects that appear in the PASCAL VOC
segmentation challenge, making this a much harder bench-
mark. To evaluate our approach on this task, we use the
FCN-8s model from [16] as our baseline that was trained on
the standard training split of 10,000 images provided with
the dataset. The results, which were generated on the val-
idation set consisting of 5105 images are shown in Table
2. We improve the performance of the FCN-8s network by
1.3% which is significant given the large size of the valida-
tion set. Please note that the ǫ value was not tuned to fit this
dataset rather the best performing ǫ from Table 1 was used.
Table 2: Results on the PASCAL-Context 59-classes vali-
dation set.Method mean IU
FCN-8s 39.12FCN-8s + GP 40.44
5. Ablative Experiments
For all the experiments in this section, we use FCN-32s
network and the validation set used in section 4.1.
Speed-Performance trade-off The guided perturbations
generated at the input layer of a deep network improves the
performance of the base model. However, there is a com-
putational overhead due to performing an additional back-
ward and forward pass. As an alternative, the backward
pass could be performed up to an intermediate layer in the
deep network instead of the input layer. In this section,
we provide results addressing the trade off between com-
putational time and resulting performance due to perturbing
layers other than the input. It can be observed from Table
4 that even using the perturbed input from as late as pool4
layer the improvement in performance remains almost con-
stant while computation time drops significantly. This ex-
periment shows that effect of GP is not only observed at the
input but also in the intermediate layers of the deep network
and hence can be leverages for reducing the computational
cost.
Comparison with CRF approaches The behavior of GP
resembles the contextual smoothing provided by VRF ap-
proaches that have been popularly used in Semantic Seg-
mentation. In this section, we provide empirical evidence
that GP captures additional dependencies in the data com-
pared to pairwise interactions that are modeled by CRFs.
3567

Table 3: Results on the PASCAL VOC2012 test set consisting of 1456 images using FCN-8s as the base network. Use of
Guided Perturbations improves the performance of the base network on 19 out of 21 classes.
Method bkg aero bicycle bird boat bottle bus car cat chair cow table dog horse mbk person plant sheep sofa train tv mean
FCN-8s [16] 92.0 82.4 36.1 75.6 61.4 65.4 83.3 77.2 80.1 27.9 66.8 51.5 73.6 71.9 78.9 77.1 55.3 73.4 44.3 74.0 63.2 67.2
FCN-8s + GP 92.4 84.4 35.9 79.3 62.6 70.5 86.2 80.0 82.8 28.0 71.9 55.2 74.6 75.6 80.2 77.4 56.9 75.6 45.8 77.4 63.18 69.3
Table 4: Trade-off between performance and computation
times obtained by truncating guided perturbations over dif-
ferent layers across the deep network. Original time taken
is 0.12s per image. The baseline performance is 62.1%
layer input pool2 pool3 pool4
Time 0.33s 0.27s 0.24s 0.22s
mIOU 64.71 64.61 64.55 64.3
Table 5 shows the mean IoU values for cases with/without
CRF [8] applied on top of the network outputs. These re-
sults demonstrate that GP indeed captures extra dependen-
cies compared to CRF and that GP can even improve upon
CRF outputs.
Table 5: Results with and without CRF
Method Base +CRF +GP +CRF+GP
FCN-8s-coco 69.8 71.1 72.0 72.7
Deeplab-ResNet-101 74.1 74.9 75.3 75.8
Guided Perturbations (vs) other strategies In this sec-
tion, we perform an ablative experiment where we per-
turb the input image in different ways in order to distin-
guish them from Guided Perturbations and show that the GP
yields the most improvement in performance. As explained
in Section 3.1, to generate a guided perturbation, we replace
the softmax output with a one-hot encoded vector for the
class of maximum confidence. We consider different meth-
ods to modify the label distribution that is obtained from the
softmax function as follows:
• random-onehot: The class label is chosen in an uniformly
random manner and used as ground truth instead of the
maximum probability class.
• Uniform-label: An uniform label distribution is produced
by assigning equal probability to all the classes and used
as encoding to generate the error gradient.
• top2-label: Modified label distribution contains equal
probability to top two predicted classes and used as en-
coding to generate the error gradient.
Figure 8 shows the effect of different types of label dis-
tribution on the segmentation performance. At the outset, it
can be observed that GP gives the best quantitative perfor-
mance of 64.7% compared to the second best case, which
is the uniform setting with negative ǫ which scores 63.8%.
We can also observe that when we perform GP, ǫ < 0 cor-
responds to the adversarial setting. Intuitively, this setting
Figure 8: Mean IOU values for several perturbations gen-
erated by using different types of label distributions on the
validation set over the range ǫ = [−1, 1] with FCN-32s as
the base network. Please refer to section 5 for details.
is equivalent to maximizing the loss of the softmax classifi-
cation function during training. Hence, the backpropagated
gradient always moves away from the correct class. In our
approach, GP is always generated by setting ǫ > 0 as men-
tioned in sections 3.1 and 5. The setting involving choosing
a random label to generate the one-hot vector at the soft-
max output results in poor performance across all values of
ǫ since gradient directions become random and the resulting
perturbations adversely affect the performance of the deep
network on the perturbed input image.
The interesting case to analyze from Figure 8 is the per-
formance of the Uniform-label setting for ǫ < 0. To under-
stand this effect, Figure 9 illustrates a toy example showing
the difference between the error gradients generated using
GP and Uniform-label setting for a different possible out-
put score distributions from the CNN. In this toy example,
the CNN is trained to classify among 5 classes. Observe
that, for the unimodal case, the gradient signal generated
for a uniform output label distribution has the same relative
magnitude as the gradient signal generated for GP but the
dominant gradient direction is exactly the opposite. How-
ever, GP still gives a better performance compared to the
uniform label distribution. In this case, the score vector is
bimodal and hence there are two dominant directions in the
gradient signal. Notice that the top gradient direction in the
case of GP still points towards the correct class and all other
directions move away from the correct class, as expected.
But in the case of uniform label distribution, there are two
competing directions and hence there is higher probability
for the gradient to move in the wrong direction.
3568

0.2 0.6 0.07 0.1 0.03
Softmax probability output
0 1 0 0 0
One-hot encoded label vector
-0.12 0.24 -0.042 -0.06 -0.018
Error gradient
0.2 0.2 0.2 0.2 0.2
Uniform label vector
0.0 -0.08 0.026 0.02 0.034
Label Encoding
0.35 0.1 0.45 0.06 0.04
0 0 1 0 0
One-hot encoded label vector
-0.157 -0.045 0.247 -0.027 -0.018
0.2 0.2 0.2 0.2 0.2
Uniform label vector
-0.03 0.02 -0.05 0.028 0.032
Unimodal score distribution
Bimodal score distribution
Figure 9: Difference in the gradient signal generated be-
tween Uniform-label setting and GP for the case of uni-
modal output score distribution (top) and bimodal output
score distribution (bottom). The dominant gradient direc-
tion in both cases is shown in the colored boxes. The exact
derivation for computing these gradient values is given in
the supplementary material.
(a) (b)
scaling factor scaling factor
mean IoU
mean IoU
Figure 10: Effect of scaling factor ǫ on performance of
FCN-32s (left) and FCN-8s (right) networks evaluated on
the reduced PASCAL VOC2012 validation set. Best viewed
in screen. Please zoom for clarity.
Effect of Scaling parameter We evaluate the perfor-
mance of our approach using FCN-32s and FCN-8s net-
works over a range of scaling parameter ǫ on the validation
set. Figure 10 shows how the performance varies based on
the scaling factor. It can be observed that improvement in
performance is generally obtained over a wide range of val-
ues of ǫ. This indicates that network’s behavior is not very
sensitive to the value of ǫ though there seems to be an op-
timal value for best performance that depends on the deep
model. We use ǫ = 0.55 for FCN-32s, ǫ = 0.7 for FCN-
8s network and ǫ = 0.22 for CRFasRNN network for our
experiments.
Image Classification The method described in Section
3.1 for semantic segmentation cannot be applied directly for
classification tasks. Since context for a classification task
is not defined naturally, we extract contextual information
from the learned feature space. Given an input image, we
first extract the feature from the deep network and use it to
select top k nearest neighbors from the training set using eu-
clidean distance metric. We then perturb the test image with
the weighted average of gradients generated using the class
of the selected nearest neighbors and perform a forward
pass to predict the final output. Let nni be the class of the
ith nearest neighbor. Following the notation established in
Section 3.1, the equation for perturbed image is given as fol-
lows: Xper = X + ǫ∑k
i=1(wisign(∇XJ (θ,Xi,Ynni
))),
where Xi is the ith nearest neighbor; k is the number of
nearest neighbors and wi is weight associated with each
nearest neighbor i and J (.) corresponds to the loss func-
tion. Figure 11 shows an example where the network cor-
rectly classifies the perturbed input generated using this pro-
cedure.
Input 1‐NN Gradients Perturbed Input
5 6
Figure 11: The input image is classified as ‘5’. By per-
turbing the input from the gradients generated using the top
nearest neighbor class, the network changes its prediction
to ‘6’
To evaluate the performance of GP on classification, we
tested the method on two standard datasets: MNIST and
CIFAR10. MNIST consists of grayscale images of digits
while CIFAR10 consists of more realistic images of ob-
ject classes. We follow the standard training/testing split
for both the cases. We use 3 nearest neighbor with equal
weights for all our experiments. For MNIST, we use a CNN
with 2 conv. layers and 2 fully-connected layers with a 20-
50-500-10 architecture and for CIFAR10, we use a CNN
with 5 conv. and 2 fully-connected layers with a 64-64-
128-128-128-128-10 architecture.
Table 6: Results on the classification task on MNIST and
CIFAR10 datasets.
Dataset Baseline Proposed
MNIST 98.92 99.15
CIFAR10 76.31 76.95
Table 6 shows the results of our classification experi-
ments. GP improves performance over the baseline on both
the datasets. However, the improvement in performance is
not as high as in the segmentation case which could be at-
tributed to two reasons: (1) the base networks themselves
have learned a very strong representation and (2) the con-
text information in the classification task is relatively weak
compared to the segmentation task.
6. Conclusion
In this paper, we have shown novel self-corrective be-havior of CNNs for segmentation and classification tasks.We showed that guided perturbations can improve the net-work’s performance without additional training or networkmodification. We have demonstrated this effect on severalpublicly available datasets and using different network ar-chitectures. We have presented several experiments thattry to understand and explain different aspects of guidedperturbations. We believe that this behavior can lead tonovel network designs and better end-to-end training pro-cedures.
3569

References
[1] Caffe model zoo. https://github.com/BVLC/
caffe/wiki/Model-Zoo. Accessed: 2010-09-30. 6
[2] L.-C. Chen, G. Papandreou, I. Kokkinos, K. Murphy, and
A. L. Yuille. Deeplab: Semantic image segmentation with
deep convolutional nets, atrous convolution, and fully con-
nected crfs. arXiv preprint arXiv:1606.00915, 2016. 2
[3] L.-C. Chen, G. Papandreou, I. Kokkinos, K. Murphy, and
A. L. Yuille. Deeplab: Semantic image segmentation with
deep convolutional nets, atrous convolution, and fully con-
nected crfs. arXiv:1606.00915, 2016. 6
[4] M. Everingham, S. A. Eslami, L. Van Gool, C. K. Williams,
J. Winn, and A. Zisserman. The pascal visual object classes
challenge: A retrospective. International Journal of Com-
puter Vision, 111(1):98–136, 2015. 1, 5
[5] I. J. Goodfellow, J. Shlens, and C. Szegedy. Explain-
ing and harnessing adversarial examples. arXiv preprint
arXiv:1412.6572, 2014. 1, 2
[6] B. Hariharan, P. Arbelaez, L. Bourdev, S. Maji, and J. Ma-
lik. Semantic contours from inverse detectors. In 2011 In-
ternational Conference on Computer Vision, pages 991–998.
IEEE, 2011. 6
[7] Y. Jia, E. Shelhamer, J. Donahue, S. Karayev, J. Long, R. Gir-
shick, S. Guadarrama, and T. Darrell. Caffe: Convolu-
tional architecture for fast feature embedding. In Proceed-
ings of the 22Nd ACM International Conference on Multi-
media, MM ’14, pages 675–678. ACM, 2014. 6
[8] P. Krahenbuhl and V. Koltun. Efficient inference in fully
connected crfs with gaussian edge potentials. In Advances
in neural information processing systems, pages 109–117,
2011. 7
[9] A. Krizhevsky. Learning multiple layers of features from
tiny images. Technical report, 2009. 5
[10] T. Lin, M. Maire, S. J. Belongie, L. D. Bourdev, R. B.
Girshick, J. Hays, P. Perona, D. Ramanan, P. Dollar, and
C. L. Zitnick. Microsoft COCO: common objects in context.
CoRR, abs/1405.0312, 2014. 6
[11] T.-Y. Lin, M. Maire, S. Belongie, J. Hays, P. Perona, D. Ra-
manan, P. Dollar, and C. L. Zitnick. Microsoft coco: Com-
mon objects in context. In European Conference on Com-
puter Vision, pages 740–755. Springer, 2014. 5
[12] A. Mahendran and A. Vedaldi. Understanding deep image
representations by inverting them. In 2015 IEEE conference
on computer vision and pattern recognition (CVPR), pages
5188–5196. IEEE, 2015. 2
[13] R. Mottaghi, X. Chen, X. Liu, N.-G. Cho, S.-W. Lee, S. Fi-
dler, R. Urtasun, and A. Yuille. The role of context for object
detection and semantic segmentation in the wild. In Proceed-
ings of the IEEE Conference on Computer Vision and Pattern
Recognition, pages 891–898, 2014. 5, 6
[14] A. Nguyen, J. Yosinski, and J. Clune. Deep neural networks
are easily fooled: High confidence predictions for unrecog-
nizable images. In 2015 IEEE Conference on Computer Vi-
sion and Pattern Recognition (CVPR), pages 427–436. IEEE,
2015. 1, 2
[15] O. Russakovsky, J. Deng, H. Su, J. Krause, S. Satheesh,
S. Ma, Z. Huang, A. Karpathy, A. Khosla, M. Bernstein,
A. C. Berg, and L. Fei-Fei. ImageNet Large Scale Visual
Recognition Challenge. International Journal of Computer
Vision (IJCV), 115(3):211–252, 2015. 1
[16] E. Shelhamer, J. Long, and T. Darrell. Fully convolutional
networks for semantic segmentation. IEEE Transactions
on Pattern Analysis and Machine Intelligence, PP(99):1–1,
2016. 2, 6, 7
[17] C. Szegedy, W. Zaremba, I. Sutskever, J. Bruna, D. Erhan,
I. Goodfellow, and R. Fergus. Intriguing properties of neural
networks. arXiv preprint arXiv:1312.6199, 2013. 1, 2
[18] R. Vemulapalli, O. Tuzel, M.-Y. Liu, and R. Chellappa.
Gaussian conditional random field network for semantic seg-
mentation. CVPR, 2016. 2
[19] J. Yosinski, J. Clune, A. Nguyen, T. Fuchs, and H. Lipson.
Understanding neural networks through deep visualization.
arXiv preprint arXiv:1506.06579, 2015. 2
[20] F. Yu and V. Koltun. Multi-scale context aggregation by di-
lated convolutions. arXiv preprint arXiv:1511.07122, 2015.
2
[21] M. D. Zeiler, D. Krishnan, G. W. Taylor, and R. Fergus.
Deconvolutional networks. In Computer Vision and Pat-
tern Recognition (CVPR), 2010 IEEE Conference on, pages
2528–2535. IEEE, 2010. 2
[22] S. Zheng, S. Jayasumana, B. Romera-Paredes, V. Vineet,
Z. Su, D. Du, C. Huang, and P. H. Torr. Conditional random
fields as recurrent neural networks. In Proceedings of the
IEEE International Conference on Computer Vision, pages
1529–1537, 2015. 2, 5, 6
3570
Related Documents