Welcome message from author
This document is posted to help you gain knowledge. Please leave a comment to let me know what you think about it! Share it to your friends and learn new things together.
Transcript


COMMITTEE RESPONSIBLE FOR THIS GUIDE
This Guide to the Measurement of Pressure and Vacuum has been prepared by the National Physical Laboratory and the Institute of Measurement & Control, supported by the National Measurement System Policy Unit of the Department of Trade and Industry. An independent panel of specialists in the measurement of pressure and vacuum developed the structure and content of the Guide, and provided wide industrial and international consultation. The people listed below served as members of the panel: Laurence Cuscó, Coordinator National Physical Laboratory Mark Bryant Pressurements Ltd Nicholas Buckeridge Druck Ltd Tony Bundock Elsag Bailey Ltd Ian Clark Keller (UK) Ltd Mike Collins Ruska Instrument Corporation Barry Dent Delta Controls Ltd Andrew Dixon MKS Instruments UK Ltd Philip Endersby Sira Test and Certification Ltd John Greenwood Edwards High Vacuum International James Gunn Antech Engineering Ltd David Hucknall Leybold Ltd David Kent Fisher-Rosemount Ltd David Lockie Pa Consultancy Malcolm Parkinson Budenberg Gauge Co. Ltd Fiona Redgrave National Physical Laboratory Ron Reid CLRC Daresbury Laboratory Colin Rendle Furness Controls Ltd Selwyn Shorrock Theta Systems Ltd David Simpson National Physical Laboratory Bernard Skillerne de Bristowe BJS Research Eric Sparks Bailey & Mackey Ltd Michael Verran British Steel plc Urs Wälchli Balzers Instruments Ltd The panel wishes to acknowledge the support it has received by way of technical and editorial comments from the following: W B Bache (British Pressure Gauge Manufacturers Association), P Clow, T J Thompson (both UKAS), C Duncombe (BSI), L March (Kistler Instruments Ltd), N A Morgan (Theta Systems Ltd) and R White (Pfeiffer). This Guide refers to other publications that provide information or guidance. Editions of the publications listed are current at the time of publication, but reference should be made to the latest editions. This Guide is subject to review by the responsible technical group in the Institute of Measurement and Control. The Institute welcomes all comments on the Guide and requests that these be addressed to: The Institute of Measurement and Control, 87 Gower Street, London, WC1E 6AA. Users of this Institute of Measurement & Control Guide shall be responsible for its correct application. No part of this publication may be reproduced in any form without prior permission in writing of the Institute of Measurement & Control. Published by the Institute of Measurement and Control. Further copies are available from the Institute. © Crown Copyright 1998. Reproduced by permission of the Controller of HMSO. ISBN 0 904457 29 X.
FOREWORD This Guide has been written to meet the need for a basic advisory document for users of pressure and vacuum measuring instrumentation. As in other fields of measurement, a consistent and harmonised approach is increasingly important, as is a common understanding of the terms used to define and describe pressure and vacuum. This Guide brings together information about pressure and vacuum measurement which exists already in the public domain but is in many cases difficult to obtain, poorly expressed, or widely misunderstood. This Guide is intended to be practical; readily applicable; widely acceptable; accessible; and to contain objective criteria against which good practice can be judged. The advice given here is carefully selected to represent conventional good practice in pressure and vacuum measurement, to be consistent with recognised standard specifications relevant to pressure and vacuum, and to be free from commercial bias. While this document provides a general introduction to pressure and vacuum measurement, it is not an in-depth scientific treatment of the subject. The further reading section is provided as a starting point for those wishing to develop a more detailed understanding of the subject. It is in the interest of many groups and individuals that information about good measurement practices should reach all those who can benefit. Accordingly, this document has been written in collaboration between the Institute of Measurement and Control, the National Physical Laboratory and an independent panel of experts involved in the production, calibration and use of pressure and vacuum measuring equipment, and in consultation with a wide circle of experts in the UK and further afield. The creation of the document was made possible by support from the National Measurement System Policy Unit of the Department of Trade and Industry, and by the voluntary effort of many of the individuals involved. All readers of this Guide owe a debt of gratitude to those who have contributed to its preparation.
C R Howard President The Institute of Measurement and Control


Guide to the Measurement of Pressure and Vacuum
CONTENTS
1 SCOPE.................................................................................................................................................................. 5
2 INTRODUCTION................................................................................................................................................ 5
3 CONCEPTS, TERMS AND DEFINITIONS ....................................................................................................... 5 3.1 What is pressure? Is vacuum different? ..................................................................................................... 5 3.2 What are absolute, gauge and differential pressures modes? ..................................................................... 6 3.3 Variations in atmospheric pressure ............................................................................................................ 7 3.4 Pressure terms and definitions ................................................................................................................... 7
4 UNITS AND CONVERSIONS .......................................................................................................................... 11 4.1 Historical pressure units........................................................................................................................... 11 4.2 The International System of Units and dimensions of pressure ............................................................... 12
4.2.1 General.......................................................................................................................................... 12 4.2.2 The SI unit of pressure .................................................................................................................. 12 4.2.3 Pressure units and conversion factors ........................................................................................... 13
5 METHODS OF MEASUREMENT.................................................................................................................... 14 5.1 General..................................................................................................................................................... 14 5.2 Liquid column instruments....................................................................................................................... 17
5.2.1 General.......................................................................................................................................... 17 5.2.2 Large-bore mercury barometers .................................................................................................... 17 5.2.3 Fortin barometers .......................................................................................................................... 18 5.2.4 Kew pattern barometers ................................................................................................................ 18
5.3 Mechanical deformation instruments ....................................................................................................... 19 5.3.1 General.......................................................................................................................................... 19 5.3.2 Mechanical deformation elements................................................................................................. 19
5.3.2.1 Diaphragms ........................................................................................................................ 19 5.3.2.2 Capsules ............................................................................................................................. 19 5.3.2.3 Bellows .............................................................................................................................. 20 5.3.2.4 Bourdon tubes .................................................................................................................... 20 5.3.2.5 Cylinders ............................................................................................................................ 20
5.3.3 Mechanical deformation sensing................................................................................................... 20 5.3.3.1 General............................................................................................................................... 20 5.3.3.2 Mechanical display............................................................................................................. 21 5.3.3.3 Capacitive techniques......................................................................................................... 22 5.3.3.4 Linear variable differential transformers (LVDTs) ............................................................ 23 5.3.3.5 Strain gauges ...................................................................................................................... 23 5.3.3.6 Vibrating structures............................................................................................................ 24
5.4 Direct resonant pressure sensors .............................................................................................................. 25 5.5 Piezo-electric devices .............................................................................................................................. 25 5.6 Pressure balances and dead-weight testers............................................................................................... 26 5.7 Multiplying and dividing techniques........................................................................................................ 28 5.8 Miscellaneous pressure measurement techniques above 0.1 GPa ............................................................ 28 5.9 Thermal conductivity gauges ................................................................................................................... 29
5.9.1 General.......................................................................................................................................... 29 5.9.2 Pirani gauges................................................................................................................................. 29 5.9.3 Convection enhanced Pirani gauges.............................................................................................. 29 5.9.4 Thermocouple and thermistor gauges ........................................................................................... 30
5.10 Spinning-rotor gauges ............................................................................................................................ 30 5.11 Ionisation gauges ................................................................................................................................... 30
5.11.1 General........................................................................................................................................ 30
1
Guide to the Measurement of Pressure and Vacuum
5.11.2 Triode gauges ............................................................................................................................. 31 5.11.3 Bayard-Alpert gauges ................................................................................................................. 32 5.11.4 Penning gauges ........................................................................................................................... 32 5.11.5 Inverted magnetron gauges ......................................................................................................... 33
5.12 Residual gas analysers for vacuum partial pressure measurements ....................................................... 33 5.12.1 General ....................................................................................................................................... 33 5.12.2 The ion source ............................................................................................................................ 34 5.12.3 The mass filter ............................................................................................................................ 34 5.12.4 The ion collector......................................................................................................................... 34
6 DEVICE SELECTION....................................................................................................................................... 35 6.1 General .................................................................................................................................................... 35 6.2 Pressure characteristics............................................................................................................................ 35
6.2.1 Pressure mode, range and rating ................................................................................................... 35 6.2.2 Pressure fluctuation....................................................................................................................... 36
6.3 Media characteristics ............................................................................................................................... 36 6.3.1 General ......................................................................................................................................... 36 6.3.2 Operating temperature .................................................................................................................. 36 6.3.3 Corrosion and deposition.............................................................................................................. 37 6.3.4 Density dependence ...................................................................................................................... 37 6.3.5 Isolation diaphragms..................................................................................................................... 37
6.4 External environment............................................................................................................................... 38 6.4.1 External pressure .......................................................................................................................... 38 6.4.2 External media .............................................................................................................................. 38 6.4.3 External temperature..................................................................................................................... 38 6.4.4 Vibration....................................................................................................................................... 38 6.4.5 Electromagnetic considerations .................................................................................................... 39
6.5 Physical characteristics ............................................................................................................................ 39 6.6 Type of use .............................................................................................................................................. 39 6.7 Installation and maintenance.................................................................................................................... 40
6.7.1 Orientation .................................................................................................................................... 40 6.7.2 Installation and mounting.............................................................................................................. 40 6.7.3 Re-calibration and servicing ......................................................................................................... 41
6.8 Signal conditioning, outputs and displays................................................................................................ 41 6.8.1 General ......................................................................................................................................... 41 6.8.2 Signal conditioning ....................................................................................................................... 41 6.8.3 Outputs and displays..................................................................................................................... 41
6.9 Performance............................................................................................................................................. 42 6.9.1 General ......................................................................................................................................... 42 6.9.2 Accuracy, uncertainty ‘within specification’ and ‘total error band’.............................................. 43 6.9.3 Range, rangeability and span ........................................................................................................ 44 6.9.4 Resolution..................................................................................................................................... 44 6.9.5 Repeatability (of results of measurements) ................................................................................... 44 6.9.6 Reproducibility (of results of measurements) and drift................................................................. 44 6.9.7 Non-linearity................................................................................................................................. 45 6.9.8 Hysteresis...................................................................................................................................... 45 6.9.9 Response time............................................................................................................................... 46 6.9.10 Temperature coefficient .............................................................................................................. 46 6.9.11 Line pressure effects ................................................................................................................... 46 6.9.12 Zero offset................................................................................................................................... 46
6.10 Inconsistent use of terminology ............................................................................................................. 47
7 CALIBRATION, TRACEABILITY AND MEASUREMENT STANDARDS................................................. 48 7.1 What is calibration? ................................................................................................................................. 48
2

Guide to the Measurement of Pressure and Vacuum
7.2 What is traceability? ................................................................................................................................ 48 7.3 Do all instruments need to be calibrated? ................................................................................................ 48 7.4 How frequently should instruments be calibrated? .................................................................................. 48 7.5 What category of standard should be used to provide the calibration? .................................................... 49 7.6 How many ways can traceable calibrations be obtained? ........................................................................ 50 7.7 What is needed to undertake calibrations?............................................................................................... 51 7.8 Vacuum gauge calibrations ...................................................................................................................... 52 7.9 Pneumatic calibrations between about 10 kPa and 1 MPa....................................................................... 54 7.10 Calibrations at higher pressures ............................................................................................................. 55 7.11 Calibration of differential pressure instruments ..................................................................................... 55 7.12 Quality assurance of pressure measurements ......................................................................................... 56
7.12.1 Measurement accreditation ......................................................................................................... 56 7.12.2 Competence in pressure and vacuum measurements................................................................... 56
8 UNCERTAINTY OF MEASUREMENT........................................................................................................... 57 8.1 General..................................................................................................................................................... 57 8.2 Motives for calculating measurement uncertainties ................................................................................. 57 8.3 Estimating uncertainty � principles.......................................................................................................... 58 8.4 Estimating uncertainty � procedure ......................................................................................................... 59 8.5 Propagation of errors and ‘bought-in’ uncertainty ................................................................................... 61
9 PRACTICAL RECOMMENDATIONS............................................................................................................. 61 9.1 General..................................................................................................................................................... 61
9.1.1 Vibration or pulsation ................................................................................................................... 62 9.1.2 Temperature .................................................................................................................................. 62 9.1.3 Protection from high pressures...................................................................................................... 62 9.1.4 Solids in suspension ...................................................................................................................... 62 9.1.5 Phase changes ............................................................................................................................... 62 9.1.6 Viscosity ....................................................................................................................................... 62 9.1.7 Ambient pressure changes and draughts ....................................................................................... 63 9.1.8 Purpose ......................................................................................................................................... 63 9.1.9 Orientation/tilt............................................................................................................................... 63 9.1.10 Acceleration due to gravity ......................................................................................................... 63
9.2 Bourdon tube gauges................................................................................................................................ 63 9.3 Dead-weight testers.................................................................................................................................. 63 9.4 Vacuum measurement recommendations ................................................................................................. 65
9.4.1 General.......................................................................................................................................... 65 9.4.2 Capacitance diaphragm gauges in vacuum regime........................................................................ 66 9.4.3 Thermal conductivity gauges ........................................................................................................ 67 9.4.4 Ionisation gauges........................................................................................................................... 67
9.4.4.1 Gauge sensitivity ................................................................................................................ 67 9.4.4.2 The effect of a gauge on a vacuum system......................................................................... 68 9.4.4.3 Comparison of types of ionisation gauge ........................................................................... 69
9.5 Safety ....................................................................................................................................................... 70 9.5.1 General.......................................................................................................................................... 70 9.5.2 Stored energy ................................................................................................................................ 70 9.5.3 Failure mode ................................................................................................................................. 70 9.5.4 Instrumentation and control .......................................................................................................... 71 9.5.5 Transporting mercury barometers ................................................................................................. 72
10 EXAMPLE CALCULATIONS ........................................................................................................................ 72 10.1 Conversions between units..................................................................................................................... 72 10.2 Comparison of ‘% reading’ and ‘% full scale reading’ .......................................................................... 73
3

Guide to the Measurement of Pressure and Vacuum
10.3 Hydrostatic head correction................................................................................................................... 74
11 FURTHER READING..................................................................................................................................... 75 11.1 British and international standards......................................................................................................... 75 11.2 Introductory reading .............................................................................................................................. 76 11.3 Advanced reading .................................................................................................................................. 76 11.4 Useful texts not specific to pressure and vacuum .................................................................................. 77 11.5 Useful addresses .................................................................................................................................... 77
LIST OF FIGURES Figure 3-1 Pressure modes .................................................................................................................................... 6 Figure 5-1 One possible classification of pressure measurement techniques (illustrative only) .......................... 15 Figure 5-2 Pressure spectrum and common instruments...................................................................................... 16 Figure 5-3 U-tube manometer.............................................................................................................................. 17 Figure 5-4 Fortin barometer ................................................................................................................................ 18 Figure 5-5 Kew pattern barometer....................................................................................................................... 18 Figure 5-6 Common mechanical deformation elements ...................................................................................... 19 Figure 5-7 Bourdon tube dial gauge .................................................................................................................... 21 Figure 5-8 Diaphragm dial gauge ........................................................................................................................ 21 Figure 5-9 Precision aneroid barometer .............................................................................................................. 22 Figure 5-10 Capacitance diaphragm gauge (capacitance manometer)................................................................. 22 Figure 5-11 LVDT gauge .................................................................................................................................... 23 Figure 5-12 Strain gauge sensing......................................................................................................................... 23 Figure 5-13 Resonant structure sensing............................................................................................................... 24 Figure 5-14 Vibrating cylinder barometer ........................................................................................................... 25 Figure 5-15 Transverse piezo-electric effect ....................................................................................................... 26 Figure 5-16 Pressure balance............................................................................................................................... 27 Figure 5-17 Pirani gauge ..................................................................................................................................... 29 Figure 5-18 Spinning-rotor gauge........................................................................................................................ 30 Figure 5-19 Triode gauge .................................................................................................................................... 32 Figure 5-20 Bayard-Alpert gauge ........................................................................................................................ 32 Figure 5-21 Penning gauge.................................................................................................................................. 32 Figure 5-22 Inverted magnetron gauge................................................................................................................ 33 Figure 5-23 Quadrupole analyser ........................................................................................................................ 33 Figure 6-1 Isolation diaphragm ........................................................................................................................... 37 Figure 6-2 Terminal linearity............................................................................................................................... 45 Figure 6-3 Zero-based linearity ........................................................................................................................... 45 Figure 6-4 Best-straight-line linearity.................................................................................................................. 45 Figure 6-5 Zero offset and span error .................................................................................................................. 46 Figure 7-1 Traceability hierarchy ........................................................................................................................ 49 Figure 7-2 Vacuum gauge calibration.................................................................................................................. 53 Figure 7-3 Calibration set-up around atmospheric pressure ................................................................................ 54 Figure 7-4 Dead-weight tester in use ................................................................................................................... 55 Figure 9-1 Vacuum gauge mounting positions .................................................................................................... 66 Figure 10-1 Different meanings of ‘1% uncertainty’ ........................................................................................... 74
4

Guide to the Measurement of Pressure and Vacuum
1 SCOPE This Guide provides advice for those wishing to select and use instruments for measuring pressure or vacuum. It introduces the main concepts and practical techniques involved in making such measurements and explains how to make such measurements so that they are valid and meaningful. This Guide primarily covers static pressure measurements made in the range 10-8 Pa to 109 Pa (10-10 mbar to 10 000 bar) � the 17 decades most relevant to industrial measurements and covers absolute-mode, gauge-mode and differential-mode measurements. Some techniques for making measurements above this range and for the measurement of dynamic pressure are covered only briefly and readers interested in these additional pressure regimes should refer to the further reading list in Chapter 11.
2 INTRODUCTION The measurement of pressure and vacuum plays an extensive and important role in the modern world. The Industrial Revolution was largely powered by the pressure generated by transforming water into steam and the need to measure pressure, over wider ranges and with increasing accuracy, has expanded ever since. Applications are found in industries as diverse as nuclear, power, gas, petro-chemical, biological, pharmaceutical, meteorological, automotive, environmental, semi-conductor, optical, aerospace, defence, ventilation, filtration and process control in general. The validity of the measurements is essential for trade, efficiency, quality and safety.
3 CONCEPTS, TERMS AND DEFINITIONS
3.1 What is pressure? Is vacuum different? Pressure is generally the result of molecules, within a gas or liquid, impacting on their surroundings � usually the walls of the containing vessel. Its magnitude depends on the force of the impacts over a defined area; hence, for example, the traditional (and obsolete!) unit pounds force per square inch. The relationship between pressure (p), force (F) and area (A) is given by:
pFA
�
(1)
and it applies whether the pressure is very small, such as in outer space � or very large, as in hydraulic systems for example. Thus the word pressure is correct when referring to the entire range of ‘force per unit area’ measurements (although it is true that at extremely low pressures the concept of molecules exerting a force becomes more abstract). So what is vacuum? Its definition is not precise but it is commonly taken to mean pressures below, and often considerably below, atmospheric pressure. It does not have separate units and we do not say that “vacuum equals force per unit area”. Thus, strictly, this Guide could have been entitled Guide to the Measurement of Pressure rather than … Pressure and Vacuum. But the differences are often misunderstood and thus leaving out the word vacuum might have falsely implied that this Guide did not cover pressure measurements below atmospheric pressure.
1 mbar = 100 Pa; 1 bar = 0.1 MPa 5

Guide to the Measurement of Pressure and Vacuum
Another definition of the distinction between pressure and vacuum comes from the industries which use and make pressure and vacuum equipment. Broadly, if the force on the walls of the containing vessel is sufficient to permit its measurement directly, we are dealing with pressure technology but if the force is too small for direct measurement and has to be indirectly inferred, we are in the realm of vacuum technology. This definition is not entirely self-consistent though; for example there is a class of instrument which operates in the vacuum region by measuring the deflection of a diaphragm.
3.2 What are absolute, gauge and differential pressures modes? If a vessel were to contain no molecules whatsoever, the pressure would be zero. Pressures measured on the scale which uses this zero value as its reference point are said to be absolute pressures. Atmospheric pressure at the surface of the earth varies but is approximately 105 Pa (1 000 mbar); this is 105 Pa absolute pressure because it is expressed with respect to zero pressure � that is no molecules at all. In everyday life, however, many applications of pressure are not so much dependent on the absolute value of a pressure as the difference between it and the pressure of the atmosphere. A punctured car tyre is said to have ‘no air in it’ and a connected pressure gauge would read zero whilst obviously still containing atmospheric air. Such a gauge is designed to measure pressure values expressed with respect to atmospheric pressure and thus indicates zero when its measurement port ‘merely’ contains molecules at atmospheric pressure. These measurements are commonly known as gauge-mode pressure measurements. Thus the difference between an absolute pressure value and a gauge pressure value is the variable value of atmospheric pressure:
absolute pressure = gauge pressure + atmospheric pressure (2) In some cases � such as engine manifold pressure measurements � pressure excursions below atmospheric pressure are required. This is sometimes known as a negative gauge pressure but it should be appreciated that the concept of a negative absolute pressure is meaningless. In other applications, where knowledge of the pressure difference between two systems is needed, the reference pressure may not necessarily be either zero or atmospheric pressure but some other value. These are known as differential pressures. For example, the flow of gas along a pipeline depends on the pressure difference between
the ends of the pipe and in practice both ends are usually at comparatively high pressures.
Figure 3-1 Pressure modes
If serious errors are to be avoided, it is important when making pressure measurements to be clear which mode of measurement is being employed: absolute, gauge (positive or negative) or differential.
Absolute Gauge Differential
Atmosphericpressure
Zeropressure
Pressure modes are illustrated in Figure 3-1; note that the reference line for gauge-mode measurements is not straight, illustrating the changeable nature of atmospheric pressure.
1 mbar = 100 Pa; 1 bar = 0.1 MPa 6
Guide to the Measurement of Pressure and Vacuum
3.3 Variations in atmospheric pressure Atmospheric pressure is the force exerted on a surface of unit area caused by the earth’s gravitational attraction of the air vertically above that area. It is transmitted equally in all directions within the air and may be measured by a variety of techniques, described in section 5. The density of the air above the surface of the earth is related to changes in temperature and global weather patterns, causing variations in the downward force and hence pressure. We are all familiar with effect of changes in atmospheric pressure: high pressure systems are linked to clear skies, low pressure areas to rain and storms. Atmospheric pressure decreases with increasing altitude. At the top of a mountain, the remaining column of air above us is smaller and the acceleration due to gravity is less (the earth’s centre of mass is further away) so atmospheric pressure is less. This phenomenon is used by aircraft to measure their altitude.
3.4 Pressure terms and definitions The following list defines a range of metrological terms used in pressure measurement. Where available, definitions have been taken from official sources, such as the ISO documents International vocabulary of basic and general terms in metrology [ 33 ], Vacuum technology � vocabulary [ 1 ], Guide to the expression of uncertainty in measurement [ 32 ] or the British Standard Glossary of terms used in metrology [ 6 ] and these terms are shown in bold. However, not all such definitions are reproduced in full and readers are advised to refer to the original sources when appropriate (see section 11.1 for details). Some small alterations have been made to the text to make it pressure-specific; for example the word measurand has often been changed to pressure. Italicised text following an official definition signifies a note added by the authors. Definitions for other terms come from common usage as understood by the authors but it should be noted that such definitions tend to be used in one particular part of the pressure spectrum and may not be adequately rigorous or unambiguous if applied across all the pressure technologies. Term Definition accuracy of measurement 33 � closeness of the agreement between the result of a measurement and a true
value of the pressure. Note: accuracy is a qualitative concept. The true value can never be perfectly known.
accuracy of a measuring instrument 33
� ability of a measuring instrument to give responses close to a true value. Note: accuracy is a qualitative concept.
adjustment (of a measuring instrument) 33
� operation of bringing a measuring instrument into a state of performance suitable for its use.
barometer � an instrument designed to measure atmospheric pressure. best straight line � the equation of a straight line, calculated from a set of measurement results,
which attempts to minimise the differences (usually called residuals) between the line and the measurement results. There is more than one statistical method used, each of which may place the straight line in a slightly different position with respect to the measurement data.
calibration 33 � a set of operations that establish, under specified conditions, the relationship between the values of quantities indicated by a measuring instrument or measuring system … and the corresponding values realised by standards. See section 7.1 for discussion of difference between calibration and adjustment.
calibration point � one particular measurement in a sequence of measurements aimed at providing calibration.
correction 33 � the value added algebraically to the uncorrected result of a measurement to compensate for systematic error. Note: since the systematic error cannot be known perfectly, the compensation cannot be complete.
1 mbar = 100 Pa; 1 bar = 0.1 MPa 7

Guide to the Measurement of Pressure and Vacuum
creep � the property of a material under load whereby its dimensions or displacement continue to alter with time.
dead-weight tester � a term commonly used to describe apparatus which includes a pressure balance piston-cylinder, masses, base assembly and other associated items (see pressure balance).
drift 33 � slow change of a metrological characteristic of a measuring instrument. error (of measurement) 33 � result of a measurement minus the true value of the measurand. Error is
numerically equal to correction but opposite in sign. error, line pressure � the variation in output of a differential pressure measuring device over a range
of line pressure values with constant differential pressure. random � a traditional and largely superseded term used in uncertainty analysis. Modern
practice instead divides errors into type A and type B which allows for better analysis.
systematic � a traditional and largely superseded term used in uncertainty analysis. Modern practice instead divides errors into type A and type B which allows for better analysis.
fluid head � pressure generated by a fluid column under the influence of gravity. full scale deflection � the maximum value that may be indicated by a device. fundamental method of measurement 6
� a method of measurement in which the value of a measurand is obtained by measurement of the appropriate base quantities. A measuring technique whose principles allow pressure values to be determined directly from values of length, mass and time. Primary standards are fundamental in nature but the word fundamental does not in itself imply high performance � for example crude water U-tubes are fundamental. All commercial equipment, howsoever fundamental, needs calibrating if traceability is to be demonstrated.
hysteresis 6 � property of a measuring instrument whereby its response to a given stimulus depends of the sequence of preceding stimuli, eg dependence of reading on whether pressure is rising or falling.
influence quantity � any effect that may influence the uncertainty associated with a measurement value.
ISO � International Organisation for Standardisation. mean free path � the average distance a molecule travels between collisions; a concept
important in vacuum technology. metrology �the science of measurement. NAMAS � National Accreditation of Measurement and Sampling � the UK standard for
accreditation to EN45001(see UKAS). NPL � the National Physical Laboratory, the UK’s national standards laboratory
which develops and maintains most of the UK’s physical measurement standards, including those for pressure and vacuum.
ppm � abbreviation for parts per million, eg 0.01 % = 100 ppm. pascal � the SI unit of pressure, abbreviated to Pa. precision � a traditional term relating to the degree of measurement refinement. Its use in
the calculation of measurement uncertainty has been superseded by concepts such as repeatability and resolution.
pressure, absolute � the value of a pressure with respect to zero pressure. See section 3.2. ambient � the pressure surrounding a device, often equal to the prevailing atmospheric
pressure. atmospheric � the pressure generated by the gravitational attraction between the earth and its
surrounding air. Synonymous with barometric pressure. barometric � see atmospheric pressure.
1 mbar = 100 Pa; 1 bar = 0.1 MPa 8

Guide to the Measurement of Pressure and Vacuum
base � the lowest pressure obtainable in a vacuum system after continuous pumping for a long period. Often a procedure of thermal cycling is also employed. Synonymous with residual pressure.
burst � the magnitude of the applied pressure which causes escape of pressure media. Also known as rupture pressure.
design � the highest pressure, given a particular working temperature and conditions, at which the device or system has been designed to operate safely.
differential � the value of the difference between two pressures. dynamic � generally, a pressure whose value changes significantly in a short period of
time. Alternatively, in flow rate measurements, the dynamic pressure can refer to the sum of the static pressure and the impact pressure.
gauge � the value of a pressure measured with respect to atmospheric pressure. See section 3.2
line � used loosely to specify a nominal pressure in a system, often acting as the reference pressure for differential pressure measurements. Often known as static pressure
maximum working � the maximum pressure which may be applied to a device under specified conditions of working. Note that fluctuating pressures can do more damage than can a continuous, steady pressure.
operating � the working pressure at which a system is normally expected to be operated. Measuring devices are often chosen so that the normal operating pressure is not near the limits of the device.
partial � the contribution to the total pressure made by an individual component in a medium of mixed gases or vapours, often used in vacuum systems. Unless otherwise stated, ‘pressure’ is synonymous with total pressure.
proof � a safety test pressure applied to a system or a device. static � see line pressure. Also sometimes used to describe the condition where
pressure values are stable � as is preferable when making non-dynamic pressure measurements.
pressure balance � an instrument consisting of a finely machined piston mounted vertically in a close-fitting cylinder used for maintaining a calculable pressure; also known as a piston gauge. When fitted with a means of pressure control, additional pressure ports, masses etc, the complete system is commonly known as a dead-weight tester.
range, measuring, working 33
� set of values of pressure for which the error of a measuring instrument is intended to lie within specified limits.
nominal 33 � range of indications obtainable with a particular setting of the controls of a measuring instrument.
lower range limit � the lowest value of pressure that the device can be adjusted to measure. lower range value � the lowest value of pressure that the device is adjusted to measure. upper range limit � the highest value of pressure that the device can be adjusted to measure. upper range value � the highest value of pressure that the device is adjusted to measure. rangeability � a facility which enables the amplification, and possibly the offset, of a
device’s output signal to be adjusted electronically to suit different pressure ranges. Note that this facility does not change the inherent physical characteristics of the sensor.
repeatability (of results of measurements) 33
� closeness of the agreement between the results of successive measurements of the pressure carried out under the same conditions of measurement. Conditions include: same procedure, observer, instrument, conditions, location; and carried out over a short period of time.
1 mbar = 100 Pa; 1 bar = 0.1 MPa 9

Guide to the Measurement of Pressure and Vacuum
reproducibility (of results of measurements) 33
� closeness of the agreement between the results of measurements of the pressure carried out under changed conditions of measurement. Includes changing some of those conditions which are held constant for ‘repeatability’, and may refer to measurements carried out over a long period of time.
resolution (of a displaying device) 33
� smallest difference between indications of a displaying device that can be meaningfully distinguished. Note that it is important not to confuse the resolution of a display alone with the resolution of a pressure measuring system which incorporates a display; the system will have less (poorer) resolution than the display alone.
response time 33 � time interval between the instant when a stimulus is subjected to a specified abrupt change and the instant when the response reaches and remains within specified limits around its final steady value.
sealed gauge � a pressure transducer, which has an in-built ‘sealed’ known reference pressure, that is electrically adjusted to read ‘zero’ when it is exposed to atmospheric pressure.
sensor 33 � element of a measuring instrument or measuring chain that is directly or indirectly affected by the measurand.
snubber � a component fitted in a pressure system line to restrict the gas flow, typically to damp oscillations in pressure.
span 33 � modulus of the difference between the two limits of a nominal range. stability 33 � ability of a measuring instrument to maintain constant its metrological
characteristics with time. standard deviation 33 � … a mathematical quantity used to characterise the dispersion of results. standard uncertainty 32 � uncertainty of the result of a measurement expressed as a standard deviation. standard, national
(measurement) 33 � standard recognised by a national decision to serve, in a country, as the basis for assigning values to other standards of the quantity concerned.
primary 33 � standard that is designated or widely acknowledged as having the highest metrological qualities and whose value is accepted without reference to other standards of the same quantity.
reference 33 � standard, generally having the highest metrological quality available at a given location or in a given organisation, from which measurements made there are derived. The reference standard itself must be periodically calibrated.
secondary 33 � standard whose value is assigned by comparison with a primary standard of the same quantity.
transfer 33 � standard used as an intermediary to compare standards. working 33 � standard that is used routinely to calibrate or check material measures,
measuring instruments or reference materials. temperature coefficient � the change in measured value per unit change in temperature. The higher the
temperature coefficient the more sensitive the device is to temperature changes. temperature compensation � method of reducing the effect of a change in temperature on a pressure
measuring instrument. traceability 33 � property of the result of a measurement or the value of a standard whereby it
can be related to stated references, usually national or international standards, through an unbroken chain of comparisons all having stated uncertainties.
transducer 33 � device that provides an output quantity having a determined relationship to the pressure. Commonly used in pressure measurement to refer to pressure transducers with voltage outputs.
transmitter � commonly used in pressure measurement to refer to devices whose signals are not appreciably degraded by transmission over long distances. See section 6.8.3.
turndown � see rangeability. turndown ratio � the ratio of the maximum and minimum full-scale pressures to which a device
may be electronically adjusted. Typically applies to pressure transmitters.
1 mbar = 100 Pa; 1 bar = 0.1 MPa 10

Guide to the Measurement of Pressure and Vacuum
type A evaluation (of uncertainty) 32
� method of evaluation of uncertainty by the statistical analysis of series of observations.
type B evaluation (of uncertainty) 32
� method of evaluation of uncertainty by means other than the statistical analysis of series of observations.
UKAS � The United Kingdom Accreditation Service is the UK national body responsible for assessing and accrediting the competence of organisations in the fields of measurement, testing, inspection and certification of systems, products and personnel (see NAMAS).
uncertainty budget � a calculation detailing the component terms contributing to the uncertainty of a measurement, their statistical distribution, mathematical manipulation and summation.
uncertainty of measurement 33
� parameter, associated with the result of a measurement, that characterises the dispersion of values that could reasonably be attributed to the measurand.
vacuum, low (rough) 1 � a pressure between 105 Pa and 100 Pa. medium 1 � a pressure between 100 Pa and 0.1 Pa. high 1 � a pressure between 0.1 Pa and 10-5 Pa. See note on ultra-high vacuum
concerning lower limit. ultra-high 1 � a pressure below 10-5 Pa. Many users put the division between high and ultra-
high vacuum at 10-7 Pa. zero error (of a measuring instrument) 33
� datum error for zero value of the pressure.
4 UNITS AND CONVERSIONS
4.1 Historical pressure units Unfortunately, in pressure and vacuum measurement, there is a multiplicity of units which causes considerable problems, both to newcomers and experienced practitioners alike. Fortunately, though, life is getting easier as obsolete and ill-defined units disappear in favour of the SI unit of pressure (see section 4.2 overleaf). Many old pressure units have obvious practical and historical origins; for example, inches of water was the unit used where pressures were measured with a water column whose top surface was sighted against an inch scale. Initially the measurement accuracies required of such systems were consistent with fairly crude measuring techniques and no one bothered too much whether the water was hot or cold. As technological demands increased, the need for more consistent units emerged; definitions were refined to take account of variations in fluid density due to temperature and purity, variations in gravitational acceleration etc, and the mathematical models of the measuring instruments were refined considerably. For example, in one traditional design of mercury barometer allowance was (and still is) made for the differential expansions between the mercury in the column, the glass from which the column is made, the brass from which the scale is made and a steel reservoir. The mathematics used to calculate more accurate values of pressure from instrument readings often used arbitrary datum values but unfortunately manufacturers often picked alternative ones. For temperature it might have been 0 oC or 68 oF; for gravitational acceleration it might have been the value associated with standard conditions or a value ‘helpfully’ modified to take account of the location , such as London laboratory conditions. Some barometers even used different conditions for adjacent scales, making it impossible to compare one with the other properly! Even with refined definitions and associated mathematics, however, many of the traditional units cannot be used at the limits of modern technology � their definitions are simply not adequate and cannot be made so.
1 mbar = 100 Pa; 1 bar = 0.1 MPa 11
Guide to the Measurement of Pressure and Vacuum
4.2 The International System of Units and dimensions of pressure
4.2.1 General The International System of Units, known as the SI system, is the coherent system of units adopted and recommended by the General Conference on Weights and Measures (CGPM). It is based on seven base quantities: length, mass, time, electric current, thermodynamic temperature, amount of substance and luminous intensity. Pressure is not a base quantity but a derived quantity, with dimensions of length, mass and time. This can be demonstrated by considering the two fundamental ways of measuring pressure: directly in terms of force-per-unit-area measurements and with liquid columns. (i) Pressure is defined as force per unit area but force = mass � acceleration (Newton’s second law of
motion) and acceleration is rate of change of velocity. Thus if pressure is force/area, it equates to (mass � rate of change of velocity)/area. This gives pressure the dimensions of mass � length/(time2 � length2) which simplifies to mass/(length � time2) or M.L-1.T-2. Thus, from the definition it can be shown that pressure is derived from three base quantities; mass, length and time.
(ii) The pressure at the bottom of a fluid column is calculated by multiplying together the density of the fluid,
the acceleration due to gravity and the height of the column (�gh). Since density is mass/volume it has dimensions mass/length3. Acceleration is rate of change of velocity so it has dimensions length/time2. The vertical distance is simply length so the product � g h has dimensions mass/length3 � length/time2 � length, which simplifies to M.L-1.T-2 and is dimensionally identical to the force/area calculation in (i) above.
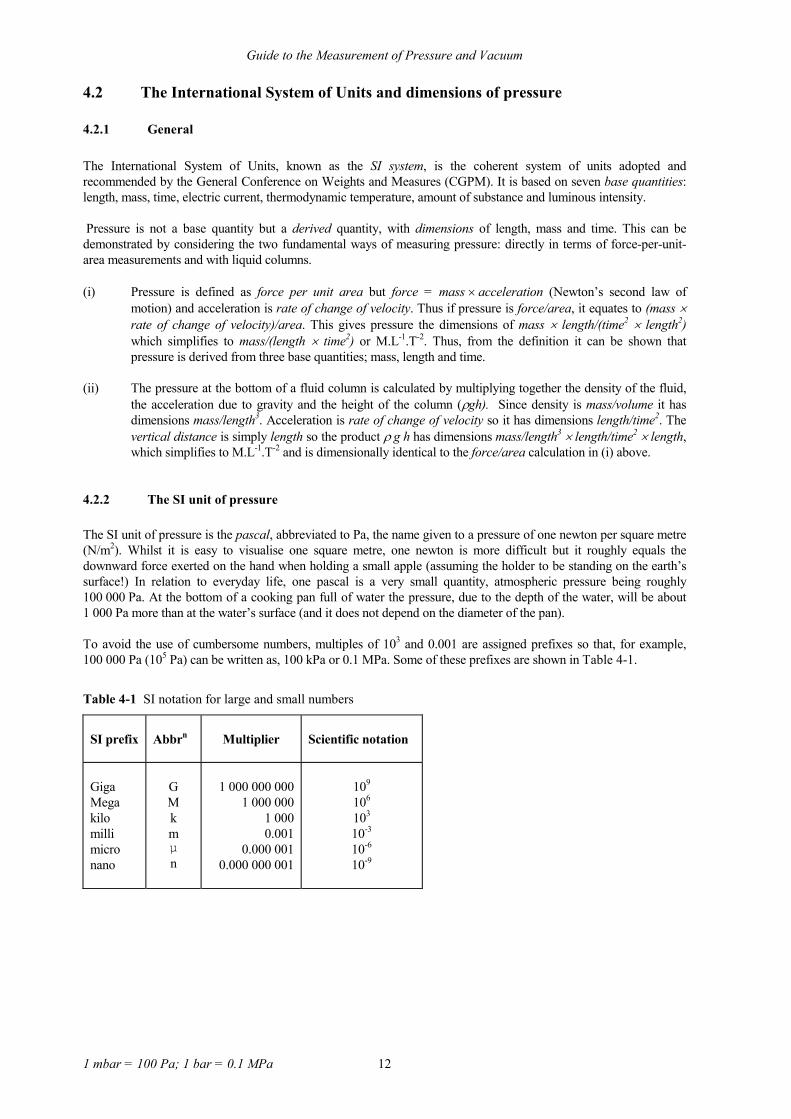
4.2.2 The SI unit of pressure The SI unit of pressure is the pascal, abbreviated to Pa, the name given to a pressure of one newton per square metre (N/m2). Whilst it is easy to visualise one square metre, one newton is more difficult but it roughly equals the downward force exerted on the hand when holding a small apple (assuming the holder to be standing on the earth’s surface!) In relation to everyday life, one pascal is a very small quantity, atmospheric pressure being roughly 100 000 Pa. At the bottom of a cooking pan full of water the pressure, due to the depth of the water, will be about 1 000 Pa more than at the water’s surface (and it does not depend on the diameter of the pan). To avoid the use of cumbersome numbers, multiples of 103 and 0.001 are assigned prefixes so that, for example, 100 000 Pa (105 Pa) can be written as, 100 kPa or 0.1 MPa. Some of these prefixes are shown in Table 4-1.
Table 4-1 SI notation for large and small numbers
SI prefix
Abbrn
Multiplier
Scientific notation
Giga Mega kilo milli micro nano
G M k m µ n
1 000 000 000
1 000 000 1 000 0.001
0.000 001 0.000 000 001
109
106
103
10-3
10-6
10-9
1 mbar = 100 Pa; 1 bar = 0.1 MPa 12
Guide to the Measurement of Pressure and Vacuum
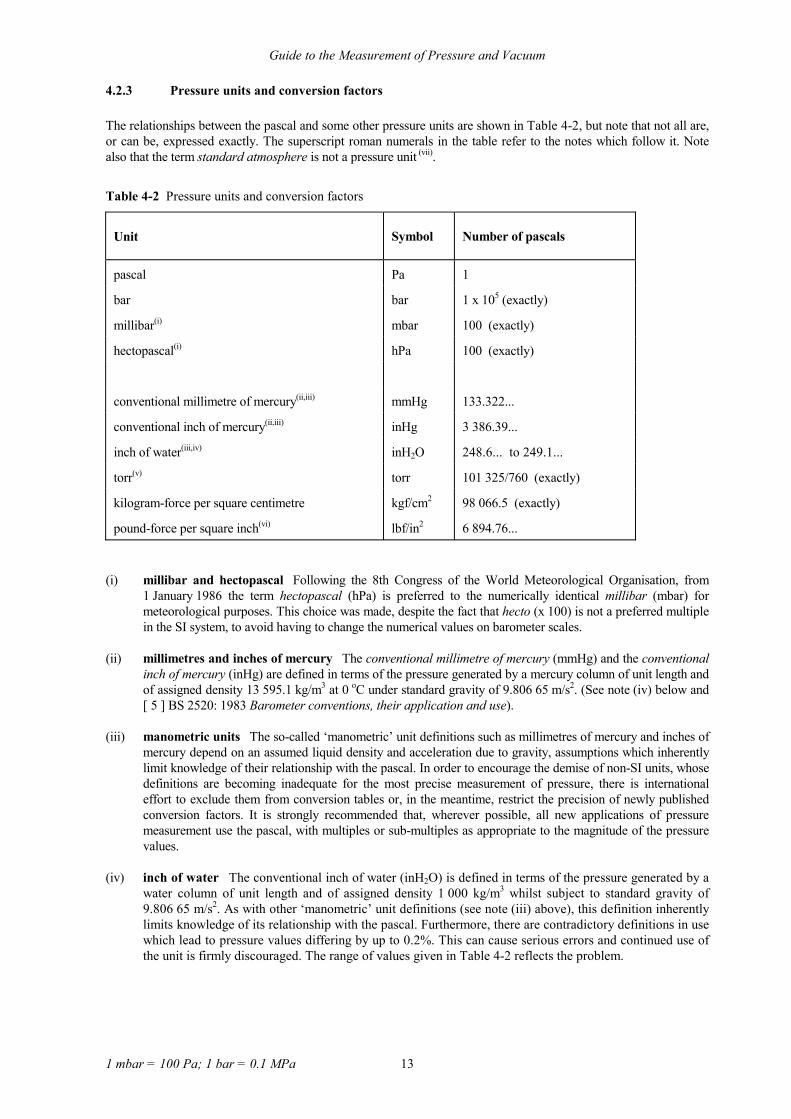
4.2.3 Pressure units and conversion factors The relationships between the pascal and some other pressure units are shown in Table 4-2, but note that not all are, or can be, expressed exactly. The superscript roman numerals in the table refer to the notes which follow it. Note also that the term standard atmosphere is not a pressure unit (vii).
Table 4-2 Pressure units and conversion factors
Unit
Symbol
Number of pascals
pascal Pa 1
bar bar 1 x 10⁵ (exactly)
millibar(i) mbar 100 (exactly)
hectopascal(i) hPa 100 (exactly)
conventional millimetre of mercury(ii,iii) mmHg 133.322...
conventional inch of mercury(ii,iii) inHg 3 386.39...
inch of water(iii,iv) inH2O 248.6... to 249.1...
torr(v) torr 101 325/760 (exactly)
kilogram-force per square centimetre kgf/cm2 98 066.5 (exactly)
pound-force per square inch(vi) lbf/in2 6 894.76... (i) millibar and hectopascal Following the 8th Congress of the World Meteorological Organisation, from
1 January 1986 the term hectopascal (hPa) is preferred to the numerically identical millibar (mbar) for meteorological purposes. This choice was made, despite the fact that hecto (x 100) is not a preferred multiple in the SI system, to avoid having to change the numerical values on barometer scales.
(ii) millimetres and inches of mercury The conventional millimetre of mercury (mmHg) and the conventional
inch of mercury (inHg) are defined in terms of the pressure generated by a mercury column of unit length and of assigned density 13 595.1 kg/m3 at 0 oC under standard gravity of 9.806 65 m/s2. (See note (iv) below and [ 5 ] BS 2520: 1983 Barometer conventions, their application and use).
(iii) manometric units The so-called ‘manometric’ unit definitions such as millimetres of mercury and inches of
mercury depend on an assumed liquid density and acceleration due to gravity, assumptions which inherently limit knowledge of their relationship with the pascal. In order to encourage the demise of non-SI units, whose definitions are becoming inadequate for the most precise measurement of pressure, there is international effort to exclude them from conversion tables or, in the meantime, restrict the precision of newly published conversion factors. It is strongly recommended that, wherever possible, all new applications of pressure measurement use the pascal, with multiples or sub-multiples as appropriate to the magnitude of the pressure values.
(iv) inch of water The conventional inch of water (inH2O) is defined in terms of the pressure generated by a
water column of unit length and of assigned density 1 000 kg/m3 whilst subject to standard gravity of 9.806 65 m/s2. As with other ‘manometric’ unit definitions (see note (iii) above), this definition inherently limits knowledge of its relationship with the pascal. Furthermore, there are contradictory definitions in use which lead to pressure values differing by up to 0.2%. This can cause serious errors and continued use of the unit is firmly discouraged. The range of values given in Table 4-2 reflects the problem.
1 mbar = 100 Pa; 1 bar = 0.1 MPa 13

Guide to the Measurement of Pressure and Vacuum
(v) torr The torr is defined as exactly 101 325/760 Pa � the ‘760’ coming from the original and arbitrary definition of standard atmosphere. Its value differs from the conventional millimetre of mercury by about 1 part in 7 million. (See [ 5 ] BS 2520: 1983 Barometer conventions, their application and use.)
(vi) pound-force per square inch The correct abbreviation for pound-force per square inch is lbf/in2. Many
instruments using this unit are labelled psi, however, and the label is incorrectly described as meaning pounds-per-square inch � with the word force missing. This is a significant conceptual error as a pound is a mass, not a force.
(vii) standard atmosphere The current definition of standard atmosphere (atm) is 101 325.0 Pa exactly. It is
still occasionally used in defining a reference environment, eg for specifying gas density, but it is not a pressure unit and should not be used to express pressure values.
5 METHODS OF MEASUREMENT
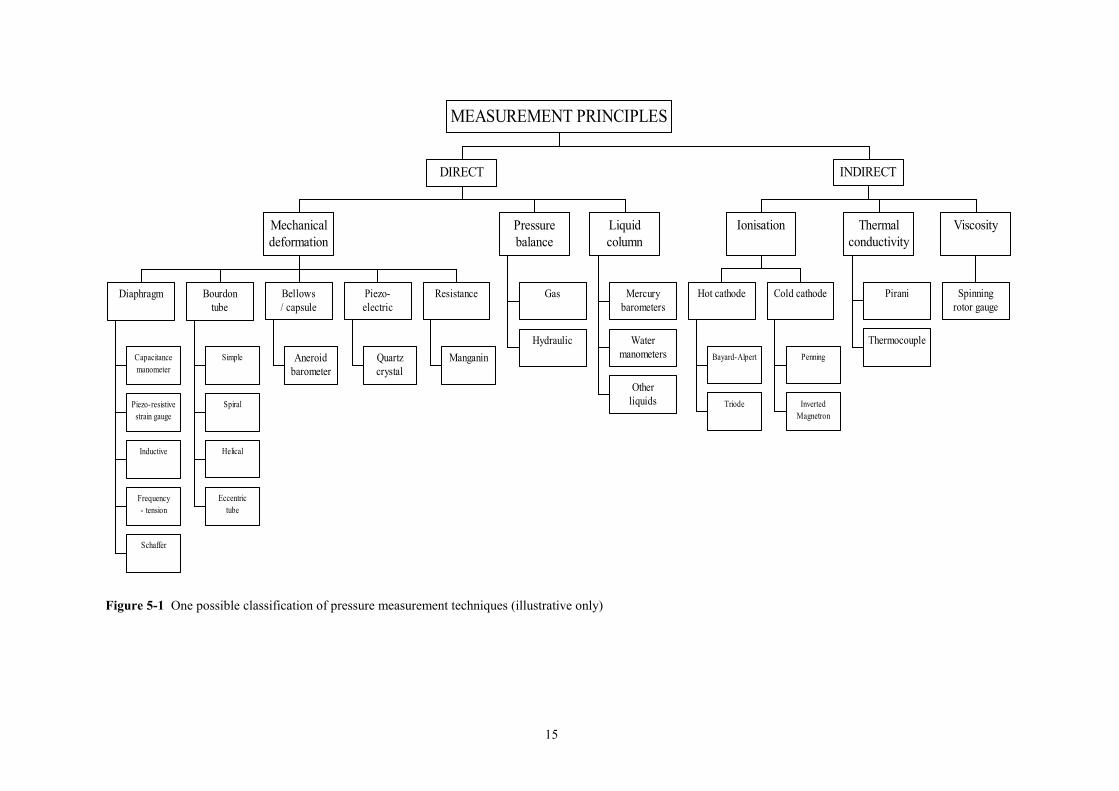
5.1 General A number of quite different principles are utilised in pressure measuring instruments. Some of these are fundamental in character such as measuring the height of a liquid column of known density. One such example is a mercury barometer where the atmospheric pressure can be balanced against the column of mercury. An extension to this idea for use at higher pressures is the use of metal weights acting over a known area to provide the force rather than the weight of the liquid. Often the pressure may be determined by measurement of the mechanical deformation of a sensing element that undergoes elastic deformation as the pressure difference across its surfaces changes. The mechanical deflection can be both implemented and sensed in a number of ways. One of the commonest types of moving mechanical elements is an elastic diaphragm. Another example is a Bourdon tube where the internal pressure forces the straightening of a curved tube. Such mechanical deformation may be sensed in a number of ways: a series of mechanical levers to give a direct display of the deformation, resistance measurement in a strain gauge, capacitance measurement, change in frequency of a resonating element under tension or compression and so on. When the pressure is very low and the mechanical deflection is therefore too small to be measured, indirect means are used that measure a physical property such as thermal conductivity, ionisation or viscosity that is dependent on the number density of molecules. Figure 5-1 shows one possible classification of some of the methods of measurement. The chart omits techniques that are employed only rarely. It should be noted that the chart shows only one possible representation of the wide range of pressure and vacuum measuring instruments and it would be equally valid to group techniques in other ways. For example, sensing techniques shown associated with diaphragms could also be used with other elastic deformation components. Figure 5-2 shows the approximate pressure ranges of some common pressure and vacuum measuring devices. Once again, it should be noted that this representation is meant as a general guide and is not a rigorous classification.
1 mbar = 100 Pa; 1 bar = 0.1 MPa 14
Capacitancemanometer
Piezo-resistivestrain gauge
Inductive
Frequency- tension
Schaffer
Diaphragm
Simple
Spiral
Helical
Eccentrictube
Bourdontube
Aneroidbarometer
Bellows/ capsule
Quartzcrystal
Piezo-electric
Manganin
Resistance
Mechanicaldeformation
Gas
Hydraulic
Pressurebalance
Mercurybarometers
Watermanometers
Otherliquids
Liquidcolumn
DIRECT
Bayard-Alpert
Triode
Hot cathode
Penning
InvertedMagnetron
Cold cathode
Ionisation
Pirani
Thermocouple
Thermalconductivity
Spinningrotor gauge
Viscosity
INDIRECT
MEASUREMENT PRINCIPLES
Figure 5-1 One possible classification of pressure measurement techniques (illustrative only)
15

Guide to the Measurement of Pressure and Vacuum
Figure 5-2 Pressure spectrum and common instruments
1 mbar = 100 Pa; 1 bar = 0.1 MPa 16

Guide to the Measurement of Pressure and Vacuum
5.2 Liquid column instruments
5.2.1 General One of the earliest methods of pressure measurement, and still one of the most accurate today, liquid columns are based on the ability of a compressed medium to force liquid up a tube.
The manometer shown in Figure 5-3 is essentially a liquid-filled U-tube where the vertical separation of the liquid’s surfaces gives a measure of the difference between the pressures in each limb. At the datum level d; the downward pressure L, is provided by the liquid above it, plus the pressure p2 at the top of the tube. In equilibrium, the column is supported by the upward pressure p1, which is transmitted through the fluid from the other limb. If the pressure in either limb changes, the liquid moves up on one side and down the other until equilibrium conditions are re-established.
Figure 5-3 U-tube manometer
h
d
L
p2
p1
p1
The pressure p1, at the lower liquid surface is given by:
p gh1 2� � p� (3) where h is the vertical height of the liquid column above the datum level, � is the density of the liquid and g is the local value of acceleration due to gravity. If the upper tube is connected to the atmosphere (p2 = atmospheric pressure) then p1 is a gauge-mode pressure; if the upper tube is evacuated (ie p2 = zero) then p1 is an absolute-mode pressure and the instrument becomes a barometer.
Mercury, water and oil are all used in various designs of manometer, although for barometric purposes mercury is always used; its density is over 13 times greater than that of water or oil and thus, for a given pressure, it requires a much shorter column � about 0.75 m when measuring atmospheric pressure. Its density is also considerably more stable than that of other liquids. Low gauge and differential pressures have traditionally been measured with water or oil liquid columns to ensure adequate sensitivity. Inclining a manometer increases its sensitivity still more � the fluid has further to travel along the inclined column to achieve a given vertical movement. The traditional units for this type of measurement were inches of water or millimetres of water, but as units they are poorly defined and their continued use is strongly discouraged (see section 4.2.3).
5.2.2 Large-bore mercury barometers Individually built large-bore mercury barometers, using a variety of optical, capacitive, ultrasonic or inductive methods for detecting the mercury surface positions, are used around the world by national laboratories as primary and national standards. The most accurate mercury columns use large diameter tubes (several tens of millimetres) to reduce capillary depression of the meniscus and other surface tension effects. Uncertainties in pressure of only a few parts per million can be achieved but extreme care has to be taken in determining the mercury temperature (typically ±0.005 oC), the mercury density (see [ 35 ]), the verticality of the height-measuring system and the local value of gravitational acceleration (see section 9.1.10). Slightly less capable instruments are available commercially and measure pressures up to about 3 x10⁵ Pa. They are, however, the most expensive of pressure measuring instruments. Two more modest mercury barometers are described overleaf.
1 mbar = 100 Pa; 1 bar = 0.1 MPa 17

Guide to the Measurement of Pressure and Vacuum
5.2.3 Fortin barometers
P
M
F
S
V
Figure 5-4 Fortin barometer Key: F, fiducial point; M, mainscale; P, porous material; S, screw; V, vernier
Fortin barometers measure pressure over the normal atmospheric range only. Measurements of mercury column length are made using a vernier whose scale zero is the tip of a fiducial point mounted in a cistern. The level of the cistern mercury can be raised or lowered by turning an axial screw to squeeze a leather bag until the mercury surface coincides with the fiducial point. The precise amount of mercury in the Fortin barometer is not critical. Atmospheric air enters through a porous material in the cistern lid. They are traditional instruments which have to be transported with particular care (see section 9.5.5) and need calibrating by total immersion (see section 7.7). Handled properly, though, they are very reliable. Beyond any calibration corrections, corrections for instrument temperature and the local value of gravitational acceleration have to be applied to their vernier readings. Details of these corrections are given in [ 5 ] BS 2520 : 1983 British Standard � Barometer conventions and tables, their application and use. Mercury barometers should be transported with extreme care (see section 9.5.5).
5.2.4 Kew pattern barometers
P
M V
Figure 5-5 Kew pattern barometer Key: M, mainscale; P, porous material; V, vernier
One version of a Kew pattern barometer, known as a station barometer, is similar to a Fortin barometer except it has a fixed cistern and to compensate for the varying height of the mercury surface in the cistern, as atmospheric pressure changes, the scale is contracted slightly. Kew pattern bench barometers are free standing and measure pressures from a few millibar up to atmospheric pressure; they use a pressure port and thus do not need total immersion calibration. The amount of mercury in either design of Kew pattern barometer is critical to its operation. Details of the corrections to be applied are given in [ 5 ] BS 2520 : 1983 British Standard � Barometer conventions and tables, their application and use. Mercury barometers should be transported with extreme care (see section 9.5.5).
1 mbar = 100 Pa; 1 bar = 0.1 MPa 18
Guide to the Measurement of Pressure and Vacuum
5.3 Mechanical deformation instruments
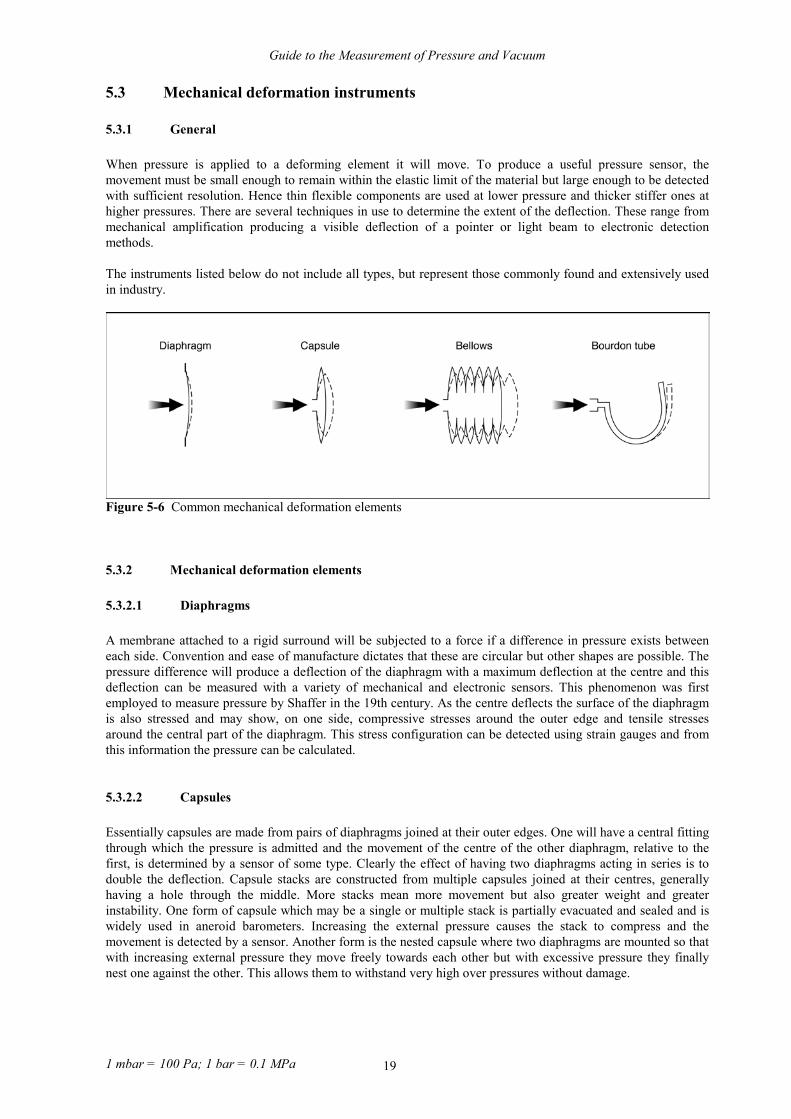
5.3.1 General When pressure is applied to a deforming element it will move. To produce a useful pressure sensor, the movement must be small enough to remain within the elastic limit of the material but large enough to be detected with sufficient resolution. Hence thin flexible components are used at lower pressure and thicker stiffer ones at higher pressures. There are several techniques in use to determine the extent of the deflection. These range from mechanical amplification producing a visible deflection of a pointer or light beam to electronic detection methods. The instruments listed below do not include all types, but represent those commonly found and extensively used in industry.
Figure 5-6 Common mechanical deformation elements
5.3.2 Mechanical deformation elements
5.3.2.1 Diaphragms A membrane attached to a rigid surround will be subjected to a force if a difference in pressure exists between each side. Convention and ease of manufacture dictates that these are circular but other shapes are possible. The pressure difference will produce a deflection of the diaphragm with a maximum deflection at the centre and this deflection can be measured with a variety of mechanical and electronic sensors. This phenomenon was first employed to measure pressure by Shaffer in the 19th century. As the centre deflects the surface of the diaphragm is also stressed and may show, on one side, compressive stresses around the outer edge and tensile stresses around the central part of the diaphragm. This stress configuration can be detected using strain gauges and from this information the pressure can be calculated.
5.3.2.2 Capsules Essentially capsules are made from pairs of diaphragms joined at their outer edges. One will have a central fitting through which the pressure is admitted and the movement of the centre of the other diaphragm, relative to the first, is determined by a sensor of some type. Clearly the effect of having two diaphragms acting in series is to double the deflection. Capsule stacks are constructed from multiple capsules joined at their centres, generally having a hole through the middle. More stacks mean more movement but also greater weight and greater instability. One form of capsule which may be a single or multiple stack is partially evacuated and sealed and is widely used in aneroid barometers. Increasing the external pressure causes the stack to compress and the movement is detected by a sensor. Another form is the nested capsule where two diaphragms are mounted so that with increasing external pressure they move freely towards each other but with excessive pressure they finally nest one against the other. This allows them to withstand very high over pressures without damage.
1 mbar = 100 Pa; 1 bar = 0.1 MPa 19

Guide to the Measurement of Pressure and Vacuum
5.3.2.3 Bellows There is no clear distinction between bellows and capsules, but bellows tend to have multiple sections, serially stacked, and generally the corrugations are small compared with the diameter. Bellows may be rolled from tube, formed under pressure or built up from welded elements. They are sometimes called capsule stacks.
5.3.2.4 Bourdon tubes Bourdon gauges, first developed in the mid-nineteenth century, with their rack and pinion driven indicating needles and scales are still widely used. Various designs exist but the typical form is a closed tube of oval cross-section, curved along its length. When pressurised the tube tends to straighten and a sensor detects this movement. They can be designed to operate over a wide range of pressures and in gauge, absolute and differential modes. Simple ‘C’-shape, spiral and helical types are available. Electronic detection of the end movement is commonly used with quartz helix devices. A range of metals and fused quartz are the usual materials of construction with the choice of materials depending on the required pressure range and media compatibility.
5.3.2.5 Cylinders When a cylindrical tube is pressurised from the inside a hoop stress is imposed in the wall which gives rise to a strain at the outer surface of the tube. This can be measured by attaching resistive strain gauges to the outer surface of the tube. Commercial instruments of this kind are available up to 1 GPa. Instead of using a separate cylinder, a common practice is to fit strain gauges to the outer wall of a pressure vessel so that the vessel itself can be used as the deforming element. Another form of cylinder-type pressure gauge suitable for use at high pressures can be made from a rod of circular cross-section which has a hole drilled down its length parallel to, but not on, the symmetry axis of the rod. When pressure is applied internally a movement of the end of the cylinder similar to that of the Bourdon tube is observed and it is detected in a similar way to Bourdon tube dial gauges.
5.3.3 Mechanical deformation sensing
5.3.3.1 General The nature of the sensing technique and associated instrumentation will affect the performance of the transducer. There are many combinations of deforming elements and sensing techniques, each will have advantages and disadvantages. The upper pressure limit will generally be determined by the limitations of the moving element, not the sensing technique. Electronic processing of output signals can provide digital resolution unobtainable with pointers and scales, no matter how big. For example, a scale one metre long, readable to ±0.5 mm, gives a resolution of ±0.05% (of full scale deflection) or ±5 parts in 10 000. Better resolution can be obtained from a digital display of just 4 digits (although strictly it would need to be ‘one and four nines’ to reach the value ‘10 000’. It should not be assumed, however, that devices with digital displays must be more accurate than analogue ones because often they are not. Most sensors are inherently analogue in nature � mechanical deformation devices certainly are � and their analogue outputs have to be converted to digital form. All analogue-to-digital converters (known as ‘A to Ds’) introduce additional errors and with low-cost devices these can be considerable. It is also instinctively but falsely believed that digital devices do not suffer drift in characteristics in the same way as do analogue ones.
1 mbar = 100 Pa; 1 bar = 0.1 MPa 20

Guide to the Measurement of Pressure and Vacuum
5.3.3.2 Mechanical display These gauges use a direct mechanical display of the movement of a Bourdon tube, a diaphragm or a capsule stack.
Bourdon tube dial gauges and diaphragm dial gauges are most commonly used in the gauge-mode but can also be used to measure differential pressures and absolute pressures by using sealed cases. With Bourdon tubes differential measurement is achieved by use of a second tube whose movement is mechanically subtracted from the main tube. With diaphragm dial gauges the differential pressure is applied across the diaphragm. Both instruments may provide absolute measurements by modifying the differential pressure design so that one side is constructed to react to changes in atmospheric pressure, enabling the instrument to simulate absolute-mode performance.
Figure 5-7 Bourdon tube dial gauge
The Bourdon tube dial gauge has a Bourdon tube of elliptical cross-section that is bent to form a circular arc. When pressure is applied to the inside of the tube the tube tends to straighten out. This is amplified mechanically using gears and levers to operate a pointer Bourdon tube dial gauges operate at pressures up to about 1.5 GPa and a typical mechanism is shown in Figure 5-7.
Diaphragm
Screwedconnection
Hair-spring
Figure 5-8 Diaphragm dial gauge
The diaphragm dial gauge is similar to a Bourdon tube dial gauge except that the moving element is a diaphragm. Its movement is transmitted through a connecting rod to an amplifying lever and gears which rotate a mechanical pointer.
1 mbar = 100 Pa; 1 bar = 0.1 MPa 21
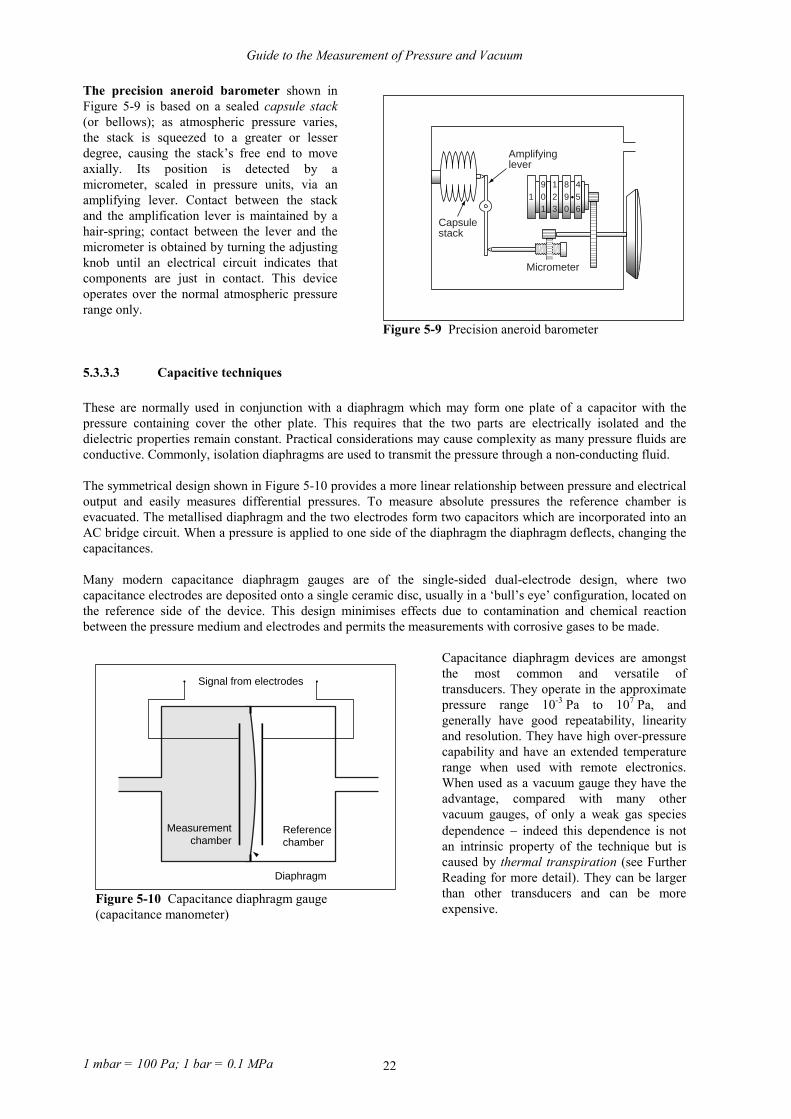
Guide to the Measurement of Pressure and Vacuum
The precision aneroid barometer shown in Figure 5-9 is based on a sealed capsule stack (or bellows); as atmospheric pressure varies, the stack is squeezed to a greater or lesser degree, causing the stack’s free end to move axially. Its position is detected by a micrometer, scaled in pressure units, via an amplifying lever. Contact between the stack and the amplification lever is maintained by a hair-spring; contact between the lever and the micrometer is obtained by turning the adjusting knob until an electrical circuit indicates that components are just in contact. This device operates over the normal atmospheric pressure range only.
Capsulestack
Amplifyinglever
Micrometer
1 0 2 9 59 1 8 4
1 3 0 6
.
Figure 5-9 Precision aneroid barometer
5.3.3.3 Capacitive techniques These are normally used in conjunction with a diaphragm which may form one plate of a capacitor with the pressure containing cover the other plate. This requires that the two parts are electrically isolated and the dielectric properties remain constant. Practical considerations may cause complexity as many pressure fluids are conductive. Commonly, isolation diaphragms are used to transmit the pressure through a non-conducting fluid. The symmetrical design shown in Figure 5-10 provides a more linear relationship between pressure and electrical output and easily measures differential pressures. To measure absolute pressures the reference chamber is evacuated. The metallised diaphragm and the two electrodes form two capacitors which are incorporated into an AC bridge circuit. When a pressure is applied to one side of the diaphragm the diaphragm deflects, changing the capacitances. Many modern capacitance diaphragm gauges are of the single-sided dual-electrode design, where two capacitance electrodes are deposited onto a single ceramic disc, usually in a ‘bull’s eye’ configuration, located on the reference side of the device. This design minimises effects due to contamination and chemical reaction between the pressure medium and electrodes and permits the measurements with corrosive gases to be made.
Capacitance diaphragm devices are amongst the most common and versatile of transducers. They operate in the approximate pressure range 10-3 Pa to 107 Pa, and generally have good repeatability, linearity and resolution. They have high over-pressure capability and have an extended temperature range when used with remote electronics. When used as a vacuum gauge they have the advantage, compared with many other vacuum gauges, of only a weak gas species dependence � indeed this dependence is not an intrinsic property of the technique but is caused by thermal transpiration (see Further Reading for more detail). They can be larger than other transducers and can be more expensive.
Figure 5-10 Capacitance diaphragm gauge (capacitance manometer)
Signal from electrodes
Referencechamber
Diaphragm
Measurementchamber
1 mbar = 100 Pa; 1 bar = 0.1 MPa 22

Guide to the Measurement of Pressure and Vacuum
5.3.3.4 Linear variable differential transformers (LVDTs) Linear variable differential transformers (LVDTs) are inductive devices that act as position sensors and may be attached to a deflecting component such as a diaphragm or bellows [ 23 ]. They comprise a cylinder of ferro-magnetic material which is moved inside a tube which houses three separate windings. A central coil is excited with an alternating voltage and there are two sensing coils, one on either side. As the magnetic cylinder moves within the tube the magnetic field coupling is changed; with suitable electronics, which may include temperature compensation, a linear relationship between cylinder position and output can be obtained. The technique may be used to detect displacements from less than a millimetre to several hundreds of millimetres in specialist applications. Sensors of this type are used in pressure transducers operating between pressures of about 0.01 Pa to 10 MPa. The cylinder is attached to the centre of a diaphragm or the end of a bellows; it will add weight and possibly stiffness. Furthermore the remote end may need support. It may be more affected by acceleration and vibration than the capacitive equivalent and may have a lower frequency response. It is more commonly available as a gauge or differential device. Absolute units become more complex.
Secondarycoil
Secondarycoil
Core
Primarycoil
Corerod
Figure 5-11 LVDT gauge
5.3.3.5 Strain gauges Strain gauges are essentially devices whose electrical resistance changes when they are strained, by extending or compressing them. When bonded to, or embodied in, a diaphragm they can be used to measure the pressure-induced movement of the diaphragm (or other moving element) of a pressure sensor. The technique is very commonly used in pressure sensors and four such gauges are normally connected in a Wheatstone bridge circuit as shown in Figure 5-12. The phenomenon of a change in resistivity due to strain, induced by a mechanical force, is known as piezo-resistivity and is exhibited by most conductors and semiconductors. When a metal wire is stretched (strained) it becomes longer and thinner, and its resistance will increase by an amount related to geometry and piezo-resistivity. In this example it can be expressed as :
���R
RL
L�
(4)
Where: R is resistance of the wire
� is the constant of proportionality, known as the gauge factor L is the length of the wire.
The gauge factor is very much greater in semiconductors than in metals � typically about 50 times greater � because the piezo-resistive contribution to the gauge factor in semiconductors is very large. This makes them much more sensitive and suitable for use as strain gauges. Indeed, in the context of pressure measurement, the term piezo-resistivive sensor is normally assumed to refer exclusively to semiconductor devices. Bonded strain gauges are so-called because they are attached to the surface of pressure sensing elements, usually diaphragms. They may be metal foil, silicon, thin film or thick film. The performance of the instrument will depend not only on the strain gauge material but also on the quality of the adhesion and of the diaphragm.
Circuit
C A
D B
G
AB
CD
Figure 5-12 Strain gauge sensing
1 mbar = 100 Pa; 1 bar = 0.1 MPa 23

Guide to the Measurement of Pressure and Vacuum
Comparable performances can be achieved with many different designs and the best choice is made by matching the device’s characteristics to the user’s application. Strain gauges can also be attached to a strain member which is mounted rigidly at one end and connected at the other, via a rod, to the pressure sensing diaphragm. Monolithic piezo-resistive silicon devices are made using techniques similar to those used to produce integrated circuits and the complete diaphragms are made from silicon, with areas doped with boron to create strain gauges. The piezo-resistive constant of silicon (and other semiconductors) is determined by the doping level and the crystal axis. This is a common and economic way to produce pressure transducers. Silicon shows excellent elastic properties, right up to its point of fracture, and this results in high over-pressure capabilities and low hysteresis. Silicon has a similar strength to steel but the low mass of a silicon diaphragm gives it a faster response time and a low acceleration sensitivity. Such silicon sensors are often mounted in oil filled cavities, isolated from the pressurised media (and sometimes also isolated from the reference media) by thin metal diaphragms so that the pressure in media incompatible with silicon can be measured. The isolating diaphragm material is commonly stainless steel, but other materials are used where this is not suitable for the application. The isolation diaphragm greatly increases the number of applications for silicon based devices. The oil filled cavity also provides a degree of mechanical damping that can protect a transducer from ‘ringing’ (see sections 6.3.5 and 9.1.1). Strain gauge pressure transducers are available with a wide variety of signal conditioning options including 4 mA to 20 mA, 0 mV to 100 mV and 0 V to 5 V outputs. Strain gauge pressure sensors are commonly available with upper range pressures from about 1 kPa to 100 MPa and are produced in absolute-, gauge- and differential-mode versions.
5.3.3.6 Vibrating structures Vibrating structures are attached to deflecting elements, such as diaphragms, in such a way that deflection induces a change in their tension/compression thereby changing their resonant frequency. This is similar to an increase in tension in the string of a musical instrument causing the note produced to become higher. Because such devices can be made with extremely ‘sharp’ resonant frequencies it is possible to detect very small changes in the resonant frequency and hence in the pressure. In this implementation, an example of which is shown in Figure 5-13, the resonating element is not directly in the pressurised medium, but is behind or embedded in the deflecting component. If the resonating structure is exposed to the pressurised medium, the device’s pressure/frequency characteristics would be influenced to some degree by the density of the pressure medium. It should be noted that the density of a medium may be effected by humidity. The first type of sensors using this idea employed a thin vibrating wire stretched between, say the end of a bellows or centre of a diaphragm and a rigid member firmly attached to the base of the bellows or the edges of the diaphragm. Later variations have self supporting structures such as single or multiple beams to give high natural frequencies without pre-tensioning to improve stability over time. Structures made from crystalline quartz
give low hysteresis and small devices made by micro-machining techniques developed from the semiconductor industry are available. Applications for these devices tend to be where high precision is needed and the higher costs of complex electronics are offset by small size and ease of integration into digital control systems.
Referencevacuum
Drive electrodeSensing electrode
Figure 5-13 Resonant structure sensing
DiaphragmResonant structure
Models are available for pressures up to a few hundred MPa. Temperature compensation is required and the mechanical components may cause some attitude sensitivity.
1 mbar = 100 Pa; 1 bar = 0.1 MPa 24
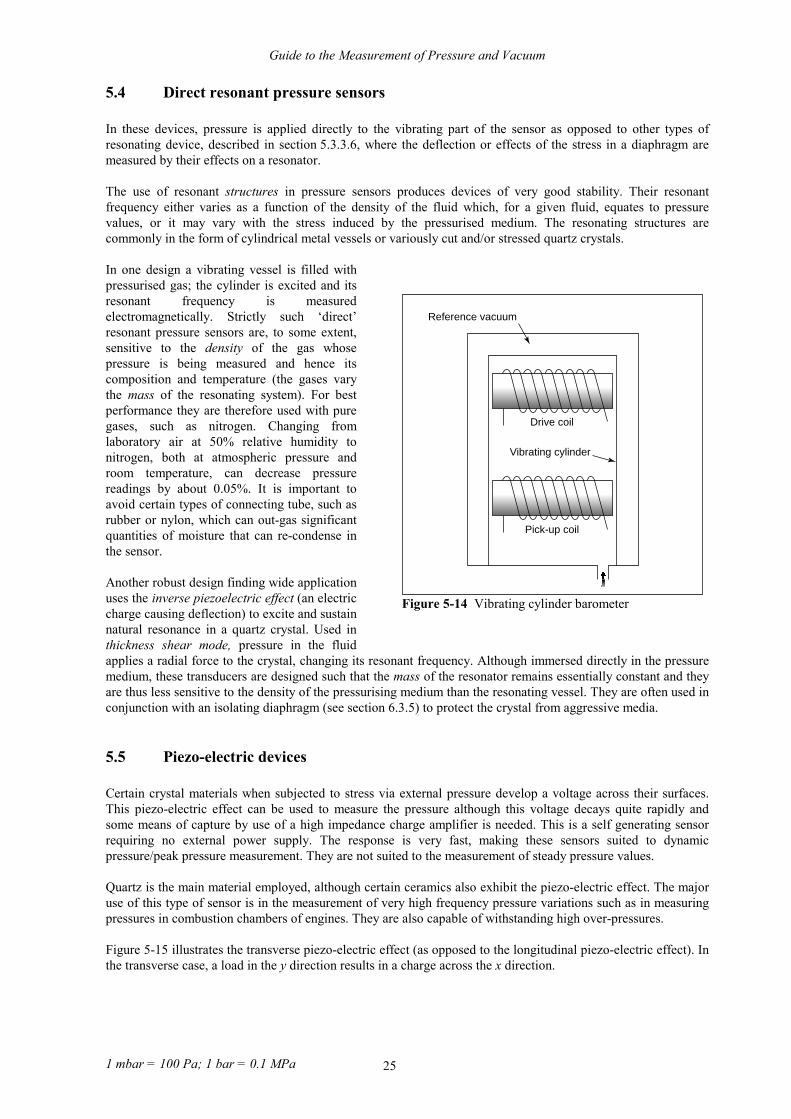
Guide to the Measurement of Pressure and Vacuum
5.4 Direct resonant pressure sensors In these devices, pressure is applied directly to the vibrating part of the sensor as opposed to other types of resonating device, described in section 5.3.3.6, where the deflection or effects of the stress in a diaphragm are measured by their effects on a resonator. The use of resonant structures in pressure sensors produces devices of very good stability. Their resonant frequency either varies as a function of the density of the fluid which, for a given fluid, equates to pressure values, or it may vary with the stress induced by the pressurised medium. The resonating structures are commonly in the form of cylindrical metal vessels or variously cut and/or stressed quartz crystals. In one design a vibrating vessel is filled with pressurised gas; the cylinder is excited and its resonant frequency is measured electromagnetically. Strictly such ‘direct’ resonant pressure sensors are, to some extent, sensitive to the density of the gas whose pressure is being measured and hence its composition and temperature (the gases vary the mass of the resonating system). For best performance they are therefore used with pure gases, such as nitrogen. Changing from laboratory air at 50% relative humidity to nitrogen, both at atmospheric pressure and room temperature, can decrease pressure readings by about 0.05%. It is important to avoid certain types of connecting tube, such as rubber or nylon, which can out-gas significant quantities of moisture that can re-condense in the sensor. Another robust design finding wide application uses the inverse piezoelectric effect (an electric charge causing deflection) to excite and sustain natural resonance in a quartz crystal. Used in thickness shear mode, pressure in the fluid applies a radial force to the crystal, changing its resonant frequency. Although immersed directly in the pressure medium, these transducers are designed such that the mass of the resonator remains essentially constant and they are thus less sensitive to the density of the pressurising medium than the resonating vessel. They are often used in conjunction with an isolating diaphragm (see section 6.3.5) to protect the crystal from aggressive media.
Figure 5-14 Vibrating cylinder barometer
Drive coil
Vibrating cylinder
Pick-up coil
Reference vacuum
5.5 Piezo-electric devices Certain crystal materials when subjected to stress via external pressure develop a voltage across their surfaces. This piezo-electric effect can be used to measure the pressure although this voltage decays quite rapidly and some means of capture by use of a high impedance charge amplifier is needed. This is a self generating sensor requiring no external power supply. The response is very fast, making these sensors suited to dynamic pressure/peak pressure measurement. They are not suited to the measurement of steady pressure values. Quartz is the main material employed, although certain ceramics also exhibit the piezo-electric effect. The major use of this type of sensor is in the measurement of very high frequency pressure variations such as in measuring pressures in combustion chambers of engines. They are also capable of withstanding high over-pressures. Figure 5-15 illustrates the transverse piezo-electric effect (as opposed to the longitudinal piezo-electric effect). In the transverse case, a load in the y direction results in a charge across the x direction.
1 mbar = 100 Pa; 1 bar = 0.1 MPa 25

Guide to the Measurement of Pressure and Vacuum
Simplified crystal structure
Loaded
Loaded
O
Si
Unloaded
++
++-
--
-
-+ -+X
+ -
Y
Charge
++++++
------
Figure 5-15 Transverse piezo-electric effect
5.6 Pressure balances and dead-weight testers Pressure balances are widely used for maintaining calculable pressures in a range extending from about 3 kPa (gas media, absolute- or gauge-mode) to 1 GPa (hydraulic, gauge-mode). Consisting essentially of finely machined pistons mounted vertically in very close-fitting cylinders, the internal pressure required to support the weight of the rotating piston and associated masses is calculated from the fundamental relationship between three quantities; mass, length and time:
pressureforcearea
m gA
� �
�
(5)
where m is the mass of the piston and associated masses, g is the local value of acceleration due to gravity and A is the effective area of the piston-cylinder combination, taken to be the area bounded by the neutral surface in the fluid between the piston and the cylinder. Strictly the equation gives the pressure value above that of the air surrounding the top of the piston and masses. Thus if the apparatus is surrounded by the atmosphere the pressure value calculated is a gauge pressure; if mounted in a vacuum chamber it is an absolute pressure. There is a small gap between the piston and the cylinder and when the piston rotates in the cylinder it is centralised by lateral forces in the pressure medium, thus avoiding contact between the piston and cylinder. If the gap between the piston and cylinder is too small the piston will not spin freely and frictional forces will introduce significant errors. If the gap is too large the pressure fluid will leak away rapidly causing the piston to ‘fall’ rapidly within the cylinder. Note that it is not necessary for the piston to rotate; in some designs it is the cylinder that rotates around the piston. Masses are generally loaded either directly on top of the piston or via an overhanging weight carrier; the latter lowers the centre of gravity and can improve pressure stability. Non-magnetic stainless steel is the preferred material for masses and weight carriers as it is more stable than other materials, such as brass or cast iron. Pressure balances are also known as piston gauges. When fitted with a means of pressure control, additional pressure ports and masses etc, the complete system is sometimes known as a dead-weight tester (see Figure 7-4). Not all practitioners differentiate between these terms and dead-weight tester is often used as a multi-purpose default description.
1 mbar = 100 Pa; 1 bar = 0.1 MPa 26
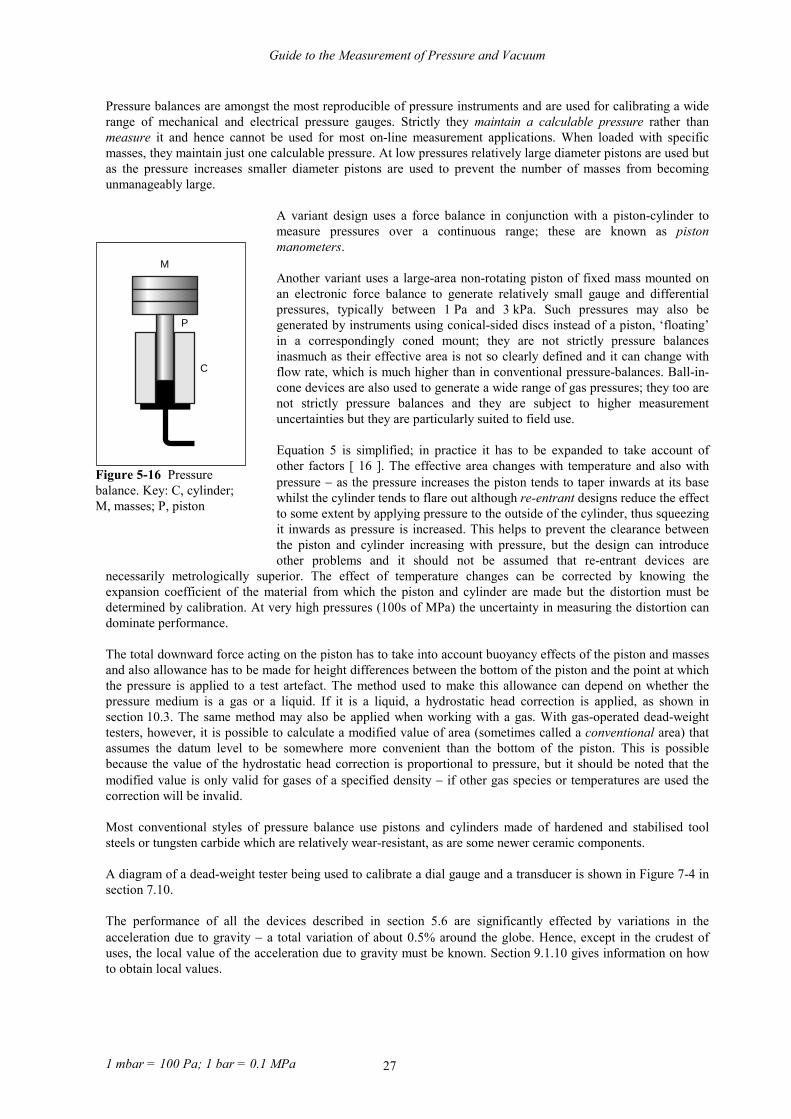
Guide to the Measurement of Pressure and Vacuum
Pressure balances are amongst the most reproducible of pressure instruments and are used for calibrating a wide range of mechanical and electrical pressure gauges. Strictly they maintain a calculable pressure rather than measure it and hence cannot be used for most on-line measurement applications. When loaded with specific masses, they maintain just one calculable pressure. At low pressures relatively large diameter pistons are used but as the pressure increases smaller diameter pistons are used to prevent the number of masses from becoming unmanageably large.
M
P
C
A variant design uses a force balance in conjunction with a piston-cylinder to measure pressures over a continuous range; these are known as piston manometers. Another variant uses a large-area non-rotating piston of fixed mass mounted on an electronic force balance to generate relatively small gauge and differential pressures, typically between 1 Pa and 3 kPa. Such pressures may also be generated by instruments using conical-sided discs instead of a piston, ‘floating’ in a correspondingly coned mount; they are not strictly pressure balances inasmuch as their effective area is not so clearly defined and it can change with flow rate, which is much higher than in conventional pressure-balances. Ball-in-cone devices are also used to generate a wide range of gas pressures; they too are not strictly pressure balances and they are subject to higher measurement uncertainties but they are particularly suited to field use. Equation 5 is simplified; in practice it has to be expanded to take account of other factors [ 16 ]. The effective area changes with temperature and also with pressure � as the pressure increases the piston tends to taper inwards at its base whilst the cylinder tends to flare out although re-entrant designs reduce the effect to some extent by applying pressure to the outside of the cylinder, thus squeezing it inwards as pressure is increased. This helps to prevent the clearance between the piston and cylinder increasing with pressure, but the design can introduce other problems and it should not be assumed that re-entrant devices are
necessarily metrologically superior. The effect of temperature changes can be corrected by knowing the expansion coefficient of the material from which the piston and cylinder are made but the distortion must be determined by calibration. At very high pressures (100s of MPa) the uncertainty in measuring the distortion can dominate performance.
Figure 5-16 Pressure balance. Key: C, cylinder; M, masses; P, piston
The total downward force acting on the piston has to take into account buoyancy effects of the piston and masses and also allowance has to be made for height differences between the bottom of the piston and the point at which the pressure is applied to a test artefact. The method used to make this allowance can depend on whether the pressure medium is a gas or a liquid. If it is a liquid, a hydrostatic head correction is applied, as shown in section 10.3. The same method may also be applied when working with a gas. With gas-operated dead-weight testers, however, it is possible to calculate a modified value of area (sometimes called a conventional area) that assumes the datum level to be somewhere more convenient than the bottom of the piston. This is possible because the value of the hydrostatic head correction is proportional to pressure, but it should be noted that the modified value is only valid for gases of a specified density � if other gas species or temperatures are used the correction will be invalid. Most conventional styles of pressure balance use pistons and cylinders made of hardened and stabilised tool steels or tungsten carbide which are relatively wear-resistant, as are some newer ceramic components. A diagram of a dead-weight tester being used to calibrate a dial gauge and a transducer is shown in Figure 7-4 in section 7.10. The performance of all the devices described in section 5.6 are significantly effected by variations in the acceleration due to gravity � a total variation of about 0.5% around the globe. Hence, except in the crudest of uses, the local value of the acceleration due to gravity must be known. Section 9.1.10 gives information on how to obtain local values.
1 mbar = 100 Pa; 1 bar = 0.1 MPa 27

Guide to the Measurement of Pressure and Vacuum
5.7 Multiplying and dividing techniques These ratiometric devices are based on combinations of co-axially linked piston-cylinder units similar to those employed in pressure balances; they either multiply or divide pressure by a factor which is related to the ratio of the piston-cylinder areas. In one design containing three co-axially linked piston-cylinder units, the middle piston has an effective area which is about 10 or 100 times greater than the upper and lower pistons. In operation, the mass of the three piston assemblies is balanced by an oil-operated pressure balance connected to the bottom surface of the lowest piston, with the pressure in the chambers between the pistons equalised. To generate a differential pressure, the pressure chambers are isolated and an appropriate mass is placed on the oil-operated pressure balance. When equilibrium is restored the pressure differential between the chambers is calculated from knowledge of the change in hydraulic pressure and the ratio of the dividers’ piston areas. Although normally used in association with pressure balances, they could be used with other sources of known reference pressures.
5.8 Miscellaneous pressure measurement techniques above 0.1 GPa For pressures in the range 0.1 GPa to 1 GPa the techniques employed in measuring pressure are essentially the same as those used at lower pressures. The main differences are that components must be made to withstand the higher pressures, safety becomes a greater consideration and the availability of working fluids becomes restricted. Over 1 GPa techniques change considerably and only a brief summary will be given here and interested readers are advised to consult some of the specialist texts given in the further reading recommendations [ 27 ] [ 28 ]. Pressure balances are available for pressures up to about 1.5 GPa although at these pressures the design is often of the controlled clearance type, where the gap between the piston and cylinder is varied by the application of a separate ‘jacket’ pressure. Research apparatus of this kind has been constructed for use at even higher pressures. The upper pressure limit of pressure balance techniques is usually met when the loss of fluid between the piston and cylinder becomes excessive and pressure cannot be maintained within the apparatus, or the fluid becomes non-isotropic. Resistivity pressure gauges have become the most popular and dependable of high pressure gauges since they cover a very wide range of pressure from about 0.1 GPa to 100 GPa and do not involve any elaborate equipment. The resistivity of metals changes as a function of temperature, pressure and composition. This results from the change in the electronic and structural arrangement of the atoms in the metal when pressure is applied. The pressure coefficient of resistance also depends on temperature such that although Manganin is the most extensively used alloy at room temperature, Zeranin is preferable for use at low temperatures. Manganin pressure gauges are constructed in their own high pressure enclosure which can be piped to the system under study in the same way as with strain gauge transducers. Hysteresis and ageing effects can both be significant. Bulk modulus cells use a rod of material, anchored at one end, subject to a triaxial stress which shortens the axial length of the rod. This results from the rod changing volume with pressure and the observation is therefore of the compressibility or bulk modulus of the rod. Electrical or optical methods are used to measure the change in axial length. Ultrasonic gauges allow the resonant frequency of an X-cut quartz crystal to vary as a function of pressure. Commercial instruments employing this principle are available which may be used to measure pressures of about 0.25 GPa.
1 mbar = 100 Pa; 1 bar = 0.1 MPa 28

Guide to the Measurement of Pressure and Vacuum
5.9 Thermal conductivity gauges
5.9.1 General The energy transfer from a hot wire through a gas can be used to measure the pressure. The heat is transferred into the gas by molecular collisions with the wire, ie by heat conduction and the rate at which the heat is transferred depends on the thermal conductivity of the gas. The performance of these instruments therefore has a strong gas composition dependence. In the low pressure region where there is molecular flow (Knudsen number larger than 3, where Knudsen number = mean free path/characteristic dimension of the system) the heat transfer is proportional to the pressure. When the number of molecules increase the gas becomes more dense and the molecules start to collide with each other more frequently. In this so-called transition region of the flow (or slip flow, 0.01 < Knudsen number < 3) the simple proportionality of the heat transfer to the pressure no longer is valid. At even higher pressures (Knudsen number < 0.01) the thermal conductivity is almost independent of the pressure. Here convective cooling of the hot surfaces is usually the dominant source of the heat transfer.
5.9.2 Pirani gauges The heat loss from a wire (typically 5 �m to 20 �m diameter) can be determined indirectly with a Wheatstone bridge circuit which both heats the wire and measures its resistance and therefore its temperature. There are two general types of heated element. The traditional and much more common configuration consists of a thin metal wire suspended in the gauge head. The other configuration is a micro-machined structure, usually manufactured from silicon covered by a thin metal film, such as platinum.
Gauge head
Circuit
GV
Figure 5-17 Pirani gauge
In the usual configuration, a thin metal wire, is suspended with at least one side electrically insulated in the gauge head and is exposed to the gas. Tungsten, nickel, iridium or platinum may be used for the wire. The wire is electrically heated and the heat transfer is electronically measured. There are three common operating methods: constant temperature method, constant voltage bridge, and the constant current bridge. All these methods indirectly measure the temperature of the wire by its resistance. The main disadvantage of using Pirani gauges is their strong gas composition dependence and their limited accuracy. The reproducibility of Pirani gauges is usually fairly good as long as no heavy contamination occurs. The measuring range of Pirani gauges is approximately from 10-2 Pa to 105 Pa, but the best performance is usually obtained between about 0.1 Pa and 1 000 Pa.
5.9.3 Convection enhanced Pirani gauges These gauges generally perform better at higher pressures than conventional Pirani gauges by measuring the heat transfer due to convection as well as conduction. They employ a thin wire that must be mounted horizontally (conventional Pirani gauges may be used in any orientation though it is recommended that they are positioned so that the wire is vertical). The wire, of similar dimensions to those used in conventional Pirani gauges, is usually located inside a concentric insulated cylinder, which is of larger diameter than the body of conventional Pirani gauges. In the pressure range 10-2 Pa to 103 Pa, the gauges may operate in the same way as in conventional Pirani gauges. However, at pressures in the range 103 Pa to 105 Pa, where convection is normally a significant heat
1 mbar = 100 Pa; 1 bar = 0.1 MPa 29
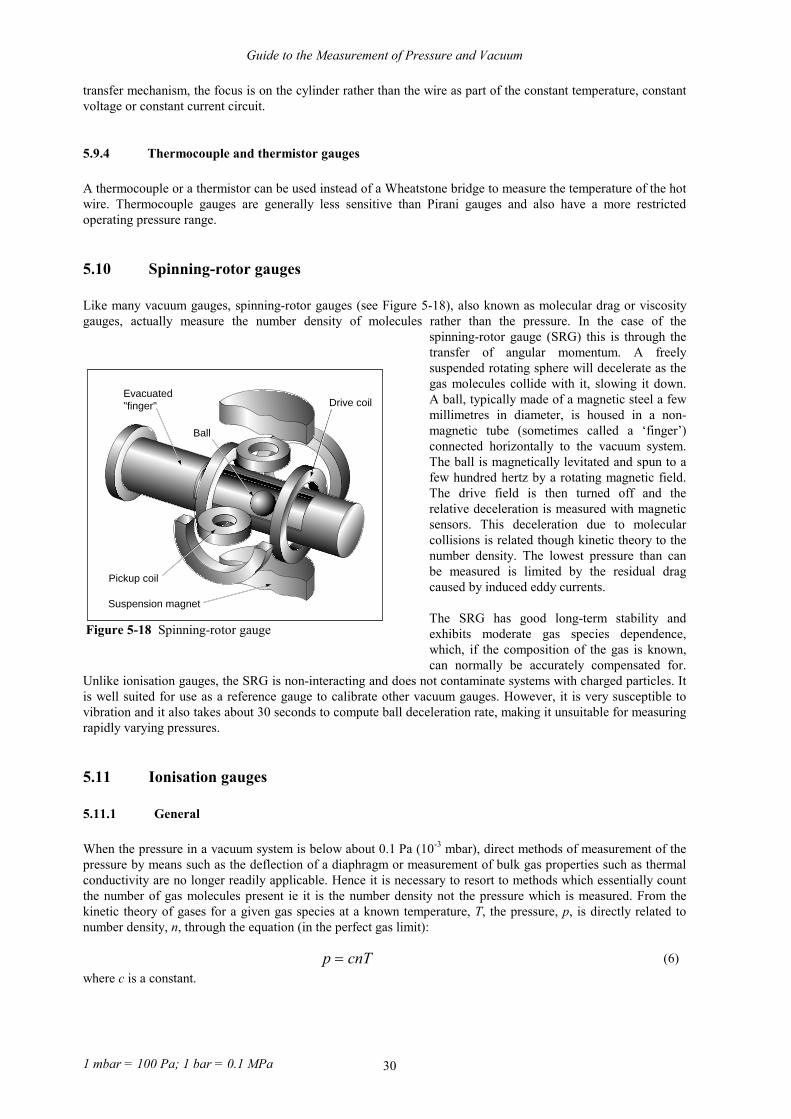
Guide to the Measurement of Pressure and Vacuum
transfer mechanism, the focus is on the cylinder rather than the wire as part of the constant temperature, constant voltage or constant current circuit.
5.9.4 Thermocouple and thermistor gauges A thermocouple or a thermistor can be used instead of a Wheatstone bridge to measure the temperature of the hot wire. Thermocouple gauges are generally less sensitive than Pirani gauges and also have a more restricted operating pressure range.
5.10 Spinning-rotor gauges Like many vacuum gauges, spinning-rotor gauges (see Figure 5-18), also known as molecular drag or viscosity gauges, actually measure the number density of molecules rather than the pressure. In the case of the
spinning-rotor gauge (SRG) this is through the transfer of angular momentum. A freely suspended rotating sphere will decelerate as the gas molecules collide with it, slowing it down. A ball, typically made of a magnetic steel a few millimetres in diameter, is housed in a non-magnetic tube (sometimes called a ‘finger’) connected horizontally to the vacuum system. The ball is magnetically levitated and spun to a few hundred hertz by a rotating magnetic field. The drive field is then turned off and the relative deceleration is measured with magnetic sensors. This deceleration due to molecular collisions is related though kinetic theory to the number density. The lowest pressure than can be measured is limited by the residual drag caused by induced eddy currents. The SRG has good long-term stability and exhibits moderate gas species dependence, which, if the composition of the gas is known, can normally be accurately compensated for.
Unlike ionisation gauges, the SRG is non-interacting and does not contaminate systems with charged particles. It is well suited for use as a reference gauge to calibrate other vacuum gauges. However, it is very susceptible to vibration and it also takes about 30 seconds to compute ball deceleration rate, making it unsuitable for measuring rapidly varying pressures.
5.11 Ionisation gauges
5.11.1 General When the pressure in a vacuum system is below about 0.1 Pa (10-3 mbar), direct methods of measurement of the pressure by means such as the deflection of a diaphragm or measurement of bulk gas properties such as thermal conductivity are no longer readily applicable. Hence it is necessary to resort to methods which essentially count the number of gas molecules present ie it is the number density not the pressure which is measured. From the kinetic theory of gases for a given gas species at a known temperature, T, the pressure, p, is directly related to number density, n, through the equation (in the perfect gas limit):
p cnT� (6) where c is a constant.
1 mbar = 100 Pa; 1 bar = 0.1 MPa 30
Ball
Evacuated"finger"
Pickup coil
Suspension magnet
Drive coil
Figure 5-18 Spinning-rotor gauge

Guide to the Measurement of Pressure and Vacuum
One of the most convenient methods to measure the number density is to use some technique to ionise the gas molecules and then collect the ions. Most practical vacuum gauges use electrons of moderate energies (50 eV to 150 eV) to perform the ionisation. The resulting ion current is directly related to pressure and so a calibration can be performed. This last statement will only be true over a finite range of pressures which will determine the working range of an instrument. The upper pressure limit will be reached when the gas density is sufficiently large that when an ion is created it has a significant probability of interacting with either neutral gas molecules or free electrons in the gas so that the ion is itself neutralised and cannot reach the collector. For practical purposes in typical laboratory systems or industrial plant this can be taken as 0.1 Pa (10-3 mbar). The lower pressure limit of a gauge will be reached when either electric leakage currents in the gauge head or measuring electronics become comparable to the ion current being measured or when another physical effect (eg influence of extraneous X-rays) gives rise to currents of this magnitude. For most of the gauges described within the Guide these limits lie below 10-6 Pa (10-8 mbar). The basic gauge equation for an ionisation gauge is:
I KnIc e� (7) Ic is the ion current K is a constant containing the probability of ionising a gas molecule by whatever means and the probability of collecting the resultant ion n is the number density of the gas molecules Ie is the ionising electron current.
The probability of ionising a gas molecule will depend on a variety of factors and hence the ionisation gauge will have different sensitivity values for different gas species. Most practical vacuum gauges use electron impact to ionise the gas molecules and this may be achieved by simply ‘boiling’ electrons off a hot wire filament and attracting them to some sort of electron collector. In passing from the filament to the collector, such electrons can interact with the electrons in the electron cloud around the nucleus of a gas molecule, ejecting one or more of them to form a charged ion. The ions are then attracted to a collector. Unfortunately, the probability of an electron ionising a gas molecule is so low in a single transit within a gauge of normal dimensions, that it is necessary to increase the electron path lengths and so increase the probability of any single electron creating an ion. Two methods are in widespread use. In a hot cathode ionisation gauge, the electrons produced at a hot filament are attracted to a highly transparent grid made from very thin wire and at a positive electrical potential. As the grid is so open there is a very strong probability that the electron will pass right through the grid and not strike a wire. If the grid is surrounded by a screen at a negative electrical potential, the electron will be repelled by this screen and be attracted back to the grid. This process can happen many times before the electron finally hits the grid and is lost. As a result very long electron paths can be achieved in a small volume. In contrast, the ions are attracted directly to the collector. The cold cathode ionisation gauge dispenses with the hot filament and uses a combination of electric and magnetic fields. Any electron will spiral around the magnetic field lines before it is eventually collected on the positively charged anode. In fact the path length will be so long and the ionisation probability so high that, once started, a self-sustaining gas discharge will be set up provided that the ions are quickly swept out of the discharge region by the ion collector. Although there are many variations on these two general types of gauge, the discussion is confined to the four types which are readily available commercially and are in widespread use, namely, the triode gauge, the Bayard-Alpert gauge, the Penning gauge and the inverted magnetron gauge.
5.11.2 Triode gauges This gauge was originally developed from the electronic valve. Electrons are emitted from a hot filament along the axis of the cylindrical grid (see Figure 5-19). The ions are created mainly inside the grid and are attracted to the cylindrical anode around the grid. The usual pressure range of the instrument is about 0.1 Pa to 10-6 Pa. A special design, the Schultz-Phelps gauge, can operate in the approximate range 10-2 Pa to 100 Pa.
1 mbar = 100 Pa; 1 bar = 0.1 MPa 31

Guide to the Measurement of Pressure and Vacuum
5.11.3 Bayard-Alpert gauges This is essentially a triode gauge turned inside out (see Figure 5-20). Here, the hot filament is outside the cylindrical grid. Ions are still created mainly inside the grid and are collected on an axial wire. Some of the electrons produced as a result of the ionisation of the gas molecules will generate X-rays when they hit the grid. X-rays hitting the collector may eject electrons from the surface and they will be indistinguishable from ions arriving at the collector. Due to the much smaller solid angle subtended by the collector wire fewer of the X-rays will strike the collector, resulting in a significantly lower pressure limit than for the triode gauge. This is the most common configuration for a hot filament ionisation gauge. The pressure range is roughly 0.1 Pa to 10-9 Pa.
_+
MR
B
N SA
C C
Figure 5-21 Penning gauge Key: A, anode; C, cathode; B, magnetic field; M, meter; N, S, magnets; R, resistor
G
FC
Figure 5-20 Bayard-Alpert gauge Key: C, collector; F, filament; G, grid
G
F
C
Figure 5-19 Triode gauge Key: C, collector; F, filament; G, grid
5.11.4 Penning gauges In this gauge electric and magnetic fields are established as shown in Figure 5-21. The anode (A) may take the form of a ring or cylinder. It might appear that the electric and magnetic fields are parallel in this configuration, but in fact when the discharge is set up the potential distribution is such that the axis of the gauge is at near the cathode potential so that the fields are in fact crossed. A gas discharge will start if the electric field is high enough (a few kV dc) for field emission of electrons to occur from one of the cathode plates (often a sharp point is provided to enhance this process) or if a cosmic ray causes an ionisation event in the gas in the gauge head. A miniature ultra violet light source can provide another means of starting the discharge by photo-emitting electrons from the gauge surfaces. Ions are collected on the loop anode. The pressure range is approximately 0.1 Pa to 10-7 Pa.
1 mbar = 100 Pa; 1 bar = 0.1 MPa 32
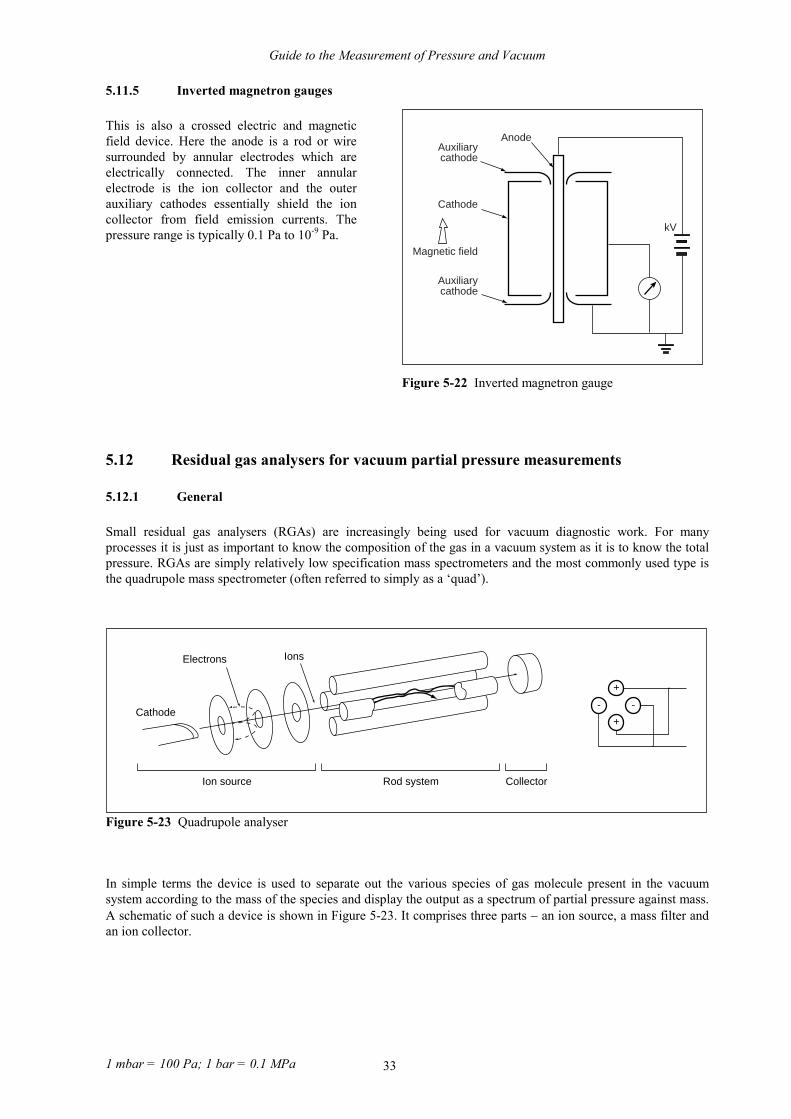
Guide to the Measurement of Pressure and Vacuum
5.11.5 Inverted magnetron gauges
Auxiliarycathode
Auxiliarycathode
Anode
Cathode
kV
Magnetic field
Figure 5-22 Inverted magnetron gauge
This is also a crossed electric and magnetic field device. Here the anode is a rod or wire surrounded by annular electrodes which are electrically connected. The inner annular electrode is the ion collector and the outer auxiliary cathodes essentially shield the ion collector from field emission currents. The pressure range is typically 0.1 Pa to 10-9 Pa.
5.12 Residual gas analysers for vacuum partial pressure measurements
5.12.1 General Small residual gas analysers (RGAs) are increasingly being used for vacuum diagnostic work. For many processes it is just as important to know the composition of the gas in a vacuum system as it is to know the total pressure. RGAs are simply relatively low specification mass spectrometers and the most commonly used type is the quadrupole mass spectrometer (often referred to simply as a ‘quad’).
Cathode
Electrons
Ion source Rod system Collector
Ions
+
+
- -
Figure 5-23 Quadrupole analyser
In simple terms the device is used to separate out the various species of gas molecule present in the vacuum system according to the mass of the species and display the output as a spectrum of partial pressure against mass. A schematic of such a device is shown in Figure 5-23. It comprises three parts � an ion source, a mass filter and an ion collector.
1 mbar = 100 Pa; 1 bar = 0.1 MPa 33
Guide to the Measurement of Pressure and Vacuum
5.12.2 The ion source This operates in a manner which is very similar to a Bayard-Alpert ionisation gauge (BAG) (see section 5.11.3) except that instead of the ions being collected on a wire, they are extracted axially by being attracted to a plate with a hole in it. They pass through the hole and are therefore injected at a known energy (determined by the potential on the extractor plate) into the mass filter. As the ion source is essentially a BAG, it has all the characteristics of such a gauge as described previously.
5.12.3 The mass filter This comprises four rods which are aligned parallel to the extraction axis of the ion source. The rods are connected together electrically in diametrically opposite pairs to form a quadrupole. An electrical potential comprising a dc potential and a superimposed radio-frequency (rf) potential at a few MHz is applied to these pairs. For a given dc and rf potential ratio only ions with a finite range of mass to charge ratios will be transmitted along the axis of the rod assembly. Those with higher or lower mass to charge ratios will be swept to the outside of the filter. By sweeping the amplitudes of the rf and dc potentials, from a low value to a higher value, whilst keeping the ratio of the amplitudes constant, ions of successively greater mass to charge ratio will pass through the filter and can be collected to form the mass spectrum. It should be noted that we often talk loosely about ‘mass’ when discussing such spectra instead of the more accurate term mass to charge ratio.
5.12.4 The ion collector This will usually take one of two forms, either a simple Faraday cup or plate detector or an electron multiplier, often a channeltron.
1 mbar = 100 Pa; 1 bar = 0.1 MPa 34
Guide to the Measurement of Pressure and Vacuum
6 DEVICE SELECTION
6.1 General Before attempting to select a pressure measuring instrument and identify a suitable supplier it is important to establish the selection criteria. They will include many factors and this section is designed to assist a potential user in making the choice. It covers the following issues in broad terms:
�� the pressure characteristics �� the characteristics of the pressure medium �� the external environment �� the physical characteristics of the instrument �� type of use �� safety �� installation and maintenance �� signal conditioning �� performance �� inconsistent use of terminology
but does not pretend to cover every conceivable pressure measuring application.
6.2 Pressure characteristics
6.2.1 Pressure mode, range and rating In selecting a suitable device it is important to consider whether an absolute-, gauge- or differential-mode measurement is required (see section 3.2) and the pressure range over which it is expected to operate. It may also be necessary to consider the pressure the device may be exposed to at other times. The maximum line pressure should also be considered in the case of differential-mode devices. The working range of an instrument should cover the expected range of pressures to be measured. Some devices perform better at certain points. Many instruments work best near the centre of their working range or away from the lower and upper limits. The maximum working pressure must be suitable, with a given safety margin for all pressures to be encountered including those possible when measurements themselves would not be taken. It should be noted that a device can often tolerate pressures outside its working range and it is important to check whether these affect the performance of the instrument or not. It should be noted that creep is more significant in metal than in silicon, quartz or ceramic components. The term over-pressure is sometimes used for this capability, but its meaning is not consistent between all manufacturers. Some vacuum gauges ie hot filament ionisation gauges, employ a safety mechanism which disconnects the power in the event of over-pressurisation. However, this should not be relied on as fail-safe as the response time may not be sufficiently quick in the case of a sudden in-rush of air. Line pressure collapse can destroy differential pressure cells. Incorrect operation of valves, or a physical failure on one side of a differential pressure system, can leave full line pressure on one side of a diaphragm and virtually no pressure on the other side � potentially causing serious damage. Depending on the design, some cells will survive this effect in either direction and some will only survive in a specified direction. Some may not survive at all. Careful quizzing of the manufacturers and their specifications is the only way to find out. Do not assume survival. Burst pressure is a much higher pressure than over-pressure and will generally result from a fault condition within the plant being monitored. Related more to safety than measurement it is concerned with confining the pressure media within the transducer. Some devices may be internally damaged beyond repair but still contain the pressure.
1 mbar = 100 Pa; 1 bar = 0.1 MPa 35
Guide to the Measurement of Pressure and Vacuum
Secondary containment may be employed to cope with the situation where the measuring component, the diaphragm or Bourdon tube itself fails, the pressure media reaches a chamber behind the failed component and that chamber is relied upon to contain the pressure. Sub-sea well-head or reservoir instrumentation companies place great emphasis on this parameter. In most instruments there is a case through which the electrical signals must pass and this is the area of weakness. Specially fired glass/ceramic seals can be made to withstand over 250 MPa differential pressure and the case thickened to suit. Higher values are available from specialist suppliers.
6.2.2 Pressure fluctuation Fluctuating or pulsating pressures are one of the most common causes of failure of pressure instruments. Often these pressure spikes are undetected so the user may be unaware of their existence. Materials, when repeatedly stressed will survive a number of cycles without apparent change but when subjected to many cycles will suddenly fail. A simple example of this phenomenon is the breaking of a paper clip by repeated folding. The materials that are used as deforming elements in pressure sensing are selected to show resilient fatigue properties. Normally specifications are given in terms of the number of pressure cycles, from zero to full rated pressure and back to zero, that a device would be expected to survive. Very large number of pressure cycles may be encountered. For example, gear pumps tend to generate high pressure pulses which can be close to twice the running pressure as indicated by a slow responding indicator. The sensing element may, however, be exposed to the full pressure peaks and, if they are equal to the nominal pressure range, failure may come quite quickly. In less than four hours a five toothed gear pump running at 3 000 rpm will have generated 3 million pulses. It is worth noting that pressures in excess of the nominal rated pressure dramatically reduce the time before fatigue failure occurs. Sometimes pressure fluctuates slowly, sometimes very quickly and you may wish to measure these variations or not. Indeed, whilst the overall system may be unable to indicate that the pressure is fluctuating the sensing element may be following the full changes and suffering in the process. A fast acting piezo-electric sensor can respond to pressures varying tens of thousands times a second but the amplifier driving a digital indicator may have considerable electronic dampening to render an ‘average’ pressure and hence a readable steady reading. The characteristics of the pressure and whether the pressure wave form, the peak pressure or the ‘average’ pressure is of interest must be assessed before a specific type of pressure measuring instrument can be selected. To follow rapid changes in pressure the piezo-electric devices cannot be bettered, followed by the semiconductor and thin film diaphragm designs. Slowest of all in response will be capsules and bellows-based devices. However, it may be that the natural integration offered by these devices provides a smoothing of the pressure spikes which may actually be preferable. The effects of these spikes can be reduced by the use of snubbers and/or damping volumes. Alternatively use of higher pressure rating equipment may be advisable.
6.3 Media characteristics
6.3.1 General The pressure medium must be compatible with the parts of the pressure measuring instrument with which it is in direct contact. Choice of suitable materials is important. For example, stainless steels and high nickel alloys such as Monel 400 may be required because of their superior media compatibility compared with traditional copper alloys. It is often overlooked that these restrictions also apply to sealing devices, such as ‘O’ rings, used to connect the device to the system.
6.3.2 Operating temperature Both the maximum and minimum operating temperatures should be considered unless specific steps are made to control the temperature to which the instrument is exposed. If the temperature of the medium exceeds the instrument rating then various fittings can be introduced between the source and the sensor to allow either
1 mbar = 100 Pa; 1 bar = 0.1 MPa 36

Guide to the Measurement of Pressure and Vacuum
dissipation from or absorption of heat into the medium. A few tens of millimetres of small bore stainless steel piping can drop several hundreds of degrees between say a powerful diesel engine case and a transducer in a cooling air draught. Many devices can cope with temperatures up to 85 °C. Above 150 °C instruments become specialised. Non-operating high temperature system flushes for cleaning or sterilisation processes will also need to be tolerated. If the temperature conditions are such that a change of phase such as solidification may take place, then this may have a catastrophic effect and special preventative measures may be required.
6.3.3 Corrosion and deposition Instruments can be obtained in a large variety of materials ranging from plastic, various grades of brasses, steels and complex nickel-based alloys, ceramics and glasses. If the media can be contained by a given material, then an instrument can normally be made of that material, though perhaps at increased cost. Generally, however, only preferred materials are used to produce sensors, with isolating procedures employed where necessary. Even if devices are described as ‘corrosion resistant’, it should always be checked exactly what the materials are corrosion resistant against. This is especially important where mixtures are involved, and also it should be remembered that corrosion is temperature dependent and if the operating temperature is significantly higher then the corrosion will also be potentially more significant. In some applications it is necessary to consider the effect of deposition of material within the sensor. Whilst the material may not be corrosive, it can cause damage to the sensor, change its performance or produce conducting paths between otherwise electrically isolated elements causing malfunction.
6.3.4 Density dependence Instruments that are density dependent will need to have correction factors applied to give meaningful results. This is particularly important for ionisation and thermal conductivity vacuum gauges and for some resonant frequency devices where the vibrating element is located directly in the operating medium. Some processes, such as semi-conductor manufacturing, require the measurement of a range of process gases. If a gauge is to be used on media of varying or unknown compositions then other techniques would be more appropriate.
6.3.5 Isolation diaphragms
In cases where the pressure medium is not compatible with the exposed sensor material, an isolating diaphragm typically made of stainless steel, Inconel, Hastalloy etc, is used to transfer the pressure to the sensing diaphragm through an oil filled cavity, so that the pressure medium is in contact with the isolation diaphragm and not the sensing diaphragm, as shown in Figure 6-1. This results in a device which can be used to measure pressure in relatively hostile media without an appreciable degradation of performance, although an increase in response time may be observed.
Isolationdiaphragm
Measurementdiaphragm
Oil-filledcavity
Figure 6-1 Isolation diaphragm
Instruments incorporating a built-in isolation diaphragm will have better temperature performance than systems with extra sections added separately because of the volume of oil involved.
1 mbar = 100 Pa; 1 bar = 0.1 MPa 37

Guide to the Measurement of Pressure and Vacuum
6.4 External environment
6.4.1 External pressure Whilst most instruments will be subjected only to variations in atmospheric pressure and may well have a vented case, some, such as sub-sea depth gauges or oil reservoir sensors, may see external pressures which are up to or even well in excess of that seen by the sensor. In extreme circumstances these high pressures may induce stresses in the device which could modify the stress pattern around the sensing element and give rise to additional errors in the reading.
6.4.2 External media Although many instruments will be working in ambient air, this may be contaminated with moisture or corrosive vapours (eg sea spray). These may be factors in selecting the appropriate housing for the instrument rather than the sensor itself. Immersed locations need careful consideration, particularly where corrosion is a risk. Great care in selection is needed where aggressive fluids combine with high pressures and high temperatures, such as in oil and gas reservoirs. British Standard BS EN 60529 : 1992 [ 10 ] defines several classes of protection of instruments covering ingress of water and dust, access to electrical live parts and impact resistance. The degree of protection is given as an IP rating comprising two or three numbers that correspond to defined levels of protection, but some care should be taken in their interpretation. Protection against hostile environments can make accurate pressure measurements difficult.
6.4.3 External temperature Whilst the operating temperature range may well be known, consideration should be given to the influence of nearby heat sources. A large machine, such as a diesel engine for example, can have air around it which is much hotter than the measured ambient temperature. An additional factor, often overlooked, is that in use an instrument may be subjected to forced cooling which ceases once the heat source is turned off, causing its temperature to rise considerably. The converse can also be true; for example, consider an instrument on an engine being used in Arctic conditions where the loss of engine heat plunges the instrument temperature to the lowest ambient temperatures. Thus both maximum and minimum temperatures should be considered. Where temperature gradients occur, it is important that the sensing element of the instrument and any temperature compensating thermometer are close to one another. Non-operational temperature where specified will be wider than the normal operating temperature of an instrument. Temperature excursions outside of those limits can cause serious errors in performance. Temperature in storage is not normally a problem but should not exceed the limits of non-operational temperature. It may be necessary to mount particularly sensitive equipment in a temperature controlled environment, either a purpose-built equipment enclosure or even an air-conditioned room. In many high vacuum applications it is necessary to bake the system, including gauges, to temperatures approaching 250 �C. The gauges, cables etc should be selected to withstand such temperatures.
6.4.4 Vibration Some instruments are more sensitive to vibration than others and it is important to ensure that the device selected is sufficiently insensitive to the frequency and amplitude of vibrations in the intended location. For example, spinning-rotor gauges can be particularly sensitive to environmental frequencies close to 400 Hz � their rotation frequency. Some devices, such as dead-weight testers, are sensitive to very low frequency vibrations, such as those found, for example, on a ship slowly moving up and down in swell or on an oil production platform. Manufactures data may give advice about such conditions but this often relates to the survival of the instrument, not the errors likely to be induced.
1 mbar = 100 Pa; 1 bar = 0.1 MPa 38

Guide to the Measurement of Pressure and Vacuum
6.4.5 Electromagnetic considerations Electromagnetic interference is included in the CE marking requirements for instruments sold in Europe and covers both the effects of radiation from other equipment and radiation from the device in question. CE marked products and specially developed aerospace devices are often hardened to withstand electromagnetic interference. Nuclear radiation is harmful to electronics and cabling in general and to semi-conductors in particular. The sensing element may well be unaffected but the electronic components used to compensate or amplify the signal may be affected over a period of time. Simple sensors, without active electronic components are most likely to tolerate such radiation. Electrical isolation is generally required between the sensing system, which would include any electronics, and the case which is normally expected to be at ‘earth potential’ which itself may vary considerably around an electrical power generation plant.
6.5 Physical characteristics General robustness of the product should be considered in the knowledge of the intended use and environment. This is particularly important if high pressure water jets, corrosive cleaning and technicians’ boots and hammers are likely to be nearby. The proximity of any welding may be another reason to opt for a robust device. A commercial test of robustness consisting of a number of falls in a random attitude from 1 metre onto a solid steel plate is performed on many instruments. Linear acceleration tests may be performed in a centrifuge where the g levels can be varied at will and held steady while measurements are made of any induced errors. Stiff pressure sensing components without other items attached, such as strain gauged sensors and single diaphragm designs, are often the most robust. Cold cathode ionisation gauges are considerably more robust than the hot filament ionisation gauges. It should also be born in mind that long integral cables are difficult to handle when trying to screw a transducer into a pressure tapping point and damage to cable or sealing can occur. The size and weight of devices may be important criteria in certain applications.
6.6 Type of use Where the instrument is to be used to provide traceable measurements it should be noted that the cost of recalibration and repeated analysis of measurement uncertainties can be significantly greater than the cost of the instrument. This effect becomes greater if the inherent characteristics of the instrument are only just adequate for the purpose. It can therefore be advisable to purchase an instrument of higher specification than initially considered appropriate. Indication rather than precise measurement implies a lower degree of accuracy and/or a relatively static application with manual control. Many instruments are not self indicating in the manner of the Bourdon gauge type but rely on electrical signals being converted to analogue or digital displays that can be remotely positioned. In control applications the instrument’s output (generally an electronic signal) is used directly as the control signal via a suitable converter to drive a regulating device. Typically this may be a pump, followed by a valve, with the pressure down stream being monitored and the resultant signal being used by the set point controller to adjust the valve opening to maintain a constant pressure. Pressure measurement often plays an important role in custody transfer applications � such as gas flow along pipelines � and special considerations may be necessary.
1 mbar = 100 Pa; 1 bar = 0.1 MPa 39

Guide to the Measurement of Pressure and Vacuum
Certain products may be used in safety critical applications and modes of failure as well as overall estimates of reliability must be considered. In addition to this, certain physical areas within a plant may have specific safety requirements and be classified as such. For example, flameproof enclosures that are designed to prevent ignition spreading to the gas/vapour surrounding the enclosure, or energy limitation techniques that limit the electrical spark energy and surface temperatures of components in a hazardous area may be required. Only certain equipment with appropriate certification may be used in hazardous areas and then only under very carefully controlled circumstances using defined methods of installation and use.
6.7 Installation and maintenance
6.7.1 Orientation Many instruments are sensitive to their orientation or attitude, but some more than others. Generally mechanical deflection devices designed for very low pressures have low stiffness structures for the deflecting element and often significant masses associated with the sensing part. This combination produces a system that is orientation sensitive, will have a low frequency response and may be somewhat fragile, requiring care in shipping and installation. Large bellows or capsule LVDT systems have low stiffness and high sensor mass making them sensitive to attitude, vibration and shock. With all instruments, consideration should be given to mounting the instrument in an orientation which reduces or eliminates the chance of material being deposited within the sensor. It should be noted that instruments should also be calibrated in this same preferred orientation. Some vacuum instruments, such as spinning-rotor gauges, may only be mounted in one orientation. Other gauges, for example ionisation gauges, may be mounted in any orientation, but horizontal mounting can result in physical distortion within the gauge and hence changes in the gauge’s characteristics. Certain devices need to be kept level or vertical and the mounting system needs to be designed appropriately. Large-bore mercury columns and dead-weight testers are examples and, if used above ground-floor level, care should be taken to ensure that the natural diurnal tilt of the building does not introduce significant error. (See sections 9.1.9 and 9.3).
6.7.2 Installation and mounting The cost of installing an instrument can be significant and must be part of the overall assessment of selection. For example, if a device is to be operated remotely and at some distance, the cost of signal transmission may be greater than the cost of the instrument. Many instruments are small enough to be mounted directly via a screwed pressure port and suffer little or no degradation in performance provided that installation is carried out according to the manufacturers recommendations. Over-tightening of securing bolts can impart a strain in the housing of some devices which may be transferred to the sensor causing an error. Some devices, eg Bourdon tube dial gauges, are large and suit wall mounting remote from the pressure source with pressure piped to the device. Between these two extremes lie many options. The ease and cost of adapting electrical outputs and cabling to suit local requirements should be considered at the selection stage; later adaptations, perhaps to facilitate removal for repair or calibration, can be expensive. Mounting systems may need to be designed to ensure that any orientation requirements are fulfilled (see section 6.7.1) Advice on the installation of vacuum gauges is given in section 9.4.1.
1 mbar = 100 Pa; 1 bar = 0.1 MPa 40
Guide to the Measurement of Pressure and Vacuum
6.7.3 Re-calibration and servicing Re-calibration can be a costly exercise and unless carried out on a well defined basis the validity of the data obtained can be suspect. The frequency of calibration will depend in part on the drift characteristics of the device and on the accuracy requirements of the application (see section 7.4). Every instrument is different as is every application. It is up to the user to determine the need for and frequency of recalibration. This can be achieved by analysis of recorded results from repeated calibration, taking into account the use and associated ambient conditions. If a transducer will need to be regularly removed for calibration, consideration should be given as to the method of cabling used. Plugs and sockets are probably easiest to use but may be more costly than integral cabling and a local junction box. Calibration should consider the whole measurement system not just the transducer. If the device needs to be removed, as is normally the case, consideration should be given to cable disconnection and to disconnection of the device from the pressure source. This might be particularly important if ,for example, the plant must remain in continuous operation, the pressure cannot be allowed to approach atmospheric pressure, or the medium may be hazardous. The use of isolating valves must be carefully evaluated as some types of valve can close off and trap some of the pressure medium. If the medium is liquid and if the tightening of the valve further reduces the trapped volume, the pressure will rise dramatically and could easily cause damage by exceeding the over-pressure limit of the instrument. Changes in temperature of the trapped volume can aggravate this situation.
6.8 Signal conditioning, outputs and displays
6.8.1 General When selecting pressure measuring equipment it is important to consider which methods of displaying, transmitting and recording pressure values are appropriate to the application, and also the degree of signal conditioning that is required.
6.8.2 Signal conditioning Most pressure measuring systems, mechanical or electrical, employ signal conditioning in one form or another. This is essentially the act of converting a ‘raw’ output signals to ones which vary with pressure changes in a fashion that is more useful to read or easier to transmit. For example, the initial output from a pressure sensor may be very small, have insufficient power or physical displacement to drive a meter or display directly, be non-linear or need scaling and signal conditioning can be used to amplify, linearise or re-scale respectively. Conditioning may also be applied to compensate for changes in operating temperature, secondary pressure effects etc. The most familiar pressure indicator is probably the traditional mechanical Bourdon tube dial gauge (see Figure 5-7) and its initial signal � movement of the ‘end piece’ as its tube unfolds � is both amplified and scaled by a lever, a rack and pinion, and a pointer. Electronic sensors and systems allow a much greater range of conditioning functions than mechanical sensors, particularly those employing microprocessors and, in the case of so-called smart devices with built-in microprocessors, the nature of the conditioning can easily be altered. For example, if a device is designed to measure pressures up to, say, 100 MPa but is to be used in a system with a maximum pressure of only 10 MPa, its output may be re-scaled to be electrical full-scale at 10 MPa. Note that whilst this tactic may change the device’s electrical output, it does not change the sensor’s mechanical characteristics. The use of built-in electronic components can restrict the temperature range to which the sensor can be exposed.
6.8.3 Outputs and displays Options for outputs and displays depend to a large degree on the relative positions of the sensor, control electronics and display, and on the environment in which they are to be used.
1 mbar = 100 Pa; 1 bar = 0.1 MPa 41
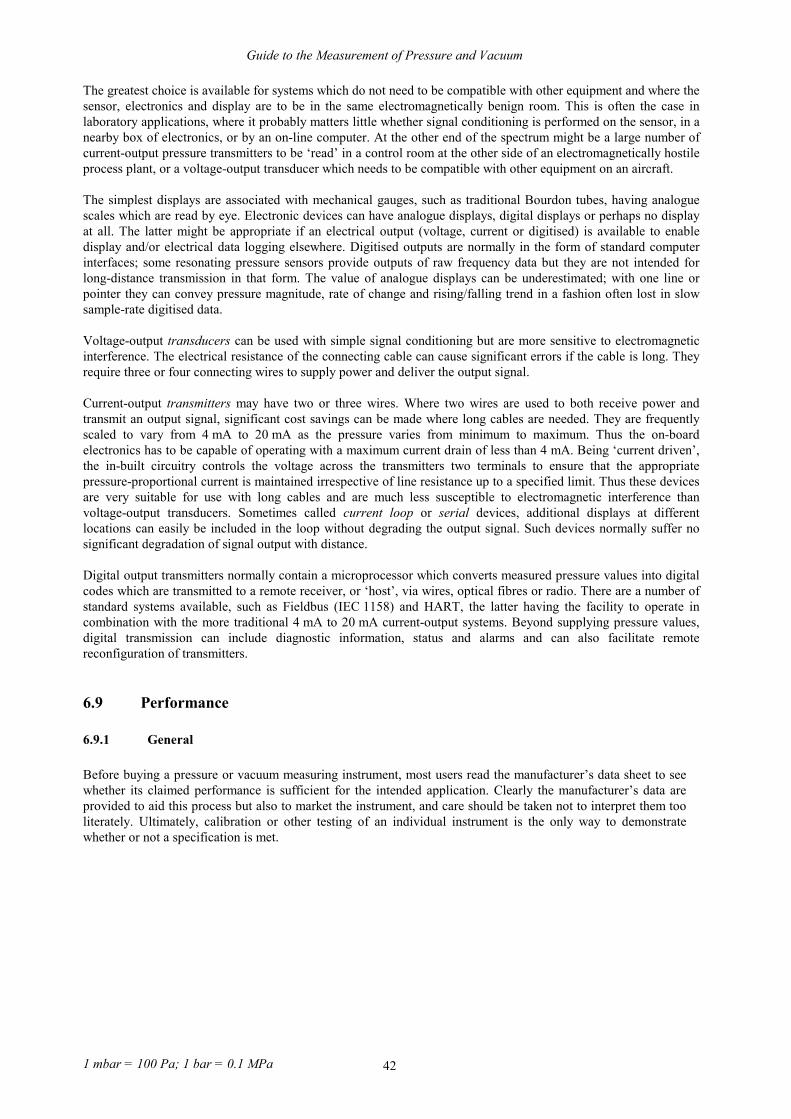
Guide to the Measurement of Pressure and Vacuum
The greatest choice is available for systems which do not need to be compatible with other equipment and where the sensor, electronics and display are to be in the same electromagnetically benign room. This is often the case in laboratory applications, where it probably matters little whether signal conditioning is performed on the sensor, in a nearby box of electronics, or by an on-line computer. At the other end of the spectrum might be a large number of current-output pressure transmitters to be ‘read’ in a control room at the other side of an electromagnetically hostile process plant, or a voltage-output transducer which needs to be compatible with other equipment on an aircraft. The simplest displays are associated with mechanical gauges, such as traditional Bourdon tubes, having analogue scales which are read by eye. Electronic devices can have analogue displays, digital displays or perhaps no display at all. The latter might be appropriate if an electrical output (voltage, current or digitised) is available to enable display and/or electrical data logging elsewhere. Digitised outputs are normally in the form of standard computer interfaces; some resonating pressure sensors provide outputs of raw frequency data but they are not intended for long-distance transmission in that form. The value of analogue displays can be underestimated; with one line or pointer they can convey pressure magnitude, rate of change and rising/falling trend in a fashion often lost in slow sample-rate digitised data. Voltage-output transducers can be used with simple signal conditioning but are more sensitive to electromagnetic interference. The electrical resistance of the connecting cable can cause significant errors if the cable is long. They require three or four connecting wires to supply power and deliver the output signal. Current-output transmitters may have two or three wires. Where two wires are used to both receive power and transmit an output signal, significant cost savings can be made where long cables are needed. They are frequently scaled to vary from 4 mA to 20 mA as the pressure varies from minimum to maximum. Thus the on-board electronics has to be capable of operating with a maximum current drain of less than 4 mA. Being ‘current driven’, the in-built circuitry controls the voltage across the transmitters two terminals to ensure that the appropriate pressure-proportional current is maintained irrespective of line resistance up to a specified limit. Thus these devices are very suitable for use with long cables and are much less susceptible to electromagnetic interference than voltage-output transducers. Sometimes called current loop or serial devices, additional displays at different locations can easily be included in the loop without degrading the output signal. Such devices normally suffer no significant degradation of signal output with distance. Digital output transmitters normally contain a microprocessor which converts measured pressure values into digital codes which are transmitted to a remote receiver, or ‘host’, via wires, optical fibres or radio. There are a number of standard systems available, such as Fieldbus (IEC 1158) and HART, the latter having the facility to operate in combination with the more traditional 4 mA to 20 mA current-output systems. Beyond supplying pressure values, digital transmission can include diagnostic information, status and alarms and can also facilitate remote reconfiguration of transmitters.
6.9 Performance
6.9.1 General Before buying a pressure or vacuum measuring instrument, most users read the manufacturer’s data sheet to see whether its claimed performance is sufficient for the intended application. Clearly the manufacturer’s data are provided to aid this process but also to market the instrument, and care should be taken not to interpret them too literately. Ultimately, calibration or other testing of an individual instrument is the only way to demonstrate whether or not a specification is met.
1 mbar = 100 Pa; 1 bar = 0.1 MPa 42

Guide to the Measurement of Pressure and Vacuum
Below are some of the terms, as typically found on manufacturers’ data sheets, used to describe instrument performance:
�� accuracy, uncertainty, ‘within specification’ and ‘total error band’ �� range, rangeability and span �� resolution �� repeatability �� reproducibility and drift �� non-linearity �� hysteresis �� response time �� temperature coefficient �� line pressure effects �� zero offset.
The list is not exhaustive, although it does indicate the most important characteristics to consider when selecting an instrument. Practical considerations such as dimensions, power supplies and output signals, may be very significant and should be carefully considered if the instrument is to meet its working requirements.
6.9.2 Accuracy, uncertainty ‘within specification’ and ‘total error band’ The word accuracy is frequently encountered when selecting a measuring device but it is often misused or misunderstood. Device selection should not be based on specified accuracies alone. In considering pressure measuring equipment, the words accuracy and uncertainty are often confused but the differences are significant, particularly at the performance limits of modern pressure measuring equipment In metrological circles the older word is accuracy and it is said to be the closeness of the agreement between the result of a measurement and a true value of the pressure. The weakness in this definition is its presumption that a true value can be known perfectly as, even in the finest national laboratories, perfect values cannot be realised; ultimately, it is not possible to make perfect measurements. The uncertainty of a measurement is a “parameter, associated with the result of a measurement, that characterises the dispersion of values that could reasonably be attributed to the measurand”. It is typically expressed as a range of pressure values in which the pressure value is estimated to lie, within a given statistical confidence, but it does not attempt to define uniquely a ‘true’ value. Thus accuracy is somewhat cruder than uncertainty. But an accurate device sounds more impressive than an uncertain one and so, whilst metrologists prefer the more correct term, sales departments continue to describe devices in terms of their claimed accuracy. Unfortunately the word accuracy is also occasionally used to mean something like ‘the difference between the uncorrected result of a measurement and an arbitrary round-number true value’. This meaning varies and is best clarified. The phrase within-specification does not have a formal definition but is generally taken to mean that, under certain conditions (not always specified!), the largest errors detected in the readings of an instrument were no greater than published figures. The conditions under which the test was made, however, may not have taken into account all the factors that can influence a measurement. The meaning of the phrase total error band is similar to within-specification. Again, the method used to calculate the total error band is rarely stated and statistical confidence limits are usually missing; this makes it very difficult to embody such figures in a properly constructed uncertainty budget.
1 mbar = 100 Pa; 1 bar = 0.1 MPa 43
Guide to the Measurement of Pressure and Vacuum
6.9.3 Range, rangeability and span The word range has two formal and rather wordy meanings; the measuring or working range is said to be a “set of values of measurands for which the error of a measuring instrument is intended to lie within specified limits” whilst the nominal range refers to “indications obtainable with a particular setting of the controls of a measuring instrument”. In practice it means the minimum and maximum pressures between which the device will work properly and provide a useful measurement signal. This definition is synonymous with span. It does not necessarily define the minimum and maximum pressures to which the device may be exposed without significant harm. For example, most vacuum gauges only work over a range of low pressures but it is expected that they will tolerate exposure to atmospheric pressure (significantly outside their measuring ranges), although not necessarily whilst switched on. Rangeability is a facility which enables the amplification, and possibly the offset, of a device’s output signal to be adjusted electronically to suit different pressure ranges. For example, some capacitance diaphragm gauges operate over several decades of pressure values giving an output voltage which varies linearly with pressure. Thus with a full-scale output of, say, 10 volts, adequate resolution at the lowest pressures may demand electrical measurement at the microvolt level. By re-ranging, with additional amplification of, say, 10 or 100 the voltages become larger and more practical. With the additional amplification, however, no useful signal will be available at higher pressures, although no damage will be done to the device. Note that this function does not change the inherent physical characteristics of the sensor. The extent of available adjustment is sometimes known as the turndown ratio. Making such adjustments will alter the uncertainty of the measurements obtained, possibly significantly. To achieve the lowest measurement uncertainties, devices should be calibrated in the configuration in which they are to be used.
6.9.4 Resolution Resolution is defined as the “smallest difference between indications of a displaying device that can be meaningfully distinguished”. It is important not to confuse the resolution of a display alone with the resolution of a pressure measuring system which incorporates a display; the system will have less (poorer) resolution than the display alone. Also, resolution is not synonymous with uncertainty � if the uncertainty of a pressure measuring system has been properly evaluated it will include a component for resolution but there will be other factors which will increase the uncertainty (reduce the accuracy) beyond that simply due to resolution.
6.9.5 Repeatability (of results of measurements) Repeatability is defined as the “closeness of the agreement between the results of successive measurements of the pressure carried out under the same conditions of measurement” where the conditions include the procedure, observer, instrument, conditions, location and a short period of time. It is normally quantified in terms of the standard deviation of a number of readings.
6.9.6 Reproducibility (of results of measurements) and drift Reproducibility is defined as the “closeness of the agreement between the results of measurements of the pressure carried out under changed conditions of measurement”, where the changes may include procedure, observer, instrument, conditions, location and may refer to measurements carried out over a long period of time. When such a timescale is the only change made between measurements, the meaning of reproducibility equates closely to that of drift, defined as the “slow change of a metrological characteristic of a measuring instrument”. Quantification of reproducibility and drift normally involves comparing a set of before and after measurements and expressing the change in the form of a normalised standard deviation. Drift is often expressed in terms of a change in pressure characteristic per unit time and the figures are often adjusted to suit an intended recalibration interval. It should be noted, however, that interpolating within or extrapolating from drift values calculated from a small number of data sets (especially just two!) can be metrologically weak and lead to significant mistakes.
1 mbar = 100 Pa; 1 bar = 0.1 MPa 44
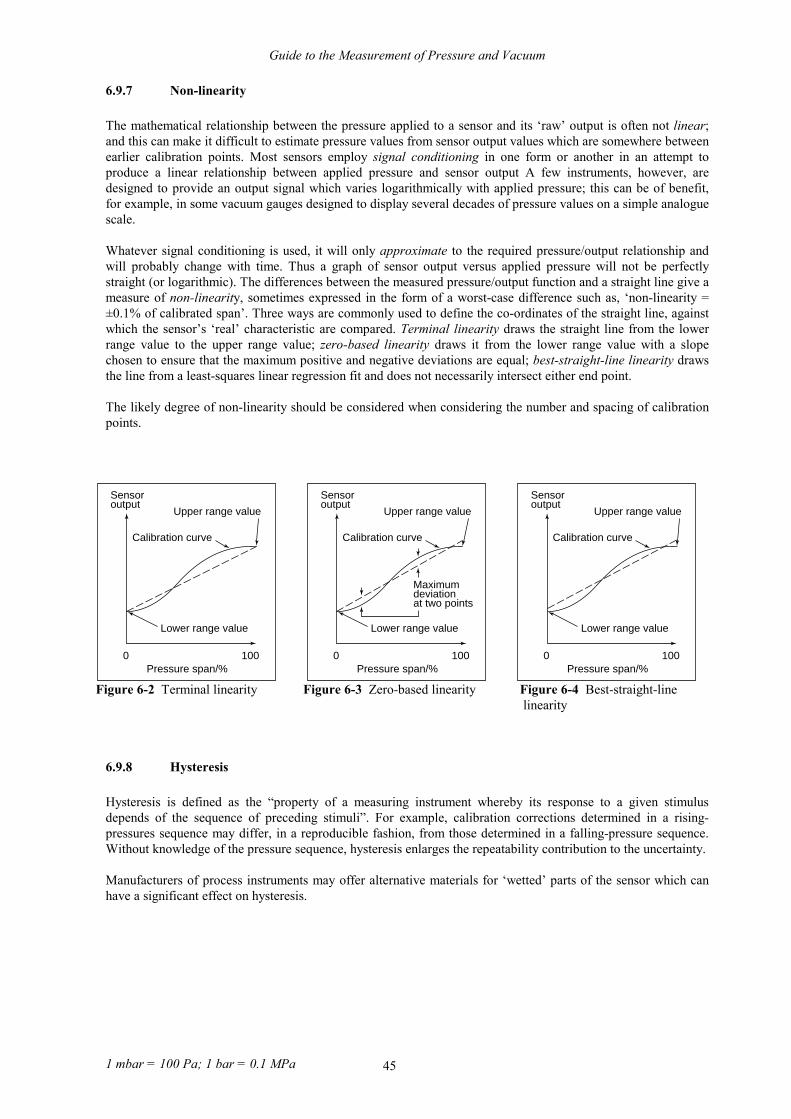
Guide to the Measurement of Pressure and Vacuum
6.9.7 Non-linearity The mathematical relationship between the pressure applied to a sensor and its ‘raw’ output is often not linear; and this can make it difficult to estimate pressure values from sensor output values which are somewhere between earlier calibration points. Most sensors employ signal conditioning in one form or another in an attempt to produce a linear relationship between applied pressure and sensor output A few instruments, however, are designed to provide an output signal which varies logarithmically with applied pressure; this can be of benefit, for example, in some vacuum gauges designed to display several decades of pressure values on a simple analogue scale. Whatever signal conditioning is used, it will only approximate to the required pressure/output relationship and will probably change with time. Thus a graph of sensor output versus applied pressure will not be perfectly straight (or logarithmic). The differences between the measured pressure/output function and a straight line give a measure of non-linearity, sometimes expressed in the form of a worst-case difference such as, ‘non-linearity = ±0.1% of calibrated span’. Three ways are commonly used to define the co-ordinates of the straight line, against which the sensor’s ‘real’ characteristic are compared. Terminal linearity draws the straight line from the lower range value to the upper range value; zero-based linearity draws it from the lower range value with a slope chosen to ensure that the maximum positive and negative deviations are equal; best-straight-line linearity draws the line from a least-squares linear regression fit and does not necessarily intersect either end point. The likely degree of non-linearity should be considered when considering the number and spacing of calibration points.
Figure 6-2 Terminal linearity Figure 6-3 Zero-based linearity Figure 6-4 Best-straight-line linearity
Sensoroutput
Calibration curve
Upper range value
Lower range value
Pressure span/%0 100
Sensoroutput
Calibration curve
Upper range value
Lower range value
Maximumdeviationat two points
Pressure span/%0 100
Sensoroutput
Calibration curve
Upper range value
Lower range value
Pressure span/%0 100
6.9.8 Hysteresis Hysteresis is defined as the “property of a measuring instrument whereby its response to a given stimulus depends of the sequence of preceding stimuli”. For example, calibration corrections determined in a rising-pressures sequence may differ, in a reproducible fashion, from those determined in a falling-pressure sequence. Without knowledge of the pressure sequence, hysteresis enlarges the repeatability contribution to the uncertainty. Manufacturers of process instruments may offer alternative materials for ‘wetted’ parts of the sensor which can have a significant effect on hysteresis.
1 mbar = 100 Pa; 1 bar = 0.1 MPa 45

Guide to the Measurement of Pressure and Vacuum
6.9.9 Response time Response time is defined as the “time interval between the instant when a stimulus is subjected to a specified abrupt change and the instant when the response reaches and remains within specified limits around its final steady value”. The response time normally quoted on manufacturers’ data sheets normally refers to the time a device takes, after a pressure change, before the indicated value of pressure is within its normal measurement uncertainty. It is particularly important to know the response time when using a device to measure a pressure which is changing. Note that response time is not the same as time constant which is the time taken, by a device, to register 2/3 of a step change in applied pressure.
6.9.10 Temperature coefficient The temperature coefficient of an instrument is essentially the change in the indicated value of pressure caused by a unit change in its temperature. All pressure and vacuum measuring instruments are affected to some extent by the temperature at which they operate which may be influenced by internal heating effects and many environmental factors. The temperature coefficient is typically expressed in the form x%/°C, with perhaps separate figures relating to the effect of temperature changes on the device’s different characteristics.
6.9.11 Line pressure effects Instruments designed to measure differential pressure with respect to a static pressure other than atmospheric or vacuum are often used in the measurement of flow and liquid level. The effect on the measurement of differential pressure, caused by changing the line (or static) pressure is known as a line pressure effect.
6.9.12 Zero offset Along with adjustment of span, the adjustment of zero offset (or zero reading or null) is a common requirement. Essentially it is entails adjusting an instrument’s reading, at the lowest indicated pressure, until it is correct. For example, a gauge-mode instrument should read zero when subjected to atmospheric pressure.
Figure 6-5 Zero offset and span error
Sensoroutput
Pressure span/%
Required output atfull-scale pressure
Required output atminimum pressure
Zerooffset
0 100
Sensoroutput
Span error
Pressure span/%0 100
1 mbar = 100 Pa; 1 bar = 0.1 MPa 46

Guide to the Measurement of Pressure and Vacuum
6.10 Inconsistent use of terminology One of the most difficult tasks for potential purchasers is to compare manufacturers’ specification sheets. Section 6.9 and the glossary in section 3.4 have attempted to explain the meaning of the terms used to describe the practice of pressure measurement but not all manufacturers or suppliers use them consistently and indeed it can be hard to do so. Making comparisons of competing products can therefore be difficult and caution is advised. Sometimes terms are misunderstood or misused and Table 6-1 gives examples, some of which are light-hearted!
Table 6-1 Misused terms and their meanings
Misused term
Meaning?
accuracy a figure enhanced by excluding one or more contributions from linearity, hysteresis, repeatability, reproducibility, the standard against which calibration was performed, or any other factors. (So what is its accuracy when all these points are included?)
calibrated adjusted so it now reads perfectly. (Calibration and adjustment are different and nothing works ‘perfectly’)
fundamental instrument so good it doesn’t need calibrating. (Fundamental principles don’t eliminate the need for calibration or traceability.)
hard vacuum a pressure that is so low that the containing vessel needs to be extra strong to stop it imploding. (The forces acting on a vessel containing a 'perfect' vacuum would only be 0.01% more than those due to a rough vacuum of 10 Pa.)
more accurate than a primary standard
so good it can’t be calibrated. (Illogical! How can this ever be known?)
primary standard the instrument’s principle is fundamental and it is therefore primary. (Wrong!)
performance is good to…. subjective and uncalculated analysis of uncertainty. (Unpersuasive)
pressure-independent output
broken.
true pressure pressure. (The word ‘true’ adds nothing.)
typical performance figures derived by ignoring any bad results. (Is the device sold to you typical?)
1 mbar = 100 Pa; 1 bar = 0.1 MPa 47

Guide to the Measurement of Pressure and Vacuum
7 CALIBRATION, TRACEABILITY AND MEASUREMENT STANDARDS
7.1 What is calibration? In common with all measuring devices, pressure measuring instrumentation needs periodic calibration, primarily to monitor changes in performance. Formally, calibration is said to be “a set of operations that establish, under specified conditions, the relationship between the values of quantities indicated by a measuring instrument …and the corresponding values realised by standards”. Thus a certificate of calibration commonly contains a list of pressure values determined by a pressure standard, a corresponding list of pressure values indicated by the instrument under test and a list of the differences between these values at each pressure. Whilst the formal definition works well for most measuring instruments, it has to be interpreted rather loosely in some cases. For example, the calibration of pressure balances, which maintain a calculable pressure rather than measure it, often entails a comparison of piston-cylinder area values rather than pressure values. Sometimes the word calibration is misused to describe the process of altering the performance of an instrument to ensure that the values it indicates are correct within specified limits. This is adjustment, not calibration, although the nature and magnitude of the adjustment is often determined by a pre-adjustment calibration, sometimes known as an ‘as found’ calibration. When adjustment is undertaken, the full procedure is thus first calibration followed by adjustment and then second calibration. Results from the first calibration will also be needed if the device’s reproducibility is to be estimated (essentially its change in characteristics over a long time interval).
7.2 What is traceability? Confidence in the results of a calibration and their relationship with other pressure measurements demands that measurements have traceability. Formally, this is said to be the “property of the result of a measurement … whereby it can be related to stated references, usually national or international standards, through an unbroken chain of comparisons all having stated uncertainties”. The “unbroken chain…” is perhaps obvious enough but the calculation of measurement uncertainties at each link in the chain is equally important and, if not handled properly, can effectively destroy traceability. Such calculations have to take into account detailed analysis of the comparison procedure as well as the characteristics of the standard being used and the expertise of the personnel undertaking the work; simply being in possession of a ‘traceable’ instrument does not in itself guarantee that measurements made with it will be traceable.
7.3 Do all instruments need to be calibrated? No. This is a difficult question to answer definitively but instruments that are used only as indictors, where pressure values are not important, probably do not need calibrating. Most instruments do need to be calibrated, however, whether they be simple devices with modest performance, state-of-the-art systems or fundamental in nature, as it is only by this process that their pressure measuring properties can be determined. Note also that it is usually the whole measurement system that needs to be calibrated, not just the sensor itself. This is because, for example, the associated electronics are probably just as likely to change characteristics as the sensor.
7.4 How frequently should instruments be calibrated? This question can be difficult to answer too, but there are two particularly important considerations to be made. First, has the device been calibrated at least twice before, without adjustment, with one calibration being quite recent? If not, is there any type test data for similar instruments? Second, what measurement uncertainty is needed? If the earlier data shows that the device has reproducibility substantially better than the uncertainty needed, the recalibration interval can probably be quite long � perhaps up to five years or so. At the other extreme, if the uncertainty required approaches the reproducibility then calibrations should be much more frequent � perhaps even daily. For the majority of instruments the recalibration interval is about a year. It is
1 mbar = 100 Pa; 1 bar = 0.1 MPa 48

Guide to the Measurement of Pressure and Vacuum
important that the historical data relates to the device when used in an environment and in a way that is similar to the way it is normally used. If no historical data is available it is not possible to answer the question.
7.5 What category of standard should be used to provide the calibration? The characteristics of the measurement standard should be compatible with both the instrument being calibrated and the associated systems. It is not necessary to use a standard that is in some way more fundamental than the ‘test’ instrument but it should operate, and itself be calibrated, over at least the pressure range in question, and be of adequately low uncertainty. The meaning of ‘adequately low’ will depend on the local application. It used to be said that the accuracy of the measurement standard against which calibrations were to be made should be about ten times better than that expected of the instrument being calibrated. As a rule-of-thumb this was very good at ensuring that the uncertainty of measurements subsequently made by the device were not noticeably degraded by limitations in the standard. It was a metrologically luxurious rule, though, and economic arguments reduced the recommended factor to about four � which was still sufficient. Today, what counts is the bottom line in an uncertainty budget after taking into account all the quantities that influence the measurement and, provided a relatively poor value is acceptable, there is no reason why the standard should not have a higher uncertainty than the potentially lower uncertainty of the device being calibrated. This situation might be acceptable, for example, if a measuring instrument of unnecessarily high metrological calibre is being used to make a lower calibre measurement.
Non-primarynational standard
of anothercountry
Secondary
Reference
Reference
Working
Secondary
Working Transfer
General instrumentation
A national and primary standard
Secondary
Working
Working
Figure 7-1 Traceability hierarchy
There are a lot of terms used to describe the hierarchical relationship of measurement standards and definitions of national, primary, secondary, reference, transfer and working standard can be found in the glossary of terms in section 3.4. In practice, though, the definitions fall into two distinct groups, with primary and national standard in one group and the remainder, including locally used terms such as ‘master’ standard, in the other group. A primary standard is one “designated or widely acknowledged as having the highest metrological qualities and whose value is accepted without reference to other standards of the same quantity”. A national standard is one “recognised by a national decision to serve, in a country, as the basis for assigning values to other standards…” Thus primary standards are normally held in national measurement laboratories but the converse it not always
1 mbar = 100 Pa; 1 bar = 0.1 MPa 49

Guide to the Measurement of Pressure and Vacuum
true � some national laboratories do not have their own primary standards, but rather instruments that are traceable to those in another country. Some instruments, such as pressure balances and liquid manometers or barometers, are often said incorrectly to be ‘primary’ simply because their operating principle is fundamental. The principles may relate directly to area and force; or density, gravity and column length, and indeed similar devices may be used in national measurement laboratories, but unless they are “designated as having the highest metrological qualities …” they are not primary standards. Other designations, such as secondary, reference, and working standards, are used in calibration hierarchies and transfer standards are used as comparators between other standards. There are many locally used variants, such as master standard and, as Figure 7-1 shows, some hierarchies have many levels but some only have two. The structure of a standards hierarchy will depend on a number of factors including the range, nature and frequency of measurements to be made at the lowest hierarchical level. Note that in some cases the instruments at the bottom of the hierarchy may be calibrated directly against a primary standard, bypassing all intermediate standards. This is only of value, however, where the metrological calibre of an instrument is sufficiently high to benefit from such a direct route. Note also that in some calibration hierarchies, equipment of similar design is used at the different levels.
7.6 How many ways can traceable calibrations be obtained? There are essentially four routes: through a UKAS-accredited laboratory (or equivalent accreditation scheme abroad), through a non-accredited laboratory, by in-house calibration, or directly from a national laboratory. Formally demonstrating traceability is not easy, though; the check-list of equipment, environment, procedures, staff training etc is long and the easiest way is to use the calibration services of a UKAS-accredited laboratory. Whichever way is chosen, however, the calibrations will only provide traceability if the results are related to stated references, usually national or international standards, through an unbroken chain of comparisons all having stated uncertainties. UKAS is the UK national body, operating under a government licence, assessing laboratories against internationally recognised criteria. The presence of a NAMAS logo, authorised by UKAS, on a certificate of calibration is an assurance that the work was carried out in a manner appropriate to the particular purpose, that the laboratory was stringently assessed by independent experts, that agreed procedures were followed and that the measurements made were traceable to national standards. UKAS accredited laboratories form an integral part of the UK’s national measurement system. There are many non-accredited laboratories with calibration facilities and some of these provide reputable services. If the traceability of a calibration needs to be formally proven (see section 7.12.1), however, a detailed review of the equipment, environment, procedures and staff training etc may have to be undertaken � an activity that could be time consuming and expensive. The third option is to provide in-house calibrations but again, if formal traceability is the goal, the process may not be straightforward. The fourth option, having an instrument calibrated directly by a national laboratory, may be appropriate in certain circumstances.
1 mbar = 100 Pa; 1 bar = 0.1 MPa 50
Guide to the Measurement of Pressure and Vacuum
7.7 What is needed to undertake calibrations? This varies widely across the pressure spectrum and with the nature of the ‘test’ artefact but the list generally includes:
�� a suitable environment �� an appropriate measurement standard �� a means of connecting the standard to the test instrument �� a method of generating and regulating the pressure �� a system for recording measurements (including ancillary parameters such as temperature) �� a method for calculating results from the measurements �� a procedure defined in advance �� adequately trained staff.
Environment The environment should normally be a stable one, with minimal vibration, tilt, and a stable temperature. This enables instrument performance to be quantified more easily, although the results are not necessarily representative of those that would have been achieved in a less stable environment. Having calibrated a device under good ‘laboratory’ conditions, allowance has to be made for any worse in-service conditions that may occur. An alternative is to calibrate a device under the more realistic conditions � more widely fluctuating temperature perhaps � but unless the procedure is rigorous it is unlikely to simulate properly all effects of poor environment in the right combination. It is also unlikely that the standard being used for the calibration was itself evaluated under such conditions and the calculated measurement uncertainties will not therefore readily apply. It is thus more common to calibrate under ‘good’ conditions and apply separately determined corrections to allow for a poorer in-service environment. Measurement standard Almost any pressure instrument can be used as a standard providing its performance is consistent with the nature of the measurements required and its associated measurement uncertainties are sufficiently low for the purpose in hand (see section 7.5) Connecting-up The majority of pressure measuring instruments are calibrated by connecting their pressure ports to a pressure standard via suitable pipework and possibly a manifold but this is not always the case. Some instruments are total immersion devices and have to be calibrated inside a pressure vessel, where the pressure is measured by a standard which is either inside the vessel too or connected to it via a pipe. Fortin and Kew station barometers are such instruments and their calibration requires mechanical connections through the vessel walls to enable the barometers to be set and portholes to enable readings to be taken by eye. A number of electronic pressure transducers are similarly total immersion devices. Vacuum instruments cannot generally be calibrated using pipework connections to the measurement standard, but for several reasons need to be connected via a comparatively large vacuum chamber instead. Most vacuum gauges do not measure pressure directly, but respond to gas density which may be determined from, for example, thermal properties or the ionisation of gas molecules. In these cases the gauge’s reading will depend not only on the pressure but also on the gas composition. Some gauges significantly perturb the pressure, temperature and uniformity of gas composition and it is important that these effects be minimised. In addition, the test gas must be the dominant component of the mixture. A large volume to surface area ratio is normally required to achieve this � hence the need for a calibration chamber. At pressures below about 100 Pa, significant pressure gradients may exist within a pipework system, even in equilibrium. The ideal size of the calibration chamber depends on many factors including the number and type of gauges to be mounted and the pressure range of interest. As a rough indication, a chamber of between 50 litres and 100 litres is appropriate for calibrations at pressures around 10-4 Pa, and one of 30 litres for pressures above 10-1 Pa. Some commercially available systems are smaller and as such attract higher uncertainty estimates. Generating and regulating pressure There are many ways of generating the required nominal pressure. In selecting one, a useful starting point might be to consider whether the required pressure is substantially below, around or above atmospheric pressure. Also, is regulation required � to hold the pressure steady, perhaps in the presence of temperature fluctuations or small leaks for example? Note that in most calibration applications it is important to ensure that the pressure is held as stable as possible.
1 mbar = 100 Pa; 1 bar = 0.1 MPa 51

Guide to the Measurement of Pressure and Vacuum
� Medium vacuum At pressures clearly into the medium vacuum region, stable pressures may be generated by ‘throttling’ a high vacuum pump (such as a diffusion or turbo-molecular pump) against a deliberately introduced leak of the test gas, via a needle valve, until equilibrium conditions prevail at the required pressure. The pressure control system can be made active by using, for example, an electrically operated needle valve which is servo controlled from a signal derived from a vacuum gauge. � Rough vacuum to gas-cylinder pressures For gas pressures ranging from rough vacuum to about atmospheric pressure, control is often provided by means of two needle valves, one connected to a source of compressed gas and the other to a vacuum (typically rotary) pump (see Figure 7-3). Above atmospheric pressure the same system may be used but a vacuum pump will not be required as depressurisation may be achieved by venting to the atmosphere. Various automatic versions of such controllers are available commercially and they can provide good regulation for long periods. Pressure systems incorporating dead-weight testers (see Figure 7-4,) tend not to need additional regulation as small pressure fluctuations are naturally compensated by the rise or fall of the piston. � Higher gas pressures Handling these pressures is potentially hazardous because of the high levels of stored energy (see section 9.5.2). � Hydraulic pressures These are most commonly generated with positive displacement pumps although, as many hydraulic fluids are essentially non-compressible, the magnitude of the displacements is comparatively small. As in gas-filled systems, use of a pressure balance will provide good regulation over a short period. (In more complex systems the period may be extended by use of a servo controlled pump). Other forms of regulation are provided by servo-controlling the pump from a signal derived from a pressure transducer or by using a gas-pressure controller to indirectly pressurise a hydraulic circuit via a gas-oil interface. Recording measurements For much calibration work, measurements can be made adequately by eye and recorded by hand, indeed some equipment, such as most dead-weight testers, does not lend itself too readily to automatic data acquisition. In many situations, however, some degree of automation is essential, either for the sake of efficiency or because manually recording sufficient data is impossible. Much pressure measuring instrumentation provides electrical outputs which can easily be connected to a computer for automatic or semi-automatic data logging. The most important point, however, is to have decided in advance which measurements to take and record. Calculating results It may seem an obvious point, but it is important that the correct calculation is performed. It is easy to make false assumptions about the order in which data is processed, use imprecise approximations or ignore terms in the hope that they are not significant. This will lead to additional errors, none of which will be accommodated in uncertainty estimates. Sound procedures It is not realistic to define a list for all pressure measuring applications but a given procedure will probably be sound only if it has had design input from a suitably experienced metrologist. One particularly unsound procedure sometimes adopted in the misguided belief that it is good metrology is known as the ‘elimination of rogue data points’ � repeating measurements until all undesirable results have been replaced with good ones. The process is also known as ‘helpful statistical bias’ or ‘cheating’, depending on the motive presumed. Adequately trained staff Again it is not realistic to suggest here what constitutes adequate training for the vast array of pressure calibration work undertaken across many industries (see section 7.12.2). A common mistake, though, is to assume that a procedure or requirement is obvious; it has led to many calibrations being performed in a fashion that was not intended.
7.8 Vacuum gauge calibrations Figure 7-2 shows a design of vacuum chamber for calibrating gauges by comparison; some general criteria are given under “connecting up” in section 9.4. The chamber should only be used for calibration purposes and kept as clean as possible, preferably under vacuum. Diffusion or turbo-molecular vacuum pumps are used to evacuate the chamber in conjunction with a rotary pump and appropriate throttle valve and/or high vacuum isolation valves.
1 mbar = 100 Pa; 1 bar = 0.1 MPa 52

Guide to the Measurement of Pressure and Vacuum
Gauge mounting-ports are distributed around the chamber at equal distances from the pump connection. Line-of-sight between ports should be avoided because electrically charged particles and vapourised contaminants can be emitted from gauges and it is important to ensure that the particles and contaminants do not impinge on one of the other gauges. The test ports should be short, large diameter tubes to maintain a high conductance between the gauge heads and the chamber. A 90° bend in the tubes further reduces line-of-sight problems. The calibration gas is admitted into the chamber through a narrow inlet pipe that discharges the gas onto the centre of the top of the chamber to produce an even pressure gradient throughout the system. This also ensures that gas molecules make several collisions with the walls of the system before entering a gauge head, thus eliminating the effect known as ‘beaming’.
The calibration gas most commonly used is dry nitrogen often provided from a small buffer volume. Care should be taken to avoid admitting water vapour – before use the inlet system should be repeatedly evacuated and filled with the test gas to remove air components, including water vapour. Care should also be taken not to over-pressure the system if gas is admitted from a cylinder.
Measurementstandard
Fromgassupply
To vacuum pump
Baffle
Testgauge
Figure 7-2 Vacuum gauge calibration
Ideally gauges should be calibrated using the process gas in which the test gauge will operate. However, it may not always be possible to have the reference gauges calibrated with that particular gas or with the range of species encountered and so gas sensitivity corrections may be required which will increase the overall calibration uncertainty.
When a dedicated calibration system is not available, calibration of test gauges can still be made provided the good practice considerations mentioned here are taken into account. The base pressure in a vacuum system is limited by the pumping speed applied to the chamber, by leaks, the outgassing of the materials exposed to the vacuum and the cleanliness of the test gauges. The base pressure of the system should usually be at least 20 times lower than the minimum calibration pressure. Once the system has reached a safe level of vacuum the gauges should be switched on and left whilst any electronic components warm up. Ideally the gauge heads will be controlled by their own dedicated gauge controller but in some circumstances separate equipment may be appropriate. Initial outgassing is mainly caused by release into the chamber of gas molecules that are absorbed or adsorbed by the materials of the system. The outgassing rate decreases over time as the molecules are pumped away until the ultimate pressure of the vacuum system is reached. (This pressure is determined by a number of factors such as the ultimate pressure achievable by the pump, residual leaks, residual outgassing and the vapour pressures of system materials). The time needed to reach this pressure can be reduced by heating the system whilst pumping. Heating increases the outgassing rate allowing the molecules to be removed more quickly. After heating, the system should be allowed to restabilise at the calibration temperature. The cool down period is a good time to degas hot filament ionisation gauges. If the chamber is not heated the gauges should be degassed at or near the base pressure. The gauges become very hot during degas and skin contact should be avoided at all costs. After degassing the gauges should be allowed to cool to their normal operating temperature. When the system has thermally stabilised various set up procedures can be followed as required.
1 mbar = 100 Pa; 1 bar = 0.1 MPa 53
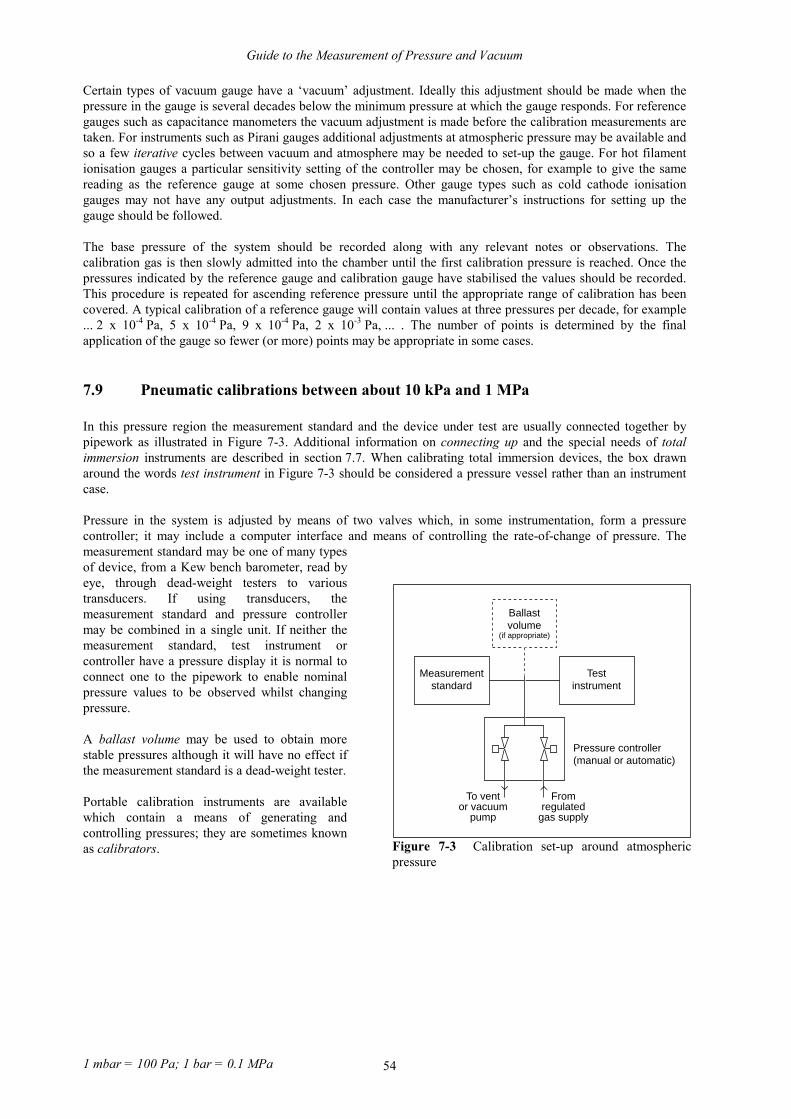
Guide to the Measurement of Pressure and Vacuum
Certain types of vacuum gauge have a ‘vacuum’ adjustment. Ideally this adjustment should be made when the pressure in the gauge is several decades below the minimum pressure at which the gauge responds. For reference gauges such as capacitance manometers the vacuum adjustment is made before the calibration measurements are taken. For instruments such as Pirani gauges additional adjustments at atmospheric pressure may be available and so a few iterative cycles between vacuum and atmosphere may be needed to set-up the gauge. For hot filament ionisation gauges a particular sensitivity setting of the controller may be chosen, for example to give the same reading as the reference gauge at some chosen pressure. Other gauge types such as cold cathode ionisation gauges may not have any output adjustments. In each case the manufacturer’s instructions for setting up the gauge should be followed. The base pressure of the system should be recorded along with any relevant notes or observations. The calibration gas is then slowly admitted into the chamber until the first calibration pressure is reached. Once the pressures indicated by the reference gauge and calibration gauge have stabilised the values should be recorded. This procedure is repeated for ascending reference pressure until the appropriate range of calibration has been covered. A typical calibration of a reference gauge will contain values at three pressures per decade, for example ... 2 x 10⁻⁴ Pa, 5 x 10⁻⁴ Pa, 9 x 10⁻⁴ Pa, 2 x 10⁻³ Pa, ... . The number of points is determined by the final application of the gauge so fewer (or more) points may be appropriate in some cases.
7.9 Pneumatic calibrations between about 10 kPa and 1 MPa In this pressure region the measurement standard and the device under test are usually connected together by pipework as illustrated in Figure 7-3. Additional information on connecting up and the special needs of total immersion instruments are described in section 7.7. When calibrating total immersion devices, the box drawn around the words test instrument in Figure 7-3 should be considered a pressure vessel rather than an instrument case. Pressure in the system is adjusted by means of two valves which, in some instrumentation, form a pressure controller; it may include a computer interface and means of controlling the rate-of-change of pressure. The measurement standard may be one of many types of device, from a Kew bench barometer, read by eye, through dead-weight testers to various transducers. If using transducers, the measurement standard and pressure controller may be combined in a single unit. If neither the measurement standard, test instrument or controller have a pressure display it is normal to connect one to the pipework to enable nominal pressure values to be observed whilst changing pressure.
Measurementstandard
Testinstrument
To ventor vacuum
pump
Fromregulated
gas supply
Ballastvolume
(if appropriate)
Pressure controller(manual or automatic)
Figure 7-3 Calibration set-up around atmospheric pressure
A ballast volume may be used to obtain more stable pressures although it will have no effect if the measurement standard is a dead-weight tester. Portable calibration instruments are available which contain a means of generating and controlling pressures; they are sometimes known as calibrators.
1 mbar = 100 Pa; 1 bar = 0.1 MPa 54
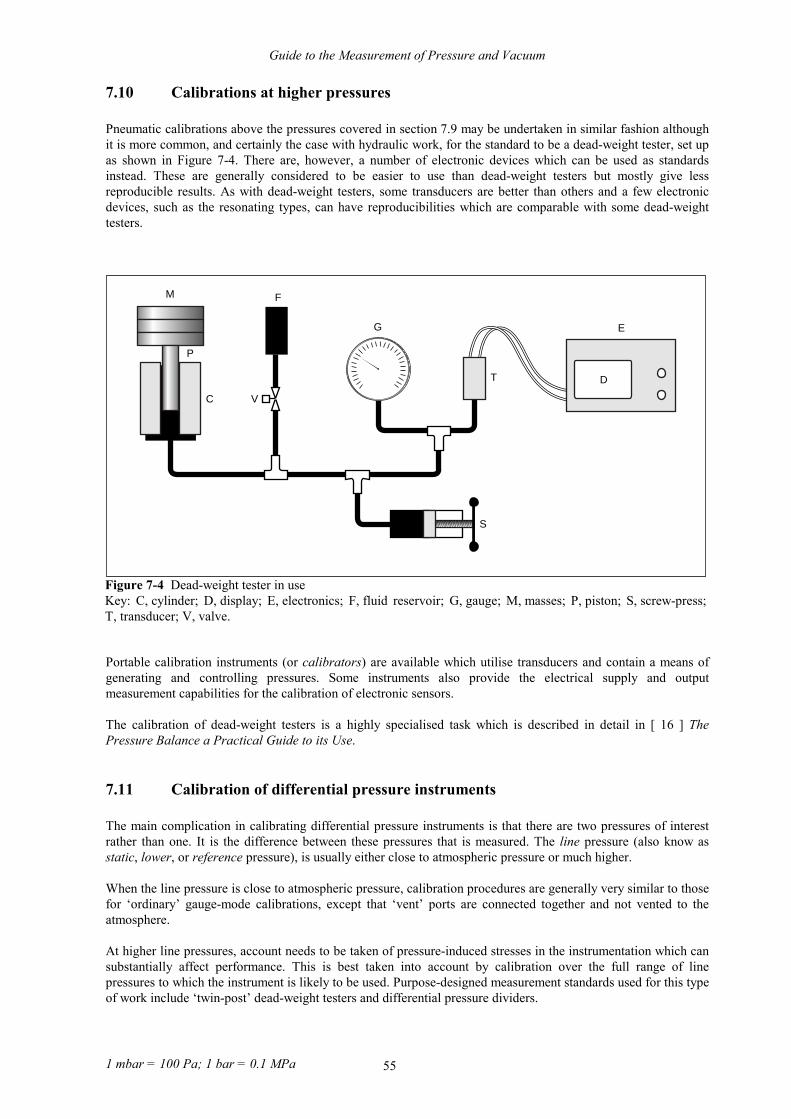
Guide to the Measurement of Pressure and Vacuum
7.10 Calibrations at higher pressures Pneumatic calibrations above the pressures covered in section 7.9 may be undertaken in similar fashion although it is more common, and certainly the case with hydraulic work, for the standard to be a dead-weight tester, set up as shown in Figure 7-4. There are, however, a number of electronic devices which can be used as standards instead. These are generally considered to be easier to use than dead-weight testers but mostly give less reproducible results. As with dead-weight testers, some transducers are better than others and a few electronic devices, such as the resonating types, can have reproducibilities which are comparable with some dead-weight testers.
Portable calibration instruments (or calibrators) are available which utilise transducers and contain a means of generating and controlling pressures. Some instruments also provide the electrical supply and output measurement capabilities for the calibration of electronic sensors. The calibration of dead-weight testers is a highly specialised task which is described in detail in [ 16 ] The Pressure Balance a Practical Guide to its Use.
7.11 Calibration of differential pressure instruments The main complication in calibrating differential pressure instruments is that there are two pressures of interest rather than one. It is the difference between these pressures that is measured. The line pressure (also know as static, lower, or reference pressure), is usually either close to atmospheric pressure or much higher. When the line pressure is close to atmospheric pressure, calibration procedures are generally very similar to those for ‘ordinary’ gauge-mode calibrations, except that ‘vent’ ports are connected together and not vented to the atmosphere. At higher line pressures, account needs to be taken of pressure-induced stresses in the instrumentation which can substantially affect performance. This is best taken into account by calibration over the full range of line pressures to which the instrument is likely to be used. Purpose-designed measurement standards used for this type of work include ‘twin-post’ dead-weight testers and differential pressure dividers.
1 mbar = 100 Pa; 1 bar = 0.1 MPa 55
M
P
F
VC
G
T
S
D
E
Figure 7-4 Dead-weight tester in use Key: C, cylinder; D, display; E, electronics; F, fluid reservoir; G, gauge; M, masses; P, piston; S, screw-press; T, transducer; V, valve.

Guide to the Measurement of Pressure and Vacuum
A short-cut but incomplete method of providing high-line differential pressure calibration is known as ‘foot-printing’. This essentially involves a gauge-mode calibration using atmospheric pressure as the line pressure, but alternative ways have to be found to compensate for the line pressure effects, known as static shift. Foot-printing can be undertaken with an ordinary dead-weight tester or indeed any appropriate pressure gauge. Manufacturers usually state tolerances for the line pressure effects in terms of a percentage of the maximum range per unit of line pressure and the shift in the zero value per unit of line pressure. These values are not, however, generally considered sufficiently accurate for the more demanding applications, such as custody transfer. A practice which is often employed undertakes both a full calibration and a foot-print. In service, especially in situ, it is easier to undertake foot-printing and results may be used as an indication that a full calibration is needed earlier than scheduled.
7.12 Quality assurance of pressure measurements
7.12.1 Measurement accreditation Many organisations carry a recognised approval or accreditation for their activities. Accreditation means that certain aspects of their business have been independently assessed, and that they comply with given criteria of quality. An accreditation or certification may for instance cover an organisation’s overall quality management system to, for example, the BS EN ISO 9000 series of standards. However a generalised quality accreditation cannot always address the details of specialised technical practises. For this reason, accreditation schemes specific to measurement have been developed. The United Kingdom Accreditation Service (UKAS) operates the National Accreditation of Measurement and Sampling (NAMAS). NAMAS accreditation of a calibration or testing laboratory provides assurance that measurements are carried out to the highest standards of technical competence, traceable to recognised national or international standards, using agreed methods and with realistic statements of uncertainty. The NAMAS regulations are based on international standards of the operation and accreditation of laboratories, such as EN 45000 and ISO Guide 25. NAMAS certificates are widely recognised and accepted throughout the UK and also worldwide. Counterparts of NAMAS exists in many other countries, and in many cases are recognised as being exactly equivalent. Formal agreements provide for the mutual recognition of certificates from different national accreditation schemes. The European Co-operation for Accreditation of Laboratories (EAL) is the body which is the focus for multilateral recognition among national measurement accreditation schemes in Europe.
7.12.2 Competence in pressure and vacuum measurements What is to be assured when a laboratory or its personnel are said to be technically competent in pressure and vacuum measurement? Well, reading this Guide does not alone lead to competence! Practical skill and experience are also required. However, it can safely be said that if personnel are to be considered competent in pressure and vacuum measurement, they should be familiar with much � if not all � of the information in the preceding chapters, for the kinds of instruments which they use. Indeed, experts should be familiar with more detail on specific areas than is given here. This document is a guideline, not a prescriptive specification or accreditation standard. However, it does summarise most of the widely accepted best practises in pressure and vacuum measurement. Therefore it is reasonable to expect that any pressure and vacuum laboratory that has passed a UKAS or equivalent assessment by an expert in the field will generally follow the practices described in this Guide. This does not mean, of course that a competent laboratory need necessarily undertake all the types of measurement described here. Nor does it mean that they need use this document in order to be applying the good practices described here. It should be noted that the European Pressure Equipment Directive will be adopted into UK Law and will be mandatory in the year 2000 surpassing all current national safety requirements and standards.
1 mbar = 100 Pa; 1 bar = 0.1 MPa 56
Guide to the Measurement of Pressure and Vacuum
8 UNCERTAINTY OF MEASUREMENT
8.1 General The uncertainty of a measurement is defined as a “parameter, associated with the result of a measurement, that characterises the dispersion of values that could reasonably be attributed to the measurand”. No measurement value can be properly interpreted without an accompanying estimate of its uncertainty. This is important not least because, for a measurement to be considered traceable through an unbroken chain of comparisons to a reference, all the measurements involved must have stated uncertainties. Calculating the uncertainties associated with pressure measurement is an important task, one that is sometimes complex and tackled with apprehension. Detailed guidance on the evaluation of uncertainties can be found in documents such as [ 32 ] the ISO Guide to the Expression of Uncertainty in Measurement, published in the UK as BSI PD 6461 : 1995, Vocabulary of Metrology, Part 3: Guide to the Expression of Uncertainty in Measurement. There is also a simplified UKAS publication [ 36 ] M3003 The Expression of Uncertainty and Confidence in Measurement which is harmonised with internationally accepted guides. In using these documents, however, some important points are often overlooked and paragraph 3.4.8 of the BSI publication gives a salutary reminder:
The document provides “… a framework for assessing uncertainty [which] cannot substitute for critical thinking, intellectual honesty and professional skill. The evaluation of uncertainty is neither a routine task nor a purely mathematical one; it depends on detailed knowledge of the nature of the [pressure regime] and of the measurement. The quality and utility of the uncertainty quoted for the result of a measurement therefore ultimately depend on the understanding, critical analysis, and integrity of those who contribute to the assignment of its value.”
These documents explain how to calculate the overall uncertainty in a measuring system from estimates of the component uncertainties associated with its various characteristics. To do this a mathematical model is needed which describes the relationship between these characteristics and pressure, under the circumstances in which the device will be used. All such models can only be approximations, however (indeed most models are derived from experimental data which, by its nature, contains errors), and the resultant calculation of uncertainty cannot compensate for the imperfections. Hence there is a tendency for uncertainty estimates to be too optimistic, especially where very simplistic models are used. This is why additional research can cause estimates of uncertainty to increase rather than decrease � it can reveal additional effects that, when added to the model, contribute to a larger value of uncertainty. Hence the phrase, ‘low uncertainties can be caused by lack of knowledge!’
8.2 Motives for calculating measurement uncertainties The rules and advice given in the literature implicitly assume that the motive for undertaking the calculation of uncertainty is entirely impartial and intellectual � that all mathematical models and estimates will be the best available, not influenced by other motives. In reality, however, there are other motives and they are not always compatible with good metrology. Specification figures in equipment sales literature are often presented as if they were the result of thorough and impartial calculations but it should be appreciated that the prime object of the literature is to encourage sales. Even in a well ordered and detailed uncertainty budget, where the statistical distribution of the component parts is well known, the uncertainty in the calculated uncertainty will be about 50%. It gets considerably larger too, as the component parts become less statistically sound � as is often the case where little or no statistical data exists and best guesses have to be used instead. This is a very large percentage and essentially means that not too much notice should be taken of a calculated uncertainty budget halving or doubling. This point is not well known, however, and those seeking calibration services mostly assume otherwise, perceiving that a figure of, say, 0.09% is meaningfully better than 0.10%. Metrologically the difference is insignificant but the lower figure attracts customers and some calibration service providers thus go to great lengths to show tiny reductions in their advertised best measurement capability figures. There is thus a commercially driven tendency for uncertainty estimates to get smaller which has little to do with practical needs or sound metrology.
1 mbar = 100 Pa; 1 bar = 0.1 MPa 57

Guide to the Measurement of Pressure and Vacuum
Thus purchasers of pressure measuring equipment and the related calibration services are advised to make judgements that are based on factors beyond small differences between numbers.
8.3 Estimating uncertainty � principles Any statement of uncertainty associated with a measurement must have two parts: a confidence interval, and a confidence level. Combining the measured value with the confidence interval sets the upper and lower confidence limits within which the ‘true’ value is expected to lie. The size of the confidence interval is related to both the standard uncertainty of the measurement and to the confidence (or ‘degree of belief’), that the ‘true’ value really does lie within the calculated confidence limits. So, if the standard uncertainty of the measurement remains unchanged. a larger confidence interval will increase the confidence in the measurement. Note, though, that a ‘true’ value can never be known � see accuracy of measurement in section 6.9.2. Confidence levels of about 95% are usually used for most commercial and industrial purposes but the international approach to expressing uncertainties uses a coverage factor, k, to expand the standard uncertainty. k=2 is most commonly used, which corresponds to a confidence level of approximately 95.5%, while k=3 gives a confidence level of approximately 99.7%. As an example, a calibration certificate may give the effective area of a dead-weight tester as:
Effective area = 80.674 2 mm2 ± 0.001 7 mm2 with a comment to the effect:
The reported uncertainty is based on a standard uncertainty multiplied by a coverage factor k=2, providing a level of confidence of approximately 95%.
This indicates that the best estimate of the ‘true’ value of area is 80.674 2 mm2 but at a confidence level of approximately 95% it is expected that the ‘true’ value lies somewhere between 80.672 5 mm2 and 80.675 9 mm2 although the probability of it lying near the limits is low. There is, however, a 5% probability that the ‘true’ value lies outside the limits. For many years it was general practice for the uncertainty of measurement of every parameter to be evaluated as a systematic or a random effect. A systematic effect was the result of some average offset of the measured value of the parameter from its true value, and a random effect was due to fluctuations of that measured value. Since 1993, the internationally agreed approach [ 32 ] is that uncertainty components are categorised by their method of evaluation and there are two types: Type A components are those evaluated by statistical sampling methods, and often relate to random effects during the measurement in question; Type B components, often derived from systematic effects, are those evaluated by any other method. Dependent upon the circumstances, Type A and Type B evaluation methods can each be used for evaluating both random or systematic effects.
�� Type A uncertainties are evaluated in terms of the standard deviation of a number of readings, and are derived from practical measurements; an example is the repeatability of a pressure transducer.
�� Type B uncertainties may be evaluated from previous measurements, knowledge of the measurement system, specification compliances, calibration and other certificates.
For both Type A and Type B uncertainties, a standard uncertainty is calculated. The estimated uncertainty limit is divided by a constant derived from knowledge of the assumed population distribution for each contributor, giving the uncertainty in the form of a standard uncertainty. The combined standard uncertainty for a particular measurement is derived from all the contributing standard uncertainties, and may be calculated by combining standard uncertainties. If all possible sources of uncertainty were estimated, the combined effect could be no worse than the sum of the greatest possible individual effects. Usually, the effects of some uncertainty contributions will tend to compensate for the effects of others, so that the combined uncertainty will be less than the arithmetic sum of the contributors. The combined uncertainty may be calculated by adding the contributors in quadrature (sometimes known as root-sum-of-squares ) as follows:
1 mbar = 100 Pa; 1 bar = 0.1 MPa 58

Guide to the Measurement of Pressure and Vacuum
combined standard uncertainty = (c u ) + (c u ) + (c u ) + . . . 12
22
32
1 2 3 (8)
where u1, u2 etc are the individual estimated contributing uncertainties, all expressed as standard uncertainties and c1, c2, etc are the sensitivity coefficients. Sensitivity coefficients quantify the relationship between an influence quantity (see section 8.4 below) and the value of pressure. It should be noted that, if the contributing uncertainties are linked or correlated, they will tend not to compensate for each other and should be added arithmetically. (The degree of correlation is described by the covariance, which in principal should be included in the combination of uncertainties. In practice, the evaluation of covariances may be difficult and zero or full correlation is often assumed.) The uncertainties of measurement of some pressure standards are often correlated, and where this is the case (except where covariance information is available), they should always be added arithmetically; an example would be when groups of masses are used together on a dead-weight tester.
8.4 Estimating uncertainty � procedure A very common need, when using pressure measuring instrumentation, is to know the uncertainty that should be assigned to a particular measurement value. But what uncertainty should be applied to the readings of a barometer, a tyre pressure gauge or a reservoir depth gauge? The answer lies in the instrument itself and the nature of the application: is the barometer in a moving ship, is the gas in the tyre hot, how clean/dense/still is the reservoir fluid and so on? Pressure is measured in an enormous range of applications and the answer will be different in each one. A less common but equally important objective is the calculation of the measurement uncertainties associated with the calibration of one pressure instrument against another. In either case, the process of estimating uncertainty first requires a list of all the factors which may influence the measurements � known as influence quantities. It is unwise to assume, without analysis, that some influence quantities are negligible. In the examples overleaf, the influence quantities fall into two categories: those associated with the intrinsic properties of the instrument � such as its repeatability, drift, resolution etc � and those associated with the system or environment in which it operates � such as tilt, temperature, height differences, acceleration due to gravity, fluid composition, vibration etc. When calibrating one instrument against another, the ‘system’ will include influence quantities ‘bought-in’ from the previous calibration of the standard. In some circumstances the calculation of the standard uncertainty of an influence quantity may warrant a separate uncertainty budget. For example, a thermometer will have its own ‘bought-in’, repeatability, resolution and drift uncertainties to assess.
1 mbar = 100 Pa; 1 bar = 0.1 MPa 59
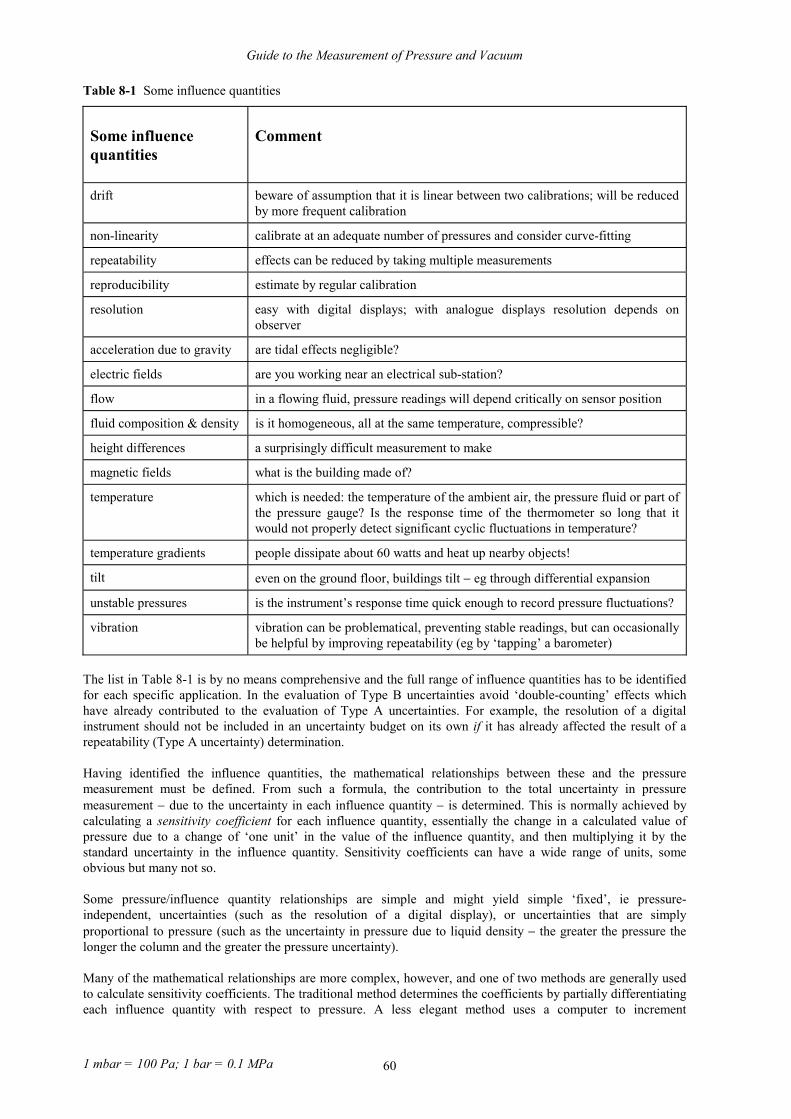
Guide to the Measurement of Pressure and Vacuum
Table 8-1 Some influence quantities
Some influence quantities
Comment
drift beware of assumption that it is linear between two calibrations; will be reduced by more frequent calibration
non-linearity calibrate at an adequate number of pressures and consider curve-fitting
repeatability effects can be reduced by taking multiple measurements
reproducibility estimate by regular calibration
resolution easy with digital displays; with analogue displays resolution depends on observer
acceleration due to gravity are tidal effects negligible?
electric fields are you working near an electrical sub-station?
flow in a flowing fluid, pressure readings will depend critically on sensor position
fluid composition & density is it homogeneous, all at the same temperature, compressible?
height differences a surprisingly difficult measurement to make
magnetic fields what is the building made of?
temperature which is needed: the temperature of the ambient air, the pressure fluid or part of the pressure gauge? Is the response time of the thermometer so long that it would not properly detect significant cyclic fluctuations in temperature?
temperature gradients people dissipate about 60 watts and heat up nearby objects!
tilt even on the ground floor, buildings tilt � eg through differential expansion
unstable pressures is the instrument’s response time quick enough to record pressure fluctuations?
vibration vibration can be problematical, preventing stable readings, but can occasionally be helpful by improving repeatability (eg by ‘tapping’ a barometer)
The list in Table 8-1 is by no means comprehensive and the full range of influence quantities has to be identified for each specific application. In the evaluation of Type B uncertainties avoid ‘double-counting’ effects which have already contributed to the evaluation of Type A uncertainties. For example, the resolution of a digital instrument should not be included in an uncertainty budget on its own if it has already affected the result of a repeatability (Type A uncertainty) determination. Having identified the influence quantities, the mathematical relationships between these and the pressure measurement must be defined. From such a formula, the contribution to the total uncertainty in pressure measurement � due to the uncertainty in each influence quantity � is determined. This is normally achieved by calculating a sensitivity coefficient for each influence quantity, essentially the change in a calculated value of pressure due to a change of ‘one unit’ in the value of the influence quantity, and then multiplying it by the standard uncertainty in the influence quantity. Sensitivity coefficients can have a wide range of units, some obvious but many not so. Some pressure/influence quantity relationships are simple and might yield simple ‘fixed’, ie pressure-independent, uncertainties (such as the resolution of a digital display), or uncertainties that are simply proportional to pressure (such as the uncertainty in pressure due to liquid density � the greater the pressure the longer the column and the greater the pressure uncertainty). Many of the mathematical relationships are more complex, however, and one of two methods are generally used to calculate sensitivity coefficients. The traditional method determines the coefficients by partially differentiating each influence quantity with respect to pressure. A less elegant method uses a computer to increment
1 mbar = 100 Pa; 1 bar = 0.1 MPa 60

Guide to the Measurement of Pressure and Vacuum
sequentially, both positively and negatively, each influence quantity and compute the corresponding changes in pressure value. Again, a typical set of values of all influence quantities, appropriate to each pressure, is substituted. Whichever method is used, an estimate is then made of the measurement uncertainty associated with each influence quantity, eg ±0.5 °C (temperature), ±0.2 mm, (height correction), ±0.1� (verticality), ±0.5 Pa (resolution). The values may represent standard deviations, confidence intervals, semi-range limits of rectangular or other statistical distributions and should be converted to the form of a standard uncertainty. Each standard uncertainty is then multiplied by the respective sensitivity coefficient to calculate the effect each uncertainty has on the measurement of pressure. The results are then combined (in quadrature if there is no correlation � see section 8.3) to form a combined standard uncertainty and, taking into account the effective number of degrees of freedom, the expanded uncertainty is found by multiplying by the coverage factor, k, appropriate to the required level of confidence.
8.5 Propagation of errors and ‘bought-in’ uncertainty As previously described (see section 7.2), traceability of measurement is achieved through a chain of unbroken calibrations. While this method provides the best estimate of the value for any measurement, each step in the chain introduces some additional uncertainty. This is because each instrument in the chain will be subject to possible drift, limited resolution, sampling uncertainties at each step, and so on. The uncertainty at any point in the chain includes the cumulative result of all preceding uncertainties. In practice, however, users need not concern themselves with these details as, provided they are using a properly traceable instrument, they will be included in the ‘bought-in’ calibration uncertainty.
9 PRACTICAL RECOMMENDATIONS
9.1 General It is important to remember the advice given on device selection since a more appropriate device selected from the outset, will ease practical implementation. Some general guidelines are given in this section. A few general points are outlined first and then some advice on particular classes of instruments is given. It should be noted that the lack of reference to specific devices does not imply that they are unimportant � rather that the general guidelines should be observed and are usually sufficient.
�� the right measurements � measurements should be made to satisfy agreed and well specified requirements
�� the right tools � measurements should be made using equipment and methods demonstrated to be fit for the purpose
�� the right people � measurement staff should be competent, properly qualified and well informed. �� the right procedures � well defined procedure consistent with national or international standards
should be in place �� demonstrable consistency � measurements should be reproducible �� regular review � there should be assessment of the technical performance of the measurement
facilities and procedures either by internal or independent assessors. A number of common factors affecting pressure measurement are described overleaf. Given the considerable variety of pressure measuring equipment, not all of the following will be relevant for any individual case.
1 mbar = 100 Pa; 1 bar = 0.1 MPa 61

Guide to the Measurement of Pressure and Vacuum
9.1.1 Vibration or pulsation Vibration of whole measurement instrument and pulsation of the pressure media are two of the largest causes of failure of mechanical deflection gauges (eg Bourdon tubes and diaphragms) even though the problems are well known. Diaphragm-based transducers may be damaged by pulsation of the pressurised media, even at relatively low amplitude, if it coincides with the natural frequency of the sensor, causing it to resonate (or ‘ring’). Designs utilising oil filled cavities and isolation diaphragms or use of damping volumes or snubbers that restrict flowrate can provide protection against pulsation. Vibration is best eliminated at source if possible or sometimes by use of flexible bellows.
9.1.2 Temperature Many pressure gauges employ an elastic element whose properties change with temperature and cause instruments to give erroneous indications of pressure. Temperature compensation is often possible over a certain range, although for more extreme cases, some form of local cooling/heating or separation of the transducer from the source of extreme temperatures may be necessary. Electronics incorporated in many devices will only work within named limits of temperature which vary from instrument to instrument. For sensitive laboratory measurements, direct sunlight may need to be considered.
9.1.3 Protection from high pressures Pressure gauges can tolerate exposure to pressures somewhat beyond their operating range. However, instruments vary considerably and this tolerance will have its limits (and indeed may be very close to the operating limits) and the installation of isolation valves may be recommended.
9.1.4 Solids in suspension When particles adhere to a measuring element surface, errors can occur. Filters may help alleviate this problem. For measurements in liquids, solids can cause problems when they precipitate out in places where the liquid is not moving, such as transducer pressure ports or ‘dead leg’ pipes leading to the transducer. This precipitation can lead to blocking of the pipe or pressure port or rapid local corrosion due to pitting corrosion as the small particles create crevices around the point of contact. Careful mounting can reduce the effect if the density of the solid portion is known. If the solids are themselves mixtures where the solids range in density from less than to more than the density of water, as is the case with of waste water, then it may be necessary to arrange a clean liquid purging facility for routinely clearing the accumulation of solids.
9.1.5 Phase changes Some materials can cause problems with phase changes due to temperature changes, such as solidification. This occurs notably when water freezes inside a transducer, where it can destroy the device. Ensuring that phase changes do not take place, perhaps by use of additional heaters, is important. The formation of crystals may also cause problems if it occurs.
9.1.6 Viscosity Whilst varying viscosity may not cause measurement errors in static systems higher viscosity will affect frequency response. This may be desirable if rapid fluctuations about a static value are to be averaged out. Alternatively, it may be undesirable if these fluctuations are themselves to be determined. It should be noted that temperature has a large effect on viscosity so care is needed when the evaluation is made. One gauge, the spinning-rotor gauge, actually measures viscosity to determine pressure in the vacuum region.
1 mbar = 100 Pa; 1 bar = 0.1 MPa 62
Guide to the Measurement of Pressure and Vacuum
9.1.7 Ambient pressure changes and draughts Gauge-mode devices will be affected by changes in the ambient atmospheric pressure, which may be significant in some circumstances. Draughts, including those from air conditioning systems may give rise to some spurious readings for sensitive low gauge measurements and will adversely effect some sensitive instruments such as pressure balances.
9.1.8 Purpose Many pressure measurements are aimed at measuring other parameters and pressure is a convenient way of carrying out the measurement. Even if the pressure measurement is extremely good, this will not necessarily mean that the other parameter is equally well known if there are other factors which effect this link. For example, if a diver wishes to know how deep he is and will use pressure to determine the depth, accuracy is impaired if the changes in water density are not considered.
9.1.9 Orientation/tilt Certain instruments are sensitive to their orientation or attitude. Dead-weight testers are particularly sensitive and will not operate properly unless they are carefully aligned so that the piston is vertical. Sensitive diaphragm sensors may also need to be positioned in a consistent position to ensure reproducible results.
9.1.10 Acceleration due to gravity For accurate measurements using dead-weight testers and liquid column devices the acceleration due to gravity g must also be known. This can be found by measurement on site, calculation or interpolation of measured values. The variation in the value of g across the earth’s surface is about 0.5% due to latitude, plus a change of approximately 0.003% per 100 m altitude. Local topography and tidal forces also can have small effects. Kaye and Laby [ 35 ] give an equation to calculate g in terms of latitude and altitude. As an alternative to calculation, the local value of g in the UK may be found from the data which has been gathered by the British Geological Survey (BGS) national gravity survey. BGS has made measurements of g throughout the UK (in the same way that the Ordnance Survey provide bench marks as points of reference to the height above sea level) and will advise on the nearest survey station. Small corrections for height and latitude differences are then applied to find the acceleration due to gravity at the point required.
9.2 Bourdon tube gauges For Bourdon tube gauges where the pressure to be measured is steady, it is permissible to allow the working pressure to be up to 75% of the range of the instrument. However, where the pressure fluctuates, the maximum value to be measured should not exceed 60% of the range. This is good general practice and is recommended in BS 1780: 1985 [ 4 ]. Many users enforce their own additional procedures particularly where the gauge has to withstand worst case pressures that are considerably greater than the normal working pressure. The advice on safety in section 9.5.2 concerning installation of safety pattern gauges should be observed.
9.3 Dead-weight testers Operating Range The lowest pressure at which a pressure balance will operate properly varies between about 2% and 20% of its maximum pressure. It is sometimes claimed (and some certificates of calibration imply) that they can be used at pressures as low as dictated by the mass of the piston alone. This is not correct. Even if a piston appears to spin freely it will produce results whose uncertainties will be difficult to calculate properly. The minimum pressures at which creditable performance is likely to be assured can only be determined by calibration.
1 mbar = 100 Pa; 1 bar = 0.1 MPa 63
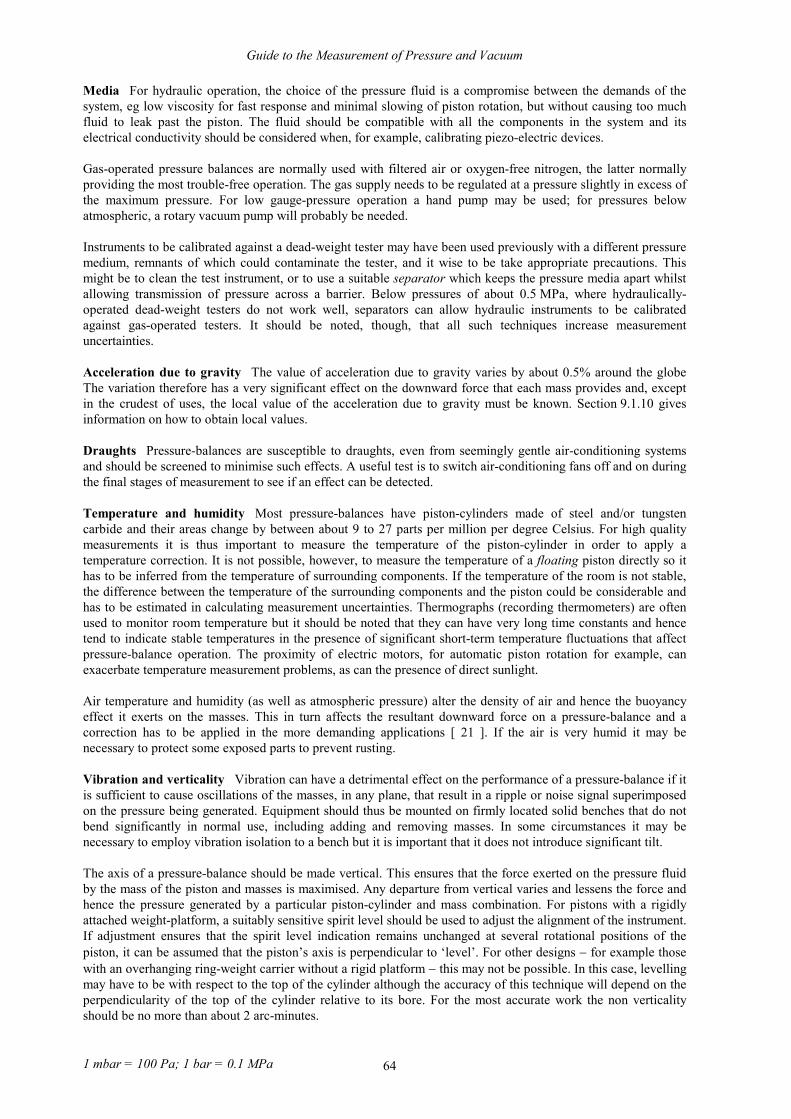
Guide to the Measurement of Pressure and Vacuum
Media For hydraulic operation, the choice of the pressure fluid is a compromise between the demands of the system, eg low viscosity for fast response and minimal slowing of piston rotation, but without causing too much fluid to leak past the piston. The fluid should be compatible with all the components in the system and its electrical conductivity should be considered when, for example, calibrating piezo-electric devices. Gas-operated pressure balances are normally used with filtered air or oxygen-free nitrogen, the latter normally providing the most trouble-free operation. The gas supply needs to be regulated at a pressure slightly in excess of the maximum pressure. For low gauge-pressure operation a hand pump may be used; for pressures below atmospheric, a rotary vacuum pump will probably be needed. Instruments to be calibrated against a dead-weight tester may have been used previously with a different pressure medium, remnants of which could contaminate the tester, and it wise to be take appropriate precautions. This might be to clean the test instrument, or to use a suitable separator which keeps the pressure media apart whilst allowing transmission of pressure across a barrier. Below pressures of about 0.5 MPa, where hydraulically-operated dead-weight testers do not work well, separators can allow hydraulic instruments to be calibrated against gas-operated testers. It should be noted, though, that all such techniques increase measurement uncertainties. Acceleration due to gravity The value of acceleration due to gravity varies by about 0.5% around the globe The variation therefore has a very significant effect on the downward force that each mass provides and, except in the crudest of uses, the local value of the acceleration due to gravity must be known. Section 9.1.10 gives information on how to obtain local values. Draughts Pressure-balances are susceptible to draughts, even from seemingly gentle air-conditioning systems and should be screened to minimise such effects. A useful test is to switch air-conditioning fans off and on during the final stages of measurement to see if an effect can be detected. Temperature and humidity Most pressure-balances have piston-cylinders made of steel and/or tungsten carbide and their areas change by between about 9 to 27 parts per million per degree Celsius. For high quality measurements it is thus important to measure the temperature of the piston-cylinder in order to apply a temperature correction. It is not possible, however, to measure the temperature of a floating piston directly so it has to be inferred from the temperature of surrounding components. If the temperature of the room is not stable, the difference between the temperature of the surrounding components and the piston could be considerable and has to be estimated in calculating measurement uncertainties. Thermographs (recording thermometers) are often used to monitor room temperature but it should be noted that they can have very long time constants and hence tend to indicate stable temperatures in the presence of significant short-term temperature fluctuations that affect pressure-balance operation. The proximity of electric motors, for automatic piston rotation for example, can exacerbate temperature measurement problems, as can the presence of direct sunlight. Air temperature and humidity (as well as atmospheric pressure) alter the density of air and hence the buoyancy effect it exerts on the masses. This in turn affects the resultant downward force on a pressure-balance and a correction has to be applied in the more demanding applications [ 21 ]. If the air is very humid it may be necessary to protect some exposed parts to prevent rusting. Vibration and verticality Vibration can have a detrimental effect on the performance of a pressure-balance if it is sufficient to cause oscillations of the masses, in any plane, that result in a ripple or noise signal superimposed on the pressure being generated. Equipment should thus be mounted on firmly located solid benches that do not bend significantly in normal use, including adding and removing masses. In some circumstances it may be necessary to employ vibration isolation to a bench but it is important that it does not introduce significant tilt. The axis of a pressure-balance should be made vertical. This ensures that the force exerted on the pressure fluid by the mass of the piston and masses is maximised. Any departure from vertical varies and lessens the force and hence the pressure generated by a particular piston-cylinder and mass combination. For pistons with a rigidly attached weight-platform, a suitably sensitive spirit level should be used to adjust the alignment of the instrument. If adjustment ensures that the spirit level indication remains unchanged at several rotational positions of the piston, it can be assumed that the piston’s axis is perpendicular to ‘level’. For other designs � for example those with an overhanging ring-weight carrier without a rigid platform � this may not be possible. In this case, levelling may have to be with respect to the top of the cylinder although the accuracy of this technique will depend on the perpendicularity of the top of the cylinder relative to its bore. For the most accurate work the non verticality should be no more than about 2 arc-minutes.
1 mbar = 100 Pa; 1 bar = 0.1 MPa 64

Guide to the Measurement of Pressure and Vacuum
Cleanliness Cleanliness of a piston-cylinder assembly is particularly important and, to avoid contamination from skin acid, internal surfaces should not be touched directly. A number cleaning techniques are employed and reference should be made to manufacturer’s instructions. Methods for cleaning gas-operated assemblies generally involve solvent cleaning, polishing with a tissue and blowing the surface dry with dry filtered gas to remove particles. It is important to use solvents that do not leave a residue. Assemblies with smaller clearances sometimes benefit from cleaning with pure toilet soap and a hot water rinse; it is assumed that soap residue acts as a boundary layer lubricant. If not thoroughly clean, the angular deceleration of a gas-operated pressure-balance will be noticeably higher, particularly at low pressures where momentum is less. It will also be less sensitive to small pressure changes (eg the addition of small weights) and might squeak. Under no circumstances should use of such a device continue without first cleaning it; permanent damage or change in effective area may result. After cleaning, pistons and cylinders should be given adequate time to reach a common temperature before re-assembly is attempted. Oil pressure-balances are less susceptible to dirt-induced problems and solvent cleaning is only necessary in extreme cases. The components should always be re-oiled before assembly, use or storage. Masses should be handled with care and kept clean. Any oil, dirt, corrosion or other damage will effect their mass values and hence the overall accuracy of pressures generated. They should be housed under a dust cover or in a storage box. Fluid systems should be checked periodically for foreign matter which could damage a piston-cylinder. Filters can minimise the risk of damage but they must be fitted where they cannot cause pressure differentials.
9.4 Vacuum measurement recommendations
9.4.1 General Many modern gauges can be mounted in any orientation without any negative impact on reading. In spite of this, best practice in mounting gauges remains to orient the gauge so that it is vertical, with the connection to the vacuum system at its base. This will prevent any debris from falling into the gauge. In situations where significant contamination can be generated, it is advisable to give additional protection by use of sinter filters, valves, spirals etc, although due account must be made of their effect on gas flow conductance. Orientation is also important for the operation of some types of thermal conductivity gauge. A change in the orientation of the gauge head can lead to a different pattern of heat convection around the filament from that during calibration. This can lead to errors in measurement. Where gauge heads are not mounted vertically, it is recommended that gauges which can be aligned or adjusted (eg Pirani gauges, capacitance manometers) are calibrated in the orientation in which they will normally be used. Some pressure measuring devices are particularly sensitive to vibration, for example, spinning-rotor gauges and sensitive capacitance manometers (those with full scale readings of less than 1 000 Pa). In such cases, it may be necessary to reduce these effects by the use of bellows couplings, for example. Thermal conductivity gauges contain temperature sensors that maintain gauge accuracy over a range of ambient temperatures (often 0 �C to 50 �C). This may be significantly below the stated maximum permissible ambient temperature for the gauge head leading to inaccuracy. Where this is a possibility, the sensor head should be protected from thermal radiation. If conduction of heat through the connecting pipework can take place, the pipework should be cooled. For particularly accurate measurement, the effects of temperature gradients (thermal transpiration) may need to be taken into account. The gauge head should be connected to the vacuum system by a straight, short, wide pipe. The pipe should have an internal diameter that is no smaller than that of the gauge tube itself. Long, narrow or angled connections can
1 mbar = 100 Pa; 1 bar = 0.1 MPa 65
Guide to the Measurement of Pressure and Vacuum
give rise to a significant measurement error. This is caused by resistance to gas flow along the pipe and is particularly noticeable at low pressures where molecular flow conditions prevail.
The gauge head should be connected as close as possible to the point where knowledge of the pressure is required. In systems which are being pumped, or where there is a steady transfer of gas from one region to another, the pressure will be lower in the vicinity of the pump inlet. The location of the gauge in the system in relation to the pumps and to the region where the pressure is needed should therefore be taken into account.
Correct location& dimensions
Pipework has toosmall diameter &is too long
Pressure reads toohigh,"beaming effect"
Materialingress
Tovacuumpump
Gas inlet
Figure 9-1 Vacuum gauge mounting positions
Gas admittance through a valve into the vacuum chamber may cause a ‘beaming’ effect directly into the gauge head. This can give a false pressure reading and, in the case of gauges containing delicate wire structures, could also damage the gauge structure. A baffle or other line-of-sight obstruction should be used to diffuse the gas entering the system.
The entrance ports of gauge heads should not be in line-of-sight from one another to limit possible interactions. When gauge heads are not connected to a vacuum system it is important to keep them clean and free from dust and debris. Enclosed gauge heads are usually provided with a protective cap; other types of gauges should be kept in dust-tight containers or cabinets when not in use.
9.4.2 Capacitance diaphragm gauges in vacuum regime For vacuum applications it is generally recommended that the sensor head be mounted in a vertical position with the port oriented downwards wherever possible. The reasons for this are twofold. Firstly, sensor heads are invariably calibrated in this orientation and re-orientation of the sensor head other may introduce gravitational effects on the diaphragm itself resulting in small inaccuracies. In particular, when the plane of the diaphragm is horizontal a gravitational force acts on the diaphragm which is indistinguishable from a pressure reading, when the plane is vertical this force is effectively zero resulting in slightly different sensor deflection. In most capacitance diaphragm gauges designs, at pressures above about 10% of the full scale deflection of the device, the diaphragm will make contact with the electrode producing an over-pressure reading. Particularly for low pressure sensors, it is recommended to use an isolation valve to protect the sensor head from pressures above full scale. Commonly re-zeroing of the device may then be necessary, though in extreme cases irreparable damage to the diaphragm may occur.
1 mbar = 100 Pa; 1 bar = 0.1 MPa 66

Guide to the Measurement of Pressure and Vacuum
9.4.3 Thermal conductivity gauges Table 9-1 Relative sensitivities of
a typical thermal conductivity gauge
Species
Relative
sensitivity
Nitrogen 1.0 Dry air 1.0
Water vapour 1.5 Argon 0.7
Hydrogen 1.4 Helium 1.0
Carbon monoxide 1.0 Carbon dioxide 1.1 Mercury vapour 0.3
Krypton 0.5 Xenon 0.4 Oxygen 1.0
Constant voltage mode operation has the advantage that the drive circuit is relatively simple; however, as the filament temperature varies with pressure, they are not so accurate at higher pressures (approaching atmospheric pressure). Constant temperature mode operation achieves better performance at higher pressures, but requires more sophisticated electronic circuitry. The pressure indication of these gauges (described in section 5.9) is dependent upon gas species; the nature of the dependency is complex and the relative sensitivity figures for different gases vary with pressure and the gauge characteristics. Some approximate values of relative sensitivity for pressures below 10 Pa is given in Table 9-1, but it should be noted that the figures are for general guidance only.
9.4.4 Ionisation gauges
9.4.4.1 Gauge sensitivity All the ionisation gauges described in section 5.11 use the collected ion current as an analogue of pressure. A number of uncertainties and variable quantities are included in the sensitivity, including the detailed geometry of an individual gauge, the values of potentials applied to the various electrodes etc. For example in a Bayard-Alpert gauge, small changes in the filament position due to ageing can change the sensitivity by several percent. For nominally identical gauge heads, a spread in sensitivities of ±10% is typical and spreads of ±50% or more are not unknown. It is therefore essential that individual gauges are calibrated when used for other than indicative purposes. The power supply to be used with the gauge should also be used in the calibration process for reproducibility. All the ionisation gauges described in section 5.11 use the collected ion current as an analogue of pressure. A number of factors, including the detailed geometry of an individual gauge and the values of potentials applied to the various electrodes effect their sensitivity. In this context, ionisation gauge sensitivity relates pressure to voltage. In a Bayard-Alpert gauge, for example, small changes in the filament position due to ageing can change
the sensitivity by several percent. For nominally identical gauge heads, a spread in sensitivities of ±10% is typical and spreads of ±50% or more are not unknown. It is therefore essential that individual gauges are calibrated when used for other than indicative purposes. The power supply to be used with the gauge should also be used in the calibration process for reproducibility.
Table 9-2 Relative sensitivties of a typical ionisation gauge
Species
Relative
sensitivity
Nitrogen 1.0 Dry air 0.9
Water vapour 0.8 to 2.0 Argon 1.4
Hydrogen 0.4 Helium 0.2
Carbon monoxide 1.0 Carbon dioxide 1.4
Neon 0.3
The sensitivity of the gauge includes the ionisation cross-section of the gas species under consideration. Since ionisation cross-sections vary from gas species to gas species, the pressure indicated by such gauges is species dependent. The cross-section is also somewhat sensitive to the energy of the electrons causing the ionisation. It is unfortunate that there is not a strong correlation between measured or calculated cross-sections for single-impact ionisation of isolated gas atoms or molecules and measured gauge sensitivities for different species. Hence again we have to rely on calibration. Table 9-2 lists sensitivities of a typical ionisation gauge for some gas species relative to nitrogen. The nitrogen equivalent pressure should be divided by these values to obtain the gas pressure. It should be noted that relative sensitivities are dependent not only on
1 mbar = 100 Pa; 1 bar = 0.1 MPa 67

Guide to the Measurement of Pressure and Vacuum
the type of ionisation gauge but also on the details of the construction of a particular gauge head. These values should therefore be taken as indicative only. For critical applications, individual gauges should be calibrated for the different gases of interest. It should be noted that in the UK and the rest of Europe most gauge calibration figures quoted by manufacturers are for nitrogen, so a ‘raw’ gauge reading will be a nitrogen equivalent pressure. In the US, however, many gauges are calibrated for argon.
9.4.4.2 The effect of a gauge on a vacuum system Ionisation gauges are not inert manometric devices and will, to a greater or lesser extent, influence what one is trying to measure. Hot cathode gauges, by definition, heat up and so will cause localised degassing of the vacuum system near the gauge which will increase the pressure. Such gauges should be carefully degassed if one is measuring low pressures, otherwise the reading of the gauge may be higher than the pressure in the system. This is particularly true if the gauge is in a side tube or an elbow. After the gauge has been used to measure chemically active gases, eg oxygen, the gauge sensitivity may well change considerably due to chemical changes in the surface of the grid or collector. Such changes may often be reversed by degasing thoroughly. The presence of a hot filament will also cause chemical changes in the residual gas in the vacuum system. For example, hydrogen � which is present in all vacuum systems � will react and water, carbon monoxide, carbon dioxide and methane will be produced. Care must therefore be taken to assess the effects of this on any process. The temperature and nature of the filament will be of some influence here. Filaments are often of tungsten wire but may be of thorium coated iridium or rhenium. The latter run at lower temperatures than tungsten, but the coating can flake off or can be chemically attacked, leading to instability of electron emission and hence gauge reading. They are, however, better able to withstand sudden exposures to atmosphere than tungsten filaments which will burn out. Ions, electrons and photons will be produced in the gauge and these can also desorb gases from surfaces inside the vacuum system. If the gauge is line-of-sight to a process, eg production of semiconductors, bombardment damage can occur or hydrocarbons on the surface can be cracked leading to a build up of carbon. It should also be noted that because gauges emit ions, electrons and photons, if there is more than one gauge in a vacuum system, perhaps attempting to measuring pressure at different points of the system, and the gauges are in line-of-sight with one another they can ‘talk’ to each other, ie each can cause spurious ionisation currents in the other, giving a false pressure indication. Similarly, false pressure readings can be caused by extraneous sources of ionising radiation such as X-ray sets, which can ‘see’ the ionisation region of the gauge head. Gauges also act as pumps. The pumping speed of a Bayard-Alpert gauge is quite low, although not negligible. That of a Penning gauge is surprisingly high � about 1 litre per second is typical. This effect needs to be considered particularly if the gauge is in a side tube or elbow with a low conductance connection to the main vacuum system where the pressure may become significantly lower than the actual pressure in the system.
1 mbar = 100 Pa; 1 bar = 0.1 MPa 68

Guide to the Measurement of Pressure and Vacuum
9.4.4.3 Comparison of types of ionisation gauge
Table 9-3 Ionisation gauge characteristics
Gauge
Advantages
Disadvantages
Triode
�� relatively robust �� sensitivity more uniform from
gauge to gauge �� good sensitivity �� relatively stable �� active gases cause relatively small
changes in sensitivity
�� hot filament �� large collector � gassy �� can exhibit slow drifts in sensitivity �� sensitive to magnetic fields �� non linear at lower pressures
Bayard-Alpert gauge
�� reasonable sensitivity �� linear to low pressures
�� hot filament �� can exhibit unpredictable changes in
sensitivity, especially after exposure to active gases.
�� can be delicate �� sensitive to magnetic fields �� variability of sensitivity from gauge to
gauge �� expensive
Penning gauge
�� robust �� no hot filament �� high sensitivity �� relatively cheap
�� can be difficult to start at low pressures �� discharge can extinguish at low pressures �� various discharge modes possible so can
exhibit unpredictable characteristic, especially at low pressure
�� non linear characteristic �� magnetic field present �� high pumping speed
Inverted magnetron gauge
�� robust �� starts at lower pressures than
penning gauge �� less susceptible to changes in
discharge mode �� discharge maintained at low
pressures �� high sensitivity
�� magnetic field present �� high pumping speed �� non linear characteristic
1 mbar = 100 Pa; 1 bar = 0.1 MPa 69

Guide to the Measurement of Pressure and Vacuum
9.5 Safety
9.5.1 General During the Industrial Revolution, many engineers and scientists began to appreciate the power available from a quantity of compressed gas and the relative ease with which this power could be generated. However, the evidence of this ease of power generation was all too frequently demonstrated with the many instances of boiler explosions that occurred. Safety was the main driving force behind early advances in pressure measurement and remains vital today [ 14 ] [ 22 ].
9.5.2 Stored energy The potential for harmful effects, should a pressure system fail, depends on the amount of energy stored in the system at the time of failure. This energy is held in three main forms. Compression energy is the energy stored in the working fluid as a result of compressing it to the working pressure. It is usually the main contribution to the stored energy and is much greater for gases than for liquids. Strain energy is the energy stored in the mechanical components, pipes, screw threads and gaskets due to the deflections that these components suffer when under pressure. Chemical energy is the energy stored in the chemical substances contained in the pressure system which might be released if the system fails. For example if the system contains a flammable gas, such as hydrogen, the gas may explode or catch fire when the system fails. The stored energy is the sum of the compression, strain and chemical energies together with any other possible means of storing energy. From a practical point of view, if the system contains an inert fluid, it is often reasonable to assume that the stored energy is the same as the compression energy. The compression energy of substances, especially gases, changes with pressure. It should be noted that for liquid filled (hydraulic) systems it is incorrect to assume that the stored energy is negligible. This may be true for small systems at but is rarely true at high pressures and is often untrue for large volume systems at low pressure. Vacuum systems are another special case. These are in fact pressure systems, like any other, but are externally pressurised rather than internally pressurised. The pressure difference across the wall of the vacuum system should be assumed to be 100 kPa and it should be noted that there is negligible difference in the stored energy between a system evacuated to 1000 Pa or one evacuated to 10-6 Pa. A Bourdon tube is often a relatively fragile part of a system, only safety pattern gauges should be used for high pressure measurement. These have a metal plate behind the dial and a blow-out back so that if the tube fails the fluids are expelled away from the operator. Such gauges must not be mounted with their backs flush to a panel and manufacturers usually provide mounting pillars so that they can be held away from a surface. For high pressure work a polycarbonate sheet should be fitted in front of the gauges or the gauges should be observed through closed circuit TV.
9.5.3 Failure mode The consequences of a pressure system failing depend upon the way in which it fails. The two main modes of failure are brittle fracture and ductile fracture. Brittle fracture is a very rapid process in which the component that fails breaks up into a very large number of small pieces. The breakage of glass is a good example. Each piece of the vessel or component that fails can become a missile which is ejected at high velocity away from the point of failure. Velocities are typically in the range 50 ms-1 to 250 ms-1 and barricading is required to contain the fragments. If the system is pressurised with a gas, brittle fracture will give rise to a blast wave which propagates in the air away from the point of failure at the speed of sound (about 300 ms-1). The blast wave is characterised by an increase in pressure (positive pulse) followed by a decrease in pressure (negative pulse). The passage of a blast wave leads to very large local deflections in objects that it encounters but, ideally, no net displacement after the wave has passed. The local deflections give rise to the destructive nature of blast waves. Ductile fracture is a relatively slow process which is accompanied by a significant amount of plastic deformation of the vessel or component that fails. It usually results in a bulge forming on the side of a tube followed by an axial split opening up along the bulge. It is possible for a whole section of pipe to be ejected as a single missile
1 mbar = 100 Pa; 1 bar = 0.1 MPa 70

Guide to the Measurement of Pressure and Vacuum
but more commonly the axial split terminates before this occurs. It is not possible to form a blast wave from a system which fails in a ductile fashion regardless of whether it is filled with gas or liquid. All things being equal, it is not necessary to barricade a system which will fail by ductile fracture, but knowing what mode of fracture will occur is the real question. Ductile failure is thus considerably less destructive than brittle failure and most pressure system components are designed to fail in this way. However, there are two additional variables that must be taken into account. Firstly, materials undergo a transition from ductile to brittle behaviour when the temperature is lowered. This is most noticeable for carbon steels and is much less so for stainless steels (which have a lower transition temperature). Secondly, there is a relationship between the toughness (propensity for fast crack propagation) and the tensile strength of the material. Materials which are very strong and hard tend to fail by brittle fracture (eg hardened drill bits) whereas lower strength materials (eg mild steel) tend to fail by ductile fracture. It should be noted that welding is a process which modifies both the composition and thermal history of the materials and can lead to enbrittlement. It should not be employed for components operating above about 50 MPa unless very careful metallurgical studies show that it is acceptable. High pressure systems often have to be made from high strength materials which are brittle and may fail by brittle fracture. In most cases systems operating at pressures above 0.1 GPa will need to be barricaded as will many gas filled systems working at lower pressures. Repeated cycling of the pressure in a component can lead to fatigue failure. Pressure transducers, which employ relatively thin diaphragms or tubes whose deflections are to be measured, are particularly vulnerable to this form of failure. Unusual conditions of cyclic loading may occur close to reciprocating pumps or compressors. Under these conditions the transducer should be fitted with a snubber (hydraulic damper) to minimise the amplitude of the pulsations. Environmental stress cracking (stress corrosion cracking) results from a chemical interaction between the metal of the vessel or component and the working fluid whilst the component is under pressure (load). Most aqueous solutions containing the chloride ion will produce cracks in both carbon and stainless steels. Exposure to mercury may result in liquid metal enbrittlement of carbon steels, brass, aluminium or monel. Growth of these cracks may lead to brittle failure. Environmental stress cracking is often associated with fatigue failure. The environmental stress cracking initiates formation of a fracture which is then propagated under cyclic loading. This is one common cause of low cycle fatigue. The time scale for failure can be very variable from a few hours to several years.
9.5.4 Instrumentation and control Since the measurement of pressure is often associated with safety-sensitive applications, the effect of human factors in the display of the measured pressure must be considered. A review of these took place in connection with the Three Mile Island nuclear accident in which interpretation of pressure measurements was a critical factor. Human factors affect all types of instrumentation not just pressure measurement. It has been found that digital, alphanumeric displays are generally better when accuracy of the presented information is the important factor. Analogue displays are better when changes in the pressure need to be observed. In either case, dual range instruments should always be avoided since it may be possible to read the pressure on the wrong scale. The same applies to instruments which have a switch which alters the units in which the measured information is displayed. Special consideration must be given to the selection of pressure measurement techniques for use in pressure control systems. The pressure rating of the device must be such that it can safely cope with all transient pressures as well as the proposed set point value. For transducers, it is best if the closed loop transfer function of the system leads to a critically damped or over-damped response to a step function input so that large overshoots and instabilities are avoided. In this respect the situation is far more critical at high pressures than at low pressures. For example, a 10% overshoot at 10 MPa (ie 1 MPa) may easily be accommodated whereas a similar excursion at 1 GPa (ie 100 MPa) presents a serious hazard. The reason for this is that at lower pressures (eg 10 MPa) a safety factor of about four times the design pressure is incorporated into pressure vessel design codes. For equipment operated at 1 GPa the safety factor may be only 10% such that the anticipated burst pressure is 1.1 times the actual working pressure. Cleanliness always aids safety, this is particularly important when dealing with very strong oxidising agents such as oxygen, fluorine, chlorine, nitric acid (fuming) and hydrogen peroxide.
1 mbar = 100 Pa; 1 bar = 0.1 MPa 71
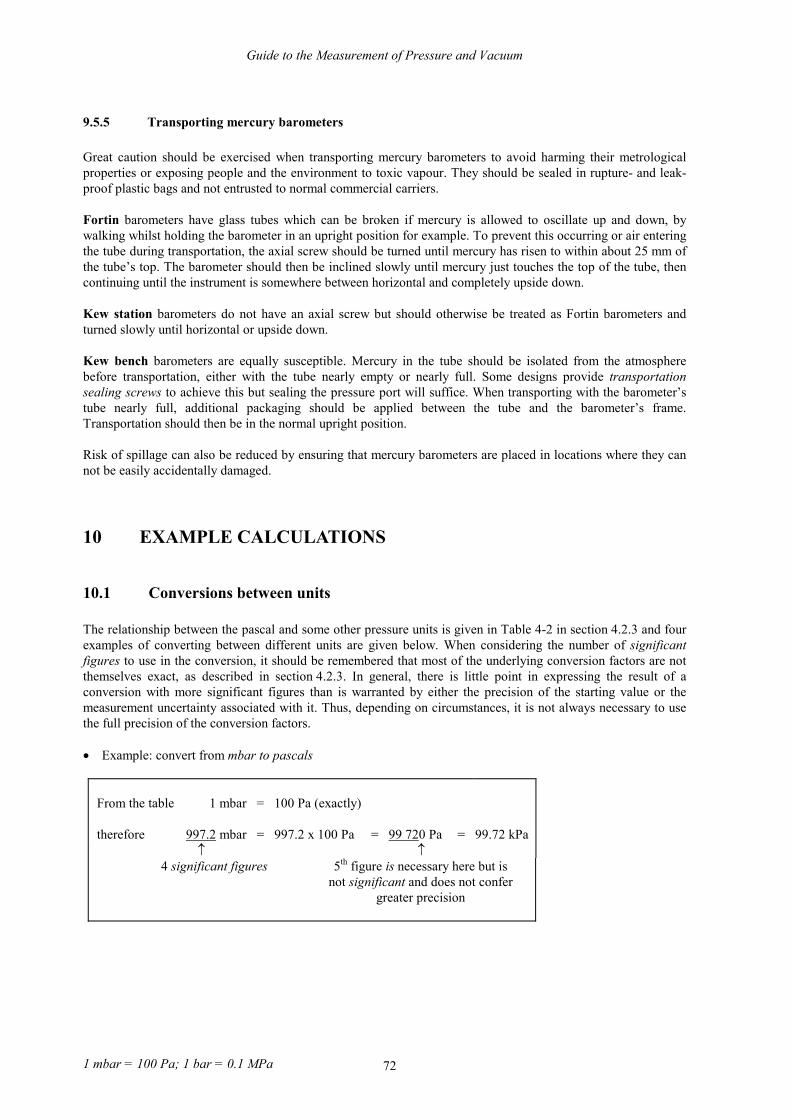
Guide to the Measurement of Pressure and Vacuum
9.5.5 Transporting mercury barometers Great caution should be exercised when transporting mercury barometers to avoid harming their metrological properties or exposing people and the environment to toxic vapour. They should be sealed in rupture- and leak-proof plastic bags and not entrusted to normal commercial carriers. Fortin barometers have glass tubes which can be broken if mercury is allowed to oscillate up and down, by walking whilst holding the barometer in an upright position for example. To prevent this occurring or air entering the tube during transportation, the axial screw should be turned until mercury has risen to within about 25 mm of the tube’s top. The barometer should then be inclined slowly until mercury just touches the top of the tube, then continuing until the instrument is somewhere between horizontal and completely upside down. Kew station barometers do not have an axial screw but should otherwise be treated as Fortin barometers and turned slowly until horizontal or upside down. Kew bench barometers are equally susceptible. Mercury in the tube should be isolated from the atmosphere before transportation, either with the tube nearly empty or nearly full. Some designs provide transportation sealing screws to achieve this but sealing the pressure port will suffice. When transporting with the barometer’s tube nearly full, additional packaging should be applied between the tube and the barometer’s frame. Transportation should then be in the normal upright position. Risk of spillage can also be reduced by ensuring that mercury barometers are placed in locations where they can not be easily accidentally damaged.
10 EXAMPLE CALCULATIONS
10.1 Conversions between units The relationship between the pascal and some other pressure units is given in Table 4-2 in section 4.2.3 and four examples of converting between different units are given below. When considering the number of significant figures to use in the conversion, it should be remembered that most of the underlying conversion factors are not themselves exact, as described in section 4.2.3. In general, there is little point in expressing the result of a conversion with more significant figures than is warranted by either the precision of the starting value or the measurement uncertainty associated with it. Thus, depending on circumstances, it is not always necessary to use the full precision of the conversion factors. �� Example: convert from mbar to pascals
From the table
1 mbar = 100 Pa (exactly)
therefore 997.2 mbar = 997.2 x 100 Pa = 99 720 Pa = 99.72 kPa � �
4 significant figures
5th figure is necessary here but is not significant and does not confer
greater precision
1 mbar = 100 Pa; 1 bar = 0.1 MPa 72

Guide to the Measurement of Pressure and Vacuum
�� Example: convert two similar values of millimetres of mercury to pascals
From the table
1 mmHg = 133.322… Pa
therefore 2.896 mmHg = 2.896 x 133.322 Pa = 386.100512 Pa and 2.897 mmHg = 2.897 x 133.322 Pa = 386.233834 Pa
� � least significant figures
differ by just ‘1’ (about 1 in 3 000)
figures less significant than about 1 in 4 000 are
meaningless
�� Example: convert pascals to pounds-force per square inch
From the table
1 lbf/in2 = 6 894.76… Pa
therefore 99.631 kPa = 99.631 x 1000 � 6 894.76 lbf/in2 = 14.450249 lbf/in2 � � �
least significant figure represents about 1 part in 100 000
the kilo part not needed
�� Example: convert inches of mercury to kilogram-force per square centimetre
From the table 1 inHg = 3 386.39… Pa and 1 kgf/cm2 = 98 066.5 Pa (exactly)
therefore 29.471 inHg = 29.471 x 3 386.39 Pa � = 29.471 x 3 386.39 � 98 066.5 kgf/cm2 = 1.017 68 kgf/cm2
� � least significant figure
represents about 1 part in 30 000
least significant figure represents about 1 part in 100 000
10.2 Comparison of ‘% reading’ and ‘% full scale reading’ The measurement uncertainties achievable with pressure gauges are often expressed in one of two ways � as a percentage of reading or as a percentage of full-scale reading and the differences can be very significant, particularly when working at pressures well away from full-scale. The dominant uncertainties in an instrument are often constant � a specified number of pascals for example ie they do not change as the pressure changes. Expressing such a ‘fixed’ pressure uncertainty as a proportion of the pressure value (which is what most users want to know), however, creates some very large numbers; indeed at zero pressure the uncertainty expressed as percentage of reading is infinite! Specification sheets sometimes show uncertainties as a proportion of full-scale pressure and this can confusingly imply better performance. Table 10-1 shows the uncertainties in the measurement of pressure, first given as 1% of reading and second expressed as 1% of full-scale reading. In the region marked with arrows, the device performing to 1% of full-scale reading is unlikely to make a meaningful measurement. The same data is shown graphically in Figure 10-1.
1 mbar = 100 Pa; 1 bar = 0.1 MPa 73

Guide to the Measurement of Pressure and Vacuum
Table 10-1 Example comparison of two common methods of expressing uncertainty
Different meanings of ‘1% uncertainty’
‘Percent of reading’
‘Percent of full-scale reading’
Instrument
reading in pressure
units (eg Pascals)
Uncertainty in pressure
units (eg Pascals)
Equivalent ‘percentage of full-scale
reading’
Uncertainty in pressure
units (eg Pascals)
Equivalent
‘percentage of reading’
1000 10 1% 10 1% 500 5 0.5% 10 2% 100 1 0.1% 10 10% 50 0.5 0.05% 10 20% 10 0.1 0.01% 10 100% � See 5 0.05 0.005% 10 200% � comment 0 0.00 - 10 � above
Uncertainty/Pa
Instrument reading/Pa
1% of reading
1% of full scale reading
0 1000
10
0
Figure 10-1 Different meanings of ‘1% uncertainty’
10.3 Hydrostatic head correction Pressure in a fluid, whether it be gas or liquid, varies with height. It doesn’t matter whether the fluid is in pipework or more loosely confined such the atmosphere or the sea � just so long as there is gravitational acceleration.
1 mbar = 100 Pa; 1 bar = 0.1 MPa 74

Guide to the Measurement of Pressure and Vacuum
If a pressure value at a different height from that at the measuring instrument is required, an allowance may have to be made for the intervening hydrostatic head (alternatively called fluid head). The pressure at a height H metres above that of the measuring instrument is given by:
P = P - gHUh i
�
(9)
where Ph is the pressure at level H metres above the measuring instrument Pi is the pressure at the measuring instrument � is the density of the fluid in kg.m-3 g is the acceleration due to gravity in m.s-2 H is the height in metres above the measuring instrument at which the pressure value is required U is a factor which converts the height correction term from pascals to the pressure units used. This expression is valid for small height differences. Within buildings is may be used to calculate the difference in the value of atmospheric pressure from floor to floor but only provided that there are no other causes of pressure differential such as wind, air conditioning fans etc. Liquids are, to a good approximation, incompressible and so the correction for liquid systems can be expressed in terms of a pressure difference per unit height; for example its value for water is very roughly 10 kPa per metre. Gases are compressible so the correction is pressure dependent and can be expressed as a proportion of the pressure value; very roughly, 1 part in 10 000 per metre at atmospheric pressure.
11 FURTHER READING
11.1 British and international standards [ 1 ] ISO 3529/1-1981 Vacuum Technology � Vocabulary � part 1: General terms. [ 2 ] ISO 3529/3-1981 Vacuum Technology � Vocabulary � part 3: Vacuum gauges. [ 3 ] ISO 10012-1: 1992 Quality assurance requirements for measuring equipment � part 1: Metrological
confirmation system for measuring equipment. [ 4 ] BS 1780: 1985 British Standard � Specification for Bourdon tube pressure and vacuum gauges. [ 5 ] BS 2520: 1983 British Standard � Barometer conventions and tables, their application and use. [ 6 ] BS 5233: 1986 British Standard � Glossary of terms used in metrology. [ 7 ] BS 6134: 1991 British Standard � Specification for pressure and vacuum switches. [ 8 ] BS 6174: 1982 British Standard � Specification for differential pressure transmitters with electrical
outputs. [ 9 ] BS 6739: 1986 British Standard � Code of practice for instrumentation in process control systems:
installation, design and use. [ 10 ] BS EN 60529: 1992 British Standard � Specification for degrees of protection provided by enclosures
(IP code).
1 mbar = 100 Pa; 1 bar = 0.1 MPa 75
Guide to the Measurement of Pressure and Vacuum
11.2 Introductory reading [ 11 ] Blake, W.K. Differential Pressure Measurements, Chapter 3 in Fluid Mechanics Measurements, Ed.:
Goldstein, R.J., Hemisphere, 1983. [ 12 ] Chambers, A., Fitch, R.K. and Halliday, B.S. Basic Vacuum Technology, IoP Publishing, Adam Hilger,
1989. [ 13 ] Harris, N. Modern Vacuum Practice, McGraw-Hill, 1989. [ 14 ] High Pressure Technology Association, High Pressure Safety Code, Eds.: Cox, B.G. and Saville, G.
High Pressure Technology Association, 1975. (Note: 2nd Edition is in press.) [ 15 ] Hucknall, D.J. Vacuum Technology and Applications, Butterworth-Heinemann, 1991. [ 16 ] Lewis, S.L. and Peggs, G.N. The Pressure Balance � A Practical Guide to Its Use, HMSO, 1992. [ 17 ] Noltingk, B.E. (Ed.) Instrumentation, 2nd Ed., Butterworth-Heinemann, 1995. [ 18 ] O’Hanlon, J.F. A User’s Guide to Vacuum Technology, 2nd Ed., Wiley, 1989. [ 19 ] Tilford, C.R. Pressure and Vacuum Measurements, Chapter 2 in Physical Methods of Chemistry,
2nd Ed., Volume Six: Determination of Thermodynamic Properties, Eds.: Rossiter, B.W. and Baetzold, R.C., John Wiley, 1992.
11.3 Advanced reading [ 20 ] Berman, A. Total Pressure Measurements in Vacuum Technology, Academic Press, 1985. [ 21 ] Dadson, R.S., Lewis, S.L. and Peggs, G.N. The Pressure Balance � Theory and Practice, HMSO, 1982. [ 22 ] Health and Safety Executive. Guide to the Pressure Systems and Transportable Gas Container
Regulations 1989 HSR30, HSE Books, 1990. [ 23 ] Herceg, E.E. Handbook of Measurement and Control (Theory and Application of the LVDT), Schaevitz
Engineering, 1976. [ 24 ] Le Neindre, B and Vodar, B. (Eds). Experimental Thermodynamics Volume II: Experimental
Thermodynamics of Non-reacting Fluids, IUPAC Publications, Butterworths, 1975. [ 25 ] Leck, J.H. Total and Partial Pressure Measurements in Vacuum Systems, Blackie & Son, 1989. [ 26 ] Pavese, F. and Molinar, G. Modern Gas-Based Temperature and Pressure Measurements in
International Cryogenic Monograph Series, Eds.: Timmerhaus, K.D., Clark, A.F. and Rizzuto, C. Plenum Press, 1992.
[ 27 ] Peggs, G.N. (Ed.) High Pressure Measurement Techniques, Applied Science, 1983. [ 28 ] Sherman, W.F. and Stadtmuller, A.A. Experimental Techniques in High Pressure Research, Wiley,
1987. [ 29 ] Stuart, P.R. ‘Code of specification for partial pressure analysers’, Vacuum, 45, 889-891, 1994. [ 30 ] Wutz, W., Adam, H. and Walcher, W. Theory and Practice of Vacuum Technology, Vieweg, 1989.
1 mbar = 100 Pa; 1 bar = 0.1 MPa 76
Guide to the Measurement of Pressure and Vacuum
1 mbar = 100 Pa; 1 bar = 0.1 MPa 77
11.4 Useful texts not specific to pressure and vacuum [ 31 ] Dietrich, C. F. Uncertainty, Calibration and Probability, 2nd Ed., Adam Hilger, 1991. [ 32 ] International Organisation for Standardisation, Guide to the Expression of Uncertainty in Measurement,
ISO, 1993. [ 33 ] International Organisation for Standardisation. International Vocabulary of Basic and General Terms in
Metrology, ISO, 1995. [ 34 ] Institute of Measurement and Control. Instrument Engineer’s Yearbook, Institute of Measurement and
Control, Annual publication. [ 35 ] Kaye, G.W.C. and Laby, T.H. Tables of Physical and Chemical Constants, 16th Ed., Longmans, 1995. [ 36 ] UKAS. M 3003: The Expression of Uncertainty and Confidence in Measurement, UKAS, 1997. (A
simplification of the ISO Guide above, available from UKAS, see section 11.5).
11.5 Useful addresses British Geological Survey (BGS), Keyworth, Nottingham, NG12 5GG. British Standards Institution (BSI), 389 Chiswick High Road, London W4 4AL. European Co-operation for Accreditation of Laboratories (EAL), PO Box 29152, 3001 GD Rotterdam, Netherlands. Institute of Measurement and Control (InstMC), 87 Gower Street, London, WC1E 6AA. National Physical Laboratory (NPL), Queens Road, Teddington, Middlesex, TW11 0LW. United Kingdom Accreditation Service (UKAS), Queens Road, Teddington, Middlesex, TW11 0NA.
Related Documents