Guide to the Markets UK | | MARKET INSIGHTS Q3 2018 As of 30 June 2018

Welcome message from author
This document is posted to help you gain knowledge. Please leave a comment to let me know what you think about it! Share it to your friends and learn new things together.
Transcript

Guide to the MarketsUK | |
MARKET INSIGHTS
Q3 2018 As of 30 June 2018

2
Global Market Insights Strategy Team
Manuel Arroyo Ozores, CFAMadrid
Lucia Gutierrez MelladoMadrid
Vincent JuvynsLuxembourg
Tilmann Galler, CFAFrankfurt
Maria Paola ToschiMilan
Tai HuiHong Kong
Ian HuiHong Kong
Marcella ChowHong Kong
Dr. Jasslyn Yeo, CFASingapore
Kerry Craig, CFAMelbourne
Chaoping Zhu, CFAShanghai
Alex Dryden, CFANew York
Dr. David Kelly, CFANew York
Samantha AzzarelloNew York
Gabriela SantosNew York
David LebovitzNew York
Jordan Jackson
New York
John Manley
New York
Tyler Voigt
New York
Hannah Anderson
Hong Kong
Yoshinori ShigemiTokyo
Shogo Maekawa
Tokyo
Nandini RamakrishnanLondon
Michael Bell, CFALondon
Jai MalhiLondon
Ambrose CroftonLondon
Karen WardLondon
Dr. Cecelia MundtNew York
Agnes Lin
Taiwan

3
Page reference
� Global economy
4. Global growth5. Global Purchasing Managers’ Index (PMI) for manufacturing6. Global unemployment7. Global inflation8. Global core inflation9. Global central bank policy10. Global currencies11. Global trade12. Productivity and population growth13. US GDP14. US corporates15. US consumer16. US labour market17. US inflation18. US Federal Reserve policy rate19. US debt20. US focus: Fiscal expansion21. Eurozone GDP22. Eurozone corporates23. Eurozone consumer24. Eurozone labour market25. Eurozone inflation26. European Central Bank policy rate27. Eurozone debt28. European politics29. Eurozone focus: Northern European exposure to Italy30. UK GDP31. UK consumer32. UK labour market33. UK inflation34. UK Bank of England policy rate35. UK focus: Trade partners36. Japan GDP37. Japan inflation38. China GDP39. China debt40. China inflation and policy rates41. Emerging markets GDP and inflation42. Emerging markets currencies and current account43. Emerging markets structural dynamics44. Emerging markets focus: Differentiating external vulnerabilities
� Equities
45. Global equity earnings and valuations46. US stock market47. US earnings48. US equity macro correlations49. US equity valuations50. US valuations and subsequent returns51. Equities and interest rates52. US bull and bear markets53. Equity income54. US sector returns and valuations55. Europe ex-UK stock market56. Europe ex-UK earnings57. Europe ex-UK equity macro correlations58. Europe ex-UK equity market and currency59. Europe ex-UK equity valuations60. Europe ex-UK large, mid and small capitalisation equities61. Europe sector returns and valuations62. UK stock market63. UK earnings64. UK equity market and currency65. UK large, mid and small capitalisation equities66. Japan stock market67. Japan earnings68. Japan equity market and currency69. Japan corporate governance70. Emerging markets performance and earnings expectations71. Emerging markets equity drivers72. Emerging markets equity valuations and subsequent returns73. Correlation and volatility74. World stock market returns
� Fixed income
75. Fixed income yields and interest rate risk76. US nominal and real 10-year government bond yields77. US yield curve78. US investment-grade bonds79. US high yield bonds80. Europe nominal and real 10-year government bond yields81. Europe and UK investment-grade bonds82. Europe high yield bonds83. Emerging markets bonds84. Global fixed income spreads and returns
� Other assets
85. Commodities86. Gold87. Stock-bond correlation and downside protection88. Alternative investments89. Sustainable investing90. Asset markets in coming years
� Investing principles
91. Life expectancy92. Cash investments93. The power of compounding94. Annual returns and intra-year declines95. Impact of being out of the market96. US asset returns by holding period97. Asset class returns (GBP)

4
GTM – UK |
2018consensus forecast
2.9%
2.2%
1.3%
1.1%
Source: BEA, Bloomberg, Eurostat, Japan Cabinet Office, ONS, Thomson Reuters Datastream, J.P. Morgan Asset Management. Forecasts are from Bloomberg contributor composite. Past performance is not a reliable indicator of current and future results. Guide to the Markets - UK. Data as of 30 June 2018.
Global growth
Real GDP growth% change year on year
4
Global economy
Eurozone
US
UK
Japan
-10
-8
-6
-4
-2
0
2
4
6
'00 '02 '04 '06 '08 '10 '12 '14 '16 '18
5
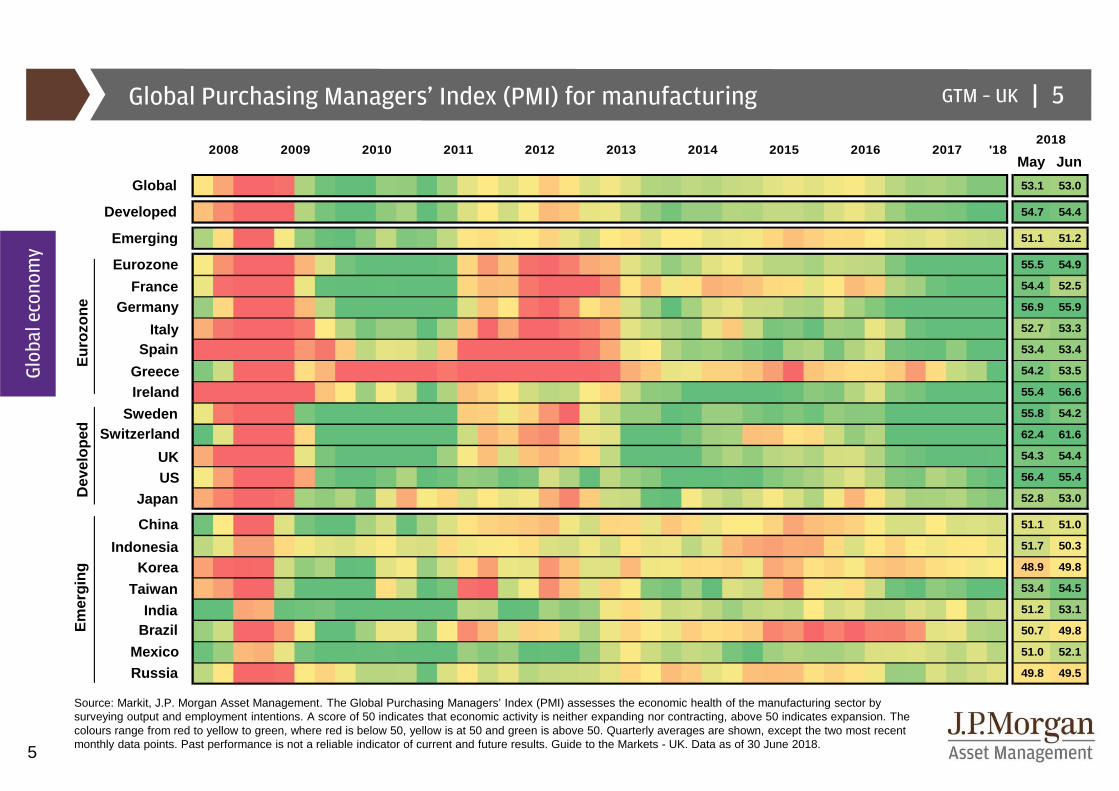
53.1 53.0
54.7 54.4
51.1 51.2
55.5 54.9
54.4 52.5
56.9 55.9
52.7 53.3
53.4 53.4
54.2 53.5
55.4 56.6
55.8 54.2
62.4 61.6
54.3 54.4
56.4 55.4
52.8 53.0
51.1 51.0
51.7 50.3
48.9 49.8
53.4 54.5
51.2 53.1
50.7 49.8
51.0 52.1
49.8 49.5
20082018
2009 2010 2011 2012 2013 2014 2015 2016 2017 '18
Global Purchasing Managers’ Index (PMI) for manufacturing
Source: Markit, J.P. Morgan Asset Management. The Global Purchasing Managers’ Index (PMI) assesses the economic health of the manufacturing sector by surveying output and employment intentions. A score of 50 indicates that economic activity is neither expanding nor contracting, above 50 indicates expansion. The colours range from red to yellow to green, where red is below 50, yellow is at 50 and green is above 50. Quarterly averages are shown, except the two most recent monthly data points. Past performance is not a reliable indicator of current and future results. Guide to the Markets - UK. Data as of 30 June 2018.
GTM – UK |
Global economy
5
India
Indonesia
Greece
Germany
China
USUK
Eurozone
France
ItalySpain
Ireland
Japan
Korea
Global
Developed
Emerging
Taiwan
Mexico
Brazil
Russia
SwitzerlandSweden
Eur
ozon
eD
evel
oped
Em
ergi
ng
May Jun

6
GTM – UK |Global unemployment
Unemployment rates%
Source: BLS, Eurostat, Japan Ministry of Internal Affairs & Communications, ONS, Thomson Reuters Datastream, J.P. Morgan Asset Management. Past performance is not a reliable indicator of current and future results. Guide to the Markets - UK. Data as of 30 June 2018.
US
Eurozone
Japan
UK
Global economy
6
1
3
5
7
9
11
13
'00 '02 '04 '06 '08 '10 '12 '14 '16 '18

7
Global inflation
Source: Bank of Mexico, DGBAS, ECB, FactSet, Federal Reserve, Goskomstat of Russia, IBGE, India Ministry of Statistics & Programme Implementation, Japan Ministry of Internal Affairs & Communication, Korean National Statistical Office, National Bureau of Statistics China, Riksbank, Statistics Indonesia, Swiss National Bank, UK Office for National Statistics (ONS), J.P. Morgan Asset Management. Figures are % change year on year. Heatmap colours are based on the respective central bank target inflation rates. Blue is below target, white is at target and red is above target. Past performance is not a reliable indicator of current and future results. Guide to the Markets - UK. Data as of 30 June 2018.
Global economy
GTM – UK | 7
India
Indonesia
Greece
Germany
USUK
EurozoneFrance
ItalySpain
Ireland
JapanChina
Korea
Global
Developed
Emerging
Taiwan
MexicoBrazil
Russia
SwitzerlandSweden
Eur
ozon
eD
evel
oped
Em
ergi
ng
Jan
Mar
Nov
Dec
May
Jul
2016
Jun
Jul
Aug
Sep
Oct
2017
Feb
Apr Jun
Aug
Sep Oct
Nov
Dec
Jan
Feb
2018
Mar
Apr
May
1.6 1.5 1.5 1.7 1.8 1.9 2.1 2.4 2.2 2.1 2.1 2.0 1.8 1.8 2.0 2.1 2.0 2.2 2.2 2.1 2.3 2.2 2.2 2.4
0.6 0.5 0.6 0.9 1.1 1.2 1.5 2.0 2.1 1.8 1.9 1.6 1.4 1.5 1.7 1.8 1.6 1.8 1.8 1.8 1.8 1.9 1.8 2.2
3.2 3.2 2.9 3.0 3.1 3.1 2.9 3.2 2.4 2.5 2.6 2.6 2.4 2.3 2.6 2.5 2.7 2.7 2.9 2.5 3.2 2.8 2.7 2.8
0.1 0.2 0.2 0.4 0.5 0.6 1.1 1.8 2.0 1.5 1.9 1.4 1.3 1.3 1.5 1.5 1.4 1.5 1.4 1.3 1.1 1.3 1.3 1.9
0.3 0.4 0.4 0.5 0.5 0.7 0.8 1.6 1.4 1.4 1.4 0.9 0.8 0.8 1.0 1.1 1.2 1.2 1.3 1.5 1.3 1.7 1.8 2.3
0.2 0.4 0.3 0.5 0.7 0.7 1.7 1.9 2.2 1.5 2.0 1.4 1.5 1.5 1.8 1.8 1.5 1.8 1.6 1.4 1.2 1.5 1.4 2.2
-0.2 -0.2 -0.1 0.1 -0.1 0.1 0.5 1.0 1.6 1.4 2.0 1.6 1.2 1.2 1.4 1.3 1.1 1.1 1.0 1.2 0.5 0.9 0.6 1.0
-0.9 -0.7 -0.3 0.0 0.5 0.5 1.4 2.9 3.0 2.2 2.6 2.0 1.6 1.7 2.0 1.8 1.7 1.8 1.2 0.7 1.2 1.3 1.1 2.1
0.2 0.2 0.4 -0.1 0.6 -0.2 0.3 1.5 1.4 1.7 1.7 1.5 0.9 0.9 0.6 1.0 0.5 1.1 1.0 0.2 0.4 0.2 0.5 0.8
0.1 0.1 -0.4 -0.3 -0.4 -0.2 -0.2 0.2 0.3 0.6 0.7 0.0 -0.6 -0.2 0.4 0.2 0.5 0.5 0.5 0.3 0.7 0.5 -0.1 0.7
1.2 1.1 1.2 0.8 1.1 1.3 1.7 1.5 1.9 1.4 2.0 1.8 1.8 2.3 2.2 2.2 1.7 1.9 1.7 1.6 1.6 2.0 1.8 2.0
-0.6 -0.5 0.0 -0.3 -0.3 -0.2 -0.2 0.3 0.7 0.5 0.7 0.4 0.4 0.6 0.5 0.8 0.8 0.8 1.1 0.8 0.5 0.7 0.4 1.0
0.5 0.6 0.6 1.0 0.9 1.2 1.6 1.8 2.3 2.3 2.7 2.9 2.6 2.6 2.9 3.0 3.0 3.1 3.0 3.0 2.7 2.5 2.4 2.4
1.0 0.8 1.1 1.5 1.6 1.7 2.1 2.5 2.7 2.4 2.2 1.9 1.6 1.7 1.9 2.2 2.0 2.2 2.1 2.1 2.2 2.4 2.5 2.8
-0.4 -0.4 -0.5 -0.5 0.1 0.5 0.3 0.4 0.3 0.2 0.4 0.4 0.4 0.4 0.7 0.7 0.2 0.6 1.0 1.4 1.5 1.1 0.6 0.7
1.9 1.8 1.3 1.9 2.1 2.3 2.1 2.5 0.8 0.9 1.2 1.5 1.5 1.4 1.8 1.6 1.9 1.7 1.8 1.5 2.9 2.1 1.8 1.8
3.5 3.2 2.8 3.1 3.3 3.6 3.0 3.5 3.8 3.6 4.2 4.3 4.4 3.9 3.8 3.7 3.6 3.3 3.6 3.3 3.2 3.4 3.4 3.2
0.7 0.4 0.5 1.4 1.5 1.5 1.3 2.0 1.9 2.2 1.9 2.0 1.9 2.3 2.6 2.1 1.8 1.3 1.5 1.0 1.5 1.3 1.6 1.5
0.9 1.2 0.6 0.3 1.7 2.0 1.7 2.2 -0.1 0.2 0.1 0.6 1.0 0.8 1.0 0.5 -0.3 0.3 1.2 0.9 2.2 1.6 2.0 1.6
5.8 6.1 5.0 4.4 4.2 3.6 3.4 3.2 3.7 3.9 3.0 2.2 1.5 2.4 3.3 3.3 3.6 4.9 5.2 5.1 4.4 4.3 4.6 4.9
8.8 8.7 9.0 8.5 7.9 7.0 6.3 5.4 4.8 4.6 4.1 3.6 3.0 2.7 2.5 2.5 2.7 2.8 3.0 2.9 2.8 2.7 2.8 2.9
2.5 2.7 2.7 3.0 3.1 3.3 3.4 4.7 4.9 5.4 5.8 6.2 6.3 6.4 6.7 6.4 6.4 6.6 6.8 5.6 5.3 5.0 4.6 4.5
7.5 7.2 6.9 6.4 6.1 5.8 5.4 5.1 4.6 4.3 4.1 4.1 4.4 3.9 3.3 3.0 2.7 2.5 2.5 2.2 2.2 2.3 2.4 2.4
8
GTM – UK |
-2
-1
0
1
2
3
4
'00 '02 '04 '06 '08 '10 '12 '14 '16 '18
Average since 2000
Latest
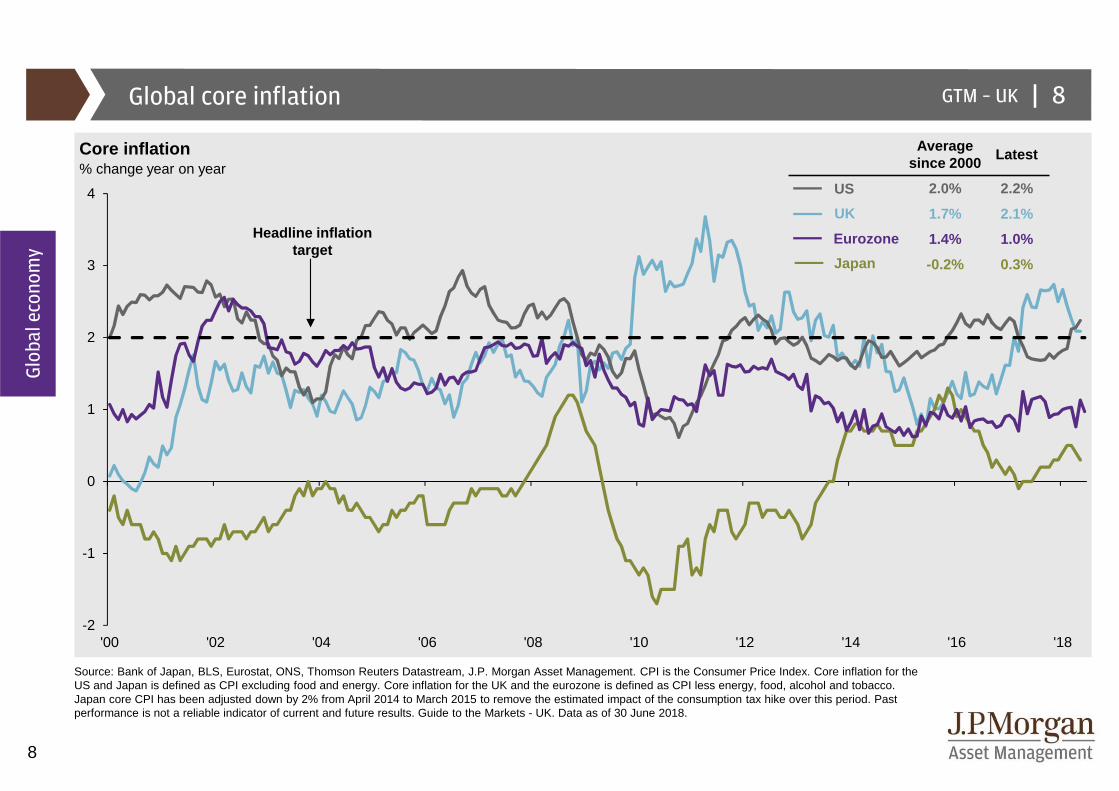
2.0% 2.2%
1.7% 2.1%
1.4% 1.0%
-0.2% 0.3%
Global core inflation
Core inflation% change year on year
Source: Bank of Japan, BLS, Eurostat, ONS, Thomson Reuters Datastream, J.P. Morgan Asset Management. CPI is the Consumer Price Index. Core inflation for the US and Japan is defined as CPI excluding food and energy. Core inflation for the UK and the eurozone is defined as CPI less energy, food, alcohol and tobacco. Japan core CPI has been adjusted down by 2% from April 2014 to March 2015 to remove the estimated impact of the consumption tax hike over this period. Past performance is not a reliable indicator of current and future results. Guide to the Markets - UK. Data as of 30 June 2018.
Global economy
8
Headline inflation target
US
Eurozone
Japan
UK
9
GTM – UK |
-0.5
0.0
0.5
1.0
1.5
2.0
2.5
3.0
Jun ’22
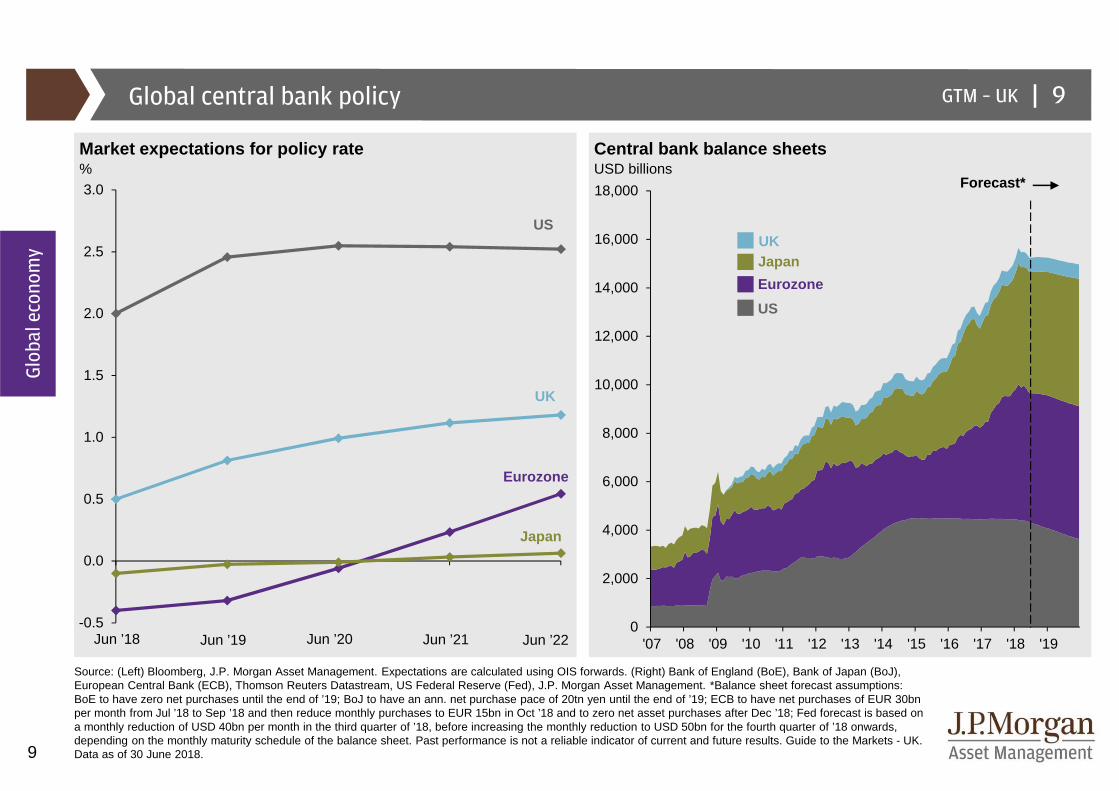
Global central bank policy
Market expectations for policy rate Central bank bal ance sheets% USD billions
Source: (Left) Bloomberg, J.P. Morgan Asset Management. Expectations are calculated using OIS forwards. (Right) Bank of England (BoE), Bank of Japan (BoJ), European Central Bank (ECB), Thomson Reuters Datastream, US Federal Reserve (Fed), J.P. Morgan Asset Management. *Balance sheet forecast assumptions: BoE to have zero net purchases until the end of ’19; BoJ to have an ann. net purchase pace of 20tn yen until the end of ’19; ECB to have net purchases of EUR 30bn per month from Jul ’18 to Sep ’18 and then reduce monthly purchases to EUR 15bn in Oct ’18 and to zero net asset purchases after Dec ’18; Fed forecast is based on a monthly reduction of USD 40bn per month in the third quarter of ’18, before increasing the monthly reduction to USD 50bn for the fourth quarter of ’18 onwards, depending on the monthly maturity schedule of the balance sheet. Past performance is not a reliable indicator of current and future results. Guide to the Markets - UK. Data as of 30 June 2018.
Forecast*
Global economy
9
US
UK
Eurozone
Japan
US
Eurozone
Japan
UK
Jun ’18 Jun ’19 Jun ’21Jun ’200
2,000
4,000
6,000
8,000
10,000
12,000
14,000
16,000
18,000
'07 '08 '09 '10 '11 '12 '13 '14 '15 '16 '17 '18 '19

10
GTM – UK |Global currencies
Real effective exchange ratesIndex level rebased to 100 in 2010, broad real effective exchange rate (REER)
Source: J.P. Morgan Securities Research, Thomson Reuters Datastream, J.P. Morgan Asset Management. Past performance is not a reliable indicator of current and future results. Guide to the Markets - UK. Data as of 30 June 2018.
Global economy
10
USD
EUR
JPY
GBP
60
70
80
90
100
110
120
130
140
150
160
'75 '77 '79 '81 '83 '85 '87 '89 '91 '93 '95 '97 '99 '01 '03 '05 '07 '09 '11 '13 '15 '17

11
GTM – UK |Global trade
Exports of goods Global export volumes% of GDP, 2017 % change year on year, three-month moving average
Source: (Left) IMF Direction of Trade, IMF World Economic Outlook October 2017, J.P. Morgan Asset Management. (Right) CPB Netherlands, Thomson Reuters Datastream, J.P. Morgan Asset Management. Past performance is not a reliable indicator of current and future results. Guide to the Markets - UK.Data as of 30 June 2018.
Global economy
11
China
EM ex-China
US
Eurozone
Other DM
Global
EM
Brazil
US
Eurozone
Canada
India
China
Russia
Mexico
Japan
Korea
UK
0 5 10 15 20 25 30 35 40 45-2
-1
0
1
2
3
4
5
6
7
8
'12 '13 '14 '15 '16 '17 '18
12
GTM – UK |
-1.0
-0.8
-0.6
-0.4
-0.2
0.0
0.2
0.4
0.6
0.8
1.0
1.2
US UK Eurozone Japan0.0
0.5
1.0
1.5
2.0
2.5
3.0
3.5
4.0
4.5
5.0
'58-'67 '68-'77 '78-'87 '88-'97 '98-'07 '08-'17
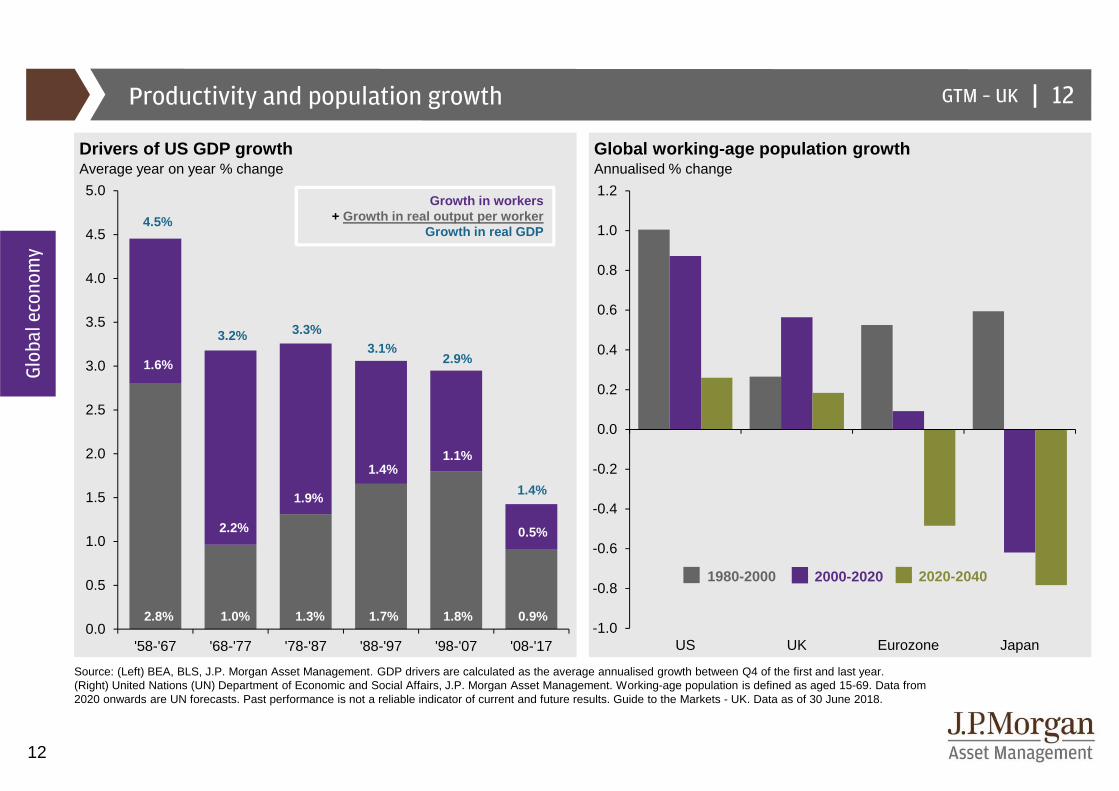
Productivity and population growth
Drivers of US GDP growth Global working-age population growthAverage year on year % change Annualised % change
Source: (Left) BEA, BLS, J.P. Morgan Asset Management. GDP drivers are calculated as the average annualised growth between Q4 of the first and last year. (Right) United Nations (UN) Department of Economic and Social Affairs, J.P. Morgan Asset Management. Working-age population is defined as aged 15-69. Data from 2020 onwards are UN forecasts. Past performance is not a reliable indicator of current and future results. Guide to the Markets - UK. Data as of 30 June 2018.
Global economy
2000-2020 2020-20401980-2000
Growth in workers + Growth in real output per worker
Growth in real GDP
12
1.6%
2.2%
1.9%
1.4%1.1%
2.8% 1.0% 1.3% 1.7% 1.8% 0.9%
4.5%
3.2% 3.3%3.1%
2.9%
1.4%
0.5%
13
GTM – UK |
30
35
40
45
50
55
60
65
-8
-6
-4
-2
0
2
4
6
'00 '01 '02 '03 '04 '05 '06 '07 '08 '09 '10 '11 '12 '13 '14 '15 '16 '17 '18
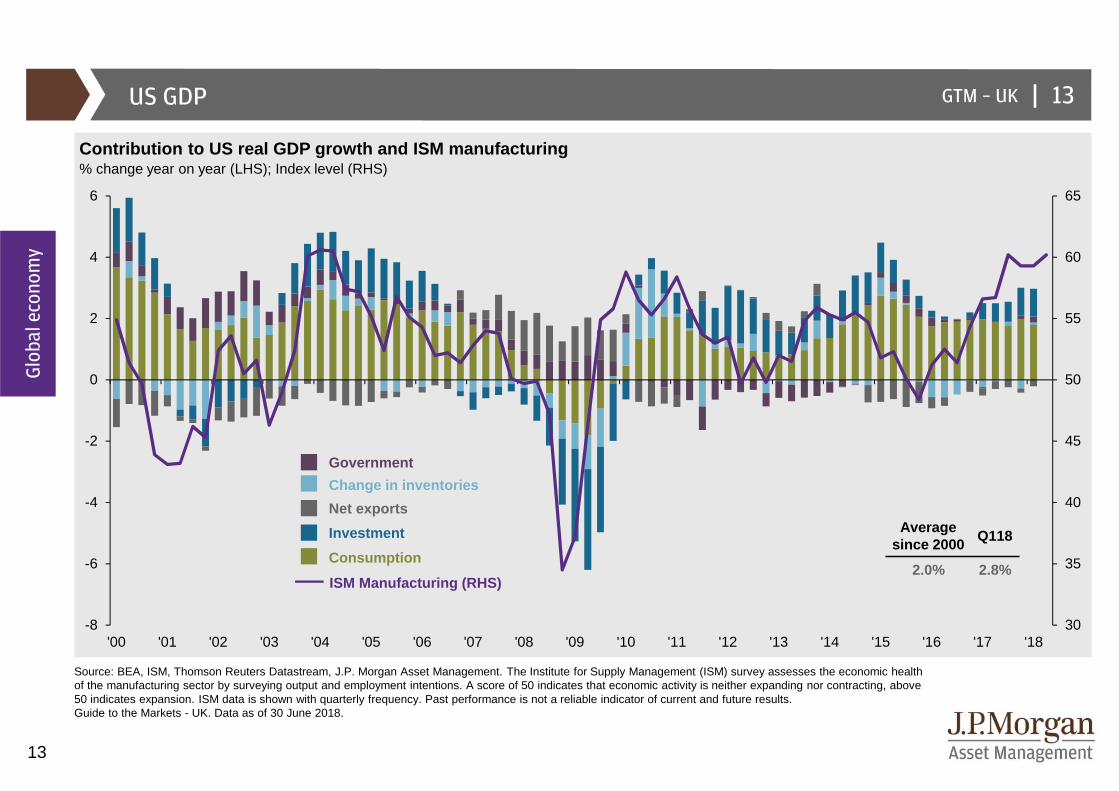
US GDP
Contribution to US real GDP growth and ISM manufact uring% change year on year (LHS); Index level (RHS)
Source: BEA, ISM, Thomson Reuters Datastream, J.P. Morgan Asset Management. The Institute for Supply Management (ISM) survey assesses the economic health of the manufacturing sector by surveying output and employment intentions. A score of 50 indicates that economic activity is neither expanding nor contracting, above 50 indicates expansion. ISM data is shown with quarterly frequency. Past performance is not a reliable indicator of current and future results. Guide to the Markets - UK. Data as of 30 June 2018.
Change in inventories
Net exports
Investment
Consumption
Government
ISM Manufacturing (RHS)
Global economy
Average since 2000
Q118
2.0% 2.8%
13

14
GTM – UK |US corporates
US future capex intentions and business investmentIndex level (LHS); % change year on year (RHS)
Source: BEA, Dallas Fed, Kansas City Fed, New York Fed, Philadelphia Fed, Richmond Fed, Thomson Reuters Datastream, J.P. Morgan Asset Management. Capexintentions is an average index level of the five aforementioned fed districts equally weighted, displayed using a three-month moving average. Past performance is not a reliable indicator of current and future results. Guide to the Markets - UK. Data as of 30 June 2018.
Future capex intentions
Business investment
Global economy
14
-20
-10
0
10
20
-30
-20
-10
0
10
20
30
40
'00 '01 '02 '03 '04 '05 '06 '07 '08 '09 '10 '11 '12 '13 '14 '15 '16 '17 '18

15
GTM – UK |US consumer
US consumer confidence US house prices relative to incomeIndex level Index level
Source: (Left) Conference Board, Thomson Reuters Datastream, J.P. Morgan Asset Management. (Right) OECD, Thomson Reuters Datastream, J.P. Morgan Asset Management. Periods of “recession” are defined using US National Bureau of Economic Research (NBER) business cycle dates. Past performance is not a reliable indicator of current and future results. Guide to the Markets - UK. Data as of 30 June 2018.
Global economy
Recession
80
90
100
110
120
130
140
150
'70 '75 '80 '85 '90 '95 '00 '05 '10 '15
15
20
40
60
80
100
120
140
160
180
'70 '75 '80 '85 '90 '95 '00 '05 '10 '15
16
GTM – UK |
0
2
4
6
8
10
12
'67 '72 '77 '82 '87 '92 '97 '02 '07 '12 '17
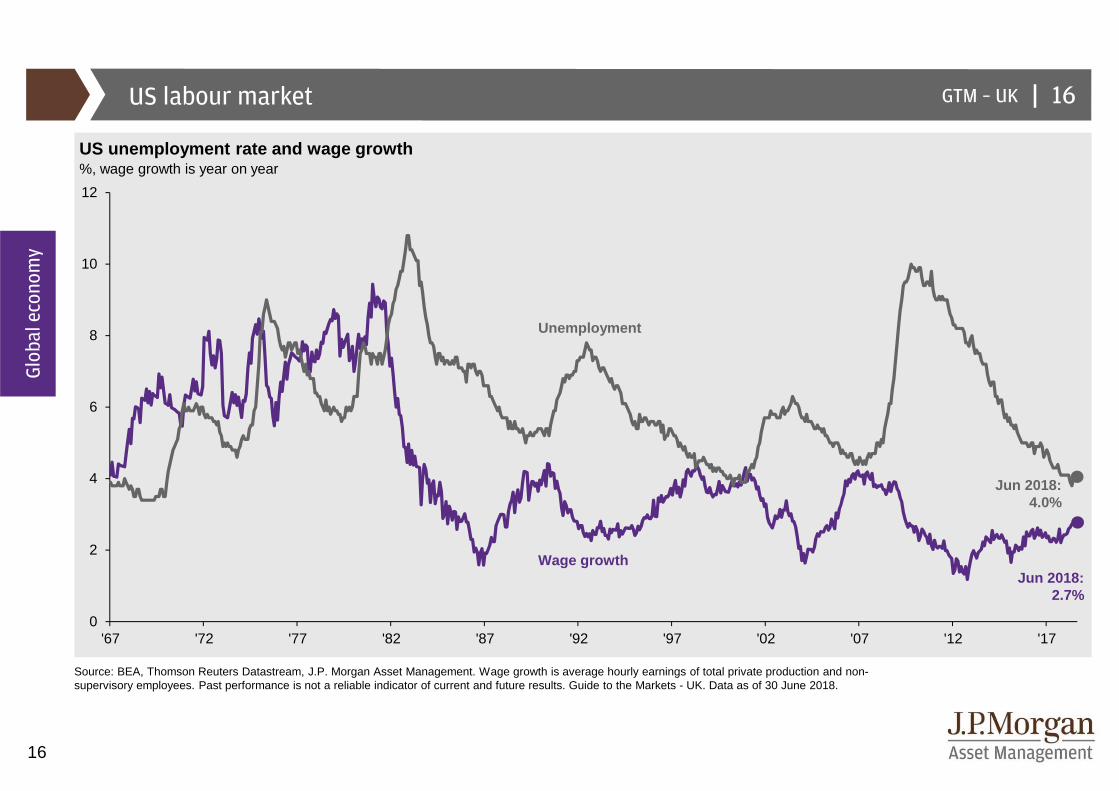
US labour market
US unemployment rate and wage growth%, wage growth is year on year
Source: BEA, Thomson Reuters Datastream, J.P. Morgan Asset Management. Wage growth is average hourly earnings of total private production and non-supervisory employees. Past performance is not a reliable indicator of current and future results. Guide to the Markets - UK. Data as of 30 June 2018.
Global economy
Unemployment
Wage growth
16
Jun 2018: 4.0%
Jun 2018:2.7%

17
GTM – UK |
-2
-1
0
1
2
3
4
5
6
'00 '02 '04 '06 '08 '10 '12 '14 '16 '18
Average since 2000
May2018
Headline CPI 2.2% 2.8%
Core CPI 2.0% 2.2%
US inflation
US headline and core inflation US core goods and ser vices inflation% change year on year % change year on year
Source: (All charts) BLS, Thomson Reuters Datastream, J.P. Morgan Asset Management. CPI is the Consumer Price Index. Core CPI is defined as CPI excluding food and energy. Core goods CPI is defined as goods CPI excluding food and energy. Past performance is not a reliable indicator of current and future results. Guide to the Markets - UK. Data as of 30 June 2018.
Global economy
17
Average since 2000
May2018
Services CPI 2.8% 2.9%
Core goods CPI 0.0% -0.3%
Headline inflation target
-3
-2
-1
0
1
2
3
4
5
6
'00 '02 '04 '06 '08 '10 '12 '14 '16 '18

18
GTM – UK |
0
1
2
3
4
5
6
7
'00 '01 '02 '03 '04 '05 '06 '07 '08 '09 '10 '11 '12 '13 '14 '15 '16 '17 '18 '19 '20
US Federal Reserve policy rate
Federal funds policy rate expectations% Fed funds rate, FOMC and market expectations
Source: Bloomberg, US Federal Reserve, J.P. Morgan Asset Management. *Forecasts are median estimates of Federal Open Market Committee (FOMC) participants.Market expectations are calculated using OIS forwards. Past performance is not a reliable indicator of current and future results. Guide to the Markets - UK. Data as of 30 June 2018.
Global economy
Federal funds rate
Market expectations on 30 June 2018 (mean)
US Fed FOMC June forecasts (median)
18
FOMC June 2018 forecasts* (%) 2018 2019 2020
Change in real GDP, Q4 to Q4 2.8 2.4 2.0
Unemployment rate, Q4 3.6 3.5 3.5
PCE inflation, Q4 to Q4 2.1 2.1 2.1
19
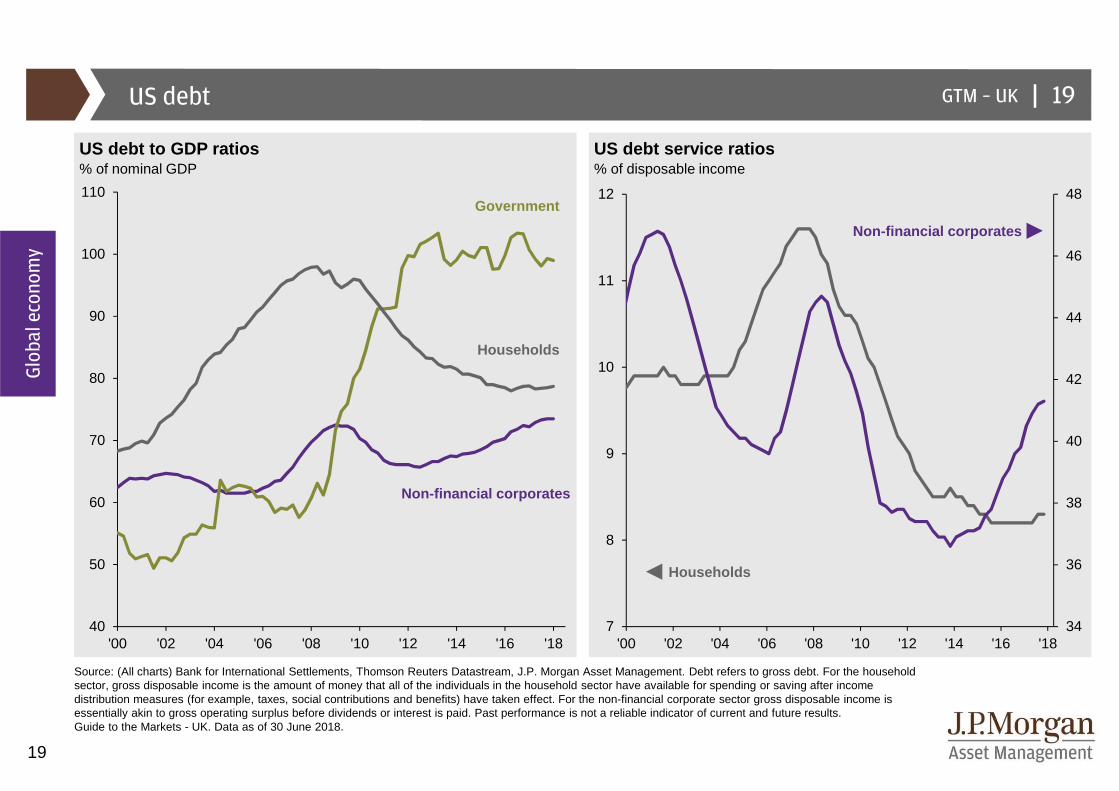
GTM – UK |US debt
US debt to GDP ratios US debt service ratios% of nominal GDP % of disposable income
Source: (All charts) Bank for International Settlements, Thomson Reuters Datastream, J.P. Morgan Asset Management. Debt refers to gross debt. For the household sector, gross disposable income is the amount of money that all of the individuals in the household sector have available for spending or saving after income distribution measures (for example, taxes, social contributions and benefits) have taken effect. For the non-financial corporate sector gross disposable income is essentially akin to gross operating surplus before dividends or interest is paid. Past performance is not a reliable indicator of current and future results. Guide to the Markets - UK. Data as of 30 June 2018.
Households
Non-financial corporates
Government
Global economy
Non-financial corporates
Households
19
40
50
60
70
80
90
100
110
'00 '02 '04 '06 '08 '10 '12 '14 '16 '1834
36
38
40
42
44
46
48
7
8
9
10
11
12
'00 '02 '04 '06 '08 '10 '12 '14 '16 '18

20
GTM – UK |
-1.0
-0.8
-0.6
-0.4
-0.2
0.0
0.2
0.4
0.6
0.8
'17 '18 '19 '20 '21
US focus: Fiscal expansion
Annual change in general government cyclically-adju sted primary balancePercentage points of GDP
Source: IMF, Thomson Reuters Datastream, J.P. Morgan Asset Management. Cyclically-adjusted primary balance is defined as the fiscal balance adjusted for the cycle, excluding net interest payments. It is a commonly used measure of discretionary fiscal policy. Projections are based on IMF staff assessment of current policies. Short-term fiscal policy assumptions are based on officially announced budgets (adjusted for IMF staff macroeconomic assumptions), whilst medium-term fiscal projections incorporate policy measures that are judged likely to be implemented. US projections incorporate the effects of tax reform as well as the Bipartisan Budget Act of 2018. Past performance is not a reliable indicator of current and future results. Guide to the Markets - UK. Data as of 30 June 2018.
20
Global economy
Eurozone
UK
US
Looser fiscal policy

21
GTM – UK |Eurozone GDP
Contribution to eurozone real GDP growth and composit e PMI% change year on year (LHS); index level (RHS)
Source: Eurostat, Markit, Thomson Reuters Datastream, J.P. Morgan Asset Management. PMI is Purchasing Managers’ Index where a score of 50 indicates that economic activity is neither expanding nor contracting, above 50 indicates expansion. PMI data is shown with quarterly frequency. Past performance is not a reliable indicator of current and future results. Guide to the Markets - UK. Data as of 30 June 2018.
Change in inventories
Net exports
Investment
Consumption
Government
Composite PMI (RHS)
Global economy
Average since 2000
Q118
1.4% 2.5%
21
30
35
40
45
50
55
60
65
-8
-6
-4
-2
0
2
4
6
'00 '01 '02 '03 '04 '05 '06 '07 '08 '09 '10 '11 '12 '13 '14 '15 '16 '17 '18
22
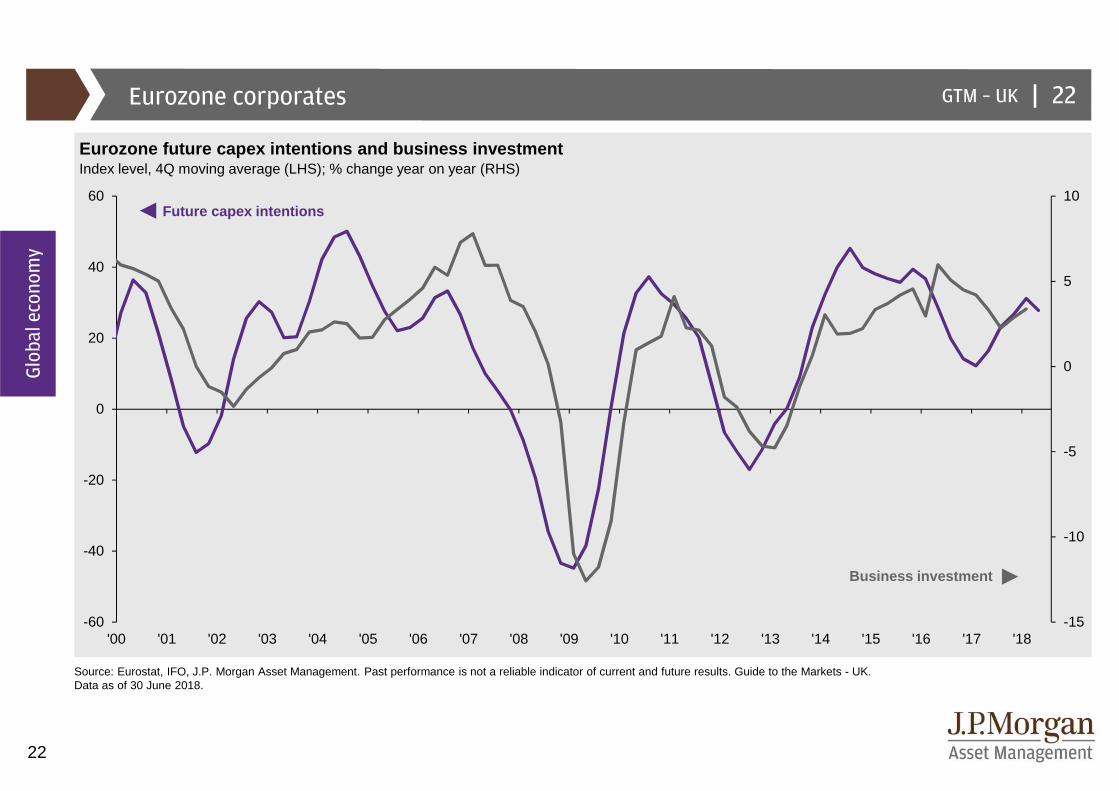
GTM – UK |Eurozone corporates
Eurozone future capex intentions and business investm entIndex level, 4Q moving average (LHS); % change year on year (RHS)
Source: Eurostat, IFO, J.P. Morgan Asset Management. Past performance is not a reliable indicator of current and future results. Guide to the Markets - UK. Data as of 30 June 2018.
Global economy
Future capex intentions
Business investment
22
-15
-10
-5
0
5
10
-60
-40
-20
0
20
40
60
'00 '01 '02 '03 '04 '05 '06 '07 '08 '09 '10 '11 '12 '13 '14 '15 '16 '17 '18

23
GTM – UK |
-40
-35
-30
-25
-20
-15
-10
-5
0
5
'00 '02 '04 '06 '08 '10 '12 '14 '16 '18
Eurozone consumer
Eurozone consumer confidence Eurozone house prices rel ative to incomeIndex level Index level
Source: (Left) European Commission, Thomson Reuters Datastream, J.P. Morgan Asset Management. (Right) OECD, Thomson Reuters Datastream, J.P. Morgan Asset Management. Light grey columns indicate recession. Past performance is not a reliable indicator of current and future results. Guide to the Markets - UK. Data as of 30 June 2018.
Global economy
Recession
23
Germany
Spain
France
Italy
0
50
100
150
200
250
'80 '84 '88 '92 '96 '00 '04 '08 '12 '16
24
GTM – UK |
1
2
3
4
5
4
5
6
7
8
9
10
11
12
13
'98 '99 '00 '01 '02 '03 '04 '05 '06 '07 '08 '09 '10 '11 '12 '13 '14 '15 '16 '17 '18
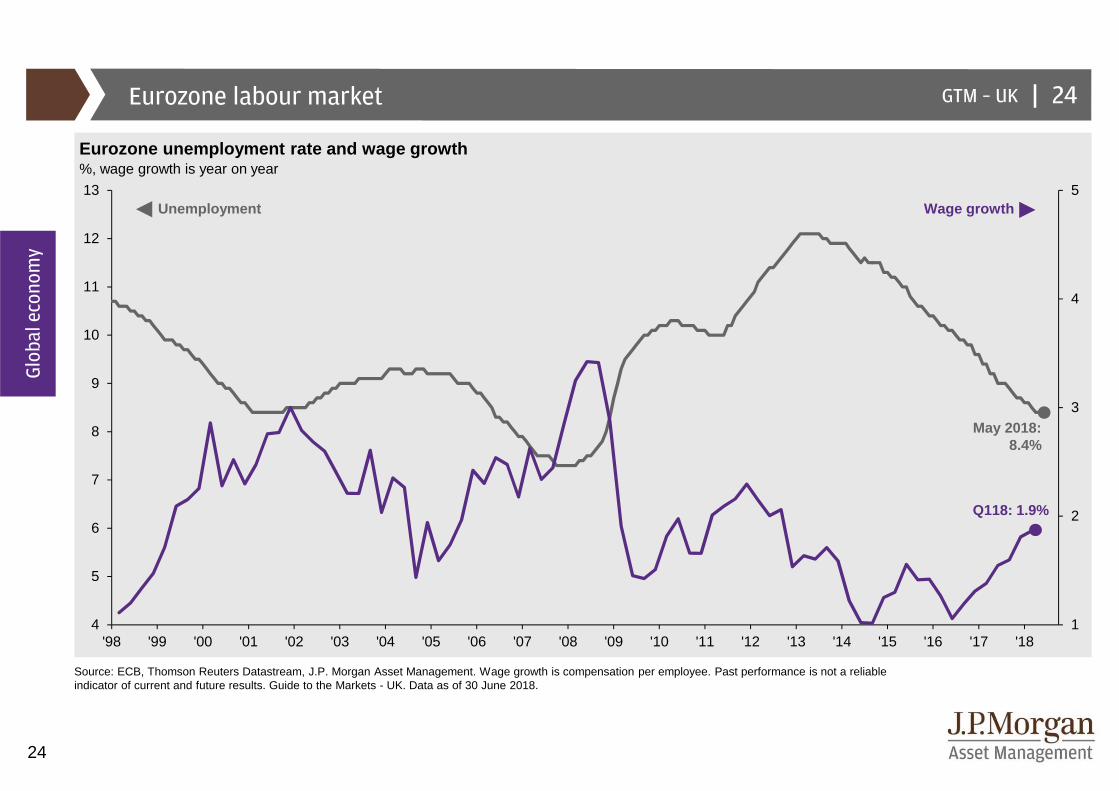
Eurozone labour market
Eurozone unemployment rate and wage growth%, wage growth is year on year
Source: ECB, Thomson Reuters Datastream, J.P. Morgan Asset Management. Wage growth is compensation per employee. Past performance is not a reliable indicator of current and future results. Guide to the Markets - UK. Data as of 30 June 2018.
Global economy
24
Wage growthUnemployment
May 2018: 8.4%
Q118: 1.9%
25
GTM – UK |
-0.5
0.0
0.5
1.0
1.5
2.0
2.5
3.0
3.5
'00 '02 '04 '06 '08 '10 '12 '14 '16 '18
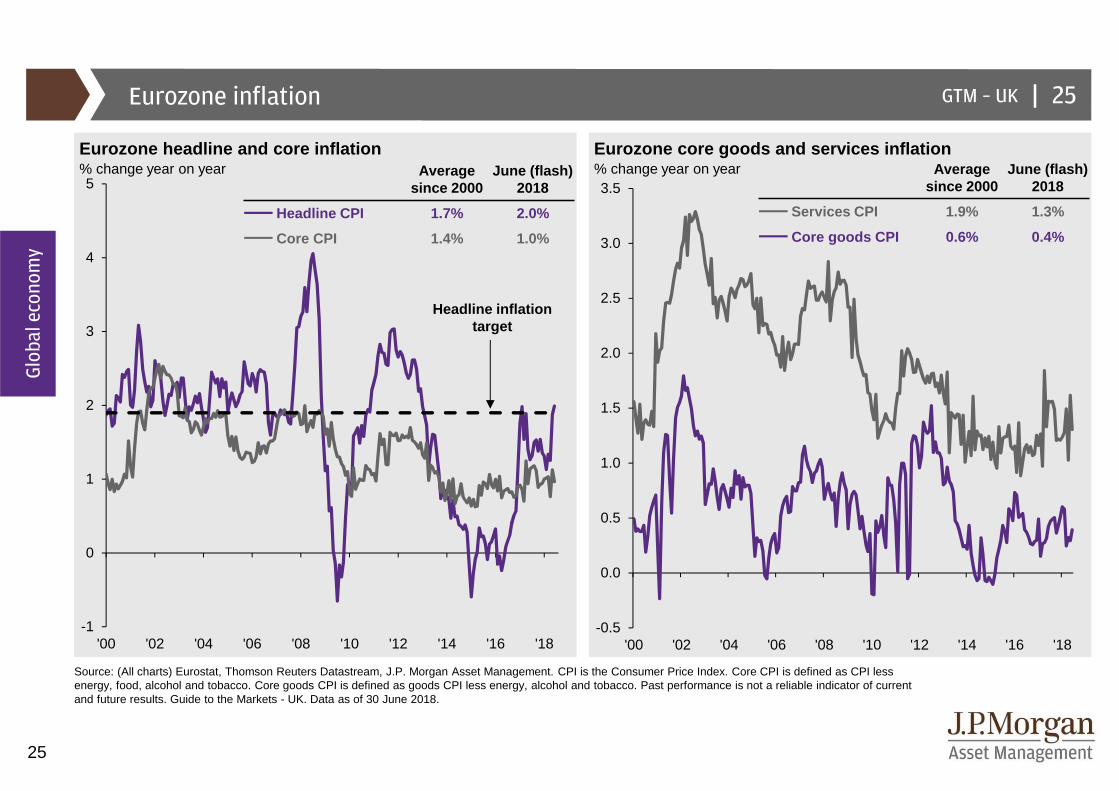
Eurozone inflation
Eurozone headline and core inflation Eurozone core goo ds and services inflation% change year on year % change year on year
Source: (All charts) Eurostat, Thomson Reuters Datastream, J.P. Morgan Asset Management. CPI is the Consumer Price Index. Core CPI is defined as CPI less energy, food, alcohol and tobacco. Core goods CPI is defined as goods CPI less energy, alcohol and tobacco. Past performance is not a reliable indicator of current and future results. Guide to the Markets - UK. Data as of 30 June 2018.
Average since 2000
June (flash)2018
Services CPI 1.9% 1.3%
Core goods CPI 0.6% 0.4%
Global economy
25
Headline inflation target
Average since 2000
June (flash)2018
Headline CPI 1.7% 2.0%
Core CPI 1.4% 1.0%
-1
0
1
2
3
4
5
'00 '02 '04 '06 '08 '10 '12 '14 '16 '18

26
GTM – UK |
-1.0
-0.5
0.0
0.5
1.0
1.5
2.0
2.5
3.0
3.5
4.0
'00 '01 '02 '03 '04 '05 '06 '07 '08 '09 '10 '11 '12 '13 '14 '15 '16 '17 '18 '19 '20
European Central Bank policy rate
European Central Bank policy rate expectations% deposit rate, market expectations
Source: Bloomberg, European Central Bank, J.P. Morgan Asset Management. *Forecasts are made by ECB staff. Market expectations are calculated using OIS forwards. Past performance is not a reliable indicator of current and future results. Guide to the Markets - UK. Data as of 30 June 2018.
Global economy
ECB deposit rate
Market expectations on 30 June 2018 (mean)
26
ECB staff June 2018 forecasts* (%)2018 2019 2020
Real GDP growth (y/y) 2.1 1.9 1.7
Unemployment rate 8.4 7.8 7.3
CPI (y/y) 1.7 1.7 1.7
27
GTM – UK |
32
33
34
35
36
37
38
39
40
41
5.0
5.5
6.0
6.5
7.0
7.5
'00 '02 '04 '06 '08 '10 '12 '14 '16 '18
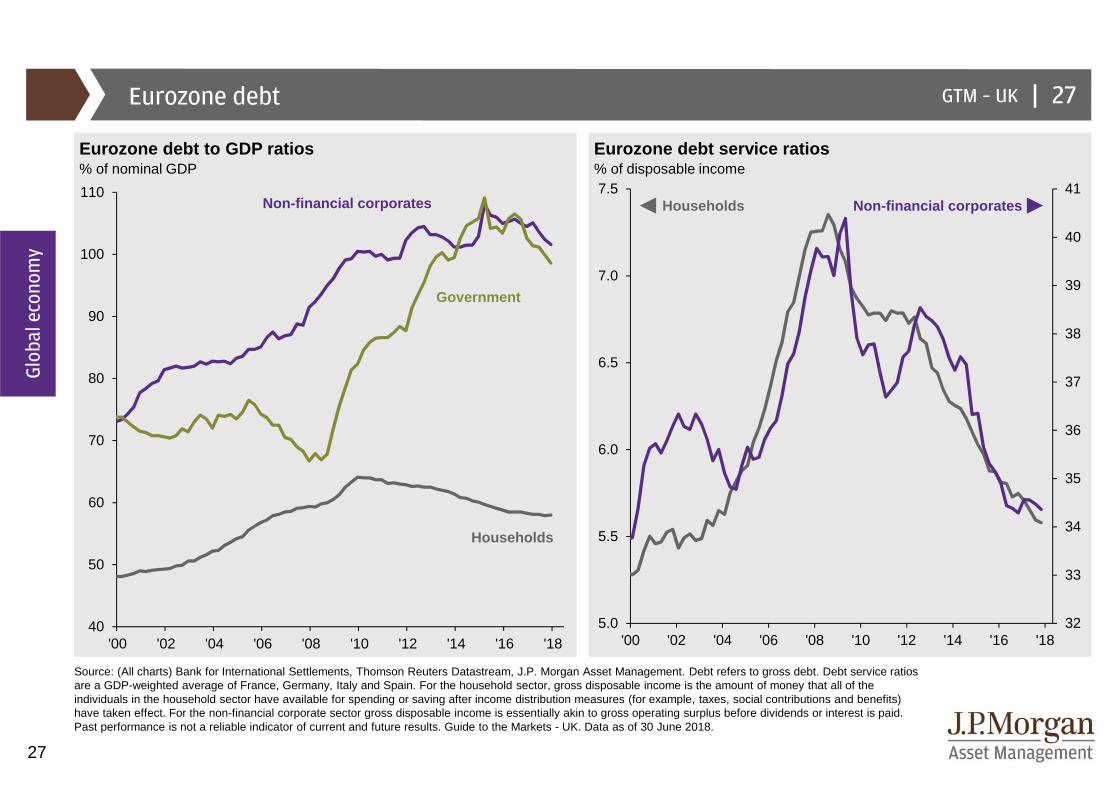
Eurozone debt
Eurozone debt to GDP ratios Eurozone debt service ratios% of nominal GDP % of disposable income
Source: (All charts) Bank for International Settlements, Thomson Reuters Datastream, J.P. Morgan Asset Management. Debt refers to gross debt. Debt service ratios are a GDP-weighted average of France, Germany, Italy and Spain. For the household sector, gross disposable income is the amount of money that all of the individuals in the household sector have available for spending or saving after income distribution measures (for example, taxes, social contributions and benefits) have taken effect. For the non-financial corporate sector gross disposable income is essentially akin to gross operating surplus before dividends or interest is paid. Past performance is not a reliable indicator of current and future results. Guide to the Markets - UK. Data as of 30 June 2018.
Households
Non-financial corporates
Government
Global economy
Non-financial corporatesHouseholds
27
40
50
60
70
80
90
100
110
'00 '02 '04 '06 '08 '10 '12 '14 '16 '18

28
GTM – UK |
40
45
50
55
60
65
70
75
80
85
90
Italy France Spain Germany
European politics
Eurozone real GDP levels Survey results: Do you support the euro?Index level rebased to 100 in 1999 % answering “yes”
Source: (Left) Eurostat, Thomson Reuters Datastream, J.P. Morgan Asset Management. (Right) Eurobarometer survey, J.P. Morgan Asset Management. Past performance is not a reliable indicator of current and future results. Guide to the Markets - UK. Data as of 30 June 2018.
28
Global economy Germany
Eurozone
Spain
France
Italy
Nov ’16
Nov ’13
Nov ’17
Mar ’18
100
105
110
115
120
125
130
135
140
145
150
'99 '01 '03 '05 '07 '09 '11 '13 '15 '17

29
GTM – UK |Eurozone focus: Northern European exposure to Italy
French and German banks’ exposure to Italian counte rpartiesUSD billions
Source: BIS, Thomson Reuters Datastream, J.P. Morgan Asset Management. Exposure to Italian counterparties is calculated as the amount of outstanding positions with underlying claims on counterparties resident in Italy. Past performance is not a reliable indicator of current and future results. Guide to the Markets - UK. Data as of 30 June 2018.
29
Global economy
0
100
200
300
400
500
600
'05 '06 '07 '08 '09 '10 '11 '12 '13 '14 '15 '16 '17
Germany
France
Share of total foreign banks’ exposure to Italian counterparties
Latest
France 48%
Germany 14%

30
GTM – UK |UK GDP
Contribution to UK real GDP growth and composite PM I% change year on year (LHS); index level (RHS)
Source: Markit, ONS, Thomson Reuters Datastream, J.P. Morgan Asset Management. PMI is Purchasing Managers’ Index where a score of 50 indicates that economic activity is neither expanding nor contracting, above 50 indicates expansion. PMI data is shown with quarterly frequency. Past performance is not a reliable indicator of current and future results. Guide to the Markets - UK. Data as of 30 June 2018.
Change in inventories
Net exports
Investment
Consumption
Government
Composite PMI (RHS)
Average since 2000
Q118
1.9% 1.2%
30
Global economy
30
35
40
45
50
55
60
65
-8
-6
-4
-2
0
2
4
6
'00 '01 '02 '03 '04 '05 '06 '07 '08 '09 '10 '11 '12 '13 '14 '15 '16 '17 '18

31
GTM – UK |
-40
-30
-20
-10
0
10
20
'87 '92 '97 '02 '07 '12 '17
UK consumer
UK consumer confidence UK house prices relative to incomeIndex level, 3-month moving average Index level
Source: (Left) GfK, Thomson Reuters Datastream, J.P. Morgan Asset Management. (Right) OECD, Thomson Reuters Datastream, J.P. Morgan Asset Management. Light grey columns indicate recession. Past performance is not a reliable indicator of current and future results. Guide to the Markets - UK. Data as of 30 June 2018.
Recession
31
40
50
60
70
80
90
100
110
120
130
'87 '92 '97 '02 '07 '12 '17
Global economy

32
GTM – UK |
-5
0
5
10
15
20
0
2
4
6
8
10
12
'85 '87 '89 '91 '93 '95 '97 '99 '01 '03 '05 '07 '09 '11 '13 '15 '17
UK labour market
UK unemployment rate and wage growth%, wage growth is year on year
Source: ONS, Thomson Reuters Datastream, J.P. Morgan Asset Management. Wage growth is a 3-month moving average of average weekly earnings for private and public sector, including bonuses and arrears. Past performance is not a reliable indicator of current and future results. Guide to the Markets - UK. Data as of 30 June 2018.
Global economy
32
Wage growth
Unemployment
Apr 2018:4.2%
Apr 2018:2.5%
33
GTM – UK |
-6
-4
-2
0
2
4
6
'00 '02 '04 '06 '08 '10 '12 '14 '16 '18-1
0
1
2
3
4
5
6
'00 '02 '04 '06 '08 '10 '12 '14 '16 '18
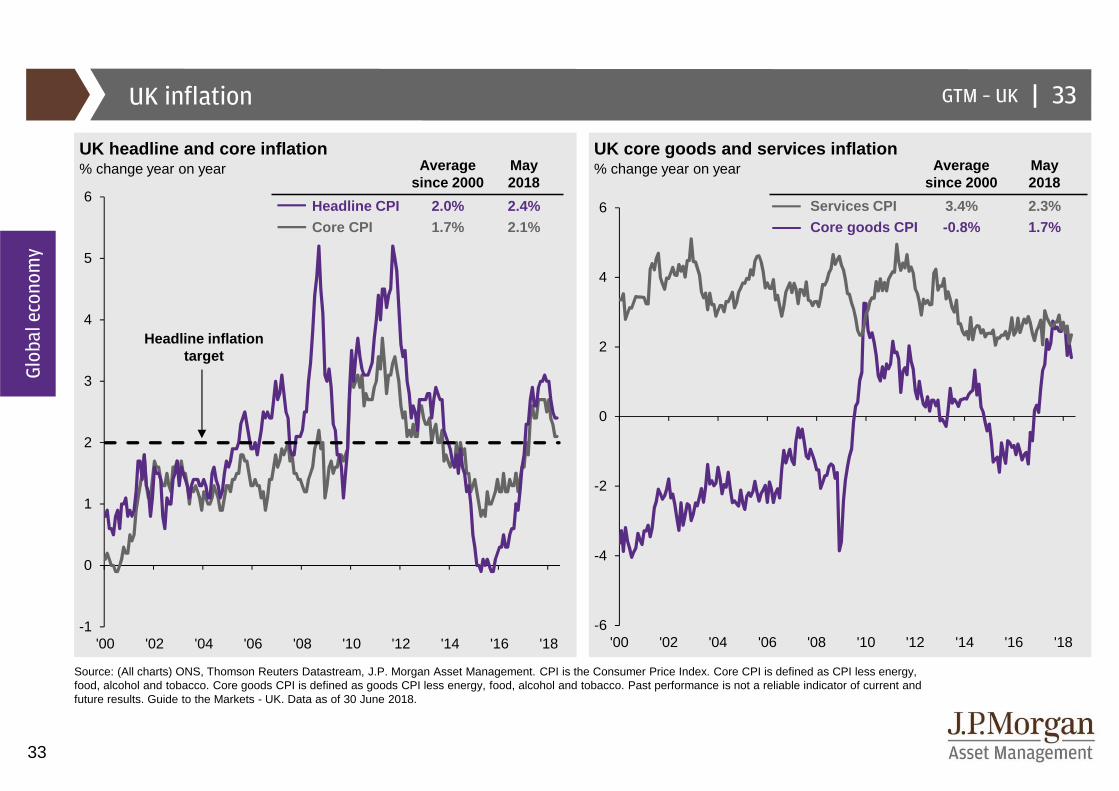
UK inflation
UK headline and core inflation UK core goods and ser vices inflation% change year on year % change year on year
Source: (All charts) ONS, Thomson Reuters Datastream, J.P. Morgan Asset Management. CPI is the Consumer Price Index. Core CPI is defined as CPI less energy, food, alcohol and tobacco. Core goods CPI is defined as goods CPI less energy, food, alcohol and tobacco. Past performance is not a reliable indicator of current and future results. Guide to the Markets - UK. Data as of 30 June 2018.
Average since 2000
May2018
Headline CPI 2.0% 2.4%Core CPI 1.7% 2.1%
Average since 2000
May2018
Services CPI 3.4% 2.3%Core goods CPI -0.8% 1.7%
33
Global economy
Headline inflation target

34
GTM – UK |
0
1
2
3
4
5
6
7
'00 '01 '02 '03 '04 '05 '06 '07 '08 '09 '10 '11 '12 '13 '14 '15 '16 '17 '18 '19 '20
UK Bank of England policy rate
Bank of England policy rate expectations% base rate, market expectations
Source: Bank of England, Bloomberg, J.P. Morgan Asset Management. *Forecasts are made by the Bank of England’s Monetary Policy Committee. GDP forecast is an annual average of year on year growth. CPI and unemployment rate forecasts are median forecasts for Q4 of each year. Market expectations are calculated using OIS forwards. Past performance is not a reliable indicator of current and future results. Guide to the Markets - UK. Data as of 30 June 2018.
Global economy
BoE base rate
Market expectations on 30 June 2018 (mean)
34
BoE May 2018 forecasts* (%) 2018 2019 2020
Real GDP growth (y/y) 1.4 1.7 1.7
Unemployment rate 4.1 4.0 4.0
CPI (y/y) 2.2 2.1 2.0

35
GTM – UK |
EU27
US
Australia
Japan
Singapore
Hong Kong
Canada
Saudi Arabia
India
China
Switzerland
UK focus: Trade partners
UK exports and imports of goods and servicesGBP billions
Source: UK ONS Pink Book, J.P. Morgan Asset Management. Data is latest available, measured at end of 2016. Middle East includes Israel, Saudi Arabia, residualGulf Arabian countries and other near and middle eastern countries. Asia includes China, Hong Kong, India, Indonesia, Iran, Japan, Malaysia, Pakistan, Philippines,Singapore, South Korea, Taiwan and Thailand. Past performance is not a reliable indicator of current and future results. Guide to the Markets - UK.Data as of 30 June 2018.
Global economy
35
Services
Services
UK export share EU27 43%
US 18%
Asia 12%
Middle East 5%
Goods
Goods
Exports:
Imports:
0 50 100 150 200 250 300 350

36
GTM – UK |Japan GDP
Contribution to Japan real GDP growth and composite PMI% change year on year (LHS); index level (RHS)
Source: Japan Cabinet Office, Markit, Thomson Reuters Datastream, J.P. Morgan Asset Management. PMI is Purchasing Managers’ Index where a score of 50 indicates that economic activity is neither expanding nor contracting, above 50 indicates expansion. PMI data is shown with quarterly frequency. Past performance is not a reliable indicator of current and future results. Guide to the Markets - UK. Data as of 30 June 2018.
Change in inventories
Net exports
Investment
Consumption
Government
Manufacturing PMI (RHS)
Average since 2000
Q118
1.0% 1.1%
36
Global economy
30
34
38
42
46
50
54
58
62
-10
-8
-6
-4
-2
0
2
4
6
'00 '01 '02 '03 '04 '05 '06 '07 '08 '09 '10 '11 '12 '13 '14 '15 '16 '17 '18
37
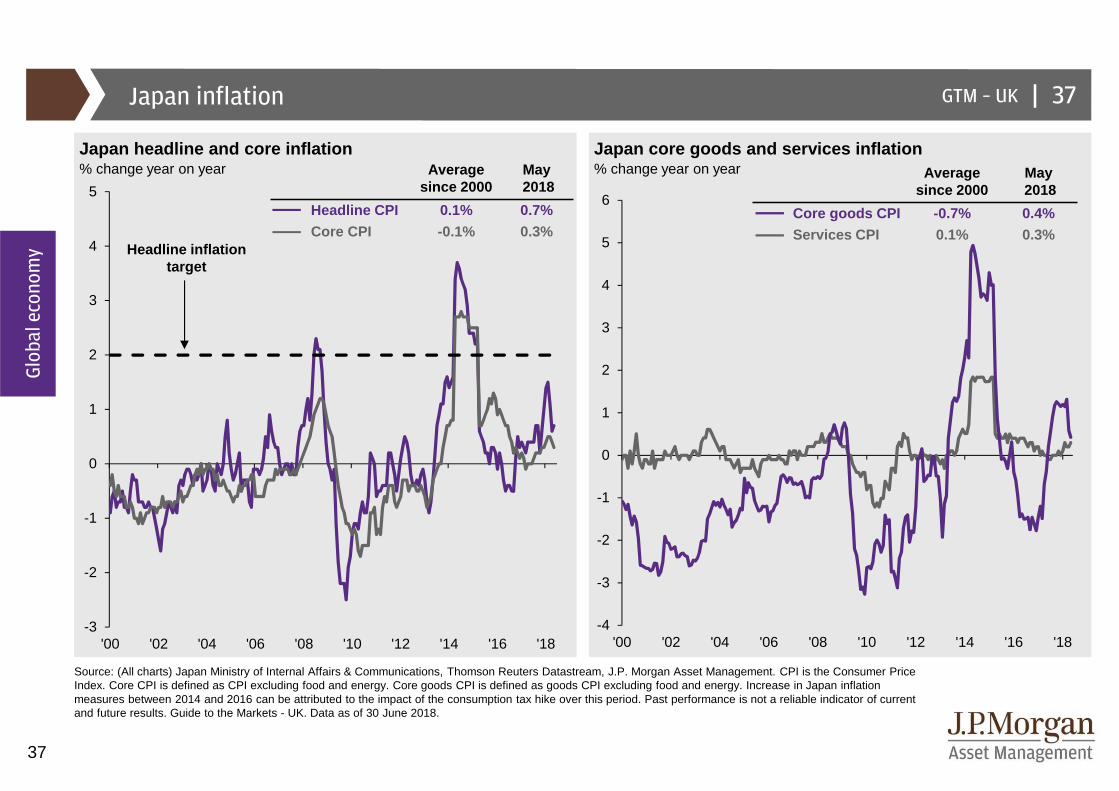
GTM – UK |Japan inflation
Japan headline and core inflation Japan core goods a nd services inflation% change year on year % change year on year
Source: (All charts) Japan Ministry of Internal Affairs & Communications, Thomson Reuters Datastream, J.P. Morgan Asset Management. CPI is the Consumer Price Index. Core CPI is defined as CPI excluding food and energy. Core goods CPI is defined as goods CPI excluding food and energy. Increase in Japan inflation measures between 2014 and 2016 can be attributed to the impact of the consumption tax hike over this period. Past performance is not a reliable indicator of current and future results. Guide to the Markets - UK. Data as of 30 June 2018.
Average since 2000
May2018
Headline CPI 0.1% 0.7%
Core CPI -0.1% 0.3%
Average since 2000
May2018
Core goods CPI -0.7% 0.4%
Services CPI 0.1% 0.3%
37
Global economy Headline inflation
target
-3
-2
-1
0
1
2
3
4
5
'00 '02 '04 '06 '08 '10 '12 '14 '16 '18-4
-3
-2
-1
0
1
2
3
4
5
6
'00 '02 '04 '06 '08 '10 '12 '14 '16 '18

38
GTM – UK |China GDP
Contribution to China real GDP growth China industri al production and retail sales% change year on year % change year on year
Source: (Left) Bloomberg, National Bureau of Statistics of China, Thomson Reuters Datastream, J.P. Morgan Asset Management. Forecast is from Bloomberg contributor composite. (Right) National Bureau of Statistics of China, Thomson Reuters Datastream, J.P. Morgan Asset Management. Industrial production is a three-month moving average and retail sales is a six-month moving average. Past performance is not a reliable indicator of current and future results. Guide to the Markets - UK. Data as of 30 June 2018.
Consumption
GDP growth
Investment
Net exports
Global economy
38
Q1 20182018
consensus forecast
6.8% 6.5%
Industrial production
Retail sales
-5
0
5
10
15
20
'90 '92 '94 '96 '98 '00 '02 '04 '06 '08 '10 '12 '14 '16 '18
Q1 2018
0
5
10
15
20
25
'96 '00 '04 '08 '12 '16
39
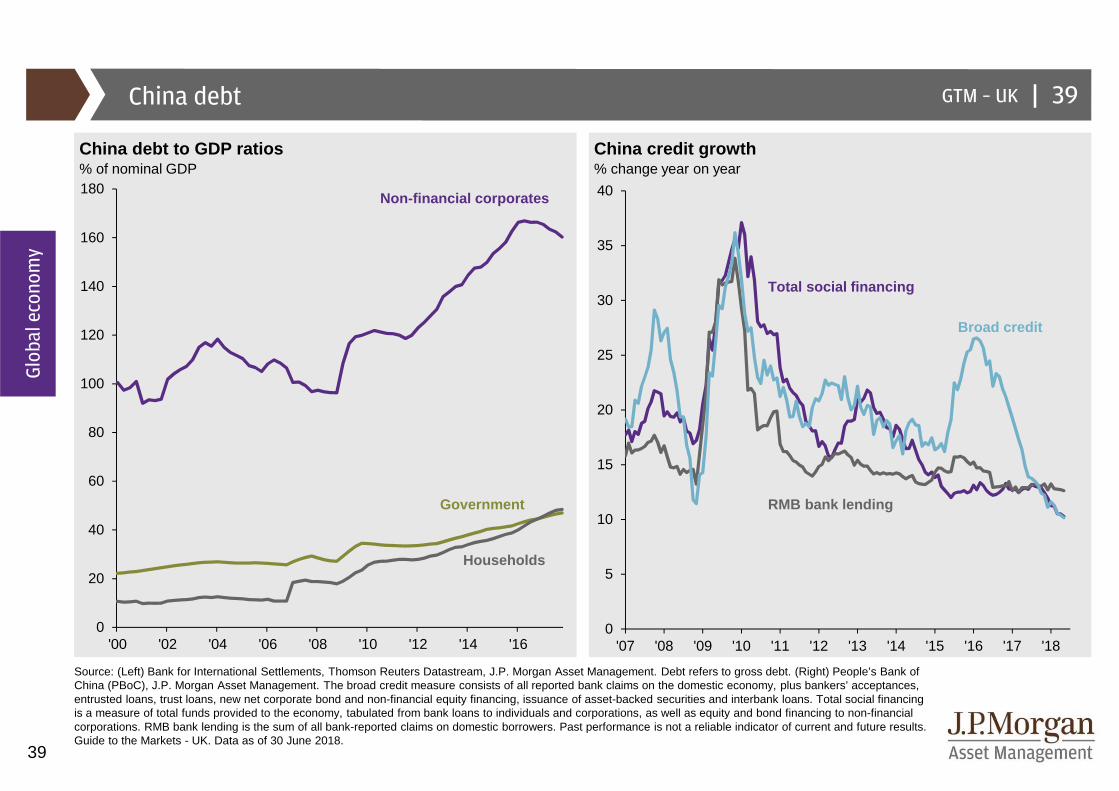
GTM – UK |China debt
China debt to GDP ratios China credit growth% of nominal GDP % change year on year
Source: (Left) Bank for International Settlements, Thomson Reuters Datastream, J.P. Morgan Asset Management. Debt refers to gross debt. (Right) People’s Bank of China (PBoC), J.P. Morgan Asset Management. The broad credit measure consists of all reported bank claims on the domestic economy, plus bankers’ acceptances, entrusted loans, trust loans, new net corporate bond and non-financial equity financing, issuance of asset-backed securities and interbank loans. Total social financing is a measure of total funds provided to the economy, tabulated from bank loans to individuals and corporations, as well as equity and bond financing to non-financial corporations. RMB bank lending is the sum of all bank-reported claims on domestic borrowers. Past performance is not a reliable indicator of current and future results. Guide to the Markets - UK. Data as of 30 June 2018.
Households
Government
Global economy
Non-financial corporates
Total social financing
Broad credit
RMB bank lending
39
0
5
10
15
20
25
30
35
40
'07 '08 '09 '10 '11 '12 '13 '14 '15 '16 '17 '180
20
40
60
80
100
120
140
160
180
'00 '02 '04 '06 '08 '10 '12 '14 '16
40
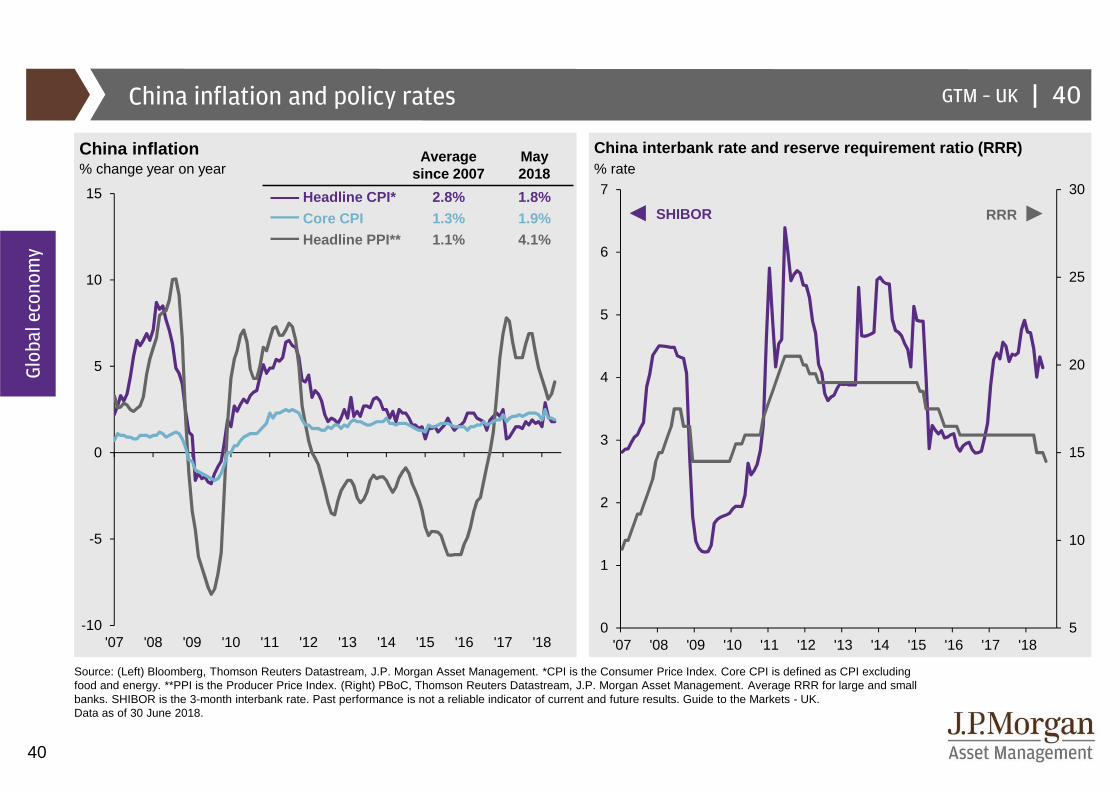
GTM – UK |China inflation and policy rates
China inflation China interbank rate and reserve requirement ratio (RRR)% change year on year % rate
Source: (Left) Bloomberg, Thomson Reuters Datastream, J.P. Morgan Asset Management. *CPI is the Consumer Price Index. Core CPI is defined as CPI excluding food and energy. **PPI is the Producer Price Index. (Right) PBoC, Thomson Reuters Datastream, J.P. Morgan Asset Management. Average RRR for large and small banks. SHIBOR is the 3-month interbank rate. Past performance is not a reliable indicator of current and future results. Guide to the Markets - UK. Data as of 30 June 2018.
Average since 2007
May2018
Headline CPI* 2.8% 1.8%
Core CPI 1.3% 1.9%Headline PPI** 1.1% 4.1%
Global economy
40
RRRSHIBOR
-10
-5
0
5
10
15
'07 '08 '09 '10 '11 '12 '13 '14 '15 '16 '17 '185
10
15
20
25
30
0
1
2
3
4
5
6
7
'07 '08 '09 '10 '11 '12 '13 '14 '15 '16 '17 '18

41
GTM – UK |
0
2
4
6
8
10
12
14
'00 '02 '04 '06 '08 '10 '12 '14 '16 '18-6
-4
-2
0
2
4
6
8
10
12
'00 '02 '04 '06 '08 '10 '12 '14 '16 '18
Emerging markets GDP and inflation
EM GDP growth EM inflation% change year on year % change year on year
Source: (All charts) IMF, national statistics agencies, J.P. Morgan Securities Research, J.P. Morgan Asset Management. Other EM countries are China, India, Malaysia, Mexico, Philippines, Poland, Romania, Thailand, Turkey, Vietnam. Commodity countries are Argentina, Brazil, Chile, Colombia, Indonesia, Kazakhstan, Peru, Russia, South Africa, Venezuela. GDP and inflation aggregates are calculated using a GDP-weighted average. Forecasts are from J.P. Morgan Securities Research. Past performance is not a reliable indicator of current and future results. Guide to the Markets - UK. Data as of 30 June 2018.
Commodity countries
Other EM countries
Forecast Forecast
Global economy
41
Commodity countries
Other EM countries

42
GTM – UK |
-2.5
-2.0
-1.5
-1.0
-0.5
0.0
0.5
1.0
'06 '07 '08 '09 '10 '11 '12 '13 '14 '15 '16 '17 '18
Emerging markets currencies and current account
EM currencies vs. US dollar EM current account balance% from fair value, relative to US dollar % of GDP
Source: (Left) J.P. Morgan Asset Management. Fair value is based on nominal exchange rates relative to PPP exchange rates and adjusted for GDP per capita. (Right) Bloomberg, J.P. Morgan Asset Management. EM currencies and current account balances are created using the current weighted average of JPM GBI-EM Global Diversified Index countries. Current account balance is the balance of a country’s net trade in goods and services, its net earnings on cross-border investments and its net transfer payments. Past performance is not a reliable indicator of current and future results. Guide to the Markets - UK. Data as of 30 June 2018.
+1 std. dev.
-1 std. dev.
Average
Global economy
42
EM current account balance improving
EM currencies expensive relative to USD
-30
-20
-10
0
10
20
30
'92 '96 '00 '04 '08 '12 '16

43
GTM – UK |
0
5
10
15
20
25
30
'70 '75 '80 '85 '90 '95 '00 '05 '10 '15
0
10,000
20,000
30,000
40,000
50,000
60,000
70,000
0 20 40 60 80 100
Emerging markets structural dynamics
Urbanisation and economic growth Share of global real GDPUrbanisation rates, %, and GDP per capita, USD, 1960-2016 %
Source: (Left) World Bank, J.P. Morgan Asset Management. Urbanisation rate refers to the proportion of the total population living within an urban area defined by national statistical offices. (Right) Thomson Reuters Datastream, World Bank, J.P. Morgan Asset Management. Past performance is not a reliable indicator of current and future results. Guide to the Markets - UK. Data as of 30 June 2018.
US
China
South Korea
India
GD
P p
er c
apita
Urbanisation rate
Global economy
43
US
Eurozone
China
Japan
India

44
GTM – UK |
-40
-20
0
20
40
60
80
-10
-5
0
5
10
15
20
Emerging markets focus: Differentiating external vulnerabilities
EM currency moves, current account balances and imp rovements in external debt% of nominal GDP, external debt is change vs. 3 years ago (LHS); % change YTD (RHS)
Source: Bloomberg, Oxford Economics, Thomson Reuters Datastream, J.P. Morgan Asset Management. Current account balance and external debt are as of end of 2017. Past performance is not a reliable indicator of current and future results. Guide to the Markets - UK. Data as of 30 June 2018.
44
Global economy
Currency move vs. USD YTDExternal debt
Current account balance
Argentina Turkey Brazil South Africa
Russia India Philippines Indonesia South Korea
Taiwan China Thailand Mexico Malaysia
External debt rising
External debt falling

45
GTM – UK |
0x
5x
10x
15x
20x
25x
30x
35x
40x
40
60
80
100
120
140
160
180
200
220
240
260
'09 '10 '11 '12 '13 '14 '15 '16 '17 '18
Global equity earnings and valuations
Global earnings per share Global forward price-to-earnings ratios NTM USD earnings per share estimates, rebased to 100 in Jan 2009 x, multiple
Source: (Left) FTSE, IBES, MSCI, Standard & Poor’s, Thomson Reuters Datastream, J.P. Morgan Asset Management. NTM is next 12 months. (Right) IBES, MSCI, Standard & Poor’s, Thomson Reuters Datastream, J.P. Morgan Asset Management. Valuations refer to 12-month forward price-to-earnings ratios for Europe ex-UK, US, Japan, UK and emerging markets. Valuation and earnings charts use MSCI indices for all regions/countries, except for the US, which is the S&P 500. Past performance is not a reliable indicator of current and future results. Guide to the Markets - UK. Data as of 30 June 2018.
Range since 1990Average since 1990
Current
One year ago
Japan
Europe ex-UK
US
EM
UK
45
Equities
US UKEuropeex-UK
Japan EM
75x

46
GTM – UK |
1
10
100
1,000
10,000
'00 '10 '20 '30 '40 '50 '60 '70 '80 '90 '00 '10
US stock market
S&P 500 IndexLog scale
Source: Robert Shiller, Standard & Poor’s, Thomson Reuters Datastream, J.P. Morgan Asset Management. Periods of “recession” are defined using US National Bureau of Economic Research (NBER) business cycle dates. Past performance is not a reliable indicator of current and future results. Guide to the Markets - UK. Data as of 30 June 2018.
Equities
46
Techbust (2000)
World War I(1914-1918)
Great Depression(1929-1939)
World War II(1939-1945)
Oil shocks(1973 & 1979) Global financial
crisis (2008)
BlackMonday(1987)
Recession

47
GTM – UK |
-36
-28
-20
-12
-4
4
12
20
28
36
44
'07 '08 '09 '10 '11 '12 '13 '14 '15 '16 '17 '18
US earnings
S&P 500 earnings and performance S&P 500 earnings pe r share growthNext 12 months’ earnings per share estimates (LHS); index level (RHS) % change year on year
Source: (All charts) IBES, Standard & Poor’s, Thomson Reuters Datastream, J.P. Morgan Asset Management. EPS is earnings per share. Expected earnings growth and delivered earnings growth are calculated using IBES consensus estimates for next 12 months’ EPS and last 12 months’ EPS, respectively. Year on year growth rates are calculated using year-end data. Past performance is not a reliable indicator of current and future results. Guide to the Markets - UK. Data as of 30 June 2018.
Equities
S&P 500 index levelS&P 500 EPS
47
Start of year EPS growth expectationsDelivered EPS growth
Current EPS growth expectations
600
800
1,000
1,200
1,400
1,600
1,800
2,000
2,200
2,400
2,600
2,800
3,000
3,200
60
80
100
120
140
160
180
'07 '08 '09 '10 '11 '12 '13 '14 '15 '16 '17 '18

48
GTM – UK |
200
250
300
350
400
450
500
550
600
650
700
0
500
1,000
1,500
2,000
2,500
3,000
'97 '99 '01 '03 '05 '07 '09 '11 '13 '15 '1770
75
80
85
90
95
100
105
110
0
500
1,000
1,500
2,000
2,500
3,000
'97 '99 '01 '03 '05 '07 '09 '11 '13 '15 '17
US equity macro correlations
Leading economic indicator vs. S&P 500 performance I nitial jobless claims vs. S&P 500 performanceIndex level Index level (LHS); thousands, three-month moving average (RHS)
Source: (Left) Conference Board, Standard & Poor’s, Thomson Reuters Datastream, J.P. Morgan Asset Management. (Right) BLS, Standard & Poor’s, Thomson Reuters Datastream, J.P. Morgan Asset Management. Periods of “recession” are defined using US National Bureau of Economic Research (NBER) business cycle dates. Past performance is not a reliable indicator of current and future results. Guide to the Markets - UK. Data as of 30 June 2018.
Equities
48
S&P 500 index level Initial jobless claims
Recession
S&P 500 index level Leading economic indicator

49
GTM – UK |
10
12
14
16
18
20
22
24
26
'90 '92 '94 '96 '98 '00 '02 '04 '06 '08 '10 '12 '14 '16 '18
US equity valuations
S&P 500 forward P/E ratiox, multiple
Source: FactSet, IBES, Robert Shiller, Standard & Poor’s, Thomson Reuters Datastream, J.P. Morgan Asset Management. P/E ratio calculated using IBES earnings estimates for next 12 months. P/E data may differ from Guide to the Markets – US, which uses FactSet earnings estimates. Shiller cyclically-adjusted P/E is price-to-earnings ratio adjusted using trailing 10-year average inflation-adjusted earnings. P/B ratio is trailing price-to-book ratio. Past performance is not a reliable indicator of current and future results. Guide to the Markets - UK. Data as of 30 June 2018.
Average: 15.8x
30 June 2018:16.3x
Valuation measureAverage
since 1990Latest
Shiller cyclically-adjusted P/E ratio 25.6x 32.1x
P/B ratio 2.9x 3.2x
Equities
49

50
GTM – UK |
-60
-40
-20
0
20
40
60
8.0x 11.0x 14.0x 17.0x 20.0x 23.0x-20
-15
-10
-5
0
5
10
15
20
25
30
8.0x 11.0x 14.0x 17.0x 20.0x 23.0x
US valuations and subsequent returns
Forward P/E ratios and subsequent 1-year returns For ward P/E ratios and subsequent 10-year returns%, annualised total return* %, annualised total return*
Source: (All charts) IBES, Standard & Poor’s, Thomson Reuters Datastream, J.P. Morgan Asset Management. *Dots represent monthly data points since 1988, which is earliest available. Past performance is not a reliable indicator of current and future results. Guide to the Markets - UK. Data as of 30 June 2018.
Current levelCurrent level
Equities
50
51
GTM – UK |
-0.6
-0.4
-0.2
0.0
0.2
0.4
0.6
0.8
0 2 4 6 8 10
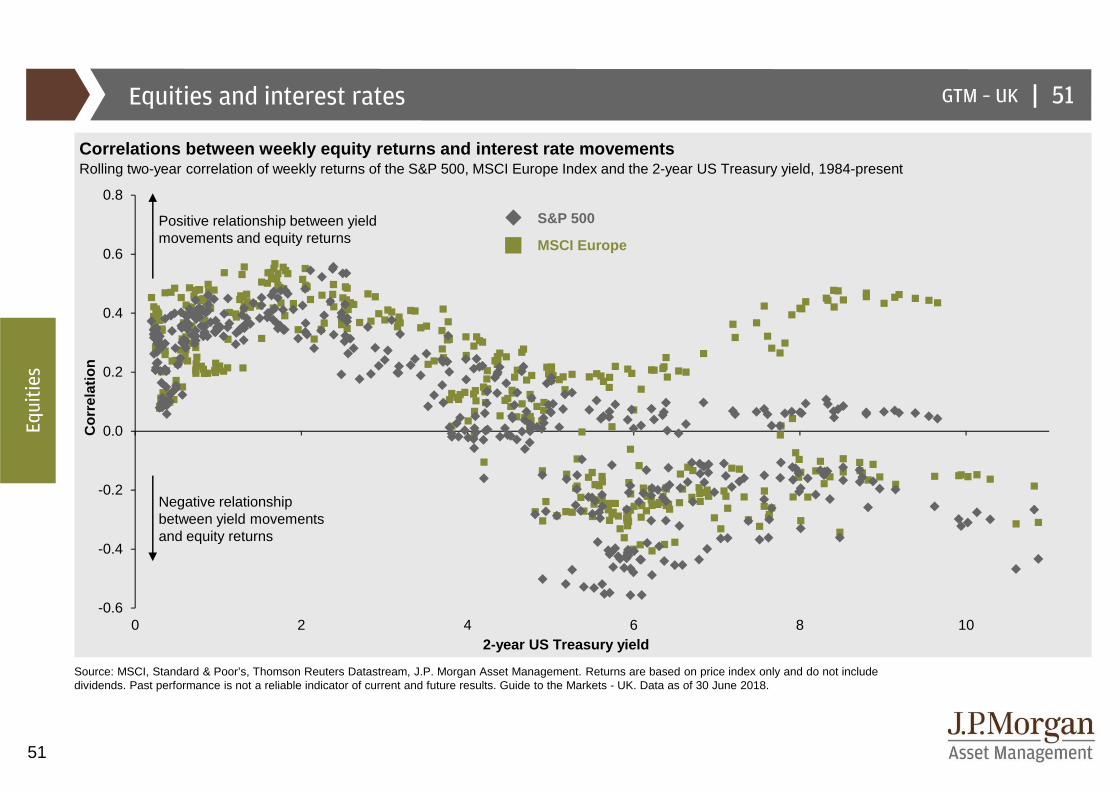
Equities and interest rates
Correlations between weekly equity returns and inte rest rate movementsRolling two-year correlation of weekly returns of the S&P 500, MSCI Europe Index and the 2-year US Treasury yield, 1984-present
Source: MSCI, Standard & Poor’s, Thomson Reuters Datastream, J.P. Morgan Asset Management. Returns are based on price index only and do not include dividends. Past performance is not a reliable indicator of current and future results. Guide to the Markets - UK. Data as of 30 June 2018.
Cor
rela
tion
2-year US Treasury yield
S&P 500
MSCI Europe
Positive relationship between yield movements and equity returns
Negative relationship between yield movements and equity returns
Equities
51

52
GTM – UK |
-100-90-80-70-60-50-40-30-20-10
0
'28 '33 '38 '43 '48 '53 '58 '63 '68 '73 '78 '83 '88 '93 '98 '03 '08 '13 '18
Market correctionsBear markets
Macro environment
Bull markets Return before peak
Market Bear DurationRecession
Bull Bull Duration 12 24peak return (months) start date return (months) months mont hs
1 Crash of 1929 – excessive leverage, irrational exuberance Sep 1929 -86% 33 - - -2 1937 Fed Tightening – premature policy tightening Mar 1937 -60 63 Jun 1932 324% 58 27% 119%3 Post WWII crash – post-war demobilisation, recession fears May 1946 -30 37 Apr 1942 158 50 27 574 Flash crash of 1962 – flash crash, Cuban Missile Crisis Dec 1961 -28 7 Jun 1949 436 152 28 235 Tech crash of 1970 – economic overheating, civil unrest Nov 1968 -36 18 Jun 1962 107 78 15 356 Stagflation – OPEC oil embargo Jan 1973 -48 21 May 1970 74 32 16 317 Volcker Tightening – campaign against inflation Nov 1980 -27 21 Oct 1974 126 75 32 488 1987 crash – programme trading, overheating markets Aug 1987 -34 3 Aug 1982 229 61 36 809 Tech bubble – extreme valuations, “dot com” boom/bust Mar 2000 -49 31 Dec 1987 582 150 19 3910 Global Financial Crisis – leverage/housing, Lehman collapse Oct 2007 -57 17 Oct 2002 101 61 16 31
Current cycle – – – Mar 2009 301 111MEDIAN – - 42% 21 158% 61 27% 39%
US bull and bear markets
S&P 500 declines from all-time highs, %
Characteristics of past bear and bull markets*
Source: Bloomberg, NBER, Robert Shiller, Standard & Poor’s, J.P. Morgan Asset Management. *A bear market represents a 20% or more decline from the previous market high using a monthly frequency; a bull market represents a 20% increase from a market trough. Periods of “recession” are defined using US National Bureau of Economic Research (NBER) business cycle dates. Chart and table show price return. Median values are calculated excluding data from current cycle. Past performance is not a reliable indicator of current and future results. Guide to the Markets - UK. Data as of 30 June 2018.
Equities
Recession
20% market decline
52
7
9
8
6
5
4
3
2
1
10

53
GTM – UK |
0.51.3
2.0 2.6 2.83.6
4.4
6.16.7
0
2
4
6
8
4.7% 5.4% 6.0% 5.1% 3.3% 4.2% 4.4% 2.5%1.8%
2.1% 3.9%
13.9%
-5.3%
3.0%
13.6%
4.4%1.6%
12.6% 15.3%
-2.7%
11.6% 6.0%
-10
0
10
20
1926-1929 1930s 1940s 1950s 1960s 1970s 1980s 1990s 2000s 2010-2017 1926-2017
Equity income
S&P 500 total return index: Dividends and capital a ppreciation
Sources of income
%, average annualised returns
% yield
Source: (Top) Ibbotson, Standard & Poor’s, Thomson Reuters Datastream, J.P. Morgan Asset Management. (Bottom) Barclays, BofA/Merrill Lynch, FTSE, Thomson Reuters Datastream, J.P. Morgan Asset Management. Global convertibles: Bloomberg Barclays Global Convertibles; EM equity; MSCI EM; UK IG: Bloomberg Barclays Sterling Agg. – Corporates; Global REITs: FTSE NAREIT Index; DM high yield: BofA/Merrill Lynch Developed Markets High Yield Constrained; EM debt: J.P. Morgan EMBI Global. Yields for the bond indices are yield to maturity and dividend yields for the equity indices. Past performance is not a reliable indicator of current and future results. Guide to the Markets - UK. Data as of 30 June 2018.
Dividends
Capital appreciation
Equities
53
UK Gilts Globalconvertibles
EMequity
FTSEAll-share
Global REITsUK IGUK cash DM high yield
EM debt
Average UK inflation: 2.8%(12 months to May 2018)

54
13.8% 2.6% 2.9% 9.5% 12.9% 26.0% 6.3% 14.1% 7.0% 2.0% 2.9% 100.0%
4.4% 1.8% 2.2% 11.9% 17.9% 41.5% 1.0% 13.4% 5.7% 0.2% 0.0% 100%
23.3% 4.1% 4.9% 7.9% 8.3% 9.9% 11.1% 13.9% 7.3% 3.6% 5.7% 100%
-3.2 2.6 6.1 -3.2 8.2 7.1 13.5 3.1 -1.5 -0.9 3.7 3.4
-4.1 -3.1 0.8 -4.7 11.5 10.9 6.8 1.8 -8.5 -8.4 0.3 2.6
13.9 71.3 68.8 103.7 245.5 231.5 24.2 182.8 147.5 41.5 91.6 118.7
521.7 307.9 525.7 459.8 699.7 594.6 127.4 355.9 247.0 170.3 235.3 388.6
1.44 1.30 1.29 1.23 1.13 1.07 0.98 0.74 0.59 0.56 0.42 1.00 β
12.1x 15.4x 17.5x 15.7x 20.7x 18.2x 17.9x 15.1x 17.1x 10.2x 16.4x 16.3x
12.8x 13.9x 15.2x 16.2x 17.7x 20.4x 17.5x 17.7x 17.2x 16.3x 1 4.0x 16.0x
14.2x 21.6x 37.4x 18.8x 21.8x 27.6x 19.4x 28.6x 20.0x 6.7x 17.3x 20.6x
15.6x 18.3x 34.2x 20.0x 19.0x 25.6x 17.8x 24.5x 21.3x 19.5x 1 5.8x 19.6x
2.1% 2.1% 3.6% 2.1% 1.4% 1.3% 2.9% 1.8% 3.2% 5.8% 3.7% 2.1%
2.3% 2.6% 4.4% 2.1% 1.5% 0.9% 2.4% 1.8% 2.6% 4.0% 4.1% 2.1%
We
ight
sR
etu
rnP
/ED
iv
US sector returns and valuations
Source: FactSet, Russell Investment Group, Standard & Poor’s, J.P. Morgan Asset Management. All calculations are cumulative total return in USD, not annualized, including dividends for the stated period. *“Since market peak” represents period 9 October 2007 to end of last quarter. **“Since market low” represents period 9 March 2009 to end of last quarter. Forward P/E ratio is a bottom-up calculation based on the most recent S&P 500 Index price, divided by consensus estimates for earnings in the next 12 months (NTM), and is provided by FactSet Market Aggregates. Trailing P/E ratios are bottom-up values defined as month-end price divided by the last 12 months of available reported earnings. This methodology is used to allow proper comparison of sector level data to broad index level data. Dividend yield is calculated as the next 12-month consensus dividend divided by most recent price. Averages are since October 1995 due to data availability. Past performance is not a reliable indicator of current and future results. Guide to the Markets - UK. Data as of 30 June 2018.
GTM – UK |
S&P 500 Index
FinancialsReal
estateMaterials IndustrialsCons.discr.
Tech EnergyHealthcare TelecomCons.
staplesS&P 500
S&P 500 weight
Q218
YTD
Since market peak*
Since market low**
Forward P/E ratio
Average since 1995
Trailing P/E ratio
Average since 1995
Dividend yield
Average since 1995
Russell Growth weight
Russell Value weight
Beta to US
Equities
54
Utilities
55
GTM – UK |
50
500
5,000
'70 '75 '80 '85 '90 '95 '00 '05 '10 '15
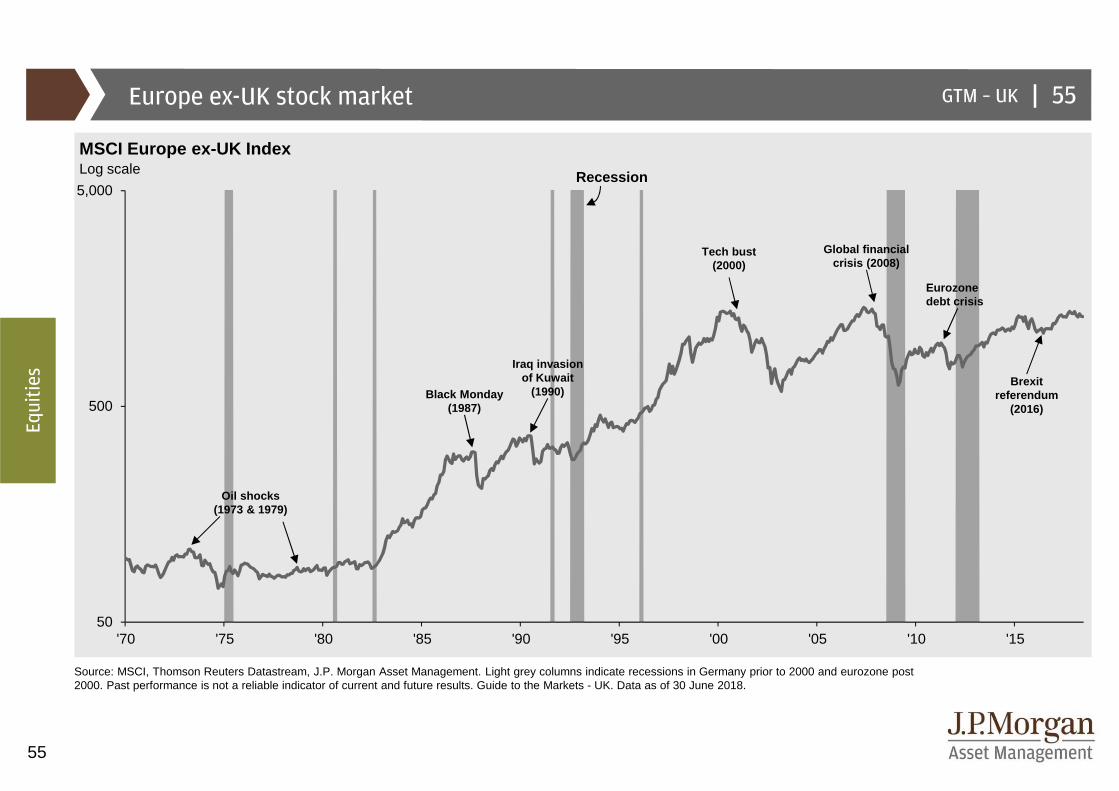
Europe ex-UK stock market
MSCI Europe ex-UK IndexLog scale
Source: MSCI, Thomson Reuters Datastream, J.P. Morgan Asset Management. Light grey columns indicate recessions in Germany prior to 2000 and eurozone post 2000. Past performance is not a reliable indicator of current and future results. Guide to the Markets - UK. Data as of 30 June 2018.
Equities
55
Recession
Black Monday (1987)
Iraq invasion of Kuwait
(1990)
Tech bust(2000)
Global financial crisis (2008)
Eurozone debt crisis
Brexit referendum
(2016)
Oil shocks(1973 & 1979)

56
GTM – UK |
-32
-24
-16
-8
0
8
16
24
32
40
'07 '08 '09 '10 '11 '12 '13 '14 '15 '16 '17 '18500
600
700
800
900
1,000
1,100
1,200
1,300
1,400
1,500
80
90
100
110
120
130
140
'07 '08 '09 '10 '11 '12 '13 '14 '15 '16 '17 '18
MSCI Europe ex-UK earnings per share growth
Europe ex-UK earnings
MSCI Europe ex-UK earnings and performanceNext 12 months’ earnings per share estimates (LHS); index level (RHS) % change year on year
Source: (All charts) IBES, MSCI, Thomson Reuters Datastream, J.P. Morgan Asset Management. EPS is earnings per share. Expected earnings growth and delivered earnings growth are calculated using IBES consensus estimates for next 12 months’ EPS and last 12 months’ EPS, respectively. Year on year growth rates are calculated using year-end data. Past performance is not a reliable indicator of current and future results. Guide to the Markets - UK. Data as of 30 June 2018.
MSCI Europe ex-UK index level
MSCI Europe ex-UK EPS
Equities
56
Start of year EPS growth expectationsDelivered EPS growth
Current EPS growth expectations
57
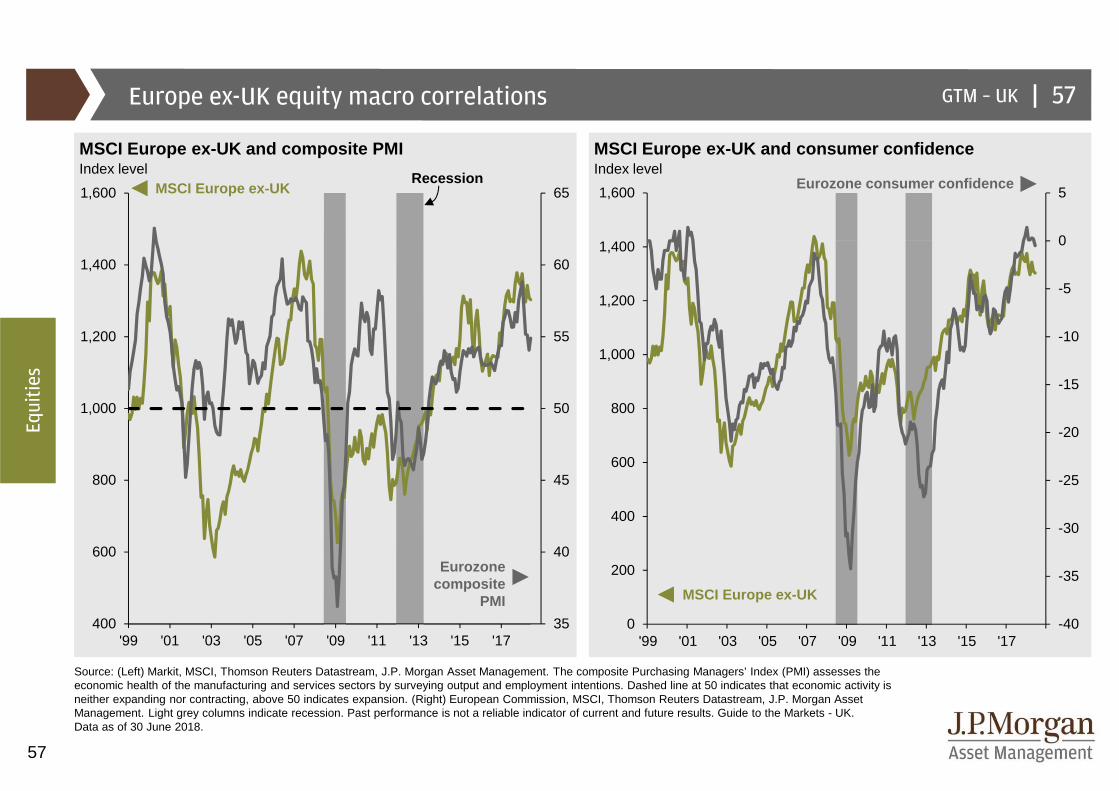
GTM – UK |Europe ex-UK equity macro correlations
MSCI Europe ex-UK and composite PMI MSCI Europe ex-U K and consumer confidenceIndex level Index level
Source: (Left) Markit, MSCI, Thomson Reuters Datastream, J.P. Morgan Asset Management. The composite Purchasing Managers’ Index (PMI) assesses the economic health of the manufacturing and services sectors by surveying output and employment intentions. Dashed line at 50 indicates that economic activity is neither expanding nor contracting, above 50 indicates expansion. (Right) European Commission, MSCI, Thomson Reuters Datastream, J.P. Morgan Asset Management. Light grey columns indicate recession. Past performance is not a reliable indicator of current and future results. Guide to the Markets - UK. Data as of 30 June 2018.
Eurozone composite
PMI
Eurozone consumer confidenceMSCI Europe ex-UK
MSCI Europe ex-UK
Equities
57
Recession
-40
-35
-30
-25
-20
-15
-10
-5
0
5
0
200
400
600
800
1,000
1,200
1,400
1,600
'99 '01 '03 '05 '07 '09 '11 '13 '15 '1735
40
45
50
55
60
65
400
600
800
1,000
1,200
1,400
1,600
'99 '01 '03 '05 '07 '09 '11 '13 '15 '17

58
GTM – UK |
0.8
0.9
1.0
1.1
1.2
1.3
1.4
1.5
1.6
1.7
400
600
800
1,000
1,200
1,400
1,600
'99 '01 '03 '05 '07 '09 '11 '13 '15 '17
Europe ex-UK equity market and currency
MSCI Europe ex-UK vs. the euroIndex level (LHS); US dollars per euro (RHS)
Source: MSCI, Thomson Reuters Datastream, J.P. Morgan Asset Management. Past performance is not a reliable indicator of current and future results. Guide to the Markets - UK. Data as of 30 June 2018.
EURUSD
MSCI Europe ex-UK
Equities
58
Euro appreciating
59
GTM – UK |
7
9
11
13
15
17
19
21
23
25
27
'90 '92 '94 '96 '98 '00 '02 '04 '06 '08 '10 '12 '14 '16 '18
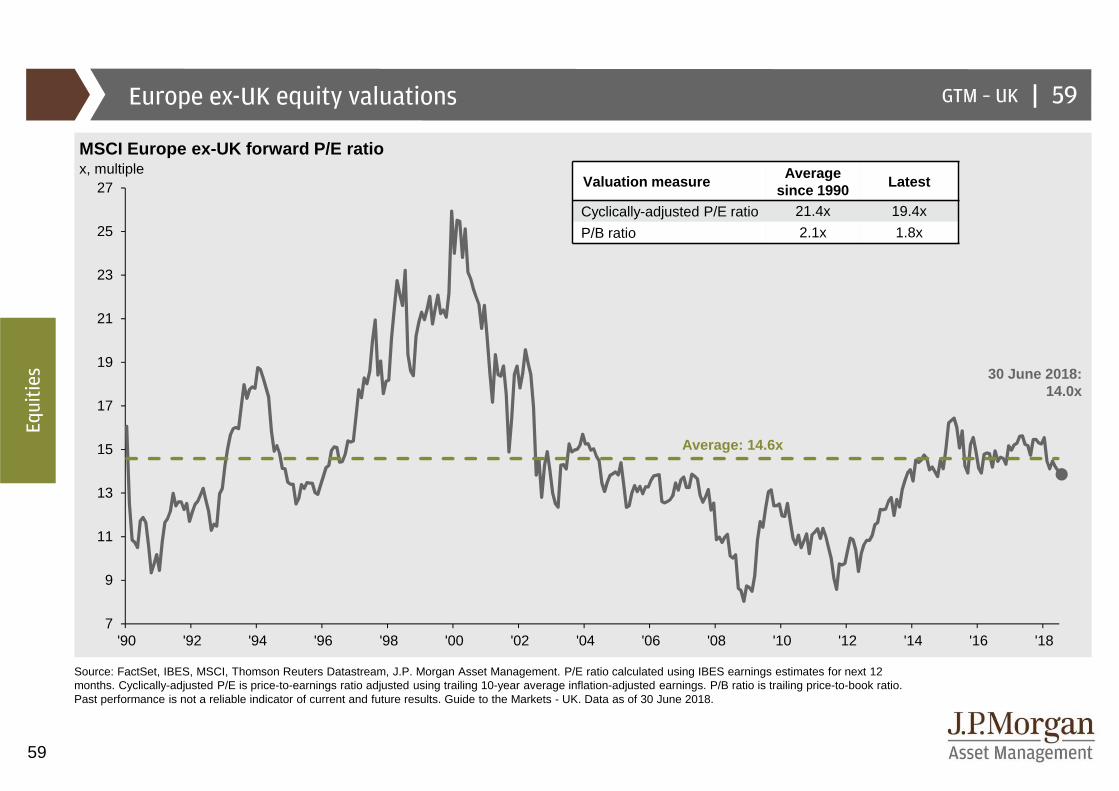
Europe ex-UK equity valuations
MSCI Europe ex-UK forward P/E ratiox, multiple
Source: FactSet, IBES, MSCI, Thomson Reuters Datastream, J.P. Morgan Asset Management. P/E ratio calculated using IBES earnings estimates for next 12 months. Cyclically-adjusted P/E is price-to-earnings ratio adjusted using trailing 10-year average inflation-adjusted earnings. P/B ratio is trailing price-to-book ratio. Past performance is not a reliable indicator of current and future results. Guide to the Markets - UK. Data as of 30 June 2018.
30 June 2018:14.0x
Average: 14.6x
Valuation measureAverage
since 1990Latest
Cyclically-adjusted P/E ratio 21.4x 19.4x
P/B ratio 2.1x 1.8x
59
Equities
60
GTM – UK |
0
50
100
150
200
250
300
350
'00 '02 '04 '06 '08 '10 '12 '14 '16 '18
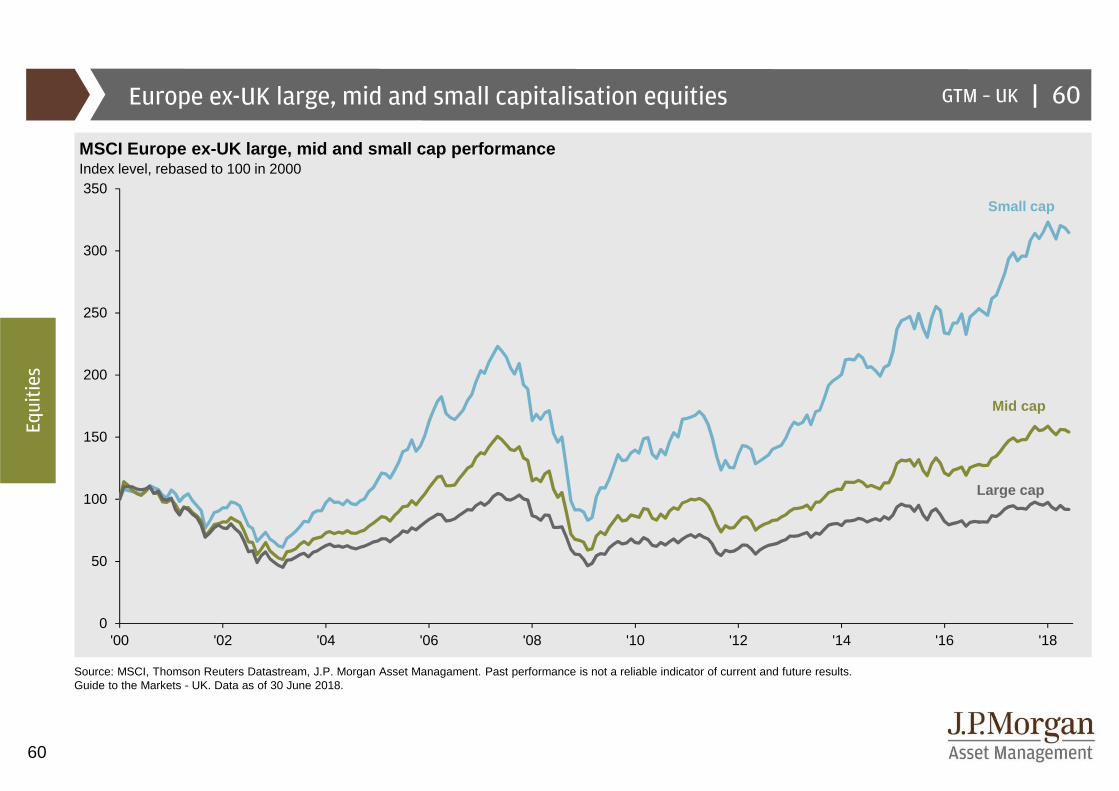
Europe ex-UK large, mid and small capitalisation equities
MSCI Europe ex-UK large, mid and small cap performa nceIndex level, rebased to 100 in 2000
Source: MSCI, Thomson Reuters Datastream, J.P. Morgan Asset Managament. Past performance is not a reliable indicator of current and future results. Guide to the Markets - UK. Data as of 30 June 2018.
Mid cap
Large cap
Small cap
Equities
60
61
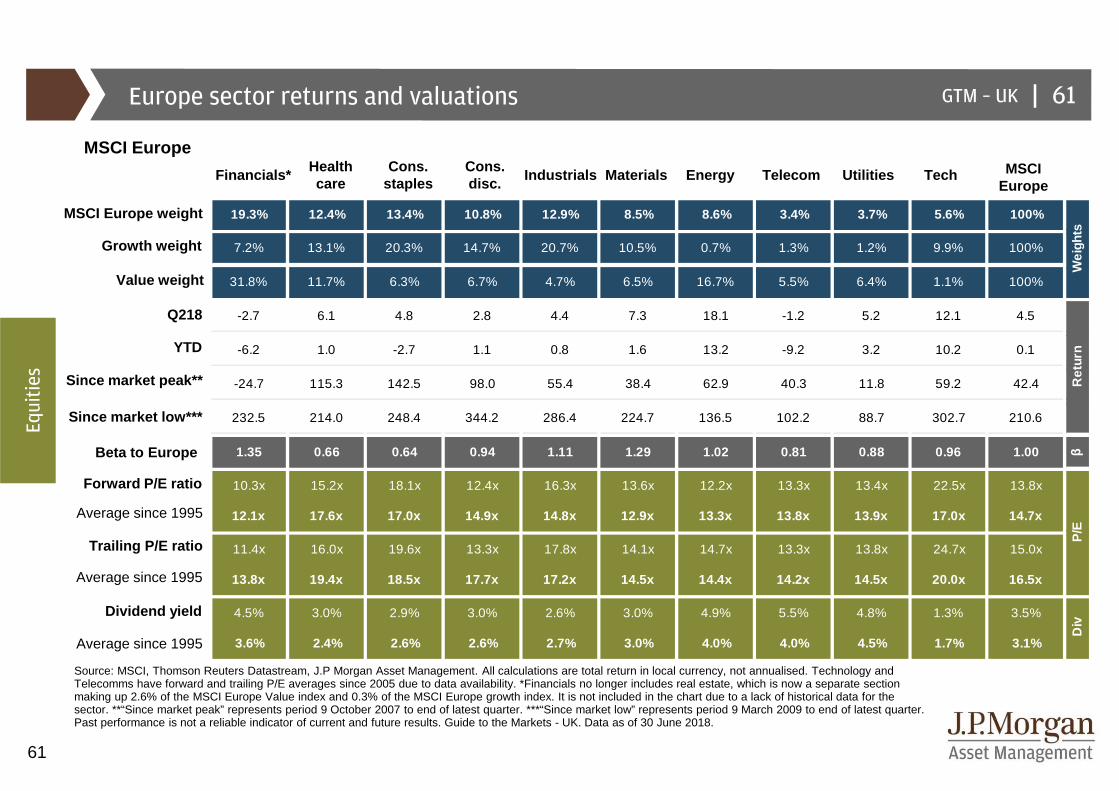
19.3% 12.4% 13.4% 10.8% 12.9% 8.5% 8.6% 3.4% 3.7% 5.6% 100%
7.2% 13.1% 20.3% 14.7% 20.7% 10.5% 0.7% 1.3% 1.2% 9.9% 100%
31.8% 11.7% 6.3% 6.7% 4.7% 6.5% 16.7% 5.5% 6.4% 1.1% 100%
-2.7 6.1 4.8 2.8 4.4 7.3 18.1 -1.2 5.2 12.1 4.5
-6.2 1.0 -2.7 1.1 0.8 1.6 13.2 -9.2 3.2 10.2 0.1
-24.7 115.3 142.5 98.0 55.4 38.4 62.9 40.3 11.8 59.2 42.4
232.5 214.0 248.4 344.2 286.4 224.7 136.5 102.2 88.7 302.7 210.6
1.35 0.66 0.64 0.94 1.11 1.29 1.02 0.81 0.88 0.96 1.00 β
10.3x 15.2x 18.1x 12.4x 16.3x 13.6x 12.2x 13.3x 13.4x 22.5x 13.8x
12.1x 17.6x 17.0x 14.9x 14.8x 12.9x 13.3x 13.8x 13.9x 17.0x 1 4.7x
11.4x 16.0x 19.6x 13.3x 17.8x 14.1x 14.7x 13.3x 13.8x 24.7x 15.0x
13.8x 19.4x 18.5x 17.7x 17.2x 14.5x 14.4x 14.2x 14.5x 20.0x 1 6.5x
4.5% 3.0% 2.9% 3.0% 2.6% 3.0% 4.9% 5.5% 4.8% 1.3% 3.5%
3.6% 2.4% 2.6% 2.6% 2.7% 3.0% 4.0% 4.0% 4.5% 1.7% 3.1%
Wei
ghts
Ret
urn
P/E
Div
Europe sector returns and valuations
Source: MSCI, Thomson Reuters Datastream, J.P Morgan Asset Management. All calculations are total return in local currency, not annualised. Technology and Telecomms have forward and trailing P/E averages since 2005 due to data availability. *Financials no longer includes real estate, which is now a separate section making up 2.6% of the MSCI Europe Value index and 0.3% of the MSCI Europe growth index. It is not included in the chart due to a lack of historical data for the sector. **“Since market peak” represents period 9 October 2007 to end of latest quarter. ***“Since market low” represents period 9 March 2009 to end of latest quarter. Past performance is not a reliable indicator of current and future results. Guide to the Markets - UK. Data as of 30 June 2018.
GTM – UK |
MSCI Europe
Financials*Health care
Cons. staples
Cons. disc.
Industrials Materials Energy Telecom Utilities Tech MSCIEurope
MSCI Europe weight
Q218
YTD
Since market peak**
Since market low***
Forward P/E ratio
Average since 1995
Trailing P/E ratio
Average since 1995
Dividend yield
Average since 1995
Growth weight
Value weight
Beta to Europe
Equities
61

62
GTM – UK |
50
500
5,000
'63 '68 '73 '78 '83 '88 '93 '98 '03 '08 '13 '18
UK stock market
FTSE All-Share IndexLog scale
Source: FTSE, Thomson Reuters Datastream, J.P. Morgan Asset Management. Light grey columns indicate recession. Past performance is not a reliable indicator of current and future results. Guide to the Markets - UK. Data as of 30 June 2018.
Equities
62
UK joins European Economic
Community(1973)
Tech bust(2000)
Global financial crisis (2008)
Brexit vote(2016)
UK leaves European Exchange Rate
Mechanism(1992)
BlackMonday(1987)
Recession
Oil shocks(1973 & 1979)

63
GTM – UK |
1,500
2,000
2,500
3,000
3,500
4,000
4,500
180
200
220
240
260
280
300
320
'07 '08 '09 '10 '11 '12 '13 '14 '15 '16 '17 '18
UK earnings
FTSE All-Share earnings and performance FTSE All-Sha re earnings per share growthNext 12 months’ earnings per share estimates (LHS); index level (RHS) % change year on year
Source: (All charts) FTSE, IBES, Thomson Reuters Datastream, J.P. Morgan Asset Management. EPS is earnings per share. Expected earnings growth and delivered earnings growth are calculated using IBES consensus estimates for next 12 months’ EPS and last 12 months’ EPS, respectively. Year on year growth rates are calculated using year-end data. Past performance is not a reliable indicator of current and future results. Guide to the Markets - UK. Data as of 30 June 2018.
FTSE All-Share index levelFTSE All-Share EPS
Equities
63
Start of year EPS growth expectationsDelivered EPS growth
Current EPS growth expectations
-36
-28
-20
-12
-4
4
12
20
28
36
44
52
'07 '08 '09 '10 '11 '12 '13 '14 '15 '16 '17 '18

64
GTM – UK |
1.0
1.2
1.4
1.6
1.8
2.0
2.2
500
1,000
1,500
2,000
2,500
3,000
3,500
4,000
4,500
'00 '02 '04 '06 '08 '10 '12 '14 '16 '18
UK equity market and currency
FTSE All-Share vs. sterlingIndex level (LHS); US dollars per UK pound (RHS)
Source: FTSE, Thomson Reuters Datastream, J.P. Morgan Asset Management. Past performance is not a reliable indicator of current and future results. Guide to the Markets - UK. Data as of 30 June 2018.
GBPUSD
FTSE All-Share
Equities
Sterling appreciating
64

65
GTM – UK |
0
10
20
30
40
50
60
70
'13 '14 '15 '16 '17 '18
UK large, mid and small capitalisation equities
FTSE 100 vs. FTSE 250 performance UK small & mid cap exposure*Index level, rebased to 100 in Jan 1987 %
Source: (Left) FTSE, Thomson Reuters Datastream, J.P. Morgan Asset Management. (Right) Morningstar, J.P. Morgan Asset Management. *Exposure to small & mid cap companies is the exposure of flexible cap UK funds. Past performance is not a reliable indicator of current and future results. Guide to the Markets - UK. Data as of 30 June 2018.
Equities
65
Average fund manager exposure*
Weight of small & mid cap in FTSE All-Share
25th - 75th percentile rangeFTSE 250
FTSE 100
0
200
400
600
800
1,000
1,200
'87 '92 '97 '02 '07 '12 '17

66
GTM – UK |
10
100
1,000
'51 '56 '61 '66 '71 '76 '81 '86 '91 '96 '01 '06 '11 '16
Japan stock market
TOPIX IndexLog scale
Source: Thomson Reuters Datastream, TOPIX, J.P. Morgan Asset Management. Light grey columns indicate recession. Past performance is not a reliable indicator of current and future results. Guide to the Markets - UK. Data as of 30 June 2018.
Equities
66
Recession
Global financial crisis (2008)
Tech bust(2000)
BlackMonday(1987) Japan’s financial
crisis (1997)
Japan-US automotive friction
(1981)
The Great East Japan Earthquake
(2011)
Oil shocks(1973 & 1979)
Japan property bubble bursts
(1990)

67
GTM – UK |
-40
-30
-20
-10
0
10
20
30
40
'07 '08 '09 '10 '11 '12 '13 '14 '15 '16 '17 '18-350
329 89
6346
67 66
-123
261
Japan earnings
TOPIX earnings and performance TOPIX earnings per sh are growthIndex level, next 12 months’ earnings estimates (LHS); index level (RHS) % change year on year
Source: (All charts) IBES, Thomson Reuters Datastream, TOPIX, J.P. Morgan Asset Management. EPS is earnings per share. Expected earnings growth and delivered earnings growth are calculated using IBES consensus estimates for next 12 months’ EPS and last 12 months’ EPS, respectively. Year on year growth rates are calculated using year-end data, which is on 31 March for Japan, with the calendar year continuing until 31 March of the following year. Past performance is not a reliable indicator of current and future results. Guide to the Markets - UK. Data as of 30 June 2018.
TOPIX index levelTOPIX EPS
Equities
67
Start of year EPS growth expectationsDelivered EPS growth
350
Current EPS growth expectations
100
300
500
700
900
1,100
1,300
1,500
1,700
1,900
20
30
40
50
60
70
80
90
100
110
120
130
140
150
'07 '09 '11 '13 '15 '17

68
GTM – UK |
70
80
90
100
110
120
130
140400
600
800
1,000
1,200
1,400
1,600
1,800
2,000
'00 '02 '04 '06 '08 '10 '12 '14 '16 '18
Japan equity market and currency
TOPIX vs. the yenIndex level (LHS); Japanese yen per US dollar (RHS)
Source: Thomson Reuters Datastream, TOPIX, J.P. Morgan Asset Management. Past performance is not a reliable indicator of current and future results. Guide to the Markets - UK. Data as of 30 June 2018.
USDJPY (inverted)
TOPIX
Equities
Yen appreciating
68
69
GTM – UK |
0
4
8
12
16
20
'00 '02 '04 '06 '08 '10 '12 '14 '16
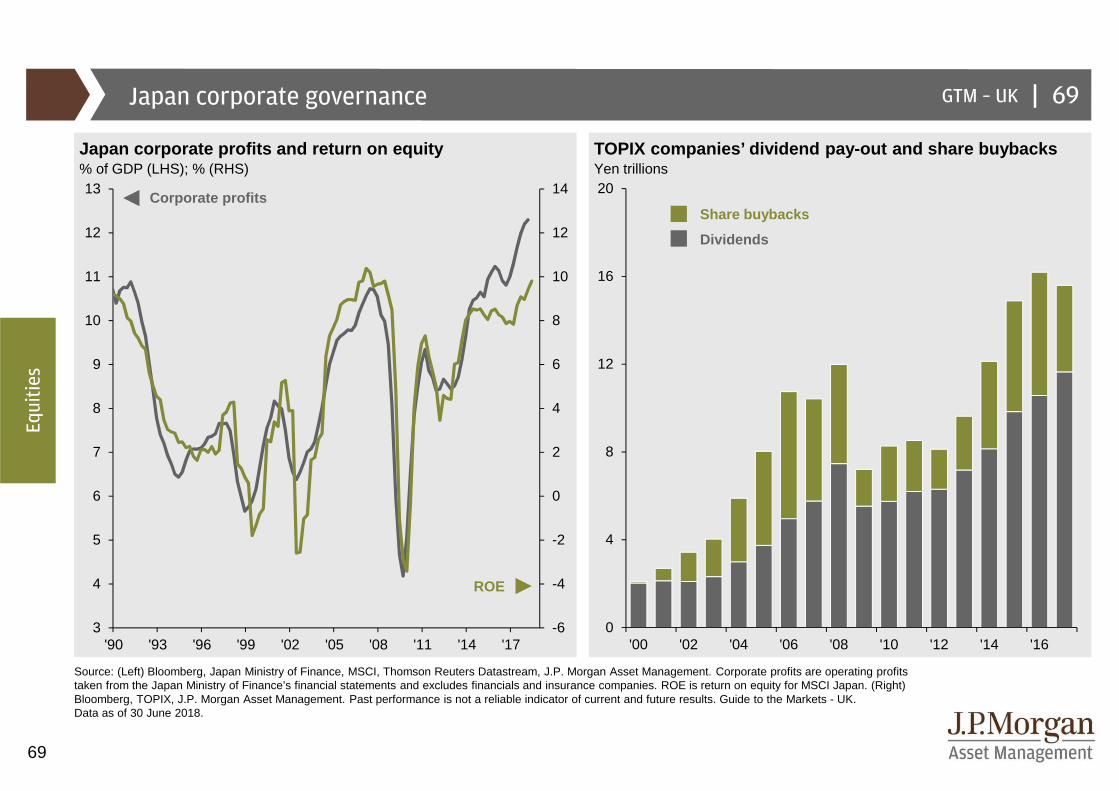
Japan corporate governance
Japan corporate profits and return on equity TOPIX c ompanies’ dividend pay-out and share buybacks% of GDP (LHS); % (RHS) Yen trillions
Source: (Left) Bloomberg, Japan Ministry of Finance, MSCI, Thomson Reuters Datastream, J.P. Morgan Asset Management. Corporate profits are operating profits taken from the Japan Ministry of Finance’s financial statements and excludes financials and insurance companies. ROE is return on equity for MSCI Japan. (Right) Bloomberg, TOPIX, J.P. Morgan Asset Management. Past performance is not a reliable indicator of current and future results. Guide to the Markets - UK. Data as of 30 June 2018.
Equities
69
Corporate profits
ROE
Dividends
Share buybacks
-6
-4
-2
0
2
4
6
8
10
12
14
3
4
5
6
7
8
9
10
11
12
13
'90 '93 '96 '99 '02 '05 '08 '11 '14 '17
70
GTM – UK |
50
70
90
110
130
150
170
190
210
'06 '07 '08 '09 '10 '11 '12 '13 '14 '15 '16 '17 '18
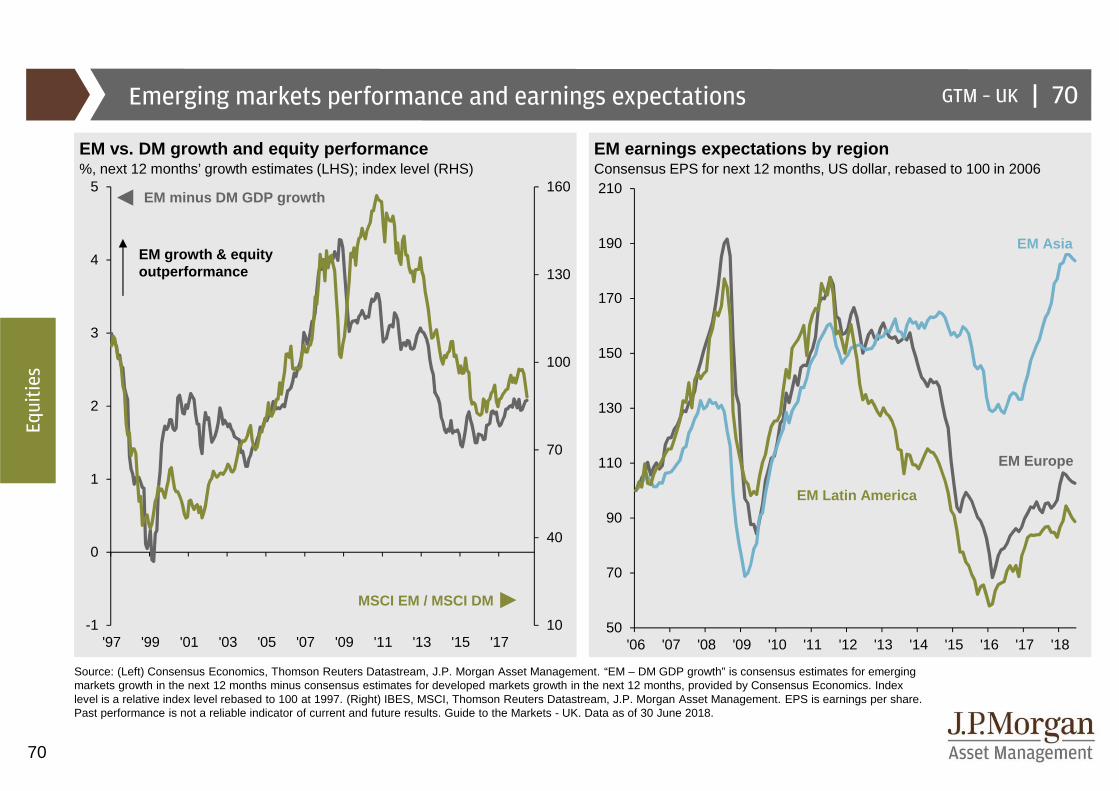
Emerging markets performance and earnings expectations
EM vs. DM growth and equity performance EM earnings expectations by region%, next 12 months’ growth estimates (LHS); index level (RHS) Consensus EPS for next 12 months, US dollar, rebased to 100 in 2006
Source: (Left) Consensus Economics, Thomson Reuters Datastream, J.P. Morgan Asset Management. “EM – DM GDP growth” is consensus estimates for emerging markets growth in the next 12 months minus consensus estimates for developed markets growth in the next 12 months, provided by Consensus Economics. Index level is a relative index level rebased to 100 at 1997. (Right) IBES, MSCI, Thomson Reuters Datastream, J.P. Morgan Asset Management. EPS is earnings per share. Past performance is not a reliable indicator of current and future results. Guide to the Markets - UK. Data as of 30 June 2018.
Equities
EM Latin America
EM Asia
EM Europe
70
EM growth & equity outperformance
EM minus DM GDP growth
MSCI EM / MSCI DM
10
40
70
100
130
160
-1
0
1
2
3
4
5
'97 '99 '01 '03 '05 '07 '09 '11 '13 '15 '17

71
GTM – UK |
150
230
310
390
470
550
630
20
40
60
80
100
120
140
160
180
'97 '99 '01 '03 '05 '07 '09 '11 '13 '15 '17
85
95
105
115
125
13520
40
60
80
100
120
140
160
180
'97 '99 '01 '03 '05 '07 '09 '11 '13 '15 '17
Emerging markets equity drivers
EM equity relative performance and commodities Relat ive EM / DM equity performance and USD REERRelative index level rebased to 100 at 1997 (LHS); index level (RHS) Relative index level rebased to 100 at 1997 (LHS); index level (RHS)
Source: (Left) Commodity Research Bureau, MSCI, Thomson Reuters Datastream, J.P. Morgan Asset Management. (Right) J.P. Morgan Securities Research, MSCI, Thomson Reuters Datastream, J.P. Morgan Asset Management. For all charts, MSCI EM and MSCI DM returns are in USD. Past performance is not a reliable indicator of current and future results. Guide to the Markets - UK. Data as of 30 June 2018.
Equities
MSCI EM / MSCI DM CRB Commodity Index
71
USD REER (inverted)MSCI EM / MSCI DM
EM equity outperformance & USD weakening
EM equity outperformance & commodity prices rising

72
GTM – UK |
0.75
1.00
1.25
1.50
1.75
2.00
2.25
2.50
2.75
3.00
'96 '98 '00 '02 '04 '06 '08 '10 '12 '14 '16 '18
Emerging markets equity valuations and subsequent returns
MSCI EM price-to-book ratio MSCI EM price-to-book ratio and subsequent 10-year returnsx, multiple %, annualised total return*
Source: (All charts) MSCI, Thomson Reuters Datastream, J.P. Morgan Asset Management. *Dots represent monthly data points since 1996, which is earliest available.Past performance is not a reliable indicator of current and future results. Guide to the Markets - UK. Data as of 30 June 2018.
Average: 1.8x
Equities
72
30 June 2018:1.7x
-20
-10
0
10
20
30
0.8x 1.3x 1.8x 2.3x 2.8x 3.3x
Current level

73
GTM – UK |Correlation and volatility
Cross country equity index correlation VIX volatilit y index%, rolling six-month average pairwise correlations Index level, implied volatility of S&P 500 Index based on options pricing
Source: (Left) Bloomberg, J.P. Morgan Asset Management. Correlation calculated from 10 market indices. (Right) CBOE, Thomson Reuters Datastream, J.P. Morgan Asset Management. Past performance is not a reliable indicator of current and future results. Guide to the Markets - UK. Data as of 30 June 2018.
Equities
73
Increasing correlation between different countries’ equity markets
0.2
0.3
0.4
0.5
0.6
0.7
0.8
0.9
'95 '97 '99 '01 '03 '05 '07 '09 '11 '13 '15 '170
10
20
30
40
50
60
'95 '97 '99 '01 '03 '05 '07 '09 '11 '13 '15 '17
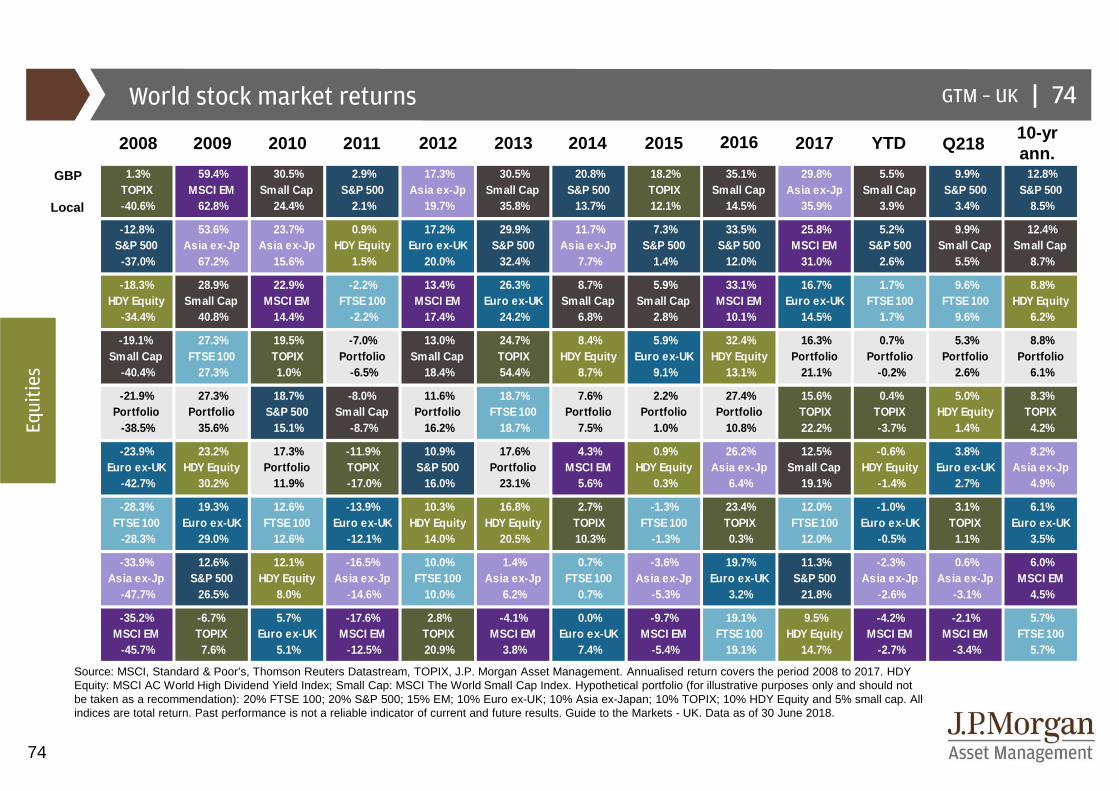
74
1.3% TOPIX
-40.6%
59.4% MSCI EM
62.8%
30.5% Small Cap
24.4%
2.9% S&P 500
2.1%
17.3% Asia ex-Jp
19.7%
30.5% Small Cap
35.8%
20.8% S&P 500 13.7%
18.2% TOPIX 12.1%
35.1% Small Cap
14.5%
29.8% Asia ex-Jp
35.9%
5.5% Small Cap
3.9%
9.9% S&P 500
3.4%
12.8% S&P 500
8.5%
-12.8% S&P 500 -37.0%
53.6% Asia ex-Jp
67.2%
23.7% Asia ex-Jp
15.6%
0.9% HDY Equity
1.5%
17.2% Euro ex-UK
20.0%
29.9% S&P 500 32.4%
11.7% Asia ex-Jp
7.7%
7.3% S&P 500
1.4%
33.5% S&P 500 12.0%
25.8% MSCI EM
31.0%
5.2% S&P 500
2.6%
9.9% Small Cap
5.5%
12.4% Small Cap
8.7%
-18.3% HDY Equity
-34.4%
28.9% Small Cap
40.8%
22.9% MSCI EM
14.4%
-2.2% FTSE 100
-2.2%
13.4% MSCI EM
17.4%
26.3% Euro ex-UK
24.2%
8.7% Small Cap
6.8%
5.9% Small Cap
2.8%
33.1% MSCI EM
10.1%
16.7% Euro ex-UK
14.5%
1.7% FTSE 100
1.7%
9.6% FTSE 100
9.6%
8.8% HDY Equity
6.2%
-19.1% Small Cap
-40.4%
27.3% FTSE 100
27.3%
19.5% TOPIX 1.0%
-7.0% Portfolio
-6.5%
13.0% Small Cap
18.4%
24.7% TOPIX 54.4%
8.4% HDY Equity
8.7%
5.9% Euro ex-UK
9.1%
32.4% HDY Equity
13.1%
16.3% Portfolio
21.1%
0.7% Portfolio
-0.2%
5.3% Portfolio
2.6%
8.8% Portfolio
6.1%
-21.9% Portfolio -38.5%
27.3% Portfolio
35.6%
18.7% S&P 500 15.1%
-8.0% Small Cap
-8.7%
11.6% Portfolio
16.2%
18.7% FTSE 100
18.7%
7.6% Portfolio
7.5%
2.2% Portfolio
1.0%
27.4% Portfolio
10.8%
15.6% TOPIX 22.2%
0.4% TOPIX -3.7%
5.0% HDY Equity
1.4%
8.3% TOPIX 4.2%
-23.9% Euro ex-UK
-42.7%
23.2% HDY Equity
30.2%
17.3% Portfolio
11.9%
-11.9% TOPIX -17.0%
10.9% S&P 500 16.0%
17.6% Portfolio
23.1%
4.3% MSCI EM
5.6%
0.9% HDY Equity
0.3%
26.2% Asia ex-Jp
6.4%
12.5% Small Cap
19.1%
-0.6% HDY Equity
-1.4%
3.8% Euro ex-UK
2.7%
8.2% Asia ex-Jp
4.9%
-28.3% FTSE 100 -28.3%
19.3% Euro ex-UK
29.0%
12.6% FTSE 100
12.6%
-13.9% Euro ex-UK
-12.1%
10.3% HDY Equity
14.0%
16.8% HDY Equity
20.5%
2.7% TOPIX 10.3%
-1.3% FTSE 100
-1.3%
23.4% TOPIX 0.3%
12.0% FTSE 100
12.0%
-1.0% Euro ex-UK
-0.5%
3.1% TOPIX 1.1%
6.1% Euro ex-UK
3.5%
-33.9% Asia ex-Jp
-47.7%
12.6% S&P 500 26.5%
12.1% HDY Equity
8.0%
-16.5% Asia ex-Jp
-14.6%
10.0% FTSE 100
10.0%
1.4% Asia ex-Jp
6.2%
0.7% FTSE 100
0.7%
-3.6% Asia ex-Jp
-5.3%
19.7% Euro ex-UK
3.2%
11.3% S&P 500 21.8%
-2.3% Asia ex-Jp
-2.6%
0.6% Asia ex-Jp
-3.1%
6.0% MSCI EM
4.5%
-35.2% MSCI EM -45.7%
-6.7% TOPIX 7.6%
5.7% Euro ex-UK
5.1%
-17.6% MSCI EM -12.5%
2.8% TOPIX 20.9%
-4.1% MSCI EM
3.8%
0.0% Euro ex-UK
7.4%
-9.7% MSCI EM
-5.4%
19.1% FTSE 100
19.1%
9.5% HDY Equity
14.7%
-4.2% MSCI EM
-2.7%
-2.1% MSCI EM
-3.4%
5.7% FTSE 100
5.7%
World stock market returns
Source: MSCI, Standard & Poor’s, Thomson Reuters Datastream, TOPIX, J.P. Morgan Asset Management. Annualised return covers the period 2008 to 2017. HDY Equity: MSCI AC World High Dividend Yield Index; Small Cap: MSCI The World Small Cap Index. Hypothetical portfolio (for illustrative purposes only and should not be taken as a recommendation): 20% FTSE 100; 20% S&P 500; 15% EM; 10% Euro ex-UK; 10% Asia ex-Japan; 10% TOPIX; 10% HDY Equity and 5% small cap. All indices are total return. Past performance is not a reliable indicator of current and future results. Guide to the Markets - UK. Data as of 30 June 2018.
GTM – UK |
GBP
Local
Equities
74
2010 201620122008 2011 YTD2009 2013 2014 201510-yr ann.
2017 Q218

75
GTM – UK |
-20
-16
-12
-8
-4
0
4
0
5
10
15
20
25
Fixed income yields and interest rate risk
Current and historical yields for selected indices
Illustration of the impact a 1% rise in local inter est rates may have on selected indices
% yield, fluctuations over the last 10 years*
% change, assumes a parallel shift in the yield curve and spreads are maintained
Source: (All charts) Thomson Reuters Datastream, J.P. Morgan Asset Management.
*Historical yield range is based on the last 10 years of data, with the exception of global convertibles, which is based on nine years, due to data availability.
Fixed income sectors shown are UK Gilts 1-3: Bloomberg Barclays Sterling Government 1-3 Years; UK Gilts 10+: Bloomberg Barclays Sterling Government 10+ Years; US Treasury: Bloomberg Barclays US Agg. Treasury; Euro inv. grade: Bloomberg Barclays Euro Agg. – Corporates; US inv. grade: Bloomberg Barclays US Corporate Investment Grade; UK inv. grade: Bloomberg Barclays Sterling Agg. – Corporates; Euro high yield: BofA/Merrill Lynch Euro Non-Financial High Yield Constrained; US high yield: BofA/Merrill Lynch US High Yield Constrained; Global convertibles: Bloomberg Barclays Credit/Rate Sensitive; EMD USD Sov.: J.P. Morgan EMBI Global; EMD Local Sov.: JPM GBI-EM Composite.
For illustrative purposes only. Change in bond price is calculated using both duration and convexity, with the exception of Convertibles, which is historical change.Past performance is not a reliable indicator of current and future results.
Guide to the Markets - UK.Data as of 30 June 2018.
UK Gilts: 1-3 years
UK Gilts: 10+ years
US Treasury: all years
Euro inv. grade
US inv. grade
UK inv. grade
Euro high yield
US high yield
Global convertibles
EMD (USD Sov.)
EMD (Local Sov.)
How to interpret this chart
Average
Current
Max
Min
Fixed income
75
Price return
Total return
Euro inv. grade
US inv. grade
UK inv. grade
UK Gilts: 1-3 years
UK Gilts: 10+ years
US Treasury: all years
Euro high yield
US high yield
Global convertibles
EMD (USD Sov.)
EMD (Local Sov.)

76
GTM – UK |US nominal and real 10-year government bond yields
Nominal and real 10-year US Treasury yields%
Source: Bloomberg, J.P. Morgan Asset Management. Real yields are US Treasury Inflation Protected Securities (TIPS). Implied inflation expectations is the breakeven index rate. Past performance is not a reliable indicator of current and future results. Guide to the Markets - UK. Data as of 30 June 2018.
Nominal
Real
Implied inflation expectations
Fixed income
76
-2
0
2
4
6
8
10
12
14
16
18
'62 '64 '66 '68 '70 '72 '74 '76 '78 '80 '82 '84 '86 '88 '90 '92 '94 '96 '98 '00 '02 '04 '06 '08 '10 '12 '14 '16 '18

77
GTM – UK |
-2
-1
0
1
2
3
'78 '82 '86 '90 '94 '98 '02 '06 '10 '14 '18
US yield curve
Yield curve Yield curve inversion and recession%, 10-year Treasury yield minus 2-year Treasury yield Number of months from
Source: (All charts) Bloomberg, Federal Reserve, Thomson Reuters Datastream, J.P. Morgan Asset Management. Date of yield curve inversion is taken from the first point the yield curve spread goes below zero, for two consecutive months. Periods of “recession” are defined using US National Bureau of Economic Research (NBER) business cycle dates. Past performance is not a reliable indicator of current and future results. Guide to the Markets - UK. Data as of 30 June 2018.
Yield curve inversion
date
Curve inversion
to S&P 500 peak
before recession
S&P 500 peak to start of
recession
Curve inversion
to recession
Aug ’78 17 0 17
Sep ’80 2 8 10
Dec ’88 17 2 19
Feb ’00 6 7 13
Dec ’05 22 2 24
Median 17 2 17
Average 13 4 17
Recession
Fixed income
77

78
GTM – UK |US investment-grade bonds
US investment-grade spread US investment-grade leverage measures% yield, option-adjusted spread over local government bond yield x, leverage (LHS); x, interest coverage ratio (RHS)
Source: (Left) Bloomberg Barclays, Thomson Reuters Datastream, J.P. Morgan Asset Management. Index is Bloomberg Barclays US Corporate Investment Grade.(Right) J.P. Morgan Securities, J.P. Morgan Asset Management. Net leverage is net debt to earnings before interest, tax, depreciation and amortisation (EBITDA). Interest coverage ratio is EBITDA over interest expense. Past performance is not a reliable indicator of current and future results. Guide to the Markets - UK. Data as of 30 June 2018.
Fixed income
Net leverage
Interest coverage
78
6
8
10
12
14
16
1.0
1.5
2.0
2.5
3.0
'00 '02 '04 '06 '08 '10 '12 '14 '16 '180
1
2
3
4
5
6
7
'00 '02 '04 '06 '08 '10 '12 '14 '16 '18

79
GTM – UK |
0
5
10
15
20
25
0
2
4
6
8
10
12
'00 '02 '04 '06 '08 '10 '12 '14 '16 '182.5
3.0
3.5
4.0
4.5
5.0
'08 '09 '10 '11 '12 '13 '14 '15 '16 '17 '18
US high yield bonds
US high yield spread and defaults US high yield leve rage measures% defaults (LHS); % yield, option-adjusted spread (RHS) x, leverage and interest coverage ratio
Source: (Left) BofA/Merrill Lynch, J.P. Morgan Securities Research, J.P. Morgan Asset Management. HY spread is using the BofA/Merrill Lynch US High Yield Constrained index. Default rates are defined as the par value percentage of the total market trading at or below 50% of par value and include any Chapter 11 filing, prepackaged filing or missed interest payments. *2018 default data is for the last 12 months. (Right) J.P. Morgan Economic Research, J.P. Morgan Asset Management. Net leverage is net debt to earnings before interest, tax, depreciation and amortisation (EBITDA). Interest coverage ratio is EBITDA over interest expense. Past performance is not a reliable indicator of current and future results. Guide to the Markets - UK. Data as of 30 June 2018.
Fixed income
79
Interest coverage ratio
Net leverage
SpreadDefaults
*

80
GTM – UK |Europe nominal and real 10-year government bond yields
Nominal and real 10-year Bund yields%
Source: Bloomberg, J.P. Morgan Asset Management. Real yields are inflation-linked German government bonds. Implied inflation expectations is the breakeven index rate. Past performance is not a reliable indicator of current and future results. Guide to the Markets - UK. Data as of 30 June 2018.
Nominal
Real
Implied inflation expectations
Fixed income
80
-2
0
2
4
6
8
10
'91 '92 '93 '94 '95 '96 '97 '98 '99 '00 '01 '02 '03 '04 '05 '06 '07 '08 '09 '10 '11 '12 '13 '14 '15 '16 '17 '18

81
GTM – UK |Europe and UK investment-grade bonds
Euro and UK investment-grade spreads Euro investment -grade leverage measures% yield, option-adjusted spread over local government bond yield x, leverage (LHS); x, interest coverage ratio (RHS)
Source: (Left) Bloomberg Barclays, Thomson Reuters Datastream, J.P. Morgan Asset Management. Indices are Euro inv. grade: Bloomberg Barclays Euro Agg. –Corporates; UK inv. grade: Bloomberg Barclays Sterling Agg. – Corporates. (Right) J.P. Morgan Securities, J.P. Morgan Asset Management. Net leverage is net debt to earnings before interest, tax, depreciation and amortisation (EBITDA). Interest coverage ratio is EBITDA over interest expense. Past performance is not a reliable indicator of current and future results. Guide to the Markets - UK. Data as of 30 June 2018.
Net leverage Interest coverage
Euro
UKFixed income
81
7
8
9
10
11
12
13
14
1.5
2.0
2.5
3.0
3.5
4.0
'01 '03 '05 '07 '09 '11 '13 '15 '170
1
2
3
4
5
6
7
'00 '02 '04 '06 '08 '10 '12 '14 '16 '18

82
GTM – UK |
0
5
10
15
20
25
0
2
4
6
8
10
12
14
16
18
20
'00 '02 '04 '06 '08 '10 '12 '14 '16 '183.0
3.5
4.0
4.5
5.0
5.5
6.0
6.5
7.0
'05 '06 '07 '08 '09 '10 '11 '12 '13 '14 '15 '16 '17 '18
Europe high yield bonds
European high yield spread and defaults European hig h yield leverage measures%, defaults (LHS); % yield, option-adjusted spread (RHS) x, leverage and interest coverage ratio
Source: (Left) BofA/Merrill Lynch, Thomson Reuters Datastream, J.P. Morgan Asset Management. Spread to worst is BofA/Merrill Lynch Euro Non-Financial High Yield Constrained. Default rates are reported by JPMAM GFICC Quantitative Research Group. Defaults are defined as a bond rated as Ca or lower. The calculation universe is based on par value percentage of the BofA ML Global High Yield Index (HW00) that is covered by Moody’s and filtered for EUR Developed Markets Ex-Financial. *2018 default data is for the last 12 months. (Right) J.P. Morgan Securities Research, J.P. Morgan Asset Management. Net leverage is net debt to earnings before interest, tax, depreciation and amortisation (EBITDA). Interest coverage ratio is EBITDA over interest expense. Past performance is not a reliable indicator of current and future results. Guide to the Markets - UK. Data as of 30 June 2018.
34%
Fixed income
82
Interest coverage ratio
Net leverage
SpreadDefaults40
*

83
GTM – UK |
2
3
4
5
6
7
8
9
10
'08 '09 '10 '11 '12 '13 '14 '15 '16 '17 '18
Emerging markets bonds
Real 10-year government bond yields% yield, local currency
Source: (Left) Bloomberg, J.P. Morgan Asset Management. Real yield is calculated by using nominal yield less current CPI for the respective countries. (Right) J.P. Morgan DataQuery, J.P. Morgan Asset Management. EM sovereign local currency is the J.P. Morgan GBI-EM; EM sovereigns USD is the J.P. Morgan EMBIG; EM corporate USD is the J.P. Morgan CEMBI. Past performance is not a reliable indicator of current and future results. Guide to the Markets - UK. Data as of 30 June 2018.
Fixed income
83
Developed markets
Emerging markets
Corporate and sovereign EMD spreads % spread over 10-year US Treasury
Average since 2008
Latest
EM sovereigns local 4.2% 4.6%
EM sovereigns USD 3.6% 3.9%
EM corporates USD 3.6% 3.3%
-3
-2
-1
0
1
2
3
4
5
6
7
8
9

84
GTM – UK |
1.2 1.2 1.5
3.93.6 3.9
0
2
4
6
8
10
12
14
16
18
20 18.9% Infl Linked
18.9%
7.1% EM Debt
1.2%
40.1% US HY 17.5%
10.4% Euro HY
6.1%
2.5% US HY 0.1%
7.3% US HY 1.0%
12.2% US HY 8.0%
14.6% UK Gilts 14.6%
6.7% US Treas.
0.8%
31.4% EM Debt 10.2%
4.9% UK IG 4.9%
1.4% US Treas.
-1.1%
6.4% US Treas.
0.1%
11.3% EM Debt
7.1%
14.1% US IG 7.5%
5.1% US IG -0.7%
27.5% Euro HY 10.1%
2.3% Infl Linked
2.3%
0.2% UK Gilts
0.2%
5.2% US IG -1.0%
9.8% US IG 5.7%
12.5% Portfolio
9.3%
2.7% Portfolio
-0.2%
26.6% US IG 6.1%
2.0% UK Gilts
2.0%
-0.4% Portfolio
-1.7%
2.7% Portfolio
-0.7%
9.7% Euro HY
7.7%
12.5% UK IG 12.5%
0.9% US HY -4.6%
25.2% Infl Linked
25.2%
0.0% Portfolio
4.9%
-0.9% US IG -3.3%
2.5% EM Debt
-3.5%
9.0% Portfolio
6.6%
12.1% EM Debt
5.5%
0.7% UK IG 0.7%
23.1% Portfolio
10.7%
-0.1% EM Debt
9.3%
-1.0% Infl Linked
-1.0%
0.1% UK Gilts
0.1%
8.2% Infl Linked
8.2%
11.6% US Treas.
5.1%
0.5% UK Gilts
0.5%
20.5% US Treas.
1.0%
-1.8% US HY 7.5%
-1.9% UK IG -1.9%
-0.0% Euro HY -0.9%
7.4% US Treas.
3.3%
8.9% US HY 2.5%
-1.2% Infl Linked
-1.2%
12.3% UK IG 12.3%
-2.8% US IG 6.4%
-1.9% Euro HY -1.5%
-0.3% UK IG -0.3%
6.5% UK IG 6.5%
-1.6% Euro HY
5.5%
-4.6% Euro HY
0.5%
10.7% UK Gilts 10.7%
-6.5% US Treas.
2.3%
-2.9% EM Debt
-5.2%
-1.1% Infl Linked
-1.1%
6.0% UK Gilts
6.0%
Global fixed income spreads and returns
Fixed income spreads Fixed income returns%, option-adjusted spread
Source: (All charts) Barclays, BofA/Merrill Lynch, J.P. Morgan Economic Research, Thomson Reuters Datastream, J.P. Morgan Asset Management. US HY: BofA/Merrill Lynch US High Yield Constrained; EM Debt: J.P. Morgan EMBI Global; Euro HY: BofA/Merrill Lynch Euro Non-Financial High Yield Constrained; US IG: Bloomberg Barclays US Agg. Corporate – Investment Grade; UK IG: Bloomberg Barclays Sterling Agg. Non-Gilts – Corporate; UK Gilts: Bloomberg Barclays Sterling Gilts; US Treasuries: Bloomberg Barclays US Agg. Gov. – Treasury; Infl Linked: BofA Merrill Lynch UK Gilt Inflation-Linked Government. Hypothetical portfolio (for illustrative purposes only and should not be taken as a recommendation): 20% UK Gilts; 15% US Treasuries; 10% Linkers; 15% US IG; 10% UK IG; 10% US HY; 5% Euro HY; 15% EM Debt. Annualised return covers period 2008 to 2017. Returns are unhedged in sterling and local currencies. Past performance is not a reliable indicator of current and future results. Guide to the Markets - UK. Data as of 30 June 2018.
|
£:
LCL:
Fixed income
84
2016201510-yr ann.2014 2017 YTD
Range since 1998
Average
Current
Euro IG US IG UK IG Euro HY US HY EMD (USD Sov.)
Q218
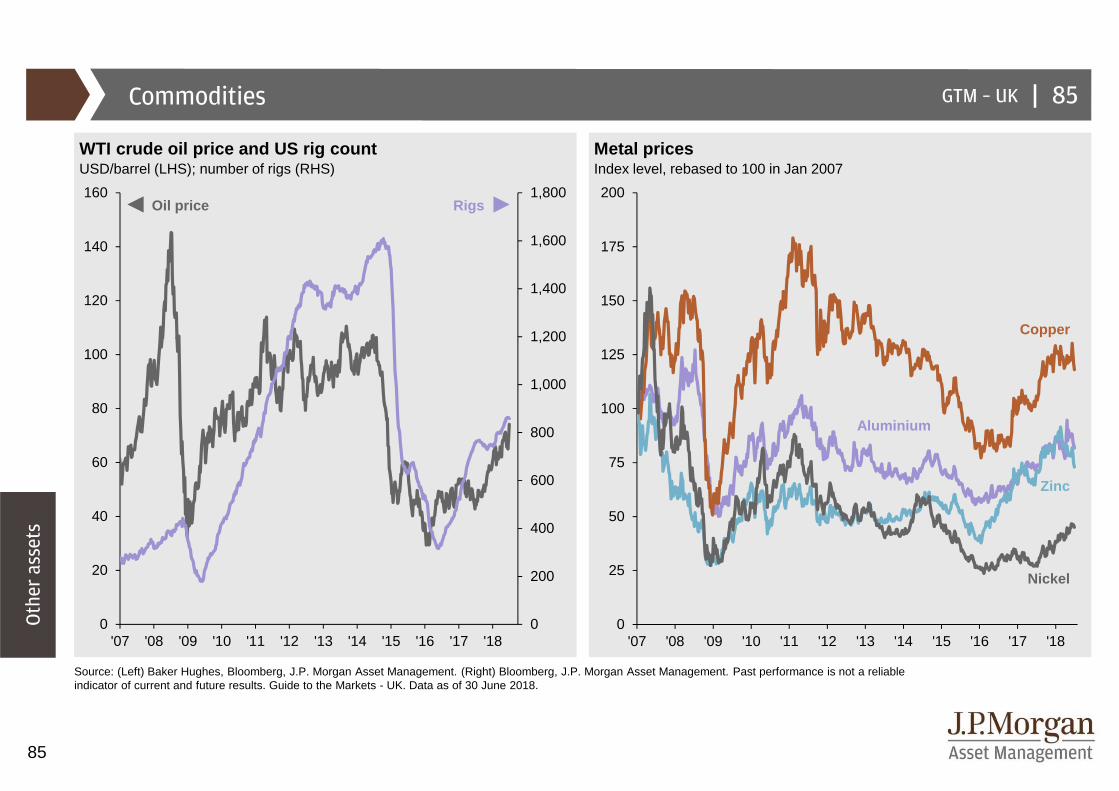
85
GTM – UK |
0
200
400
600
800
1,000
1,200
1,400
1,600
1,800
0
20
40
60
80
100
120
140
160
'07 '08 '09 '10 '11 '12 '13 '14 '15 '16 '17 '180
25
50
75
100
125
150
175
200
'07 '08 '09 '10 '11 '12 '13 '14 '15 '16 '17 '18
Commodities
Metal pricesIndex level, rebased to 100 in Jan 2007
Source: (Left) Baker Hughes, Bloomberg, J.P. Morgan Asset Management. (Right) Bloomberg, J.P. Morgan Asset Management. Past performance is not a reliable indicator of current and future results. Guide to the Markets - UK. Data as of 30 June 2018.
Other assets
85
WTI crude oil price and US rig countUSD/barrel (LHS); number of rigs (RHS)
RigsOil price
Nickel
Copper
Zinc
Aluminium

86
GTM – UK |
0
500
1,000
1,500
2,000
2,500
'78 '82 '86 '90 '94 '98 '02 '06 '10 '14 '18
Gold
Gold vs. real US 10-year Treasury yields Gold price$ per Troy ounce (LHS), % inverted (RHS) $ per Troy ounce
Source: (All charts) Thomson Reuters Datastream, J.P. Morgan Asset Management. Inflation-adjusted gold price is the historic gold price in today’s money, converted using the US Consumer Price Index. The 2001 low is defined as April 2001, and the 2011 peak is defined as August 2011. Past performance is not a reliable indicator of current and future results. Guide to the Markets - UK. Data as of 30 June 2018.
Other assets
Real yields (inverted)
Gold
86
Change since 2001 low
Change since 2011 peak
YTD change
Gold +374.2% -31.5% -4.0%
Inflation-adjusted gold price
Gold price
-1.0
-0.5
0.0
0.5
1.01,000
1,300
1,600
1,900
'12 '13 '14 '15 '16 '17 '18
30 June 2018: $1,251

87
GTM – UK |
1.3
-1.1
0.5 0.4
2.9
-3.8
1.0
-0.7
-4
-2
0
2
4
Stock-bond correlation and downside protection
Rolling six-month stock and bond correlations Hedge fund returns in different market environmentsOf total return on US equities (S&P 500) and US Treasuries (10-yr) %, average total return in up and down months, 2001-2017
Source: (Left) Thomson Reuters Datastream, J.P. Morgan Asset Management. (Right) Barclays, Hedge Fund Research, Standard & Poor’s, Thomson Reuters Datastream, J.P. Morgan Asset Management. *HFRI FW is Hedge Fund Research Index Fund Weighted. **US bonds is the Bloomberg Barclays US Aggregate Bond Index. Downside protection refers to attempting to minimise the impact of any falls in the underlying investments. Past performance is not a reliable indicator of current and future results. Guide to the Markets - UK. Data as of 30 June 2018.
HFRI FW*US bonds**
HFRI FW*
S&P 500
S&P 500 up S&P 500 down Bonds downBonds up
Other assets
87
Stock and bond returns moving in the same direction
-1.0
-0.5
0.0
0.5
1.0
'92 '97 '02 '07 '12 '17
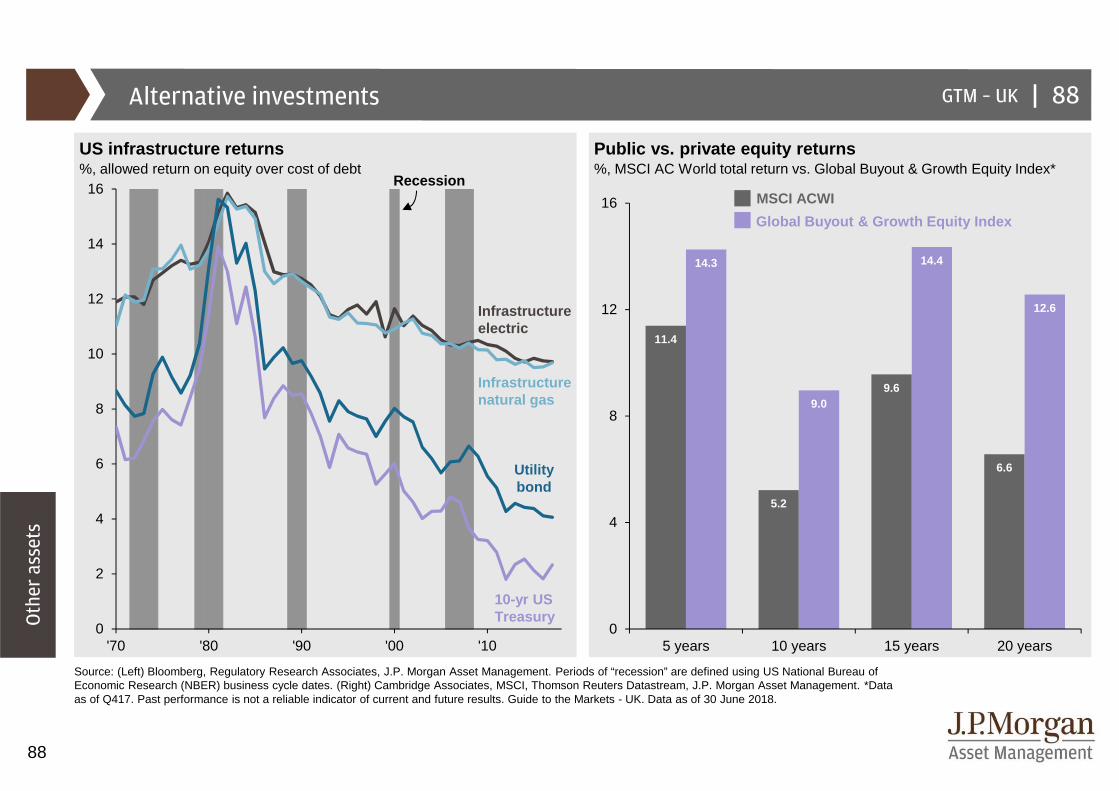
88
GTM – UK |
0
2
4
6
8
10
12
14
16
'70 '80 '90 '00 '10
Alternative investments
US infrastructure returns Public vs. private equity returns%, allowed return on equity over cost of debt %, MSCI AC World total return vs. Global Buyout & Growth Equity Index*
Source: (Left) Bloomberg, Regulatory Research Associates, J.P. Morgan Asset Management. Periods of “recession” are defined using US National Bureau of Economic Research (NBER) business cycle dates. (Right) Cambridge Associates, MSCI, Thomson Reuters Datastream, J.P. Morgan Asset Management. *Data as of Q417. Past performance is not a reliable indicator of current and future results. Guide to the Markets - UK. Data as of 30 June 2018.
Recession
Infrastructure electric
Infrastructure natural gas
10-yr US Treasury
Utility bond
Global Buyout & Growth Equity Index
MSCI ACWI
Other assets
88
11.4
5.2
9.6
6.6
14.3
9.0
14.4
12.6
0
4
8
12
16
5 years 10 years 15 years 20 years
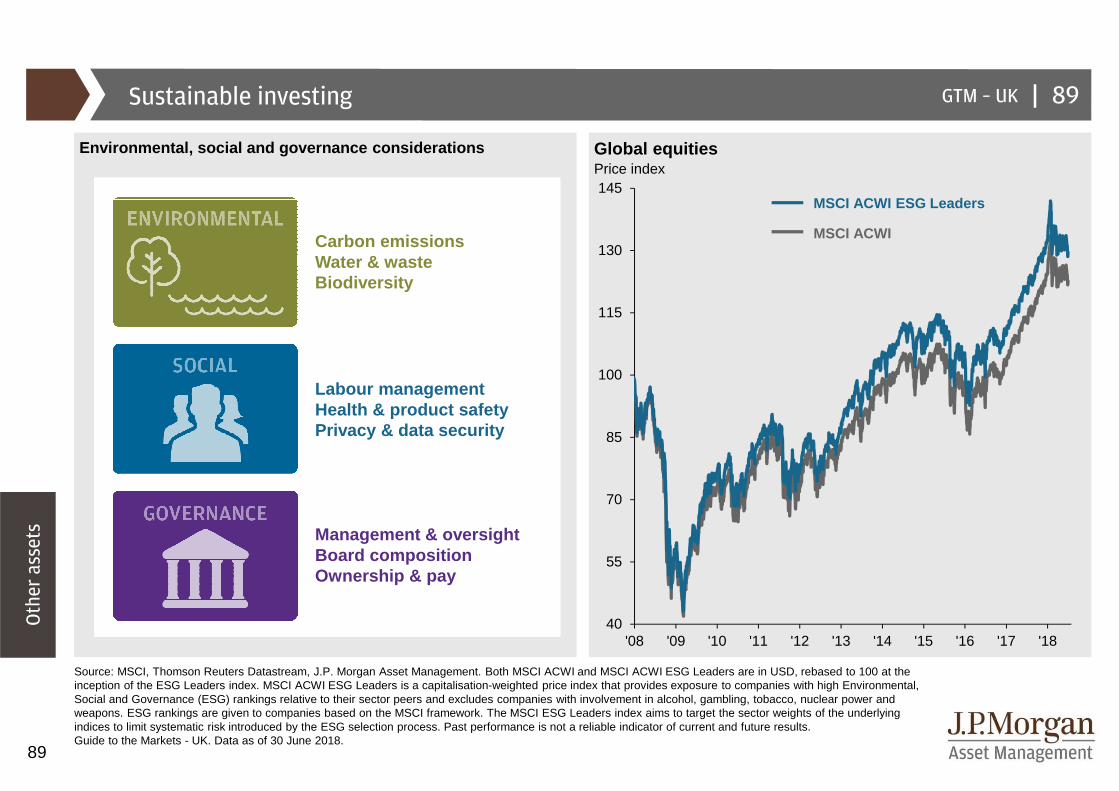
89
GTM – UK |Sustainable investing
Environmental, social and governance considerations Global equitiesPrice index
Source: MSCI, Thomson Reuters Datastream, J.P. Morgan Asset Management. Both MSCI ACWI and MSCI ACWI ESG Leaders are in USD, rebased to 100 at the inception of the ESG Leaders index. MSCI ACWI ESG Leaders is a capitalisation-weighted price index that provides exposure to companies with high Environmental, Social and Governance (ESG) rankings relative to their sector peers and excludes companies with involvement in alcohol, gambling, tobacco, nuclear power and weapons. ESG rankings are given to companies based on the MSCI framework. The MSCI ESG Leaders index aims to target the sector weights of the underlying indices to limit systematic risk introduced by the ESG selection process. Past performance is not a reliable indicator of current and future results.Guide to the Markets - UK. Data as of 30 June 2018.
Other assets
89
MSCI ACWI
MSCI ACWI ESG Leaders
Carbon emissionsWater & wasteBiodiversity
Labour managementHealth & product safetyPrivacy & data security
Management & oversightBoard compositionOwnership & pay
40
55
70
85
100
115
130
145
'08 '09 '10 '11 '12 '13 '14 '15 '16 '17 '18

90
GTM – UK |
-4 -2 0 2 4 6 8 10 12 14
Asset markets in coming years
Past and expected returns%, annualised return
Source: 2018 Long-Term Capital Market Assumptions, November 2017, J.P. Morgan Multi-Asset Solutions, J.P. Morgan Asset Management. Returns are in GBP. The projections in the chart above are based on J.P. Morgan Asset Management’s proprietary long-term capital market assumptions (10-15 years) for returns of major asset classes. The resulting projections include only the benchmark return associated with the portfolio and do not include alpha from the underlying product strategies within each asset class. The assumptions are presented for illustrative purposes only. Past performance is not a reliable indicator of current and future results.Guide to the Markets - UK. Data as of 30 June 2018.
Other assets
Expected return in coming 10-15 years
Return over past 10 years
90
EM equity
Private equity
UK large cap
Eurozone large cap
EM local currency debt
UK core real estate
US large cap
Global infrastructure
Diversified hedge funds hedged
Commodities
UK investment-grade corporates
UK cash
UK gilts
World government bonds
UK government inflation-linked bonds
Japan equity

91
GTM – UK |
67
24
76
35
92
50
0
20
40
60
80
100
80 years 90 years
Life expectancy
Probability of reaching ages 80 and 90% probability, persons aged 65, by gender and combined couple
Source: ONS 2014-2016 Life Tables, J.P. Morgan Asset Management. Past performance is not a reliable indicator of current and future results.Guide to the Markets - UK. Data as of 30 June 2018.
Men
Women
Couple – at least one lives to specified age
Investing
principles
91
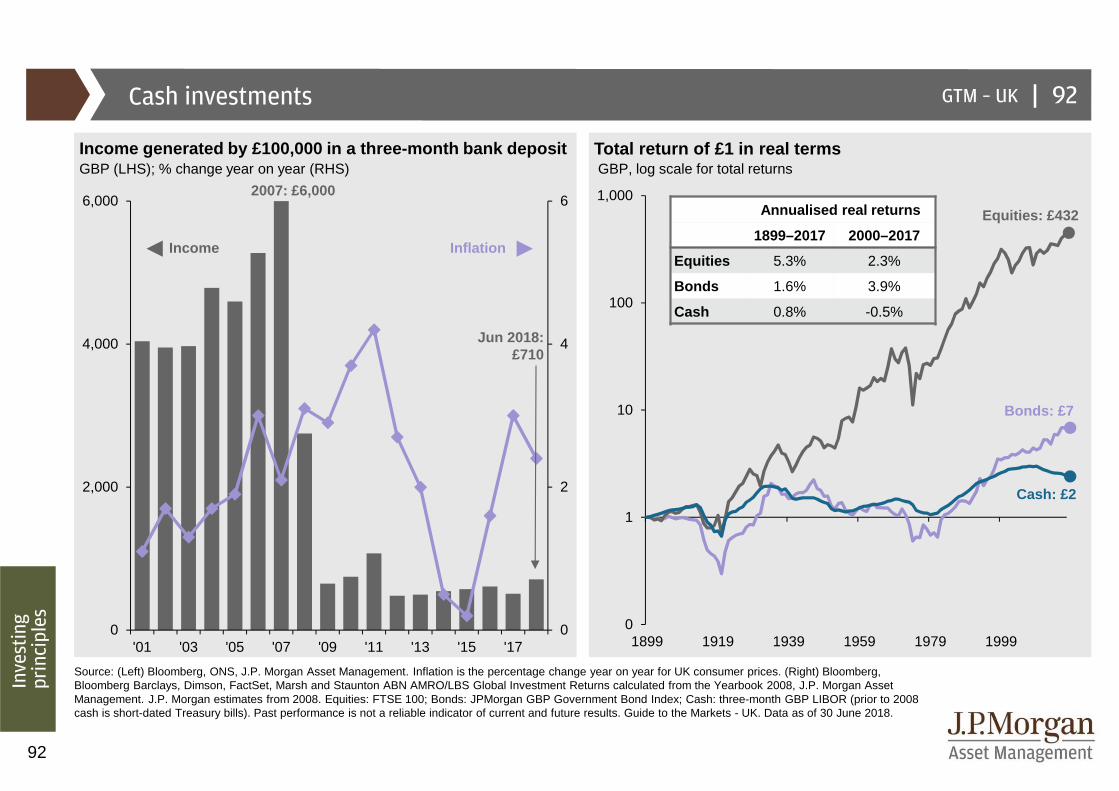
92
GTM – UK |
0
1
10
100
1,000
1899 1919 1939 1959 1979 19990
2
4
6
0
2,000
4,000
6,000
'01 '03 '05 '07 '09 '11 '13 '15 '17
Cash investments
Income generated by £100,000 in a three-month bank deposit Total return of £1 in real termsGBP (LHS); % change year on year (RHS) GBP, log scale for total returns
Source: (Left) Bloomberg, ONS, J.P. Morgan Asset Management. Inflation is the percentage change year on year for UK consumer prices. (Right) Bloomberg, Bloomberg Barclays, Dimson, FactSet, Marsh and Staunton ABN AMRO/LBS Global Investment Returns calculated from the Yearbook 2008, J.P. Morgan Asset Management. J.P. Morgan estimates from 2008. Equities: FTSE 100; Bonds: JPMorgan GBP Government Bond Index; Cash: three-month GBP LIBOR (prior to 2008 cash is short-dated Treasury bills). Past performance is not a reliable indicator of current and future results. Guide to the Markets - UK. Data as of 30 June 2018.
Jun 2018: £710
2007: £6,000Annualised real returns
1899–2017 2000–2017
Equities 5.3% 2.3%
Bonds 1.6% 3.9%
Cash 0.8% -0.5%
Equities: £432
Bonds: £7
Cash: £2
Investing
principles
92
Income Inflation

93
GTM – UK |
0
20,000
40,000
60,000
80,000
100,000
'86 '88 '90 '92 '94 '96 '98 '00 '02 '04 '06 '08 '10 '12 '14 '16 '18
0
100,000
200,000
300,000
400,000
500,000
600,000
700,000
25 30 35 40 45 50 55 60 65
The power of compounding
£5,000 invested annually with 5% growth per year £5, 000 investment with/without income reinvestedGBP GBP, FTSE All-Share returns
Source: (Left) J.P. Morgan Asset Management. For illustrative purposes only, assumes all income reinvested, actual investments may incur higher or lower growth rates and charges. (Right) Bloomberg, FTSE, J.P. Morgan Asset Management. Based on FTSE All-Share index and assumes no charges. Past performance is not a reliable indicator of current and future results. Guide to the Markets - UK. Data as of 30 June 2018.
Investing
principles
Starting at age 35
Starting at age 25
Without dividends reinvested
With dividends reinvested
Age
£353,803
£30,766
£639,199
£101,666
93

94
GTM – UK |
22
46
30
-14
15 15
23
-10
19
12
20
11
21
-8
-15
-25
17
9
18
13
2
-33
25
11
-7
8
17
-2 -3
129
-1
-9
-37
-9
-14
-22
-12
-18
-4
-18
-4-6
-10
-25
-11-12
-30 -31
-17
-6 -7
-10-13
-43
-23
-17-19
-12 -12 -10
-15
-12
-4
-11
-50
-40
-30
-20
-10
0
10
20
30
40
'86 '88 '90 '92 '94 '96 '98 '00 '02 '04 '06 '08 '10 '12 '14 '16 '18
Annual returns and intra-year declines
FTSE All-Share Index intra-year declines vs. calend ar-year returnsDespite average intra-year drops of 15.3% (median 12.2%), annual returns are positive in 23 of 32 years%
Source: FTSE, Thomson Reuters Datastream, J.P Morgan Asset Management. Returns are based on local price only and do not include dividends. Intra-year decline refers to the largest market fall from peak to trough within a short time period during the calendar year. Returns shown are calendar years from 1986 to 2017. Current year is year to date. Past performance is not a reliable indicator of current and future results. Guide to the Markets - UK. Data as of 30 June 2018.
Intra-year decline
Calendar-year return
Investing
principles
94
YTD

95
GTM – UK |
6.3%
2.8%
-1.1%
-4.1%
0
5,000
10,000
15,000
20,000
25,000
30,000
35,000
40,000
Fully invested Missed 10 best days Missed 30 best days Missed 50 best days
Impact of being out of the market
Returns of FTSE All-ShareGBP, value of a £10,000 investment between 1998 and 2017 with annualised return (%)
Source: Bloomberg, FTSE, J.P. Morgan Asset Management. Investment outcomes based on price returns. For illustrative purposes only. Returns calculated daily over the time period assuming no return on each of the specified number of best days. Past performance is not a reliable indicator of current and future results. Guide to the Markets - UK. Data as of 30 June 2018.
Investing
principles
Initial investment
95
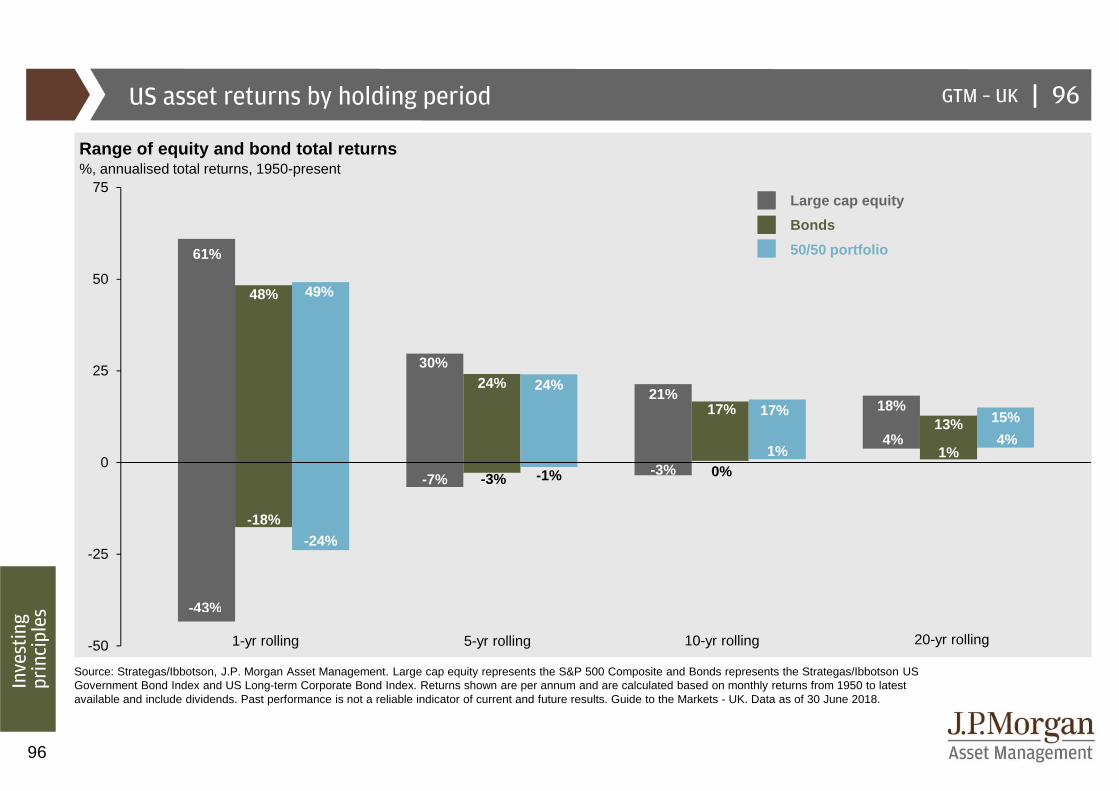
96
GTM – UK |US asset returns by holding period
Range of equity and bond total returns%, annualised total returns, 1950-present
Source: Strategas/Ibbotson, J.P. Morgan Asset Management. Large cap equity represents the S&P 500 Composite and Bonds represents the Strategas/Ibbotson US Government Bond Index and US Long-term Corporate Bond Index. Returns shown are per annum and are calculated based on monthly returns from 1950 to latest available and include dividends. Past performance is not a reliable indicator of current and future results. Guide to the Markets - UK. Data as of 30 June 2018.
Investing
principles
Large cap equity
Bonds
50/50 portfolio
96
1-yr rolling 5-yr rolling 10-yr rolling 20-yr rolling
48% 49%
30%24% 24%
21%17% 17% 18%
13% 15%
-18%-24%
-7% -3% -1% -3% 0%1%
4%1%
4%
-50
-25
0
25
50
75
61%
-43%
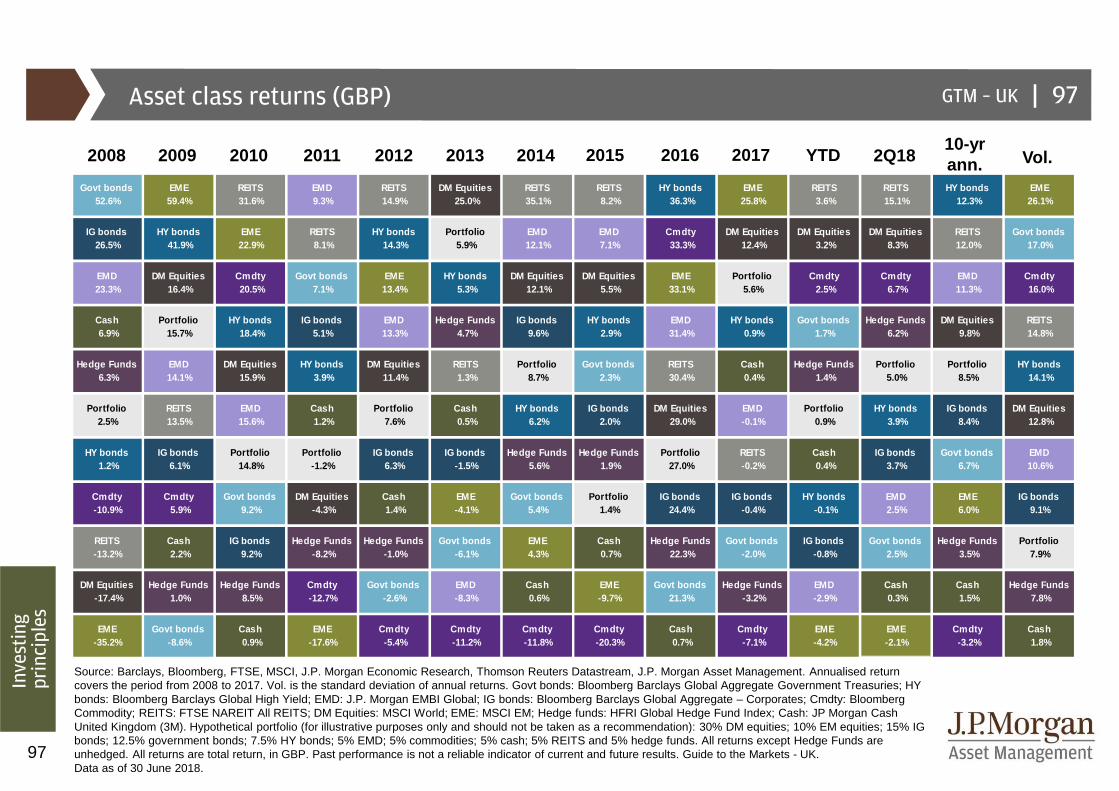
97
Govt bonds 52.6%
EME 59.4%
REITS 31.6%
EMD 9.3%
REITS 14.9%
DM Equities 25.0%
REITS 35.1%
REITS 8.2%
HY bonds 36.3%
EME 25.8%
REITS 3.6%
REITS 15.1%
HY bonds 12.3%
EME 26.1%
IG bonds 26.5%
HY bonds 41.9%
EME 22.9%
REITS 8.1%
HY bonds 14.3%
Portfolio 5.9%
EMD 12.1%
EMD 7.1%
Cmdty 33.3%
DM Equities 12.4%
DM Equities 3.2%
DM Equities 8.3%
REITS 12.0%
Govt bonds 17.0%
EMD 23.3%
DM Equities 16.4%
Cmdty 20.5%
Govt bonds 7.1%
EME 13.4%
HY bonds 5.3%
DM Equities 12.1%
DM Equities 5.5%
EME 33.1%
Portfolio 5.6%
Cmdty 2.5%
Cmdty 6.7%
EMD 11.3%
Cmdty 16.0%
Cash 6.9%
Portfolio 15.7%
HY bonds 18.4%
IG bonds 5.1%
EMD 13.3%
Hedge Funds 4.7%
IG bonds 9.6%
HY bonds 2.9%
EMD 31.4%
HY bonds 0.9%
Govt bonds 1.7%
Hedge Funds 6.2%
DM Equities 9.8%
REITS 14.8%
Hedge Funds 6.3%
EMD 14.1%
DM Equities 15.9%
HY bonds 3.9%
DM Equities 11.4%
REITS 1.3%
Portfolio 8.7%
Govt bonds 2.3%
REITS 30.4%
Cash 0.4%
Hedge Funds 1.4%
Portfolio 5.0%
Portfolio 8.5%
HY bonds 14.1%
Portfolio 2.5%
REITS 13.5%
EMD 15.6%
Cash 1.2%
Portfolio 7.6%
Cash 0.5%
HY bonds 6.2%
IG bonds 2.0%
DM Equities 29.0%
EMD -0.1%
Portfolio 0.9%
HY bonds 3.9%
IG bonds 8.4%
DM Equities 12.8%
HY bonds 1.2%
IG bonds 6.1%
Portfolio 14.8%
Portfolio -1.2%
IG bonds 6.3%
IG bonds -1.5%
Hedge Funds 5.6%
Hedge Funds 1.9%
Portfolio 27.0%
REITS -0.2%
Cash 0.4%
IG bonds 3.7%
Govt bonds 6.7%
EMD 10.6%
Cmdty -10.9%
Cmdty 5.9%
Govt bonds 9.2%
DM Equities -4.3%
Cash 1.4%
EME -4.1%
Govt bonds 5.4%
Portfolio 1.4%
IG bonds 24.4%
IG bonds -0.4%
HY bonds -0.1%
EMD 2.5%
EME 6.0%
IG bonds 9.1%
REITS -13.2%
Cash 2.2%
IG bonds 9.2%
Hedge Funds -8.2%
Hedge Funds -1.0%
Govt bonds -6.1%
EME 4.3%
Cash 0.7%
Hedge Funds 22.3%
Govt bonds -2.0%
IG bonds -0.8%
Govt bonds 2.5%
Hedge Funds 3.5%
Portfolio 7.9%
DM Equities -17.4%
Hedge Funds 1.0%
Hedge Funds 8.5%
Cmdty -12.7%
Govt bonds -2.6%
EMD -8.3%
Cash 0.6%
EME -9.7%
Govt bonds 21.3%
Hedge Funds -3.2%
EMD -2.9%
Cash 0.3%
Cash 1.5%
Hedge Funds 7.8%
EME -35.2%
Govt bonds -8.6%
Cash 0.9%
EME -17.6%
Cmdty -5.4%
Cmdty -11.2%
Cmdty -11.8%
Cmdty -20.3%
Cash 0.7%
Cmdty -7.1%
EME -4.2%
EME -2.1%
Cmdty -3.2%
Cash 1.8%
Asset class returns (GBP)
Source: Barclays, Bloomberg, FTSE, MSCI, J.P. Morgan Economic Research, Thomson Reuters Datastream, J.P. Morgan Asset Management. Annualised return covers the period from 2008 to 2017. Vol. is the standard deviation of annual returns. Govt bonds: Bloomberg Barclays Global Aggregate Government Treasuries; HY bonds: Bloomberg Barclays Global High Yield; EMD: J.P. Morgan EMBI Global; IG bonds: Bloomberg Barclays Global Aggregate – Corporates; Cmdty: Bloomberg Commodity; REITS: FTSE NAREIT All REITS; DM Equities: MSCI World; EME: MSCI EM; Hedge funds: HFRI Global Hedge Fund Index; Cash: JP Morgan Cash United Kingdom (3M). Hypothetical portfolio (for illustrative purposes only and should not be taken as a recommendation): 30% DM equities; 10% EM equities; 15% IG bonds; 12.5% government bonds; 7.5% HY bonds; 5% EMD; 5% commodities; 5% cash; 5% REITS and 5% hedge funds. All returns except Hedge Funds are unhedged. All returns are total return, in GBP. Past performance is not a reliable indicator of current and future results. Guide to the Markets - UK. Data as of 30 June 2018.
GTM – UK |
Investing
principles
97
2010 20122008 2011 20162009 2013 2014 201510-yr ann. Vol.YTD2017 2Q18

J.P. Morgan Asset Management: Index definitions
All indexes are unmanaged and an individual cannot invest directly in an index. Index returns do not include fees or expenses. The S&P 500 Index is widely regarded as the best single gauge of the U.S. equities market. This world-renowned index includes a representative sample of 500 leading companies in leading industries of the U.S. economy. Although the S&P 500 Index focuses on the large-cap segment of the market, with approximately 75% coverage of U.S. equities, it is also an ideal proxy for the total market. An investor cannot invest directly in an index. The S&P 400 Mid Cap Index is representative of 400 stocks in the mid-range sector of the domestic stock market, representing all major industries.The Russell 3000 Index® measures the performance of the 3,000 largest U.S. companies based on total market capitalization. The Russell 1000 Index ® measures the performance of the 1,000 largest companies in the Russell 3000. The Russell 1000 Growth Index ® measures the performance of those Russell 1000 companies with higher price-to-book ratios and higher forecasted growth values. The Russell 1000 Value Index ® measures the performance of those Russell 1000 companies with lower price-to-book ratios and lower forecasted growth values. The Russell Midcap Index ® measures the performance of the 800 smallest companies in the Russell 1000 Index. The Russell Midcap Growth Index ® measures the performance of those Russell Midcap companies with higher price-to-book ratios and higher forecasted growth values. The stocks are also members of the Russell 1000 Growth index. The Russell Midcap Value Index ® measures the performance of those Russell Midcap companies with lower price-to-book ratios and lower forecasted growth values. The stocks are also members of the Russell 1000 Value index. The Russell 2000 Index ® measures the performance of the 2,000 smallest companies in the Russell 3000 Index.The Russell 2000 Growth Index ® measures the performance of those Russell 2000 companies with higher price-to-book ratios and higher forecasted growth values. The Russell 2000 Value Index ® measures the performance of those Russell 2000 companies with lower price-to-book ratios and lower forecasted growth values. The Russell Top 200 Index ® measures the performance of the largest cap segment of the U.S. equity universe. It includes approximately 200 of the largest securities based on a combination of their market cap and current index membership and represents approximately 68% of the U.S. market. The MSCI® EAFE (Europe, Australia, Far East) Net Index is recognized as the pre-eminent benchmark in the United States to measure international equity performance. It comprises 21 MSCI country indexes, representing the developed markets outside of North America.The MSCI Emerging Markets IndexSM is a free float-adjusted market capitalization index that is designed to measure equity market performance in the global emerging markets. As of June 2007, the MSCI Emerging Markets Index consisted of the following 25 emerging market country indices: Argentina, Brazil, Chile, China, Colombia, Czech Republic, Egypt, Hungary, India, Indonesia, Israel, Jordan, Korea, Malaysia, Mexico, Morocco, Pakistan, Peru, Philippines, Poland, Russia, South Africa, Taiwan, Thailand, and Turkey.The MSCI ACWI (All Country World Index) Index is a free float-adjusted market capitalization weighted index that is designed to measure the equity market performance of developed and emerging markets. As of June 2009 the MSCI ACWIconsisted of 45 country indices comprising 23 developed and 22 emerging market country indices. The MSCI Small Cap IndicesSM target 40% of the eligible Small Cap universe within each industry group, within each country. MSCI defines the Small Cap universe as all listed securities that have a market capitalization in the range of USD200-1,500 million.The MSCI All Country Asia Pacific ex-Japan Index is a free float-adjusted market capitalization weighted index that is designed to measure the equity market performance of the developed and emerging markets in the Pacific region. The MSCI All Country Asia Pacific ex-Japan Index consists of the following 11 developed and emerging market countries: Australia, China, Hong Kong, Indonesia, Japan, Korea, Malaysia, New Zealand, Philippines, Singapore, Taiwan, and Thailand.
The MSCI China Index is an unmanaged index considered representative of stocks of China.The MSCI KOKUSAI Index is a free float-adjusted market capitalization index that is designed to measure the equity market performance of developed markets excluding Japan. The MSCI KOKUSAI Index consists of the following 23 developed market country indices: Australia, Austria, Belgium, Canada, Denmark, Finland, France, Germany, Greece, Hong Kong, Ireland, Israel, Italy, Netherlands, New Zealand, Norway, Portugal, Singapore, Spain, Sweden, Switzerland, the United Kingdom, and the United States*.The Nikkei 225 Index is a price-weighted average of the 225 top-rated Japanese companies listed in the first section of the Tokyo Stock Exchange.The Tokyo Price Index (TOPIX) is a capitalization-weighted index lists all firms that are considered to be under the 'first section' on the TSE, which groups all of the large firms on the exchange into one pool. The second section groups all of the remaining smaller firms.The FTSE 100 Index is an index of the 100 largest companies (by market capitalization) in the United Kingdom.The FTSE All Share Index is an index of the 630 largest companies (by market capitalization) in the United Kingdom.The MSCI Value and Growth IndicesSM cover the full range of developed, emerging and All Country MSCI Equity indexes. As of the close of May 30, 2003, MSCI implemented an enhanced methodology for the MSCI Global Value and Growth Indices, adopting a two dimensional framework for style segmentation in which value and growth securities are categorized using different attributes - three for value and five for growth including forward-looking variables. The objective of the indexdesign is to divide constituents of an underlying MSCI Standard Country Index into a value index and a growth index, each targeting 50% of the free float adjusted market capitalization of the underlying country index. Country Value/Growth indices are then aggregated into regional Value/Growth indices. Prior to May 30, 2003, the indices used Price/Book Value (P/BV) ratios to divide the standard MSCI country indices into value and growth indices. All securities were classified as either "value" securities (low P/BV securities) or "growth" securities (high P/BV securities), relative to each MSCI country index.The following MSCI Total Return IndicesSM are calculated with gross dividends:This series approximates the maximum possible dividend reinvestment. The amount reinvested is the dividend distributed to individuals resident in the country of the company, but does not include tax credits.The MSCI Europe IndexSM is a free float-adjusted market capitalization index that is designed to measure developed market equity performance in Europe. As of June 2007, the MSCI Europe Index consisted of the following 16 developed market country indices: Austria, Belgium, Denmark, Finland, France, Germany, Greece, Ireland, Italy, the Netherlands, Norway, Portugal, Spain, Sweden, Switzerland and the United Kingdom. The MSCI Pacific IndexSM is a free float-adjusted market capitalization index that is designed to measure equity market performance in the Pacific region. As of June 2007, the MSCI Pacific Index consisted of the following 5 Developed Market countries: Australia, Hong Kong, Japan, New Zealand, and Singapore. Credit Suisse/Tremont Hedge Fund Index is compiled by Credit Suisse Tremont Index, LLC. It is an asset-weighted hedge fund index and includes only funds, as opposed to separate accounts. The Index uses the Credit Suisse/Tremont database, which tracks over 4500 funds, and consists only of funds with a minimum of US$50 million under management, a 12-month track record, and audited financial statements. It is calculated and rebalanced on a monthly basis, and shown net of all performance fees and expenses. It is the exclusive property of Credit Suisse Tremont Index, LLC. The NCREIF Property Index is a quarterly time series composite total rate of return measure of investment performance of a very large pool of individual commercial real estate properties acquired in the private market for investment purposes only. All properties in the NPI have been acquired, at least in part, on behalf of tax-exempt institutional investors - the great majority being pension funds. As such, all properties are held in a fiduciary environment. The NAREIT EQUITY REIT Index is designed to provide the most comprehensive assessment of overall industry performance, and includes all tax-qualified real estate investment trusts (REITs) that are listed on the NYSE, the American Stock Exchange or the NASDAQ National Market List.
J.P. Morgan Asset Management: Index definitions
The Dow Jones Industrial Average measures the stock performance of 30 leading blue-chip U.S. companiesThe Dow Jones-UBS Commodity Index is composed of futures contracts on physical commodities and represents twenty two separate commodities traded on U.S. exchanges, with the exception of aluminum, nickel, and zinc.West Texas Intermediate (WTI) is underlying commodity in the New York Mercantile Exchange's oil futures contracts. The S&P GSCI Index is a composite index of commodity sector returns representing an unleveraged, long-only investment in commodity futures that is broadly diversified across the spectrum of commodities. The returns are calculated on a fully collateralized basis with full reinvestment. The Bloomberg Barclays U.S. Aggregate Index represents securities that are SEC-registered, taxable, and dollar denominated. The index covers the U.S. investment grade fixed rate bond market, with index components for government and corporate securities, mortgage pass-through securities, and asset-backed securities. This U.S. Treasury Index is a component of the U.S. Government index. The Bloomberg Barclays High Yield Index covers the universe of fixed rate, non-investment grade debt. Pay-in-kind (PIK) bonds, Eurobonds, and debt issues from countries designated as emerging markets (e.g., Argentina, Brazil, Venezuela, etc.) are excluded, but Canadian and global bonds (SEC registered) of issuers in non-EMG countries are included. The Bloomberg Barclays 1-3 Month U.S. Treasury Bill Index includes all publicly issued zero-coupon U.S. Treasury Bills that have a remaining maturity of less than 3 months and more than 1 month, are rated investment grade, and have $250 million or more of outstanding face value. The Bloomberg Barclays Euro-Aggregate Index consists of bond issued in the euro or the legacy currencies of the sovereign countries participating the European Monetary Union (EMU).The Global Bond Index Emerging Market Broad Diversified Index (GBI-EM) is a comprehensive global local emerging markets index, and consists of liquid, fixed-rate, domestic currency government bonds.The Bloomberg Barclays Global Aggregate Corporate Index consists of corporate issues in Europe, the US and Asia-pacific regions. The Bloomberg Barclays Global High Yield Index is an unmanaged index considered representative of fixed rate, noninvestment-grade debt of companies in the U.S., developed markets and emerging markets.The Bloomberg Barclays Emerging Markets Index includes USD-denominated debt from emerging markets in the following regions: Americas, Europe, Middle East, Africa, and Asia. As with other fixed income benchmarks provided by Barclays Capital, the index is rules-based, which allows for an unbiased view of the marketplace and easy replicability.The Bloomberg Barclays MBS Index covers the mortgage-backed pass-through securities of Ginnie Mae, Fannie Mae, and Freddie Mac. Aggregate components must have a weighted average maturity of at least one year, must have $250 million par amount outstanding, and must be fixed rate mortgages.The Bloomberg Barclays Corporate Bond Index is the Corporate component of the U.S. Credit index.The Bloomberg Barclays TIPS Index consists of Inflation-Protection securities issued by the U.S. Treasury.The J.P. Morgan EMBI Global Index includes U.S. dollar denominated Brady bonds, Eurobonds, traded loans and local market debt instruments issued by sovereign and quasi-sovereign entities.The Li Keqiang Index is a composite measure composed of China’s electricity production, financial institution loans and railway freight.The Euro Stoxx 600 Index represents large, mid and small capitalisation companies across 18 European countries. The JPMorgan GBI-EM Global Diversified consists of regularly traded, liquid fixed-rate, domestic currency government bonds to which international investors can gain exposure. The weightings among the countries are more evenly distributed within this index.The JPMorgan Corporate Emerging Markets Bond Index (CEMBI): The CEMBI tracks total returns of US dollar-denominated debt instruments issued by corporate entities in Emerging Markets countries, and consists of an investable universe of corporate bonds. Both indices are also available in Diversified version. The JPMorgan CEMBI Index is a USD denominated external debt index tracking bond issued by sovereigns and quasi-sovereigns in the developing nations. The J.P. Morgan Domestic High Yield Index is designed to mirror the investable universe of the U.S. dollar domestic high yield corporate debt market.
The CS/Tremont Equity Market Neutral Index takes both long and short positions in stocks with the aim of minimizing exposure to the systematic risk of the market (i.e. a beta of zero).*The CS/Tremont Multi-Strategy Index consists of funds that allocate capital based on perceived opportunities among several hedge fund strategies. Strategies adopted in a multi-strategy fund may include, but are not limited to, convertible bond arbitrage, equity long/short, statistical arbitrage and merger arbitrage.The Bloomberg Barclays U.S. Dollar Floating Rate Note (FRN) Index provides a measure of the U.S. dollar denominated floating rate note market.*Market Neutral returns for November 2008 are estimates by J.P. Morgan Funds Market Strategy, and are based on a December 8, 2008 published estimate for November returns by CS/Tremont in which the Market Neutral returns were estimated to be +0.85% (with 69% of all CS/Tremont constituents having reported return data). Presumed to be excluded from the November return are three funds, which were later marked to $0 by CS/Tremont in connection with the Bernard Madoff scandal. J.P. Morgan Funds believes this distortion is not an accurate representation of returns in the category. CS/Tremont later published a finalized November return of -40.56% for the month, reflecting this mark-down. CS/Tremont assumes no responsibility for these estimates.The Office of National Statistics (ONS) Index is a mix-adjusted average housing price index. The index is calculated monthly using mortgage financed transactions from the Regulated Mortgage Survey by the Council of Mortgage Lenders. The Nationwide House Price Index is a mix adjusted index constructed from Nationwide lending data across the UK.The Halifax House Price Index is constructed from mortgage data derived from Halifax lending data across the UK.The MSCI AC World High Dividend Yield Index is composed of those securities that have higher-than-average dividend yield within its parent index, a track record of consistent dividend payments and the capacity to sustain future dividend payments.

J.P. Morgan Asset Management: Risks and disclosures
The Market Insights programme provides comprehensive data and commentary on global markets without reference to products. Designed as a tool to help clients understand the markets and support investment decision-
making, the programme explores the implications of current economic data and changing market conditions. For the purposes of MiFID II the JPM Market Insights and Portfolio Insights programmes are marketing
communications and are not in scope for any MiFID II/MiFIR requirements specifically related to investment research. Furthermore, the J.P. Morgan Asset Management Market Insights and Portfolio Insights programmes as non-
independent research have not been prepared in accordance with legal requirements designed to promote the independence of investment research; nor are they subject to any prohibition on dealing ahead of the dissemination
of investment research.
This document is a general communication being provided for informational purposes only. It is educational in nature and not designed to be taken as advice or a recommendation for any specific investment product, strategy, plan feature or other purpose in any jurisdiction, nor is it a commitment from J.P. Morgan Asset Management or any of its subsidiaries to participate in any of the transactions mentioned herein. Any examples used are generic, hypothetical and for illustration purposes only. This material does not contain sufficient information to support an investment decision and it should not be relied upon by you in evaluating the merits of investing in any securities or products. In addition, users should make an independent assessment of the legal, regulatory, tax, credit, and accounting implications and determine, together with their own professional advisers, if any investment mentioned herein is believed to be suitable to their personal goals. Investors should ensure that they obtain all available relevant information before making any investment. Any forecasts, figures, opinions or investment techniques and strategies set out are for information purposes only, based on certain assumptions and current market conditions and are subject to change without prior notice. All information presented herein is considered to be accurate at the time of production, but no warranty of accuracy is given and no liability in respect of any error or omission is accepted. It should be noted that investment involves risks, the value of investments and the income from them may fluctuate in accordance with market conditions and taxation agreements and investors may not get back the full amount invested. Both past performance and yield are not a reliable indicator of current and future results.
J.P. Morgan Asset Management is the brand for the asset management business of JPMorgan Chase & Co. and its affiliates worldwide. This communication is issued by the following entities: in the United Kingdom by JPMorgan Asset Management (UK) Limited, which is authorized and regulated by the Financial Conduct Authority; in other European jurisdictions by JPMorgan Asset Management (Europe) S.à r.l.; in Hong Kong by JF Asset Management Limited, or JPMorgan Funds (Asia) Limited, or JPMorgan Asset Management Real Assets (Asia) Limited; in Singapore by JPMorgan Asset Management (Singapore) Limited (Co. Reg. No. 197601586K), or JPMorgan Asset Management Real Assets (Singapore) Pte Ltd (Co. Reg. No. 201120355E); in Taiwan by JPMorgan Asset Management (Taiwan) Limited; in Japan by JPMorgan Asset Management (Japan) Limited which is a member of the Investment Trusts Association, Japan, the Japan Investment Advisers Association, Type II Financial Instruments Firms Association and the Japan Securities Dealers Association and is regulated by the Financial Services Agency (registration number “Kanto Local Finance Bureau (Financial Instruments Firm) No. 330”); in Korea by JPMorgan Asset Management (Korea) Company Limited; in Australia to wholesale clients only as defined in section 761A and 761G of the Corporations Act 2001 (Cth) by JPMorgan Asset Management (Australia) Limited (ABN 55143832080) (AFSL 376919); in Brazil by Banco J.P. Morgan S.A.; in Canada for institutional clients’ use only by JPMorgan Asset Management (Canada) Inc., and in the United States by JPMorgan Distribution Services Inc. and J.P. Morgan Institutional Investments, Inc., both members of FINRA/SIPC.; and J.P. Morgan Investment Management Inc.
In APAC, distribution is for Hong Kong, Taiwan, Japan and Singapore. For all other countries in APAC, to intended recipients only.
Copyright 2018 JPMorgan Chase & Co. All rights reserved
Prepared by: Karen Ward, Tilmann Galler, Vincent Juvyns, Maria Paola Toschi, Michael Bell, Nandini Ramakrishnan, Jai Malhi and Ambrose Crofton.
Unless otherwise stated, all data as of 30 June 2018 or most recently available.
Guide to the Markets - UK
JP-LITTLEBOOK
0903c02a81fb922f
Related Documents