Prepared for Department of Homeland Security Guide for Creating Useful Solution Architectures Core Research Program, Keys for Successful Deployment of IT Solution Architecture December 4, 2017 Version 1.1 Approved for Public Release; Distribution Unlimited. Case Number 17-4589 / DHS reference number 16-J-00097-02 This document is a product of the Homeland Security Systems Engineering and Development Institute (HSSEDI™).

Welcome message from author
This document is posted to help you gain knowledge. Please leave a comment to let me know what you think about it! Share it to your friends and learn new things together.
Transcript

Prepared for Department of Homeland Security
Guide for Creating Useful Solution Architectures
Core Research Program, Keys for Successful Deployment of IT Solution Architecture
December 4, 2017
Version 1.1
Approved for Public Release; Distribution Unlimited.
Case Number 17-4589 / DHS reference number 16-J-00097-02
This document is a product of the Homeland Security Systems Engineering and Development Institute (HSSEDI™).

ii
Homeland Security Systems Engineering & Development Institute The Homeland Security Systems Engineering & Development Institute (HSSEDI) is a federally funded
research and development center (FFRDC) established by the Secretary of Homeland Security under
Section 305 of the Homeland Security Act of 2002. The MITRE Corporation operates HSSEDI under the
Department of Homeland Security (DHS) contract number HSHQDC-14-D-00006.
HSSEDI’s mission is to assist the Secretary of Homeland Security, the Under Secretary for Science and
Technology, and the DHS operating elements in addressing national homeland security system
development issues where technical and systems engineering expertise is required. HSSEDI also consults
with other government agencies, nongovernmental organizations, institutions of higher education, and
nonprofit organizations. HSSEDI delivers independent and objective analyses and advice to support
systems development, decision making, alternative approaches, and new insight into significant
acquisition issues. HSSEDI’s research is undertaken by mutual consent with DHS and is organized by
tasks.
The research performed for this this report is conducted under Task Research Execution Plan (TREP)
number - TREP102, P16-64: Core Research Program, Key for Successful Deployment of IT Solution
Architectures. This document provides DHS Information Technology (IT) Solution Architects, Program
Managers, and Systems Engineers with a practical guide for creating useful Solution Architectures. The
document leverages best practices research and addresses key challenges to Solution Architecture at DHS,
previously developed by HSSEDI. The information presented in this report does not necessarily reflect
official DHS opinion or policy.
For more information about this publication contact:
Homeland Security Systems Engineering & Development Institute
The MITRE Corporation
7515 Colshire Drive
McLean, VA 22102
Email: [email protected]
http://www.mitre.org/HSSEDI

iii
Acknowledgements
The Homeland Security Act of 2002 (Section 305 of PL 107-296, as codified in 6 U.S.C. 185),
herein referred to as the “Act,” authorizes the Secretary of the Department of Homeland
Security, acting through the Under Secretary for Science and Technology, to establish one or
more federally funded research and development centers (FFRDCs) to provide independent
analysis of homeland security issues. MITRE Corp. operates the Homeland Security Systems
Engineering and Development Institute (HSSEDI) as an FFRDC for DHS under contract
HSHQDC-14-D-00006. The HSSEDI FFRDC provides the government with the necessary
systems engineering and development expertise to conduct complex acquisition planning and
development; concept exploration, experimentation and evaluation; information technology,
communications and cyber security processes, standards, methodologies and protocols; systems
architecture and integration; quality and performance review, best practices and performance
measures and metrics; and, independent test and evaluation activities. The HSSEDI FFRDC also
works with and supports other federal, state, local, tribal, public and private sector organizations
that make up the homeland security enterprise. The HSSEDI FFRDC’s research is undertaken by
mutual consent with DHS and is organized as a set of discrete tasks. This report presents the
results of research and analysis conducted under:
HSHQDC-16-J-00097
Core Research Program, Keys for Successful Deployment of IT Solution Architectures
Sponsor: Antonio Villafana, DHS OCIO/EBMO
The results presented in this report do not necessarily reflect official DHS opinion or policy.
Approved for Public Release; Distribution Unlimited.
Case Number 17-4589 / DHS reference number 16-J-00097-02

iv
Abstract The Department of Homeland Security Enterprise Business Management Office (EBMO) recognizes that
a key requirement for the success of information technology (IT) programs is a mature and viable
Solution Architecture. Pursuant to that objective, EBMO has tasked the Homeland Security Systems
Engineering & Development Institute (HSSEDI) with identifying challenges and successes with IT
Solution Architectures at DHS, documenting industry and department best practices, and providing keys
for IT program success with respect to Solution Architecture.
This document provides a practical Solution Architectures “how to” guide that describes useful solution
content, relations to the DHS Acquisition Lifecycle Framework and Systems Engineering Life Cycle, and
creating lean/just enough architecture to support agile development. The overall objective of this HSSEDI
research is to increase the likelihood of IT program success and foster a mature and viable Solution
Architecture discipline across DHS.
This document is intended for DHS IT Solution Architects, Program Managers, and Systems Engineers. It
is intended for use within waterfall, agile, and hybrid development approaches. This document leverages
best practices research and addresses key challenges to Solution Architecture previously developed by
HSSEDI.
Key Words 1. HSSEDI Core Research Program
2. DHS IT Programs
3. Solution Architecture
4. Solution Architecture Best Practices
5. Agile Development

v
Record of Changes
No. Date Reference A=Add M=Modify D=Delete
Description of Change
1.0 9/12/2016 Initial A Initial
1.1 12/4/2017 Update D Deleted References to earlier phases.
1.2 4/4/2018 Update M Updated based upon Public Release
Review of FFRDC PMO

vi
Table of Contents
1 Introduction ........................................................................................................................................... 1
1.1 Purpose of This Document ...................................................................................................1
1.2 Document Organization .......................................................................................................1
2 Solution Architecture at DHS ............................................................................................................... 2
2.1 Key Principles for Solution Architecture at DHS ................................................................2
2.2 Distinction among Architectures .........................................................................................3
2.3 The Role of the Solution Architect ......................................................................................3
2.4 Solution Architecture Construct ..........................................................................................4
2.5 Benefits of Solution Architecture ........................................................................................8
3 Conceptual Solution Architecture Description ................................................................................... 9
3.1 Business Process Graphic ....................................................................................................9
3.1.1 Content ...........................................................................................................................9
3.1.2 Example .......................................................................................................................10
3.2 Layer Graphic ....................................................................................................................10
3.2.1 Content .........................................................................................................................10
3.2.2 Example .......................................................................................................................12
3.3 User Interaction Graphic ....................................................................................................13
3.3.1 Content .........................................................................................................................13
3.3.2 Example .......................................................................................................................14
3.4 Solution Concept Graphic ..................................................................................................15
3.4.1 Content .........................................................................................................................15
3.4.2 Example .......................................................................................................................15
3.5 Subsequent SELC Activity Dependencies .........................................................................16
4 Logical Solution Architecture Description ........................................................................................ 17
4.1 Business Procedure Graphic ..............................................................................................17
4.1.1 Content .........................................................................................................................17
4.1.2 Example .......................................................................................................................18
4.2 System Function Graphic ...................................................................................................19
4.2.1 Content .........................................................................................................................19
4.2.2 Example .......................................................................................................................20

vii
4.3 Interface Graphic ...............................................................................................................20
4.3.1 Content .........................................................................................................................21
4.3.2 Example .......................................................................................................................21
4.4 Information / Control Flow Graphic ..................................................................................22
4.4.1 Content .........................................................................................................................23
4.4.2 Example .......................................................................................................................23
4.5 Integrated Design Graphic .................................................................................................24
4.5.1 Content .........................................................................................................................24
4.5.2 Example .......................................................................................................................25
4.6 Subsequent SELC Activity Dependencies .........................................................................26
5 Physical Solution Architecture Description ...................................................................................... 27
5.1 Physical Business Process Graphic ....................................................................................27
5.1.1 Content .........................................................................................................................28
5.1.2 Example .......................................................................................................................28
5.2 Component Software Graphic ............................................................................................29
5.2.1 Content .........................................................................................................................29
5.2.2 Example .......................................................................................................................30
5.3 Physical Infrastructure Graphic .........................................................................................30
5.3.1 Content .........................................................................................................................31
5.3.2 Example .......................................................................................................................31
5.4 Physical Solution Interface Graphic ..................................................................................32
5.4.1 Content .........................................................................................................................32
5.4.2 Example .......................................................................................................................33
5.5 Solution Performance Graphic ...........................................................................................33
5.5.1 Content .........................................................................................................................34
5.5.2 Example .......................................................................................................................34
6 Development and Use of Solution Architectures throughout the DHS ALF and SELC ................ 36
6.1 Needs Analysis...................................................................................................................37
6.1.1 Create Initial Conceptual Solution Architecture ..........................................................37
6.2 Solution Engineering .........................................................................................................38
6.2.1 Update Conceptual Solution Architecture ...................................................................38

viii
6.3 Planning .............................................................................................................................40
6.4 Requirements Definition ....................................................................................................40
6.4.1 Develop Initial Logical Solution Architecture .............................................................40
6.5 Design and Development ...................................................................................................41
6.5.1 Update Logical Solution Architecture .........................................................................41
6.5.2 Create Physical Solution Architecture .........................................................................41
6.6 Integration and Implementation .........................................................................................43
6.6.1 Update Physical Solution Architecture ........................................................................43
Appendix A Acronyms .............................................................................................................................. 44

ix
List of Figures
Figure 1. Solution Architecture Context with Other Architectures ................................................ 3
Figure 2. Solution Architect Relationships to Other Stakeholders ................................................. 4
Figure 3. Solution Architecture Construct ...................................................................................... 5
Figure 4. Key Relationships among Solution Architecture Graphics ............................................. 7
Figure 5. Solution Architecture Throughout the DHS ALF and SELC .......................................... 7
Figure 6. Conceptual Solution Architecture Content ...................................................................... 9
Figure 7. Business Process Graphic Example............................................................................... 10
Figure 8. Elements of a Layer Graphic ......................................................................................... 11
Figure 9. Layer Graphic Example ................................................................................................. 13
Figure 10. User Interaction Graphic Example .............................................................................. 14
Figure 11. Solution Concept Graphic Example ............................................................................ 16
Figure 12. Logical Solution Architecture Content ........................................................................ 17
Figure 13. Business Procedure Graphic Example ......................................................................... 19
Figure 14. System Function Graphic Example ............................................................................. 20
Figure 15. Interface Graphic Example .......................................................................................... 22
Figure 16. Information / Control Flow Example .......................................................................... 24
Figure 17. Integrated Design Graphic Example ........................................................................... 25
Figure 18. Physical Solution Architecture .................................................................................... 27
Figure 19. Physical Business Process Graphic Example .............................................................. 29
Figure 20. Component Software Graphic Example ...................................................................... 30
Figure 21. Physical Infrastructure Graphic Example .................................................................... 32
Figure 22. Physical Solution Interface Graphic Example ............................................................. 33
Figure 23. Solution Performance Graphic Example ..................................................................... 35
Figure 24. Solution Architecture throughout the DHS ALF and SELC ....................................... 36
List of Tables
Table 1. Descriptions for Solution Architecture Graphics .............................................................. 5
Table 2. Development of Solution Architecture throughout the SELC ........................................ 36

ii

1
1 Introduction This Guide for Creating Useful Solution Architectures is the fourth of four products being generated as
part of a research project funded through the Homeland Security Systems Engineering & Development
Institute (HSSEDI) Core Research Program. The research effort responsible for this report is being
sponsored by the Enterprise Business Management Office (EBMO) within the Office of the Chief
Information Officer (OCIO) and is being executed under the guidance of the Deputy Executive Director
of EBMO.
1.1 Purpose of This Document
The overall purpose of this document is to help increase the likelihood of DHS IT program success and
foster a standardized Solution Architecture discipline across DHS.
This guide provides DHS IT Solution Architects, Program Managers, and Systems Engineers a practical
Solution Architectures “how to” guide that:
• Describes the conceptual, logical, and physical elements required for an effective Solution
Architecture
• Shows the association of the Solution Architecture to existing Acquisition Lifecyle Framework
(ALF) and Systems Engineering Lifecyle (SELC) activities and further describes the use of the
Solution Architectures throughout the IT program life cycle
• Describes how to iteratively build conceptual, logical, and physical solution architectures in
alignment with an incremental software development approach and rapid deployment of DHS IT
programs.
1.2 Document Organization
The remainder of the document is organized as follows: Section 2 provides an overview of Solution
Architecture at DHS and describes key principles and benefits. Section 3 describes the conceptual
solution architecture. Section 4 describes the logical solution architecture. Section 5 describes the
physical solution architecture. Lastly, Section 6 outlines specific guidance by DHS ALF and SELC
activities for developing the Solution Architecture.

2
2 Solution Architecture at DHS Over the past several years, DHS has experienced a number of challenges to its IT programs, including cost
overruns, re-starts, and delayed deployments. While many factors have contributed to those challenges,
HSSEDI research has shown that a viable and mature Solution Architecture is critical to the success of an
IT program.
Solution architecture captures and communicates the “big-picture” vision of the program to key business
and technical stakeholders, facilitates integration of the contracting, infrastructure, and systems engineering
activities throughout the ALF and SELC, and fosters collaboration between technical and business
stakeholders.
However, based on interviews with several DHS IT programs, HSSEDI found that a number of DHS IT
programs lack a mature and viable Solution Architecture, as indicated by several challenges including:
• Solution Architecture is not well defined, and is neither standardized nor consistently used across
DHS IT programs.
• Solution Architecture best practices have not been fully incorporated into DHS processes and
guidance.
• Solution Architecture is not integrated with DHS’ agile development approach.
This section provides guiding principles for Solution Architecture at DHS, defines Solution Architecture,
explains the role of the Solution Architect, and highlights key benefits to DHS Components and IT
programs.
2.1 Key Principles for Solution Architecture at DHS
For purposes of this document, Solution Architecture is defined as:
A program-level solution vision and architecture description consisting of abstract solution
building blocks. It is comprised of multiple integrated views that conform to standardized and/or
“fit-for-purpose” viewpoints and stakeholder concerns. It influences, guides, and supports SELC
activities.
In addition, this Guide is based on the following key principles for Solution Architecture at DHS:
• The focus of Solution Architecture should be on enabling the success of IT programs at the
Component/Program level; it should not be viewed as a top-down mandate or an enforcement
mechanism.
• Solution Architecture should support all IT development approaches (e.g., agile, waterfall,
hybrid).
• Solution Architecture should not be additive to the acquisition process or a program’s timeline,
and should not delay rapid system development and deployment.
• Solution Architectures should evolve in an incremental, iterative manner throughout the program
life cycle, and be used to influence, guide, and support other life-cycle activities (e.g.,
requirements, design, development, test, contracting).
• Every IT program should have a Solution Architect with the appropriate skills and experience to
influence, guide, and support the full life cycle of the program.

3
2.2 Distinction among Architectures
A Solution Architecture sits between an enterprise architecture and one or more specific system
architectures. In most cases, these system architectures are either specialized or technical architectures
that address various types of infrastructures leveraged by software components.
As shown in Figure 1, Enterprise Architecture operates at the strategic level across a number of
technologies, focusing on the enterprise rather than a specific system. On the other end of the spectrum,
Systems Architecture operates at a tactical level and is focused on the details of a specific system,
application, or subsystem.
Solution Architecture operates in the middle and is focused on the selected business problem. Solution
Architecture is more technology oriented than enterprise architectures, but at the same time Solution
Architecture is constrained by the technical architecture included in the enterprise architecture.
Solution Architecture functions as an integrating framework for the solution building blocks that need to
come together and function as a whole to satisfy user needs and stakeholder concerns.
Figure 1. Solution Architecture Context with Other Architectures
2.3 The Role of the Solution Architect
Based on research findings documented in the Best Practices for Solution Architecture deliverable, the
role of a Solution Architect should be distinguished from that of a systems engineer. The roles of a
Systems Engineer and a Solution Architect may overlap but should not be considered one and the same.
The Solution Architect plays a prominent role in the pre-systems engineering activities; while the role of
the Systems Engineer gains prominence as the system development progresses through the SELC phase.
During the later stages of SELC, the Solution Architect and the Systems Engineer collaborate to ensure
that the implemented solution is aligned with the envisioned Solution Architecture.

4
Solution architects balance the architectural concerns of the IT programs with the concerns of the
enterprise under which the programs are being executed. Solution architects play an important role in
ensuring that the solution architecture aligns with the established roadmaps. A solution architect should
be part of the program management team from the very beginning, and should play a key role in the
acquisition and systems engineering activities.
A Solution Architect needs to interact, communicate, collaborate, and coordinate with a wide spectrum of
people, as shown in Figure 2. One of the key relationships is with the other architects who are responsible
for specialized aspects of an IT solution, including data architects, software/application architects,
security architects, and network architects.
Figure 2. Solution Architect Relationships to Other Stakeholders
Although a Solution Architect role carries the label of an architect, in reality, a Solution Architect is part
architect and part technologist. A Solution Architect is expected to be a senior-level resource with
considerable knowledge across a wide spectrum of established and emerging technologies and products
that can be used to implement a desired solution. A Solution Architect is not expected to be an expert in
the use of these products or technologies but is expected to have more than superficial knowledge about a
variety of products and technologies and an awareness of their pros and cons.
2.4 Solution Architecture Construct
As shown in Figure 3, the Solution Architecture consists of three components—a Conceptual Solution
Architecture, a Logical Solution Architecture, and a Physical Solution Architecture—each representing
increasing levels of detail and specificity from the conceptual ideation to the logical design to the physical
implementation.
• Conceptual Solution Architecture is an architecture that captures a big-picture vision of the
whole solution. This architecture identifies the major functional components needed to provide
the core business/mission capabilities within the solution, describes the relationship to the various
organizations interacting with the solution’s building blocks, the purpose of each building block
component, and the interrelationships among the functional components.
Enterprise Architect
Program Management
Other Stakeholders
DHS Leadership
Other ProjectArchitects
Solution Architect
Stakeholder Engagement
SystemEngineers
Technical Staff (Requirements Engineers;
Designers; Developers etc.)
Industry(Hardware &
SoftwareVendors
RFIs, RFPs
Coordination &Collaboration
PrototypeDevelopment
Collaboration
Component Leadership

5
• Logical Solution Architecture describes these software components and the information flows
and control flows among the components within the system. It results from allocating the
functional components in the Conceptual SA to software components identified from
requirements analysis and early design work. Software components may be open source,
commercial off-the-shelf (COTS), or government off-the-shelf (GOTS) products, or custom code.
• Physical Solution Architecture shows the mapping of all software components to hardware
components and detailed information and control flows. It includes connections to internal and
external networks; incorporation of security features and devices, component integration
mechanisms, and component scaling mechanisms needed to meet non-functional requirements.
Figure 3. Solution Architecture Construct
HSSEDI research recommends that Solution Architecture should consist of at least 14 specific graphics,
as shown in Table 1. The content within each graphic should be tailored for the specific situational use.
Table 1. Descriptions for Solution Architecture Graphics
Solution
Architecture
Components
Corresponding Graphic Description
Conceptual Solution
Architecture
Establishes the
solution vision and
context
Business Process Graphic Shows the abstract business context for the solution
and how the solution supports the business context
User Interaction Graphic Shows the users and their interactions with the
solution
Layer Graphic Shows the delineation of business functionality and
technology elements
Solution Concept Graphic
Shows organizations, stakeholders, users, systems,
and technologies, within the solution and their
respective interactions
Logical Solution Business Procedure Detailed data flows showing specific inputs, outputs,

6
Solution
Architecture
Components
Corresponding Graphic Description
Architecture
Confirms the Solution
design that will be
implemented
Graphic functions, decisions, alternate flows
System Function Graphic
Shows the allocation of application, data, messaging
functions in the conceptual layer graphic to elements
within the Building Block graphic
Interface Graphic Shows logical-level details of all interactions among
the stakeholder, users, systems, and technology
Information / Control
Flow Graphic
Graphic that details how information is flowing and
controlled among the logical solution elements
Integrated Design Graphic
A logical level solution overview showing some
physical details covering all solution elements in
order to understand key technical issues
Physical Solution
Architecture
Validates that what is
delivered is
sustainable
Physical Business Process
Graphic
Shows the physical flows of material objects (e.g.,
documents) among physical locations and details the
operations performed at the location
Component Software
Graphic
Shows the system products of the major components
and is useful for understanding common system
products across the architecture to identify duplication
Physical Infrastructure
Graphic
Shows the physical construction and relationships
among the major components within the solution
Physical Solution
Interface Graphic
Shows the physical interface construction of the
interfaces among users within the solution as well as
the interfaces among the major components within the
solution
Solution Performance
Graphic
Shows the solution’s ability to meet its stated
performance requirements like response time,
throughput, peak load behavior, scalability, and
hardware resources, as well as, examining the impacts
of potential future changes in users, transaction
volumes, and data sets.
As a unified architecture, there are well-defined relations among these 14 graphics. Figure 4 shows the
key notional relations as the program formulates the Solution Architecture from conceptual to physical.

7
Figure 4. Key Relationships among Solution Architecture Graphics
The arrows flowing from Conceptual to Logical to Physical Solution Architectures indicate that the
earlier graphics’ systems engineering data contributes to the development of the later graphics’ systems
engineering data. The reverse shows that as the later graphics’ systems engineering data is developed, it
may cause changes to the upper related graphic.
In addition, as shown in Figure 5, the three components of a Solution Architecture should be developed in
an incremental and iterative manner throughout the program life cycle.
Figure 5. Solution Architecture Throughout the DHS ALF and SELC

8
The Conceptual Solution Architecture is initiated early in the program life cycle and extended throughout
the program; the Logical Solution Architecture builds off the Conceptual Solution Architecture and is
developed iteratively throughout the program; the Physical Solution Architecture builds off both the
Conceptual and Logical Solution Architectures to describe the actual software and hardware components
and their functions, map the software to the hardware, and provide additional details (e.g., networking,
performance monitoring, security components) required for incremental development and testing. The
entire Solution Architecture is used to influence, guide, and support systems engineering activities
throughout the program life cycle.
2.5 Benefits of Solution Architecture
Solution Architecture increases the likelihood of program success by facilitating analyses of changing
program requirements and needs, which are typical characteristics of large, complex programs, while
providing long-term vision of the target solution.
Solution Architecture delivers the following specific benefits:
• Aligns the business, information, and technology capabilities, and accurately translates business
needs into a technical solution
• Ensures that the design of the business solution meets the current business functional
requirements, positions the solution for future functional requirements and continuous business
optimization, and fits with the enterprise architecture and technology roadmaps
• Defines an extensible platform supporting the initial solution delivery and also charts a clear
course for extending that initial solution to meet evolving business needs over the course of
numerous functional evolutions
• Establishes a foundation for flexible and coordinated business technology change
• Documents, delivers, and shares the technical vision of the program throughout the business
solution end-to-end life cycle: from ideation to design to implementation
• Provides a tool to integrate the contracting, infrastructure, and
requirements/design/development/testing systems engineering activities
• Influences, guides, and supports the technology choices and the ALF and SELC activities
throughout the entire program life cycle.

9
3 Conceptual Solution Architecture Description The Conceptual Solution Architecture establishes the solution vision and solution context. It is an
abstract-level graphic that captures a big-picture view of the whole solution, which includes both business
and technical aspects. The Conceptual Solution Architecture provides a basis for analyses and trade-off
studies that can help refine and optimize the Solution Architecture in sufficient detail to support solution
design and implementation.
After examining various architecture frameworks, HSSEDI research supports that the Conceptual
Solution Architecture consists minimally of four graphics: Business Process, Layer, User Interface, and
Solution Concept, as shown in Figure 6.
Figure 6. Conceptual Solution Architecture Content
The following sections describe these graphics. While they are all required, specific content should be
tailored to meet the needs of each program’s scope, complexity, key performance parameters, and
requirements.
3.1 Business Process Graphic
The Business Process Graphic provides a mission perspective of the solution’s core capabilities to guide
design, development, and validation of the solution, and to ensure that the solution satisfies its mission
needs. In addition, it provides a functional perspective of the solution’s business activities, enabling
management to use the Solution Architecture to identify enhancements to operations. For a more detailed
description, review the Object Management Group’s (OMG) Business Process Modeling Notation
(BPMN) standard.
3.1.1 Content
The Business Process Graphic depicts key business functions and their relationships using a process flow
format and supporting descriptive information. The Business Process Graphic contains:
• Definitions of organizations, stakeholders, users, and roles performed.
• Definitions of each business function to identify clearly all functions within the solution and
eliminate overlap within functions.
• Definition of data used within the business context.
• Definitions of function interrelationships. This could be simply that they are related, directed flow
(arrow) representing sequence, or data transmission between them.
• Definitions of any controls or event triggers.
• Depiction of the interrelationships of the functions via a business graphics(s) that additionally
includes organizations, stakeholders, users, and/or roles. The program will use the business
graphic to support analyses related to identifying user roles, identifying process inefficiencies,
10
evaluating outputs for alignment with goal achievement, supporting solution requirements
analysis, and understanding organizational responsibilities.
• A single simpler overall integrated graphic of complex related process flows so that the program
can confirm correctness of the processes.
This research recommends that solution architects use standard flowcharting techniques or data flow
diagrams that support developing more precise models using the BPMN in later systems engineering
activities.
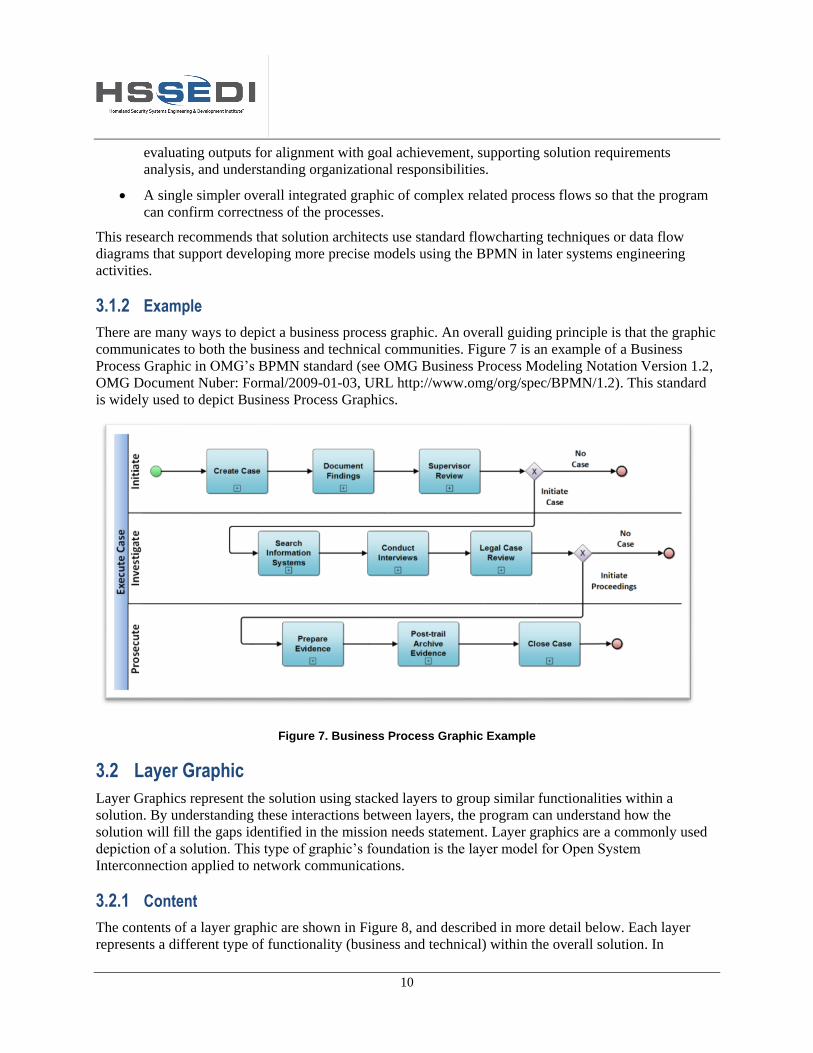
3.1.2 Example
There are many ways to depict a business process graphic. An overall guiding principle is that the graphic
communicates to both the business and technical communities. Figure 7 is an example of a Business
Process Graphic in OMG’s BPMN standard (see OMG Business Process Modeling Notation Version 1.2,
OMG Document Nuber: Formal/2009-01-03, URL http://www.omg/org/spec/BPMN/1.2). This standard
is widely used to depict Business Process Graphics.
Figure 7. Business Process Graphic Example
3.2 Layer Graphic
Layer Graphics represent the solution using stacked layers to group similar functionalities within a
solution. By understanding these interactions between layers, the program can understand how the
solution will fill the gaps identified in the mission needs statement. Layer graphics are a commonly used
depiction of a solution. This type of graphic’s foundation is the layer model for Open System
Interconnection applied to network communications.
3.2.1 Content
The contents of a layer graphic are shown in Figure 8, and described in more detail below. Each layer
represents a different type of functionality (business and technical) within the overall solution. In

11
addition, interactions occur only between neighboring layers. This type of separation facilitates
implementation of clearly defined interfaces among layer functionalities, resulting in loose coupling,
modularity, and the flexibility needed for continuously evolving the solution to accommodate
business/mission changes, new capabilities, and new technologies.
Figure 8. Elements of a Layer Graphic
User Communications
The user communications layer includes the interface and communication mechanisms for users (humans,
software in other internal and external systems) to interact with the architected solution.
Business Capabilities
The business capabilities layer identifies the major business/mission functions or core capabilities
supported by the solution. They drive the contents of the other layers within the graphic. These
capabilities represent groupings of related business process graphics.
Applications and Services
The application and services layer identifies the major software applications and services that implement
the business capabilities. In more detailed views of the architecture (beyond conceptual), the applications
and services layer will include sub-layers showing more detailed software components that implement the
major applications and services.
Integration (Middleware)
The integration/middleware layer includes software that enables software components in other layers to
interact with each other. System developers often use middleware in a complex or distributed system or a
system that may include both legacy and modernized components. They may also use middleware to
coordinate interfaces among distributed software applications. Examples of middleware include message
brokers, enterprise service buses (ESBs), service orchestration products, and workflow management
products.
Data
The data layer includes structured and unstructured business/mission data and data management products

12
used by the solution’s applications and services.
Infrastructure and Facilities
The infrastructure and facilities layer includes the facilities (e.g., data centers, service or processing
centers, and their locations), networks, servers, and storage devices used to implement the solution’s
business functions, software applications, and data requirements. The Solution Architect assists in design
of the infrastructure to support the solution performance requirements (e.g., server and application
availability, end-to-end response time, data throughput volume and time, reliability, availability,
maintainability). The infrastructure layer includes the solution monitoring and management components
that help ensure that the solution meets its performance requirements, including backup, failover, and
disaster recovery capabilities.
Security and Privacy
The security and privacy layer includes all components and mechanisms used to implement the solution’s
security and privacy requirements. Security mechanisms address user access control, information
assurance, data security, and cyber security for a solution. Privacy mechanisms provide required
protection of privacy-related information in the solution, such as personally identifiable information. The
set of security and privacy components crosses and affects all architecture layers.
Performance
The performance layer includes the components and mechanisms that the solution will use to ensure that
it meets its reliability, maintainability, and availability requirements, as well as other key performance
parameters, such as user response times. The set of performance-related components crosses and affects
all architecture layers.
3.2.2 Example
Figure 9 provides an example of a Layer Graphic.
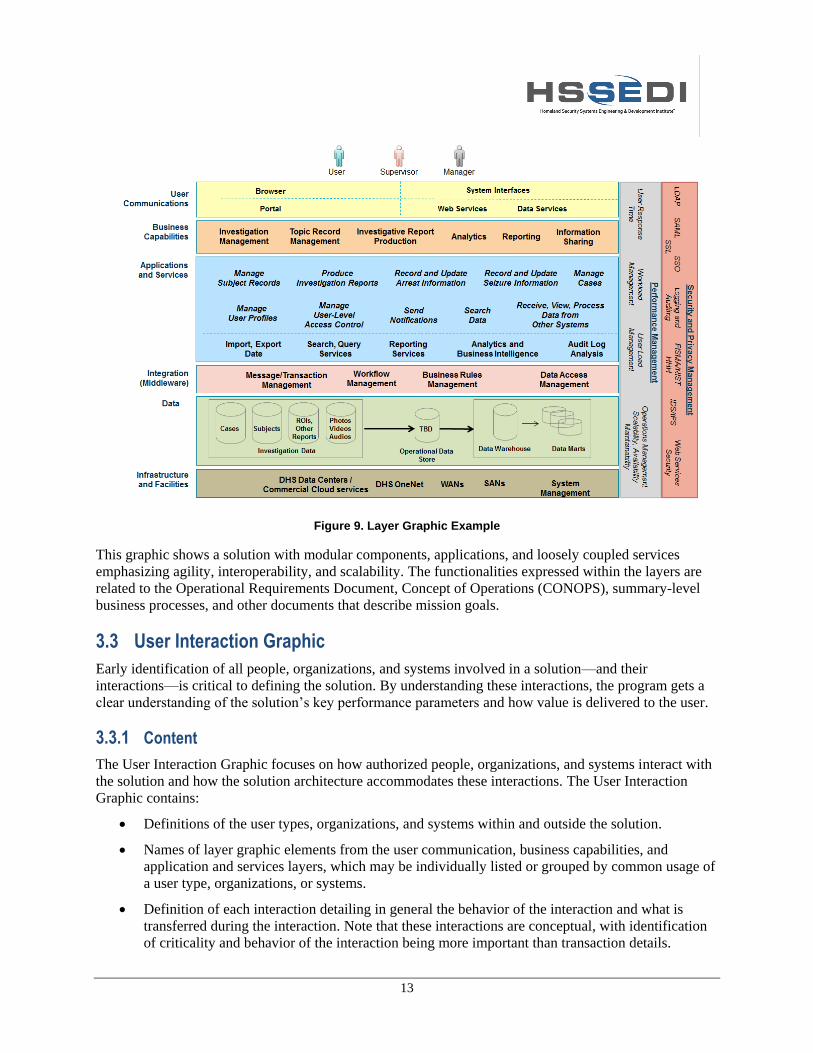
13
Figure 9. Layer Graphic Example
This graphic shows a solution with modular components, applications, and loosely coupled services
emphasizing agility, interoperability, and scalability. The functionalities expressed within the layers are
related to the Operational Requirements Document, Concept of Operations (CONOPS), summary-level
business processes, and other documents that describe mission goals.
3.3 User Interaction Graphic
Early identification of all people, organizations, and systems involved in a solution—and their
interactions—is critical to defining the solution. By understanding these interactions, the program gets a
clear understanding of the solution’s key performance parameters and how value is delivered to the user.
3.3.1 Content
The User Interaction Graphic focuses on how authorized people, organizations, and systems interact with
the solution and how the solution architecture accommodates these interactions. The User Interaction
Graphic contains:
• Definitions of the user types, organizations, and systems within and outside the solution.
• Names of layer graphic elements from the user communication, business capabilities, and
application and services layers, which may be individually listed or grouped by common usage of
a user type, organizations, or systems.
• Definition of each interaction detailing in general the behavior of the interaction and what is
transferred during the interaction. Note that these interactions are conceptual, with identification
of criticality and behavior of the interaction being more important than transaction details.

14
• Depiction of the interactions via a user interaction graphic showing the user types, organizations,
systems, name layer graphic elements, and the defined interactions. The program will use the
User Interaction Graphic to support analyses related to identifying user roles, identifying process
inefficiencies, evaluating outputs for alignment with goal achievement, supporting solution
requirements analysis, and understanding organizational responsibilities.
The User Interaction Graphic is usually prepared in an informal manner when formulating the Conceptual
Solution Architecture. More formal depictions may occur in development of the Logical Solution
Architecture.
3.3.2 Example
In the example shown Figure 10, users of the solution include individuals and other systems. Individuals
are users, supervisors, other managers, and possibly other authorized government users. Individuals
access the solution via a portal. The solution authenticates and grants access to users to specific functions
and data by security-related software in the portal. Based on authentication and authorizations, a user will
be presented links via the portal software to enable access to the specific functions identified and their
associated data.
Users of the solution may also be systems (internal and external to the agency) that request imports of
related data, provide exports of their data based on the solution design, or request specific data through
Web services.
Figure 10. User Interaction Graphic Example
Note that the Solution Architects may use any icons desired, from simple icons to pictures, so long as the

15
people, organizations, and systems are clearly distinguishable and their roles are clear.
3.4 Solution Concept Graphic
The Solution Concept Graphic reflects the initial analysis of how to structure the solution to meet the
business/mission needs. The Solution Concept Graphic is developed to convey an integrated depiction of
the solution vision and context. The graphic allows comprehension of the overall solution, confirming
that the solution will fill the gaps in the mission needs statement and meet all defined Key Performance
Parameters (KPPs). It also supports identification of risks, undue complexity, and missing capabilities.
3.4.1 Content
The Solution Concept Graphic reflects the fundamental organization of a set of solution building blocks
that can be procured or developed somewhat independently. The Open Group Architecture Framework
defines a solution building block as having the following characteristics:
• A package of functionality defined to meet the business needs across an organization
• A defined boundary and is generally recognizable as “a thing” by domain experts
• Interoperates with other, interdependent building blocks.
The Solution Concept Graphic contains:
• Functional definitions of each building block. A block can be an organization, a system, an
application, a COTS product, or a piece of technology.
• Definitions of all interfaces across the solution boundary. They may be just what was defined
within the User Interface Graphic or may contain additional system/technology level interfaces.
• Definition of each arrow within the Solution Concept Graphic. Different arrow shapes and
thicknesses can be used to display different meanings, such as an undefined relationship, a
performance sequence, a directed data flow, a directed physical material flow, or a causal
relation.
• Depiction of the solution concept showing the user types, organizations, systems, interfaces,
building blocks, and arrows related to all defined interactions. The program will use the Solution
Concept Graphic to support analyses related to formulating alternative solutions, trade-offs, and
means of solution development.
• A clear mapping to Business Process Graphic content.
The Solution Concept Graphic can display the solution building blocks using any icons desired, from
simple squares to pictures, so long as the block are well defined.
3.4.2 Example
Figure 11 shows an example of a Solution Concept Graphic identifying the solution’s major components.
An IT program decided to divide its overall solution into four major components: the case management
application, an ESB, a data warehouse, and an operational data store to stage data before loading into the
warehouse. The case management application was going to be a COTS product and would require a
procurement, but work could proceed on the other three components, as well as on revising operational
procedures to reduce schedule and complexity risks for the overall program. Thus, the overall solution
concept comprises these four major building blocks. In addition, architecting was started on the potential
disaster recovery architecture of the overall solution architecture. This affected the conceptual

16
architecture. The arrows indicate information flows between users and the system components, among the
major system components, and between the ESB and other systems. Also shown is the backup and
recovery initial concept, which initially was to simply replicate the operational architecture.
Figure 11. Solution Concept Graphic Example
A Conceptual Solution Architecture may have multiple Solution Concept Graphics to support common
understanding among DHS management, the Lead Technical Authority (LTA), the Lead Business
Authority (LBA), and IT program management.
3.5 Subsequent SELC Activity Dependencies
The following systems engineering data, organized by major SELC activities, is dependent on the
Conceptual Solution Architecture data:
• Needs Analysis
o Preliminary CONOPS
o Capability Development Plan
• Solution Engineering
o CONOPS
o Operational Requirements
o Analysis of Alternatives
• Planning
o Systems Engineering Plan
o Test Execution Master Plan

17
4 Logical Solution Architecture Description The Logical Solution Architecture describes organizations, users, system/software components, and the
information/control flows among them. An organization can be any group of individuals organized to
perform certain functions. System/software components may be government shared services, COTS or
GOTS products, or custom code. Figure 12 shows the graphics that should be developed at a minimum
within the Logical Solution Architecture, regardless of the software methodology (agile, spiral, or
waterfall) the program is following.
Figure 12. Logical Solution Architecture Content
The Logical Solution Architecture results from allocating the abstract Conceptual Solution Architecture
content to specific organizations, users, and system/software components that are identified during
Requirements Engineering and Design SELC activities. In addition, as a solution may consist of multiple
organizations and systems, each of these Logical Solution Architecture graphics may be a synthesized
combination of Solution Architecture content developed during Requirements Engineering and Design
and will map to related organizational and system architecture graphics.
The following sections describe these graphics. While they are required, the content type, depth, and
formality should be tailored to meet the need for detail, and to answer questions about gap fulfillment,
KPPs, and requirements.
4.1 Business Procedure Graphic
The Business Procedure Graphic is a more detailed specification of the processes within the Business
Process Graphic. The Business Procedure Graphic provides a user activity perspective of the solution’s
specific business functional capabilities to:
• Enable management to identify enhancements to operations
• Guide Requirements Engineering and Design activities
• Support validation that the overall solution satisfies agency mission needs
• Show ownership and responsibilities of each procedure.
The Business Procedure Graphic shows sequential flow of control between activities, the events that
trigger the activities, the data involved, and results from completion of a procedure. The graphic may
utilize swim lane techniques to represent ownership and realization of process steps.
4.1.1 Content
The Business Procedure Graphic is a depiction of key business functions related via defined relations in a
process flow format and supporting descriptive information. The Business Procedure Graphic contains:
• Definitions of specific actual organizations, stakeholders, users, and roles performed.
• Definitions of each business function to identify clearly all functions within the solution and
eliminate overlap within functions.

18
• Definition of data used within the business context.
• Definitions of function interrelationships. This could be simply that they are related, directed flow
(arrow) representing sequence, or data transmission between them.
• Definitions of any decision events associated with procedure steps.
• Definitions of any controls or event triggers.
• Depiction of the interrelationships of the functions via a business graphics(s) that additionally
includes organizations, stakeholders, users, and/or roles. The program will use the business
graphic(s) to support analyses related to identifying user roles, identifying process inefficiencies,
evaluating outputs for alignment with goal achievement, supporting solution requirements
analysis, and understanding organizational responsibilities.
• A single simpler overall integrated graphic of complex related process flows so that the program
can confirm correctness of the processes
This research recommends that Solution Architects use the standards-based workflow charting techniques
used within the related system architecture development activities. Using consistent standards will
support collaboration among the program teams and verification of the solution/system designs. Standards
may be data flow diagraming, BPMN, Integration Definition for Function Modeling (IDEF), or the
Unified Modeling Language (UML).
4.1.2 Example
There are many ways to depict a Business Procedure Graphic, depending on the standard used. An overall
guiding principle is that the Business Procedure Graphic communicates to specific users and their
organizations and the system architects on the program. Figure 13 is an example of a Business Procedure
Graphic using BPMN. Note that regardless of standard used for the graphic, the following need to be
shown:
• Information flowing on lines connecting activities
• Key control points
• Key products developed
• Data repositories accessed.

19
Figure 13. Business Procedure Graphic Example
4.2 System Function Graphic
The System Function Graphic addresses the linkage between possible system functions and business
functions and activities. The System Function Graphic depicts a mapping of system functions and users to
business activities. The System Function Graphic identifies the transformation of an operational need into
a purposeful action performed by a system within the solution. The intended usage of the System
Function Graphic includes supporting the:
• Tracing of functional system requirements to user requirements
• Tracing of solution options to requirements
• Identification of overlaps or gaps.
The System Function Graphic plays a particularly important role in tracing the architectural elements
associated with system function requirements to those associated with user requirements. The Solution
Architect will update this system functional information during SELC design activities to generate the as-
designed detailed system functional content of the related system architecture.
4.2.1 Content
The System Function Graphic reflects the fundamental organization of a set of systems functions
allocated to the building blocks within the Solution Concept Graphic. The System Function Graphic is
based on the Solution Concept graphic and simply contains:
• Functional definitions of each function depicted within a building block on the graphic.
• Depiction of the system functions along with specific users, organizations, and arrows related to
all defined interactions. The program will use the Systems Function Graphic to support analyses
related to formulating alternative solutions, trade-offs, and alternative means of solution
development.

20
• A clear mapping to Business Procedure Graphic content. This supports the solution fulfilling the
specific user and organization needs.
The System Function Graphic considers both the business procedures that it directly supports as well as
the business processes that execute around it.
4.2.2 Example
Figure 14 is an example of a Solution Functions graphic using the same layout as the Solution Concept
Graphic.
Figure 14. System Function Graphic Example
There are many ways to depict a System Function Graphic, depending on the standard used. An overall
guiding principle is that the System Function Graphic should be displayed in a similar manner to the
Solution Concept Graphic, or alternatively in the standard that the program is using for related systems
architecture-level graphics. Note that in Figure 14, the arrows have no descriptions and merely show
relations among the various solution components. They are defined in the Interface Graphic described
next.
4.3 Interface Graphic
The Interface Graphic details the interfaces of users with the solution, the interactions among the major
components within the solution, and interfaces to systems / organizations external to the solution. The

21
Interface Graphic details from a logical perspective the content and structure of messages moved across
the interface. The Interface Graphic describes in broader terms the related system architecture interface
descriptions.
The Interface Graphic has several uses from an overall solution perspective:
• Detailing specification of solution interfaces.
• Investigating alternative interface options.
• Capturing System Information Flow requirements. There may be multiple systems within the
solution.
• Developing a standard for exchanging messaging-related information across multiple solution
components.
• Isolating the activities associated with connecting to and consuming information from the
development of the solution functionality. This support components being loosely coupled.
4.3.1 Content
The Interface Graphic is used to give a more precise specification of a connection between organizations,
users, and systems. The graphic, however, will not identify the protocol stacks used. The protocols will be
specified in Physical Interface Graphic within the Physical Solution Architecture.
The Interface Graphic is based on the System Function Graphic and contains:
• Descriptions of each interface depicted on the Interface Graphic.
• Descriptions of each message type detailing the sender, information exchanged, and receiver.
• Depiction of each message type within an interface along with specific users, organizations, and
systems involved. An arrow is show for each message type to define all interactions. The program
will use the Interface Graphic to support analyses related to formulating alternative solutions,
trade-offs, and alternative means of solution development.
4.3.2 Example
Figure 15 is a general example of an Interface Graphic using the same standard as the System Function
Graphic.

22
Figure 15. Interface Graphic Example
Just as in all the graphics, there are many ways to depict an Interface Graphic, depending on the standard
used. An overall guiding principle is that the Interface Graphic should be displayed in a similar manner to
the System Function Graphic, or alternatively in the standard that the program is using for related systems
architecture-level graphics. Note that in Figure 15, the building blocks representing system components
have no functional content descriptions and merely show the various tiers within the solution components.
The components’ function definitions are described within the System Function Graphic.
4.4 Information / Control Flow Graphic
The Information / Control Flow Graphic defines a series of important solution end-to-end interactions
necessary to generate desired user results from the solution. System function process flows are depicted to
illustrate important aspects of solution performance. The System Information / Control Flow content is
mapped to the Business Process Graphic and Business Procedure Graphic to validate that the design
supports user and agency needs.
Each Information / Control Flow Graphic consists of a sequence of systems functions and system data
interfaces to ensure that each user and system component has the information it needs, at the right time, to
perform its assigned functionality.
The Information / Control Flow Graphic(s) have several uses from an overall solution perspective:
• Supporting identification of functional system requirements
• Relating user and system functions across a task
• Developing a clear description of the necessary data flows that are input (consumed) and output
(produced) by each activity
• Confirming that the functional connectivity is complete (i.e., that a resource’s required inputs are

23
all satisfied)
• Confirming that the functional decomposition is at the appropriate level of detail across the
solution.
Within a solution, the system architectures include many information / control flows. At the logical
solution level, it is only necessary to define an Information / Control Flow Graphic that relates to
mandatory user / organization needs, and that shows interactions across multiple systems to verify that
defined system performance is achievable.
4.4.1 Content
The Information / Control Flow Graphic content is based on the System Function Graphic, Systems
Interface Graphic, Business Procedure Graphic, and related system architecture content. The Information
/ Control Flow Graphic provides detailed information regarding:
• System function interrelationships. This could be described simply as a name on an arrow
representing data transmission between system functions.
• Rule logic, acting as controls that change flow operation (delays, change of priority, alternative
paths, transaction flow termination, etc.).
• System performance data to confirm overall end-to-end performance across systems within the
solution.
• User performance related to the flow (e.g., thinking time after receipt of information before next
step initiation).
The Information / Control Flow Graphic depicts the complete end-to-end interrelationships of the system
functions and shows the desired result related to organizations, stakeholders, users, and/or roles. The
program will use the Information / Control Flow Graphic to support analyses related to identifying user
roles, identifying process inefficiencies, evaluating outputs for alignment with goal achievement,
supporting solution requirements analysis, and understanding organizational responsibilities.
4.4.2 Example
Figure 16 is a general example of an Information / Control Flow Graphic. Within the graphic there will be
a clear mapping to the Solution Function Graphic content showing which functionality is being used
within the flow. In addition, there will be a clear mapping to the Interface Graphic showing which
interfaces are used. These mappings support verifying the end-to-end flow functionally fulfilling the
specific user and organization needs. The inclusion of performance data would allow verification of
defined technical performance parameters. Last, although not shown in this example, rule-based controls
would be shown with clear mapping to related documentation.

24
Figure 16. Information / Control Flow Example
Just as in all the graphics, there are many ways to depict an Information /Control Flow Graphic,
depending on the standard used. An overall guiding principle is that the Information / Control Flow
Graphic should be displayed in a similar manner to other graphics or alternatively in the standard that the
program is using for related systems architecture-level graphics.
4.5 Integrated Design Graphic
The Integrated Design Graphic reflects continuing analysis of how to structure the solution to meet
agency business/mission needs. It enables cross-program business and technical communications,
allowing all to see how what they are working on or deciding impacts other points of the solution. These
architectural discussions include such topics as interfaces, performance, function allocation, and software
product use. The program develops the graphic to support a common understanding of particular system-
level operational issues as well as common testing approaches across the various components. The
graphic is updated to reflect emerging issues as well as resolved issues.
The Integrated Design Graphic bridges the Logical Solution Architecture to related system architectures
and to the Physical Solution Architecture. The overall Logical Solution Architecture may comprise
multiple structural components, each developed by a different team on schedules that differ. While
different teams are designing and developing each component separately, it is important to document the
solution architecture as a whole to support integration testing to ensure that the solution meets the desired
behaviors based on the solution’s functional and non-functional requirements. The integrated design view
enables the various component developers to discuss the interactions of their respective development and
test approaches to ensure achievement of the associated broad capabilities.
4.5.1 Content
There is no standard content for this graphic, as the content and its depiction reflect each program’s
specific architecture. The following are general guidelines for the graphic content:

25
• Structure the graphic to show the content of the Solution Concept Graphic and the Interface
Graphic.
• Depict the entire Solution Architecture so the various development teams can see their respective
interoperability.
• As solution component system-level physical architectures are defined, include the data center or
cloud operating environments and network interconnections.
• Include all technical discussions having architectural impacts. Doing so may require a mixture of
conceptual, logical, and physical depictions. This supports the program being able to see direct
and indirect impacts of technical decisions.
Generally, this graphic is a large wall graphic, enabling everyone on the program to see what they are
working on and how it relates to others’ efforts. The program should be encouraged to write and make
corrections on the graphic, which the Solution Architect will incorporate into the next version.
4.5.2 Example
Figure 17 shows an integrated design view of a solution, identifying the major logical and some physical
components of the solution. The arrows indicate information flows between users and the solution
components, among the major system components, and between the solution and external systems.
Figure 17. Integrated Design Graphic Example

26
4.6 Subsequent SELC Activity Dependencies
The following systems engineering data, organized by major SELC activities, is dependent upon the
Logical Solution Architecture data:
• Planning
o Systems Engineering Plan
o Test Execution Master Plan
• Requirements Definition
o Functional requirements
o Non-functional requirements
o Conceptual data model
o Updated Conceptual Solution Architecture
• Design
o System-level architectures
o Physical Solution Architecture
• Development
o Updated system-level architectures
o Updated Physical Solution Architecture

27
5 Physical Solution Architecture Description The Physical Solution Architecture represents the physical reality of the solution as it moves from design
through development, test, and implementation. The final update of this graphic is made after all
software/hardware/network implementations and any organizational changes required to fully implement
the solution are complete.
The Physical Solution Architecture describes the detailed as-built architecture for the operational system,
including specific software and hardware components and their mappings and interconnections necessary
to implement the major components within the solution. The architecture also identifies network and
control devices used to interconnect all hardware components of the solution and connect the solution to
external information sources for, and users of, the solution. The Physical Solution Architecture
description enables traceability of all contents shown in the Logical Solution Architecture to content in
the Physical Solution Architecture.
Five graphics should be developed at a minimum, as shown in Figure 18.
Figure 18. Physical Solution Architecture
As the system moves toward full operational capability, the program will use the Physical Solution
Architecture to analyze potential architecture modifications resulting from changes in operational
processes, functions, software capabilities, network upgrades, hardware (e.g., mobility devices), and
external demands for data within the solution.
The Physical Solution Architecture synthesizes and integrates the subordinate physical system
architectures, and the five graphics relate to specific graphics developed as part of each subordinate
physical system architecture.
The following sections describe these graphics. While they are required, the content type, depth, and
formality should be tailored to address key performance parameters, technical performance parameters,
and requirements, regardless of the methodology (agile, waterfall, or hybrid) the program is following.
5.1 Physical Business Process Graphic
The Physical Business Process Graphic shows the physical components (such as hardware, software, and
network) that support execution of the procedures (or sub-processes) shown in the Business Procedure
Graphic. The Physical Business Process Graphic provides a user activity perspective of the as-
implemented solution’s specific business functional capabilities to:
• Enable management to identify enhancements to operations
• Support validation that the overall solution satisfies agency mission needs
• Show ownership and responsibilities of each physical process
• Support various analyses related to authorized users, identifying physical process inefficiencies,
evaluating information artifacts for alignment with goal achievement, supporting solution
requirements validation, and understanding organizational responsibilities.

28
The Physical Business Process Graphic shows sequential flow of control between physical activities, the
events that trigger the activities, the data involved, and results from completion of a process. The graphic
may utilize swim lane techniques to represent as-implemented ownership and realization of process steps.
5.1.1 Content
The Physical Business Process Graphic is a depiction of key business activities via defined relations in a
process flow format with supporting descriptive information. The Physical Business Process Graphic
contains:
• Definitions of specific actual organizations, stakeholders, and users.
• Definitions of each business activity to identify clearly all activities within the solution and
eliminate overlap within activities.
• Definitions of information artifacts used within the business context.
• Definitions of activity interrelationships. This could be simply that they are related, directed flow
(arrow) representing sequence, or information artifact transmission between them.
• Definitions of any controls or event triggers.
• Depiction of the interrelationships of the activities via a business graphics(s) that additionally
includes organizations, stakeholders, and users.
This research recommends that Solution Architects use the standards-based workflow charting techniques
used within the related system architecture development activities to support collaboration among the
program teams and verification of the solution/system designs. Standards may be data flow diagraming,
BPMN, IDEF, or the UML.
5.1.2 Example
There are many ways to depict a Physical Business Process Graphic. An overall guiding principle is that
the Physical Business Process Graphic communicates the following elements to specific users, their
organizations, and system architects:
• Physical locations where functions are performed
• Physical components on which software is executing
• Physical information data packet being transmitted between related locations or components
• Physical data repositories accessed
• Specific users by organization name
• Annotations explaining what is happening.
Figure 19 is an example of a Physical Business Process Graphic.

29
Figure 19. Physical Business Process Graphic Example
5.2 Component Software Graphic
The purpose of the Component Software Graphic is to convey an integrated presentation of the software
applications / products used to implement the solution components comprising the entire solution. The
software applications / products may be open source, COTS or GOTS products, or custom code. The
Component Software Graphic corresponds to the System Function Graphic tiered model and shows the
software applications / products implementing the component functionality in a tiered view structure. The
tiered view is useful for understanding common software products across the architecture to identify
duplication and needless complexity within the solution’s physical architecture.
5.2.1 Content
The Component Software Graphic reflects the fundamental organization of a set of software
implementing the components within the solution. The Component Software Graphic is based on the
System Function Graphic and the Physical Infrastructure Graphic, and contains:
• Definitions of each software application / product depicted within a component on the Physical
Infrastructure Graphic.
• Depiction of the software application / product along with specific users, organizations, and
arrows related to all defined interactions. The program will use the Component Software Graphic
to support analyses related to identifying alternative products.
• Mapping to System Function Graphic content. This supports the solution fulfilling the specific
user and organization functional needs.
During Design and Implementation, the Component Software Graphic plays a particularly important role
in tracing system function requirements to the architectural elements associated with fulfilling the
requirements. The Solution Architect will update the system functional information during SELC Design
and Implementation activities to generate the as-built detailed system functional content of the Physical

30
SA.
5.2.2 Example
Figure 20 is an example of a Component Software Graphic. For consistency and ease of understanding,
the layout of the graphic is based on the System Function Graphic. This graphic shows the software
products underlining the physical architecture. This allows “seeing” things like common usage to simplify
the architecture, product interoperability issues among products, and potential architecture reliability,
maintainability, availability, and adaptability improvements.
Figure 20. Component Software Graphic Example
5.3 Physical Infrastructure Graphic
The Physical Infrastructure Graphic addresses the physical construction and relationships among the
major components within the solution. The graphic links the Logical Solution Architecture and the
Physical Solution Architecture in terms of their major components. It also summarizes related supporting
components, such as access services and audit services that may be supported by enterprise services
external to the solution.
The Physical Infrastructure Graphic addresses the linkage between physical software/hardware
components comprising the solution and functionality described in the Physical Business Process
Graphic. The Physical Infrastructure Graphic identifies the transformation of an operational need into a
purposeful action performed by a specific organization using a specific system application / product
within the solution. The Physical Infrastructure Graphic includes supporting the:

31
• Tracing of functional system requirements to software applications / products
• Identification of redundancies and overlaps among software products.
Note that lines (not arrows) are used on the graphic to show the key relations among components. The
lines are not described on the Physical Infrastructure Graphic but within the Solution Interfaces Graphic.
Also, physical infrastructure content is sometimes shown in a matrix form within related system
architectures.
5.3.1 Content
The Physical Infrastructure Graphic reflects the fundamental organization of software / hardware within
the major components of the solution. The Physical Infrastructure Graphic contains:
• Detailed definitions of each solution physical component.
• Depiction of the solution physical component and lines defining a relation between components.
The program will use the Physical Infrastructure Graphic to support detailing the test and
production environment needed to ensure successful operations.
• A clear mapping to the Physical Interfaces Graphic. This supports the solution fulfilling the
specific behavioral and performance requirements.
The Physical Infrastructure Graphic considers both the component software that it directly supports as
well as the system processes that execute around it.
5.3.2 Example
Figure 21 is an example of a Physical Infrastructure Graphic. This graphic shows that the physical
solution is operating within two environments: a customer-specific private cloud from a public cloud
vendor and a specific environment under Infrastructure as a Service procured from DHS’ main data center
called DC1. Shown are the relations among the four main architecture components: the case management
application in some COTS product, the Oracle-based Data Warehouse and Operational Data Store (ODS),
and the ESB in Apache Synapse. In addition, two support services are shown: an Access Service
permitting access to the DHS network and some additional Case Management Application (CMA)
services supporting connection and data retrieval between the public cloud and DC1.
This graphic permits discussing and understanding the relations and non-relations among the components
and possible interoperability issues. For example, the ODS is not using the ESB to retrieve bulk data from
external systems, as indicated by the lack of a line between the two and a line from the ODS to the other
DHS systems block. An interoperability issue may be the size of the physical network connection
(provided by a communications vendor) supporting the dedicated connection between the public cloud
vendor’s data center and DHS’ DC1 data center.

32
Figure 21. Physical Infrastructure Graphic Example
5.4 Physical Solution Interface Graphic
The Physical Solution Interface Graphic addresses the physical construction of the interfaces among users
within the solution, as well as the interfaces among the major components within the solution. The
graphic links the Interface Graphic and the Information Control / Flow Graphic from the Logical Solution
Architecture to the physical instantiation of the interfaces for the major solution components.
The Physical Solution Interface Graphic has several uses from an overall solution perspective:
• Detailing physical specification of solution interfaces.
• Implementing a standard protocol for network messaging.
• Investigating alternative physical interface options.
• Informing physical network performance analyses. This performance analysis shows potential
network bottlenecks within the supporting physical network.
This research recommends that Solution Architects describe the physical interfaces using the standards
within the related system architecture development activities to support collaboration among the program
teams and verification of the solution/system implementation.
5.4.1 Content
The Physical Solution Interface Graphic shows a precise specification of a connection between
organizations, users, and solution components. It describes in specific physical terms the related system
architecture interface descriptions of the Logical Solution Architecture Interface Graphic (see Section
4.3). It reflects the fundamental organization of message exchanges among the major components of the
solution. The Physical Solution Interface Graphic contains:
• Descriptions of each physical interface depicted on the graphic.
• Descriptions of each message type detailing the sender, information exchanged, and receiver.
• Descriptions from a physical implementation perspective of the content, structure, and protocol of
message packets moved across the related network components.
• Descriptions of the interfaces of users with the solution, the interactions among the major
components within the solution, and interface to systems / organizations external to the solution.
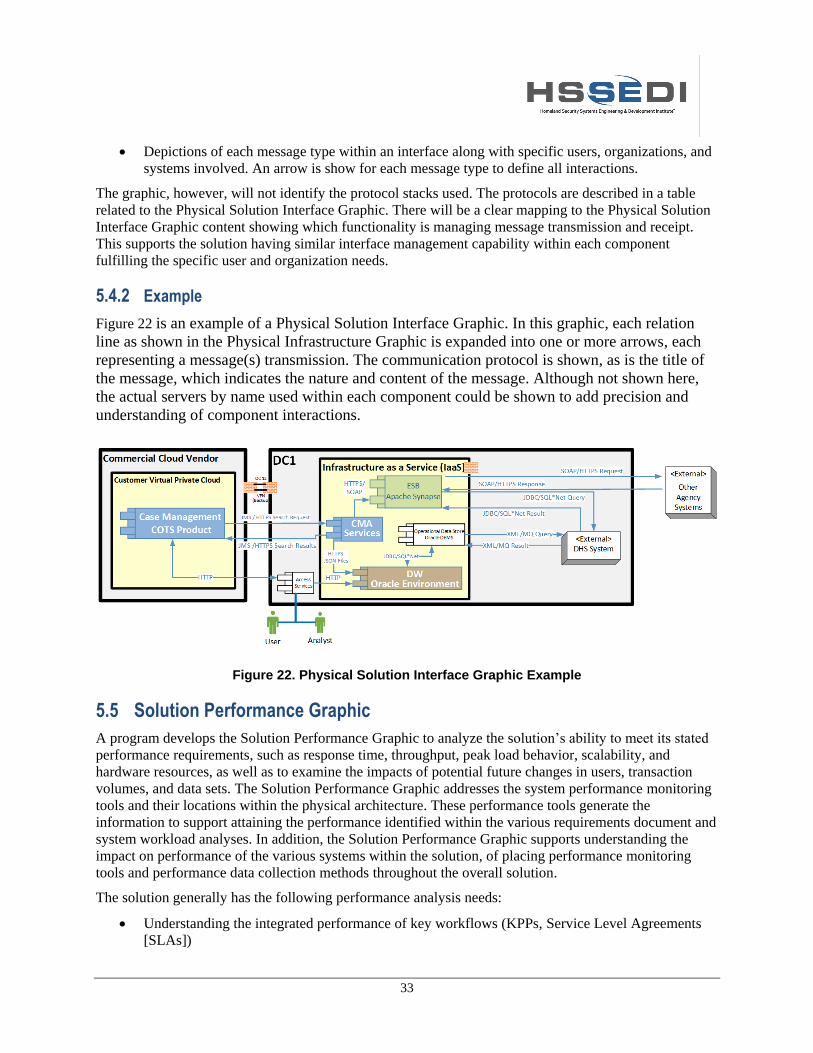
33
• Depictions of each message type within an interface along with specific users, organizations, and
systems involved. An arrow is show for each message type to define all interactions.
The graphic, however, will not identify the protocol stacks used. The protocols are described in a table
related to the Physical Solution Interface Graphic. There will be a clear mapping to the Physical Solution
Interface Graphic content showing which functionality is managing message transmission and receipt.
This supports the solution having similar interface management capability within each component
fulfilling the specific user and organization needs.
5.4.2 Example
Figure 22 is an example of a Physical Solution Interface Graphic. In this graphic, each relation
line as shown in the Physical Infrastructure Graphic is expanded into one or more arrows, each
representing a message(s) transmission. The communication protocol is shown, as is the title of
the message, which indicates the nature and content of the message. Although not shown here,
the actual servers by name used within each component could be shown to add precision and
understanding of component interactions.
Figure 22. Physical Solution Interface Graphic Example
5.5 Solution Performance Graphic
A program develops the Solution Performance Graphic to analyze the solution’s ability to meet its stated
performance requirements, such as response time, throughput, peak load behavior, scalability, and
hardware resources, as well as to examine the impacts of potential future changes in users, transaction
volumes, and data sets. The Solution Performance Graphic addresses the system performance monitoring
tools and their locations within the physical architecture. These performance tools generate the
information to support attaining the performance identified within the various requirements document and
system workload analyses. In addition, the Solution Performance Graphic supports understanding the
impact on performance of the various systems within the solution, of placing performance monitoring
tools and performance data collection methods throughout the overall solution.
The solution generally has the following performance analysis needs:
• Understanding the integrated performance of key workflows (KPPs, Service Level Agreements
[SLAs])

34
• Identifying over-/under-utilized sub-components (hardware, software, and network)
• Determining solution/system performance impacts of workload changes (number of users, user
activities)
• Analyzing solution performance impacts of architecture changes.
As the solution evolves toward full operating capability and beyond, architecture changes resulting from
changes in functionality, software components, network topology, and emerging external demands will
affect solution performance.
5.5.1 Content
The Solution Performance Graphic reflects the fundamental organization of performance monitoring
software / hardware within the major components of the solution. The Solution Performance Graphic
contains:
• Descriptions of each performance monitoring tool and associated monitoring mechanism inserted
into the architecture.
• Descriptions of performance information to be collected and the use of the information.
• A clear mapping of performance information types to key performance parameters,
system/network-level technical performance parameters, and solution SLAs. This supports the
program being able to fully test overall solution performance and fulfill the specific behavioral
and performance requirements.
• A clear mapping of performance information to associated system functional requirements. This
supports analyzing impacts of architectural changes resulting from new requirements.
• A graphical depiction of the performance measurement software/hardware within the overall
solution architecture. A good technique for this is to overlay the performance measurement
software/hardware onto the Physical Solution Interface Graphic to show the additional interfaces
needed for the performance architecture.
The Solution Performance Graphic considers both the component software/hardware performance that it
directly monitors and the solution processes performance that the technology performance enables.
5.5.2 Example
Figure 23 is an example of a Solution Performance Graphic. This graphic should be based on either the
Physical Infrastructure Graphic or the Physical Solution Interface Graphic to facilitate understanding
across the program. This example is based on the Physical Infrastructure Graphic. What is added into
either graphic are the system performance management application, the associated performance
monitoring applications (PMAs) resident within each component, and the messaging (dashed arrows).
The PMAs monitor the component’s performance and transmit the information to the performance
application for synthesis to understand the overall performance. This graphic helps to illustrate the
amount of monitoring and its placement. Performance monitoring itself impacts component performance
and thus needs to be taken into consideration in designing the component. Additionally, the performance
capability needs to be designed within the SA so it can be used to determine the effects of single or
combinations of architectural changes. This graphic should be developed at a detail level necessary to see
and understand performance monitoring. Thus, not shown in the example (but could be added), are exact

35
hardware configurations, software applications, network configuration, and the precise nature of network
connections.
Figure 23. Solution Performance Graphic Example
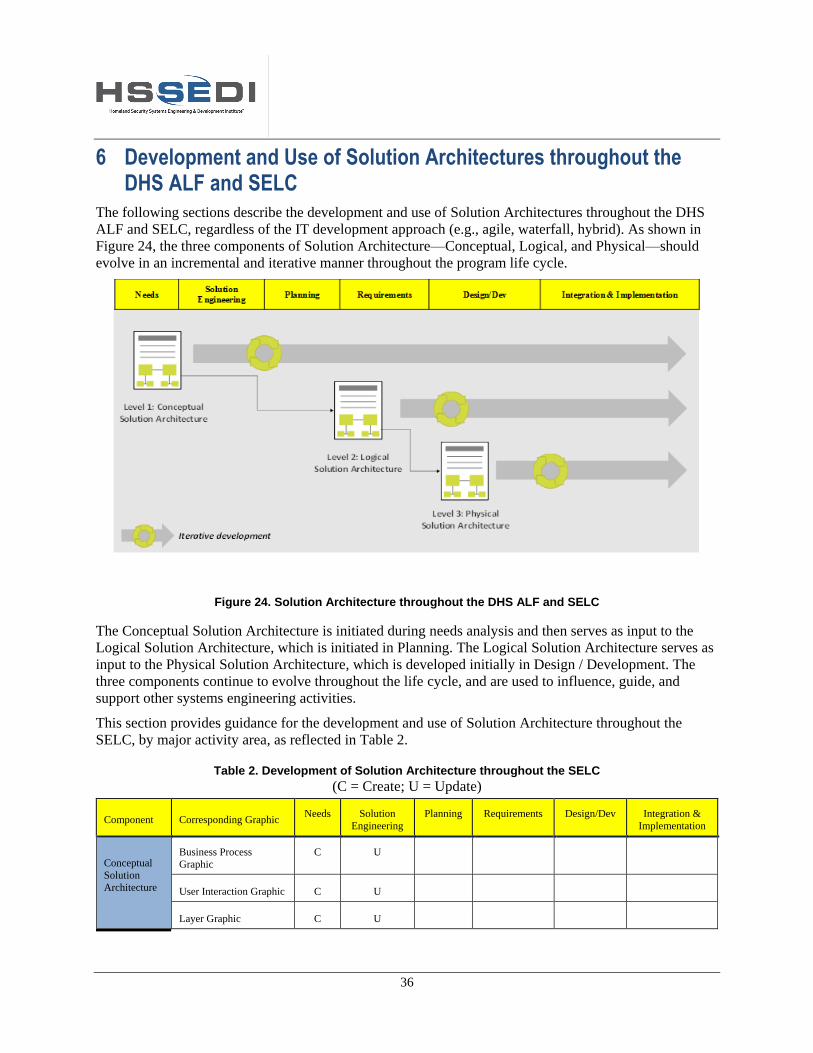
36
6 Development and Use of Solution Architectures throughout the DHS ALF and SELC
The following sections describe the development and use of Solution Architectures throughout the DHS
ALF and SELC, regardless of the IT development approach (e.g., agile, waterfall, hybrid). As shown in
Figure 24, the three components of Solution Architecture—Conceptual, Logical, and Physical—should
evolve in an incremental and iterative manner throughout the program life cycle.
Figure 24. Solution Architecture throughout the DHS ALF and SELC
The Conceptual Solution Architecture is initiated during needs analysis and then serves as input to the
Logical Solution Architecture, which is initiated in Planning. The Logical Solution Architecture serves as
input to the Physical Solution Architecture, which is developed initially in Design / Development. The
three components continue to evolve throughout the life cycle, and are used to influence, guide, and
support other systems engineering activities.
This section provides guidance for the development and use of Solution Architecture throughout the
SELC, by major activity area, as reflected in Table 2.
Table 2. Development of Solution Architecture throughout the SELC
(C = Create; U = Update)
Component Corresponding Graphic Needs Solution
Engineering
Planning Requirements Design/Dev Integration &
Implementation
Conceptual
Solution
Architecture
Business Process
Graphic
C U
User Interaction Graphic C U
Layer Graphic C U

37
Component Corresponding Graphic Needs Solution
Engineering
Planning Requirements Design/Dev Integration &
Implementation
Solution Concept
Graphic
C U
Logical
Solution
Architecture
Business Procedure
Graphic(s)
C U
System Function
Graphic
C U
Interface Graphic C U
Information / Control
Flow Graphic(s)
C U
Integrated Design
Graphic
C U
Physical
Solution
Architecture
Physical Business
Process Graphic
C U
Component Software
Graphic
C U
Physical Infrastructure
Graphic
C U
Physical Solutions
Interfaces Graphic
C U
Solution Performance
Graphic
C U
6.1 Needs Analysis
During Needs Analysis, the Solution Architect should create an initial, stand-alone Conceptual Solution
Architecture that contains “fit-for-purpose” or “just enough” information to codify a potential solution
and support understanding of rapid and incremental development and deployment approaches (i.e.,
adequate for agile development and risk mitigation).
6.1.1 Create Initial Conceptual Solution Architecture
The Solution Architect should create an initial version of the Conceptual Solution Architecture, which
comprises the following four graphics, as described in Section 3:
• Business Process Graphic – Shows the abstract business context for the solution and how the
solution supports the business context
• User Interaction Graphic – Shows the users and their interactions with the solution
• Layer Graphic – Delineates business functionality and technology elements
• Solution Concept Graphic – Shows each organization, stakeholder, user(s), system(s), and
technologies within the solution and their respective interactions.
These graphics show what new capabilities are needed to fill the gaps, and how users, organizations,
systems, and technologies would interact within the new solution. The initial Conceptual Solution
Architecture artifact provides a basis for discussion and approval among DHS management, the LTA, the
38
LBA, and IT program management. It also supports solution discovery discussions among technical staff
codifying the general nature of the solution. It will have content sufficient to support the first Acquisition
Decision Event (ADE-1), and serve as input to the Logical Solution Architecture developed in
Requirements Definition.
INPUTS
The following artifacts serve as input to—and will be developed concurrently with—the initial
Conceptual Solution Architecture:
• Mission Needs Statement
• Initial operational requirements
• Preliminary Concept of Operations (P-CONOPS) data
• Enterprise Architecture Business Reference Model
ACTIVITIES
The following activities will create the initial Conceptual Solution Architecture:
• Identify and describe the operational functions and capabilities of the major components/building
blocks of the target solution
• Evolve the architecture’s functional framework and development principles from the P-CONOPS
• Identify and illustrate the interrelationships among the major components/building blocks and
generally define their interoperability
• Identify all stakeholders, users, organizations, and business processes associated with the
solution, and define the interoperability among them
• Scope the proposed capabilities against the DHS enterprise architecture
• Produce initial versions of the four graphics:
o Business Process
o Layer
o User Interaction
o Solution Concept
• Document traceability among the initial Conceptual Solution Architecture, P-CONOPS,
Capability Development Plan, and any preliminary operational requirements.
OUTPUT
The output of these activities is the initial Conceptual Solution Architecture along with supporting
definitional content data. The initial Conceptual Solution Architecture is used to communicate to IT
program and DHS management the general nature of the potential solution.
6.2 Solution Engineering
During Solution Engineering activities, the Solution Architect updates the initial Conceptual Solution
Architecture developing during Needs Analysis.
6.2.1 Update Conceptual Solution Architecture
Building on the initial Conceptual Solution Architecture, the updated Conceptual Solution Architecture
identifies relevant stakeholders, users, organizations, and business processes; defines expected
performance improvements associated with the solution; and contains additional information needed to
support solution discovery discussions among business and technical staff. The new output consists of

39
several graphics under a “fit-for-purpose” basis. It is developed incrementally and concurrently with the
other solution engineering activities.
The updated Conceptual Solution Architecture should be treated as a key SELC artifact, and is approved
in ADE-2a as the targeted solution. The updated Conceptual SA supports focused market research, cost
estimates, and the Analysis of Alternatives (AoA), and serves as input to the Logical Solution
Architecture developed in Requirements Definition. In addition, the updated Conceptual Solution
Architecture becomes a valuable tool in communicating the general nature of the solution to a wide
audience.
INPUTS
The following are required to develop the updated Conceptual Solution Architecture:
• Initial Conceptual Solution Architecture, including Business Process Graphic, User Interaction
Graphic, Layer Graphic, and Solution Concept Graphic
• CONOPS
• Operational Requirements
• Initial Functional Requirements
• Technology Readiness Assessments
ACTIVITIES
The following activities will create the updated Conceptual Solution Architecture:
• Update the four graphics developed during Needs Analysis:
o Add details to the Solution Concept Graphic covering each operational requirement.
Create a version of the graphic with indicators for which architecture component fulfills a
particular operational requirement.
o For each building block component within the Solution Concept Graphic, update the
Layer Graphic by associating the needed functionality to fill gaps with potential system
functions.
o Update the User Interaction Graphic to show detail about interactions across the solution
boundary, nature of user interfaces, and organizational operational changes.
o Develop alternative Solution Concept Graphics, based on market research and technology
investigations, showing possible alternative implementations of the solution (e.g., COTS
products, open source products, cloud computing offerings, and mobile computing
capabilities).
• Support AoA, trade-off studies, and market research to refine and augment the preferred solution
alternative.
• Analyze the current preferred Solution Architecture to facilitate its implementation under the
systems development methodology being used (e.g., agile, spiral, waterfall, hybrid).
• Ensure traceability among the content data within the Conceptual Solution Architecture,
CONOPS, operational requirements, and costing elements.
• Assess the use of a tool environment supporting more formal architecture development and
traceability.
OUTPUTS
• Full content data of the Conceptual Solution Architecture sufficient to support an ADE 2a
decision and subsequent systems engineering activities.

40
6.3 Planning
The Conceptual Solution Architecture that was updated during Solution Engineering serves as input to
several key Planning activities, including defining technical scope, identifying applicable design
considerations, developing the test and evaluation master plan, and developing the overall program
management plan. As needed, the Solution Architect should update the Conceptual Solution Architecture
based on additional information acquired during Planning activities.
6.4 Requirements Definition
During Requirements Definition, the Solution Architect develops the initial Logical Solution
Architecture.
6.4.1 Develop Initial Logical Solution Architecture
The Logical Solution Architecture is the bridge between the Conceptual Solution Architecture and the
Physical Solution Architecture. The Logical Solution Architecture provides key system architecture
components and their interrelationships, major system functions, and information flows. The Logical
Solution Architecture consists of five graphics:
• Business Procedure Graphic(s) - Detailed data flow(s) showing specific inputs, outputs, functions,
decisions, alternate flows
• System Function Graphic - Shows the allocation of application, data, and messaging functions in
the conceptual layer graphic to elements within the building block graphic
• Interface Graphic - Shows logical-level details of all interactions among the stakeholder, users,
systems, and technology
• Information / Control Flow Graphic(s) - Details how information is flowing and controlled
among the logical solution elements
• Integrated Design Graphic - A logical-level solution overview showing some physical details
covering all solution elements in order to understand key technical issues.
INPUT
The following are required to develop the initial Logical Solution Architecture:
• Conceptual Solution Architecture, including Business Process Graphic, User Interaction Graphic,
Layer Graphic, and Solution Concept Graphic
• Functional and Non-Functional Requirements
• Functional Analysis Artifact
• Conceptual Data Model
ACTIVITIES
The following activities will create the initial Logical Solution Architecture:
• Using information from the Business Process Graphic, develop an initial version of the Business
Procedure Graphic. The graphic will show sequential flow of activities, the events that trigger the
activities, the data involved, and the results from completion of a procedure.
• Produce the initial System Function Graphic, which maps system functions and users to the
business process activities.
• Develop the initial Interface Graphic, which depicts the interactions among and between the
major components of the solution, including users, systems, and organizations.

41
• Develop the initial Information / Control Flow graphic, showing the series of interactions
necessary to generate the desired result from the solution.
OUTPUT
The output of these activities is the initial Logical Solution Architecture along with supporting
definitional content data.
6.5 Design and Development
In design and development, the Solution Architect updates the Logical Solution Architecture and creates
an initial Physical Solution Architecture.
6.5.1 Update Logical Solution Architecture
The Solution Architect updates the initial Logical Solution Architecture comprising five graphics:
• Business Procedure Graphic
• System Function Graphic
• Interface Graphic
• Information / Control Flow Graphic
• Integrated Design Graphic
INPUT
The following are required to develop the initial Logical Solution Architecture:
• Initial Logical Solution Architecture
• Updated Functional and Non-Functional Requirements
• Updated Functional Analysis Artifact
• Conceptual Data Model
ACTIVITIES
The following activities will create the initial Logical Solution Architecture:
• Update the Business Procedure Graphic.
• Update the System Function Graphic based on additional information defined in the business
process activities.
• Update the initial Interface Graphic, which depicts the interactions among and between the major
components of the solution, including users, systems, and organizations.
• Update the initial Information / Control Flow graphic, showing the series of interactions
necessary to generate the desired result from the solution.
OUTPUT
The result is an updated Logical Solution Architecture with supporting definitional content data.
6.5.2 Create Physical Solution Architecture
The Solution Architect should create an initial version of the Physical Solution Architecture, as described
in Section 5. This artifact is comprised of the following five graphics:
• Physical Business Process Graphic - Shows the physical flows of material objects (e.g.,
documents) among physical locations and details the operations performed at the location.
42
• Component Software Graphic - Shows the system products of the major components and is useful
for understanding common system products across the architecture to identify duplication.
• Physical Infrastructure Graphic - Shows the physical construction and relationships among the
major components within the Solution.
• Physical Solution Interface Graphic - Shows the physical interface construction of the interfaces
among users within the solution as well as the interfaces among the major components within the
solution.
• Solution Performance Graphic - Shows the solution’s ability to meet its stated performance
requirements such as response time, throughput, peak load behavior, scalability, and hardware
resources, as well as examining the impacts of potential future changes in users, transaction
volumes, and data sets.
The Physical Solution Architecture describes the detailed as-built architecture for the operational system,
including specific software and hardware components and their mappings and interconnections necessary
to implement the major components within the solution. The architecture also identifies network and
control devices used to interconnect all hardware components of the solution and connect the solution to
external information sources for, and users of, the solution.
INPUT
The following artifacts serve as input to the development of the initial Physical Solution Architecture:
• Updated Conceptual and Logical Solution Architectures
• Initial design documents, including data architecture, SLAs, site development plan, and system-
level requirements.
ACTIVITIES
The following activities will create the initial Physical Solution Architecture:
• Create an initial version of the Physical Business Process Graphic, based on the updated Business
Procedure Graphic. This graphic is a more detailed depiction of key business activities and the
sequential flow of data, information, control, and activities throughout the process.
• Develop the Component Software Graphic, which conveys an integrated presentation of the
software products and applications used to implement the solution components.
• Develop the Physical Infrastructure Graphic showing the linkage between the software and
hardware components and the functionality of the system.
• Develop the Physical Solution Interface Graphic to address the physical construction of the
interfaces.
• Develop the Solution Performance Graphic to illustrate the system performance monitoring tools
and their locations within the physical architecture.
OUTPUT
The output of these activities is the initial Physical Solution Architecture along with supporting
definitional content data. This artifact will serve as input to software development, including finalizing
subsystem specifications, building code, or configuring the system.
The program will also use the Physical Solution Architecture to analyze potential architecture
modifications resulting from changes in operational processes, functions, software capabilities, network
upgrades, hardware (e.g., mobility devices), and external demands for data within the solution. The
Physical Solution Architecture also enables traceability of all contents shown in the Logical Solution

43
Architecture to content in the Physical Solution Architecture.
6.6 Integration and Implementation
During Integration and Implementation, the Solution Architect updates the Physical Solution
Architecture.
6.6.1 Update Physical Solution Architecture
The Solution Architect should update the initial version of the Physical Solution Architecture.
INPUT
The following artifacts serve as input to the development of the updated Physical Solution Architecture:
• Updated Conceptual and Logical Solution Architectures
• Initial Physical Solution Architecture
• Final design documents, test and evaluation plans, integration plans, and overall system
architecture.
ACTIVITIES
The following activities will create the initial Physical Solution Architecture:
• Update the five graphics based on additional information and details:
o Physical Business Process Graphic
o Component Software Graphic
o Physical Infrastructure Graphic
o Physical Solution Interface Graphic
o Solution Performance Graphic
OUTPUT
The output of these activities is the updated Physical Solution Architecture along with supporting
definitional content data. The program will use the Physical Solution Architecture to analyze potential
architecture modifications resulting from changes in operational processes, functions, software
capabilities, network upgrades, hardware (e.g., mobility devices), and external demands for data within
the solution.

44
Appendix A Acronyms
ADE Acquisition Development Event
ALF Acquisition Lifecycle Framework
AoA Analysis of Alternatives
BPMN Business Process Modeling Notation
CONOPS Concept of Operations
COTS Commercial off-the-Shelf
DHS Department of Homeland Security
EBMO Enterprise Business Management Office
ESB Enterprise Service Bus
FFRDC Federally Funded Research and Development Center
GOTS Government off-the-Shelf
HSSEDI Homeland Security Systems Engineering & Development Institute
IDEF Integration Definition for Function Modeling
IT Information Technology
KPP Key Performance Parameter
LBA Lead Business Authority
LTA Lead Technical Authority
ODS Operational Data Store
OMG Object Management Group
P-CONOPS Preliminary Concept of Operations
PMA Performance Monitoring Application
PMO Program Management Office
SA Solution Architecture
SELC Systems Engineering Life Cycle
SLA Service Level Agreement
UML Unified Modeling Language

45
Related Documents