This project has been funded with support from the European Commission. This publication reflects the views only of the author, and the Commission cannot be held responsible for any use which may be made of the information contained therein. Improving Proximity Responses for the Adaptation of Vocational Education and Training 2015-1-ES01-KA202-015976 Guide 2: HOW TO MONITOR LABOUR MARKET NEEDS TO PROACTIVELY ADAPT VET OFFER Coordinator Gema Oliva, Consorcio del Pacto territorial por el Empleo del Valle del Vinalopó, Elda, Alicante, Spain Collaborators Carola Dierich, Wisamar Bildungsgesellschaft gemeinnützige GmbH Belén García Jaramillo Consorcio del Pacto territorial por el Empleo del Valle del Vinalopó Graziano di Paola. Fondazione Giacomo Brodolini Marc Caballero. Notus . Barcelona Spain. Semiha ÖZKUL, Directorate of National Education Date of delivery 23.02.2017 Date of revision 14/03/2017 Version V6

Welcome message from author
This document is posted to help you gain knowledge. Please leave a comment to let me know what you think about it! Share it to your friends and learn new things together.
Transcript

This project has been funded with support from the European Commission. This publication reflects the views only of the author, and the Commission cannot be held responsible for any use which may be made of the information contained therein.
Improving Proximity Responses for the Adaptation of Vocational Education and Training
2015-1-ES01-KA202-015976
Guide 2:
HOW TO MONITOR LABOUR MARKET NEEDS TO
PROACTIVELY ADAPT VET OFFER
Coordinator Gema Oliva, Consorcio del Pacto territorial por el Empleo del Valle del Vinalopó, Elda, Alicante, Spain
Collaborators Carola Dierich, Wisamar Bildungsgesellschaft gemeinnützige GmbH Belén García Jaramillo Consorcio del Pacto territorial por el Empleo del Valle del Vinalopó Graziano di Paola. Fondazione Giacomo Brodolini Marc Caballero. Notus . Barcelona Spain. Semiha ÖZKUL, Directorate of National Education
Date of delivery 23.02.2017
Date of revision 14/03/2017
Version V6

2
Improving Proximity Responses for the Adaptation of Vocational Education and Training/ 2015-1-ES01-KA202-015976
INDEX
Introduction 3
Previous considerations 4
An overview of the process 6
Description 10
Step 1: Planning and Methodology 10
Step 2: Implementation 16
Step 3: Results 22
Step 4: Analysis, evaluation, report. 25
Checklist 29
To learn more about it 30

3
Improving Proximity Responses for the Adaptation of Vocational Education and Training/ 2015-1-ES01-KA202-015976
INTRODUCTION
This “How to Guide” has been developed in the framework of the Project “Improving
Proximity Responses for Vocational Education and Training – ImproVET” funded by
ERASMUS+, Key Action 2 under the contract 2015-1-ES01-KA202-015976.General information
on the project and an overview of the structure of the Intervention Model can be found in the
introduction part of the Intervention Model.
This is the How to Guide number 2 out of 4 within the Intervention Model. Each one of the
Intervention Model elements can be read separately, but partners strongly encourage the
reader to keep in mind its internal coherence as shown in the following diagram.
In this diagram, the How to Guide you are about to read has been highlighted in green.
Along the following pages this Guide will provide tools, methodologies and tips that will help
local agents involved in Vocational Education and Training, both from public and private
sectors, to monitor labour market needs that will enable them to reply to the following: the
kind of VET needed to be supported by public and private sectors, qualifications which are
required by the employers, the financial requirements to provide local VET and the financial
considerations by the public and private sectors, public and private sectors collaboration in C-
VET and the responsibilities of stakeholders for VET.
HowTo Guide
How to monitor labor
market needs of VET
How to design and
implement a Local VET
Plan
How to assess the local
impact of VET
Implementation Toolkit
Inspiring Practices
Case Studies
How to build a local
Partnership for VET

4
Improving Proximity Responses for the Adaptation of Vocational Education and Training/ 2015-1-ES01-KA202-015976
PREVIOUS CONSIDERATIONS
You accomplished the first step of developing a VET program by forming a partnership for
VET in your territory. In this process, you will have achieved the following items, among others:
- You have identified key agents for VET in your territory
- You have analysed the legal and administrative framework of VET in your country
- You have identified, in a participative way, the common objectives and concerns
shared by key agents on VET
To improve the provision of continuous vocational education and training (C-VET) in your
territory, first, you need to know the state of the art and the needs on C-VET in your territory.
Therefore, it is necessary to conduct a needs analysis.
Along with this guide, we are going to talk about How to monitor labour market needs in
order to proactively and successfully adapt the C-VET offer in a territory. Firstly, we will start
by explaining the concept of labour market needs.
In Spain, labour market means the set of relations between employers and people looking
for a salary working for others. (https://es.wikipedia.org/wiki/Mercado_de_trabajo).
Wikipedia supports this Spanish meaning including companies and people. In Great Britain,
the labour market is the supply of people in a particular country or area who are able and
willing to work. Cambridge dictionary, in its definition, only includes people
(http://dictionary.cambridge.org/es/diccionario/ingles/labour-market) In Collins dictionary
the definition is: When you talk about the labour market, you are referring to all the people
who are able to work and want jobs in a country or area, in relation to the number of jobs
there are available in that country or area. This definition includes people and number of jobs,
but not employers [business].
https://www.collinsdictionary.com/dictionary/english/labour-market COBUILD Advanced
English Dictionary. Copyright © HarperCollins Publishers
In view of the fact that several countries will use this guide, it is necessary to clarify how
we are going to use the ‘labour market’ concept in the guide. We will explain how and why
we will work on labour market needs.
Labour market needs is a broad term, which includes several factors and demands related
to companies and population. The area that concerns our project, that is to adapt the VET
offer to labour market needs, entitles us to focus on companies needs which means only
companies recruitment need sand C-VET training for the current workers in a company.

5
Improving Proximity Responses for the Adaptation of Vocational Education and Training/ 2015-1-ES01-KA202-015976
Concretely, we focus on skill shortages. Skill shortages are usually defined as instances when
the demand for a particular skill exceeds the supply of available people with that skill at market
clearing wage rates (Skill shortages and gaps in European enterprises. CEDEFOP 2015).The
reason why we focus only on companies skill needs is because we want to find out what is the
skills mismatch in the labour market, namely which skills are needed by employers and which
are not available in the labour market among persons looking for a job or looking for a
professional development in the company in which they already work. Once we find out these
skills needs, we will be able to find as well the real and not covered needs in the current C-VET
offer. Following the European Migration Network in the Spanish publication of 2015 called
“Determination of labour migration needs of third-country nationals in Spain”, we should
corroborate difficult coverage work positions in our territories if we want to really know our
work market needs. But not only that, we have to study current shortages in active companies’
workers. Thus we will not consider in this guide job offers for which there is already a
professional training in the territory adjusted to these demands. These job offers are perfectly
covered by existing C-VET.
The aim of this project is as its title describes: ‘Improving Proximity Responses for the
Adaptation of Vocational Education and Training’, especially regarding C-VET. Our goal is not
only to train the unemployed people but to detect the lack of skilled workers which are
demanded to cover the companies’ outstanding positions. This shortage of workers can be
solved either by hiring new workers or by re-training actual employees. This implies that their
lack of skills is due to the fact that they do not have access to professional training
programmes adjusted to their needs. By doing this, we cover companies’ needs and we
provide realistic opportunities in our territory to unemployed population and to employees
who are looking for a professional development in their career. This is our project intervention
field.

6
Improving Proximity Responses for the Adaptation of Vocational Education and Training/ 2015-1-ES01-KA202-015976
AN OVERVIEW OF THE PROCESS
As we are searching for specific demands linked to labour market needs, we will focus only
on companies’ needs. We spotlight these demands and compare them to the data gathered
from current companies recruitment needs. In particular, it is important to remark the job
positions, which cannot be covered in a territory because of a lack of qualified people due to
inexistent VET programs. We will acknowledge as well scenarios in which this VET training
exists but is not in line with the new recruitment needs of the companies. To understand our
points of view have a look at this visual example of UK commission for employment and skills:
https://youtu.be/z3wjrWyyH1c
We have to start by appointing the researcher from the established partnership and this
depends on the nature of the partners. If the partnership includes a Labour Agency, a Chamber
of Commerce or a Statistics Institute, the task of conducting a needs analysis can be allocated
to them as they are more experienced in the field of employment.
In order to get an effective local labour market needs analysis, we need to assess several
indicators in the territory (see fiche 1 in toolkit) and require to the local training and
employment agency the current C-VET offer list in the territory. This is a very important and
nuclear task in all the process. Depending on a proper selection of indicators, our needs
analysis would be more or less successful. By analysing these indicators abovementioned, we
can find out the framework of the C-VET offer in the territory. Therefore, that issue is
fundamental to choose the right partner. This partner should have a statistics and social
research and an employment portfolio to make an effective identification of indicators right
from the beginning.
Useful datasets are sometimes available on the website of official Statistic Institutes in the
territory or might be available through the official Labour Agency. For instance, in Spain every
three months, the National Employment office publishes a catalogue of jobs with difficult
coverage. Concerning job offers analysis, it is not important where find the data if it is a reliable
source. The search should be focussed on offers, which are vacant for a long time. In order to
detect the offers, which are unoccupied, a series of searches during a period of time must be
carried out. For example, we can establish to conduct during a period of three months a search
every week. This way, we obtain data about the market labour and the work positions
available, which is in fact updated information. The vacancies offers, which are not covered in
this period means the job offers which are always available and unfilled, are the most difficult
coverage jobs.
Besides, there are very interesting studies in Europe and all over the world, updated,
statistically tested and validated which can give a right orientation for starting a needs
7
Improving Proximity Responses for the Adaptation of Vocational Education and Training/ 2015-1-ES01-KA202-015976
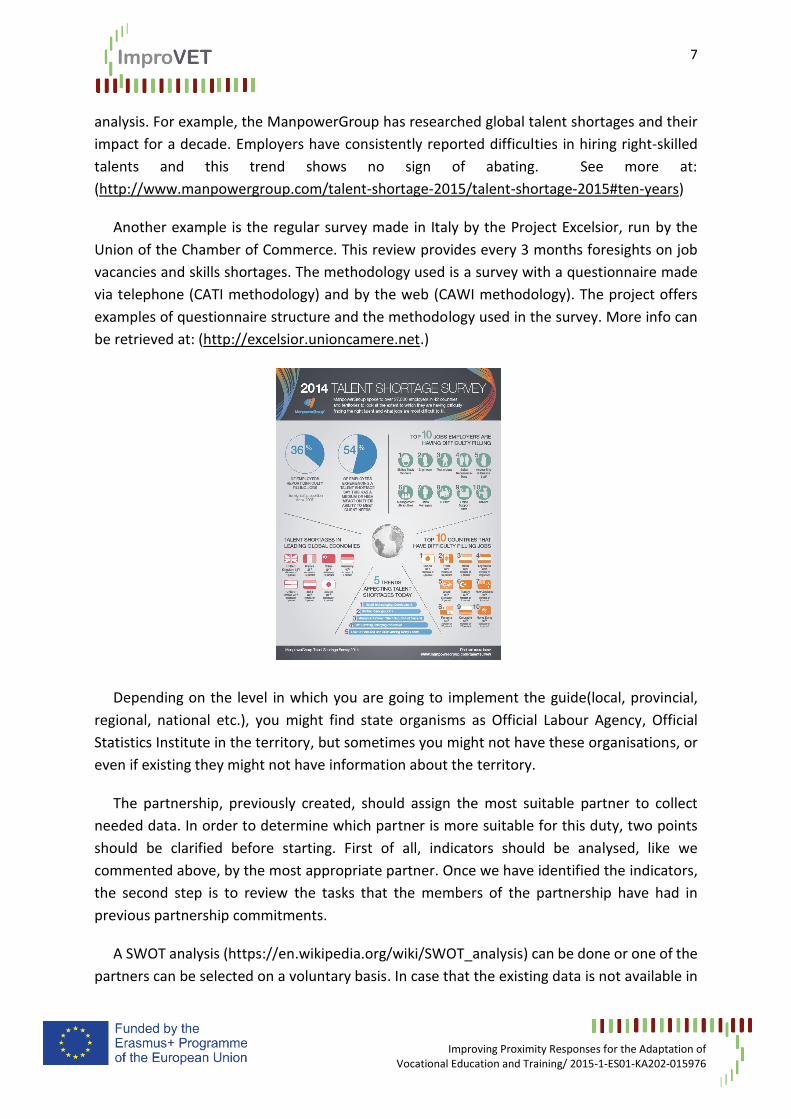
analysis. For example, the ManpowerGroup has researched global talent shortages and their
impact for a decade. Employers have consistently reported difficulties in hiring right-skilled
talents and this trend shows no sign of abating. See more at:
(http://www.manpowergroup.com/talent-shortage-2015/talent-shortage-2015#ten-years)
Another example is the regular survey made in Italy by the Project Excelsior, run by the
Union of the Chamber of Commerce. This review provides every 3 months foresights on job
vacancies and skills shortages. The methodology used is a survey with a questionnaire made
via telephone (CATI methodology) and by the web (CAWI methodology). The project offers
examples of questionnaire structure and the methodology used in the survey. More info can
be retrieved at: (http://excelsior.unioncamere.net.)
Depending on the level in which you are going to implement the guide(local, provincial,
regional, national etc.), you might find state organisms as Official Labour Agency, Official
Statistics Institute in the territory, but sometimes you might not have these organisations, or
even if existing they might not have information about the territory.
The partnership, previously created, should assign the most suitable partner to collect
needed data. In order to determine which partner is more suitable for this duty, two points
should be clarified before starting. First of all, indicators should be analysed, like we
commented above, by the most appropriate partner. Once we have identified the indicators,
the second step is to review the tasks that the members of the partnership have had in
previous partnership commitments.
A SWOT analysis (https://en.wikipedia.org/wiki/SWOT_analysis) can be done or one of the
partners can be selected on a voluntary basis. In case that the existing data is not available in

8
Improving Proximity Responses for the Adaptation of Vocational Education and Training/ 2015-1-ES01-KA202-015976
the territory, or previous research does not exist, it is very probable that you are implementing
the guides in a small territory. Thereby you should start from the initial stage: collecting data
directly from companies. For example, if you are going to implement in a small territory,
probably you will not find a state organism providing you data about difficult coverage jobs.
However, you have an advantage: the area will permit you to go directly to the companies and
ask face-to-face about the needs, without requiring large amounts of funding and time. The
size of the area determines the research costs.
Doubtless, you will find another kind of problem in small territories, for example, that they
are not open to interviews or to share their company needs. The Consorcio Intermunicipal del
Pacto por el Empleo del Valle del Vinalopó has large experience working at a local level with
enterprises owners and found problems with an old-fashioned business mentality’. It can
happen that companies’ owners are not always accessible and eager for changes in their
companies. In this case, you should start even from an earlier initial point and be able to raise
awareness among these companies by explaining the repercussions they could have on their
performance and profitability if they do not have qualified people adapted to their needs.
Therefore, you should plan an awareness-raising plan to persuade the company and display
the pros and cons of giving the job positions needs for adapting C-VET programs to them.
(Fiche 3 in toolkit)
We have to identify the positions of difficult coverage and current hiring needs, which
means that it is significant to perceive the new skills, which are needed in a current and in a
medium-term situation. However, we need to identify the needs of a particular work position
already existing and covered by active workers of the company staff as well. Having a singular
and individual setting, we should be able to determine the skills, which are bound to be up-
dated or increased. There may be many reasons, which created this unbalanced prospect,
such as new applications, new machinery, new standards required, etc. These are the needs
that your research should identify in your territory and to which a vocational training for the
companies needs should be adjusted.
According to this, the framework of the analysis contains the following four steps:
The first step (Planning & Methodology): It is necessary to plan the labour market analysis
in detail in advance. You will need to take decisions among other things within the framework
of the analysis, the financial resources to carry it out and the target group. Secondly, it needs
to be decided what kind of research methods you are going to use since incomplete or wrong
PLANNING
&
METHODOLOGY
IMPLEMENTATION
RESULTS
ANALYSIS
EVALUATION AND
REPORT

9
Improving Proximity Responses for the Adaptation of Vocational Education and Training/ 2015-1-ES01-KA202-015976
chosen data gathered might lead to unsuccessful implementation. The criteria, which are
related to the data collection, need to be considered carefully. The criteria should be
thoroughly defined in the description part.
The second step (Implementation): During the implementation process, the data collection
methodology emphasized in the planning is used to get the necessary data related to the
needs. We have previously decided the methods, the indicators, the timing, the financial
issues, the area, the partnership and who is going to conduct each part. Then you apply what
you have planned.
The third step (Results): After having collected the data through the questionnaires, we
have to transfer the responses from the questionnaires into a spreadsheet to be analysed.
The fourth step (Analysing, Evaluating and reporting): Sufficient detail should be included
in the descriptive analysis to enable the reader to see the investigative steps you have
followed, how you made methodological decisions or changes of direction.

10
Improving Proximity Responses for the Adaptation of Vocational Education and Training/ 2015-1-ES01-KA202-015976
DESCRIPTION
Step 1. Planning and Methodology
Description
Before referring to planning, we should consider the definition of the labour market needs
analysis and objectives that are already defined in our overview of the process. Through
looking at the previous studies in the territory, if possible, we would understand this context
more easily. While describing it, it is helpful to think about the context, place or area where
you need to do your research, duration of the implementation and tools.
1. PLANNING
1.1 The planning group
The planning group must support and define the scope and the analysis plan, validate the
analysis, provide guidance for a better understanding or additional research. When it is
impractical or expensive to evaluate every aspect in a population, due to a wide range of
causes such as the territory size, a properly selected sample can yield meaningful inferences
about the characteristics of the underlying population.
Statistical sampling is useful when sufficient data are not available electronically, the cost
of collecting and analyzing every individual observation from a population is too high or takes
too much time, and when a population is too large to obtain reasonable data of each
observation. See further info on: (http://www.mymarketresearchmethods.com/descriptive-
inferential-statistics-difference/)
In the planning group for the labour market need analyses should be included
representatives of companies, local authorities, representatives of regional/national
authorities involved in VET, employers’ organizations, trade unions, sectorial/professional
organizations, research and innovation centres, educational centres, VET providers, local
development agencies, employment services, entrepreneurship and business development
services or industrial clusters. The more inclusive you are and the more you ensure
participation of all relevant groups, the more benefits and comprehensive data you can
collect. However, a larger partnership may also have more problems to unify criteria. It is
fundamental to include in the planning group, if possible, the following stakeholders:
VET providers, individual freelance teachers or organizations. They have
extensive experience in both: companies’ needs for their employees and job
requirements.

11
Improving Proximity Responses for the Adaptation of Vocational Education and Training/ 2015-1-ES01-KA202-015976
Local Authorities. Collaborating with them will help you not only to overcome
the difficulties that can be experienced but also to generate a stronger engagement
and achieve more success.
Employment Agencies. Like C-VET providers, they also have knowledge of the
needs of companies and the qualifications of the unemployed. Moreover, they may
have already conducted surveys and questionnaires on employment needs.
Statistics Institutions. Including them to the planning group gives us the
opportunity to reach the statistical information, which gives you an idea of the needs
analysis. Furthermore, they can be helpful while determining the sectors and territory
you will work on.
Once you established a planning group, it will be easier to decide who will conduct the
explained analysis, how to collect the data and how to evaluate it. Who will carry out the
needs analysis and analyse the data, closely affects both, the quality and the quantity of the
data you get. In this case, it should be decided whether the institutions, organizations,
individuals in the partnership will conduct it or you will get professionals. For this reason, this
issue should be considered well and decided together with the local partners considering the
cost benefit ratio.
In this needs analysis, we will focus on C-VET, trying to be less extensive and to give an
example of how to do it with any VET program. The same that we describe in this guide can
be applied to other VET levels.
1.2 Understanding the planning
The needs analysis requires to work directly with companies and to interview them
directly in order to collect extensive and real data. The C-VET providers, Employment
Agencies, Statistics Institutions and National employment office, are going to reveal
the main labour sectors in your region and even they may conduct the companies’
interviews instead of you. This may result in a big saving in time and expenses as they
have established procedures to carry out these consultations. Even supposing that
they have experience in labour market needs, you should take a representative sample
from your region to develop an up-dated investigation of labour market needs. These
samples are realistic ones and useful to foster an effective implementation of
ImproVET model.
The needs analysis in this guide requires working directly with all VET providers to
hand out information about the entire catalogue of current VET offer and specific

12
Improving Proximity Responses for the Adaptation of Vocational Education and Training/ 2015-1-ES01-KA202-015976
programs of each C- VET course. That way we will test if C-VET contents are adapted
to labour market needs in the territory.
As ultimate beneficiaries, we have on the one hand unemployed people and on the
other companies development in addition to the chances of creating new jobs and
later on to decrease unemployment rates. Along with these lines, we have to evaluate
the results of those indicators in order to asses if we analysed the labour market needs
properly. The assessment process will be described in detail in guide number 4 –
Impact Assessment.
2. METHODOLOGIES
After setting a planning group, methodologies that are going to be used in the needs
analysis should be considered. Also depending on the budget, you will have to decide which
methods to use. The general methods give you a first overview and you will not need big
financial resources. A deeper research is more time consuming and more financial resources
are needed. You can also focus on the general methods first and then decide to get into deeper
research only for some specific sectors. It would, for example, be possible to conduct a deeper
research for one sector and one or two years later for the next one.
2.1. General methods
First of all, existing statistics on Vocational Education and Training and unemployment rates
in important sectors should be analysed. As a result, you will have preliminary information
before you take any action. If there is no data available, the local partners, which are in touch
with the sectors in the territory, should enlighten the others about the needs of companies.
Later on, analysing current job offers in the territory can be helpful. Understanding what
kind of skills companies are looking for, what kind of jobs are currently offered and what kind
of skills are important for employers. In addition, it is important to have a look at the currently
existing VET programs, to get an overview what is already available in the territory. This will
give you an idea of designing a new VET program avoiding duplications.
2.2 Deeper research
For deeper research, once settled down the planning group, you need to get into direct
contact with the companies and stakeholders in your territory in order to find out their
situation and their needs. This can be done through questionnaires (online or via e-mail),
interviews by phone or face-to-face, round tables or even observations in the companies. As
an example, in the UK there is a specific organism called “UK Commission for Employment
and Skills“ (UKCES) which is a governmental organization for VET adaptation to labour
market needs. You can find all the information directly at this link:

13
Improving Proximity Responses for the Adaptation of Vocational Education and Training/ 2015-1-ES01-KA202-015976
www.gov.uk/government/uploads/system/uploads/attachment_data/file/327492/evidence-
report-81-ukces-employer-skills-survey-13-full-report-final.pdf
A questionnaire is a research instrument consisting of a series of questions and other
prompts for the purpose of gathering information from respondents. Before you prepare it,
some basic questions should be answered.
What is your goal in doing this questionnaire? The data you want to get out of
it and the way you will use the results should be defined.
How much time do you have to do that? It totally depends on the target group.
If the questionnaire is carried out on a large number of people in a large area, it should
not be overlooked that costs and time use will increase.
Will you make your survey available to everybody who wants to answer or will
you ask the questions to a sample group?
What kind of questions will be asked? Asking open questions will be more
qualitative while asking closed questions is more quantitative.
How are you going to distribute the questionnaire – online, by e-mail or do you
want to conduct interviews? (In the case of interviews, you need to decide who is
going to conduct it.)
What kind of statistical methods is going to be used applied to the
questionnaire construction?
3. TIMELINE
In order to have a proper analysis process, you should set a timeline and deadline for the
questions below. Answering them will let you know if you are in the right way.
How long will it take to set the planning group?
How long will it take to contact people to set a truly representative group?
How long will it take to prepare and print the surveys?
How long will you gather information?
How long will it take to analyse the data and write the report?
4. FINANCIAL ISSUES
Since there are many variables, it is difficult to estimate the costs of conducting a needs
analysis. The variables that need to be considered carefully are;
How much time do you have to conduct the needs analysis?
How many people are going to get involved in it?
How big is the relevant territory and how many sectors are there?
Who is going to ask the questions? Are you going to pay them or do they
volunteer?

14
Improving Proximity Responses for the Adaptation of Vocational Education and Training/ 2015-1-ES01-KA202-015976
If overtime is spent to conduct the needs analysis, the costs will increase. However, it
should not be forgotten that the larger the region being surveyed, the more people can be
surveyed, the more accurate and true information you can reach. If there is a local partner
organization experienced in surveys, you may not have to pay for your needs analysis.
Key questions and Critical Points
In this step, the reliability of the planned events is important. It is required to clarify the
framework in the planning stage. For this purpose, previously applied surveys must be checked and it should be informed about how the similar concepts are handled, which data is used, how the ideas are tested and the results evaluated. It is important to put related questions in data collecting tools for the labour market needs and needs in education. The financial part for conducting the needs analysis depends on some variables. If data is already available in the territory, it is quite reasonable to use it. If you conduct a needs analysis, the cost may depend on if you receive professional help from any agents or hire a researcher who gives support with statistical documents to be prepared and conducted.
Also, while conducting a survey or a questionnaire, the participant selection process is
critical. In this process, participant selection (sample selection) needs to be done from various groups. It is required to evaluate the risks before and take precautions needed for the questions below.
- Is the researcher’s knowledge on the subject appropriate for the evaluation? - Efficiency in method and Technical Information: Has the researcher required method
and technical knowledge for collecting and analysing the data? - Will the data collecting be permitted? Will the companies be helpful in this process? - Efficiency in time management and Feasibility:
o Is the number of staff, time and financial support appropriate for completing the survey?
o Is there any back-up plan in case of an uncompleted survey? o In the case of not having enough people available for an interview or a survey,
do the ones you could reach meet the representativeness criteria? - Technical Resources: Is a safe and convenient environment ensured for the survey?
These criteria should be provided before the practice and necessary precautions should be taken against risks.
CRITICAL POINT: One of the important elements that will guide the analysis of needs is the data that already
exists. You can access this information from the records of employment agencies, the
statistical institutes, the vocational education providers, companies, the Chambers of
Commerce, and the researches of workers' unions. At this point, you should be aware that the
existing data is timely. If it is out of date, it may mislead you. Even if the data is extensive and
reliable, it is a snapshot of a particular time.

15
Improving Proximity Responses for the Adaptation of Vocational Education and Training/ 2015-1-ES01-KA202-015976
Inspiring Experiences and Useful Tools
SWOT ANALYSIS: https://en.wikipedia.org/wiki/SWOT_analysis
- Determination of labor and labor migration needs of nationals of third countries in Spain
2015:
http://extranjeros.empleo.gob.es/es/redeuropeamigracionhttp://ec.europa.eu/dgs/home-
affairs/what-we-do/index_en.htm
- DETECTA is a tool launched by the Public Employment Services in Aragon in 2009. It is
aimed at making a real diagnosis about the training needs of the labour market in the
region:http://www.aragon.es/DepartamentosOrganismosPublicos/OOAA/InstitutoAragones
Empleo/AreasTematicas/Formacion/AccionesInvestigacion/ci.Detección-de-
necesidades.detalleInaem
- UK Employer Skills Survey 2015: mainstage
questionnaire:https://www.gov.uk/government/publications/ukces-employer-skills-survey-
2015-supplementary-documents
- Explanation about matching skills and needs: https://youtu.be/z3wjrWyyH1c
- Planning group and Inferential statistics:
http://www.mymarketresearchmethods.com/descriptive-inferential-statistics-difference/
Results and outputs for the Step
- Identifying the goal and the definition of the Labour Market Needs Analysis
- Clarifying the geographical scope (region, village, town or city)
- Determining the duration of the analysis
- Determining the expenses
- Defining the research Methodology
- Determining the universe and the sampling group (the number of the sectors/firms)
- Determining the data collecting device and its content (surveys, questionnaires)
- Identifying of the indicators to be considered and methodologies to measure them,
both from statistical sources and from questionnaires and other questioning
methodologies
- Determining the researchers (the number of the analysts)
- The informative meeting that will be held for the researchers
- Meeting that is held for the companies and the local partners about the questionnaire
https://www.gov.uk/government/publications/ukces-employer-skills-survey-2015-supplementary-documents

16
Improving Proximity Responses for the Adaptation of Vocational Education and Training/ 2015-1-ES01-KA202-015976
Step 2. Implementation
Description
For the implementation of this needs analysis guide, we highly recommend a
questionnaire. Nevertheless, there are other methods that you can use such as analysing
existing data from previous researches although it may present several risks which we have
mentioned in the previous step.
2.1 How to develop a questionnaire for the adaptation of continuous VET to labour
market needs:
2.1.1 Designing
The questionnaire consists of a set of inquiries, usually of various types, systematically and
carefully prepared on the facts and aspects that are of interest in a research or evaluation.
These questions can be applied in a variety of ways, among them for example, we can ask
directly to a certain group or use current technology such as e-mail.El cuestionario como
instrumento de investigación y evaluación. The questionnaire as an investigation and
evaluation instrument. (Tomás García Muñoz. Almendralejo,2003)
Since we have to gather data concerning difficult coverage offers, we should create a questionnaire able to discriminate which ones are difficult coverage offers and which ones are not, despite the time that companies have gone by without hiring anybody. (See fiche 1 in toolkit)
That way we should gather information about a wide range of aspects such as the publication date of the job offer, source of job offer publication, the type of offer (engineer, assistant, manager, etc.), the lack of skills of a current worker in existing work positions, the time without covering a particular post, the sector, the company, and of course the required skills in new hirings and the required VET level.
Other indicators that should be included depend on the territory needs and particularities. (See fiche 1 in toolkit) This information should be analysed in comparison with the current VET offer list in the territory that you have previously gathered from the pertinent educational organism in the area. We have to develop the questionnaire taking into account the next aspects:
The questionnaire should be developed to obtain information from companies and agents,
so you might consider specific questions for collecting data from job offers from different
kinds of sources (website, newsletters, newspapers, etc.). In order to consider all the possible
scenarios, you should develop a battery of questions that allows you to collect the necessary
data from the current offers published among different sources. In this case, a previously and

17
Improving Proximity Responses for the Adaptation of Vocational Education and Training/ 2015-1-ES01-KA202-015976
well-structured design must be determined in order to gather information and be able to face
different circumstances. At the same time, if possible, in the same questionnaire you should
include questions about unfilled skills in currently covered work positions. Despite the fact
that it is too difficult to make a questionnaire covering all the aspects that we want to collect,
we should try to use the more accurate sampling possible. If this task is a threat for the
questionnaire comprehension, as many aspects are interlinked and can create a
misunderstanding by the users, we might try to establish a different structure and create the
questionnaire by topics, for example, by company sectors, by sources etc. In this case, we will
gather the information in a more organized and understandable way, at the same time making
the analysis of the results will be easier.
Some questions to be considered are:
The questionnaire should start with an introduction. An introductory statement may include information about the general purpose, a request for cooperation, and information about anonymity or confidentiality procedures. This information can be presented at the beginning of the questionnaire or in a cover letter. If a cover letter is used, a short introduction should also be printed on the questionnaire so that the questionnaire is self-sufficient. Sung Heum Lee (Hand Book of Human Performance Technology. Constructing an effective questionnaire. Chapter Thirty-two.)
Instructions. Every self-administered questionnaire should begin with instructions on completing it. For closed-ended questions including multiple choice, yes or no, and rating scales, respondents should be given instructions about answer formats, such as placing a check mark or a X in the box beside the appropriate answer or writing in their answers when called for. For open-ended questions such as fill-ins, short answers, and essays, respondents should be given some guidance as to whether brief or lengthy answers are expected. If a given question varies from the general instructions pertaining to the whole questionnaire, special instructions for that subsection will be required to facilitate a proper response, Sung Heum Lee (Hand Book of Human Performance Technology. Constructing an effective questionnaire. Chapter Thirty-two).Instructions should be complete, unambiguous and concise.
Skills, job qualifications, and competences required for the difficult coverage offers. We recommend to use, as a method of labour market vacancies classification the “Compatibility with the Framework for Qualifications of the European Higher Education descriptors for cycles. Each cycle descriptor offers a generic statement of typical expectations of achievements and abilities associated with qualifications that represent the end of that cycle (https://ec.europa.eu/ploteus/content/descriptors-page). Nevertheless, it depends on the territory. For all territories, it is advisable to consult the national framework for Higher education. The descriptors will help you to identify required profiles in job search web motors, newspapers, directly in companies or in any other trusty source.

18
Improving Proximity Responses for the Adaptation of Vocational Education and Training/ 2015-1-ES01-KA202-015976
Company and company sector. We have to include in the questionnaire at least one question to collect important information about the company sector. We can classify if recruitment companies needs in a territory are related to sectors or not. You can use ATECO codes (https://www.istat.it/en/archive/17959) like a safe solution for coding your answers.
The source. It is important to be aware of the different sources used such as internet motor sites, newspapers employment sections and company direct information. You must control the duplicity of data collected. For example, you can visit a company and then gather their same job offer from the internet or in the newspaper. It will cause inflated data and skewed results.
Time without covering the vacancies. Our principal target is to gather information, and then you should take into account a system of questions to identify the work positions which have been unfilled for a long period of time, the so-called difficult coverage vacancies. Following the example that we have given in the ‘overview of the process’ about that point ( see page 6) the same questionnaire should be done in an established period of time and you should ask the same questions every time, so the data will be appropriate and link to the current labour market. You should include as well useful questions able to identify the same offer from the same company requiring always the same skills while these skills are not required by other companies in the same territory. This could mean that the problem in difficult coverage offer is not about finding trained people in the territory but it depends on specific and personal company characteristics. This ’difficult coverage offer’ is not a real target for us to identify VET shortages and we have to dismiss it as a statistical bias.
Closing Statement. A questionnaire also needs a closing statement that thanks participants for completing the questions. A closing statement is also related in part to logistics. Questionnaires could include what to do with completed answers, Sung Heum Lee (Hand Book of Human Performance Technology. Constructing an effective questionnaire. Chapter Thirty-two)
An example is: When you have completed the questionnaire, please return it to the blue box located at the front exit of the room.
You should pay attention at these points while writing the questions:
Write Simple, Clear, and Short Questions
Make Specific and Precise Questions.
Use Appropriate Language.
Ensure Respondents’ Ability to Answer.
Include Only One Topic or Idea per Item.
Use Appropriate Emphasis for Key Words in the Question
Take Care with Sensitive Questions.
Avoid Negative Questions or Double Negatives.

19
Improving Proximity Responses for the Adaptation of Vocational Education and Training/ 2015-1-ES01-KA202-015976
Avoid Biased or Loaded Questions and Terms.
Avoid Questions with False Premises or Future Intentions
Question Formats. Questionnaire item responses fall into two general categories:
(1)Closed-ended, or structured, fixed-response questions; and (2)open–ended, or unstructured, free-response questions. In closed-ended questions, including those with multiple choice, yes or no, and true or false answers, and questions with rating scales, respondents are asked to select the answers from a fixed set of response alternatives. Closed-ended questions are very common in questionnaires designed for analyses and evaluations because of a greater uniformity of responses and easy administration. Their main drawback can be in the structuring of responses Sung Heum Lee (Hand Book of Human Performance Technology. Constructing an effective questionnaire. Chapter Thirty-two)
As the nature of our analysis aims at reviewing labour market needs, we will use close-ended or structured, fixed-response questions (See examples in https://www.gov.uk/government/publications/ukces-employer-skills-survey-2015-uk-report ). Since we are not looking for individual attitudes and our purpose is to analyze facts, we consider this the most appropriate question format.
2.1.2 Conducting the questionnaire application.
Due to the nature of close ended or structured fixed-response questions, we will use direct
answer application procedures. The two mostly used are: by mail/ online and face to face. Questionnaires by mail are generally used to tackle big samples. The costs are less than
through the post, as paper, printing and stamps can be an over cost which might not have to be considered in the planning. In order to save expenses, you can send it by email as the investment is minimum. Or you can use online tools like SurveyMonkey to create a questionnaire and just send the link to it by e-mail. The advantage of online surveys is, that you can download the results in an already structured format (e.g. excel). See more at: (https://es.surveymonkey.com/)
Questionnaires face-to face are called collective application questionnaires. We apply these questionnaires in a group.
Both types of applications have pros and cons, being aware of them it would be easier to choose the most appropriate one depending on a particular situation, Martínez, La Nueva Ciencia. 2002 p. 22
Once we have designed the questionnaire, and before the final implementation, following Sung Heum Lee, in chapter thirty two of Hand book of human performance technology, a well-made questionnaire has several attributes. It is well-organized, the questions are clear, response options are well-drawn and exhaustive, and there is a natural order or flow to the questions that keeps the respondent moving toward completion of the questionnaire. These desirable attributes, though deceptively simple when they occur in a quality questionnaire,
20
Improving Proximity Responses for the Adaptation of Vocational Education and Training/ 2015-1-ES01-KA202-015976
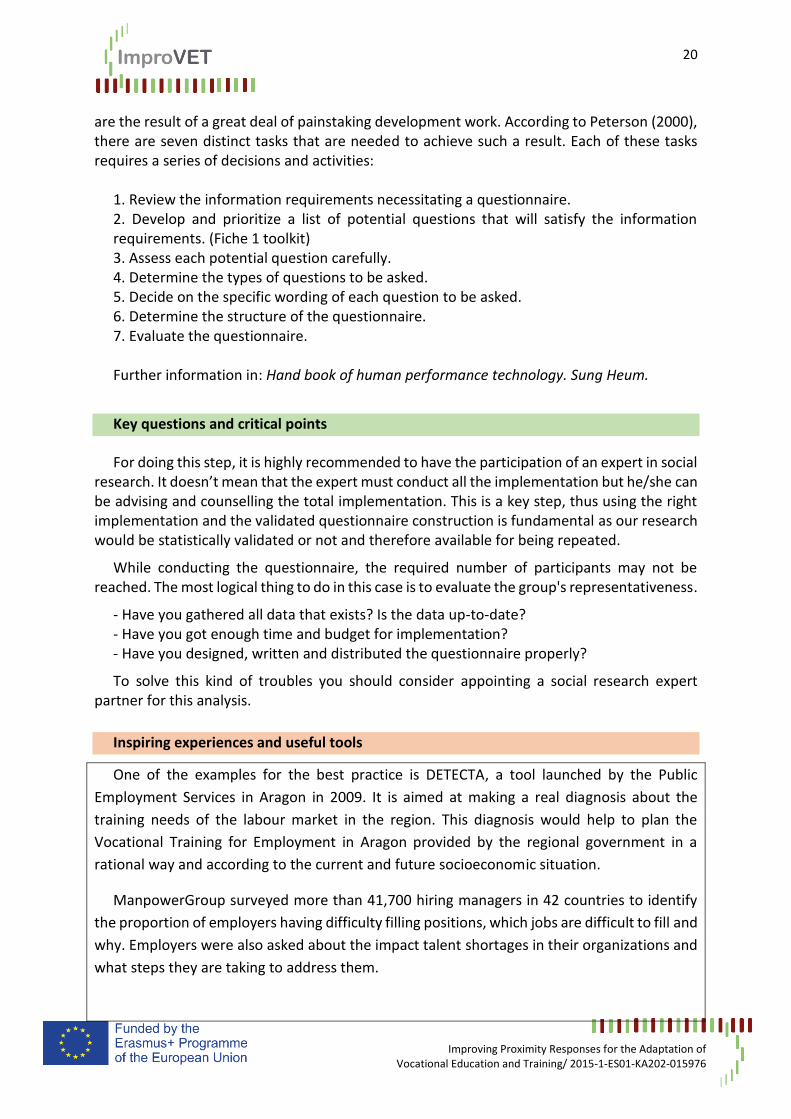
are the result of a great deal of painstaking development work. According to Peterson (2000), there are seven distinct tasks that are needed to achieve such a result. Each of these tasks requires a series of decisions and activities:
1. Review the information requirements necessitating a questionnaire. 2. Develop and prioritize a list of potential questions that will satisfy the information requirements. (Fiche 1 toolkit) 3. Assess each potential question carefully. 4. Determine the types of questions to be asked. 5. Decide on the specific wording of each question to be asked. 6. Determine the structure of the questionnaire. 7. Evaluate the questionnaire. Further information in: Hand book of human performance technology. Sung Heum.
Key questions and critical points
For doing this step, it is highly recommended to have the participation of an expert in social research. It doesn’t mean that the expert must conduct all the implementation but he/she can be advising and counselling the total implementation. This is a key step, thus using the right implementation and the validated questionnaire construction is fundamental as our research would be statistically validated or not and therefore available for being repeated.
While conducting the questionnaire, the required number of participants may not be reached. The most logical thing to do in this case is to evaluate the group's representativeness.
- Have you gathered all data that exists? Is the data up-to-date? - Have you got enough time and budget for implementation? - Have you designed, written and distributed the questionnaire properly?
To solve this kind of troubles you should consider appointing a social research expert partner for this analysis.
Inspiring experiences and useful tools
One of the examples for the best practice is DETECTA, a tool launched by the Public
Employment Services in Aragon in 2009. It is aimed at making a real diagnosis about the
training needs of the labour market in the region. This diagnosis would help to plan the
Vocational Training for Employment in Aragon provided by the regional government in a
rational way and according to the current and future socioeconomic situation.
ManpowerGroup surveyed more than 41,700 hiring managers in 42 countries to identify
the proportion of employers having difficulty filling positions, which jobs are difficult to fill and
why. Employers were also asked about the impact talent shortages in their organizations and
what steps they are taking to address them.

21
Improving Proximity Responses for the Adaptation of Vocational Education and Training/ 2015-1-ES01-KA202-015976
41,700 employers were asked:
• How much difficulty are you having filling jobs due to lack of available talent?
• Compared to last year at this time, how much difficulty are you having filling jobs?
• What is the one job you are typically having the most difficulty filling?
• What level of impact does this talent shortage have on your ability to meet client
needs?
• How are talent shortages/skills gaps impacting your organization?
• Why are you having difficulty filling this specific job?
• What strategies are you pursuing to overcome these difficulties?
- See more at:http://www.manpowergroup.com/talent-shortage-2015/talent-shortage-
2015#ten-years
See more at:
http://excelsior.unioncamere.net/index.php?option=com_content&view=article&id=119&It
emid=466
See more at: UK Employer Skills Survey 2015
See more at IMPROVET BEST PRACTICES DOSSIER: in Verbund Strukturwandel (VSW)
(Alliance Structural Transformation)
Results and outputs for the Step
Construction of a questionnaire that assesses:
The needed skills in the labour market.
The needed skills in currently developed jobs.
The difficult coverage company offers
Proper questionnaire conduction and application:
By mail
By phone
In person gathering groups.

22
Improving Proximity Responses for the Adaptation of Vocational Education and Training/ 2015-1-ES01-KA202-015976
Step 3. ANALYZING RESULTS
Description
It’s time to analyze the questionnaires implementation results and transfer the data
gathered into the numerical concept wrote down into tables. Remember that the facts have to be presented clearly, coherently and fully so they can be interpreted.
There are powerful statistical data programs in the Informatics market. We would recommend you SPSS. This program is not only a great tool for analysis and evaluation but as well of validation.
Please check for more info http://www.ibm.com/analytics/us/en/technology/spss/„ SPSS is a popular statistical analysis software package, which stands for Stat istical Package for Social Sciences .
It is one of the more popular tools in the contemporary statistical analysis due to its easy to use Graphical user interface, although it offers a wide range of capabilities ranging from add-on modules to add-on pack ages such as Amos and Clementine. SPSS was first developed in 1968 and has since been used extensively in industry and university research applications.
If we decide to analyse the results manually we should follow as a sample, the next steps:
One of the questions in our questionnaire is about contract’s types. The answer options are as follows and the numerical concept to be written down into tables is:
QUESTION Nº 5 What kind of contracts are used in your company?
Fixed-term contracts: We chose numerical correspondence with number 1
Agency staff: it corresponds to the number 2
Freelancers, consultants, contractors: it corresponds to the number 3
Zero hours contracts: it corresponds to the number 4
In the results registered in the question number five has been registered the next number of answers:
75 Fixed-term contracts:
25 Agency staff contracts
106 Freelancers, consultants and contractors.
250 Zero hours contracts
To translate this into a numerical concept to be analyzed, we do a table following, for example, gender criteria:
23
Improving Proximity Responses for the Adaptation of Vocational Education and Training/ 2015-1-ES01-KA202-015976
In our sample we can see that:
In answer number 1: 40 males and 35 females are fixed-term hired.
In answer number 2: 18 males and 7 females are Agency staff
In answer number 3: 38 males and 68 females are freelancers, consultants and contractors.
In answer number 4: 70 males and 180 females are zero hours hired.
From here onwards we can apply the appropriate statistical formulas to extract from the data the results we seek and we can use the relevant analysis criteria, ie, by gender, age, socioeconomic or cultural levels, etc.
When formulating the results section, it's important to remember that the results of a study do not prove anything. Findings can only confirm or reject the hypothesis underpinning your study. However, the act of articulating the results helps you to understand the problem from within, to break it into pieces, and to view the research problem from various perspectives.
The page length of this section is set by the amount and types of data to be reported. Be concise, using non-textual elements appropriately, such as figures and tables, to present results more effectively. In deciding what data to describe in your results section, you must clearly distinguish information that would normally be included in a research paper from any raw data or other content that could be included as an appendix.
Avoid providing data that is not critical to answering the research question. The background information you described in the introduction section should provide the reader with any additional context or explanation needed to understand the results. A good strategy is to always re-read the background section of your paper after you have written up your results to ensure that the reader has enough context to understand the results [and, later, how you interpreted the results in the discussion section of your paper]. http://libguides.usc.edu/writingguide/results
Describing results:
We can start by thinking about the criteria that we are going to use to describe results, or
what does the information gathered consist of:
• by economical sector or by region?
• by skills cluster or difficult coverage works?
• by any other relevant order?
Answers to these questions require rigorous analysis and description, but not interpretation.
We have to think about the order in which the results are presented which may be chronological, so following the order in which the facts were obtained; or hierarchical, in order of their relative importance to the heart of the investigation. The introductory description should be able to answer simple questions. For example:

24
Improving Proximity Responses for the Adaptation of Vocational Education and Training/ 2015-1-ES01-KA202-015976
Introductory Sections
• Where was the study conducted?
• When was the study conducted? Why?
• What were the study aims, objectives, and intended outputs?
• Who conducted the study? Which methods/tools were used? Why?
• How did people participate in the study? Which ethnic, language or other groups were
involved?
•How does the level of participation achieved in your study compare with general
participation concerning (community)?
Key questions and critical points
Make a brief introduction to the results: where, when what who, how
Making a difference between report and results and present it separately.
The results are an analysis and description without interpretation.
The results don’t prove anything by themselves
Select only the most relevant data.
Organize the data following criteria.
SPSS as a tool for organizing results
Inspiring experiences and useful tools
Results report http://nsse.indiana.edu/2016_Institutional_Report/pdf/NSSE16%20Snapshot%20(NSSE
ville%20State).pdf
Results and outputs for the Step
The results are the concentrated information, which leads us to do the report.

25
Improving Proximity Responses for the Adaptation of Vocational Education and Training/ 2015-1-ES01-KA202-015976
Step 4. ANALYSIS, EVALUATION AND REPORT
Description
4.1 Describing Report
To begin with, you have to write a report containing a complete record of the study processes and findings. (See example in inspiring experiences and useful tools.) Once you have completed the report, you may decide to extract parts of it and prepare short summaries for dissemination among the various stakeholders who will expect to learn about your results. In this section, we will deal with the complete report first and then suggest additional ways in which it may be disseminated among specific audiences or readerships.
Writing a Complete Study Report At the end of the investigation and analysis processes, you will find yourself with considerable amounts of fieldnotes, charts, and other written records of what you have done. These will all need to be systematically organized, kept in notebooks, and files compiled by hand or on a computer, if available. You can then start putting them together following a report outline
Writing Separate Summaries for Specific Readers or Interest Groups You may need to send short summaries such as an executive summary to your project funders, the study population, local community groups, governmental levels involved, C-VET providers, Councils, regional organisms etc. It is important to balance well the positive and negative findings when reporting, in short, executive summary format. By definition, an executive summary does not allow the reader the benefit of seeing the findings in the context. Evaluation study results are seldom entirely positive or entirely negative, but a combination of the two. Whether they are interpreted as positive or negative depends on who is interpreting and using them.
You may also prepare short articles summarizing your findings for dissemination in local and/or regional partnerships.You will need to bear in mind the interests of each of these groups when deciding what to include, and what language and style to use.
Making Verbal Presentations to Selected Groups and Inviting Their Comments and Suggestions You may find it beneficial to present partial or full results of your investigation to some of the most important stakeholders in the study in order to elicit their responses to the analysis and interpretation of your findings. Charts, graphs, and other visual displays can be used to present the findings in ways that will interest and stimulate participants.
4.2 Descriptive analysis: Description and analysis of qualitative information are closely linked, hence the phrase
descriptive analysis. This step should include some description of the purpose of the study,
the study site, and people involved, which is normally presented in the introductory sections
of a report. However, the descriptive analysis focuses on the information gathered in relation
26
Improving Proximity Responses for the Adaptation of Vocational Education and Training/ 2015-1-ES01-KA202-015976
to how it was gathered, where, and by whom. This involves reviewing the information,
identifying links, patterns, and common themes, arranging the facts in order, and presenting
them as they are, without adding any comments on their significance. In this guide, analysing
and evaluating will appear as an introductory part of the results section since we are collecting
data and making a quantitative analysis.
4.3 Interpretation
The second stage is to determine what the results mean and how significant they are in the specific context to which they belong. The reasons behind skills shortages and to what extent they are influenced by educational development policies in VET for adapting it to labour market need and wider issues concerning our understanding of the links between skills shortages and continuous VET adaptation can also be explored in the light of the findings.
The following are some of the questions for the study team to answer when interpreting the
study results:
• What do the results mean?
• Why did the results turn out the way they did?
• What are possible explanations for the results?
• Have all the why questions been answered? Do some of them require further
investigation?
The interpretation of findings should ideally reflect the comments and suggestions made by members of the study population(s) during the feedback sessions that are built into the use of investigative and analytical methods/tools. This will help minimize the biases that can creep into the interpretation of results, making sure that they are not separated from the context in which information was gathered.
4.4 Evaluation
Descriptive analysis and interpretation of results ultimately lead to judging the findings as positive or negative or both and stating the reasons why. The values of the study team and other stakeholders are brought to bear on the study findings. For example, the findings may show what is right, wrong, desirable, or undesirable in the way the project has promoted improved C-VET programs adjusted to the market needs: The questions to be answered here are: • What is the significance of the findings to the various stakeholders in this particular
setting?
• to your project?
• to the study population?
• to applied researchers interested in the links between skill shortages in hiring and current
jobs with C-VET programs?

27
Improving Proximity Responses for the Adaptation of Vocational Education and Training/ 2015-1-ES01-KA202-015976
The interpretation and judgment of results are usually presented in the Discussion section of
a report. It is important to strike a fair balance between the positive and negative aspects of
the findings. For example, positive findings should be emphasized without brushing over
negative ones. Similarly, negative findings should not only be listed but discussed in a way
that explores possible practical solutions or feasible remedies. The discussion section should
be followed by the conclusions which may be presented in the same section or separately
under conclusions.
4.6 Recommendations
The fourth stage is to draw some recommendations for action to be taken on the basis of the analysis, interpretation, and judgement of study findings. The Recommendations section of a report normally follows the discussion and conclusions and should address the following questions.
• What are the implications of the findings, based on your analysis, interpretation, and
judgements?
• for your particular project?
• for other projects that may be interested in learning from your findings?
• for any other interested parties, such as researchers?
• What should be done by your project and other stakeholders on the basis of the analysis,
interpretation, and judgement of your study results?
The more the different concerned parties or stakeholders are involved in the interpretation and evaluation of the study results, the easier it will be for you to reflect their interests in the recommendations. Practical and feasible suggestions should be clearly included in the recommendations.
Key questions and critical points
The report is the visible result of a huge amount of work. It should be planned and developed with rigorousness but at the same time might be made with a “commercial” point of view. The report must be “easy-to-digest” and attractive to the reader. It must catch reader’s attention.
The report like dissemination instrument
Write a complete study. As a difference with report section, in this case, we have to deeply
explain.
Write separate summaries to easier understanding
Make verbal presentations to stakeholders and dissemination targets
Interpret the results
Evaluate the significance of the results
28
Improving Proximity Responses for the Adaptation of Vocational Education and Training/ 2015-1-ES01-KA202-015976
Inspiring experiences and useful tools
The SPSS Statistics 17.0 Brief Guide provides a set of tutorials designed to acquaint you with the various components of statistics. This guide provides a set of tutorials designed to enable you to perform useful analysis on your data. You can work through the tutorials in sequence or turn to the topics for which you need additional information. SPSS A BRIEF GUIDE:
https://www.hks.harvard.edu/fs/pnorris/Classes/A%20SPSS%20Manuals/SPSS%20Statistics
%20Brief%20Guide%2017.0.pdfOutline of a Report (Fiche 2 in toolkit)
SPECIFIC REPORT SAMPLE
See more at: http://www.manpowergroup.com/talent-shortage-2015/talent-shortage-2015#ten-years
OTHER REPORT SAMPLES https://www.dlsweb.rmit.edu.au/lsu/content/2_AssessmentTasks/assess_tuts/reports_L
L/report.pdf http://www.who.int/responsiveness/KIS%20Report.pdf Results and outputs for the step
The final report is composed by descriptive analysis and evaluation where we can
interpret data and finally report it with our conclusions.

29
Improving Proximity Responses for the Adaptation of Vocational Education and Training/ 2015-1-ES01-KA202-015976
CHECKLIST
When conducting a Labour Market Needs Analysis for Vocational Education and Training (VET),
make sure you have considered the following items:
Consideration Y N
Have you established a planning group?
Have you clarified the aims of the needs analysis?
Have you defined the territory?
Have you determined methodologies for the needs analysis?
Have you established a timeline including deadlines?
Have you planned the financial cost?
Have you checked available data?
Do you have an overview of current VET offers in the territory?
Have you identified trusty sources to gather job offers in your territory?
Have you identified training needs in currently covered jobs?
Have you conducted the questionnaire application properly?
Have you identified the right expert partner for the research?
Has any exposition been given to companies?
Have you obtained permission from your territorial government if
necessary ?
Have you analysed the collected data?
Have you gathered only relevant results for the research report?
Have you written a complete report?
Have you prepared the dissemination targets for the report results?

30
Improving Proximity Responses for the Adaptation of Vocational Education and Training/ 2015-1-ES01-KA202-015976
TO LEARN MORE ABOUT IT
More research ideas can be taken from a search of different international databases:
- European centre for the development of Vocational training. http://www.cedefop.europa.eu/
- UK Commission for Employment and Skills (UKCES)http://excelsior.unioncamere.net
- SPSS A BRIEF GUIDE:
https://www.hks.harvard.edu/fs/pnorris/Classes/A%20SPSS%20Manuals/SPSS%20Statistics%
20Brief%20Guide%2017.0.pdf
BIBLIOGRAPHY:
- Sung Heum Lee. Chapter thirty-two “Constructing and effective questionnaire”. (Hand book of
human performance technology 2006).
- Bulletí La Recerca “¿Cómo se elabora un cuestionario?”. ISSB: 1886-1946
- RMIT University “Sample research report”. Learning skills Unit.
- BMZ Federal Ministry for Economic Cooperation and Development. “Guidelines for an
Employment and Labour Market Analysis” (ELMA)
- Tomás García Muñoz. Almendralejo, Marzo 2003 “El cuestionario como instrumento de
investigación / Evaluación”.
- UK Commision for Employment and Skills.“The UK Commission’s Employer Skills Survey 2013:
UK results”. Windertotham M., Vivian D., Shury J. and Davies B. Genna Kik. Senior Research
Manager.
- ISCED 2013 “ISCED FIELD of education and training 2013”. Manual to accompany the
international standard Classification of Education 2011
- EMN Red Europea de Migración “Determinación de las necesidades de mano de obra y de
migración laboral de nacionales de terceros países en España”.. Comisión Europea.
- NSSEville State University “A summary of student engagement results NSSE 2016 snapshot”..
- EUROSTAT. “Practical guide of data validation”.
- CEDEFOP 2015 “Skill shortages and gaps in European enterprises. Striking a balance between
vocational Education and training and the labour market”.
- Martínez Miguélez, Miguel. La Nueva Ciencia, 2002.
Related Documents