1 Guidance on the Interpretation of FHSIs DRAFT – February 26, 2019 Introduction This document has been prepared by Michael Hafeman as part of a project jointly sponsored by the IMF and the World Bank. However, it is not an official document of either organization. The draft guidance on the interpretation of financial health and stability indicators (FHSIs) herein draws on the following sources of information: • IAIS Core Curriculum module 12B, “A Primer on Non-Life Insurance Ratios”, Craig Thorburn, 2006 • IAIS Core Curriculum module 11, “Market Analysis”, Jaroslav Kucera, 2006 • IMF WP / 03 / 138, “Insurance and Issues in Financial Soundness”, Udaibir S. Das, Nigel Davies, and Richard Podpiera, 2003 • NAIC, “Insurance Regulatory Information System (IRIS) Ratios Manual”, 2016 Edition • IMF, “Modifications to the Current List of Financial Soundness Indicators – Background Paper”, November 13, 2013. It has benefitted from reviews of earlier drafts by Michael Grist (World Bank, retired), insurance supervisors in the Eastern Caribbean (in connection with a CARTAC project), and supervisors in Eswatini (in connection with an IMF-FIRST Initiative project). The FHSIs have been organized in accordance with the CARAMELS categories to which they are primarily related. A separate document provides a mapping of the FHSIs to other risk assessment categories where they can be useful in informing the assessment. Unless otherwise indicated, the results of FHSIs that are calculated as ratios are typically expressed as percentages. When FHSIs involving items from the income statement are calculated for periods of less than one year the results are typically annualized. FHSIs denoted as [FSI] have been adopted by the IMF as Financial Soundness Indicators for the insurance sector.

Welcome message from author
This document is posted to help you gain knowledge. Please leave a comment to let me know what you think about it! Share it to your friends and learn new things together.
Transcript

1
Guidance on the Interpretation of FHSIs DRAFT – February 26, 2019
Introduction
This document has been prepared by Michael Hafeman as part of a project jointly sponsored by the IMF
and the World Bank. However, it is not an official document of either organization.
The draft guidance on the interpretation of financial health and stability indicators (FHSIs) herein draws
on the following sources of information:
• IAIS Core Curriculum module 12B, “A Primer on Non-Life Insurance Ratios”, Craig Thorburn,
2006
• IAIS Core Curriculum module 11, “Market Analysis”, Jaroslav Kucera, 2006
• IMF WP / 03 / 138, “Insurance and Issues in Financial Soundness”, Udaibir S. Das, Nigel Davies,
and Richard Podpiera, 2003
• NAIC, “Insurance Regulatory Information System (IRIS) Ratios Manual”, 2016 Edition
• IMF, “Modifications to the Current List of Financial Soundness Indicators – Background Paper”,
November 13, 2013.
It has benefitted from reviews of earlier drafts by Michael Grist (World Bank, retired), insurance
supervisors in the Eastern Caribbean (in connection with a CARTAC project), and supervisors in Eswatini
(in connection with an IMF-FIRST Initiative project).
The FHSIs have been organized in accordance with the CARAMELS categories to which they are primarily
related. A separate document provides a mapping of the FHSIs to other risk assessment categories
where they can be useful in informing the assessment.
Unless otherwise indicated, the results of FHSIs that are calculated as ratios are typically expressed as
percentages. When FHSIs involving items from the income statement are calculated for periods of less
than one year the results are typically annualized.
FHSIs denoted as [FSI] have been adopted by the IMF as Financial Soundness Indicators for the insurance
sector.
2
Contents Capital ........................................................................................................................................................... 6
1.01 Gross written premium / capital ................................................................................................... 6
1.02 Net written premium / capital ...................................................................................................... 6
1.03 Capital / total assets...................................................................................................................... 7
1.04 Capital / invested assets [FSI] ....................................................................................................... 7
1.05 Capital / technical provisions ........................................................................................................ 7
1.06 Cover of solvency margin .............................................................................................................. 7
1.07 Risk-based capital adequacy ratios ............................................................................................... 8
1.08 Growth in capital ........................................................................................................................... 8
1.09 Net growth in capital .................................................................................................................... 9
1.10 Statutory deposit / required deposit ............................................................................................ 9
Assets ............................................................................................................................................................ 9
2.01 (Real estate + unquoted equities + receivables) / total assets ..................................................... 9
2.02 Real estate / total assets ............................................................................................................. 10
2.03 Real estate / capital .................................................................................................................... 10
2.04 (Real estate + mortgages) / total assets ..................................................................................... 10
2.05 Maximum deposits in a single bank / total assets ...................................................................... 11
2.06 (Cash + loans + investments) / total assets ................................................................................. 11
2.07 Receivables / (gross written premium + reinsurance recoveries) .............................................. 11
2.08 Receivables / capital ................................................................................................................... 11
2.09 (Non-performing investment assets and loans + receivables over 90 days) / total assets ........ 12
2.10 Receivables over 90 days / total receivables .............................................................................. 12
2.11 Equities / total assets .................................................................................................................. 13
2.12 Non-performing loans / total gross loans ................................................................................... 13
2.13 Maximum investment in a single counterparty / total assets .................................................... 13
2.14 Maximum receivable from a single counterparty / total assets ................................................. 14
2.15 Gross asset position in financial derivatives / capital ................................................................. 14
2.16 Gross liability position in financial derivatives / capital .............................................................. 14
2.17 Investments: distribution by type ............................................................................................... 14
2.18 Investments: geographical distribution ...................................................................................... 15
2.19 Investments: sectoral distribution .............................................................................................. 15
Reinsurance ................................................................................................................................................. 16
3
3.01 Risk retention ratio [FSI] ............................................................................................................. 16
3.02 (Reinsurance recoveries + reinsurance commissions) / reinsurance ceded ............................... 17
3.03 Maximum exposure to single risk / capital ................................................................................. 17
3.04 Maximum exposure to single event / capital ............................................................................. 17
3.05 Maximum premium ceded to a single reinsurer / gross written premium ................................ 18
Actuarial ...................................................................................................................................................... 18
4.01 Net claims provisions / average of net claims paid in last three years ....................................... 18
4.02 Net technical provisions / average of net written premium in last three years ......................... 19
4.03 Net claims provisions / capital .................................................................................................... 19
4.04 Claims development ................................................................................................................... 20
4.05 Underwritten business: distribution by class of business ........................................................... 20
4.06 Underwritten business: geographical distribution ..................................................................... 21
4.07 Underwritten business: sectoral distribution ............................................................................. 22
4.08 Actuarial assumption: short-term interest rate .......................................................................... 22
4.09 Actuarial assumption: long-term interest rate ........................................................................... 22
Management ............................................................................................................................................... 23
5.01 Gross written premium per employee ....................................................................................... 23
5.02 Assets per employee ................................................................................................................... 23
5.03 Operating expenses / gross written premium ............................................................................ 23
5.04 Personnel expenses / gross written premium ............................................................................ 24
5.05 Growth in gross written premium .............................................................................................. 24
5.06 Growth in net written premium ................................................................................................. 25
5.07 Growth in total assets ................................................................................................................. 25
5.08 Gross written premium / sum insured ........................................................................................ 25
5.09 Gross written premium / number of policies ............................................................................. 26
5.10 Complaint index .......................................................................................................................... 26
5.11 Pay-out ratio ............................................................................................................................... 27
5.12 Board composition ...................................................................................................................... 27
Earnings ....................................................................................................................................................... 27
6.01 Claims ratio ................................................................................................................................. 27
6.02 Gross claims ratio ........................................................................................................................ 28
6.03 Expense ratio............................................................................................................................... 28
6.04 Combined ratio ........................................................................................................................... 29
4
6.05 Investment income ratio ............................................................................................................. 29
6.06 Operating ratio ............................................................................................................................ 30
6.07 Profitability ratio ......................................................................................................................... 30
6.08 Return on revenue ...................................................................................................................... 30
6.09 Revisions to technical provisions / technical provisions ............................................................. 31
6.10 Nominal net investment yield ..................................................................................................... 31
6.11 Real net investment yield ........................................................................................................... 32
6.12 Return on equity (ROE) [FSI] ....................................................................................................... 32
6.13 Earnings per employee ............................................................................................................... 32
6.14 Return on assets (ROA) [FSI] ....................................................................................................... 32
6.15 Policies lapsed or surrendered / policies in force at beginning of the year ............................... 33
6.16 Market value / book value .......................................................................................................... 33
6.17 Price / earnings ratio ................................................................................................................... 33
6.18 Price / gross written premium .................................................................................................... 34
Liquidity and ALM ....................................................................................................................................... 34
7.01 Liquid assets / current liabilities ................................................................................................. 34
7.02 Liquid assets / total liabilities ...................................................................................................... 35
7.03 Liquid assets / total assets .......................................................................................................... 35
7.04 Liquid liabilities / total liabilities ................................................................................................. 35
7.05 Net open foreign exchange position / capital ............................................................................. 36
7.06 Duration of assets / duration of liabilities .................................................................................. 36
Subsidiaries and Related Parties ................................................................................................................. 37
8.01 Group debtors / total assets ....................................................................................................... 37
8.02 Related party receivables / total assets ...................................................................................... 37
8.03 Due to related parties / total assets ........................................................................................... 38
8.04 (Investments in related parties + related party receivables) / total assets ................................ 38
8.05 (Investments by related parties + due to related parties) / total assets .................................... 38
8.06 (Revenues from related parties + expenditures to related parties) / (total revenues + total
expenditures) .......................................................................................................................................... 39
8.07 Group (gross written premium + paid claims) / total (gross written premium + paid claims) ... 39
8.08 Related party (gross written premium + paid claims) / total (gross written premium + paid
claims) 39
Industry-wide .............................................................................................................................................. 39
9.01 Assets / total financial system assets [FSI].................................................................................. 39
5
9.02 Assets / gross domestic product [FSI] ......................................................................................... 40
9.03 Penetration ................................................................................................................................. 40
9.04 Density ........................................................................................................................................ 40
9.05 Density - in USD ........................................................................................................................... 40
9.06 Concentration ratio ..................................................................................................................... 41
9.07 Herfindahl-Hirschman Index ....................................................................................................... 41
9.08 Assets lost during the previous 5 years / average assets ........................................................... 42
6
Capital
1.01 Gross written premium / capital This indicator is calculated as the ratio of gross written premium to capital. Capital can be determined as
total assets less total liabilities. Capital provides a cushion for absorbing losses. This indicator measures
the adequacy of the cushion without considering the effect of reinsurance. The higher the ratio, the
more risk the insurer bears in relation to capital.
The distribution of premium by class of business should be considered when analysing this ratio.
Insurers with a larger portion of premium from riskier and longer-tail classes of business should
generally maintain a lower ratio because their results can be more variable. Insurers with stable profits
and adequate reinsurance coverage are better able to sustain a higher ratio than those with losses,
unstable profits, inadequate reinsurance, or reinsurance with weak reinsurers.
Thresholds of supervisory concern can vary between 500% and 900%. The ratio of net written premium
to capital can also be of interest; the threshold of supervisory concern is typically 300%.
1.02 Net written premium / capital This indicator is calculated as the ratio of net written premium to capital. Capital can be determined as
total assets less total liabilities. Net written premium is a proxy for the risk the insurer retains after
reinsurance. Capital provides a cushion for absorbing losses. This indicator measures the adequacy of
the cushion after considering the effect of reinsurance. The higher the ratio, the more risk the insurer
bears in relation to capital.
Ultimately, the solvency level of an insurer is critical in providing the protection that is sought by the
supervisor for the policyholders. One of the first “rules of thumb” elaborated was the so called “Kenney
rules”. These relate to premiums and capital. As a useful measure, they are yet to be surpassed for their
simplicity—relating the size of the business to the capital available to support it. More scientific
approaches have been developed, but these rules, as general guidance to conservative and proper
management, still have a sense of reality and insurers that venture far from these basics do so at their
peril.
The distribution of premium by class of business should be considered when analysing this ratio.
Insurers with a larger portion of premium from riskier and longer-tail classes of business should
generally maintain a lower ratio because their results can be more variable. Insurers with stable profits
and adequate reinsurance coverage are better able to sustain a higher ratio than those with losses,
unstable profits, inadequate reinsurance, or reinsurance with weak reinsurers.
It is considered that a ratio of net written premium to capital of more than 300% would be a matter of
concern, although some supervisors would accept ratios of up to 500% for life insurers. The ratio of
gross written premium to capital can also be of interest; thresholds of supervisory concern can vary
between 500% and 900%.
Consider the example of an insurer that writes CU 500 (CU means currency units) of premiums and has
CU 100 of capital. The indicator is therefore 500%. If this insurer has a combined ratio of 120%, it will
experience a loss of CU 100 on the CU 500 of premiums written. This loss will render the insurer
insolvent. The example illustrates why insurers need to place prudent limits on their business volumes.
7
1.03 Capital / total assets This indicator is calculated as the ratio of capital to total assets. Capital can be determined as total
assets less total liabilities. Assets are not risk-weighted.
This indicator measures the extent to which the capital of an insurer can bear asset risks. For example,
some real estate investments might lose value because of market declines or some receivables might be
uncollectible, either of which would adversely affect capital.
It complements the capital adequacy ratios calculated based on the methodology required by
regulation. Also, it measures financial leverage and is sometimes called the leverage ratio.
Since the life insurance business is generally longer-term and more asset intensive, care should be taken
in comparing the ratios of life insurers and nonlife insurers.
1.04 Capital / invested assets [FSI] This indicator is calculated as the ratio of capital to invested assets. Capital can be determined as total
assets less total liabilities. Invested assets are not risk-weighted.
This indicator measures the extent to which the capital of an insurer can bear asset risks related to its
investments. For example, some real estate investments might lose value because of market declines or
some issuers of bonds in which the insurer has invested might default on their obligations, either of
which would adversely affect capital.
1.05 Capital / technical provisions This indicator is calculated as the ratio of capital to technical provisions. Capital can be determined as
total assets less total liabilities.
This indicator provides a measure of the extent to which the capital of an insurer can bear liability risks.
For example, a nonlife insurer’s claims provisions might turn out to have been inadequate estimates of
the ultimate claims costs or a life insurer might experience unexpectedly high claims because of an
epidemic, either of which would adversely affect capital.
In the case of long-term life insurance business, premiums received in the year are not as reliable a
proxy for the risk assumed as for nonlife insurers. Technical provisions might provide a more reliable
proxy for the risk.
1.06 Cover of solvency margin This indicator is calculated as the ratio of available solvency to required solvency.
Available solvency can be determined fundamentally as total assets less total non-capital liabilities. Non-
capital liabilities are liabilities other than those arising from the issuance of a capital instrument, such as
preferred shares, by the insurer. It is also possible to reduce the available solvency by excluding some
assets that might be judged as not being available or by increasing some liabilities that might be
considered less likely to be sufficient to absorb losses. Accordingly, the available solvency definition may
include some adjustments for such considerations, which need to be considered when interpreting the
results.
8
In different jurisdictions, the required solvency margin takes different forms. One major form is an
index-based method, where the required margin is defined in terms of the greater of several
calculations, such as a fixed amount, a percentage of premiums, and a percentage of claims provisions.
A more complex approach can apply different premiums and claims factors to different classes of
business based on the perceived risk. The second major form is a risk-based capital adequacy
requirement.
Given that the “required” solvency is a legal obligation on the insurer, then a ratio that is less than 100%
indicates a breach. In some jurisdictions, a higher value is considered as appropriate and so a figure
below a control level, such as 200%, may be a trigger for supervisory intervention.
1.07 Risk-based capital adequacy ratios This indicator is calculated as the ratio of available capital to required capital.
Available capital can be determined fundamentally as total assets less total non-capital liabilities. Non-
capital liabilities are liabilities other than those arising from the issuance of a capital instrument, such as
preferred shares, by the insurer. It is also possible to reduce the available capital by excluding some
assets that might be judged as not being available or by increasing some liabilities that might be
considered less likely to be sufficient to absorb losses. Accordingly, the available capital definition may
include some adjustments for such considerations, which need to be considered when interpreting the
results. Available capital is sometimes classified into various “tiers” of quality, in which case indicators
would be calculated not only using total available capital but also using only the highest tier(s).
In different jurisdictions, the calculation of required capital takes different forms. One major form is a
factor-based method, where the required capital is calculated by applying risk weights to various
parameters, such as premiums, technical provisions, and assets, with the risk weights varying according
to the relative risks of adverse changes in the parameters. Risk-based capital adequacy requirements
might also apply factors to various values but might combine these “capital charges” following the
statistical theory by squaring the values before adding them and then taking the square root of the
result. In some jurisdictions, insurers are required to apply stress scenarios to calculate the
requirements.
Given that the “required” capital is a legal obligation on the insurer, then a ratio that is less than 100%
indicates a breach. In some jurisdictions, a higher value is considered as appropriate and so a figure
below a control level, such as 200%, may be a trigger for supervisory intervention.
1.08 Growth in capital This indicator is calculated as the ratio of the change in capital during the measurement period to capital
at the end of the previous measurement period.
The growth in capital measures improvement or deterioration in an insurer’s financial condition during
the year. The usual range for the ratio is between -10% and 50%.
The lower limit is set more conservatively because a decrease in capital is a cause for concern. If the
indicator falls below this limit, the reasons for the change should be determined, as well as whether
these factors will be repeated in future years.
9
The upper limit is used because experience has shown that some insurers have reported dramatic
increases in capital prior to their failure. Large increases in capital may indicate instability, the shifting of
capital from other companies within a group, significant growth, or mergers and acquisitions.
1.09 Net growth in capital This indicator is calculated as the ratio of the change in capital during the measurement period, net of
capital contributed during such period, to capital at the end of the previous measurement period.
The net growth in capital, net of capital contributed, measures improvement or deterioration in an
insurer’s financial condition during the year based on operational results. Changes in surplus notes,
capital contributions, and adjustments to capital are removed to highlight the insurer’s operations. The
usual range for the ratio is between -10% and 50%.
The lower limit is set more conservatively because a decrease in capital is a cause for concern. If the
indicator falls below this limit, the reasons for the change should be determined, as well as whether
these factors will be repeated in future years.
The upper limit is used because experience has shown that some insurers have reported dramatic
increases in capital prior to their failure. Large increases in capital may indicate instability, significant
growth, or mergers and acquisitions.
1.10 Statutory deposit / required deposit This indicator is calculated as the ratio of the actual statutory deposit of an insurer at the reporting date
to the required deposit.
In some jurisdictions, insurers are required by law to deposit cash or high-quality fixed-income
securities, such as government bonds, with the supervisor or in a trust account. The requirement might
be a fixed amount, a percentage of premiums, a percentage of the minimum required capital, or the
highest of two or more of these amounts. The deposits provide liquid assets that are readily accessible
in the event an insurer fails. Insurers seldom deposit any more assets than are required. A ratio of less
than 100% indicates a breach of the requirement.
Assets
2.01 (Real estate + unquoted equities + receivables) / total assets This indicator is calculated as the ratio of the sum of real estate assets, unquoted equities, and
receivables to total assets.
Assets can be categorized as:
• investments of the insurer;
• amounts owing to the insurer from third parties, including premiums that have yet to be
received from policyholders and intermediaries;
• other operating assets such as equipment; and
• amounts owing from reinsurers.
Ultimately, the supervisor is interested in the quality of the asset portfolio, its appropriateness reflecting
the nature of the business mix on the liability side of the balance sheet, any potential source of
10
concentration of counterparty risk, and the liquidity of the assets compared to the needs of the insurer
to meet its obligations to policyholders as they fall due.
One indicator of asset quality is the share of real estate, unquoted equities, and receivables in total
assets. These asset classes have the largest probability of being impaired. Both real estate and unquoted
equities are illiquid assets, with real estate often being difficult to value in many jurisdictions. Quoted
equities should also be included in jurisdictions where they are illiquid or not regularly traded, as should
other assets, which may have similar characteristics. Receivables may expose the insurer to a
considerable credit risk and overstate assets if there are insufficient provisions for uncollectible debts.
Some supervisors would consider a ratio of 40% or more to be of concern.
2.02 Real estate / total assets This indicator is calculated as the ratio of real estate assets to total assets.
It is an indicator of asset quality. Real estate can have a high probability of being impaired. It is an illiquid
asset, which is often difficult to value in many jurisdictions.
Some supervisors would consider a ratio of 20% or more to be of concern. However, in jurisdictions
where investment markets are not well developed, supervisors might be prepared to accept larger
shares of investment in real estate.
2.03 Real estate / capital This indicator is calculated as the ratio of the real estate assets to capital.
It is an indicator of the exposure of an insurer to risks arising from real estate assets. Real estate can
have a high probability of being impaired. It is an illiquid asset, which is often difficult to value in many
jurisdictions.
This ratio shows the extent to which an insurer’s capital might be adversely affected by problems with
its real estate assets. If the ratio is high, then a relatively small deterioration in the value of real estate
could have a large effect on capital.
2.04 (Real estate + mortgages) / total assets This indicator is calculated as the ratio of the sum of real estate assets and mortgages to total assets.
In some jurisdictions, insurers are exposed to risks in the real estate market not only through
investments in real estate but also through mortgage lending. Mortgage lending subjects an insurer to
counterparty credit risk. Also, mortgage loans are secured by real estate, the valuation and liquidity of
which can be of concern in the event of default. Real estate and mortgage loans may be overstated.
Excessive investment in real estate and mortgage loans, investment in non-income producing real
estate, and overdue or restructured mortgage loans are relatively common sources of financial difficulty.
Some supervisors would consider a ratio of 30% or more to be of concern. However, in jurisdictions
where investment markets are not well developed, or for life insurers that are using mortgages to match
long-term liabilities such as annuities, supervisors might be prepared to accept higher ratios.
11
2.05 Maximum deposits in a single bank / total assets This indicator is calculated as the ratio of the outstanding total deposits by an insurer in the single bank
that holds the maximum deposits by the insurer to the total assets of the insurer.
In virtually all jurisdictions, banks are regulated financial institutions, and are typically high-quality
counterparties. However, large deposits in a single bank expose an insurer to concentration risk. Such
concentrations can also create significant cross-sectoral exposures, potentially creating systemic risk if a
bank was to fail. Furthermore, although bank deposits are typically liquid, they seldom generate
sufficient rates of return to contribute significantly to the profitability of the insurer.
Some supervisors would consider a ratio of 25% or more to be of concern. However, in jurisdictions
where investment markets are not well developed, supervisors might be prepared to accept higher
ratios.
2.06 (Cash + loans + investments) / total assets This indicator is calculated as the ratio of the sum of cash, loans, and investments to total assets.
The total of cash, loans, and other investments as a share of an insurer’s total assets is an indicator of
the extent to which assets are available for or being used as investments. A higher ratio is more
desirable than a lower ratio, because it indicates the insurer has a high proportion of tangible assets
which can be invested to earn income or sold to meet obligations.
The benchmark for supervisory concern might depend on the extent to which an insurer is engaged in
investment activities versus other activities. For example, some insurers will have significant non-
investment assets used in their operations, such as equipment and software. Some supervisors would
consider a ratio of less than 60% to be of concern.
2.07 Receivables / (gross written premium + reinsurance recoveries) This indicator is calculated as the ratio of receivables to the sum of gross written premium and
reinsurance recoveries.
It provides an indication of the level of credit control exercised by an insurer in collecting these key
items of revenue. A high ratio suggests that the credit policy and collection practices of the insurer are
weak, which would be of particular concern if receivables are a relatively large proportion of assets.
Debtors are often either policyholders or intermediaries in the case of premium income or reinsurers in
the case of reinsurance recoverables. Receivables may expose the insurer to a considerable credit risk
and overstate assets if there are insufficient provisions for collection problems.
Both the credit worthiness of the counterparties and concentrations of credit risk should be examined.
The aging of receivables should also be analyzed. If there is a likelihood of not being able to collect
receivables, adequate provision should be made.
2.08 Receivables / capital This indicator is calculated as the ratio of receivables to capital.

12
If receivables are high, the insurer’s capital might be significantly eroded if the receivables cannot be
collected. Acceptable maximum ratios established by supervisors are typically 40-50%, although some
would accept up to 100%.
Receivables from policyholders and intermediaries as a percentage of capital is a particularly useful
indicator of potential problems.
Reinsurance recoverables (amounts owing from reinsurers or amounts that are expected to be claimed
— the difference between gross and net (of reinsurance) technical provisions) can represent a large part
of the insurer’s balance sheet. Determining the extent of this exposure is important as it may be
necessary, if the ratio is at a level that is of concern, to gain some assurance as to the underlying credit
risk represented. Reinsurance recoverables may be high because reinsurance ceded is high, the insurer
has had some large claims, or its reinsurers are slow in paying.
Both the credit-worthiness of the counterparties and concentrations of credit risk should be examined.
The aging of receivables should also be analyzed. If there is a likelihood of not being able to collect
receivables, adequate provision should be made.
2.09 (Non-performing investment assets and loans + receivables over 90 days) / total
assets Ratios that relate to more general credit quality can be borrowed from the banking analysis. These
would address assets that may be defined as “non-performing” or the general structure of ageing of
debts.
This indicator is calculated by taking the value of non-performing investment assets and loans, as well as
receivables over 90 days, less the value of specific provisions (to the extent they have not already been
deducted in calculating the reported asset values) as the numerator and total assets as the
denominator.
Non-performing assets and long-outstanding receivables may expose the insurer to a considerable credit
risk and overstate assets if there are insufficient provisions for collection problems. Low-quality assets
such as these should account for a small portion of total assets. Some supervisors would consider a ratio
of 3% or more to be of concern, while others would accept up to 10%.
2.10 Receivables over 90 days / total receivables This indicator is calculated as the ratio of receivables over 90 days to total receivables.
It provides an indicator of the level of credit control exercised by an insurer. A high ratio suggests that
the credit policy and collection practices of the insurer are weak, which would be of particular concern if
receivables are a relatively large proportion of assets.
Debtors are often either policyholders or intermediaries in the case of premium income or reinsurers in
the case of reinsurance recoveries.
Both the credit worthiness of the counterparties and concentrations of credit risk should be examined.
The aging of receivables should also be analyzed. If there is a likelihood of not being able to collect
receivables, adequate provision should be made. Long-outstanding receivables may expose the insurer

13
to a considerable credit risk and overstate assets if there are insufficient provisions for collection
problems. Long-outstanding receivables should account for a small portion of total receivables.
2.11 Equities / total assets This indicator is calculated as the ratio of equities to total assets. Other investments that are like
equities, such as mutual funds and hedge funds, should be included in the numerator. However, equity
investments that are on the balance sheet of the insurer but in fact are part of risk pass-through
products, such as unit-linked life insurance, should be excluded from both the numerator and
denominator.
This indicator reveals the degree of an insurer's exposure to stock market risk and fluctuations of the
economy.
If the proportion of equities in total assets is significant, further examination of the portfolio
composition is necessary, with special emphasis on the possible correlation of exposure on the asset and
liability sides of the balance sheet.
In fact, the need to consider both sides of the balance sheet simultaneously is more general. While the
indicators of asset quality are the same for both life and non-life insurers, they need to be evaluated in
the context of the nature of an insurer’s business. For instance, it would be reasonable for a life insurer
or a non-life insurer with long-tail liabilities to have a relatively larger proportion of assets invested in
riskier (e.g., equities) or less-liquid (e.g., real estate) assets than a non-life insurer with short-term
business, as the yield on these assets can be expected to better match the future obligations. Also, some
risk management tools and hedging strategies, including the use of derivatives, might lower the
aggregate (matched) risk, even though they may appear to add risk if analyzed separately.
Some supervisors would consider a ratio of 30% or more to be of concern.
2.12 Non-performing loans / total gross loans This indicator is calculated by using the value of non-performing loans (including mortgages) as the
numerator and the total value of the loan portfolio (including non-performing loans, and before the
deduction of specific loan loss provisions) as the denominator.
It helps to identify problems with asset quality in the loan portfolio.
Some insurers include banking activities on the asset side of their balance sheet by direct lending to
financial and nonfinancial companies. Loans other than mortgages form a substantial part of
investments by life insurers in some countries, and this type of asset has been one of the key problems
in insurance failures in these countries.
The benchmark for supervisory concern should be consistent with that used by the banking supervisor in
the jurisdiction, with respect to loan portfolios of similar composition.
2.13 Maximum investment in a single counterparty / total assets This indicator is calculated as the ratio of the maximum investment by an insurer in a single
counterparty to the total assets of the insurer. The numerator should include all investments in and
loans to the counterparty, including persons related to the counterparty, such as companies within a
group.
14
An insurer’s investments should be diversified. This ratio provides an indication of the extent to which
investments lack diversification. Concentration in a single counterparty not only exposes an insurer to
credit risk but also, depending on the relationship with the counterparty, might affect the insurer’s
ability to take other decisions. For example, an insurer might invest in a company in order to sell
insurance coverage to it, which could affect the insurer’s decisions on underwriting and claims matters.
Some supervisors would consider a ratio of 10% or more to be of concern.
2.14 Maximum receivable from a single counterparty / total assets This indicator is calculated as the ratio of the maximum receivable from a single counterparty to the
total assets of the insurer. The numerator should include all debts of the counterparty, including persons
related to the counterparty, such as companies within a group.
An insurer should not be unduly exposed to any one debtor. This ratio provides an indication of the
extent to which receivables lack diversification. Concentration of receivables in a single counterparty not
only exposes an insurer to credit risk but also, depending on the relationship with the counterparty,
might affect the insurer’s ability to take other decisions. For example, an insurer might extend credit to a
policyholder or intermediary with respect to the payment of premiums in order to sell insurance, which
could affect the insurer’s decisions on underwriting and claims matters.
Some supervisors would consider a ratio of 5% or more to be of concern.
2.15 Gross asset position in financial derivatives / capital This indicator is calculated by using the market value of financial derivative assets as the numerator and
capital as the denominator. It is an asset quality ratio and provides an indication of the exposure of an
insurer’s financial derivative asset positions relative to capital. It should be used in conjunction with the
indicator on the gross liability position in financial derivatives. Together, they can provide some insight
on the insurer’s risk management strategy.
2.16 Gross liability position in financial derivatives / capital This indicator is calculated by using the market value of financial derivative liabilities as the numerator
and capital as the denominator. It is an asset quality ratio and provides an indication of the exposure of
an insurer’s financial derivative liability positions relative to capital. It should be used in conjunction with
the indicator on the gross asset position in financial derivatives. Together, they can provide some insight
on the insurer’s risk management strategy.
2.17 Investments: distribution by type The distribution of investments by type is not a single ratio. There are many ways that the asset mix can
be determined, depending on the classification of assets in the reports to the supervisor. It would be
normal, in the case of examining the assets that are part of the investment operations, to express the
investments of each type as a percentage of the total investments.
The distribution indicates the extent to which investments are diversified amongst different types of
investment.
The insurer would normally consider the market value of the investments when conducting its
investment operations regardless of whether this is the basis of the values in the balance sheet in the
15
jurisdiction. It is useful, in the case that the balance sheet is not based on market values, for the
supervisor to have access to the market values so that asset mix ratios can be calculated on this basis.
The distribution of investments should be assessed with reference to both regulatory requirements for
diversification and the insurer’s investment policy. Reasons for any significant changes in the
distribution of investments should be investigated. For example, changes in the investment mix might
be triggered by changes in ownership and management or changes in the business focus of the insurer.
Some supervisors would consider a change of 10% or more in the share of any type of investment to be
of potential concern. Other supervisors set a threshold based on the average change in the distribution.
For example, supervisors in the USA calculate an indicator as the average of the absolute value of
percentage changes in the shares of each of 16 types of asset, with 5% as the threshold.
2.18 Investments: geographical distribution The geographical distribution of investments is not a single ratio. In examining this distribution, the total
investments in each geographical region would be expressed as a percentage of the total investments.
The distribution indicates the extent to which investments are diversified amongst different
geographical regions. It facilitates the assessment of credit and market risk arising from exposures to
particular countries and helps to assess the impact of adverse events in these countries on an insurer
and the domestic financial system. It is a measure of concentration risk of an insurer.
Investment in foreign assets might enable an insurer to diversify its investment risks and to take
advantage of types of investments not available in the local market. However, given the potential
influence of currency movements on the values of foreign assets, and the fact that liabilities are typically
in the local currency, then it is usual to examine the exposure to foreign exchange risks specifically.
The geographical distribution of investments should be assessed with reference to regulatory
requirements, the insurer’s investment policy, and the insurer’s exposure to foreign currency liabilities.
For example, a large or increasing level of foreign exchange exposure may need to be investigated by
finding out the policy toward and extent of hedging used by the insurer.
In jurisdictions that cover a large and diverse area, supervisors might also assess the distribution of
investments among relevant geographical areas within the jurisdiction. For example, an insurer with a
concentration of investments in one region of the country might be exposed to the risk of significant
losses in the event of an economic downturn or natural catastrophe in that region.
2.19 Investments: sectoral distribution The sectoral distribution of investments is not a single ratio. In examining this distribution, the total
investments in each economic sector would be expressed as a percentage of the total investments.
The distribution indicates the extent to which investments are diversified amongst different economic
sectors. The investments of an insurer should be diversified among various sectors of the economy, to
mitigate the risk of exposure to significant losses in the event of problems that affect a particular sector.
Banking supervisors typically review the sectoral distribution of loans; insurance supervisors might use
the same sectoral breakdown. This would facilitate the sharing of information among supervisors for
both group-wide supervision and macroprudential risk assessment.

16
Reinsurance
3.01 Risk retention ratio [FSI] The risk retention ratio is calculated as the net written premium divided by the gross written premium,
where gross written premium is the sum of written premium on policies issued by the insurer and
reinsurance assumed.
It provides an indication of the extent to which an insurer is willing to retain the insurance risk on the
business that it writes. The risk retention ratio can vary significantly, for example, depending on the type
of business written by the insurer, so it should be calculated by class of business. For example, the risk
retention ratio for short-tail business with high claims frequency, such as comprehensive motor, may
appropriately be high (>80%), whereas the risk retention ratio for fire, engineering or liability business
may appropriately be low (< 20%). If the risk retention ratio is high, the adequacy of the insurer’s capital
to withstand adverse claims experience should be assessed, considering its maximum exposure to a
single risk and to a single event.
Risk retention ratios will not be the same in all countries but will vary based on market circumstances in
each jurisdiction. However, where risk retention ratios are low relative to the industry then this may
suggest that the insurer is either purchasing far more reinsurance than its peers or that it is paying more
than would be expected for a similar amount of cover. If the insurer purchases more than the usual level
of reinsurance then it is possible that it may feel, implicitly or explicitly, that it does not have the capital
available to allocate to the risk as much as other insurers.
If the use of reinsurance is particularly high, a practice known as “fronting”, then an insurer may
consider itself to be largely immune to the underlying risk. In some cases, for example, an insurer may
be presented with a risk that it would not normally accept but it is also presented with a corresponding
reinsurance contract that means that the insurer would appear to bear little of the insurance risk. In
such cases, the insurer may decide to write the policy and take out the reinsurance contract and simply
to make a profit from the reinsurance commissions it will receive. Fronting has its dangers to the insurer
and does not represent best practice. First, an insurer should remember that the reinsurer may fail to
deliver on the reinsurance contract resulting in the insurer being on risk in full. Second, from a public
policy perspective, fronting is a means of getting around requirements to be licensed in the domicile. It
is a practice that, in effect, amounts to the insurer renting its license to conduct insurance business to
others. If fronting appears to be happening, the supervisor should carefully check the reinsurance
arrangements to ensure the insurer has reinsured its business adequately, including its inward
reinsurance, and that its reinsurers are good credit risks.
In some circumstances, the pricing cycle in the reinsurance market will play into an insurer’s attitude
toward ceding risk. If reinsurance is relatively cheap then the cost benefit analysis will make reinsurance
relatively more attractive and it may make sense for an insurer to increase the amount of risk that it
cedes to reinsurers, taking advantage of the lower costs. As a result, changes in reinsurance retention
rates need to be interpreted in the context of costs and prices in the reinsurance markets more
generally. Understanding the insurer’s ratios will be informed by an understanding of the behavior of
the market and the reaction of other insurers to the same changes to pricing of reinsurance.
Where the use of reinsurance shows a change over time, either decreasing or increasing, it suggests that
the insurer is changing its reinsurance policy and practice. A supervisor should be interested in knowing
17
the reasons for change with some certainty. Is the insurer feeling that the exposure to risk has
increased? Are they of the view that their capital situation should be less exposed? Are they concerned
that their capital position is, in some way, less secure?
3.02 (Reinsurance recoveries + reinsurance commissions) / reinsurance ceded This indicator is calculated as the ratio of the sum of reinsurance recoveries and reinsurance
commissions to reinsurance premiums ceded.
It measures how much an insurer receives back from its reinsurers in terms of claims recoveries and
commissions compared to the reinsurance premiums it has paid. The indicator should be examined over
time and by class of business.
A high ratio might indicate that an insurer has experienced adverse claims or has successfully negotiated
favorable terms for its reinsurance. Over time, it is unlikely that the ratio would be more than 100%,
because this would indicate that reinsurers are losing money on the relationship.
A low ratio might indicate that an insurer is having a good period of claims experience. However, it
might also indicate that the insurer is paying a high price for its reinsurance. Where an insurer is paying
more than its peers for reinsurance protection, then this would indicate that the reinsurers feel that the
portfolio of the insurer is poor.
3.03 Maximum exposure to single risk / capital This indicator is calculated as the ratio of the maximum exposure to a single risk (sometimes referred to
as the per-risk retention limit) to capital.
It indicates the extent to which the solvency of the insurer is exposed to a large claim. The indicator may
differ by class of business.
Acceptable maximum ratios established by supervisors are typically 2-5%.
3.04 Maximum exposure to single event / capital Increasingly, with the use of more complex risk management and measurement techniques, insurers
have sought to determine a maximum that they will have to pay out in the case of a single catastrophic
event (the Maximum Event Retention or “MER”), or the maximum total claims that they may have to
pay in the event of a probable but very unlikely event (sometimes referred to as the Probable Maximum
Loss / Claim or “PML”). These events can be described in terms of their low probability, or “return
period” where an event with a probability of 0.5% in a year would have a “return period” of 200 years or
be described as a “one-in-200 year” PML event.
The supervisor will be unlikely to receive sufficient information in the financial returns to calculate the
MER or PML themselves, but the insurers can report the figures that they have determined to the
supervisor. It can also be interesting to know the event that would lead to the MER or PML.
The MER can then be compared with the capital available. This can indicate whether the insurer would
still be commercially solvent if the event occurred, or how many such events the insurer could withstand
before it would have an asset deficiency. Acceptable maximum ratios established by supervisors are
typically 5-10%.
18
3.05 Maximum premium ceded to a single reinsurer / gross written premium This indicator is calculated as the ratio of the premium ceded by an insurer to the single reinsurer that
has assumed the most reinsurance from the insurer, compared to the gross written premium of the
insurer.
Large cessions of reinsurance to a single reinsurer expose an insurer to counterparty concentration risk,
should the reinsurer become unwilling or unable to meet its obligations. The concentration might be a
related-party risk, if the insurer and reinsurer are members of the same group. Reinsurance
concentrations might also create systemic risk, if several insurers are significantly exposed to the same
reinsurer.
Actuarial
4.01 Net claims provisions / average of net claims paid in last three years This indicator is calculated as the ratio of net claims provisions to the average of net claims paid in the
last three years.
Differences in this indicator amongst insurers with similar portfolios of insurance business can provide
insight on the relative conservatism of their claims provisioning. Changes over time for a particular
insurer might indicate changes in its claims handling or provisioning practices.
Claims provisions will vary in their method of estimation, the extent that they involve human judgment,
and the extent to which information is available for the assessment of the claim. Claims that are in the
final stages of settlement may well have a clearly-defined outstanding amount that can represent the
provision. More generally, however, the ultimate cost of the claim is an estimate. In addition, the insurer
will have claims that have been incurred but not reported (IBNR), so will have no information about
these except experience. But the fact that it is certain that some claims will be reported later, and the
need to ensure that the insurer correctly represents its liabilities, means that it should have these
provisions.
Given the subjective nature of establishing claims provisions, close examination is needed to assess
whether the provisions established can be viewed as adequate. Insurers may understate their claims
provisions for reasons that can vary from errors or omissions to deliberate attempts to inflate profits (or
to avoid presenting a loss). In between these extremes, there is the potential for misplaced optimism or
the use of a method that is inappropriate. Alternatively, the actual experience may change, or the
insurer may be able to, because of careful study and improved procedures, adopt a more accurate
estimate than they were able to do in the past. Claims-based ratios will also be influenced by the
insurer’s claims handling procedures and administrative processes that can alter the timing of claims
settlement and influence the ratios.
Where the ratio of claims provisions to claims paid shows a decreasing trend then this may indicate a
weakening of the provisions and should be investigated. It may also indicate that the insurer has been
speeding up the claims settlement administration or that there have been some large cases that
distorted the trend—but such alternative contentions would need to be supported by some other
evidence before they were accepted by the supervisor. Hopefully, management would have already
investigated such a trend and be able to substantiate the reason. Deficiencies in provisions are of the
greatest concern to the supervisor.
19
4.02 Net technical provisions / average of net written premium in last three years This indicator is calculated as the ratio of net technical provisions to the average of net written premium
in the last three years.
Differences in this indicator amongst insurers with similar portfolios of insurance business can provide
insight on the relative conservatism of their provisioning. Changes over time for a particular insurer
might indicate changes in its provisioning practices.
Technical provisions for non-life insurers include unearned premium provisions, unexpired risk
provisions, and claims provisions. Technical provisions for life insurers are typically dominated by
actuarial (mathematical) provisions, with claims provisions accounting for a relatively small part of
technical provisions.
The mechanism for recognizing the premium as being “earned” is perhaps the least judgmental of all the
provisions, so the ratio should be of lower supervisory interest. However, it is still important to check it
because movements in the ratio can result from either errors in the data submitted by the insurer (that
would need to be corrected to ensure a robust analysis of other items) or deliberate misstatement (that
would be a cause for supervisory intervention).
As unearned premium is a function of the premium rates themselves, then the unearned premium
provisions will underestimate the actual resources needed to cover future risks if the premium rates are
not adequate. Where this is the case, then it is pertinent to consider whether an additional provision for
unexpired risk should be made and, if such a provision has been made, whether it is sufficient.
Claims provisions have already been discussed.
Actuarial provisions are calculated using various methods and assumptions about the future cash flows
under the insurance policies. Their amounts can be very sensitive to the assumptions, such as the rates
of interest used to discount the future cash flows.
When the ratio of technical provisions to premiums is decreasing, it could indicate a weakening of one
or more of the types of provisions, which should be investigated.
4.03 Net claims provisions / capital This indicator is calculated as the ratio of net claims provisions to capital.
Like the ratio of capital to technical provisions, this indicator provides a measure of the extent to which
the capital of an insurer can bear liability risks. However, it focuses on claims provisions, the relative size
and potential for misestimation of which are more likely to be significant for a non-life insurer than a life
insurer.
Claims recoverable from reinsurers are deducted from gross claims provisions on the assumption that an
adverse deviation in claims provisions will in part be funded by reinsurers.
Some supervisors consider a ratio of 250% or more to be of concern.
A simplified example shows the usefulness of this indicator. Consider an insurer with no reinsurance and
no liabilities except 1,000 in claims provisions. Assume the insurer’s ratio of net claims provisions to
capital is 1,000%. This implies that the assets of the insurer are 1,100 and its capital is 100. Now, assume
20
that the actuary re-estimates the claims provisions and discovers an adverse deviation of 10%. Claims
provisions increase by 100 to 1,100, assets stay the same at 1,100 and capital thus decreases to 0,
leaving the insurer insolvent.
4.04 Claims development This indicator measures the development of unpaid claims and claims adjustment expenses based on
claims paid during the last five years, plus the current provision, compared to the initial provisions
established for those claims. For purposes of this calculation, the claims provision at the beginning of
the five-year period is considered the “initial provision” for claims incurred more than five years ago.
Particularly for long-tail business, insurers may report their expected future claim payments from the
existing business as well as their past claim payments based on both the year of the occurrence of the
claim event and the year (or expected year) of the claim payments. If this is done, then it is possible to
examine the claims paid in the latest accounting period compared to those expected when the
provisions were determined the previous year, and to make such comparisons over several years.
If the ratio that compares the actual claims plus the current provision to the initial provisions that were
established is materially greater than 100%, then this suggests that the claims experience might have
deteriorated or that claims provision were intentionally understated, and future claims provisions
should also show a corresponding increase. Again, the counter position is that claims may simply be
being settled more quickly—an argument that the total claims outcome remains largely unchanged and
that future payment expectations might be reduced. Interpreting this ratio, and the action that may be
appropriate, would also be informed by understanding the method used by the insurer in setting these
provisions. Some methods, such as a target overall claim ratio, will automatically take credit for claims
being paid earlier, whether this is actually the case. Other methods, such as the chain ladder methods,
will more gradually reflect both changed experience that is either positive or negative.
Some supervisors consider a ratio of 120% or more to be of concern, while others take a more
conservative approach and would investigate any situation where the ratio exceeds 100%.
The results should be interpreted with care. It is best to calculate the ratios by class of business because
different classes can be expected to show different behaviors and business volume and mix changes will
influence the aggregate results. For long-tail business, if the information is available, it may also be
informative to calculate the ratio separately for each year of claim event.
Note that this ratio needs to be interpreted being aware that claims provisions should correctly include
an allowance for expenses related to claims payments (claims adjustment expenses), whereas the actual
amounts of such expenses might be reported separately from the claims paid.
4.05 Underwritten business: distribution by class of business The distribution of underwritten business by class of business is not a single ratio. In examining this
distribution, the written premiums in each class of business would be expressed as a percentage of the
total written premiums.
The distribution indicates the extent to which the business of the insurer is diversified amongst different
classes of business. Such diversification can help to mitigate the risk of exposure to significant losses in
the event of problems that affect a particular class of business. However, insurers should not diversify

21
beyond their capacity to understand and manage the risks in the classes of business that they
underwrite.
The starting point is to summarize the business mix in terms of the proportion of premium for the
insurer which comes from each main class of business and to reflect on how this compares with
previous years. Reasons for any significant changes in the distribution of business should be
investigated. Changes in business mix can reflect positive management action. Alternatively, they can
reflect “accidental” increase in exposure to less profitable segments through inadequate pricing. The
business mix and the trends in the mix will inform the analysis of other ratios.
A large increase in volume in a class of business may signal a sudden change whereby the insurer has
entered a new product area, distribution niche, or sales territory. It would be a concern if an insurer did
so without recognizing that it will have limited experience regarding the risk in this new area. There have
been cases where insurers have viewed such growth positively up until they start to see the claims
emerge to such an extent that they realize that they were, in fact, writing a disproportionate share of
the poorer quality risks.
Some supervisors set a threshold based on the average change in the distribution. For example,
supervisors in the USA calculate an indicator as the average of the absolute value of percentage changes
in the shares of each of 9 main classes of life insurance business, with 5% as the threshold.
4.06 Underwritten business: geographical distribution The geographical distribution of underwritten business is not a single ratio. In examining this
distribution, the written premiums in each geographical region would be expressed as a percentage of
the total written premiums.
The distribution indicates the extent to which the business of the insurer is diversified amongst different
geographical regions. Underwriting business in foreign jurisdictions might enable an insurer to diversify
its insurance risks. Such diversification can help to mitigate the risk of exposure to significant losses in
the event of problems that affect a region.
However, insurers should not diversify beyond their capacity to understand and manage the risks in the
markets in which they underwrite business. Given the potential for foreign operations to create
problems for an insurer, it is usual to examine the exposure to foreign business.
The geographical distribution of insurance business should be assessed with reference to regulatory
requirements, the insurer’s business plans, and the insurer’s management capabilities. For example, a
large or increasing level of foreign business may need to be investigated by finding out the source of this
business and how it is being managed by the insurer.
In jurisdictions that cover a large and diverse area, supervisors might also assess the distribution of
business among relevant geographical areas within the jurisdiction. For example, an insurer with a
concentration of business in one region of the country might be exposed to the risk of significant losses
in the event of an economic downturn or natural catastrophe in that region.
22
4.07 Underwritten business: sectoral distribution The sectoral distribution of underwritten business is not a single ratio. In examining this distribution, the
written premiums in each economic sector would be expressed as a percentage of the total written
premiums.
Banking supervisors typically review the sectoral distribution of loans; insurance supervisors might use
the same sectoral breakdown. This would facilitate the sharing of information among supervisors for
both group-wide supervision and macroprudential risk assessment.
The distribution indicates the extent to which the business of the insurer is diversified amongst different
economic sectors. The business of an insurer should be diversified among various sectors of the
economy, to mitigate the risk of exposure to significant losses or decreases in premiums in the event of
problems that affect a particular sector. However, insurers should not diversify beyond their capacity to
understand and manage the risks in the markets in which they underwrite business.
4.08 Actuarial assumption: short-term interest rate When calculating actuarial technical provisions and premium rates, the actuary discounts expected
future cash flows using assumed rates of interest. The higher the assumed rate of interest the lower the
result.
Actuaries often use discount rates that vary over time, for example, following a yield curve or grading
from an initial rate to an ultimate rate.
This indicator is the interest rate used for discounting the shortest-term cash flows.
Although interest rate assumptions often differ amongst actuaries, supervisors should assess the
reasonableness of the assumptions in light of market conditions. Supervisors should seek explanations
of significant changes from one valuation to the next that are not consistent with changes in market
conditions and for outliers amongst the assumptions used for different insurers.
4.09 Actuarial assumption: long-term interest rate When calculating actuarial technical provisions and premium rates, the actuary discounts expected
future cash flows using assumed rates of interest. The higher the assumed rate of interest the lower the
result.
Actuaries often use discount rates that vary over time, for example, following a yield curve or grading
from an initial rate to an ultimate rate.
This indicator is the interest rate used for discounting the longest-term cash flows.
Although interest rate assumptions often differ amongst actuaries, supervisors should assess the
reasonableness of the assumptions in light of market conditions. Supervisors should seek explanations
of significant changes from one valuation to the next that are not consistent with changes in market
conditions and for outliers amongst the assumptions used for different insurers.

23
Management
5.01 Gross written premium per employee The ratio of gross written premium to the number of employees is an indicator of operational efficiency,
which is likely to be correlated with general management soundness. Unsound efficiency indicators
could flag potential problems in key areas, including the management of insurance and investment risks.
Gross written premium is used as a proxy for the overall volume of business activity. The analysis needs
to reflect the difference in results that single premium versus annual premium business will have on this
indicator. The employees included in the denominator should be appropriately matched to the premium
included in the numerator; for example, if the gross written premium relates only to business within the
local jurisdiction then only employees whose activities relate to that business should be included.
It also needs to be considered that insurers may use different distribution channels to sell their products
and sometimes may spin off their distribution into subsidiaries or other companies in a group. This can
affect the number of employees; for example, employees of the insurer working in its branch offices or
agencies would be included in the denominator, while employees of a related bank that are selling
bancassurance would not be. In general, internet and call-center distribution are cheaper than using
brokers or agents, and these factors should be considered when interpreting the results. The same
indicator can be calculated for both life and non-life insurers, but the benchmarks will be different
because the life insurance business is more asset-intensive and its distribution costs are usually front-
loaded into the initial policy years. A significant change in the indicator for a particular insurer might
indicate a significant change in its business model, which would warrant further analysis and enquiry.
5.02 Assets per employee The ratio of assets to the number of employees is an indicator of operational efficiency, which is likely to
be correlated with general management soundness. Unsound efficiency indicators could flag potential
problems in key areas, including the management of insurance and investment risks.
Assets is used as a proxy for the overall volume of business activity. The same indicator can be
calculated for both life and non-life insurers, but the benchmarks will be different because the life
insurance business is more asset-intensive. This indicator might also be compared to the ratios of other
financial institutions, such as banks, in the jurisdiction. A significant change in the indicator for a
particular insurer might indicate a significant change in its business model, which would warrant further
analysis and enquiry.
5.03 Operating expenses / gross written premium The ratio of operating expenses to gross written premium is an indicator of operational efficiency, which
is likely to be correlated with general management soundness. Unsound efficiency indicators could flag
potential problems in key areas, including the management of insurance and investment risks.
Gross written premium is used as a proxy for the overall volume of business activity. The analysis needs
to reflect the difference in results that single premium versus annual premium business will have on this
indicator; this might be done by weighting single premiums at 10% to reduce the distortion that might
be caused by single premium business, which sometimes fluctuates significantly in response to changes
in the interest-rate environment.
24
This indicator is similar to and should be considered in conjunction with the insurer’s expense ratio.
5.04 Personnel expenses / gross written premium The ratio of personnel expenses to gross written premium is an indicator of operational efficiency, which
is likely to be correlated with general management soundness. Unsound efficiency indicators could flag
potential problems in key areas, including the management of insurance and investment risks.
Gross written premium is used as a proxy for the overall volume of business activity. The analysis needs
to reflect the difference in results that single premium versus annual premium business will have on this
indicator; this might be done by weighting single premiums at 10% to reduce the distortion that might
be caused by single premium business, which sometimes fluctuates significantly in response to changes
in the interest-rate environment.
It also needs to be considered that insurers may use different distribution channels to sell their products
and sometimes may spin off their distribution into subsidiaries or other companies in a group. Such
factors should be considered when interpreting the results. For example, although Internet and call-
center distribution might be cheaper than using intermediaries, they might result in higher personnel
expenses and lower commission expenses, which will affect the indicator. Accordingly, this indicator
should be considered in conjunction with the insurer’s expense ratio.
5.05 Growth in gross written premium This indicator is calculated as the ratio of the change in gross written premium from that of the previous
year, compared to the gross for written premium of the previous year. In both the numerator and the
denominator, single premiums should be weighted at 10% to reduce the distortion that might be caused
by single premium business, which sometimes fluctuates significantly in response to changes in the
interest-rate environment.
If an insurer is growing its written premium quickly, this may indicate that the insurer is under-pricing its
products or that underwriting standards are being relaxed. Alternatively, it may indicate that the insurer
has simply increased its effectiveness in the market or that it is successfully increasing premium rates. If
growth rates show a marked decline, it may be that an insurer has lost its ability to be competitive in the
marketplace.
If written premium is growing quickly, there is a risk that the insurer’s infrastructure may not be
adequate to properly manage the increased volumes of business. In the extreme, an insurer may
attempt to write more business to increase cash flow to meet current claim payments. This is a
particularly concerning situation. Furthermore, rapid premium growth raises the question of whether
the insurer has sufficient financial resources for the level of risk that it is carrying and, if such growth
were to continue, whether it will need to raise capital in the future.
To interpret premium-based ratios, it is also useful to study industry-wide levels for the equivalent
ratios. More general factors, such as the performance of the economy, levels of inflation,
unemployment, growth rates and the level of growth relative to the general growth in the economy
(usually the level of written premium relative to GDP can be considered) will be reflected in insurance
markets. It is also necessary to be aware of wider developments such as the privatization of a class of
business, changes in the taxation basis that may make a class of business more or less attractive, and
changes in the regulatory environment that may lead to volume changes.
25
Benchmarks for supervisory concern will depend on the rates of growth of the economy and of the
insurance market overall. A typical range for the ratio is between -10% and 25%.
5.06 Growth in net written premium This indicator is calculated as the ratio of the change in net written premium from that of the previous
year, compared to the net written premium of the previous year. In both the numerator and the
denominator, single premiums should be weighted at 10% to reduce the distortion that might be caused
by single premium business, which sometimes fluctuates significantly in response to changes in the
interest-rate environment.
The same factors are relevant to the interpretation of this indicator as for the growth in gross written
premium. However, capital needs are more closely related to the amount of risk retained by an insurer
than the gross amount of business written. Accordingly, the level and pattern of this indicator are
particularly relevant to assessing the effects of growth on capital adequacy.
Benchmarks for supervisory concern will depend on the rates of growth of the economy and of the
insurance market overall. A typical range for the ratio is between -10% and 25%.
5.07 Growth in total assets This indicator is calculated as the ratio of the change in total assets from the end of the previous year,
compared to the total assets at the end of the previous year.
It provides an indicator of an insurer’s ability to increase its assets through its underwriting, marketing,
and investment operations.
Low or negative rates of growth in total assets might arise because of poor claims results, high levels of
surrenders or withdrawals from savings products, high expenses, poor investment results, or large
dividend payments to shareholders.
High rates of growth in total assets might be generated by high levels of sales, particularly of savings
products, exceptional underwriting results, or favorable investment results. They might also arise from
delays in the payment of claims (perhaps accompanied by under-provisioning), revaluation of assets
such as real estate, or the raising of capital by the insurer. Accordingly, the underlying causes of
unexpected levels of growth in total assets, whether positive or negative, should be investigated.
Benchmarks for supervisory concern will depend on the rates of growth of the economy and of the
insurance market overall, along with the rates of return available on investments. A typical range for the
ratio is between -5% and 20%.
5.08 Gross written premium / sum insured This indicator is calculated as the gross written premium divided by the sum insured. It is expressed as a
multiple of the local currency units (CU), for example, X CU per 1,000 CU of sum insured.
The premium as a proportion of total sums insured may give an indication of the average policy charge
and, all other things being equal, will rise as prices increase. The ratio will vary significantly with the type
of business written by the insurer, so it should be calculated by class of business. It is likely to be less
reliable for small portfolios or more customized business lines such as commercial business or
reinsurance. But it can be of some indicative value in cases where additional investigation is required to
26
fully prepare for inquiries with the insurer, so that the supervisor is better equipped to interpret the
response of the insurer to these inquiries.
Price levels can be subject to cycles that will flow through to periods where there is upward or
downward pressure on premium volumes. Costs of insurance can also change with changes in such
widely varying factors as weather conditions, crime rates, the nature of safety or security equipment in
general use, or the extent that laws are subject to policing. The results of market analysis should provide
this input.
A smaller business portfolio will impact profitability to the extent that the insurer is not able to reduce
costs, particularly through the effect of fixed costs. An insurer may have simply found that it has had to
reduce prices to remain competitive—giving rise to the suggestion that profitability will be adversely
impacted. At the same time, the insurer may be reducing its prices whilst achieving a greater reduction
in the risk that it holds by increasing the excess or deductibles on claims that it incorporates in its
policies.
5.09 Gross written premium / number of policies This indicator is calculated as the gross written premium divided by the number of policies. It is
expressed in the local currency units (CU), for example, X CU per policy.
The average premium per policy may give an indication of the market segment targeted by an insurer.
For example, a high ratio for individual life insurance might indicate that the insurer is targeting high-
income consumers and a low ratio that it is focused on microinsurance. All other things being equal, the
ratio will rise as prices increase. The ratio will vary significantly with the type of business written by the
insurer, so it should be calculated by class of business. It is likely to be less reliable for small portfolios or
more customized business lines such as commercial business or reinsurance. But it can be of some
indicative value in cases where additional investigation is required to fully prepare for inquiries with the
insurer, so that the supervisor is better equipped to interpret the response of the insurer to these
inquiries.
One example where this may be of use is where the policy terms and conditions and coverage are
largely defined and uniform. Such a situation may exist with respect to compulsory third-party liability
insurance for motor accidents where the policy benefits may be set out in the law. As such, each policy
provides identical cover, so the basic cost is somewhat generic. Such a generic underpin to the product
can illuminate further analysis and make it of greater relevance.
5.10 Complaint index This indicator is calculated as the ratio of an insurer’s share of all complaints against insurers, compared
to the insurer’s share of the market. Market share should be calculated based on gross written
premium. It provides an indicator of the extent to which an insurer treats its customers fairly.
Some classes of business are more likely than others to result in complaints. Therefore, the mix of an
insurer’s business should be considered in interpreting the results. If sufficient data is available, it can be
useful to calculate this indicator by class of business.
Ratios materially higher than 100% should generally trigger investigation by the supervisor.

27
5.11 Pay-out ratio This indicator is calculated as the ratio of dividends to shareholders (or in the case of branches, transfers
to head office) to the net income of the insurer after tax.
It shows how much of the insurer’s net income is being distributed to shareholders in contrast to being
added to retained earnings within the insurer (or retained as assets within the branch). A high ratio may
indicate that the level of dividend might not be supported by profits or might be unsustainable in the
future. It may indicate that the board is being pressured by shareholders (or branch management by the
head office) to make high payouts, which could compromise the financial strength of the insurer. A low
ratio may cause shareholders to be concerned that they are not being sufficiently rewarded and to
wonder whether retained capital is being put to effective use.
This indicator should be considered along with the current and prospective adequacy of the insurer’s
capital, the trend and stability of its net income, and the sources of its net income. For example, if much
of the net income of an insurer has been earned from non-cash items such as unrealized gains on
investments and changes in actuarial assumptions, a high pay-out ratio would be inappropriate.
Some supervisors would consider a pay-out ratio of 40% or more to be of concern.
5.12 Board composition This indicator is calculated as the ratio of the number of unaffiliated board members to the total number
of board members. Board composition should be diverse in many respects, such as expertise and
gender, to help ensure robust oversight. This indicator measures just one aspect of diversity, the
balance between members whose interests might be more aligned with those of management and
those who might bring a more independent perspective.
Earnings
6.01 Claims ratio This indicator is calculated as the ratio of net incurred claims to net earned premium. In both the
numerator and the denominator, amounts include both business underwritten directly by the insurer
and reinsurance assumed from other insurers, reduced by premiums ceded to and claims recovered
from reinsurers, respectively. The ratio can vary significantly with the type of business written by the
insurer, so it should be calculated by class of business. For classes where the amount of business is
small, it is reasonable to expect that the result will be more volatile or extreme.
A significant influence on profit performance is the underlying claims that arise from the business that
the insurer has written. Claims costs are influenced by both the number and the size of claims and the
extent that they are less (or more) than was anticipated in the premiums charged. Here the claims ratio
(or loss ratio) is the conventional longstanding indicator of profitability and underwriting quality. Where
the ratio is high, this indicates that premium rates are too low for the level of risk or that the claims
experience has deteriorated. Either way, the insurer’s profitability will be endangered.
Even where the ratio is low, this may be of some supervisory interest. Where an insurer writes
particularly profitable business then there may be a question as to whether it can do so indefinitely. In
some cases, it is reasonable to expect that it will, due to a specialization in the way that the insurer
markets or manages the product, while in other situations prudent management would consider the
28
alternatives and seek strategies to respond to increased competition or guard against loss of advantage
in the future. It is reasonable to ask what strategies the insurer may have to maintain this particularly
favorable situation into the future and what actions it will consider, by way of having contingency plans
in place, should the profitability of this business come under market pressure.
From a market conduct perspective, a low claims ratio raises the possibility that the insurer’s products
have been priced too high to provide reasonable value to the policyholders, or that claims are being
unfairly adjudicated.
As both the incurred claims and the earned premium values are functions of provisions (for claims and
unearned premiums respectively), then any change in the manner that provisioning is determined will
also influence the ratio.
Benchmarks for supervisory concern will depend on the class of business and the competitiveness of the
insurance market.
6.02 Gross claims ratio This indicator is calculated as the ratio of gross incurred claims to gross earned premium. In both the
numerator and the denominator, amounts include both business underwritten directly by the insurer
and reinsurance assumed from other insurers. The ratio can vary significantly with the type of business
written by the insurer, so it should be calculated by class of business.
The same factors are relevant to the interpretation of this indicator as for the net claims ratio. However,
because this indicator ignores the effects of reinsurance ceded, it helps in assessing the underlying
profitability of the business underwritten directly by the insurer or assumed from other insurers.
Benchmarks for supervisory concern will depend on the class of business and the competitiveness of the
insurance market.
6.03 Expense ratio This indicator is calculated as the ratio of expenses to net earned premium.
A significant influence on profit performance of an insurer is the expenses associated with the
administration of its business. The conventional approach to this measure has been the expense ratio.
Higher ratios indicate that the business is cost-intensive or that the insurer is less efficient. Larger
insurers and smaller insurers can be expected to show different ratios due to economies of scale and the
influence of fixed costs; however, this is not always the case and would also reflect management
capacity to manage costs effectively. Similarly, where an insurer is growing, it should have a
progressively declining expense ratio. This will not always be observed, and an indication of poor
expense management ultimately raises concerns.
Within the same insurer, it may be that the expense ratios are different between classes of business.
There may be a valid reason for this, but it is reasonable to check the allocation of expenses by
examining the more detailed breakdown of expenses that may be provided in the supporting accounts.
From a market conduct perspective, a high expense ratio raises the possibility that the insurer’s
products do not provide reasonable value to the policyholders, or that the insurer is competing for
business through the payment of high commissions to intermediaries.
29
The expense ratio can be calculated based on both net and gross (of reinsurance) values for premium.
Where net premium is used then expenses would be reduced by reinsurance commissions.
6.04 Combined ratio This indicator is calculated as the sum of the claims ratio and the expense ratio.
Traditionally, non-life insurers have been considered as insurers that take on risk through the writing of
policies, lay off some of this risk through reinsurance, and then try to ensure that the remaining retained
premium is sufficient to cover claims, expenses, and make a profit. With such a philosophy, investment
returns were treated as somewhat fortuitous rather than a part of the core operation. It is still most
likely that the largest source of risk, and hence the focus of management attention, will be on the
underwriting “side” of the business. This approach gave rise to the combined ratio and a rule of thumb
that an insurer will be making underwriting losses where the combined ratio is more than 100%. It
should, however, not be making losses overall at this level due to the investment result. Consequently,
in a competitive market, it is not unusual for the combined ratios to be slightly above 100%. There will,
however, be a clear concern where combined ratios exceed 100% by a substantial margin. Prolonged
triple-digit combined ratios, in an environment of low or volatile investment yields, signal a drain on
capital and the prospect of solvency problems.
From a market conduct perspective, a high combined ratio raises the possibility that the insurer’s
products do not provide reasonable value to the policyholders.
As the claims ratio and the expense ratio can be calculated on a basis that is either net or gross of the
reinsurance accounts, then the combined ratio can also be calculated on a net and gross basis.
Although the combined ratio can be calculated for life insurers, the calculation might not produce useful
results. This is because the life insurance claims (and increases in technical provisions) for long-term
policies do not relate closely to the current year’s premiums, while acquisition expenses are often higher
in the early policy years.
Benchmarks for supervisory concern will depend on the class of business and the competitiveness of the
insurance market. A typical range for the ratio is between 75% and 105%.
6.05 Investment income ratio This indicator is calculated as the ratio of investment income (net of investment expenses but gross of
tax) to net earned premium.
It measures the contribution of investments to profitability in a manner comparable to the combined
ratio used to measure the contribution of underwriting operations. It should not be confused with the
net yield on investments, which uses average invested assets in the denominator.
The return that the insurer is able to extract from the investment of funds is often a significant element
of profit performance. It can be important to investigate both the actual result from the investments as
well as the components of this result.
In unusual cases, the assets relating to some or all of the reinsurance may be invested by the ceding
insurer, and the treatment of the investment income and the assets in these situations should be
understood.
30
In many cases, investment income is not allocated to classes of business within an insurer’s portfolio, so
the inclusion of investment income is more common for analysis at the level of the insurer in total. For
more globally-calculated ratios, the addition of allowances for tax and other items as well as expenses
and other income that are not attributable to a particular class of business is also more relevant.
6.06 Operating ratio The operating ratio is calculated as the combined ratio minus the investment income ratio. To reduce
the potential effects of year-to-year volatility on the analysis, some supervisors, including those in the
USA, use a two-year overall operating ratio.
The operating ratio is used in recognition of the fact that investment income can make an insurer
profitable even if the combined ratio is above 100%.
More generally, various profit ratios are directed at the same overall assessment of profitability. The
profit ratios reflect a measure of “reward” relative to the size of the business in general terms.
Profit ratios will, in fact, be a mixture of the performance of the business written on gross terms and the
margin given away or earned through the terms of any reinsurance. Accordingly, it may be useful to
separate these influences to determine the extent that the insurer earns margins from the business it
writes separately from the effect of its reinsurance program on these margins.
The usual range for the operating ratio includes results less than 100%. An operating ratio below 100%
indicates an operating profit and a ratio result above 100% indicates an operating loss.
6.07 Profitability ratio The profitability ratio is calculated using the sum of underwriting income, investment income, and other
income, less other expenses, as the numerator and net earned premium as the denominator.
The profitability ratio is like the complement of the operating ratio (100% minus the operating ratio),
but the numerator includes the net of other income and other expenses. (Note that “underwriting
income” means net earned premium minus net incurred claims minus expenses.) Where such items
have not been reflected in underwriting income or investment income, it provides a more complete
measure of profitability than the operating ratio. The profitability ratio can be interpreted as a profit
margin, or a form of margin-on-sales ratio.
The usual range for the profitability ratio includes results more than 0%.
6.08 Return on revenue The return on revenue ratio is calculated using profits (the sum of underwriting income, investment
income, and other income, less other expenses) as the numerator and total revenue (the sum of net
earned premium, investment income, and other income) as the denominator.
The return on revenue is similar to the profitability ratio, but the denominator includes investment
income and other income. It can be interpreted as a profit margin on all of the revenue an insurer is able
to generate.
31
6.09 Revisions to technical provisions / technical provisions For life insurers with long-term products, the claims ratio can provide misleading information regarding
profitability. A more reliable indicator might be the revisions to the prior year’s technical provisions
divided by the current year’s technical provisions. This is effectively a charge to current profits due to
deviations of recent experience and current expectations of the future from previous actuarial
assumptions.
Information regarding the amount of and reasons for revisions to the prior year’s technical provisions
would typically be available in the actuary’s report.
6.10 Nominal net investment yield The nominal net investment yield indicator provides the percentage of annual income on an investment
portfolio, net of investment expenses. The investment yield is calculated net of investment expenses but
gross of tax, using book values of invested assets. If the book values are not based on marking assets to
market, care should be taken when making comparisons with market rates of return.
Investment yield is calculated as net investment income earned divided by average cash and invested
assets, or 200 * [G / (A+B+C+D–E–F–G)], where:
A = total cash and invested assets, current year
B = total cash and invested assets, prior year
C = investment income due and accrued, current year
D = investment income due and accrued, prior year
E = borrowed money, current year
F = borrowed money, prior year
G = net investment income earned
The net investment income earned will have several components. These will be investment income
(such as interest and dividends), the contribution from realized gains or losses, and (in the case of assets
marked to market) the contribution from unrealized gains or losses. In a book value accounting
environment, the realization of investment gains adds to profit in the accounting period that the assets
are sold. In a market value environment, both realized and unrealized gains come into the profit result.
The result is reduced by investment expenses.
In either case, the objective is to determine how much of the profit contribution has come from each
source, in order to examine the trends and consider the likely prospects for their contribution to the
future investment yields of the insurer. Accordingly, it can also be useful to calculate the rate of return
on a net (of tax) basis and using market values, with the investment income element defined to include
or separate investment income and realized and unrealized gains, as is relevant, and using total assets.
It is useful to calculate averages of this indicator over periods of five and ten years, to help assess
longer-term performance of the insurer in managing its investments.
32
Low yields might be caused by large investments in bank deposits, speculative investments, investments
in related parties, large investments in real estate for the insurer’s own use, significant interest
payments on borrowed money, or high investment expenses.
High yields might be caused by investments in high-risk instruments or extraordinary dividend payments
from subsidiaries.
Benchmarks for supervisory concern will depend on the conditions in the investment markets and the
economy more generally. In general, insurers should be able to generate investment yields higher than
the rates paid by banks on deposits and higher than the rate of inflation, even after investment
expenses. Insurers that are unable to regularly generate investment yields higher than the discount
rates assumed when calculating their technical provisions could suffer significant losses.
6.11 Real net investment yield The real net investment yield is calculated by subtracting the inflation rate from the nominal net
investment yield. It provides the percentage of annual income on an investment portfolio, net of both
investment expenses and the inflation rate.
It is useful to calculate averages of this indicator over periods of five and ten years, to help assess
longer-term performance of the insurer in managing its investments.
Benchmarks for supervisory concern will depend on the conditions in the investment markets and the
economy more generally. In general, insurers should be able to generate investment yields higher than
the rates paid by banks on deposits and higher than the rate of inflation, even after investment
expenses. This indicator shows the extent to which the net investment yield exceeded the rate of
inflation.
6.12 Return on equity (ROE) [FSI] Return on equity is calculated by dividing net income after tax by the average value of capital over the
same period. In calculating the ratio, care needs to be taken that the average (weighted) capital is used
in the calculation. This is particularly the case where there have been capital movements during the
year.
Return on equity is a profitability indicator that is intended to measure an insurer’s efficiency in using its
capital. The return on equity reflects the level of capital that the shareholders have subscribed, and the
return directed at them. As a result, profit is usually taken as net income after tax. (Note: for banks, the
IMF has specified the use of pre-tax income.)
6.13 Earnings per employee Earnings per employee is calculated as the net income after tax divided by the number of employees.
The result is expressed in local currency units.
It is a profitability indicator that is intended to measure an insurer’s efficiency in using its staff to
generate earnings.
6.14 Return on assets (ROA) [FSI] Return on assets is calculated by dividing net income after tax by the average value of total assets over
the same period. (Note: for banks, the IMF has specified the use of pre-tax income.)
33
It is a profitability indicator that is intended to measure an insurer’s efficiency in using its assets to
generate earnings.
6.15 Policies lapsed or surrendered / policies in force at beginning of the year This indicator is calculated as the ratio of number of policies lapsed or surrendered during a year to the
number of policies in force at the beginning of the year. There are many other ways to calculate lapse
rates, such as focusing on lapses of policies in their first one or two years or basing the ratio on
premiums or amounts of insurance lapsed, which might also be used if the necessary data is available.
A policy lapses when it is forfeited by the policyholder without receiving any payment from the insurer
in respect of the premiums already paid to the company in respect of the period the policy was in force.
It is different from a life insurance policy surrender, which the insurer treats as a claim by the
policyholder for which it pays the surrender value. In either case, the policy will no longer be in force.
Although there may be good reasons for some lapses, a lapse often means poor-quality new business
was written. High lapse and surrender rates are a concern for the insurer because they result in lower
profits, as it will often be unable to fully recover the expenses, including commission, it incurred in
acquiring the policy. They also depress the growth of the insurer’s premiums and assets.
High lapse rates are also of concern for the industry, because they create a negative public attitude
toward insurance, and for the supervisor, because they indicate a lack of proper operational controls by
the insurer.
6.16 Market value / book value This indicator is calculated as the ratio of the total market value of an insurer’s shares to the total book
value of its shares. It is typically expressed as a ratio rather than as a percentage. Market value is
calculated by multiplying current price of each class of shares by the number of such shares outstanding,
then summing the result over all classes of shares. The book value of the insurer is its net worth
according to the financial statements.
This measure is used by investors and analysts to help evaluate whether a company’s shares are over- or
under-valued. An insurer whose prospects are viewed positively by the market will tend to have a higher
ratio than one whose prospects are viewed negatively. Changes in the ratio from period to period can
signal changes in the market’s assessment of an insurer’s prospects.
6.17 Price / earnings ratio This indicator is calculated as the ratio of the total market value of an insurer’s shares to its earnings. It
is typically expressed as a ratio rather than as a percentage. Market value is calculated by multiplying
current price of each class of shares by the number of such shares outstanding, then summing the result
over all classes of shares. The earnings of the insurer are its earnings after tax, according to the financial
statements.
This measure is used by investors and analysts to help evaluate whether a company’s shares are over- or
under-valued. An insurer whose prospects are viewed positively by the market will tend to have a higher
ratio than one whose prospects are viewed negatively. Changes in the ratio from period to period can
signal changes in the market’s assessment of an insurer’s prospects.
34
6.18 Price / gross written premium This indicator is calculated as the ratio of the total market value of an insurer’s shares to gross written
premium. It is typically expressed as a ratio rather than as a percentage. Market value is calculated by
multiplying current price of each class of shares by the number of such shares outstanding, then
summing the result over all classes of shares.
This measure is used by investors and analysts to help evaluate whether a company’s shares are over- or
under-valued. An insurer whose prospects are viewed positively by the market will tend to have a higher
ratio than one whose prospects are viewed negatively. Changes in the ratio from period to period can
signal changes in the market’s assessment of an insurer’s prospects.
Liquidity and ALM
7.01 Liquid assets / current liabilities The ratio of liquid assets to current liabilities is an indicator of the insurer’s ability to meet short-term
obligations. It also provides a rough indication of the possible implications for policyholders if liquidation
becomes necessary.
Liquid assets are defined to include those assets that the supervisor is particularly confident are and will
remain liquid. They include cash, demand deposits, and term deposits maturing in less than one year.
Government securities are also included, unless there are concerns about their liquidity. Some
supervisors include accounts receivable that have been outstanding for less than three months. Some
supervisors include common and preferred equities, if the markets in their jurisdiction are liquid.
Intermediaries’ balances deferred and not yet due is not a liquid asset.
Current liabilities are defined to include those liabilities that are already due or might become due
within the next year. They include accounts payable, overdrafts, and bank loans, except for amounts
payable after one year or more. Liabilities are adjusted to remove the amount of liabilities equal to
deferred intermediaries’ balances; since this is not a liquid asset, the adjustment is made to remove the
corresponding liability. Total insurance liabilities are reduced by any liabilities that will not be payable
within the next year, if data is available to enable them to be identified. For example, such liabilities
might include the portion of life insurance technical provisions related to annuity payments due after
one year or more.
The usual range for the ratio includes results above 100%.
Too little liquidity might mean claims payments need to be deferred, but too much liquidity might
adversely affect investment returns. During an onsite inspection, it may be appropriate to check the
cashflow forecasting and liquidity management practices of the insurer.
Analysis has shown that many insurers who become insolvent report decreasing liquidity ratios in their
final years. Therefore, it is important to consider the trend of this indicator, as well as the current year
result. Further analysis of an insurer with a low liquidity ratio should focus on the adequacy of technical
provisions and on proper valuation, mix, and liquidity of assets to determine whether the insurer will be
able to meet its obligations to policyholders.

35
7.02 Liquid assets / total liabilities The ratio of liquid assets to total liabilities is an indicator of the insurer’s ability to meet its obligations,
including those that are not expected to be payable in the short-term.
Liquid assets are defined to include those assets that the supervisor is particularly confident are and will
remain liquid. They include cash, demand deposits, and term deposits maturing in less than one year.
Government securities are also included, unless there are concerns about their liquidity. Some
supervisors include accounts receivable that have been outstanding for less than three months. Some
supervisors include common and preferred equities, if the markets in their jurisdiction are liquid.
Total liabilities are defined to include technical provisions and other liabilities of the insurer.
The usual ranges for the ratio include results above 95% for non-life insurers and above 60% for life
insurers.
Too little liquidity might mean claims payments need to be deferred, but too much liquidity might
adversely affect investment returns. During an onsite inspection, it may be appropriate to check the
cashflow forecasting and liquidity management practices of the insurer.
Analysis has shown that many insurers who become insolvent report decreasing liquidity ratios in their
final years. Therefore, it is important to consider the trend of this indicator, as well as the current year
result. Further analysis of an insurer with a low liquidity ratio should focus on the adequacy of technical
provisions and on proper valuation, mix, and liquidity of assets to determine whether the insurer will be
able to meet its obligations to policyholders.
7.03 Liquid assets / total assets The ratio of liquid assets to total assets is an indicator of the extent to which the assets of an insurer are
liquid and available to meet obligations to policyholders that might come due.
Liquid assets are defined to include those assets that the supervisor is particularly confident are and will
remain liquid. They include cash, demand deposits, and term deposits maturing in less than one year.
Government securities are also included, unless there are concerns about their liquidity. Some
supervisors include accounts receivable that have been outstanding for less than three months. Some
supervisors include common and preferred equities, if the markets in their jurisdiction are liquid.
Total assets are defined to include cash, investments, and all other assets of the insurer.
Too little liquidity might mean claims payments need to be deferred, but too much liquidity might
adversely affect investment returns. During an onsite inspection, it may be appropriate to check the
cashflow forecasting and liquidity management practices of the insurer.
7.04 Liquid liabilities / total liabilities The ratio of liquid liabilities to total liabilities is an indicator of the extent to which the liabilities of an
insurer are already due or might become due in the near future.
Liquid liabilities are defined to include those liabilities that are already due or might become due within
the next year. They include accounts payable, overdrafts, and bank loans, except for amounts payable
after one year or more. They do not include the amount of liabilities equal to deferred intermediaries’
balances. Total insurance liabilities are reduced by any liabilities that will not be payable within the next
36
year, if data is available to enable them to be identified. For example, such liabilities might include the
portion of life insurance technical provisions related to annuity payments due after one year or more.
Total liabilities are defined to include technical provisions and other liabilities of the insurer.
7.05 Net open foreign exchange position / capital This indicator is calculated as the ratio of the net open foreign exchange position to capital. The
numerator is calculated by converting all the values of all assets and liabilities denominated in foreign
currencies to local currency units, then subtracting the total of the converted liabilities from the total of
the converted assets.
It is an indicator of an insurer’s exposure to foreign exchange risks. It measures the mismatch of foreign
currency asset and liability positions to assess the vulnerability of the insurer to exchange rate
movements. In many of the jurisdictions where insurers may issue policies denominated in a foreign
currency, they are required to have assets denominated in a particular foreign currency not less than the
policyholder liabilities in that same currency.
Some supervisors would consider a ratio of 100% or more to be of potential concern. However, the
volatilities of the relevant foreign exchange rates should be considered when assessing the level of
concern.
7.06 Duration of assets / duration of liabilities This indicator is calculated as the ratio of the duration of an insurer’s assets to the duration of its
liabilities. It measures the exposure of an insurer to losses arising from movements in interest rates.
It is important when reviewing the distribution of an insurer’s assets to consider the possibility of cash
outflow, as determined by the nature of the insurer’s business, and the ability of the insurer to
withstand such a cash demand without undue deterioration of the asset portfolio. The distribution of
bank deposits and bonds by maturity and cash flow projections of the insurer are helpful in reviewing
the insurer’s short-term liquidity and longer-term matching of expected asset and liability cash flows.
Life insurers often issue long-term policies with savings features and, in many cases, long-term interest
rate guarantees. In such cases, it is particularly important that they invest for the long term, so that they
can meet their obligations to policyholders and reduce their exposure to market risk related to changes
in interest rates. Many life insurers attempt to match the duration of their assets to the duration of their
liabilities.
In some jurisdictions, insurers are required to report the durations of their assets and liabilities in the
regulatory returns. In some other jurisdictions, asset and liability cash flow projections are provided in
the return forms, from which the supervisor can calculate (or approximate) the durations.
Duration can be measured in various ways. One measurement is modified duration, which is defined as
the percentage change in the value of a series of cash flows for a 100-basis point change in interest
rates. The formula assumes that the cash flows do not change as interest rates change, which might not
be the case.
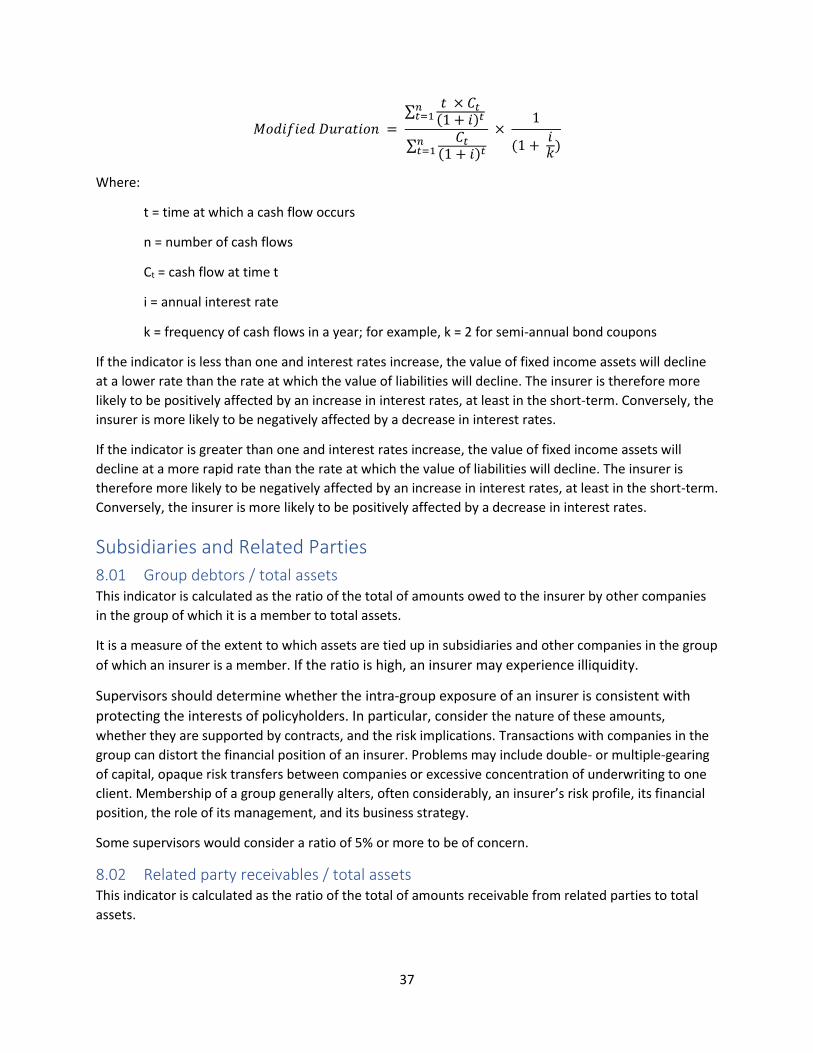
37
𝑀𝑜𝑑𝑖𝑓𝑖𝑒𝑑 𝐷𝑢𝑟𝑎𝑡𝑖𝑜𝑛 = ∑
𝑡 × 𝐶𝑡
(1 + 𝑖)𝑡 𝑛𝑡=1
∑𝐶𝑡
(1 + 𝑖)𝑡𝑛𝑡=1
× 1
(1 + 𝑖𝑘
)
Where:
t = time at which a cash flow occurs
n = number of cash flows
Ct = cash flow at time t
i = annual interest rate
k = frequency of cash flows in a year; for example, k = 2 for semi-annual bond coupons
If the indicator is less than one and interest rates increase, the value of fixed income assets will decline
at a lower rate than the rate at which the value of liabilities will decline. The insurer is therefore more
likely to be positively affected by an increase in interest rates, at least in the short-term. Conversely, the
insurer is more likely to be negatively affected by a decrease in interest rates.
If the indicator is greater than one and interest rates increase, the value of fixed income assets will
decline at a more rapid rate than the rate at which the value of liabilities will decline. The insurer is
therefore more likely to be negatively affected by an increase in interest rates, at least in the short-term.
Conversely, the insurer is more likely to be positively affected by a decrease in interest rates.
Subsidiaries and Related Parties
8.01 Group debtors / total assets This indicator is calculated as the ratio of the total of amounts owed to the insurer by other companies
in the group of which it is a member to total assets.
It is a measure of the extent to which assets are tied up in subsidiaries and other companies in the group
of which an insurer is a member. If the ratio is high, an insurer may experience illiquidity.
Supervisors should determine whether the intra-group exposure of an insurer is consistent with
protecting the interests of policyholders. In particular, consider the nature of these amounts,
whether they are supported by contracts, and the risk implications. Transactions with companies in the
group can distort the financial position of an insurer. Problems may include double- or multiple-gearing
of capital, opaque risk transfers between companies or excessive concentration of underwriting to one
client. Membership of a group generally alters, often considerably, an insurer’s risk profile, its financial
position, the role of its management, and its business strategy.
Some supervisors would consider a ratio of 5% or more to be of concern.
8.02 Related party receivables / total assets This indicator is calculated as the ratio of the total of amounts receivable from related parties to total
assets.
38
It is a measure of the extent to which assets are tied up in related-party receivables, collection of which
might be difficult to enforce because of the relationship. Related parties might include subsidiaries,
other companies in a group of which an insurer is a member, and directors and senior managers of the
insurer. If the ratio is high, an insurer may experience illiquidity.
Supervisors should determine whether the amounts due from related parties are consistent with
protecting the interests of policyholders. In particular, consider the nature of these amounts,
whether they are supported by contracts, and the risk implications.
In many jurisdictions, insurers are often a part of an insurance group, a financial group, or a
conglomerate. In such cases, group exposures might account for a large share of related party
exposures. Transactions with companies in the group can distort the financial position of an insurer.
Problems may include double- or multiple-gearing of capital, opaque risk transfers between companies
or excessive concentration of underwriting to one client. Membership of a group generally alters, often
considerably, an insurer’s risk profile, its financial position, the role of its management, and its business
strategy.
Some supervisors would consider a ratio of 5% or more to be of concern.
8.03 Due to related parties / total assets This indicator is calculated as the ratio of the total of amounts due to related parties to total assets.
Amounts due to related parties indicate trading with related parties, which might increase the risks to
which an insurer is exposed. A high ratio indicates that the insurer could be having difficulty in paying its
debts when they fall due.
8.04 (Investments in related parties + related party receivables) / total assets This indicator is calculated as the ratio of the total of amounts invested in or receivable from related
parties, compared to total assets.
It is a measure of the extent to which assets are tied up in related-party investments and receivables,
which might not be liquid or available to meet policyholder obligations.
If the amount is high, an insurer may experience illiquidity or a low yield. Large investments in
related insurers may also increase the overall risk to which an insurer is subject. Supervisors should
determine whether the insurer’s investments in and amounts due from related parties are
consistent with protecting the interests of policyholders.
A relatively large value for this indicator should be questioned. Some supervisors would consider a ratio
of 5% or more to be of concern. However, in jurisdictions where many insurers are members of groups
and investment alternatives are limited, supervisors might be prepared to accept higher ratios (for
example, 10%).
8.05 (Investments by related parties + due to related parties) / total assets This indicator is calculated as the ratio of the total of amounts invested in the insurer by related parties
and amounts due to related parties, compared to total assets.
39
It is a measure of the extent to which related parties have a current or potential claim on the assets of
an insurer. If the ratio is high, the insurer might face pressure from related parties to make repayments
or to pay interest or dividends on the amounts outstanding, which could compromise its ability to meet
obligations to policyholders.
Some supervisors would consider a ratio of 5% or more to be of concern.
8.06 (Revenues from related parties + expenditures to related parties) / (total revenues
+ total expenditures) This indicator is calculated as the ratio of an insurer’s revenues from and expenditures to related parties,
compared to its total revenues from and expenditures to all parties.
It is a measure of the extent to which an insurer’s business activities relate to transactions with related
parties. The purpose of combining income and expense items is to minimize the potential distortion of
transactions with related parties on preferential or detrimental terms and conditions.
Some supervisors would consider a ratio of 20% or more to be of concern.
8.07 Group (gross written premium + paid claims) / total (gross written premium + paid
claims) This indicator is calculated as the ratio of an insurer’s gross written premium from and claims paid to
group companies, compared to its total gross written premium from and claims paid to all parties.
It is a measure of the extent to which an insurer’s insurance activities relate to business written on other
companies in its group. The purpose of combining income and expense items is to minimize the
potential distortion of underwriting insurance on group companies on preferential or detrimental terms
and conditions.
Some supervisors would consider a ratio of 20% or more to be of concern.
8.08 Related party (gross written premium + paid claims) / total (gross written premium
+ paid claims) This indicator is calculated as the ratio of an insurer’s gross written premium from and claims paid to
related parties, compared to its total gross written premium from and claims paid to all parties.
It is a measure of the extent to which an insurer’s insurance activities relate to business written on
related parties. The purpose of combining income and expense items is to minimize the potential
distortion of underwriting insurance on related parties on preferential or detrimental terms and
conditions.
Some supervisors would consider a ratio of 20% or more to be of concern.
Industry-wide
9.01 Assets / total financial system assets [FSI] This indicator is calculated using insurers’ assets as the numerator and total financial system assets as
the denominator. The latter is the total of financial assets owned by deposit-taking institutions, other

40
financial corporations, nonfinancial corporations, households, the government, and the central bank. It
measures the relative importance of insurers within the domestic financial system.
9.02 Assets / gross domestic product [FSI] This indicator is calculated using insurers’ assets as the numerator and gross domestic product as the
denominator. It measures the importance of insurers compared to the size of the economy.
9.03 Penetration Penetration is calculated as the ratio of gross written premiums in the insurance market to gross
domestic product. Insurance penetration is usually calculated separately for the life and non-life sectors.
Comparative information for many countries is published annually by Swiss Re Sigma; in its statistics,
health insurance is treated as non-life insurance.
Penetration normally is used to compare market development: the higher the insurance penetration
ratio, the more developed the market. This interpretation is subject to the caveat that in countries in
which pensions are not funded through life insurance, the insurance penetration may be lower than in
other countries, despite similar levels of both market development and country wealth. The relative
penetration of life insurance and non-life insurance can also differ significantly, reflecting cultural
preferences and the existence of mandatory coverages, such as motor third-party liability insurance,
among other things.
Differences in the value of this indicator between the most and least developed markets are striking.
The values range from less than 1% for some African and Asian countries to more than 10% (South
Africa, Switzerland, and the United Kingdom, among other countries).
9.04 Density Density is calculated as the ratio of gross written premium to population. It represents the amount
spent on purchasing insurance per capita during one year, expressed in local currency units. Insurance
density is usually calculated separately for the life and non-life sectors.
This indicator enables analysis of the growth of the local insurance market. Its calculation needs only
broadly available information (insurance market premium volume and numbers of inhabitants). Its
value, however, does not purely reflect the levels of income and wealth but can also be impacted by
local jurisdictional and market conditions.
9.05 Density - in USD This indicator is calculated as the ratio of gross written premium, converted to United States Dollars, to
population. It represents the amount spent on purchasing insurance per capita during one year,
expressed in United States Dollars. Insurance density is usually calculated separately for the life and
non-life sectors. Comparative information for many countries is published annually by Swiss Re Sigma; in
these statistics, health insurance is treated as non-life insurance.
This indicator enables a relatively reliable and fair comparison of individual markets. Its calculation
needs only broadly available information (insurance market premium volume, the exchange rate
between local currency and USD, and numbers of inhabitants); therefore, it is easily accessible. Its value,
however, does not purely reflect the relevant country income and wealth but can also be impacted by
local jurisdictional and market conditions.

41
9.06 Concentration ratio The concentration ratio is calculated as the percentage of market share owned by the largest X
companies, where X is a specified number of companies. The number chosen is often 4 or 8, but it might
be smaller if there are few insurers operating in a jurisdiction or larger if there are many insurers.
Market shares can be based on gross premium written or assets, with the former being more commonly
used for non-life insurers and the latter for life insurers.
The concentration ratio provides a simple indicator of the extent of competition in the market. It is
usually calculated separately for the life and non-life sectors.
The lower the concentration ratio, the more widespread–and usually, the better–the competition in the
market. The extent of competition might be considered using four categories, defined as:
Perfect competition – very low concentration ratio
Monopolistic competition – concentration ratio below 40% for the 4-firm measurement
Oligopoly – concentration ratio above 40% for the 4-firm measurement
Monopoly – near to 100% concentration ratio for the 4-firm measurement.
In addition, comparing market share information over time allows supervisors to identify insurers that
are expanding or contracting, to investigate reasons for the change, and to assess whether the insurer
can deal effectively with the growth or loss in business.
In jurisdictions where insurers are members of groups, it can be useful to examine the concentration
ratio on a group-wide basis (adding the market shares of the insurers in each group).
9.07 Herfindahl-Hirschman Index The Herfindahl-Hirschman Index (HHI) provides a more complete picture of market concentration than
does the concentration ratio. The HHI is usually calculated separately for the life and non-life sectors.
This index uses the market shares of all insurers. It squares these market shares to place more weight on
the larger insurers. If there are n insurers in the market, the HHI can be expressed as:
𝐻𝐻𝐼 = 𝑠12 + 𝑠2
2 + ⋯ + 𝑠𝑛2
where si = market share of the ith insurer, expressed as a percentage. Market shares can be based on
gross premium written or assets, with the former being more commonly used for non-life insurers and
the latter for life insurers.
Unlike the concentration ratio, the HHI will change if there is a shift in market share among the larger
insurers.
The HHI can be used to determine whether mergers are equitable to society and thus also influence
supervisory decisions. As the market concentration increases, competition and efficiency may decrease,
and the opportunities for collusion and monopoly increase. In the United States, increases of over 100
points generally provoke scrutiny, although it may vary case to case. The Department of Justice
considers markets with indices below 1500 to be unconcentrated, between 1500 and 2500 to be
moderately concentrated, and above 2500 to be concentrated.

42
In jurisdictions where insurers are members of groups, it can be useful to examine the HHI on a group-
wide basis (adding the market shares of the insurers in each group before squaring the result). The HHI
might also be examined with respect to the market share by class of business or even by product.
9.08 Assets lost during the previous 5 years / average assets This indicator is calculated as the ratio of the total losses to arising from the insolvency of insurers or
intermediaries, fraud, theft or government appropriation during the previous five years to the average
assets during that same five-year period.
It enables analysis of the overall security of the insurance sector for consumers. Its progress over time
should be examined and comparisons might also be made with the assets lost in other financial sectors
in the jurisdiction.
Related Documents