DMSDR1S-#5229205-v11- Guidance_Note_on_Jobs_&_Growth_Issues_in_Surveillance_and_Program_Work_Supplement_on_C ountry_Case_Studies.DOCX 2010 Article IV Report GUIDANCE NOTE ON JOBS AND GROWTH ISSUES IN SURVEILLANCE AND PROGRAM WORK—SUPPLEMENT ON COUNTRY CASE STUDIES Approved By Olivier Blanchard, Carlo Cottarelli, and Siddharth Tiwari Prepared by a staff team supervised by Kalpana Kochhar (SPR), Prakash Loungani (RES), Ranil Salgado (SPR), and Ben Clements (FAD); coordinated by Hans Weisfeld (SPR); and comprising Ruo Chen and Monique Newiak (both SPR), with contributions from Wendell Daal, Floris Fleermuys, Rodrigo Garcia-Verdu, Javier Arze del Granado, and Kevin Wiseman (all AFR); Alexandros T. Mourmouras (APD); Faezeh Raei (EUR); Elva Bova (FAD); Antonio David (ICD); May Khamis, Amina Lahreche, and Harold Zavarce (all MCD); Raphael Espinoza and Davide Furceri (both RES); Carol Baker (STA); and Mercedes Garcia-Escribano, Fei Han, Herman Kamil, and Lawrence Norton (all WHD). CONTENTS I. INTRODUCTION _______________________________________________________________________________ 3 II. ALGERIA: STRUCTURAL REFORMS TO RAISE GROWTH AND EMPLOYMENT______________ 5 III. BAHRAIN: LABOR MARKET REFORMS _____________________________________________________ 10 IV. BRAZIL: GROWTH, EMPLOYMENT, AND INCOME INEQUALITY __________________________ 13 V. REPUBLIC OF CONGO: INCLUSIVE GROWTH _______________________________________________ 15 VI. GERMANY: LABOR MARKET REFORMS ____________________________________________________ 18 References ______________________________________________________________________________________ 20 VII. GHANA: INCLUSIVE GROWTH SUCCESSES AND CHALLENGES __________________________ 21 VIII. HAITI: STRUCTURAL FISCAL REFORMS TO STRENGTHEN GROWTH AND INCLUSION 27 IX. KOREA: LABOR MARKET REFORMS ________________________________________________________ 30 X. MALAYSIA: AVOIDING THE MIDDLE-INCOME TRAP ______________________________________ 32 XI. MEXICO: LABOR MARKET REFORMS ______________________________________________________ 36 September 27, 2013

Welcome message from author
This document is posted to help you gain knowledge. Please leave a comment to let me know what you think about it! Share it to your friends and learn new things together.
Transcript

DMSDR1S-#5229205-v11-
Guidance_Note_on_Jobs_&_Growth_Issues_in_Surveillance_and_Program_Work_Supplement_on_C
ountry_Case_Studies.DOCX 2010 Article IV Report
GUIDANCE NOTE ON JOBS AND GROWTH ISSUES IN
SURVEILLANCE AND PROGRAM WORK—SUPPLEMENT
ON COUNTRY CASE STUDIES
Approved By Olivier Blanchard,
Carlo Cottarelli, and
Siddharth Tiwari
Prepared by a staff team supervised by Kalpana Kochhar (SPR),
Prakash Loungani (RES), Ranil Salgado (SPR), and Ben Clements (FAD);
coordinated by Hans Weisfeld (SPR); and comprising Ruo Chen and
Monique Newiak (both SPR), with contributions from Wendell Daal,
Floris Fleermuys, Rodrigo Garcia-Verdu, Javier Arze del Granado, and
Kevin Wiseman (all AFR); Alexandros T. Mourmouras (APD); Faezeh
Raei (EUR); Elva Bova (FAD); Antonio David (ICD); May Khamis, Amina
Lahreche, and Harold Zavarce (all MCD); Raphael Espinoza and Davide
Furceri (both RES); Carol Baker (STA); and Mercedes Garcia-Escribano,
Fei Han, Herman Kamil, and Lawrence Norton (all WHD).
CONTENTS
I. INTRODUCTION _______________________________________________________________________________ 3
II. ALGERIA: STRUCTURAL REFORMS TO RAISE GROWTH AND EMPLOYMENT______________ 5
III. BAHRAIN: LABOR MARKET REFORMS _____________________________________________________ 10
IV. BRAZIL: GROWTH, EMPLOYMENT, AND INCOME INEQUALITY __________________________ 13
V. REPUBLIC OF CONGO: INCLUSIVE GROWTH _______________________________________________ 15
VI. GERMANY: LABOR MARKET REFORMS ____________________________________________________ 18
References ______________________________________________________________________________________ 20
VII. GHANA: INCLUSIVE GROWTH SUCCESSES AND CHALLENGES __________________________ 21
VIII. HAITI: STRUCTURAL FISCAL REFORMS TO STRENGTHEN GROWTH AND INCLUSION 27
IX. KOREA: LABOR MARKET REFORMS ________________________________________________________ 30
X. MALAYSIA: AVOIDING THE MIDDLE-INCOME TRAP ______________________________________ 32
XI. MEXICO: LABOR MARKET REFORMS ______________________________________________________ 36
September 27, 2013

JOBS AND GROWTH: SUPPLEMENT ON COUNTRY CASE STUDIES
2 INTERNATIONAL MONETARY FUND
References ______________________________________________________________________________________ 39
XII. NAMIBIA: PROMOTING INCLUSIVE GROWTH AND EMPLOYMENT _____________________ 40
References ______________________________________________________________________________________ 43
XIII. SPAIN: LABOR MARKET REFORMS _______________________________________________________ 44

JOBS AND GROWTH: SUPPLEMENT ON COUNTRY CASE STUDIES
INTERNATIONAL MONETARY FUND 3
I. INTRODUCTION
1. This supplement provides case studies of how countries around the world have
addressed jobs and growth challenges, and how Fund staff have helped in this. The studies
are meant to provide cross country experience. They share a broad structure, organized around
four questions:
What was the initial situation regarding growth, employment, and income distribution?
What policy measures were implemented to enhance growth and employment and to even
out the distribution of income? Were potential complementarities or trade-offs between
enhancing growth, employment, and income distribution considered?
How did Fund staff help the authorities? For example, in which areas did staff help the
authorities analyze issues, how did staff go about analyzing issues, and what were the main
considerations that shaped staff’s recommendations?
What were the results of policy actions taken?
2. The case studies attest to a wide range of jobs and growth challenges. In advanced
countries, improving the functioning of labor markets appears to be a key issue, including by
addressing labor market duality (Spain) and strengthening incentives to take up work (Germany
and Korea). In emerging market countries, reform of labor market policies is an issue as well
(Mexico), but challenges also include improving the income distribution (Brazil and Namibia) and
avoiding the middle income trap (Malaysia). In low-income countries (Haiti), an important goal is
raising tax revenue to allow for greater public investment and social spending. Finally, making the
best use of hydrocarbon revenue (Algeria, Bahrain, Republic of Congo, and more recently also
Ghana) is a challenge that cuts across income groups.
3. While a collection of case studies does not allow drawing firm conclusions on which
policies work well, a few points are worth making:
The German and Mexican labor market reforms are seen as having helped, or as being likely
to help, bring unemployment down and support growth. In contrast, the overall impact of the
Spanish reforms appears less certain so far, given the presently high rate of unemployment in
this country. While a number of reasons might explain this difference, and the longer-term
effects of the Spanish reforms are not yet known, a contributing factor to this difference in
outcomes so far likely is the fact that Germany and Mexico implemented reforms in a stable
macroeconomic environment while Spain did so in very difficult circumstances. This
demonstrates the desirability of implementing reforms in good times, and of providing as
supportive an environment as possible within the limits of available policy space when
reforms have to be started in less favorable times.

JOBS AND GROWTH: SUPPLEMENT ON COUNTRY CASE STUDIES
4 INTERNATIONAL MONETARY FUND
The case study for Korea, presenting findings from preliminary staff research, suggests that
female labor force participation in Korea could be raised by removing disincentives that arise
from the tax treatment of second earners, increasing childcare benefits, and facilitating more
part-time work opportunities. In this way, the gap between male and female participation
could be lowered by about one third. The case study also estimates that policy actions aimed
at enhancing skills, such as retraining programs, could lower skills mismatches and
substantially raise youth employment.
The case of Brazil suggests that in a context of stability-oriented macroeconomic policies,
well-targeted social transfers can help support inclusion, and thus possibly growth and
stability, at a limited budgetary cost. Further, Brazil’s experience suggests that reforms aimed
at lowering compliance costs, such as the introduction of a simplified taxation scheme for
small businesses, can support labor market formalization.
The case of Malaysia appears to suggest that policies aimed at broad economic inclusion can
help development from low- to middle-income level, while transition to advanced country
status requires, in addition, gains in education to meet the needs of today’s knowledge and
innovation-based industries. An upgrading of other elements, such as a strengthening of
institutions, may also be needed.
The case study for Bahrain appears to demonstrate that in countries with some hydrocarbon
revenue and a large supply of low-cost foreign labor, a combination of education and training
initiatives combined with limits on and taxation of foreign labor can contribute to raising the
private sector employment of nationals. This said, avoiding a large public sector wage
premium that undermines nationals’ incentives to take up employment in the private sector,
is also important.

JOBS AND GROWTH: SUPPLEMENT ON COUNTRY CASE STUDIES
INTERNATIONAL MONETARY FUND 5
II. ALGERIA: STRUCTURAL REFORMS TO RAISE
GROWTH AND EMPLOYMENT1
4. The Algerian economy is heavily dependent on the hydrocarbon sector, which
accounts for 98 percent of total exports and more than 65 percent of the budget resources.
The public sector dominates the economy and growth in the private—and more generally the
nonhydrocarbon— sector is inhibited by regulatory constraints, an insufficiently developed financial
sector, as well as limited openness to both trade and foreign investment.
5. Over the recent past, staff’s policy discussions with the authorities have borne
increasingly on the issue of growth and employment in the country, where unemployment has
been declining fast but remains high in some segments of the population (such as the youth and
women). Discussions were based both on original analytical work and on the use of the recently
developed jobs and growth template. 2
Growth and labor market performance in Algeria
6. Algeria’s growth over the 2000s averaged 3.5 percent overall, reaching 6 percent in
the nonhydrocarbon sector. While this was a marked improvement compared to the previous
decade, growth has remained below its long-term potential, which could be as high as 6 percent per
year.3 A cross-country analysis highlights that, over the last two decades, lackluster improvements in
total factors productivity and insufficient physical capital accumulation have hampered Algeria’s
performance compared to other economies, while the country did relatively well with respect to
human capital, notably thanks to the healthy growth of the labor force4.
7. The unemployment rate improved markedly over the past decade, falling from a high
of 29.5 percent in 2000 to 10 percent in 2011. Supporting this improvement were (1) the rapid
demographic transition that brought working-age population growth from 3.6 percent in 1990
down to 1.8 percent in 2011; (2) low, stable and somewhat declining participation rates; and (3) a
rapid increase in employment concomitant to the acceleration of growth in the nonhydrocarbon
sector, led by rising public sector investment.
8. A recent wave of active labor market policies was launched in 2009, and was aimed
notably at the youth. These measures included tax exemptions for employment-creating small and
medium enterprises; interest subsidies and guaranties for credit extended to young entrepreneurs;
and subsidies to employers’ social security contributions. The authorities also designed schemes to
1 Prepared by Amina Lahreche (MCD).
2 See http://www-intranet.imf.org/jobsandinclusivegrowthtoolkit/Pages/EmploymentTools.aspx.
3 See IMF Country Report No. 13/47 (www.imf.org/external/pubs/ft/scr/2013/cr1347.pdf).
4 See ‘”Promoting Faster Growth in Algeria”, in Algeria: Selected Issues Paper, IMF Country Report No. 13/48,
February 2013.

JOBS AND GROWTH: SUPPLEMENT ON COUNTRY CASE STUDIES
6 INTERNATIONAL MONETARY FUND
provide technical support to small entrepreneurs (such as market analysis or legal support), as well
as training and skills development programs for employees. While the sustained impact of these
measures is not yet clear – in part because they have been accompanied by temporary public sector
hiring and preferences for domestic contractors in public procurement – it is likely that they have
contributed to the recent decline in unemployment, especially for the highly educated, whose
unemployment rate declined from 21.4 percent in 2010 to 16.1 percent in 2011.
9. The overall improvement in labor market outcomes however masks unequal
developments across various segments of the population: in particular, while unemployment
rates are relatively low for males above 25 years old, they are much higher for women, the youth
and the highly educated.
0
1
2
3
4
5
6
7
1985 1990 1995 2000 2005 2010
Fertility rate (births per woman) Population growth (in percent)
Demographics(5-year averages)
Sources: Algerian authorities, World Bank, and IMF staff calculations.
0
2
4
6
8
10
12
20
25
30
35
40
45
50
55
60
1990
1991
1992
1993
1994
1995
1996
1997
1998
1999
2000
2001
2002
2003
2004
2005
2006
2007
2008
2009
2010
2011
Participation rate (in percent, LHS) Employment (in million, RHS)
Employment and Participation(1990-2011)
Sources: Algerian authorities, World Bank, and IMF staff calculations.
0
5
10
15
20
25
30
35
2003 2004 2005 2006 2007 2008 2009 2010 2011
Total Female Youth
Unemployment(In percent, 2003-2011)
Sources: Algerian authorities.
0
5
10
15
20
25
30
35
40
45
Male Female Overall
Average Tertiary education diploma 16-24
Unemployment by Category(In percent, 2011)
Sources: Algerian authorities.
JOBS AND GROWTH: SUPPLEMENT ON COUNTRY CASE STUDIES
INTERNATIONAL MONETARY FUND 7
Assessing the elasticity of employment to growth
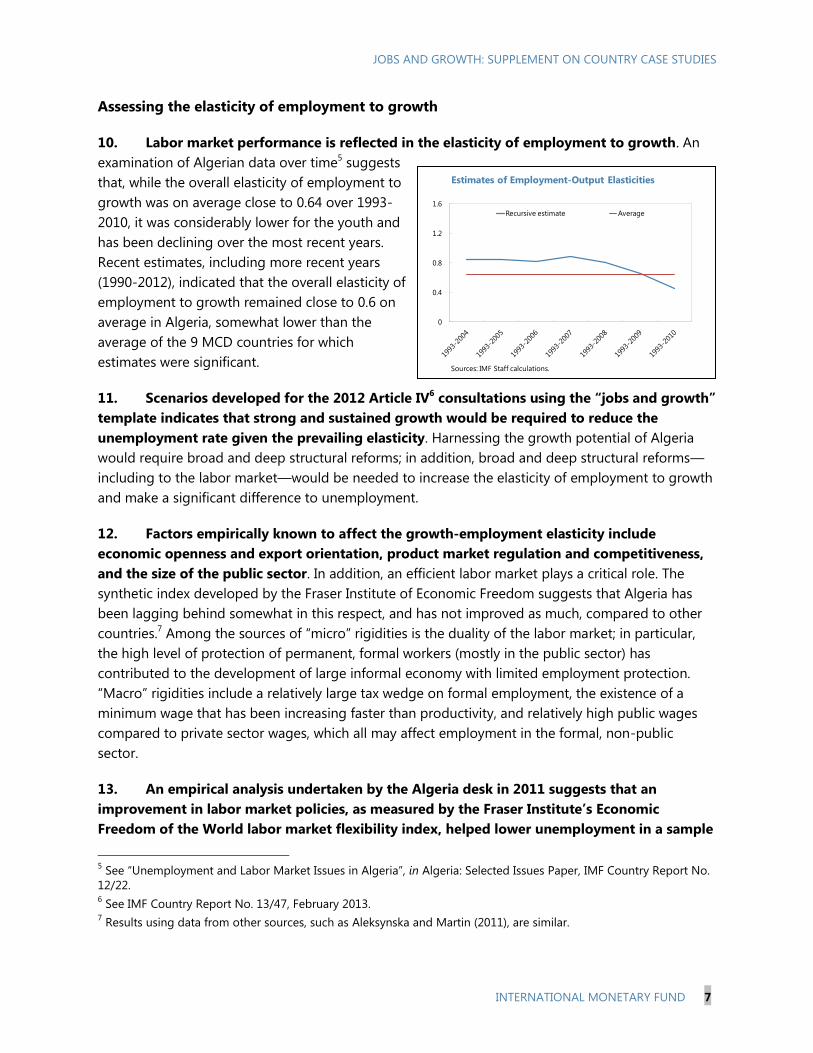
10. Labor market performance is reflected in the elasticity of employment to growth. An
examination of Algerian data over time5 suggests
that, while the overall elasticity of employment to
growth was on average close to 0.64 over 1993-
2010, it was considerably lower for the youth and
has been declining over the most recent years.
Recent estimates, including more recent years
(1990-2012), indicated that the overall elasticity of
employment to growth remained close to 0.6 on
average in Algeria, somewhat lower than the
average of the 9 MCD countries for which
estimates were significant.
11. Scenarios developed for the 2012 Article IV6 consultations using the “jobs and growth”
template indicates that strong and sustained growth would be required to reduce the
unemployment rate given the prevailing elasticity. Harnessing the growth potential of Algeria
would require broad and deep structural reforms; in addition, broad and deep structural reforms—
including to the labor market—would be needed to increase the elasticity of employment to growth
and make a significant difference to unemployment.
12. Factors empirically known to affect the growth-employment elasticity include
economic openness and export orientation, product market regulation and competitiveness,
and the size of the public sector. In addition, an efficient labor market plays a critical role. The
synthetic index developed by the Fraser Institute of Economic Freedom suggests that Algeria has
been lagging behind somewhat in this respect, and has not improved as much, compared to other
countries.7 Among the sources of “micro” rigidities is the duality of the labor market; in particular,
the high level of protection of permanent, formal workers (mostly in the public sector) has
contributed to the development of large informal economy with limited employment protection.
“Macro” rigidities include a relatively large tax wedge on formal employment, the existence of a
minimum wage that has been increasing faster than productivity, and relatively high public wages
compared to private sector wages, which all may affect employment in the formal, non-public
sector.
13. An empirical analysis undertaken by the Algeria desk in 2011 suggests that an
improvement in labor market policies, as measured by the Fraser Institute’s Economic
Freedom of the World labor market flexibility index, helped lower unemployment in a sample
5 See “Unemployment and Labor Market Issues in Algeria”, in Algeria: Selected Issues Paper, IMF Country Report No.
12/22. 6 See IMF Country Report No. 13/47, February 2013.
7 Results using data from other sources, such as Aleksynska and Martin (2011), are similar.
0
0.4
0.8
1.2
1.6
Recursive estimate Average
Estimates of Employment-Output Elasticities
Sources: IMF Staff calculations.

JOBS AND GROWTH: SUPPLEMENT ON COUNTRY CASE STUDIES
8 INTERNATIONAL MONETARY FUND
of 140 countries over 1980-2008, and that the impact was higher in Algeria than in the
average of the sample. A dynamic estimate points to a lasting impact.8 These results are likely to be
significantly strengthened if efficiency-enhancing labor market reforms were complemented by
structural measures to enhance trade openness, competitiveness, competition and private sector
orientation.9
Policies to increase growth …
14. Discussions with the authorities underscored the importance of supporting higher
investment: directing public capital spending toward projects that generate high economic
returns; and maintaining efforts to improve the quality of spending, while private sector
participation could be better leveraged. The environment for private investment needs to be
improved, in particular by lowering the cost of doing business, improving tax administration,
facilitating trade, and improving access to finance, notably for privately-owned SMEs.10
15. Policies are also needed to support an efficient and knowledge-driven economy. A
larger openness to both trade and foreign direct investment would support a faster accumulation of
knowledge. Policies to enable innovation and increase technological absorptive capacity together
with investment in education, training, and health, would support knowledge absorption. Institutions
are essential to the optimal allocation and efficiency of factors; in particular, government
effectiveness, a business climate supportive of private-sector development, and a sound competitive
environment should be encouraged.
… and employment
16. The empirical analysis suggests that reforms to improve labor market efficiency could
have a valuable effect in reducing unemployment both in the short and in the medium term.
While measures to reduce micro and macro rigidities are important, they are also complex to
implement and would take time given the structure of the bargaining system in Algeria (where the
government, the private sector employers and the trade unions all are strong stakeholders).
However, other less structural reforms can be implemented that require less consensus building. It
would be particularly important to implement measures aimed at reducing search and hiring costs,
such as the high payroll taxes,11
in order to integrate women and young workers into the labor
market.
8 See “Unemployment and Labor Market Issues in Algeria”, op. cit.
9 See “Unemployment and Labor Market Issues in Algeria”, in Algeria: Selected Issues Paper, IMF Country Report No.
12/22.
10 For additional information, see IMF Country Report No. 13/47, February 2013.
11 For additional information, see IMF Country Report No. 13/47, February 2013.
JOBS AND GROWTH: SUPPLEMENT ON COUNTRY CASE STUDIES
INTERNATIONAL MONETARY FUND 9
17. The high level of unemployment among young graduates is also the result of skills
mismatches. On the one hand, the private sector has not been able to create sufficient demand for
skilled workers; on the other, the distribution of Algerian students is highly unbalanced towards
disciplines such as humanities, social sciences, law and education; this generates a shortage in the
skills most needed by the private sector. In this context, active labor market policies should seek to
improve the efficiency of the job matching process and to enhance the skills of the unemployed.
Structural policies should aim at improving the employability of the labor force, for instance through
“education for employment” policies.
18. Finally, reforms aimed at improving the business climate and fostering product market
competition are key to increase labor demand over the medium-term. In particular, lower
barriers to entry would curb market power and incumbents’ rents, tend to reduce wage claims, and
contribute to closing the gap between productivity and real wages.
JOBS AND GROWTH: SUPPLEMENT ON COUNTRY CASE STUDIES
10 INTERNATIONAL MONETARY FUND
III. BAHRAIN: LABOR MARKET REFORMS12
Bahrain enacted a number of labor market initiatives during 2004–06 that contributed to lowering the
unemployment rate and significantly slowing the growth of public-sector employment.
Growth and employment
19. Bahrain witnessed high growth rates throughout the past decade. Non-oil economic
activity grew at a fast pace during most of the 2000s; it slowed down at the end of the decade,
mostly because of the onset of the global financial crisis in 2008 and domestic political turmoil in
2011. While real non-oil growth averaged 9.6 percent during 2000–07, average annual real non-oil
growth during 2008–11 was at 4.6 percent, about 5 percentage points lower than the previous
period.
20. Bahrain has a segmented labor market. At end-2012, Bahraini nationals constituted
around 49 percent of the population, and accounted for 85 percent and 20 percent of employees in the
public and private sectors, respectively. High public-sector wages and lower working hours attract
Bahraini nationals to public-sector employment, and effectively set relatively high reservation wages
for nationals in private-sector employment. Accordingly, about 40 percent of the Bahraini nationals
labor force is employed by the public sector. Non-nationals are employed mostly by the private
sector and are generally paid lower wages than nationals in similar positions. Despite the high
growth rates witnessed in the 2000s and the absorption of nationals into the public sector, Bahrain
experienced high unemployment rates among nationals; the rates reached a high of 16 percent in
2006. This was largely due to skill mismatches of Bahraini nationals and the availability of cheaper
expatriate labor.
21. Bahrain has limited fiscal resources. Similar to other Gulf Cooperation Council (GCC)
countries, Bahrain is largely dependent on oil for fiscal revenue. However, unlike its neighbors,
Bahrain’s oil reserves are small, which limits its ability to employ nationals in the public sector.
Furthermore, the main long-term challenge for Bahrain is to continue to diversify its economy away
from oil. To do so, it needs to upgrade its domestic labor force to work productively in the private
sector and to innovate. In this context, Bahrain’s labor reform program described below focuses on
training and skill building of the Bahraini labor force.
Labor market reforms: initiatives and results
22. The labor market reform initiative was launched in 2004 with the aim of improving job
opportunities for nationals and facilitating the mobility of non-nationals. Labor market reforms
were spearheaded by the Economic Development Board (EDB) tasked with promoting Bahrain’s
Vision 2030. Reforms included the creation of the National Employment Project (a job-
matching/placement program for unemployed nationals, which operated for 18 months), the Labor
12
Prepared by May Khamis and Harold Zavarce (MCD).
JOBS AND GROWTH: SUPPLEMENT ON COUNTRY CASE STUDIES
INTERNATIONAL MONETARY FUND 11
Market Regulatory Authority (LMRA),13
the Labor Fund (LF) “Tamkeen,” and the Unemployment
Insurance Program.14
The objectives of the reforms were to stimulate investment and technological
change and to enhance education and training of the Bahraini labor force. Bahrain also requires a
minimum “Bahrainization ratio,” under which the share of Bahraini nationals in the work force of
various economic sectors must attain certain minima.
23. The Labor Fund provides training programs and support to enterprises to foster
private sector development and employment. It administers training institutes for job seekers and
employers, and supports small and medium-sized enterprises (SMEs) in their efforts to improve
productivity, with, for instance, affordable loans to upgrade technology (by guaranteeing access to
loans from commercial banks). Tamkeen also conducts industry and product exhibitions, and
facilitates an easy flow of information and learning between firms and customers and between job
seekers and employers.
24. More recently, the Ministry of Labor instituted a multifaceted set of programs for
training Bahraini nationals and supporting the private sector. Programs include: (i) training new
graduates in basic skills to prepare them for employment, subsidizing part of the private-sector
wages paid to nationals in the initial stages of employment (BD 150–200 per month for two years),
and (ii) cooperating with the private sector in setting up skill improvement programs and on-the-job
training. Specialized courses (lectures and hands-on training) for technical professions such as law
and engineering have been instituted. The national program for apprenticeship, modeled after
Germany’s system, is being developed. New initiatives are also in preparation. These include: (i) the
establishment of a skills assessment center that would provide skill certificates for both Bahraini and
expatriate workers; (ii) a market intelligence unit, to be developed with the EDB to understand future
market skill needs; and (iii) developing occupational standards (for 125 occupations) that will also
help develop training standards and provide input for the skills assessment design and educational
curriculum.
25. Reforms also targeted increasing female labor force participation. Two initiatives were
created to provide incentives for enterprises to hire women nationals. The first is the provision of
two non-national permits for each female national employee hired. The second is a job-sharing
program that allows two female employees to work part-time by sharing one full-time position.
26. Levies on non-nationals’ salaries finance the Labor Fund program fully. During the
period 2006-12, Tamkeen costs averaged about 0.6 percent of GDP. The unemployment insurance
scheme is also fully funded from employers’ and employees’ contributions, and levies on non-
nationals
13 The LMRA regulates labor markets, oversees licensing and non-national employment, and collects statistics and
performs labor market research to inform policy discussions. In 2009, Bahrain became the first GCC country to end
the sponsorship system for foreign workers, allowing workers to move jobs without the permission of their employer.
14 Unemployment insurance provides income for the unemployed (for 12 months), and for new entrants to the labor
market (for six months). All beneficiaries are required to join a training and placement program.

JOBS AND GROWTH: SUPPLEMENT ON COUNTRY CASE STUDIES
12 INTERNATIONAL MONETARY FUND
27. Labor market reforms were successful in reducing unemployment and containing
public-sector employment growth. Bahrain succeeded in achieving a drastic reduction in
unemployment in a short period of time; the unemployment rate fell from a high of 16 percent in
2006 to below 4 percent by end-2012. Furthermore, the rate of growth of nationals’ public sector
employment slowed from 5 percent during 2002–06 to 2 percent in 2007–12. The highest growth in
nationals’ private sector employment was in trade (which includes the hospitality sector), followed
by finance. Furthermore, the number of women nationals in such sectors as retail has been on the
rise in recent years.
Fund involvement and recommendations
28. Staff has welcomed the above-noted reforms. Discussions with the authorities focused
on minimizing potential distortions and fiscal cost. Staff generally welcomed the emphasis
placed on vocational training, the introduction of social insurance for SMEs, and consultation with
unions and the business community in formulating labor policies. In the initial stages of the reforms,
staff recommended that the unemployment insurance plan be fully funded to avoid drains on the
budget. Staff also argued for using price-based interventions instead of sectoral quotas for
Bahrainis, and cautioned against quickly increasing the cost of expatriate labor, so as to avoid
adverse impacts on competitiveness. In recent years, staff has also been advising Bahrain (and GCC
countries more generally) to avoid public sector wage premia. While agreeing in principle with staff
on this issue, the authorities cite political pressures as reasons for public sector wage increases.

JOBS AND GROWTH: SUPPLEMENT ON COUNTRY CASE STUDIES
INTERNATIONAL MONETARY FUND 13
-4
-2
0
2
4
6
8
1991
1992
1993
1994
1995
1996
1997
1998
1999
2000
2001
2002
2003
2004
2005
2006
2007
2008
2009
2010
2011
2012
Growth in Real GDP per Capita
(Percent)
GDP per capita (2005 U.S. dollars)
Trend (HP filter)
0.52
0.54
0.56
0.58
0.6
0.62
0
8
16
24
32
40
2001 2002 2003 2004 2005 2006 2007 2008 2009 2010
Poverty Rate and Gini Coefficient
Poverty rate (percent of total population)
Gini coefficient (RHS)
Source: IPEA database.Sources: Haver Analytics; and Fund staff calculations.
0
1
2
3
4
5
Jan
-2004
Au
g-2
004
Mar-
2005
Oct
-2005
May-
2006
Dec-
2006
Jul-
2007
Feb
-2008
Sep
-2008
Ap
r-2009
No
v-2009
Jun
-2010
Jan
-2011
Au
g-2
011
Mar-
2012
Oct
-2012
May-
2013
Labor Supply: Employment and Labor Force
(3-month moving average annual percent change)
Employment Labor force
Source: IBGE; Haver analytics; and Fund staff calculations.
IV. BRAZIL: GROWTH, EMPLOYMENT, AND INCOME
INEQUALITY15
29. Brazil has witnessed a decade of robust growth and remarkable social transformation.
A strong policy framework (fiscal responsibility, inflation targeting and a flexible exchange rate) has
contributed to macroeconomic stability and supported strong growth, together with a sustained
improvement in the terms of trade. Brazil’s annual growth averaged 3.6 percent during 2003-12,
compared to 2.3 percent during 1995-2002, and GDP per capita has followed a strong upward trend.
Meanwhile, Brazil has seen a substantial reduction in poverty and inequality and rising living
standards of large segments of the population.16
The poverty rate has declined from 35 percent in
2001 to 21 percent in 2009 and inequality, as measured by the Gini coefficient, declined too.17
30. The social transformation has been underpinned by significant improvements in the
labor market, in turn facilitated by the prolonged
macroeconomic stability.
Employment has grown more strongly than the labor
force resulting in a steady decline in the
unemployment rate since 2009. The unemployment
rate reached a record low of 5.5 percent by end-
2012, down from 11.7 percent in 2002.
15
Prepared by Mercedes Garcia-Escribano and Fei Han (WHD).
16 According to “Economic Mobility and the Rise of the Latin American and Caribbean Middle Class”, the World Bank,
Washington, D.C., 2013, Brazil’s middle class represents 30 percent of total population, compared to 22 percent in
2002. Middle class is defined as people with per capita household income of 10 to 50 U.S. dollars per day in the
report.
17 Poverty rate is defined as the percentage of people in the total population with per capita household income
below the poverty line. The poverty line considered here is twice the extreme poverty line, an estimate of the value of
a basket of food with minimum calories needed to adequately meet a person, based on the recommendations of
FAO and WHO.

JOBS AND GROWTH: SUPPLEMENT ON COUNTRY CASE STUDIES
14 INTERNATIONAL MONETARY FUND
45
50
55
60
65
0
4
8
12
16
Ap
r-2002
Ap
r-2003
Ap
r-2004
Ap
r-2005
Ap
r-2006
Ap
r-2007
Ap
r-2008
Ap
r-2009
Ap
r-2010
Ap
r-2011
Ap
r-2012
Unemployment and Formalization
Unemployment rate (percent)
Formal employment (percent of total employment, RHS)
90
100
110
120
130
0
100
200
300
400
Jan-2
003
Jan-2
004
Jan-2
005
Jan-2
006
Jan-2
007
Jan-2
008
Jan-2
009
Jan-2
010
Jan-2
011
Jan-2
012
Jan-2
013
Minimum Wage and Average Real Earnings
(Index, January 2003=100)
Minimum wage
Average real earnings (RHS)
Sources: Haver Analytics; and Fund staff calculations.Sources: IBGE; and Haver Analytics.
Labor market formalization has grown steadily. Formal jobs now account for 60 percent of
employment, representing an increase of 10 percentage points since 2002. In addition to the
strong economic growth, several regulatory changes have benefited this process, including the
introduction of simplified taxation for small businesses, and measures for private pension funds
to increase portability of benefits and lower the costs of participation for small enterprises.
Real wages have risen, in particular in the service sector, reflecting buoyant domestic demand
and sustained increases in the minimum wage.
31. In addition to strong employment growth, social policies have contributed to the
reduction of poverty and inequality. Brazil has successfully expanded well-targeted social
assistance programs. Federal spending on social assistance programs has almost doubled in percent
of GDP over the last decade but at less than 1 percent of GDP it remains small relative to total
spending.18
The two main programs are transfers to low-income elderly and disabled adults
(equivalent to the minimum wage), and the Bolsa Família program. The latter program features a
direct cash transfer to poor households, with the benefit varying according to the household’s level
of per capita income and number of children, conditional on children’s school attendance and
participation in basic health care programs. This program, created in 2004, currently benefits almost
14 million households, at a budgetary cost of 0.4 percent of GDP, and is widely recognized as an
effective policy in reducing poverty and inequality.19
32. Brazil’s greater inclusiveness supported sizable gains in private income and
consumption and may thus have had a positive effect on growth and macroeconomic
stability. The gains in income and inclusion also went hand in hand with financial deepening,
suggesting that there may also have been a helpful feedback relationship between inclusion and
financial sector development.
18
See Teresa Ter-Minassian, 2012, “Structural Reforms in Brazil: Progress and Unfinished Agenda”, IADB Policy Brief
No. IDB-PB-158, Inter-American Development Bank.
19 A study by the UNDP’s International Policy Centre for Inclusive Growth found that the Bolsa Família program
explains about 20 percent of the drop in household income inequality since 2001.

JOBS AND GROWTH: SUPPLEMENT ON COUNTRY CASE STUDIES
INTERNATIONAL MONETARY FUND 15
V. REPUBLIC OF CONGO: INCLUSIVE GROWTH20
This note summarizes the approach taken by the Republic of Congo (Congo) team to integrate
inclusive growth into the 2012 Article IV consultation discussions (SM/12/134).21
In broad terms, given
strong qualitative and quantitative indications that policies have not been inclusive, the team
evaluated a series of quantifiable dimensions of inclusive growth (see table below) to gauge which
areas warranted particular emphasis. Dimensions were limited to those which are directly or indirectly
impacted by policy. In the case of Congo, all dimensions were lacking, leading to adoption of inclusive
growth as the overarching theme of the discussions. Other country teams will likely find only a few
dimensions which warrant in depth study and focus.
Quantifiable Dimensions of Inclusive Growth
Sustained growth Post-conflict growth pattern
Broad-based growth Oil versus non-oil activity
Informality Production, employment
Employment Un-, under-, and vulnerable employment
Business climate, governance Ease of doing business
Access to financial services (Underdeveloped) banking sector
Access to basic infrastructure Post-conflict, stock of infrastructure
Social outcomes Incidence of multidimensional poverty
Quantitative assessment
33. An initial back of the envelop calculation indicated that growth in the oil-rich country
had not been inclusive—indeed, despite oil revenues of $20 billion over the decade ending 2011
and per capita GDP of about $3,600, over half of the population of 4 million continued to live in
poverty, with over 70 percent suffering from at least one-dimension of multidimensional poverty.
34. The mission team then focused on using available quantitative indicators to make an
initial assessment of the key dimensions holding back inclusiveness. For sectors outside of the
Fund’s core mandate, it was imperative to capitalize on the work of development partners. In
addition to widely available indicators, such as national accounts statistics, the Doing Business
20
Prepared by Carol Baker (STA) and Javier Arze del Granado (AFR).
21 http://www.imf.org/external/pubs/cat/longres.aspx?sk=40046.0

JOBS AND GROWTH: SUPPLEMENT ON COUNTRY CASE STUDIES
16 INTERNATIONAL MONETARY FUND
Report (World Bank), banking sector data and the UN’s Human Development Index, the team
benefited from a 2009 Employment and Informal Sector Survey and a 2011 World Bank Employment
and Growth study. For infrastructure, staff adapted academic work to construct in-house calculations
of the road network22
, while using World Bank MDG data points on electricity consumption.
35. The results of the quantitative assessment were daunting, indicating that all
dimensions of inclusion were lacking. Notably, in addition to revealing low non-oil growth and
sustained poverty, the analysis indicated that a large share of the population is excluded from
participation in income earning economic activity; diversification is hindered by a difficult business
climate; basic infrastructure (roads, energy, water) is severely lacking; and a labor skills mismatch—
resulting from an inappropriately focused and low quality education system—leads to high un- and
under-employment, especially among youth.
36. Given the severity of the bottlenecks, the quantitative analysis alone could not answer
the question which dimensions were holding back inclusion. Coming to an overall assessment
required using the team’s judgment.
Coming to an overall assessment
37. After looking at the quantifiable indicators, and given knowledge acquired in the field,
the team concluded that growth has not been inclusive, in large part because of interlinked
bottlenecks which were present in all dimensions. In order to foster inclusive growth,
coordinated policy actions were required in areas under the Fund’s core mandate (growth, taxation,
budget allocation, public financial management, financial sector) as well as areas in which
development partners generally take the lead (business climate, governance and transparency,
employment policy, health and education policies, etc.).
The approach to the 2012 Article IV consultation
38. The approach was to focus the team’s analytical work on areas under the Fund staff’s
core area of expertise, namely macroeconomic policy, and leverage work of development
partners in other areas.
39. At the stage of the PCN: the team was in a strong position to make recommendations in
most dimensions by building on the analyses carried out and strong collaboration with development
partners throughout the ECF program (2008–11). For example, (i) the authorities put an emphasis on
inclusive growth in their new PRS (January 2012); (ii) donors had assisted the authorities to develop
a financial sector strategy (2008) and an Action Plan to Improve the Business Climate (adopted
February 2011); and (iii) the World Bank produced an Employment and Growth study (December
2011) which contains a matrix of recommendations to increase labor market participation and
22
Gwilliam, Keneth, et al. (2011). Africa’s Transport Infrastructure: Mainstreaming Maintenance and Management.
The World Bank, Washington D.C.
JOBS AND GROWTH: SUPPLEMENT ON COUNTRY CASE STUDIES
INTERNATIONAL MONETARY FUND 17
improve the labor market. Preliminary results were also available from the authorities’ 2011
Household Survey.
40. In the field: the team actively sought out and collaborated closely with less traditional
development partners, such as Unicef and the World Food Program (WFP) in areas related to social
service provision and policies to strengthen the social safety net. This included inviting development
partners to the technical meetings on relevant topics (with the approval of the authorities) and
holding joint presentations on key topics, such as the benefits of a public expenditure tracking
(PETS) diagnostic in improving health and education outcomes. The team worked closely with
donors to define their work program for the coming year, requesting that key diagnostic studies in
the social area be brought forward in support of strengthening expenditure quality. Subsequently, at
joint meetings donors informed the government of their willingness to put PETS on the top of their
agenda (Unicef and the World Bank) and identified sources of financing. The WFP informed the
team of their work with Ministry for Social Affairs on an incipient and small “in kind” transfer
program which is showing promising results, and the team expressed support for these efforts in
technical as well as policy meetings. Finally, at the donor briefing, the team pressed for greater
collaboration among donors to “speak with one voice” aimed at improving inclusive growth
outcomes, inter alia, better governance/transparency of oil resources.
41. In the staff report: inclusive growth was made the overarching theme. The case was
presented as “Congo at a crossroads”, where growth has been strong but not inclusive.
The team’s own analysis focused on our core areas of expertise, namely aspects of fiscal policy
which support raising inclusiveness. Topics included: (i) reducing expenditure
volatility/procyclicality by introducing a fiscal rule for the spending-saving of oil receipts; (ii)
expenditure allocation to investment and social areas; and (iii) raising the quality of spending,
especially in investment (improvements in PFM) and social service provision (health and
education). The team also weighed in on the authorities’ growth model based on Special
Economic Zones, noting that a first-best solution would be to improve the overall business
climate for all firms (which includes a major overhaul of the unduly complex tax system) and
avoid creating new distortions.
On areas outside of our core expertise, the team produced short background notes summarizing
the main issues outlined in the reports of development partners (i.e., the World Bank
Employment and Growth study, 2011) and attached them to the staff report. The main message
is that given the severity of the situation, a multi-pronged approach to job-rich growth is
needed.

JOBS AND GROWTH: SUPPLEMENT ON COUNTRY CASE STUDIES
18 INTERNATIONAL MONETARY FUND
0
2
4
6
8
10
12
1970 1974 1978 1982 1986 1990 1994 1998 2002 2006 2010
Germany: Unemployment Rate(Percent of labor force)
Source: Federal Statistical Office (National and ILO definiton).
West Germany Unified Germany
-3
-1
1
3
5
7
9
11
13
15
1970 1975 1980 1985 1990 1995 2000 2005 2010
Germany France Italy
United Kingdom United States Japan
Unemployment in Advanced Economies(Percent of labor force)
Source: World Economic Outlook.
VI. GERMANY: LABOR MARKET REFORMS23
After decades of rising unemployment, Germany undertook major reforms of its labor market
institutions and unemployment benefits in early 2000s, forging an environment with higher incentives
to supply labor and improved flexibility to create jobs. The reforms served Germany well during the
crisis and are reflected in its low unemployment rates. The German labor market is currently strong.
However, continued policy efforts are needed to improve upward mobility in some segments.
42. The German labor market has gone through a salient transformation in the last
decade, from being called the “sick man of the Europe” in the late 90s to the “labor market miracle”
during the Great Recession. Current low unemployment rates have not always been the case in
Germany. In fact, from 1970 to 2005 there has been a secular increase in unemployment rates in
Germany, only partially interrupted but not reversed by cyclical trends. The labor market was
characterized by the prevalence of long-term unemployment and low job creation. The roots of the
problem were interlinked. High reservation wages (due to high and long unemployment benefits)
reduced incentives for labor supply and job search. On the other hand, high reservation wages
combined with high firing costs and rigid wage determination mechanisms discouraged job
creation.
43. High unemployment rates and pressures on the social security funds triggered a far-
reaching labor market and social policy reform in early 2000s, called Hartz I-IV reforms.
Approved during 2002-03 but implemented gradually, these complementary reforms can be broadly
grouped in three sets based on their goals. One set of reforms incentivized job creation by reducing
firing costs: Hartz I significantly deregulated the temporary work sector, giving individual employers
flexibility to vary employment through temp workers without incurring hiring or firing costs. In
addition, Hartz II increased the threshold size for firms subject to layoff rules, from five to ten
workers. Another set of reforms aimed at increasing incentives for labor supply and job search: Hartz
IV considerably reduced the size and duration of unemployment benefits and made them
conditional on tighter sets of rules for job search and acceptance. Moreover, Hartz II also introduced
so-called mini-jobs, or part-time forms of employment involving monthly income of less than 400
23
Prepared by Faezeh Raei (EUR).
JOBS AND GROWTH: SUPPLEMENT ON COUNTRY CASE STUDIES
INTERNATIONAL MONETARY FUND 19
0
1
2
3
4
5
6
1996 1998 2000 2002 2004 2006 2008 2010 2012
Short-term unemployed
Long-term unemployed
Germany: Unemployment by Duration(Millions of persons)
Source: Federal Statistical Office.
35
36
37
38
39
40
41
42
-2
-1.5
-1
-0.5
0
0.5
1
1.5
2
2.5
1992 1994 1996 1998 2000 2002 2004 2006 2008 2010 2012
Contribution of part time (percent, LHS)
Contribution of full time (percent, LHS)
Total employment (millions of persons, RHS)
Germany: Total Employment and Growth Contributions
from Part time and Full time Employment
Sources: Federal Statistical Office, OECD and IMF staff caluculations.
EUR monthly which were exempt from most social security taxes. A third set of reforms (Hartz III)
restructured the Federal labor agency and sought to improve training and matching efficiency of job
searchers. The Hartz reforms moved Germany closer to the Nordic system of “flexicurity” with
medium to high level of employment protection, generous but conditional unemployment benefits,
and strong active labor market policies facilitating labor reallocation (micro flexibility). However,
compared to the Nordic model, the German model provides less protection and has more
decentralized bargaining systems.
44. Reforms of marginal jobs led to more flexibility in core jobs. Reforms of the low-wage
sector led to non-legislative changes in the core labor market (high-paid protected jobs) which was
difficult to deregulate. Growth of temporary jobs gave rise to a second tier of employment in
manufacturing and resulted in competition in the regular employment sector. The firms and unions
started to increasingly introduce flexibility into collectively bargained work arrangements. One key
change was the gradual adoption of worktime accounts, enabling reduction of working hours or pay
in exchange for avoiding layoffs. This feature increased macro flexibility and served the German
economy well during the crisis as firms reduced hours instead of dismissing workers. The macro
flexibility provided through work-time accounts, was supplemented by enhancing the longstanding
practice of short-time subsidies (kurzarbeit) during the crisis, which facilitated work-time reductions
by partially compensating workers for part of their lost income.
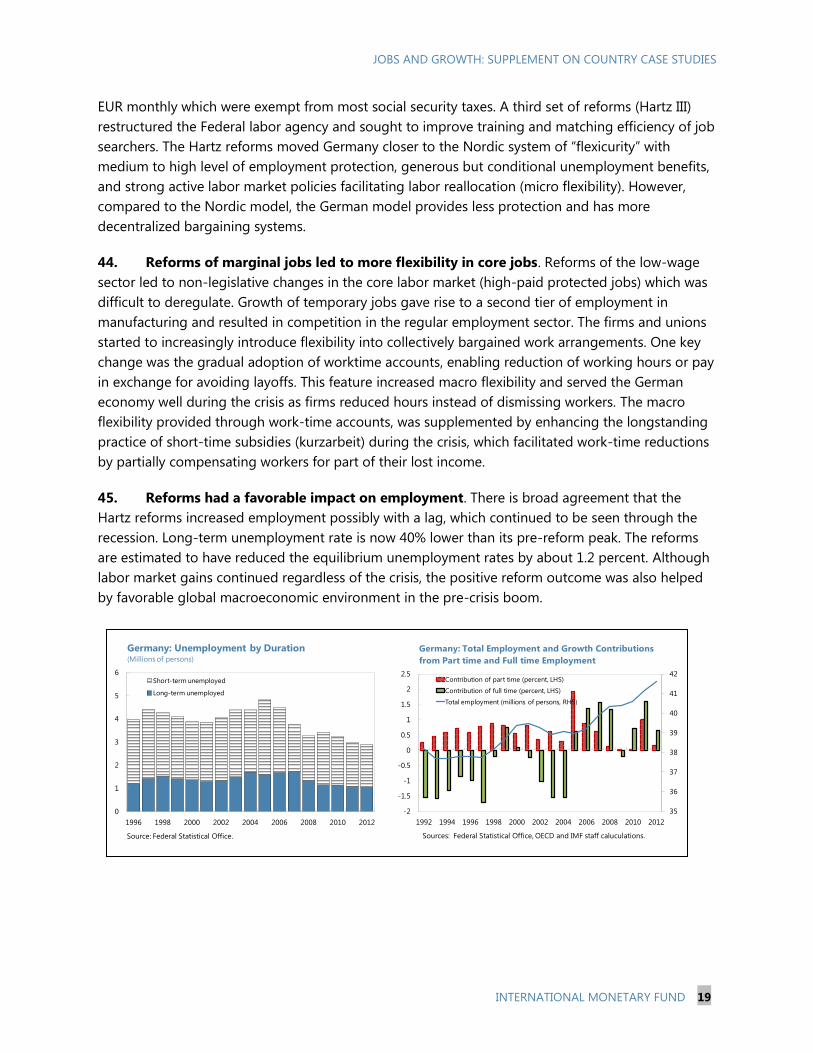
45. Reforms had a favorable impact on employment. There is broad agreement that the
Hartz reforms increased employment possibly with a lag, which continued to be seen through the
recession. Long-term unemployment rate is now 40% lower than its pre-reform peak. The reforms
are estimated to have reduced the equilibrium unemployment rates by about 1.2 percent. Although
labor market gains continued regardless of the crisis, the positive reform outcome was also helped
by favorable global macroeconomic environment in the pre-crisis boom.

JOBS AND GROWTH: SUPPLEMENT ON COUNTRY CASE STUDIES
20 INTERNATIONAL MONETARY FUND
-1
4
9
14
19
24
29
Germany France Italy Spain Untied States
∆ P 90/10 ∆ P 90/50 ∆ P 50/10
Changes in Decile Income Ratios(Percent change between 2005 and 2010)
Source: OECD.Note. Columns represent prercent changes between 2005 and 2010 in P90/10 (ratio of top to
bottom deciles of income), P90/50 (ratio of top decile to median income) and P50/10 (ratio of
median income to bottom decile).
0.18
0.22
0.26
0.30
0.34
0.38
0.42
1975 1980 1985 1990 1995 2000 2005 2010
CAN FRA DEU ITA JPN GBR USA
USA
GBR
DEU
FRACAN
Source: OECD.
Gini Coefficient in Advanced Countries
(Gini coefficient of income inequality)
46. The impact of reforms on inequality is less clear. An increased labor participation of low-
skilled may be part of the observed increase in income inequality; however, it is difficult to
disentangle this impact from the global rise in inequality. In addition, while initially the number of
part-time jobs increased, it has stabilized since and employment growth of full time jobs have
picked up, with a potential dampening impact on inequality
47. The German labor market is working well but there is ample scope to improve the
performance of some of its segments. Training and activation policies need to be maintained to
integrate the disadvantaged groups, the remaining long-term unemployed, and to help with the
upward mobility of the temporary workers and the marginally employed. Part-timers face steep tax-
wedges to increase hours worked, with the effect of making these jobs persistent rather than
stepping stones to full-time employment. Removing fiscal disincentives and providing training can
help mitigate risks of persistent marginal employment.
References
Burda, M. C. and J. Hunt, 2011, “What explains the German labor market miracle in the Great
Recession?” National Bureau of Economic Research, No. w17187. 2011.
Eichhorst, W. and P. Marx, 2011, “Reforming German labour market institutions: A dual path to
flexibility," Journal of European Social Policy 21.1 (2011): 73-87.
Schindler, M., 2013, "What Does the Crisis Tell Us about the German Labor Market?" Germany in an
Interconnected World Economy (2013): 77.

JOBS AND GROWTH: SUPPLEMENT ON COUNTRY CASE STUDIES
INTERNATIONAL MONETARY FUND 21
VII. GHANA: INCLUSIVE GROWTH SUCCESSES AND
CHALLENGES24
Ghana has experienced strong and broadly inclusive growth over the last 20 years, defined as
growth that raises the income of most or all in society, including the poorest groups. Significant
progress in poverty reduction has been achieved as well as the establishment of a highly rated
governance and business environment. Although poverty and social indicators have improved
significantly, about a quarter of the population still lives below the poverty line. Demographic
trends will require the creation of 6–7 million jobs in the next 20 years, more than half of the
current labor force, to absorb new entrants into the labor market. Success will hinge on
complementing growth from extractive industries with diversified, private sector-led growth in
more labor-intensive sectors. Staff discussions with the authorities have focused on addressing
Ghana’s main growth constraints, consistent with the government’s own growth and development
agenda.
Background
48. Ghana has experienced strong per capita GDP growth over the last 20 years,
consistently outperforming Sub-Saharan Africa and the world. Growth has accelerated over the
last 5 years, with strong performance in 2011, in particular, due to investment in oil extraction. This
growth experience has recently vaulted the country into lower-middle income status.
24
Prepared by Wendell Daal and Kevin Wiseman (both AFR), based on Country Report No. 13/187 (Appendix II)
-2.0
-1.0
0.0
1.0
2.0
3.0
4.0
5.0
6.0
1993 1996 1999 2002 2005 2008 2011Pe
r C
ap
ita
GD
P G
row
th (
10
ye
ar
roll
ing
av
era
ge
, P
PP
)
Middle income Sub-Saharan Africa World Ghana
Per Capita Growth
Sources: World Bank, World Development Indicators, 2013; Staff estimates.
0
1000
2000
3000
4000
5000
6000
7000
GD
P p
er
cap
ita
, P
PP
1990 2011
Per Capita GDP
Sources: World Bank, World Development Indicators, 2013.
JOBS AND GROWTH: SUPPLEMENT ON COUNTRY CASE STUDIES
22 INTERNATIONAL MONETARY FUND
0 50 100 150 200
SSA 1997 2012
Proportion of seats held by women in national parliaments (%) Ghana 1997 2011
SSA 1990 2011
Ratio of female to male tertiary enrollment (%) Ghana 1991 2011
SSA 1990 2011
Ratio of girls to boys in primary and secondary education (%) Ghana 1990 2012
SSA 1990 2011
School enrollment, primary (% net) Ghana 1999 2012
SSA 1990 2010
Literacy rate, youth total (% of people ages 15-24) Ghana 2000 2010
SSA 1990 2010
Improved water source (% of population with access) Ghana 1990 2010
SSA 1990 2010
Improved sanitation facilities (% of population with access) Ghana 1990 2010
SSA 2000 2009
Births attended by skilled health staff (% of total) Ghana 1993 2011
SSA 1990 2010
Maternal mortality ratio (modeled estimate, per 10,000 live births) Ghana 1990 2010
SSA 1990 2011
Mortality rate, under-5 (per 1,000) Ghana 1990 2011
Poverty headcount ratio at urban poverty line (% of urban population) Ghana 1992 2006
Poverty headcount ratio at rural poverty line (% of rural population) Ghana 1992 2006
Earliest Observation
Latest Observation
Other Social Indicators
Sources: World Bank, World Development Indicators, 2013.
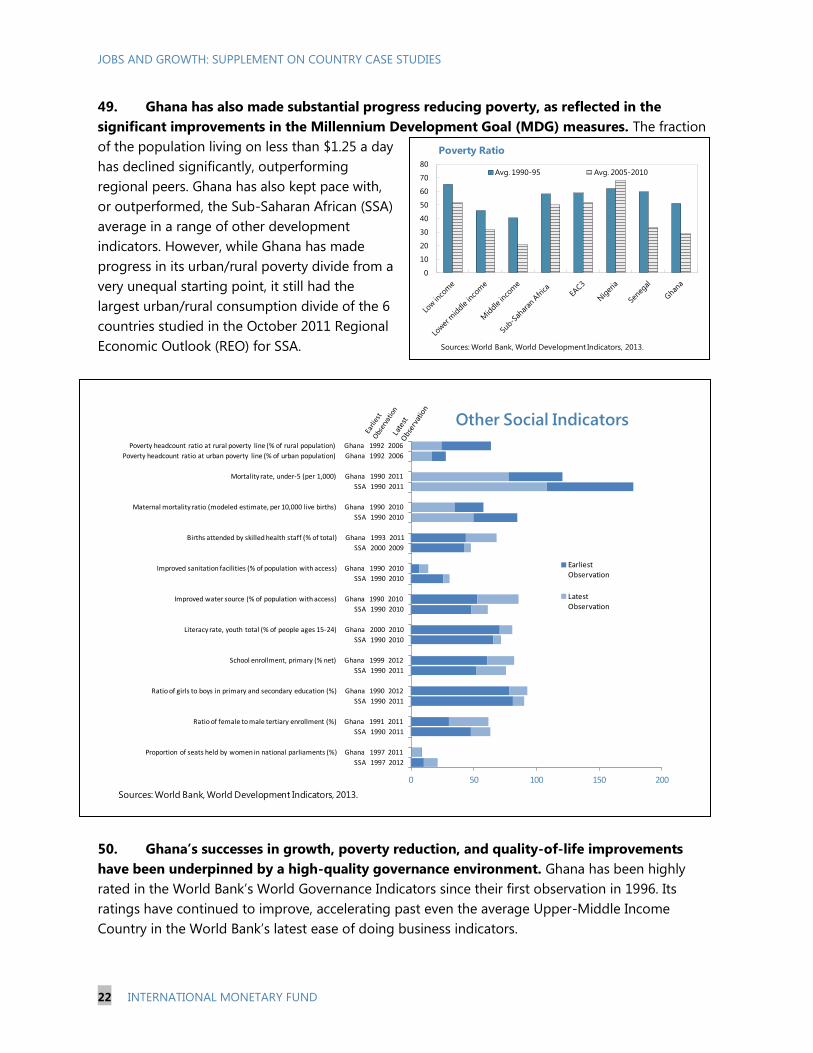
49. Ghana has also made substantial progress reducing poverty, as reflected in the
significant improvements in the Millennium Development Goal (MDG) measures. The fraction
of the population living on less than $1.25 a day
has declined significantly, outperforming
regional peers. Ghana has also kept pace with,
or outperformed, the Sub-Saharan African (SSA)
average in a range of other development
indicators. However, while Ghana has made
progress in its urban/rural poverty divide from a
very unequal starting point, it still had the
largest urban/rural consumption divide of the 6
countries studied in the October 2011 Regional
Economic Outlook (REO) for SSA.
50. Ghana’s successes in growth, poverty reduction, and quality-of-life improvements
have been underpinned by a high-quality governance environment. Ghana has been highly
rated in the World Bank’s World Governance Indicators since their first observation in 1996. Its
ratings have continued to improve, accelerating past even the average Upper-Middle Income
Country in the World Bank’s latest ease of doing business indicators.
0
10
20
30
40
50
60
70
80Avg. 1990-95 Avg. 2005-2010
Poverty Ratio
Sources: World Bank, World Development Indicators, 2013.

JOBS AND GROWTH: SUPPLEMENT ON COUNTRY CASE STUDIES
INTERNATIONAL MONETARY FUND 23
Authorities’ growth and development agenda
51. The government’s own transformation agenda provided the context for the
discussions with staff. It pursues three broad objectives:
Economic diversification. Leveraging oil and gas resources to create a robust job-creating
manufacturing sector will require significant infrastructure investments and removal of the main
bottlenecks to growth—inadequate and unreliable energy provision and lack of affordable
private sector financing.
Social inclusion. To make further advancements in poverty reduction, ensure that the benefits of
growth are widely shared, and build a workforce ready to take on higher-skilled jobs, the
government wants to further strengthen Ghana’s social safety net and continue investments in
utilities, health, and education, while improving the quality of social spending.
Macroeconomic and debt sustainability. The public debt ratio has steadily risen since the
country benefited from HIPC/MDRI debt relief, and the government realizes that fiscal
consolidation is needed to reduce external vulnerabilities, lower inflation, and support of private
investment.
Constraints to growth
52. Access to affordable credit and reliable electricity provision are the principal
constraints to private sector growth. These constraints—identified in a recent study by the U.S.
and Ghanaian governments based on firm-level surveys—present a particular burden for small and
medium-sized enterprises and labor-intensive sectors, where growth is most inclusive.
53. Despite the existence of a relatively well-developed banking system, access to
affordable financing is a problem. Ghana’s banking system has more bank accounts and branches
per capita than the regional average, and even though rural and community banks have become a
key channel for financial inclusion, only about 30 percent of Ghanaian adults have an account at a
62.0
47.6
34.632.7
0.0
10.0
20.0
30.0
40.0
50.0
60.0
70.0
Bett
er
Co
ntr
ol o
f C
orr
up
tio
n
Governancer Indicators
Sources: World Bank, World Governance Indicators, 2013.
0
25
50
75
100
Easi
er fo
r d
oin
g b
usi
ness
2008 2012
Ease of Doing Business(Percentile rank; 100= better)
Sources: World Bank, International Finance Corporation, Doing Business 2013

JOBS AND GROWTH: SUPPLEMENT ON COUNTRY CASE STUDIES
24 INTERNATIONAL MONETARY FUND
formal institution. A sizeable part of the population relies instead on the services of about 600
microfinance companies, as well as 3,000–5,000 individual susu collectors, traditional providers of
informal banking services, that serve over half a million customers.
54. For those parts of the population that have bank accounts, the high cost of borrowing
is significantly constraining access to credit. Double-digit real lending rates—kept up by large
government financing needs—are crowding out the private sector; private credit is low relative to
similar, and even less developed, markets. In contrast, the real return to savings is negative, leaving
domestic savings ratios well below those of countries with less developed financial markets.
55. Energy supply has been identified as another major constraint on growth.
Entrepreneurs report that unreliable energy supply, the high cost of private generators, and the
uncertain future of energy providers are major concerns in investment decisions. These concerns are
most acute in sectors which contribute heavily to job growth—manufacturing and downstream
agricultural transformation.
56. The poor financial situation of energy providers is preventing necessary maintenance
and additional investment. Reluctance to raise electricity prices to cost-recovery levels, along with
relatively high commercial and technical losses in the distribution network, has severely affected the
financial viability of the state energy companies. The sector came recently under further strain from
the rupture of the West African Gas Pipeline, increasing the share of petroleum-based production at
double the marginal cost.
Growing where the jobs are
57. Ghana’s economy will need to add 6-7 million jobs by 2030, according to population
and economic activity rate projections. Currently more than 80 percent of Ghana’s jobs are in the
informal sector, and it is unlikely that the formal economy will be able to generate enough stable
salary work to absorb the influx of new workers. More than 40 percent of workers are in the
agricultural sector which remains poorly paid and largely informal. Among the middle-income SSA
0
4
8
12
16
20
Ghana Kenya Zambia Lower-Middle
Income
Sub-Saharan
Africa
Lending-Deposit Spread
Sources: World Bank, FINSTATS Database, 2013; IMF staff calculations.
0
10
20
30
40
2002 2004 2006 2008 2010
GHA WAEMU Avg KEN SSA Avg
Private Credit to GDP, 2002–2011(Percent of GDP)
Sources: World Bank, FINSTATS Database, 2013, and IMF staff estimates.

JOBS AND GROWTH: SUPPLEMENT ON COUNTRY CASE STUDIES
INTERNATIONAL MONETARY FUND 25
countries compared in the Fall 2012 REO, the agriculture share of GDP in Ghana was more than
twice as high as in any other country and was declining at the second slowest rate. As discussed
below, the sector has registered below-average growth over the past 5 years.
Fund involvement and recommendations
58. During the 2013 Article IV Consultation, discussions were guided by the government’s
own growth and development agenda. The team focused on the main identified constraints to
strong and inclusive growth, which were integrated into the consultation in several ways:
Dedicated outreach event with members of local think tanks and CSOs. The team presented an
assessment of Ghana’s broadly inclusive growth over the past two decades and identified
challenges going forward. A discussion followed with local experts assessing key bottlenecks
and identifying solutions.
Coverage of inclusive growth topics in meetings and mission outputs. The team pursued
problems related to electricity provision, credit access, and interest rate spreads in a variety of
meetings with the private sector, unions, and public sector entities. These topics were
highlighted in policy discussions and woven into the team’s press release and staff report.
Enhanced financial sector surveillance. Ghana’s participation in the LIC pilot provided an
opportunity to elaborate in more detail on the linkages between financial sector development
and inclusive growth.
59. Conversations with business and union representatives, civil society organizations, and
the authorities showed a broad consensus across key stakeholders:
Fiscal consolidation should be the government’s immediate priority, with a realignment of
spending away from wages and subsidies toward investment in infrastructure. Lower
government borrowing will make private credit more affordable, while a return to cost-recovery
electricity tariffs will help restore the financial viability of the state-owned energy companies as a
prerequisite for stabilizing Ghana’s energy supply. In addition to easing Ghana’s main growth
26%
8%
7%
11%
48%
42%
1%
11%
4%
43%
Sectoral Employment and Output Shares
Agriculture
Mining and quarrying
Manufacturing
Other Secondary
Sector
Tertiary Sector
Employment
GDP
Sources: Ghanaian authorities; IMF staff estimates.
Mining and
Quarying
Manufacturing
Construction
EducationOther Services
-5
0
5
10
15
20
25
0 100 200 300 400 500 600 700
Avera
ge S
ecto
ral G
row
th 2
006
-11
People Employed per Million Cedis Value Added, 2010
Labor Intensity and Growth
Bubble Size indicates Employment Share
Sources: Ghana Statistical Service and IMF staff estimates.
Agriculture
JOBS AND GROWTH: SUPPLEMENT ON COUNTRY CASE STUDIES
26 INTERNATIONAL MONETARY FUND
constraints, fiscal consolidation will also reduce external vulnerabilities arising from a high
current account deficit and low foreign reserve cover. At the same time, there was a shared
recognition that successful transformation requires administrative and institutional reforms to
promote reliable policy implementation, higher efficiency of public infrastructure investment,
and deeper financial intermediation.
Looking forward, policies will have to focus on promoting growth in employment-producing
sectors. Even though Ghana enjoys a natural comparative advantage in agriculture and should
not pursue a manufacturing-led growth strategy at all costs, diversifying unskilled labor away
from basic agriculture, while increasing agricultural productivity, would likely lead to higher
growth with particular benefits for the most vulnerable within and outside the agricultural
sector. At the same time, the extractive sector will continue to be an engine of growth over the
next 10 years as petroleum production peaks and new natural gas fields are brought on stream.
Prudent use of natural resource revenues for infrastructure and human capital investments will
determine the extent to which Ghana’s resource wealth will contribute positively to the welfare
of the average Ghanaian.
JOBS AND GROWTH: SUPPLEMENT ON COUNTRY CASE STUDIES
INTERNATIONAL MONETARY FUND 27
VIII. HAITI: STRUCTURAL FISCAL REFORMS TO
STRENGTHEN GROWTH AND INCLUSION25
60. Haiti is one of the poorest countries in the world. GDP per capita in 2011 was about
$1000 USD on a PPP basis, which represents a decline of 25 percent from twenty years ago. Almost
80 percent of the population lives in extreme poverty, and inequality is very high, with a Gini
coefficient based on market income of 59.2. Haiti’s poverty is rooted in its difficult history, but also
reflects periods of macroeconomic mismanagement, poor infrastructure, and an unfavorable
business environment. Political instability, deep domestic institutional and structural weaknesses,
and frequent natural disasters (including the massive 2010 earthquake) compound these challenges.
Employment is low, concentrated in small business and in the informal sector.
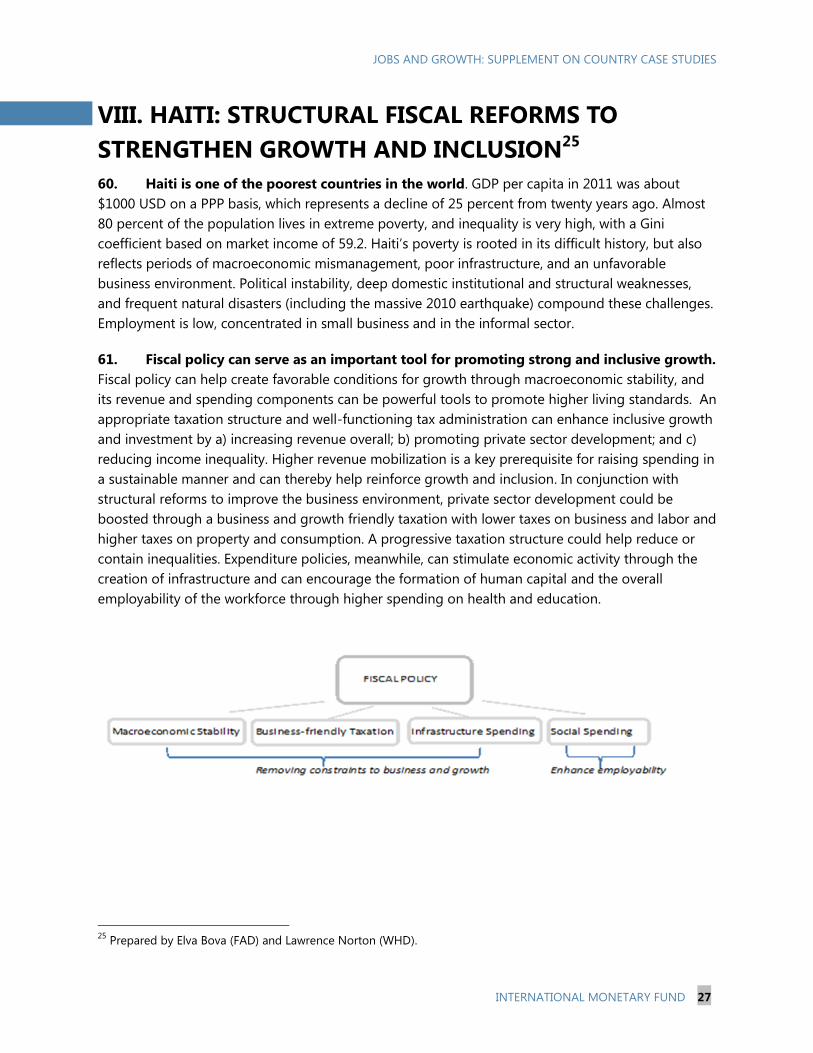
61. Fiscal policy can serve as an important tool for promoting strong and inclusive growth.
Fiscal policy can help create favorable conditions for growth through macroeconomic stability, and
its revenue and spending components can be powerful tools to promote higher living standards. An
appropriate taxation structure and well-functioning tax administration can enhance inclusive growth
and investment by a) increasing revenue overall; b) promoting private sector development; and c)
reducing income inequality. Higher revenue mobilization is a key prerequisite for raising spending in
a sustainable manner and can thereby help reinforce growth and inclusion. In conjunction with
structural reforms to improve the business environment, private sector development could be
boosted through a business and growth friendly taxation with lower taxes on business and labor and
higher taxes on property and consumption. A progressive taxation structure could help reduce or
contain inequalities. Expenditure policies, meanwhile, can stimulate economic activity through the
creation of infrastructure and can encourage the formation of human capital and the overall
employability of the workforce through higher spending on health and education.
25
Prepared by Elva Bova (FAD) and Lawrence Norton (WHD).

JOBS AND GROWTH: SUPPLEMENT ON COUNTRY CASE STUDIES
28 INTERNATIONAL MONETARY FUND
62. Domestic revenue is low in Haiti, and the taxation structure hinders private sector
development. Domestic revenue stood at almost 13 percent of GDP in 2011, a level largely below
that of countries with similar levels of GDP
per capita. This reflects capacity constraints in
the administration and collection process, a
high level of tax expenditures, and a taxation
structure that does not reflect the needs and
compliance challenges of large, medium, and
small taxpayers. Haiti relies heavily on indirect
taxation, particularly customs duties and a
turnover tax that is applied on all levels of the
production chain, posing a significant burden
on business. Haiti’s taxation structure is
therefore one constraint on Haiti’s business
environment (along with a cumbersome and
uncertain regulatory and legal regime, low levels of access to finance, and infrastructure
bottlenecks), and is not efficient in raising domestic revenue. Moreover, Haiti’s highest income tax
rate takes effect only at very high levels of income, resulting in only weak progressivity and
perpetuating inequality.
63. Reforms to revenue collection could broaden the tax base while reducing compliance
costs. Haiti plans to replace the turnover tax with a traditional VAT, which could reduce incentives to
operate in the informal sector while potentially raising revenue overall. The authorities plan to
complete a study on the adoption of a VAT by December 2013, and are a drafting a VAT law
supported by IMF technical assistance. Reforms to the corporate tax structure could also be
considered: for example, at present the tax on dividends must be added to the corporate income
tax, and companies cannot deduct taxes on international income. Such reforms, as part of a broader
effort to improve the business environment, could spur private sector development while raising
revenue. A more progressive income tax system could also be considered.
64. Improvements in the capacity to execute public spending programs would promote
Haiti’s long-term growth and development.
Haiti has weak capacity for executing capital
spending despite enormous infrastructure
gaps. This reflects a fragmentation of the
public investment program, cumbersome
project execution, and weak information and
control systems. Against this background,
Haiti should pursue reforms to define clear
responsibility among government institutions,
enhance the control system, boost the work of
the unit of project executions and promote a
dynamic information system. Current
Income levels (in % of GDP per capita) corresponding to
the lowest and highest tax rate
Treasury-financed capital spending:
Execution rate

JOBS AND GROWTH: SUPPLEMENT ON COUNTRY CASE STUDIES
INTERNATIONAL MONETARY FUND 29
expenditures should also be reoriented more towards social spending, which are the lowest in the
region.
Social Spending
(percent of GDP)

JOBS AND GROWTH: SUPPLEMENT ON COUNTRY CASE STUDIES
30 INTERNATIONAL MONETARY FUND
IX. KOREA: LABOR MARKET REFORMS26
Situation regarding growth, income distribution and unemployment
65. Korea’s growth has gradually slowed since the mid 1990s, after an extended period of
rapid growth. As is often cited, it is one of the few countries that went from being a recipient of
financial aid to a donor country and a member of the OECD in a short span of time, and is often
hailed as a model for developing countries. However, Korean growth has decelerated in recent
years. Actual real GDP growth has slowed from almost 10 percent during 1981-1990 to average
around 3 percent during 2011-2012. This suggests that Korea’s potential output has also trended
down over time and, in the absence of sustained and comprehensive structural reforms, may
continue to do so in the face of future demographic headwinds.
66. At the same time, income inequality has worsened since the Asian crisis, albeit from
low levels. While the Gini coefficient of net disposable income has declined markedly from about
36 in 1980 to about 29 in 1998, it has been an upward trend increase since then reaching about
31 percent in 2010 (close to the OECD countries’ average).27
Though recent data indicate a reversal
of this trend, owing largely to the government’s social programs, it is not yet clear whether this
amelioration of inequality will be sustained.
67. Despite the deceleration in output growth, unemployment rates have steadily
decreased over the last two decades. The overall unemployment rate has declined from about
11 percent in 1998 to about 3.2 percent in 2012, while youth unemployment has decreased from
about 12 percent to about 8 percent over the same period. While unemployment rates are currently
among the lowest in the OECD countries, low female participation rates, decreasing youth
employment rates, and low service sector productivity due to labor market segmentation are
important labor market challenges, and factors contributing to lower potential growth and
increasing income inequality. In this context, labor market reforms are critical for Korea.
Focus of staff analysis
68. For the forthcoming October Article IV, staff in collaboration with the authorities, will
analyze two key labor market impediments and how they can be remedied: the low female
labor participation rate and the degree of skill mismatch. Specifically, these two issues will be
analyzed as follows:
Female labor force participation. First, the evolution of female labor force participation will be
analyzed, also in comparison to the observed trends for male participation in Korea and for
female participation in other OECD countries. Second, the analysis will assess the determinants
of labor force participation in Korea compared to other OECD countries. Third, the results of the
26
Prepared by Davide Furceri (RES).
27 Data for income inequality are taken from the Standardized World Income Inequality Database (Solt, 2011).
JOBS AND GROWTH: SUPPLEMENT ON COUNTRY CASE STUDIES
INTERNATIONAL MONETARY FUND 31
empirical analysis will be used to quantify the effect of structural reforms in this area (such as
child care benefits) on Korea’s female labor force participation by simulating a convergence of
policy settings towards those prevailing in benchmark OECD countries, identified as those with
the lowest restrictions.
Labor market mismatch and youth employment. First, the analysis will examine trends in youth
employment and unemployment, including among young graduates. Second, a time-varying
measure of mismatch will be constructed, and its evolution over time examined. Third, the
analysis will assess how much of the evolution in youth unemployment and employment has
been driven by skill mismatch between aggregate labor demand and supply.
Results of the analysis and policy recommendations.
69. Female labor force participation. While much of the low participation rate in Korea
compared to other OECD countries is explained by unobserved factors including differences in social
preferences for participation, policies to remove labor market distortions can raise labor force
participation rates. Specifically, preliminary findings suggest that the following policy actions could
raise female participation rates in Korea: (i) making the tax treatment of second earners in a
household compared with single earners more neutral; (ii) increasing childcare benefits;
(iii) facilitating more part-time work opportunities. Simulations of comprehensive policy reforms in
these areas suggest that they could lead to an increase in female participation rate of about 8
percentage points over the medium term, which would reduce by one third the gap between male
and female participation rates.
70. Labor market mismatch. Preliminary findings suggest that: (i) skill mismatch had been
decreasing until mid 2000, when it started stagnating and started to slightly increase; (ii) while there
is a strong correlation between youth employment and the measure of labor market mismatch,
youth and overall unemployment are not significantly correlated with labor market mismatch,
suggesting that labor participation decisions are affected by changes in mismatch. The effect of
mismatch on youth employment rate is economically important. Policy actions, including targeted
educational policies and retraining programs, bringing skill mismatch back to the downward path
before 2005 can increase youth employment rates by 0.6 percentage points per year, which would
bring the youth employment rate back to the level before Asian crisis within 10 years.

JOBS AND GROWTH: SUPPLEMENT ON COUNTRY CASE STUDIES
32 INTERNATIONAL MONETARY FUND
X. MALAYSIA: AVOIDING THE MIDDLE-INCOME
TRAP28
71. Background. At the time of independence in 1957, the economy was commodities-based
and ethnic Malay and other indigenous people (the bumiputera) were disadvantaged. Promoting
shared prosperity was high on the nation’s agenda. Malaysia’s social contract aimed at enhancing
the economic position of the bumiputera based on inclusive processes. Malaysia gradually
expanded the range of commodities it produced and adopted rural development policies that
increased land availability and agricultural extension. Manufacturing took off in the 1980s. Following
the Asian financial crisis, sound macroeconomic management, a liberal trade regime, a reformed
financial system, and emphasis on economic and government transformation and human resource
development provide the institutional and policy framework needed to promote job creation and
inclusive growth.
72. Track record. Malaysia’s growth performance has been notable. Real GDP has expanded by
over 6 percent per annum since 1961, resulting in a 25-fold increase in per capita income. Malaysia,
a high middle income country now, aspires to reach advanced country status by 2020. Growth has
been broad-based and transformative, involving economic diversification, export orientation and
rapid urbanization. Trade amounts to over 130 percent of GDP and over 70 percent of Malaysians
now live and work in urban areas. Modern sectors have absorbed large quantities of agricultural
labor, helping to raise aggregate labor productivity.
73. Social indicators. Malaysia’s rising per capita income has been accompanied by significant
progress in indicators of well being. Poverty has been more than halved and child mortality and
malaria have been reduced by more than two thirds. The headcount poverty rate (3.8 percent)
compares favorably with regional peers and has been falling. Urban poverty in Malaysia is
1.9 percent (2009 figure), a fraction of rural poverty (8.4 percent). Income inequality is high
compared to ASEAN˗5 peers, rural-urban income disparities persist, and the median wage in
agriculture is a third of that in manufacturing. Progress in gender equality lags behind and maternal
mortality, while improved, remains high (29 percent per 100,000 births). Health and education
attainment indicators have improved significantly but public health spending (2.2 percent of GDP) is
relatively low.
74. Jobs and employment. The Malaysian economy supports about 11 million jobs and adds
about 180,000 new jobs a year. Industrial employment peaked to a third of total in 1997 and now
amounts to 28 percent (2010 figures). Services are now the single most important source of job
growth. New jobs are increasingly high- and mid-skill, reflecting a general upgrading of skills in the
economy. Labor force participation rate is 79 percent for men and 46 percent for women. Policies
aim to raise the participation of women in the labor force—this could be an important source of
employment growth in the future. Measured unemployment is low and fell from a peak of
28
Prepared by Alexandros T. Mourmouras (APD).

JOBS AND GROWTH: SUPPLEMENT ON COUNTRY CASE STUDIES
INTERNATIONAL MONETARY FUND 33
3.7 percent during the Global Financial Crisis to about 3 percent at present. Youth unemployment
exceeds 11 percent however. About 1.1 million foreign workers (from Indonesia, Philippines and
Bangladesh) have an important presence. They work in trade, manufacturing, agriculture and
construction. Reducing dependence on foreign labor is a policy concern.
75. Boosting growth. A central objective of Malaysian policymakers is to avoid a middle income
trap—the hypothesis that after reaching middle income levels a country’s growth rate may slow or
even stagnate. In this regard, it is useful to ask what separates Malaysia from advanced countries like
Korea. Differences in per capita income can be attributed to differences in endowments of human
and physical capital, and total factor productivity (TFP): Korea’s output per capita is 2.6 times that of
Malaysia while its capital-output ratio is 20 percent greater than Malaysia’s, and its human capital
(proxied by school years per worker) is 13.95 (compared with 11.42 for Malaysia). Based on a growth
accounting framework, differences in TFP are estimated to explain about half of the gap in output
per worker in Korea and Malaysia; differences in education (human capital) explain about 30
percent, and differences in capital per worker explain the remaining 20 percent. The multiyear plans
pursued by the Malaysian authorities aim to improve policies and institutions—the fundamental
determinants of human and physical capital accumulation and of TFP growth—and avoid a middle
income trap.
76. Transforming the economy and
government. In response to the challenge,
Malaysia is implementing a number of multi-
year “transformation” programs to raise
economic growth and strengthen its
inclusiveness. These programs aim to improve
public sector delivery, raise skills, support
innovation, and turn Malaysia into a knowledge
intensive economy. Concrete policy actions
target strategic sectors (finance, infrastructure,
oil and gas and other commodities). Priorities
include enhanced competition, liberalization of services, divestment of public enterprises, and
market prices for subsidized commodities. These efforts are helping to raise private investment,
which had declined following the Asian crisis, and improving the business climate: Malaysia now
ranks 12th
in the World Bank’s 2013 Doing Business survey. All in all, Malaysia is on its way to
realizing its objective of becoming a high income country by 2020.
77. Strengthening labor policies and institutions in the face of heightened international
demand (and competition) for talent and demographic change is another key policy objective:
Education. Employment prospects, wages and living standards are closely related to the length
and quality of schooling. Malaysia has made important progress in raising school enrollments:
secondary net enrollment has risen sharply (to 68 percent in 2009 from 32.7 percent in 1970).
Enrollment in tertiary education enjoyed a 10-fold increase since 1980 and the wage premium
for university graduates exceeds 50 percent. These gains notwithstanding, Malaysia needs to
0
20
40
60
80
100
120
140
160
Ph
ilip
pin
es
Ind
ia
Ind
on
esi
a
Vie
tnam
Ch
ina
Jap
an
Th
ailan
d
Mala
ysi
a
Au
stra
lia
Ko
rea
New
Zeala
nd
Ho
ng
Ko
ng
SA
R
Sin
gap
ore
Ease of Doing Business Rankings, 2013
Source: World Bank, Doing Business Indicators.

JOBS AND GROWTH: SUPPLEMENT ON COUNTRY CASE STUDIES
34 INTERNATIONAL MONETARY FUND
increase enrollments further in order to meet the skill requirements of an innovation-based
economy and close the gap with OECD levels. Among the priorities are to improve educational
attainment (what students actually know); expand access to tertiary education and the
availability of financing among under-served groups; control quality in private universities; and
retain Malaysia-grown talent at home (World Bank, 2012). The Education Blueprint 2013-25 aims
to transform the Ministry of Education and focus on results—putting Malaysian students at the
top third of international assessments. The key in this area, as in all others, will be sustained
implementation.
Pensions. Malaysia’s population of 29
million (mid-2012 estimate) has been
growing at about 1.9 percent a year in the
2000s. Fertility has been falling and the
share of working age population has been
increasing, but the old age dependency
ratio will start rising after 2020, which
could pose challenges. Malaysia recently
introduced a Private Retirement Scheme
(PRS), which helps supplement the
government-mandated Employees
Provident Fund (EPF). The risk sharing characteristics of Malaysia’s pension system could be
improved by: (i) introducing a publicly funded, first pillar for noncontributors; and (ii) allow
workers to receive their pensions as annuities, to help reduce longevity risk.
Minimum wage. A minimum wage was introduced in 2013, aiming to boost wages of low-skilled
workers and enhance productivity. Initial indications are that the impact on inflation and
unemployment has been limited. The minimum wage should help the incomes of the poor and
also provide incentives for businesses to shift to more capital-intensive technologies. Together
with reforms to improve the business climate, it could lead to higher productivity. The minimum
wage is set at a relatively high level, but flexibility in its implementation and the low share of
labor costs in Malaysia could offset its impact on employment.
Female labor force participation. At 46 percent, the participation of women in the labor force is
low by regional standards. Raising it is quantitatively important for growth and also helps
promote gender equity and intra-family income distribution. Malaysia plans to boost this rate to
55 percent by 2015. Legal reforms and incentives are in train to establish childcare facilities,
employ and train women after career breaks, and promote flexible work arrangements.
Strengthening social protection. Other dimensions of social protection need to be further
developed. Labor redundancy costs are high (Malaysia is ranked 108th
out of 144 countries in
this area in the World Economic Forum’s Global Competitiveness Report). Additional measures
needed, such as introducing unemployment insurance; improving the targeting of cash transfers;
and making them conditional on access to education and health care. Stronger social safety nets
should also help reduce precautionary savings and narrow the current account.
0
2
4
6
8
10
12
14
16
18
50
55
60
65
70
75
1970 1980 1990 2000 2010 2020 2030 2040
Perc
en
t
Perc
en
t o
f p
op
ula
tio
n
Working age population (in percent of total population)
Old age dependency ratio (right scale)
Source: United Nations.
Malaysia: Working Age Population and Old Age Dependency
Ratio 1970−2040

JOBS AND GROWTH: SUPPLEMENT ON COUNTRY CASE STUDIES
INTERNATIONAL MONETARY FUND 35
78. The future. Turning Malaysia into a prosperous, inclusive nation will require continuous
transformation of its economy and government to modernize institutions, infrastructure, and skills.
The Malaysian authorities have identified a wide range of reforms to improve institutions, raise
productivity, improve the effectiveness of education and enhance social insurance and protection.
The minimum wage policy and the other reforms being debated, including unemployment
insurance, should help to insure workers from risk. Challenges remain: public debt is relatively high,
the budget needs to reduce its reliance on oil and gas revenue, and public spending must be better
targeted and made more equitable, including by reforming fuel subsidies.

JOBS AND GROWTH: SUPPLEMENT ON COUNTRY CASE STUDIES
36 INTERNATIONAL MONETARY FUND
XI. MEXICO: LABOR MARKET REFORMS29
79. With macroeconomic and financial stability well entrenched, a key challenge for
Mexico is to implement reforms to boost growth and employment generation. Over the past
two decades, Mexico has achieved low inflation and fiscal discipline, a stable financial system and
deep integration to the rest of the world—underpinned by a strong rules-based policy framework.
Despite these efforts, economic growth has been lackluster, trailing that of many other comparable
emerging market economies.
80. Labor market distortions have been identified as a key obstacle hampering economic
growth (Chiquiar and Ramos-Francia, 2009). Over the last four decades, labor regulations in
Mexico (dating from 1970s) remained among the most rigid in the OECD and emerging markets.
Labor laws considered employee-employer relationships as almost permanent, with little room for
any but open-ended contracts. The legislation further constrained contracts by restricting part-time
work and nonstandard work schedules, prohibiting hiring by the hour or on a trial basis. In addition,
the working of labor courts did not favor the swift and predictable resolution of disputes, while
setting high severance pay requirements, particularly for short-term workers (Arias et al., 2010). As a
result, the high costs and constraints on hiring and firing reduced the total number of jobs in the
formal sector, affected the composition of the labor force (youth and female unemployment being
higher), and slowed productivity growth (firms adopt less technology or adopt it more slowly,
cannot adapt to new environments, and invest less in training— especially small firms).30
Overall,
these distortions led to an inefficient allocation of labor, and the prevalence of low-productivity jobs
in the large informal sector of the economy.31
81. In late 2012, Congress approved a labor reform bill.32
The new legislation introduces new
hiring modalities, streamlines dispute resolution, promotes incentives for productivity, regulates
outsourcing practices and improves labor conditions. Specifically:
To lower the costs of hiring workers and boost job creation in the formal sector, the law
introduces new contractual modalities and flexible labor contracts. These include trial and initial
training contracts, as well as temporary employment contracts for specific projects or seasonal
activities (all these categories will accrue wages, social security and other benefits). The law also
29
Prepared by Herman Kamil (WHD).
30 World Bank (2012).
31 About half of the Mexican labor force is employed in the unregulated informal sector, as workers or owners of
predominantly small firms. As informal firms tend to stay small to avoid being noticed, their productivity is low
because they do not reap the benefits of scale, they have limited or no access to credit, they are less likely to train
their employees and to adopt new technologies, and they have limited access to government services (Loser,
Fajgenbaum and Kohli, 2012).
32 A political alliance between the major parties (the Pacto de Mexico) underpins an ambitious growth and
productivity-enhancing agenda. These include reforms in labor markets (approved), education (approved),
telecommunications (approved), and financial sector, public finances and energy reforms, to be considered later in
2013.

JOBS AND GROWTH: SUPPLEMENT ON COUNTRY CASE STUDIES
INTERNATIONAL MONETARY FUND 37
allows for hourly pay contracts (provided that the pay is not below the equivalent of the
minimum wage) and establishes a new regulatory framework for outsourcing practices;
To provide judicial certainty and reduce separation costs, the law streamlines the settlement of
labor lawsuits and caps compensation for unjustified dismissals to one year of salary. These
provisions would simplify the current dispute resolution process, which makes the process of
layoff much more lengthy, costly, and uncertain (and can hold up severance pay for several
years);33
To improve labor organization within firms, productivity and labor skills will take precedence
over seniority as the main criteria for promotion and filling vacancies, increasing incentives to
invest in human capital.34
The law recognizes training as the most important factor for increasing
productivity and establishes a National Committee for Productivity, aimed at fostering labor
quality and certification of labor skills.
82. The new law enhances micro flexibility, increasing the ability of the economy to allow
for the reallocation of workers to jobs needed to sustain productivity growth. Contracting
modalities that allow for probationary periods and training/skill development allow employees to
gain necessary knowledge and employers to determine whether the workers can perform
satisfactorily. This in turn increases labor mobility and workers’ incentives to look for more
productive jobs or train and acquire new skills in the formal sector. On the other hand, fewer
frictions and greater certainty with regard to hiring and firing practices allows industries with cyclical
demand to function more efficiently, enhancing the economy’s ability to adjust to macroeconomic
shocks. Overall, these effects would make the economy more efficient in the allocation of resources,
helping increase total factor productivity and potential growth.35
83. The new legislation expands worker’s rights and social protection guarantees. The law
adopts the concept of “decent work”, established by the International Labor Organization, which
underscores the respect for the dignity of workers, and broadens the non-discrimination clause to
include ethnic origin, nationality, disability, age, religion, immigration status, health status, sexual
preference and marital status. The law also gives greater protection to vulnerable groups. For
instance, it establishes that employers must provide adequate facilities for people with disabilities
and formally bans child labor under 14 years of age.
33
If an employee challenged a dismissal, resolution of that dispute could take years. Meanwhile, the employer would
be liable for continuously accumulating back pay and other fines until the case was resolved, even if the employee
found a new job. These open-ended liabilities encouraged companies to operate in the informal economy, where
workers could be hired and fired easily and were not entitled to benefits.
34 Previously, seniority, not merit, was a major factor in promotions. Under the reform, employers will be able to use
merit-based systems and offer productivity and performance bonuses. In promotions, companies may now consider
a worker’s skill and productivity before seniority.
35 More flexible contracts could also motivate people previously not willing to work to find employment, and thus
join the labor force.
JOBS AND GROWTH: SUPPLEMENT ON COUNTRY CASE STUDIES
38 INTERNATIONAL MONETARY FUND
84. The labor reform aims for a more inclusive labor market, increasing youth and female
labor force participation and gender equality in the workplace. The introduction of short-term
and hourly contracts could have a positive impact on the quality of job creation— making it easier
for young people (i.e., students) and women to find part-time jobs. The law also strengthens the
protection of working women: it bans mandatory pregnancy tests and marital status questions that
might discriminate against women in the hiring process, and explicitly forbids an employer from
asking a woman to resign because she becomes pregnant. In addition, women will now have more
flexibility in using their legally mandated six weeks of required annual leave before and after giving
birth. Lastly, it imposes more severe penalties for bullying and sexual harassment.
85. While it is premature to arrive at a firm estimate of the reform’s impact on growth,
the central bank estimated that the labor reform could add about 0.2 percent per year to
potential growth. Using a production function approach, Alcaraz et al (2013) estimated the impact
of the labor reform mainly through its effects on formal job creation, the shift of employment from
the informal to the formal sector, and an increase in labor productivity in the formal sector.
According to the authors, the introduction of more flexible contracts is expected to lower youth
unemployment and lead to an increase in formal employment, while the availability of hourly
employment and wages will provide incentives for part-time salaried workers (typically in the
informal sector) to shift to formal jobs. Also, the introduction of a cap on back wages would reduce
costs associated with employment termination, implying a reduction of approximately 20 percent in
hiring barriers in the formal sector. At the same time, training and trial contracts and the precedence
of productivity over seniority are expected to increase formal workers’ productivity.
86. While the Fund did not have a direct role in the 2012 labor market reforms, it had
previously suggested that the authorities consider changes to labor market regulations. IMF
(2010), for example, states that “…labor market reforms being discussed go in the right direction, but
more action will be needed to increase flexibility”. IMF (2011) also notes that an expedition of
reforms to enhance labor market efficiency would help create a more dynamic labor market,
including among the young.
87. An education reform program of Mexico’s public school system was signed into law in
2013, which could enhance inclusive growth. While enrollment has increased over the years, the
quality of education remains below that of peers. Mexico ranks last in the Organization for Economic
Cooperation and Development’s Program for International Student Assessment. A major cause of
poor performance is that Mexico’s teaching profession is weak and poorly managed (Hanson, 2012).
One of the key changes in the education reform is to create a professional system for evaluating,
hiring, assigning and promoting teachers, while reducing labor unions’ interference on access to
teaching positions. Enhancing the quality of education would, among other things, reduce the skills
gap and help integrate more of the labor force into the formal sector.
JOBS AND GROWTH: SUPPLEMENT ON COUNTRY CASE STUDIES
INTERNATIONAL MONETARY FUND 39
References
Alcaraz, C. E., Covarrubias, E., Salcedo, A., and A. Chiquiar, 2013, “Estimación del efecto de la Reforma
Laboral sobre el crecimiento del PIB potencial y el empleo formal” in Informe sobre la
Inflación, Banco de México.
Arias, J., Azuara, O., Bernal, P., Heckman, J. and C. Villareal, 2010, “Policies to promote growth and
economic efficiency in Mexico”. IZA Discussion Paper No. 4740, Institute for the Study of
Labor.
Chiquiar, D. and M. Ramos-Francia, 2009, “Competitiveness and Growth of the Mexican Economy.
Working Paper 2009-11, Banco de Mexico.
Hanson, G., 2012, “Understanding Mexico’s Economic Underperformance”. Woodrow Wilson
International Center for Scholars.
International Monetary Fund, 2010, Mexico: Article IV Consultation. IMF Country Report No. 10/71.
Washington D.C.: International Monetary Fund.
International Monetary Fund, 2011, Mexico: Article IV Consultation. IMF Country Report No. 11/250.
Washington D.C.: International Monetary Fund.
Loser, C., Fajgenbaum, J. and Kohli, H. 2012, “A New Vision for Mexico 2042: Achieving Prosperity for
All”. Centennial Group International.
World Bank, 2012, “Labor Markets for Inclusive Growth”. Mexico Policy Note 4.

JOBS AND GROWTH: SUPPLEMENT ON COUNTRY CASE STUDIES
40 INTERNATIONAL MONETARY FUND
XII. NAMIBIA: PROMOTING INCLUSIVE GROWTH AND
EMPLOYMENT36
Despite the initial success after Independence in reducing inequality, Namibia remains among the
countries with the highest levels of income inequality in the world. While growth over the last two
decades has been inclusive, it has become less so over time. In order to increase the inclusiveness of
growth, it is recommended that a thorough review of the targeting of public transfers and social
programs is conducted to assess the extent to which they are reaching their intended beneficiaries.
Given the importance of labor income as the main source of income for the great majority of
Namibians, the issue of inclusive growth cannot be analyzed independently of the labor market, where
high unemployment continues the be a major challenge.
88. Since Independence Namibia
has managed to significantly reduce
poverty and income inequality.
Nevertheless, despite the progress
achieved, inequality in Namibia remains
among the highest in the world, and the
rate at which inequality has declined has
slowed down: whereas the Gini
coefficient declined from 0.70 in
1993/94 to 0.60 in 2003/04, it declined
only marginally since 2003/04, to 0.59 in
2009/10.
89. Given that labor income is the
main source of household income,
the issue of income inequality is
related to the other main challenge in
Namibia, namely, the high and
persistent unemployment rate.
According to the latest National Income
and Expenditure Survey (NIES) corresponding to the years 2009/10, labor income constituted on
average 72.3 percent of total income in Namibia, with 49.2 percent corresponding to wages and
salaries and 23.1 percent to income from subsistence farming. According to the same survey, the
unemployment rate remains high at 34 percent.
36
This case study is a summary of “Promoting Inclusive Growth and Employment in Namibia,” prepared by Rodrigo
Garcia-Verdu (AFR), Antonio David (ICD) and Floris Fernanzo Fleermuys (AFR), which appeared as Appendix V in the
2012 Staff Report of the Article IV Consultation for Namibia.
Namibia: Income Inequality1
Source: World Development Indicators 2013, World Bank, and Namibia’s National
Statistical Agency. 1 The countries included in the figure are some of the ones with the highest levels of
income inequality according to the World Bank estimates included in the World
Development Indicators 2013. There are no regional averages available for the
estimates of the Gini coefficient as the income and expenditure surveys on which
they are based are typically not collected frequently enough.
0.501
0.505
0.515
0.521
0.525
0.547
0.559
0.563
0.575
0.597
0.610
0.631
0 0 0 0 0 1 1 1
Zimbabwe (1995)
Cape Verde (2002)
Swaziland (2010)
Chile (2009)
Lesotho (2003)
Brazil (2009)
Colombia (2010)
Bolivia (2008)
Zambia (2010)
Namibia (2009/10)
Botswana (1993/94)
South Africa (2009)
Gini coefficient, latest estimate available
(year in parenthesis)
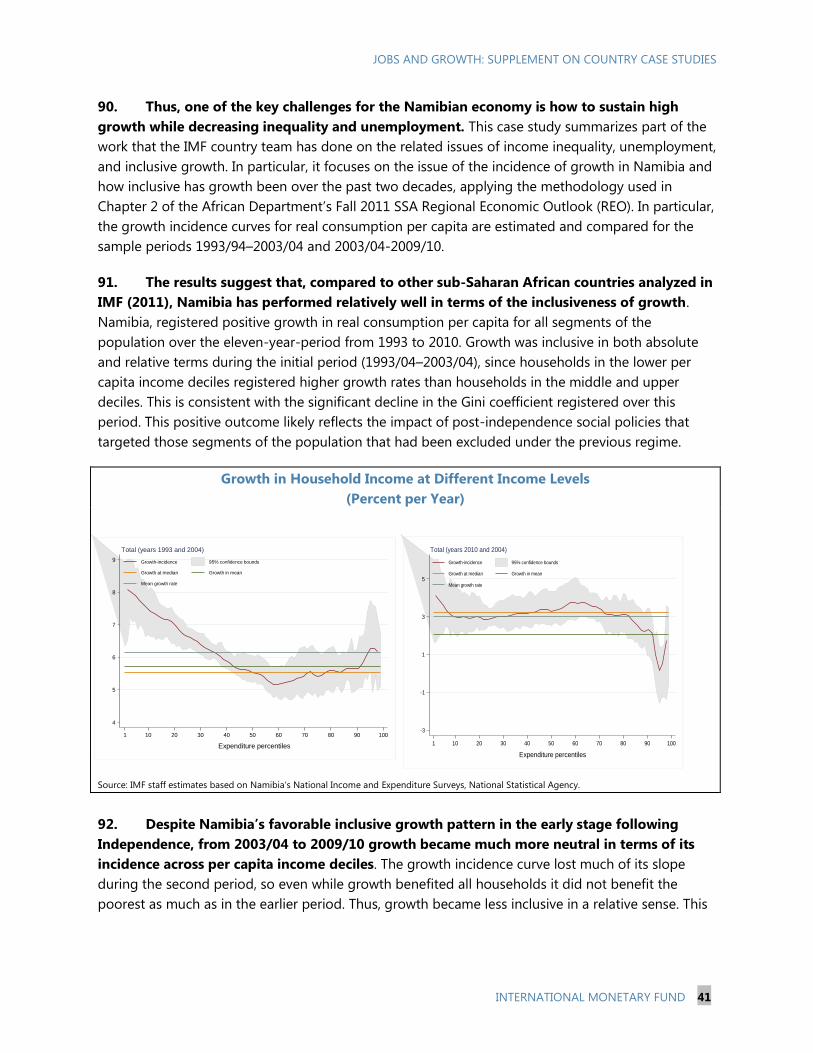
JOBS AND GROWTH: SUPPLEMENT ON COUNTRY CASE STUDIES
INTERNATIONAL MONETARY FUND 41
90. Thus, one of the key challenges for the Namibian economy is how to sustain high
growth while decreasing inequality and unemployment. This case study summarizes part of the
work that the IMF country team has done on the related issues of income inequality, unemployment,
and inclusive growth. In particular, it focuses on the issue of the incidence of growth in Namibia and
how inclusive has growth been over the past two decades, applying the methodology used in
Chapter 2 of the African Department’s Fall 2011 SSA Regional Economic Outlook (REO). In particular,
the growth incidence curves for real consumption per capita are estimated and compared for the
sample periods 1993/94–2003/04 and 2003/04-2009/10.
91. The results suggest that, compared to other sub-Saharan African countries analyzed in
IMF (2011), Namibia has performed relatively well in terms of the inclusiveness of growth.
Namibia, registered positive growth in real consumption per capita for all segments of the
population over the eleven-year-period from 1993 to 2010. Growth was inclusive in both absolute
and relative terms during the initial period (1993/04–2003/04), since households in the lower per
capita income deciles registered higher growth rates than households in the middle and upper
deciles. This is consistent with the significant decline in the Gini coefficient registered over this
period. This positive outcome likely reflects the impact of post-independence social policies that
targeted those segments of the population that had been excluded under the previous regime.
Growth in Household Income at Different Income Levels
(Percent per Year)
Source: IMF staff estimates based on Namibia‘s National Income and Expenditure Surveys, National Statistical Agency.
92. Despite Namibia’s favorable inclusive growth pattern in the early stage following
Independence, from 2003/04 to 2009/10 growth became much more neutral in terms of its
incidence across per capita income deciles. The growth incidence curve lost much of its slope
during the second period, so even while growth benefited all households it did not benefit the
poorest as much as in the earlier period. Thus, growth became less inclusive in a relative sense. This
4
5
6
7
8
9
Ann
ua
l gro
wth
rate
%
1 10 20 30 40 50 60 70 80 90 100
Expenditure percentiles
Growth-incidence 95% confidence bounds
Growth at median Growth in mean
Mean growth rate
Total (years 1993 and 2004)
-3
-1
1
3
5
An
nu
al g
row
th r
ate
%
1 10 20 30 40 50 60 70 80 90 100
Expenditure percentiles
Growth-incidence 95% confidence bounds
Growth at median Growth in mean
Mean growth rate
Total (years 2010 and 2004)

JOBS AND GROWTH: SUPPLEMENT ON COUNTRY CASE STUDIES
42 INTERNATIONAL MONETARY FUND
is consistent with the fact that the Gini coefficient declined only marginally in Namibia.37
The
deceleration in the mean and median growth rates of real consumption per capita is noticeable in
the graph, since in the second period the whole growth incidence curve shifted downwards.
93. This change in the incidence of growth has possibly been the result of weaker
targeting or leakage of social program, and of the expansion of expenditure not targeted to
the poor, which have resulted in government expenditure become less progressive. While
testing this hypothesis requires using disaggregated data on income by source (labor earnings,
rental income, pensions, social transfers, etc.), the fact that further reductions in inequality are
proving more difficult should be a source of concern as the level of inequality in Namibia is still
among the highest in the world.
94. In order for Namibia to return to the inclusive growth pattern registered over the first
decade after Independence, a rationalization and reallocation of government expenditures
(including tax expenditures) should be undertaken to increase their progressiveness. Namibia‘s
public expenditures as a share of GDP are among the highest among upper-middle income
countries. It is possible to reallocate public expenditures in a way that keeps total spending constant
while increasing its progressiveness: based on a thorough analysis of the incidence of public
expenditures, social programs and public transfers that do not reach or benefit their intended
beneficiaries should be corrected or eliminated. Potential pockets of inefficiencies should also be
identified and eliminated.
95. The second crucial element for increasing the inclusiveness of growth in Namibia is
improving the performance of the labor market. As mentioned before, labor is the main source
of income in Namibia, and unemployment has remained very high. On the determinants of
unemployment in Namibia, the results of the recent work by Leigh and Flores (2012), shows that the
high level of unemployment in the SACU region is attributable to structural rather than cyclical
factors. In particular, their work shows that structural factors, including rapid wage growth above
productivity increases, the existing skills mismatch, and the wage policies in the public sector can
account for most of the high level of unemployment in the region. Namibia‘s Targeted Intervention
Initiative for Employment and Economic Growth (TIPEEG) needs to be complemented with policies
to address these structural factors.
96. The policy dialogue with the Namibian authorities has focused on policies to reduce
unemployment. The IMF country team’s analysis of the labor market in Namibia suggests that
TIPEEG, a temporary workfare program, might have medium-term benefits by allowing youths to
enter the labor force and gain valuable job experience. Nevertheless, the team advised that the
program would need to have a skill development component to maximize its job creation potential
on a sustainable basis.
37
It should be noticed, though, that the Gini coefficient corresponds to income, while the growth incidence curve
corresponds to consumption per capita.

JOBS AND GROWTH: SUPPLEMENT ON COUNTRY CASE STUDIES
INTERNATIONAL MONETARY FUND 43
97. A related area of the policy dialogue between the IMF team and the government of
Namibia has been the government’s wage and employment policies and their broader impact
on the rest of the economy. The public sector employs a significant share of the employed
population (16 percent). Furthermore, government employees (including those working for state-
owned enterprises) constitute about one out of every four salaried employees in Namibia. As a
result of its size as an employer, the government’s wage policies are likely to affect the functioning
of the whole labor market. The IMF’s country team advice to the government has been to take into
account potential impacts of its wage and employment decisions on private sector job creation, and
that public wage increases should be in line with sustainable increases in labor productivity.
References
International Monetary Fund, 2011, “How Inclusive has Africa‘s Recent High-Growth Episode
Been?,” Regional Economic Outlook: Sub-Saharan Africa. Sustaining the Expansion, October
(Washington).
International Monetary Fund, 2013, Namibia: Staff Report for the 2012 Article IV Consultation, IMF
Country Report No. 13/43, Washington D.C.: International Monetary Fund, January 23, 2013.
Leigh, L., and I. Flores, 2013, “Closing the Jobs Gap in the Southern Africa Customs Union (SACU),” in
Johannes Mongardini (ed.) Building a Common Future in Southern Africa: Challenges and
Opportunities, Washington D.C.: International Monetary Fund.
JOBS AND GROWTH: SUPPLEMENT ON COUNTRY CASE STUDIES
44 INTERNATIONAL MONETARY FUND
XIII. SPAIN: LABOR MARKET REFORMS38
Background
98. After a brief stabilization in 2011, the Spanish economy fell back into recession in 2012
as the euro area debt crisis deepened in the south of Europe. Pulled down by falling house
prices, fiscal consolidation, banking sector stress and falling real household income, GDP contracted
1.4 percent in 2012, ending the year nearly 5 percentage points below peak.
99. Unemployment rose to 25 percent in 2012, with youth unemployment reaching
50 percent. The causes behind the increase in unemployment were: (i) the collapse of the
construction sector; (ii) a lack of competitiveness, as wages in Spain had outpaced the rest of the
euro area by around 15 percent since 2000; (iii) duality in the labor market, with very high external
flexibility provided by temporary contracts; (iv) restrictions to firms’ internal flexibility, fostered by an
intermediate level of collective bargaining and the insider/outsider problem (since workers under
permanent contracts were highly protected).
100. The large increase in unemployment drove a surge in income inequality. Spain was not
able to afford a safety net wide enough to protect 6 million unemployed. By the end of 2012, only a
quarter of the unemployed benefitted from regular unemployment insurance, whilst another quarter
received more limited unemployment assistance. The remaining half of the unemployed population
was not eligible for any unemployment benefits. As a result, the Gini coefficient increased by 6
percentage points between 2007 and 2010, one of the largest deteriorations in the OECD.39
UNICEF
(2012) estimated that 26 percent of children live in poverty in Spain, an increase by 10 percent from
pre-crisis levels.40
Policy measures
101. Spain’s ability to restore growth using macroeconomic management was constrained
by its membership in the euro area and thus the absence of the monetary and exchange rate
policy tool. These constraints were worsened by the increase in financial fragmentation between
periphery and core banking systems. Nevertheless, several steps were taken to limit the drag of the
needed fiscal and external adjustments. Spain, in agreement with its European partners, slowed the
pace of fiscal consolidation. The banking sector was restructured and recapitalized under an ESM-
financed program. Spanish yields also benefitted from several ECB announcements intended to
protect the euro.
38
Prepared by Raphael Espinoza (RES)
39 OECD Income Distribution Database (www.oecd.org/social/income-distribution-database.htm)
40 UNICEF (2012), La Infancia en España (2012-2013): El impacto de la crisis en los niños.

JOBS AND GROWTH: SUPPLEMENT ON COUNTRY CASE STUDIES
INTERNATIONAL MONETARY FUND 45
102. In 2012, the government embarked on an ambitious structural reform agenda. A major
labor market reform was enacted and retail hours were liberalized. Some measures to protect
vulnerable households at risk of eviction were passed as well. Further reforms, yet to be
implemented, have been announced to reduce the regulatory burden of trading within Spain and to
liberalize professional services.
Labor market reform
103. The 2012 labor market reform was far-reaching, targeting the main weaknesses in the
labor market:
(i) Duality. The difference in employment protection between workers under different
types of contract was reduced. The renewal of temporary contracts was limited to 2
years maximum, and a new, more attractive, permanent contract was created for
small firms.
(ii) Internal flexibility. Priority was given to firm-level agreements over provincial or
industry-wide collective agreements. The period during which expired collective
agreements are automatically extended was limited to a maximum of one year. In
addition, the use of opt-out clauses from collective agreements was clarified. The
use of temporary dismissals and work hours reduction was facilitated.
(iii) Active Labor Market Policies. Hiring subsidies were overhauled, with a reduction by
half of the number of subsidized contracts. The replacement rate for unemployment
benefits after 6 months was reduced by 10 percent.
Complementarities and trade-offs considered
104. The labor market reform was necessary to create a basis for growth in the medium
term through a large internal devaluation. But there were possible short term tradeoffs on
growth, employment and income distribution in the event that the necessary wage flexibility would
not be sufficiently forthcoming. In particular, some components of the reform (e.g., the reduction of
dismissal costs) had the potential to accelerate job destruction during the crisis. The restriction to
the use of temporary contracts may also slow down hiring when the economy recovers. Further, the
reduction in unemployment benefits could exacerbate inequality.
105. To mitigate the adverse effects on income distribution, the government implemented
a modest extension of the unemployment assistance program. Room for addressing adverse
effects on growth was limited by tight constraints on fiscal policy and the absence of the monetary
and exchange rate policy tool.
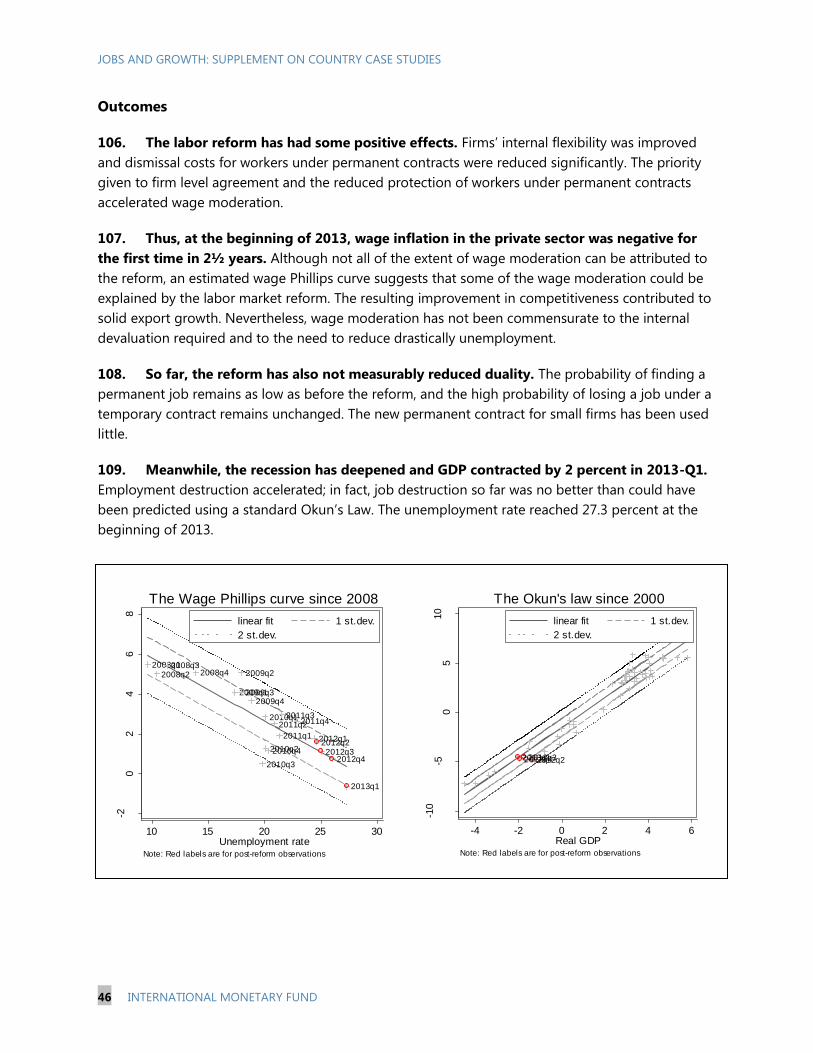
JOBS AND GROWTH: SUPPLEMENT ON COUNTRY CASE STUDIES
46 INTERNATIONAL MONETARY FUND
Outcomes
106. The labor reform has had some positive effects. Firms’ internal flexibility was improved
and dismissal costs for workers under permanent contracts were reduced significantly. The priority
given to firm level agreement and the reduced protection of workers under permanent contracts
accelerated wage moderation.
107. Thus, at the beginning of 2013, wage inflation in the private sector was negative for
the first time in 2½ years. Although not all of the extent of wage moderation can be attributed to
the reform, an estimated wage Phillips curve suggests that some of the wage moderation could be
explained by the labor market reform. The resulting improvement in competitiveness contributed to
solid export growth. Nevertheless, wage moderation has not been commensurate to the internal
devaluation required and to the need to reduce drastically unemployment.
108. So far, the reform has also not measurably reduced duality. The probability of finding a
permanent job remains as low as before the reform, and the high probability of losing a job under a
temporary contract remains unchanged. The new permanent contract for small firms has been used
little.
109. Meanwhile, the recession has deepened and GDP contracted by 2 percent in 2013-Q1.
Employment destruction accelerated; in fact, job destruction so far was no better than could have
been predicted using a standard Okun’s Law. The unemployment rate reached 27.3 percent at the
beginning of 2013.
2008q1
2008q22008q3
2008q4
2009q1
2009q2
2009q32009q4
2010q1
2010q2
2010q3
2010q4
2011q1
2011q22011q3
2011q4
2012q12012q22012q3
2012q4
2013q1
-20
24
68
Wag
e i
nfl
atio
n i
n t
he b
usin
ess
secto
r
10 15 20 25 30Unemployment rate
linear fit 1 st.dev.
2 st.dev.
Note: Red labels are for post-reform observations
The Wage Phillips curve since 2008
2012q22012q32012q42013q1
-10
-50
510
Em
plo
yment
-4 -2 0 2 4 6Real GDP
linear fit 1 st.dev.
2 st.dev.
Note: Red labels are for post-reform observations
The Okun's law since 2000
JOBS AND GROWTH: SUPPLEMENT ON COUNTRY CASE STUDIES
INTERNATIONAL MONETARY FUND 47
Fund involvement and recommendations
110. The Fund, along with the ECB and the European Commission, emphasized the need to
set up an independent evaluation of the reform. The government decided to involve an
international organization (such as the OECD) in its own assessment of the reform. Discussions with
labor lawyers, Supreme Court judges, and think tanks also allowed the Fund to provide suggestions
on how to clarify some elements of the reform and reduce legal uncertainty.
111. The Fund also suggested additional measures to deepen the reform and minimize its
adverse effects. Fund advice was geared to the need to proceed with internal devaluation in the
hopes of boosting employment immediately. In particular, the Fund recommended facilitating opt-
outs from collective agreements and reducing labor costs (including taxes) on low-skilled workers.
Aware of the potential adverse short-term effects of labor market reforms on growth, employment,
and income distribution, the Fund argued that the fastest way to reap the benefits of the labor
reform was to reach a tri-partite agreement based on commitments by employers to create jobs, in
exchange for labor unions accepting further wage moderation.
Related Documents