Office of Water (4303T) EPA-821-R-13-006 Washington, DC 20460 March 2013 Guidance for Limited Use Alternate Test Procedure Applications for ASTM Method D7575 for Oil and Grease As explained in the Federal Register notice dated March 6, 2013, EPA determined that ASTM D7575 is a good stand-alone method for the measurement of oil and grease as defined by the method. The method was single- and multi-lab tested following ASTM Standard Practice D2777 (Standard Practice for the Determination of Precision and Bias of Applicable Test methods of Committee D19 on Water) and produced recoveries and precision as good as or better than EPA Method 1664A for those matrices tested and in the range of ASTM D7575 applicability (5-200 mg/L). EPA’s primary concern is that the two methods may produce different results. Therefore, for limited use ATP applications that request consideration of ASTM D7575 as an analytic method in place of those promulgated in 40 CFR Part 136 (e.g., EPA Method 1664A/B), the applicant needs to submit an application form (see reference below), demonstrate that the lab can successfully perform the method, and document comparability by performing side-by-side (parallel) testing of the method’s performance in a clean matrix and an actual wastewater matrix. The QC elements and the QC acceptance criteria must be specified. EPA suggests using the specific side by side comparison procedures recommended in the guidance document that was originally developed when Method 1664A was promulgated as a comparison to EPA Method 413.1 (see Analytical Method Guidance for EPA Method 1664A Implementation and Use [40 CFR Part 136], EPA/821-R-00-003, February 2000). To perform and document a side-by-side comparison of EPA Method 1664A and ASTM D7575, we suggest, at a minimum, analysis of three replicates of each sample by each method on any seven days over a minimum 30-day period, for a total of 42 analyses (21 by ASTM D7575 and 21 by EPA Method 1664A). For this side-by side comparison, the analyst should use the separatory funnel liquid/liquid extraction (LLE) procedure, not the optional SPE procedure, in Method 1664A because of the possible confounding of results that could occur when two variables (SPE and the solvent) are changed simultaneously. If all six results for a given day associated with any sample are less than the minimum level (< ML), these results should not be used in the comparison because it is necessary to have actual measured values to test equivalency. In the event that a test result less than the ML is obtained, samples should be collected on an additional day (i.e., the number of tests should be increased to provide a minimum of seven paired triplicate results for the comparison). We suggest testing for statistical significance using procedures for development of the root- mean-square deviation (RMSD) as detailed below using results obtained with the EPA Method 1664A as the reference method. If the RMSD is within the acceptance limit, the results obtained using the different methods are considered comparable. If the RMSD is not within the acceptance limit, the difference is significant and the results are not considered comparable. Example Calculations for Side-by-Side Comparisons To allow you to make the calculations necessary for comparison easily, we have produced a Microsoft Excel ® spreadsheet that does all calculations automatically after you have entered the

Welcome message from author
This document is posted to help you gain knowledge. Please leave a comment to let me know what you think about it! Share it to your friends and learn new things together.
Transcript

Office of Water (4303T) EPA-821-R-13-006 Washington, DC 20460 March 2013
Guidance for Limited Use Alternate Test Procedure Applications for
ASTM Method D7575 for Oil and Grease
As explained in the Federal Register notice dated March 6, 2013, EPA determined that ASTM D7575 is a good stand-alone method for the measurement of oil and grease as defined by the method. The method was single- and multi-lab tested following ASTM Standard Practice D2777 (Standard Practice for the Determination of Precision and Bias of Applicable Test methods of Committee D19 on Water) and produced recoveries and precision as good as or better than EPA Method 1664A for those matrices tested and in the range of ASTM D7575 applicability (5-200 mg/L). EPA’s primary concern is that the two methods may produce different results. Therefore, for limited use ATP applications that request consideration of ASTM D7575 as an analytic method in place of those promulgated in 40 CFR Part 136 (e.g., EPA Method 1664A/B), the applicant needs to submit an application form (see reference below), demonstrate that the lab can successfully perform the method, and document comparability by performing side-by-side (parallel) testing of the method’s performance in a clean matrix and an actual wastewater matrix. The QC elements and the QC acceptance criteria must be specified. EPA suggests using the specific side by side comparison procedures recommended in the guidance document that was originally developed when Method 1664A was promulgated as a comparison to EPA Method 413.1 (see Analytical Method Guidance for EPA Method 1664A Implementation and Use [40 CFR Part 136], EPA/821-R-00-003, February 2000). To perform and document a side-by-side comparison of EPA Method 1664A and ASTM D7575, we suggest, at a minimum, analysis of three replicates of each sample by each method on any seven days over a minimum 30-day period, for a total of 42 analyses (21 by ASTM D7575 and 21 by EPA Method 1664A). For this side-by side comparison, the analyst should use the separatory funnel liquid/liquid extraction (LLE) procedure, not the optional SPE procedure, in Method 1664A because of the possible confounding of results that could occur when two variables (SPE and the solvent) are changed simultaneously. If all six results for a given day associated with any sample are less than the minimum level (< ML), these results should not be used in the comparison because it is necessary to have actual measured values to test equivalency. In the event that a test result less than the ML is obtained, samples should be collected on an additional day (i.e., the number of tests should be increased to provide a minimum of seven paired triplicate results for the comparison). We suggest testing for statistical significance using procedures for development of the root-mean-square deviation (RMSD) as detailed below using results obtained with the EPA Method 1664A as the reference method. If the RMSD is within the acceptance limit, the results obtained using the different methods are considered comparable. If the RMSD is not within the acceptance limit, the difference is significant and the results are not considered comparable. Example Calculations for Side-by-Side Comparisons To allow you to make the calculations necessary for comparison easily, we have produced a Microsoft Excel® spreadsheet that does all calculations automatically after you have entered the

2
necessary results. This spreadsheet is available on EPA’s website at http://water.epa.gov/scitech/methods/cwa/update_index.cfm and is named “Oil and Grease ATP Comparison Worksheet.” You must have Microsoft Excel 97® or a later version to run the spreadsheet. Example 1 Steps 1-3. Eight sample replicates were collected on a total of seven days spaced over a minimum of a one month period. For the sample replicates collected on each day, three were analyzed by EPA Method 1664A/B, three by ATP1 (for a total of 6 samples per day) and two were used for QC. All QC tests were performed and the results of the QC tests (including the matrix spike test) met the QC acceptance criteria in Method 1664A/B. Results of the triplicate analyses by each method on each day are listed in Table 1. The yellow shading indicates the cells where the applicant must enter data. Step 4. The (natural log) log-transformed results are listed in Table 2.

3
Table 1. Example results for side-by-side study* (units: mg/L)
Reference Method = 1664A/B Alternate Test Procedure = ATP1
Matrix = Refinery
Results Units: mg/L
EPA Method 1664A/B Alternate Test Procedure
Collection Date
Analysis Date
Time Held (Days)
Sample Rep #1 Rep #2 Rep #3 Rep #1 Rep #2 Rep #3
1/2/2013 1/4/2013 2 1 13 18 12 13 18 12
1/8/2013 1/11/2013 3 2 10 12 14 10 12 14
1/17/2013 1/24/2013 7 3 22 26 22 22 26 22
1/25/2013 2/1/2013 7 4 12 17 15 12 17 15
1/28/2013 2/4/2013 7 5 20 17 12 20 17 12
2/4/2013 2/13/2013 9 6 37 35 31 37 35 31
2/7/2013 2/15/2013 8 7 11 14 13 11 14 13 * Data in this data set are estimations of data that could be produced in a side-by-side study and are not “real-world” data.
Table 2. Log-transformed results
Results Units: mg/L
EPA Method 1664A/B Alternate Test Procedure
Collection Date
Analysis Date
Time Held (Days) Sample Rep #1 Rep #2 Rep #3 Rep #1 Rep #2 Rep #3
1/2/2013 1/4/2013 2 1 2.56 2.89 2.48 2.56 2.89 2.48
1/8/2013 1/11/2013 3 2 2.30 2.48 2.64 2.30 2.48 2.64
1/17/2013 1/24/2013 7 3 3.09 3.26 3.09 3.09 3.26 3.09
1/25/2013 2/1/2013 7 4 2.48 2.83 2.71 2.48 2.83 2.71
1/28/2013 2/4/2013 7 5 3.00 2.83 2.48 3.00 2.83 2.48
2/4/2013 2/13/2013 9 6 3.61 3.56 3.43 3.61 3.56 3.43
2/7/2013 2/15/2013 8 7 2.40 2.64 2.56 2.40 2.64 2.56

4
Sample (j) EPA 1664A/B
(i=1) ATP (i=2)
1 2.65 2.65
2 2.48 2.48
3 3.15 3.15
4 2.68 2.68
5 2.77 2.77
6 3.53 3.53
7 2.53 2.53
Step 5. The 14 triplicate means of the log-transformed results are listed in Table 3.
Table 3. Triplicate means (Mij)
Step 6. The 14 triplicate standard deviations of the log-transformed results are listed in Table 4.
Table 4. Triplicate standard deviations (sij)
Sample (j) EPA 1664A/B
(i=1) ATP (i=2)
1 0.215 0.215
2 0.168 0.168
3 0.096 0.096
4 0.176 0.176
5 0.261 0.261
6 0.090 0.090
7 0.124 0.124 Step 7. The mean-square error is:
1MSE [(0.215)2 (0.168)2 (0.096)2 ... (0.090)2 (0.124)2 ] 0.029
14 Step 8. The method-specific means are:
1M M1 1
M1j [2.65 2.48 3.15 2.68 2.77 3.53 2.53] 2.83 7 ( j1,...,7) 7
Similarly, MM2 = 2.83.

5
1M S1 [2.65 2.65] 2.65
2 Similarly, MS2 = 2.48, MS3 = 3.15, MS4 = 2.68, MS5 = 2.77, MS6 = 3.53, and MS7 = 2.53.
1 1M o [2.83 3.32] [2.96 2.71 3.38 2.96 3.00 3.69 2.81] 2.83
2 7 ( j1,...,7)
Step 9. The RMSD is:
1RMSD [(2.65 2.65)2 (2.48 2.48)2 ... (2.53 2.53)2 ] 0.000
7 Step 10. The RMSDMAX is:
2 * 0.029RMSDMAX * 2.36 0.215
3 Step 11. The compared result is:
Because the RMSD is < than the RMSD MAX, the difference between the two methods is not significant.
Based on the results shown above, Method ATP1 is comparable to Method 1664A/B over the course of 9 days in a Refinery matrix.

6
Example 2
Eight sample replicates were collected on a total of seven days spaced over a minimum of a one month period. For the sample replicates collected on each day, three were analyzed by EPA Method 1664A/B, three by ATP2 and two were used for QC. Results of the triplicate analyses are listed in Table 5. Step 4. The log-transformed results are listed in Table 6.

7
Table 5. Example results for side-by-side study*
Reference Method = 1664A/B Alternate Test Procedure = ATP2
Matrix = Meat Packer
Results Units: mg/L
EPA Method 1664A/B Alternate Test Procedure Collection
Date Analysis
Date Time Held
(Days) Sample Rep #1 Rep #2 Rep #3 Rep #1 Rep #2 Rep #3
1/2/2013 1/4/2013 2 1 13 18 12 23 28 29
1/8/2013 1/11/2013 3 2 10 12 14 21 19 17
1/17/2013 1/24/2013 7 3 22 26 22 41 36 35
1/25/2013 2/1/2013 7 4 12 17 15 26 27 24
1/28/2013 2/4/2013 7 5 20 17 12 26 23 27
2/4/2013 2/13/2013 9 6 37 35 31 52 48 40
2/7/2013 2/15/2013 8 7 11 14 13 21 20 25
* Data in this data set are estimations of data that could be produced in a side-by-side study and are not “real-world” data.
Table 6. Log-transformed results
Results Units: mg/L
EPA Method 1664A/B Alternate Test Procedure Collection
Date Analysis
Date Time Held
(Days) Sample Rep #1 Rep #2 Rep #3 Rep #1 Rep #2 Rep #3
1/2/2013 1/4/2013 2 1 2.56 2.89 2.48 3.14 3.33 3.37
1/8/2013 1/11/2013 3 2 2.30 2.48 2.64 3.04 2.94 2.83
1/17/2013 1/24/2013 7 3 3.09 3.26 3.09 3.71 3.58 3.56
1/25/2013 2/1/2013 7 4 2.48 2.83 2.71 3.26 3.30 3.18
1/28/2013 2/4/2013 7 5 3.00 2.83 2.48 3.26 3.14 3.30
2/4/2013 2/13/2013 9 6 3.61 3.56 3.43 3.95 3.87 3.69
2/7/2013 2/15/2013 8 7 2.40 2.64 2.56 3.04 3.00 3.22
8
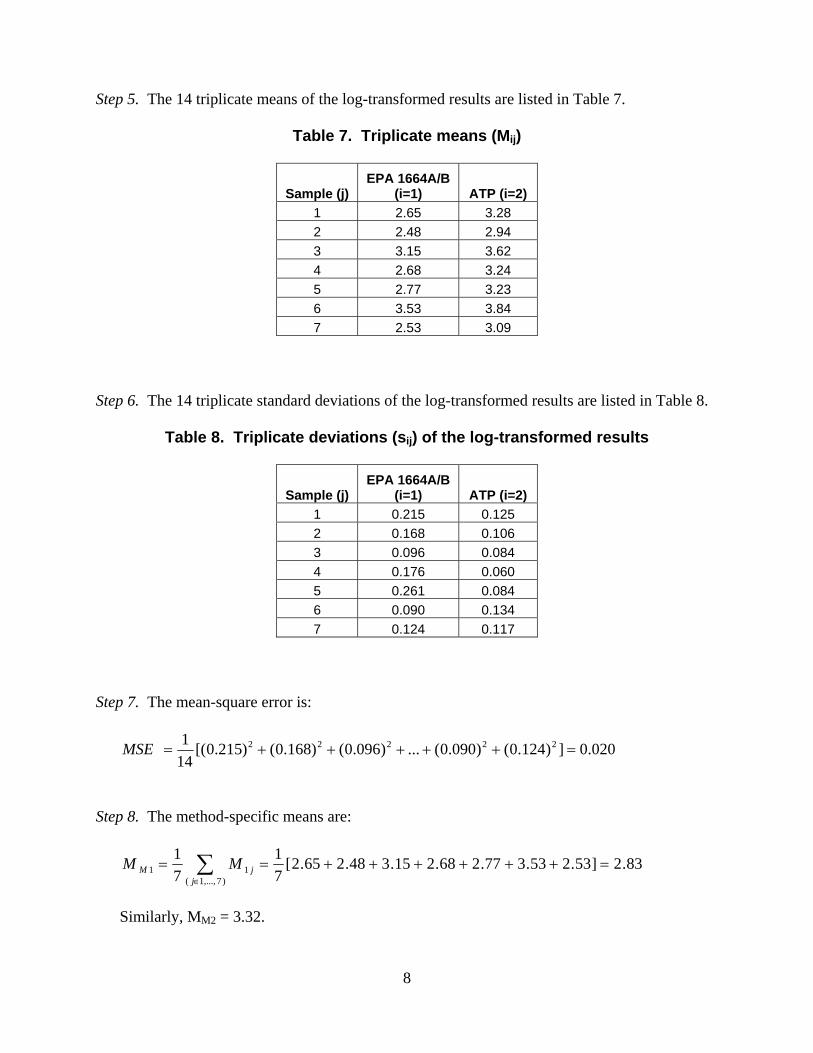
Step 5. The 14 triplicate means of the log-transformed results are listed in Table 7.
Table 7. Triplicate means (Mij)
Sample (j) EPA 1664A/B
(i=1) ATP (i=2)
1 2.65 3.28
2 2.48 2.94
3 3.15 3.62
4 2.68 3.24
5 2.77 3.23
6 3.53 3.84
7 2.53 3.09 Step 6. The 14 triplicate standard deviations of the log-transformed results are listed in Table 8.
Table 8. Triplicate deviations (sij) of the log-transformed results
Sample (j) EPA 1664A/B
(i=1) ATP (i=2)
1 0.215 0.125
2 0.168 0.106
3 0.096 0.084
4 0.176 0.060
5 0.261 0.084
6 0.090 0.134
7 0.124 0.117
Step 7. The mean-square error is:
1MSE [(0.215)2 (0.168)2 (0.096)2 ... (0.090)2 (0.124)2 ] 0.020
14 Step 8. The method-specific means are:
1M M 1 1
M 1 j [2.65 2.48 3.15 2.68 2.77 3.53 2.53] 2.83 7 ( j1,..., 7 ) 7
Similarly, MM2 = 3.32.

9
1M S1 [2.65 3.28] 2.96
2 Similarly, MS2 = 2.71, MS3 = 3.38, MS4 = 2.96, MS5 = 3.00, MS6 = 3.69, and MS7 = 2.81.
1 1M 0 [2.83 3.32] [2.96 2.71 3.38 2.96 3.00 3.69 2.81] 3.07
2 7 ( j1,...,7)
Step 9. The RMSD is:
1RMSD [(2.65 3.28)2 (2.48 2.94)2 ... (2.53 3.09)2 ] 0.503
7 Step 10. The RMSDMAX is:
2 * 0.020RMSDMAX * 2.36 0.178
3 Step 11. The compared result is:
Because the RMSD is > than the RMSD MAX, the difference between the two methods is significant.
Based on the results shown above, Method ATP2 is NOT comparable to Method 1664B over the course of 7 days in a Meat Packer matrix.

10
Appendices 1 and 2 of this guidance document provide examples of spreadsheets with results that:
1. pass RMSD comparability test for Oil and Grease methods. 2. fail the RMSD comparability test for Oil and Grease methods. This example also
indicates Pass or Fail for the IPR and MDL QC elements. Listed below are additional tools and sample forms that may be used when processing limited use applications for D7575. These documents are available on the EPA website at http://water.epa.gov/scitech/methods/cwa/update_index.cfm .
1. Oil and Grease ATP Comparison Worksheet. An interactive Excel® spreadsheet that does all calculations automatically after the necessary raw data are entered in the highlighted fields made available for use by applicants. This spreadsheet does all calculations automatically after the necessary raw data are entered in the highlighted fields. The spreadsheet also indicates Pass or Fail when data are entered for the IPR and MDL QC elements. This single version of the spreadsheet generated examples above and is password protected to prevent changes being made to the equations used to automatically calculate the results. (Mentioned above in this guidance on pp. 1-2.)
2. NPDES Chemistry Limited Use Alternate Test Procedure Application. An ATP
application form that lists the required attachments to be submitted by the applicant, with an example. (Fillable form, MS Word 2007®)
3. NPDES Chemistry Limited Use Alternate Test Procedure Method Documentation
Form. This form describes all the necessary sections of the method and/or Standard Operating Procedure. (Fillable form, MS Word 2007®)
4. Performance Comparison Form (Clean Matrix, Laboratory Pure Water). This form
describes the basic QC elements such as IPR, MDL and Proficiency Testing with the QC acceptance criteria. A Certification Statement (last page of this form) must be signed and attached with the raw data. (Fillable form, MS Word 2007®)
5. Performance Comparison Form (Effluent Matrix). This form describes side-by-side
(parallel) testing of D7575 and 1664A/B method performance in the actual wastewater matrix with QC elements and QC acceptance criteria specified. A Certification Statement (last page of this form) must be signed and attached with the raw data. (Fillable form, MS Word 2007®)

11
Appendix 1. Example of Oil and Grease ATP with Passing Results
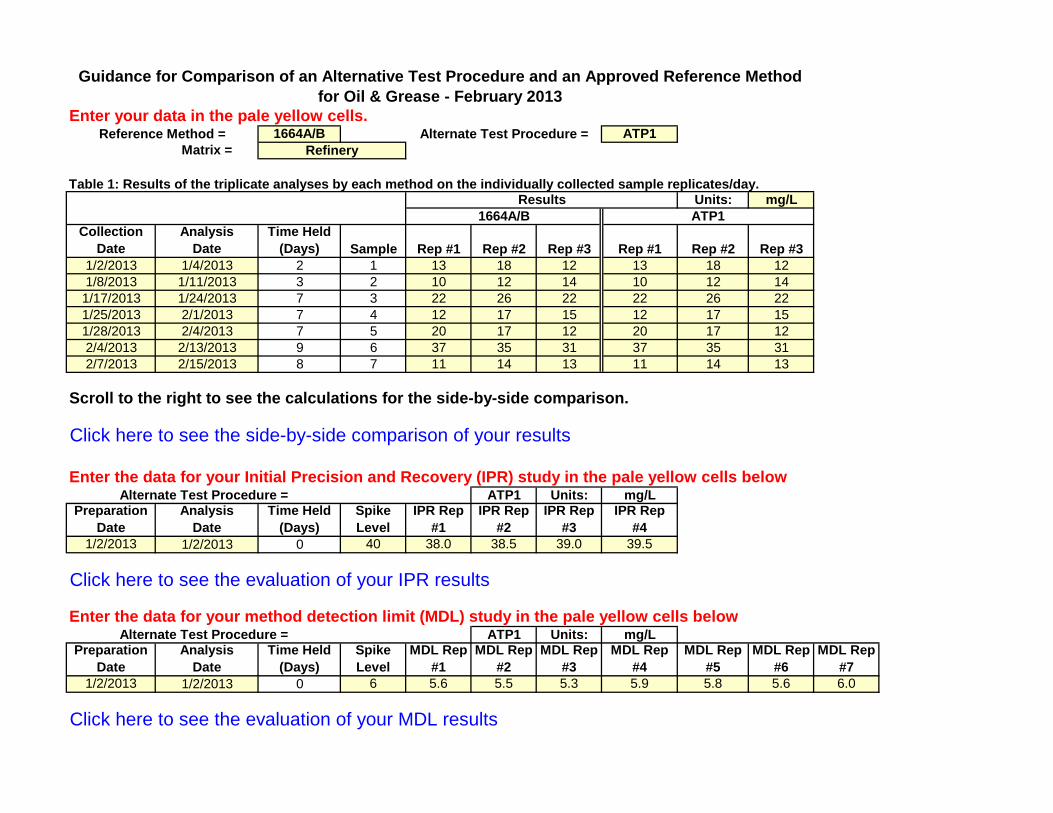
Enter your data in the pale yellow cells.1664A/B ATP1
Matrix =
Units: mg/L
Collection Date
Analysis Date
Time Held (Days) Sample Rep #1 Rep #2 Rep #3 Rep #1 Rep #2 Rep #3
1/2/2013 1/4/2013 2 1 13 18 12 13 18 121/8/2013 1/11/2013 3 2 10 12 14 10 12 141/17/2013 1/24/2013 7 3 22 26 22 22 26 221/25/2013 2/1/2013 7 4 12 17 15 12 17 151/28/2013 2/4/2013 7 5 20 17 12 20 17 122/4/2013 2/13/2013 9 6 37 35 31 37 35 312/7/2013 2/15/2013 8 7 11 14 13 11 14 13
Scroll to the right to see the calculations for the side-by-side comparison.
Enter the data for your Initial Precision and Recovery (IPR) study in the pale yellow cells belowATP1 Units: mg/L
Preparation Date
Analysis Date
Time Held (Days)
Spike Level
IPR Rep #1
IPR Rep #2
IPR Rep #3
IPR Rep #4
1/2/2013 1/2/2013 0 40 38.0 38.5 39.0 39.5
Enter the data for your method detection limit (MDL) study in the pale yellow cells belowATP1 Units: mg/L
Preparation Date
Analysis Date
Time Held (Days)
Spike Level
MDL Rep #1
MDL Rep #2
MDL Rep #3
MDL Rep #4
MDL Rep #5
MDL Rep #6
MDL Rep #7
1/2/2013 1/2/2013 0 6 5.6 5.5 5.3 5.9 5.8 5.6 6.0
Table 1: Results of the triplicate analyses by each method on the individually collected sample replicates/day.
Alternate Test Procedure =
Refinery
Click here to see the evaluation of your IPR results
Alternate Test Procedure =
Click here to see the evaluation of your MDL results
Guidance for Comparison of an Alternative Test Procedure and an Approved Reference Method for Oil & Grease - February 2013
Reference Method = Alternate Test Procedure =
1664A/B
Click here to see the side-by-side comparison of your results
ATP1Results
EStrassl
Typewritten Text
EStrassl
Typewritten Text
12
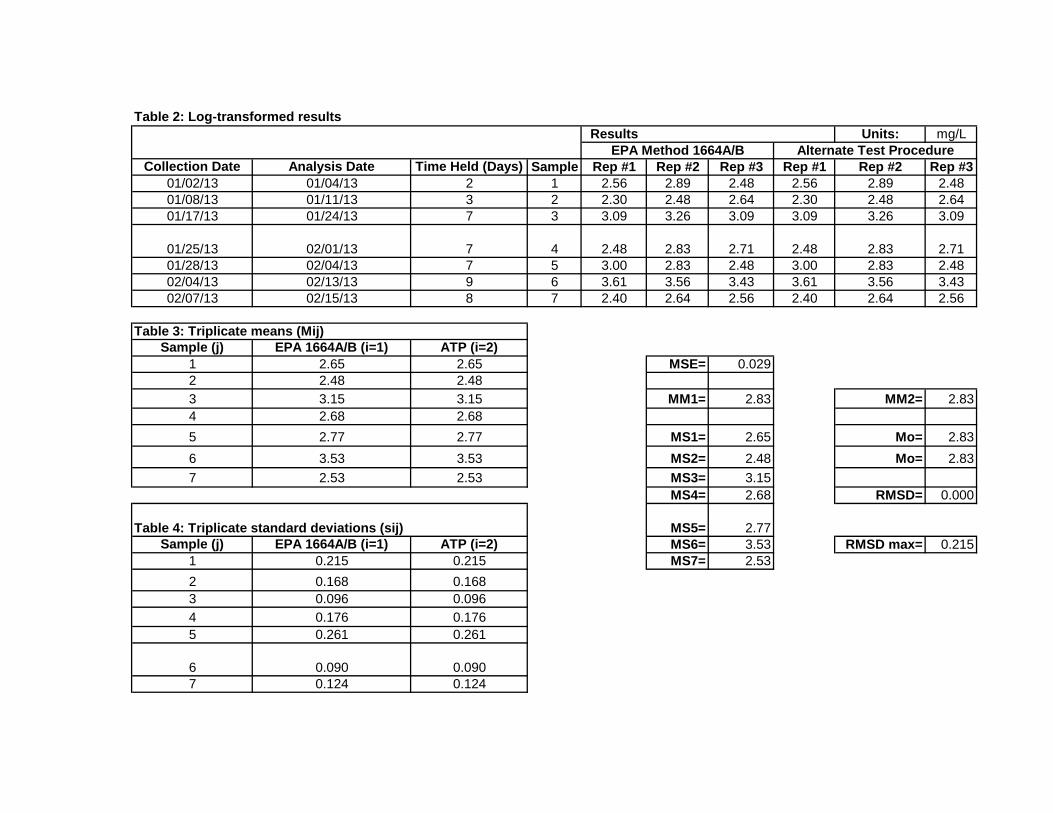
Table 2: Log-transformed resultsResults Units: mg/L
Collection Date Analysis Date Time Held (Days) Sample Rep #1 Rep #2 Rep #3 Rep #1 Rep #2 Rep #301/02/13 01/04/13 2 1 2.56 2.89 2.48 2.56 2.89 2.4801/08/13 01/11/13 3 2 2.30 2.48 2.64 2.30 2.48 2.6401/17/13 01/24/13 7 3 3.09 3.26 3.09 3.09 3.26 3.09
01/25/13 02/01/13 7 4 2.48 2.83 2.71 2.48 2.83 2.7101/28/13 02/04/13 7 5 3.00 2.83 2.48 3.00 2.83 2.4802/04/13 02/13/13 9 6 3.61 3.56 3.43 3.61 3.56 3.4302/07/13 02/15/13 8 7 2.40 2.64 2.56 2.40 2.64 2.56
Sample (j) EPA 1664A/B (i=1) ATP (i=2)1 2.65 2.65 MSE= 0.0292 2.48 2.483 3.15 3.15 MM1= 2.83 MM2= 2.834 2.68 2.685 2.77 2.77 MS1= 2.65 Mo= 2.836 3.53 3.53 MS2= 2.48 Mo= 2.837 2.53 2.53 MS3= 3.15
MS4= 2.68 RMSD= 0.000
MS5= 2.77Sample (j) EPA 1664A/B (i=1) ATP (i=2) MS6= 3.53 RMSD max= 0.215
1 0.215 0.215 MS7= 2.532 0.168 0.1683 0.096 0.0964 0.176 0.1765 0.261 0.261
6 0.090 0.0907 0.124 0.124
Alternate Test ProcedureEPA Method 1664A/B
Table 4: Triplicate standard deviations (sij)
Table 3: Triplicate means (Mij)
EStrassl
Typewritten Text
EStrassl
Typewritten Text
13

Results: Because the RMSD is < than the RMSD MAX, the difference between the two methods is not significant.
Based on the results shown above: Method ATP1 is comparable to Method 1664A/B over the course of 9 days in a Refinery matrix.
Holding Time Check:
Click here to go back to data entry page.
The maximum time your comparison study samples were held MEETS the 28-day holding time for the method.
EStrassl
Typewritten Text
14

Spike Level: 40
Mean IPR Result: 38.5
Recovery #1 (%): 95.0Recovery #2 (%): 96.3Recovery #3 (%): 97.5Recovery #4 (%): 98.8
Mean Recovery (%): 96.9
Standard Deviation: 1.6
Recovery Test: Your IPR MEETS the recovery requirements of the method
Precision Test: Your IPR MEETS the precision requirements of the method
Holding Time Check:
Click here to go back to the data entry page.
IPR Evaluation:
The maximum time your IPR samples were held MEETS the 28-day holding time for the method.
EStrassl
Typewritten Text
15

MDL Evaluation:
Spike Level: 6
Mean Result: 5.7
Standard Deviation: 0.2
Calculated MDL (7 reps): 0.8 mg/L
MDL Test: Your MDL MEETS the method requirements
Holding Time Check:
Click here to go back to the data entry page.
The maximum time your MDL samples were held MEETS the 28-day holding time for the method.
EStrassl
Typewritten Text
16

17
Appendix 2. Example of Oil and Grease ATP with Failing Results

Enter your data in the pale yellow cells.1664A/B ATP2
Matrix =
Units: mg/L
Collection Date
Analysis Date
Time Held (Days) Sample Rep #1 Rep #2 Rep #3 Rep #1 Rep #2 Rep #3
1/2/2013 2/4/2013 33 1 13 18 12 23 28 291/8/2013 1/11/2013 3 2 10 12 14 21 19 171/17/2013 1/24/2013 7 3 22 26 22 41 36 351/25/2013 2/1/2013 7 4 12 17 15 26 27 241/28/2013 2/4/2013 7 5 20 17 12 26 23 272/4/2013 2/13/2013 9 6 37 35 31 52 48 402/7/2013 2/15/2013 8 7 11 14 13 21 20 25
Scroll to the right to see the calculations for the side-by-side comparison.
Enter the data for your Initial Precision and Recovery (IPR) study in the pale yellow cells belowATP2 Units: mg/L
Preparation Date
Analysis Date
Time Held (Days)
Spike Level
IPR Rep #1
IPR Rep #2
IPR Rep #3
IPR Rep #4
1/2/2013 2/2/2013 31 40 37.0 27.0 29.0 35.0
Enter the data for your method detection limit (MDL) study in the pale yellow cells belowATP2 Units: mg/L
Preparation Date
Analysis Date
Time Held (Days)
Spike Level
MDL Rep #1
MDL Rep #2
MDL Rep #3
MDL Rep #4
MDL Rep #5
MDL Rep #6
MDL Rep #7
1/2/2013 2/2/2013 31 6 4.0 3.5 4.5 5.5 4.0 4.2 5.0
Click here to see the evaluation of your IPR results
Alternate Test Procedure =
Click here to see the evaluation of your MDL results
Guidance for Comparison of an Alternative Test Procedure and an Approved Reference Method for Oil & Grease - February 2013
Reference Method = Alternate Test Procedure =
1664A/B
Click here to see the side-by-side comparison of your results
ATP2Results
Table 1: Results of the triplicate analyses by each method on the individually collected sample replicates/day.
Alternate Test Procedure =
Meat Packer
EStrassl
Typewritten Text
18
EStrassl
Typewritten Text

Table 2: Log-transformed resultsResults Units: mg/L
Collection Date Analysis Date Time Held (Days) Sample Rep #1 Rep #2 Rep #3 Rep #1 Rep #2 Rep #301/02/13 02/04/13 33 1 2.56 2.89 2.48 3.14 3.33 3.3701/08/13 01/11/13 3 2 2.30 2.48 2.64 3.04 2.94 2.8301/17/13 01/24/13 7 3 3.09 3.26 3.09 3.71 3.58 3.56
01/25/13 02/01/13 7 4 2.48 2.83 2.71 3.26 3.30 3.1801/28/13 02/04/13 7 5 3.00 2.83 2.48 3.26 3.14 3.3002/04/13 02/13/13 9 6 3.61 3.56 3.43 3.95 3.87 3.6902/07/13 02/15/13 8 7 2.40 2.64 2.56 3.04 3.00 3.22
Sample (j) EPA 1664A/B (i=1) ATP (i=2)1 2.65 3.28 MSE= 0.0202 2.48 2.943 3.15 3.62 MM1= 2.83 MM2= 3.324 2.68 3.245 2.77 3.23 MS1= 2.96 Mo= 3.076 3.53 3.84 MS2= 2.71 Mo= 3.077 2.53 3.09 MS3= 3.38
MS4= 2.96 RMSD= 0.503
MS5= 3.00Sample (j) EPA 1664A/B (i=1) ATP (i=2) MS6= 3.69 RMSD max= 0.178
1 0.215 0.125 MS7= 2.812 0.168 0.1063 0.096 0.0844 0.176 0.0605 0.261 0.084
6 0.090 0.1347 0.124 0.117
Alternate Test ProcedureEPA Method 1664A/B
Table 4: Triplicate standard deviations (sij)
Table 3: Triplicate means (Mij)
EStrassl
Typewritten Text
19

Results: Because the RMSD is > than the RMSD MAX, the difference between the two methods is significant.
Based on the results shown above: Method ATP2 is NOT comparable to Method 1664A/B over the course of 33 days in a Meat Packer matrix.
Holding Time Check:
Click here to go back to data entry page.
The maximum time your comparison study samples were held EXCEEDS the 28-day holding time for the method.
EStrassl
Typewritten Text
20
EStrassl
Typewritten Text

Spike Level: 40
Mean IPR Result: 31.0
Recovery #1 (%): 92.5Recovery #2 (%): 67.5Recovery #3 (%): 72.5Recovery #4 (%): 87.5
Mean Recovery (%): 80.0
Standard Deviation: 11.9
Recovery Test: Your IPR FAILS the recovery requirements of the method
Precision Test: Your IPR FAILS the precision requirements of the method
Holding Time Check:
Click here to go back to the data entry page.
IPR Evaluation:
The maximum time your IPR samples were held EXCEEDS the 28-day holding time for the method.
EStrassl
Typewritten Text
21

MDL Evaluation:
Spike Level: 6
Mean Result: 4.4
Standard Deviation: 0.7
Calculated MDL (7 reps): 2.1 mg/L
MDL Test: Your MDL FAILS the method requirements
Holding Time Check:
Click here to go back to the data entry page.
The maximum time your MDL samples were held EXCEEDS the 28-day holding time for the method.
EStrassl
Typewritten Text
22
EStrassl
Typewritten Text
Related Documents