United States Office of Air and Radiation March 2011 Environmental Protection Agency _____________________________________________________________________________________________ GUIDANCE FOR DETERMINING BEST AVAILABLE CONTROL TECHNOLOGY FOR REDUCING CARBON DIOXIDE EMISSIONS FROM BIOENERGY PRODUCTION

Welcome message from author
This document is posted to help you gain knowledge. Please leave a comment to let me know what you think about it! Share it to your friends and learn new things together.
Transcript
United States Office of Air and Radiation March 2011 Environmental Protection Agency _____________________________________________________________________________________________
GUIDANCE FOR DETERMINING BEST AVAILABLE
CONTROL TECHNOLOGY FOR REDUCING
CARBON DIOXIDE EMISSIONS FROM BIOENERGY
PRODUCTION

Guidance for Determining Best Available Control
Technology for Reducing Carbon Dioxide Emissions from
Bioenergy Production
Prepared by the
U.S. Environmental Protection Agency Office of Air and Radiation
Washington, DC
March 2011

Disclaimer
This document explains the requirements of EPA regulations, describes EPA policies, and
recommends procedures for permitting authorities to use to ensure that permitting decisions are
consistent with applicable regulations. This document is not a rule or regulation, and the
guidance it contains may not apply to a particular situation based upon the individual facts and
circumstances. This guidance does not change or substitute for any law, regulation, or any other
legally binding requirement and is not legally enforceable. The use of non-mandatory language
such as “guidance,” “recommend,” “may,” “should,” and “can,” is intended to describe EPA
policies and recommendations. Mandatory terminology such as “must” and “required” are
intended to describe controlling requirements under the terms of the Clean Air Act and EPA
regulations, but this document does not establish legally binding requirements in and of itself.

2
Table of Contents
I. Introduction
II. CO2 Emissions from Bioenergy and the Carbon Cycle
III. EPA‟s Previous Actions Relating to Application of PSD Program to Biogenic CO2
Emissions
IV. Summary of the Top-Down BACT Process
V. Step 1 of the Top-Down BACT Process
A. Traditional Application of Step 1
B. Previous EPA Guidance on GHG Control Strategies
C. Application of Step 1 to Bioenergy Facilities
VI. Step 2 – Eliminate Technically Infeasible Options
VII. Step 3 – Rank Remaining Control Technologies
VIII. Step 4 – Energy, Environmental, and Economic Impacts
A. Traditional Step 4 Considerations
1. Environmental impacts
2. Economic impacts
3. Energy impacts
B. Specific Considerations at Step 4 for Bioenergy Facilities
1. Environmental impacts
2. Economic impacts
3. Energy impacts
C. Potential Conclusions in Step 4 Analysis
IX. Step 5 – Selecting BACT
3
I. Introduction
This guidance provides an illustration of reasoning that a Prevention of Significant
Deterioration (PSD) permitting authority may use to support the conclusion that the best
available control technology (BACT) for carbon dioxide (CO2) emissions at a bioenergy facility1
is the combustion of biogenic fuels by itself. As of January 2, 2011, greenhouse gases (GHG),
including CO2, became a pollutant subject to regulation under the Clean Air Act (CAA).2 Under
existing PSD program regulations and EPA interpretations of those regulations, stationary
sources of air pollution that require a PSD permit to authorize construction,3 and that would have
the potential to emit (or would increase GHG emissions by) 75,000 tons CO2 equivalent (CO2e)
per year (tpy) or more or are requesting to increase GHG emissions by 75,000 tons CO2e per
year (tpy) but that did not obtain such a permit prior to January 2, 2011,4 will need to
demonstrate to the appropriate reviewing authority5 that the proposed facility will meet GHG
emission limitations through application of BACT.6 To assist PSD permit applicants and
reviewing authorities with making this determination, EPA provided guidance on November 10,
1 A „bioenergy facility‟ is defined, for the purposes of this guidance, as a facility that generates energy via the
combustion of biologically-derived material other than fossil fuels, for example wood, biosolids, or agricultural
products. This could be undertaken either alone or in addition to traditional fossil fuels. 2 75 FR 17004 (April 2, 2010); 75 FR 31514 (June 3, 2010).
3 On June 3, 2010, EPA issued a final rule that “tailors” the applicability provisions of the PSD and title V programs
to enable EPA and states to phase in permitting requirements for GHGs in a common sense manner (“Tailoring
Rule”). The first Tailoring Rule step begins on January 2, 2011, and ends on June 30, 2011, and this step covers
what EPA has called “anyway sources” and “anyway modifications” that would be subject to PSD “anyway” based
on emissions of pollutants other than GHGs. The second step begins on July 1, 2011, and continues thereafter to
cover both anyway sources and certain other large emitters of GHGs. 4 75 FR 17021 (April 2, 2010); 75 FR 31526 (June 3, 2010)
5 This may be EPA or a state or local government authority depending on the status of implementation. See
75 FR 77698 (December 13, 2010); 75 FR 81874 (December 29, 2010); 75 FR 82246 - 82536 (December 30, 2010);
76 FR 752 (January 6, 2011); 76 FR 2070 (January 12, 2011); 76 FR 2581 (January 14, 2011);
76 FR 2591 (January 14, 2011). 6 40 CFR 52.21(b)(49)-(50); 40 CFR 51.166(b)(48)-(49); 40 CFR 52.21(b)(12); 40 CFR 51.166(b)(12); 40 CFR
52.21(j)(2)-(3); 40 CFR 51.166(j)(2)-(3); 75 FR 17004 (April 2, 2010); 75 FR 31514 (June 3, 2010).

4
2010 entitled PSD and Title V Permitting Guidance for Greenhouse Gases (“2010 GHG
Permitting Guidance”),7 which includes a section on determining BACT for GHG. In addition to
the November 10, 2010 guidance EPA also released technical white papers8 for several industry
sectors.
Any stationary source, including a bioenergy facility, that qualifies as a major stationary
source required to obtain a PSD permit must address the BACT requirement for GHGs if it emits
or increases its emission of this regulated pollutant in amounts greater than 75,000 tons on a
CO2e basis.9 This guidance on determining BACT for CO2 emissions from a bioenergy facility
is intended to supplement the 2010 GHG Permitting Guidance, and not to supersede it. This
guidance applies to sources that generate energy from biologically–based material, and it does
not apply to other sources that may emit biogenic CO2 but do not generate energy from the
biological material. For the sources with biogenic emissions not covered by this guidance
document, one should consult the 2010 GHG Permitting Guidance and prior guidance EPA has
provided on the top-down BACT process.
Concurrent with the release of this guidance, EPA is issuing a proposed rule to defer
application of PSD permitting requirements to CO2 emissions from biologically-based material
(biogenic CO2 emissions) for a three-year period. The scope of the proposed deferral is wider
than the scope of this guidance: the deferral is intended to cover all sources of biogenic CO2
emissions, including those that emit CO2 from biologically-based material but do not generate
energy from it.
EPA expects to take final action on the proposed deferral rule in the July 2011 timeframe.
In the event that EPA finalizes the deferral for the PSD program as proposed, states may require
7 http://www.epa.gov/nsr/ghgdocs/epa-hq-oar-2010-0841-0001.pdf
8 http://www.epa.gov/nsr/ghgpermitting.html
9 75 Fed. Reg. at 31606-07; 40 CFR 52.21(b)(49); 40 CFR 52.166(b)(48).
5
additional time to review their state laws to incorporate the deferral established by that rule. To
the extent no such deferral is available under the PSD permitting regulations applicable at the
time a permitting authority issues a PSD permit for a bioenergy facility, the reasoning described
below may be used on an interim basis to support a conclusion in such a permit that BACT for
CO2 is combustion of biomass fuels alone.
This document does not provide a final determination of BACT for a particular source,
since such determinations can only be made by individual permitting authorities on a case-by-
case basis after consideration of the record in each case. Upon considering the record in an
individual case, if a permitting authority has a reasoned basis to address particular issues
discussed in this document in a different manner than EPA recommends here, permitting
authorities (including EPA) have the discretion to do so in decisions on individual permit
applications consistent with the relevant requirements in the CAA and regulations. However,
EPA believes the analysis described below will be sufficient in most cases to support the
conclusion that utilization of biomass fuel alone is BACT for a bioenergy facility.
It is also important to note that this guidance is meant to be interim guidance only and
that once EPA completes the detailed examination of the science and technical issues associated
with accounting for biogenic CO2 emissions from stationary sources, as discussed in the
proposed deferral, those analyses may outweigh many of the considerations mentioned in this
guidance.
II. CO2 Emissions from Bioenergy and the Carbon Cycle
Carbon dioxide emissions from bioenergy facilities are generated during the combustion
of biologically-based material (e.g., forest or agricultural products) for energy. The term „CO2
emissions from bioenergy‟ is used in this guidance to describe biogenic CO2 emissions from a

6
stationary source that directly result from the combustion of biologically-based materials other
than fossil fuels when these materials are used to generate energy. Although every molecule of
CO2 has the same radiative forcing in the atmosphere regardless of its source, CO2 emissions
from bioenergy merit unique consideration in the BACT analysis because land-based biomass
carbon stocks can be replenished more quickly than fossil fuel carbon stocks, and thus these
biogenic carbon stocks can act as a sink on a shorter time scale than fossil carbon. For example,
many coal deposits in North America originated hundreds of millions of years ago. In contrast,
the reservoirs of carbon found on the surface of Earth, in pools such as tree biomass and cropland
soils, have accumulated over decades, not millennia.
Through relatively rapid photosynthesis, plants absorb CO2 from the atmosphere and add
it to their biomass, which contains roughly 50% carbon by weight, through a process called
sequestration. When biological material such as plant biomass is harvested or cleared from the
land and burned for energy, the material acts as a source of carbon, releasing its stored carbon
back to the atmosphere as CO2. Over large spatial scales such as states, regions, or continents, if
more carbon is sequestered in plant biomass than is emitted to the atmosphere through processes
such as harvest, fire, or natural decomposition, plant biomass acts as a net sink for carbon.
Conversely, if more carbon is released than is sequestered, plant biomass acts as a net source for
carbon.
EPA‟s Inventory of U.S. Greenhouse Gas Emissions and Sinks (the Inventory)10
tracks
annual GHG emissions and sinks including emissions of CO2, methane (CH4), nitrous oxide
(N2O), hydrofluorocarbons (HFCs), perfluorocarbons (PFCs), and sulfur hexafluoride (SF6).
That report estimates all anthropogenic sources and sinks of GHG emissions at the national
10
US EPA. 2010. Inventory of U.S Greenhouse Gas Emissions and Sinks: 1990-2008. U.S. EPA #430-R-10-06.
7
scale, classified into six broad sectors: Energy, Industrial Processes, Solvents and Other Product
Uses, Agriculture, Land-Use, Land-Use Change and Forestry (LULUCF), and Waste. The
Energy Sector includes all GHGs emitted during the production, transformation, handling and
consumption of energy commodities, including fuel combustion. The LULUCF Sector includes
emissions and sequestration resulting from human activities that influence the way land is used
or that affect the size of carbon stocks on land. Thus, at the national level, CO2 emissions from
biomass combustion are not included in the estimate of emissions from a country‟s Energy
Sector, even though the emissions physically occur at the time and place in which useful energy
is being generated (e.g., power plant or automobile).
Averaged over the years 1990-2008, data from the Inventory show that the LUCF sector
in the United States has been a net sink of 841 Teragrams carbon dioxide equivalent (CO2e) per
year.11
This sink is roughly 12% of the average gross emissions from all other sources combined
in the United States over the same time period. Future national projections under business as
usual (BAU), as reported in the Fifth U.S Climate Action Report (CAR) submitted to the
UNFCCC in 2010, suggest that this LUCF sink is likely to continue, if not increase in size, at
least until 2020.12
Biogenic CO2 emissions are distinct from other regulated pollutants at bioenergy
facilities because, unlike other pollutants and other GHGs, CO2 emissions can participate directly
in the global carbon cycle through photosynthesis, which is critical for the maintenance of life on
Earth. Further, emissions of CO2 can dwarf emissions of other GHGs from biomass combustion.
For example, CO2 makes up 97.9% of the global warming potential (GWP) of the GHG
11
See Tables 1 and 2 in Appendix. 12
U.S. Climate Action Report 2010. Fifth National Communication of the United States of America under the
United National Framework Convention on Climate Change. Chapter 5 Projected Greenhouse Gas Emissions, page
81. www.state.gov/documents/organization/140636.pdf
8
emissions from wood and wood residuals.13
Finally, because sequestration of CO2 emissions in
living plant material outside the boundaries of the facility may counteract the emissions from
such facilities on a continuous basis, this unique dynamic merits consideration in the BACT
analysis. This argument is underlined by the fact that GHGs such as CO2 are well-mixed in the
atmosphere at large spatial scales; therefore, the need to reduce them directly at the facility is of
lesser importance so long as their net atmospheric impact is accounted for and is negative or
zero.
III. EPA’s Previous Actions Relating to Application of the PSD Program to Biogenic
CO2 Emissions
On the basis of the Inventory results described above and other considerations,
stakeholders have requested that EPA exclude, either partially or wholly, biogenic CO2 emissions
for the purposes of the BACT analysis and the PSD program based on the view that the
biological material used to generate energy can also serve as a sink for carbon. In its notice
proposing the PSD and Title V Greenhouse Gas Tailoring Rule, EPA referenced the Inventory
for the applicable global warming potential (GWP) values and guidance on how to calculate a
source‟s GHG emissions in tons per year (tpy) CO2e. While EPA referred to the Inventory for
GWP identification purposes only, several commenters appeared to misunderstand our intent.
The narrow reference to the use of GWP values for estimating GHG emissions was provided to
offer consistent guidance on how to calculate these emissions and was not intended as an
indication, direct or implied, that biogenic emissions would be excluded from permitting
applicability merely by association with the national Inventory.14
As noted above, the Inventory
13
See CO2, CH4 and N2O GWPs in Table A-1 of 40 CFR Part 98 Subpart A; and emission factors for CO2, CH4 and
N2O from combustion of wood and wood residuals in Tables C-1 and C-2 of 40 CFR Part 98 Subpart C. 14
See 74 FR 55351, under the definition for „carbon dioxide equivalent‟
9
does not exclude these emissions, but simply includes them in the LUCF Sector rather than the
Energy Sector to avoid double-counting at the national scale.
In response, when finalizing the Tailoring Rule, EPA acknowledged the role that
biogenic fuels and feedstocks could play in reducing anthropogenic GHG emissions, and did not
dispute the commenters‟ observations that many state, federal, and international rules and
policies treat biogenic sources and fossil sources of CO2 emissions differently.15
Nevertheless,
we determined that we lacked a sufficient record at that time to apply the legal rationales utilized
in the Tailoring Rule to exclude emissions of CO2 from biogenic sources in determining
permitting applicability provisions. At that time, we had not requested and did not obtain public
comments addressing the particular administrative burden of permitting projects that specifically
involve biogenic CO2 emissions from energy production. Although EPA did not promulgate an
applicability exclusion for biogenic emissions in the final Tailoring Rule, EPA did observe that
flexibility exists to apply the existing regulations and policies regarding BACT in ways that take
into account their net effects on atmospheric GHG concentrations.
In order to explore the issue further following the promulgation of the Tailoring Rule, in
July 2010 EPA solicited views from the public through a Call for Information (CFI) on
approaches to accounting for biogenic emissions, including whether some or all of a source's
biogenic CO2 emissions could be discounted based on a determination that they are canceled out
by the CO2 absorption associated with growing the fuel. Also, we solicited information on the
means to estimate and measure CO2 emissions from a variety of biogenic fuels.
EPA issued its PSD and Title V Permitting Guidance for Greenhouse Gases on
November 10, 2010 (“2010 GHG Permitting Guidance”), which discusses the basic information
15
See 75 FR 31514.

10
that permit writers and applicants need to address GHG emissions in permits.16
To assist
permitting authorities carrying out BACT analyses for GHGs pending further EPA action, the
guidance indicated that permitting authorities may consider the environmental, energy and
economic benefits that may accrue from the use of certain types of biogenic fuels (e.g., biogas
from landfills) for energy generation, consistent with existing air quality standards. Noting that
a variety of federal and state policies have recognized that some biogenic fuels can be part of a
national strategy to reduce dependence on fossil fuels and to reduce emissions of GHGs, EPA
determined that it is appropriate for permitting authorities to account for both existing federal
and state policies and their underlying objectives in evaluating the environmental, energy and
economic benefits of biogenic fuels. EPA observed that, based on these considerations,
permitting authorities might determine in the GHG component of the BACT analysis for new or
modified bioenergy facilities, as defined in Section I, that such utilization of biogenic fuels is
inherently BACT for GHGs. To assist permitting authorities further in considering these factors,
EPA announced its intent to issue guidance that will provide a suggested framework for
undertaking an analysis of the environmental, energy and economic impacts of using biogenic
fuels in Step 4 of the top-down BACT process.
IV. Summary of the Top-Down BACT Process
On November 10, 2010, EPA issued the 2010 GHG Permitting Guidance, which
supplements prior EPA guidance on determining BACT, including EPA‟s 1990 Draft New
Source Review Workshop Manual (“1990 Workshop Manual”).17
In the 2010 GHG Permitting
16
PSD and Title V Permitting Guidance for Greenhouse Gases. Prepared by EPA staff. November 2010. Available
at: http://www.epa.gov/nsr/ghgdocs/epa-hq-oar-2010-0841-0001.pdf 17
“PSD and Title V Permitting Guidance for Greenhouse Gases.” Prepared by EPA staff. November 2010.
Available at: http://www.epa.gov/nsr/ghgdocs/epa-hq-oar-2010-0841-0001.pdf;
“New Source Review Workshop Manual; Draft.” October 1990.
Available at: http://www.epa.gov/ttn/nsr/gen/wkshpman.pdf.

11
Guidance, EPA recommends that permitting authorities continue to use the Agency‟s five-step
“top-down” BACT process to determine BACT for GHGs. In brief, the top-down process calls
for all available control technologies for a given pollutant to be identified and ranked in
descending order of control effectiveness. A permit applicant should first examine the highest-
ranked (“top”) option. The top-ranked option(s) should be established as BACT unless the
permit applicant demonstrates to the satisfaction of the permitting authority that technical
considerations, or energy, environmental, or economic impacts justify a conclusion that the top-
ranked technology is not “achievable” in that case. If the most effective control strategy is
eliminated in this fashion, then the next most effective alternative should be evaluated, and so on,
until an option is selected as BACT.18
This analysis should be conducted for each regulated
NSR pollutant that is subject to the BACT requirement in a given case.
EPA has broken down this analytical process into the following five steps, some of which
are discussed in detail later in this section.
Step 1: Identify all available control technologies.
Step 2: Eliminate technically infeasible options.
Step 3: Rank remaining control technologies.
Step 4: Evaluate most effective controls and document results.
Step 5: Select BACT.
For additional detail on this process, consult the 2010 GHG Permitting Guidance and references
contained therein. As this guidance focuses on unique considerations for bioenergy facilities, the
discussion that follows elaborates only on those steps where EPA believes such considerations
are most likely to arise.
18
2010 GHG Permitting Guidance at 18.
12
V. Step 1 of the Top-Down BACT Process
A. Traditional Application of Step 1
The first step in the top-down BACT process is to identify all available control options.
Available control options are those air pollution control technologies or techniques (including
lower-emitting processes and practices) that have the potential for practical application to the
emissions unit and the regulated pollutant under evaluation. They typically include the
application of alternative production processes, methods, systems, and techniques, including
clean fuels or treatment or innovative fuel combustion for control of the affected pollutant.19
However, while Step 1 is intended to capture a broad array of potential options for
pollution control, this step of the process is not without limits. EPA has recognized that a Step 1
list of options need not necessarily include inherently lower polluting processes that would
fundamentally redefine the nature of the source proposed by the permit applicant.20
BACT
should generally not be applied to regulate the applicant‟s purpose or objective for the proposed
facility. In assessing whether an option would fundamentally redefine a proposed source, EPA
recommends21
that permitting authorities apply the analytical framework recently articulated by
the Environmental Appeals Board. 22
The underlying record will be an essential component of a
19
See pages 25-34 of “PSD and Title V Permitting Guidance for Greenhouse Gases.” (November 2010) for more
general background on Step 1 of the top-down process. 20
In re Prairie State Generating Company, 13 E.A.D. 1, 23 (EAB 2006). 21
See, generally, In the Matter of American Electric Power Service Corporation, Southwest Electric Power
Company, John W. Turk Plant, Petition No. VI-2008-01 (Order on Petition) (December 15, 2009) (title V order
referencing and applying framework developed by the EAB) ; In the Matter of Cash Creek Generation, LLC,
Petition Nos. IV-2008-1 & IV-2008-2 (Order on Petition) (December 15, 2009) (same). 22
The EPA Environmental Appeals Board has applied this framework for evaluating redefining the source questions
in three cases involving coal-fired power plants. In re Desert Rock Energy Company, PSD Appeal No. 08-03 et al.
(EAB Sept. 24, 2009); In re Northern Michigan University, PSD Appeal No. 08-02 (EAB Feb. 18, 2009); In re
Prairie State Generating Company, 13 E.A.D. 1 (EAB 2006). For additional examples of how EPA approached the
redefining the source issue in the context of power plants prior to developing this analytical framework, see the
following decisions. In re Old Dominion Electric Cooperative, 3 E.A.D. 779 (Adm‟r 1992); In re Hawaiian
Commercial & Sugar Co., 4 E.A.D. 95 (EAB 1992); In re SEI Birchwood Inc., 5 E.A.D. 25 (EAB 1994). EPA also
considered this issue in the context of waste incinerators prior to developing the recommended analytical
framework. In re Pennsauken, 2 E.A.D. 667 (Adm‟r 1988); In the Matter of Spokane Regional Waste-to-Energy
13
supportable BACT determination that a candidate control technology redefines the source.23
The
“redefining the source” issue is ultimately a question of degree that is within the discretion of the
permitting authority. Ultimately, any decision to exclude an option on “redefining the source”
grounds must be explained and documented in the permit record, especially where such an
option has been identified as significant in public comments.24
The 2010 GHG Permitting
Guidance provides more information that permit writers and applicants may consult on this topic.
The CAA includes “clean fuels” in the definition of BACT.25
While clean fuels that
would reduce GHG emissions should be considered, EPA has recognized that the initial list of
control options for a BACT analysis does not need to include “clean fuel” options that would
fundamentally redefine the source. Such options include those that would require a permit
applicant to switch to a primary fuel type (e.g., coal, natural gas, or biomass) other than the type
of fuel that an applicant proposes to use for its primary combustion process.
B. Previous EPA Guidance on GHG Control Strategies
As EPA discussed in the 2010 GHG Permitting Guidance, for the purposes of a BACT
analysis for GHGs, EPA classifies carbon capture and sequestration as an add-on pollution
control technology26
that is “available”27
for large CO2-emitting facilities including fossil fuel-
Facility, 2 E.A.D. 809 (Adm‟r 1989); In the Matter of Brooklyn Navy Yard Resource Recovery Facility, 3 E.A.D.
867 (EAB 1992); In re Hillman Power Co., LLC, 10 E.A.D. 673, 684 (EAB 2002). In another case, EPA considered
this question in the context of a conversion of a natural-gas fired taconite ore facility to a petcoke fuel. In re
Hibbing Taconite Co., 2 E.A.D. 838 (Adm‟r 1989). For an example of the application of this concept to a fiberglass
manufacturing facility, see In re Knauf Fiber Glass, 8 E.A.D 121 (EAB 1998). 23
In re Desert Rock Energy Company, PSD Appeal No. 08-03 et al. (EAB Sept. 24, 2009), slip op. at 65, 76. 24 In re Desert Rock Energy Company, slip op. at 70-71, 76-77; In the Matter of Cash Creek Generation, Order at 7-
10. 25
42 USC 7579(3). EPA has not yet updated the definition of BACT in the PSD regulations to reflect the addition
of the “clean fuels” language that occurred in the 1990 amendments to the Clean Air Act. 40 CFR 52.21(b)(12); 40
CFR 51.166(b)(12). Nevertheless, EPA reads and applies its regulations consistent with the terms of the Clean Air
Act. 26
EPA recognizes that CCS systems may have some unique aspects that differentiate them from the types of
equipment that have traditionally been classified as add-on pollution controls (i.e., scrubbers, fabric filters,
electrostatic precipitators). However, since CCS systems have more similarities to such devices than inherently
14
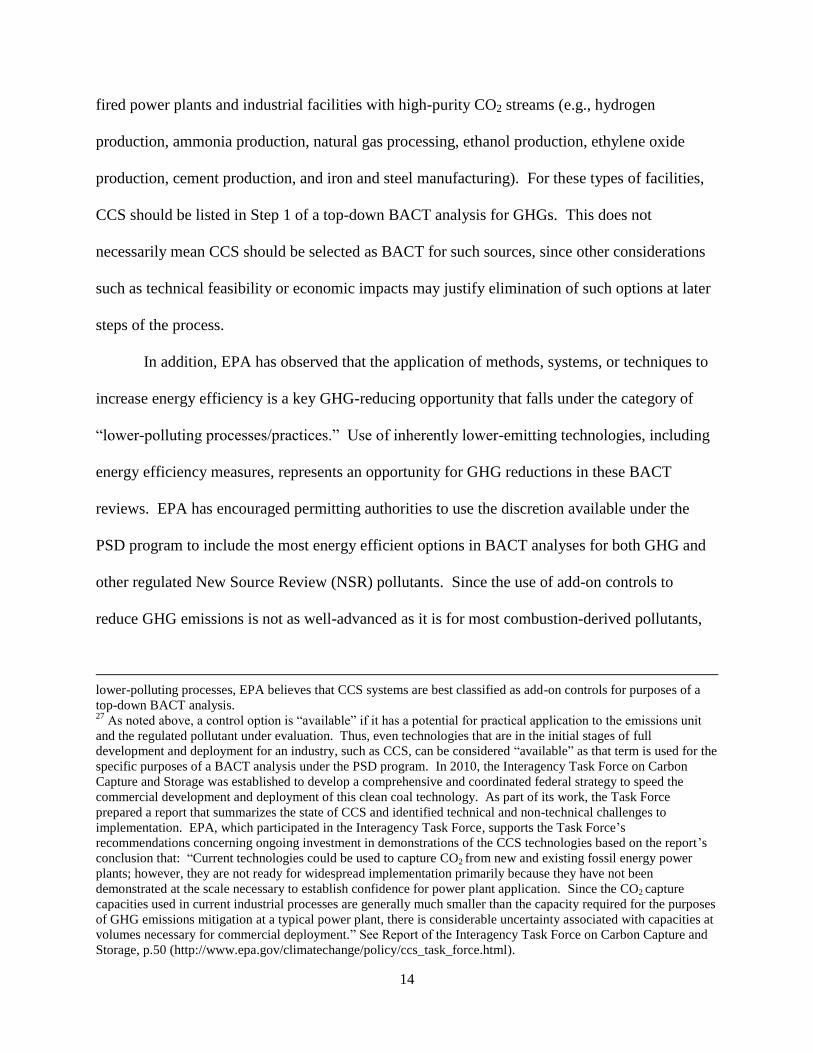
fired power plants and industrial facilities with high-purity CO2 streams (e.g., hydrogen
production, ammonia production, natural gas processing, ethanol production, ethylene oxide
production, cement production, and iron and steel manufacturing). For these types of facilities,
CCS should be listed in Step 1 of a top-down BACT analysis for GHGs. This does not
necessarily mean CCS should be selected as BACT for such sources, since other considerations
such as technical feasibility or economic impacts may justify elimination of such options at later
steps of the process.
In addition, EPA has observed that the application of methods, systems, or techniques to
increase energy efficiency is a key GHG-reducing opportunity that falls under the category of
“lower-polluting processes/practices.” Use of inherently lower-emitting technologies, including
energy efficiency measures, represents an opportunity for GHG reductions in these BACT
reviews. EPA has encouraged permitting authorities to use the discretion available under the
PSD program to include the most energy efficient options in BACT analyses for both GHG and
other regulated New Source Review (NSR) pollutants. Since the use of add-on controls to
reduce GHG emissions is not as well-advanced as it is for most combustion-derived pollutants,
lower-polluting processes, EPA believes that CCS systems are best classified as add-on controls for purposes of a
top-down BACT analysis. 27
As noted above, a control option is “available” if it has a potential for practical application to the emissions unit
and the regulated pollutant under evaluation. Thus, even technologies that are in the initial stages of full
development and deployment for an industry, such as CCS, can be considered “available” as that term is used for the
specific purposes of a BACT analysis under the PSD program. In 2010, the Interagency Task Force on Carbon
Capture and Storage was established to develop a comprehensive and coordinated federal strategy to speed the
commercial development and deployment of this clean coal technology. As part of its work, the Task Force
prepared a report that summarizes the state of CCS and identified technical and non-technical challenges to
implementation. EPA, which participated in the Interagency Task Force, supports the Task Force‟s
recommendations concerning ongoing investment in demonstrations of the CCS technologies based on the report‟s
conclusion that: “Current technologies could be used to capture CO2 from new and existing fossil energy power
plants; however, they are not ready for widespread implementation primarily because they have not been
demonstrated at the scale necessary to establish confidence for power plant application. Since the CO2 capture
capacities used in current industrial processes are generally much smaller than the capacity required for the purposes
of GHG emissions mitigation at a typical power plant, there is considerable uncertainty associated with capacities at
volumes necessary for commercial deployment.” See Report of the Interagency Task Force on Carbon Capture and
Storage, p.50 (http://www.epa.gov/climatechange/policy/ccs_task_force.html).

15
initially, in many instances energy efficient measures may serve as the foundation for a BACT
analysis for GHGs with add-on pollution control technology and other strategies added as they
become more accessible.
C. Application of Step 1 to Bioenergy Facilities
At the outset, when considering an application to construct or modify a bioenergy
facility, it will be important to address the extent to which the BACT analysis for GHGs should
include comparative evaluation of biogenic fuels and other types of fuels, including fossil fuels.
However, where a proposed bioenergy facility can demonstrate that utilizing a particular type of
biogenic fuel is fundamental to the primary purpose of the project, then at the first step of the
top-down process, permitting authorities can rely on that to determine that use of another fuel
would redefine the proposed source.
To the extent this showing is made by a permit applicant proposing to construct or
modify an electric generating facility that would utilize biomass fuels alone in the primary
production process, the options listed as Step 1 of a top-down BACT analysis for GHGs may be
limited to (1) utilization of biomass fuel alone, (2) energy efficiency improvements, and (3)
carbon capture and sequestration if the source meets the characteristics summarized above and
described in more detail in the 2010 GHG Permitting Guidance.
In cases where a permit applicant proposes to co-fire or combine biomass fuels with
another primary fuel type, the list of BACT options should include the option of utilizing both
types of primary fuels in different combinations. If the applicant proposes a specific
proportional allocation or fuel mix (i.e., <5 percent biomass, >95 percent fossil fuel) and believes
other allocations should be eliminated from consideration in the BACT analysis for GHGs, the
permit application should provide an explanation as to why the particular allocation desired by
16
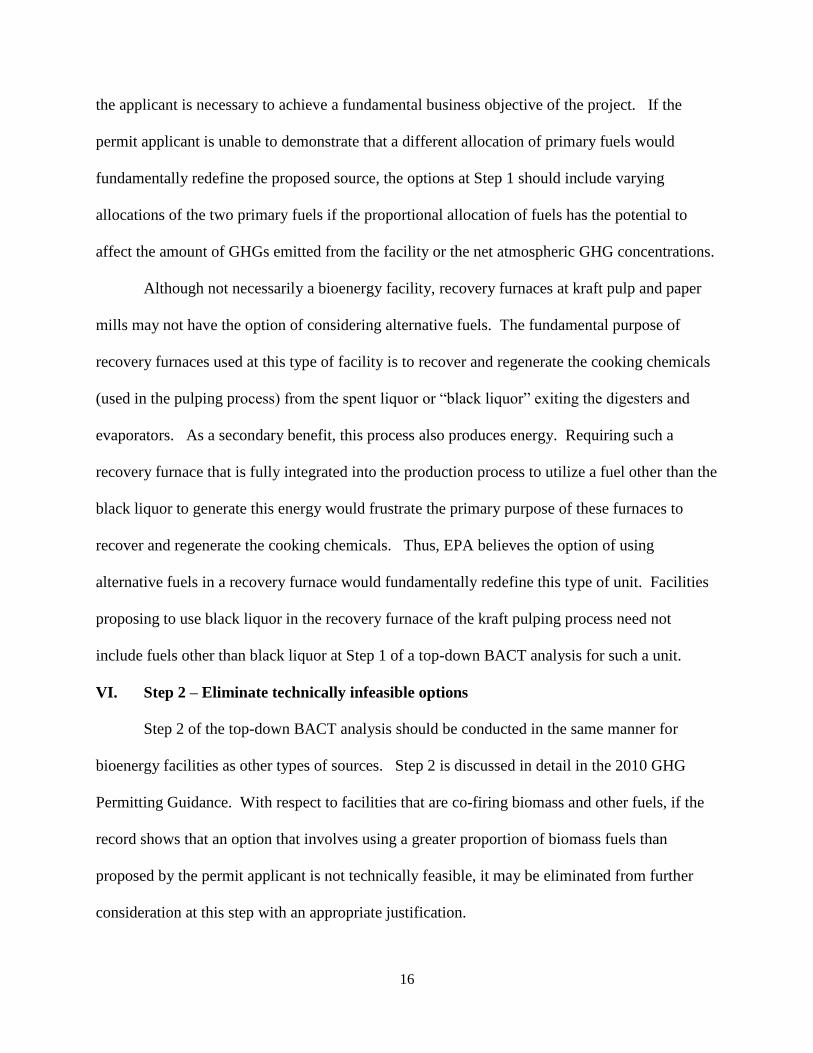
the applicant is necessary to achieve a fundamental business objective of the project. If the
permit applicant is unable to demonstrate that a different allocation of primary fuels would
fundamentally redefine the proposed source, the options at Step 1 should include varying
allocations of the two primary fuels if the proportional allocation of fuels has the potential to
affect the amount of GHGs emitted from the facility or the net atmospheric GHG concentrations.
Although not necessarily a bioenergy facility, recovery furnaces at kraft pulp and paper
mills may not have the option of considering alternative fuels. The fundamental purpose of
recovery furnaces used at this type of facility is to recover and regenerate the cooking chemicals
(used in the pulping process) from the spent liquor or “black liquor” exiting the digesters and
evaporators. As a secondary benefit, this process also produces energy. Requiring such a
recovery furnace that is fully integrated into the production process to utilize a fuel other than the
black liquor to generate this energy would frustrate the primary purpose of these furnaces to
recover and regenerate the cooking chemicals. Thus, EPA believes the option of using
alternative fuels in a recovery furnace would fundamentally redefine this type of unit. Facilities
proposing to use black liquor in the recovery furnace of the kraft pulping process need not
include fuels other than black liquor at Step 1 of a top-down BACT analysis for such a unit.
VI. Step 2 – Eliminate technically infeasible options
Step 2 of the top-down BACT analysis should be conducted in the same manner for
bioenergy facilities as other types of sources. Step 2 is discussed in detail in the 2010 GHG
Permitting Guidance. With respect to facilities that are co-firing biomass and other fuels, if the
record shows that an option that involves using a greater proportion of biomass fuels than
proposed by the permit applicant is not technically feasible, it may be eliminated from further
consideration at this step with an appropriate justification.

17
VII. Step 3 – Rank remaining control technologies
As with Step 2, EPA recommends applying the same consideration in Step 3 of the
BACT analysis for a bioenergy facility that would apply to other types of sources. Step 3 is
discussed in detail in the 2010 GHG Permitting Guidance.
VIII. Step 4 – Energy, Environmental, and Economic Impacts
A. Traditional Step 4 Considerations
Under Step 4 of the top-down BACT analysis, permitting authorities must consider the
economic, energy, and environmental impacts arising from each option remaining under
consideration. Accordingly, after all available and technically feasible control options have been
ranked in terms of control effectiveness (BACT Step 3), the permitting authority should consider
any specific energy, environmental, and economic impacts identified with those technologies to
either confirm that the top control alternative is appropriate or determine it to be inappropriate.
The “top” control option should be established as BACT unless the applicant demonstrates, and
the permitting authority agrees, that the energy, environmental, or economic impacts justify a
conclusion that the most stringent technology is not “achievable” in that case. If the most
stringent technology is eliminated in this fashion, then the next most stringent alternative is
considered, and so on.
1. Environmental impacts
EPA and other permitting authorities have most often used this analysis to eliminate more
stringent control technologies with significant or unusual effects that are unacceptable in favor of
the less stringent technologies with more acceptable collateral environmental effects. However,
EPA has also interpreted the BACT requirements to allow for a more stringent technology to
remain in consideration as BACT if the collateral environmental benefits of choosing such a
18
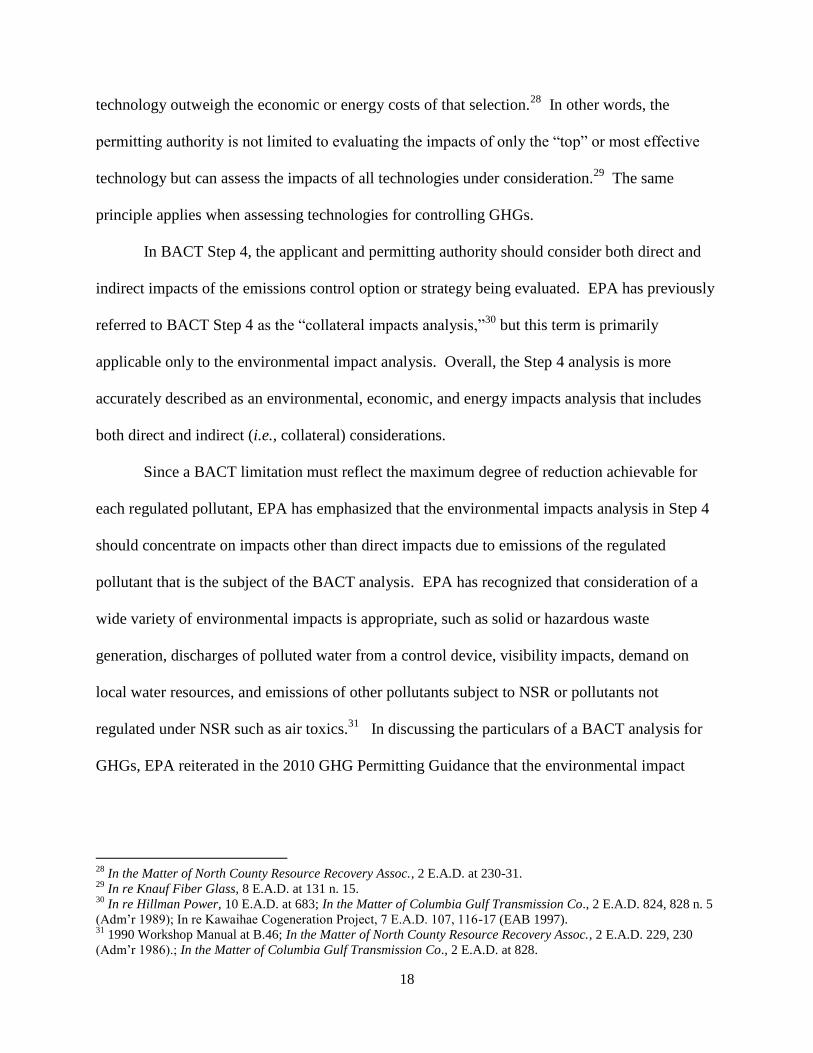
technology outweigh the economic or energy costs of that selection.28
In other words, the
permitting authority is not limited to evaluating the impacts of only the “top” or most effective
technology but can assess the impacts of all technologies under consideration.29
The same
principle applies when assessing technologies for controlling GHGs.
In BACT Step 4, the applicant and permitting authority should consider both direct and
indirect impacts of the emissions control option or strategy being evaluated. EPA has previously
referred to BACT Step 4 as the “collateral impacts analysis,”30
but this term is primarily
applicable only to the environmental impact analysis. Overall, the Step 4 analysis is more
accurately described as an environmental, economic, and energy impacts analysis that includes
both direct and indirect (i.e., collateral) considerations.
Since a BACT limitation must reflect the maximum degree of reduction achievable for
each regulated pollutant, EPA has emphasized that the environmental impacts analysis in Step 4
should concentrate on impacts other than direct impacts due to emissions of the regulated
pollutant that is the subject of the BACT analysis. EPA has recognized that consideration of a
wide variety of environmental impacts is appropriate, such as solid or hazardous waste
generation, discharges of polluted water from a control device, visibility impacts, demand on
local water resources, and emissions of other pollutants subject to NSR or pollutants not
regulated under NSR such as air toxics.31
In discussing the particulars of a BACT analysis for
GHGs, EPA reiterated in the 2010 GHG Permitting Guidance that the environmental impact
28
In the Matter of North County Resource Recovery Assoc., 2 E.A.D. at 230-31. 29
In re Knauf Fiber Glass, 8 E.A.D. at 131 n. 15. 30
In re Hillman Power, 10 E.A.D. at 683; In the Matter of Columbia Gulf Transmission Co., 2 E.A.D. 824, 828 n. 5
(Adm‟r 1989); In re Kawaihae Cogeneration Project, 7 E.A.D. 107, 116-17 (EAB 1997). 31
1990 Workshop Manual at B.46; In the Matter of North County Resource Recovery Assoc., 2 E.A.D. 229, 230
(Adm‟r 1986).; In the Matter of Columbia Gulf Transmission Co., 2 E.A.D. at 828.

19
analysis should continue to concentrate on impacts other than the direct impacts due to emissions
of the regulated pollutant that is the subject of the BACT analysis.
2. Economic impacts
EPA has previously advised that the economic impacts component of the analysis should
focus on direct economic impacts calculated in terms of cost effectiveness (dollars per ton of
pollutant emission reduced). This cost effectiveness should be addressed on both an average
basis for each measure and combination of measures, and on an incremental basis comparing the
costs and emissions performance level of a control option to the cost and performance of the next
most stringent control option.32
The emphasis should be on the cost of control relative to the
amount of pollutant removed, rather than economic parameters that provide an indication of the
general affordability of the control alternative relative to the source. To justify elimination of an
option on economic grounds, the permit applicant should demonstrate that the costs of pollutant
removal for that option are disproportionately high.33
3. Energy impacts
EPA has traditionally called for the energy impacts analysis to consider only direct
energy consumption and not indirect energy impacts, such as the energy required to produce raw
materials for construction of control equipment.34
Direct energy consumption impacts include
the consumption of fuel and the consumption of electrical or thermal energy. This energy
impacts analysis should include an assessment of demand for both electricity that is generated
onsite and power obtained from the electrical grid, and may include an evaluation of impacts on
fuel scarcity or a locally desired fuel mix in a particular area. Applicants and permitting
32
1990 Workshop Manual, Section IV.D.2.b (B.36 – B.44). 33
1990 Workshop Manual at B.31-32. 34
In re Power Holdings, PSD Appeal No. 09-04 (EAB Aug. 13, 2010), slip op. at 22, n.17 (citing 1990 Workshop
Manual at B.30).

20
authorities should examine whether the energy requirements for each control option result in any
significant or unusual energy penalties or benefits.35
The costs associated with direct energy
impacts should be calculated and included in the economic impacts analysis (i.e., cost
analysis).36
B. Specific Considerations at Step 4 for Bioenergy Facilities
While the more traditional approach that EPA has applied in the Step 4 analysis is to
eliminate options from the top-down BACT analysis based on unacceptable adverse energy,
environmental, or economic impacts, this is not the only way to conduct a Step 4 analysis. EPA
has recognized a permitting authority is not limited to evaluating the impacts of only the “top” or
most effective technology (based on the ranking options based on control of released from the
facility) but can assess the impacts of all technologies under consideration.37
This approach may
include an evaluation of the energy, environmental, and environmental benefits of all options
under consideration without explicitly eliminating options based on adverse impacts.
1. Environmental impacts
Although EPA has not recommended focusing on the environmental impacts of the
pollutant that is the subject of the BACT analysis, with respect to CO2 emissions from bioenergy
facilities, EPA believes a different frame of reference should be considered because of the nature
of the carbon cycle and the fact that the production of biomass entails carbon sequestration.
Within the context of the PSD program, a potential justification that biogenic CO2 emissions can
be accounted for differently than non-biogenic CO2 emissions at the facility relies on the
argument that sequestration occurs. This sequestration occurs offsite, outside the boundaries of
35
1990 Workshop Manual at B.29. 36
1990 Workshop Manual at B.30. 37
In re Knauf Fiber Glass, 8 E.A.D. at 131 n. 15.
21
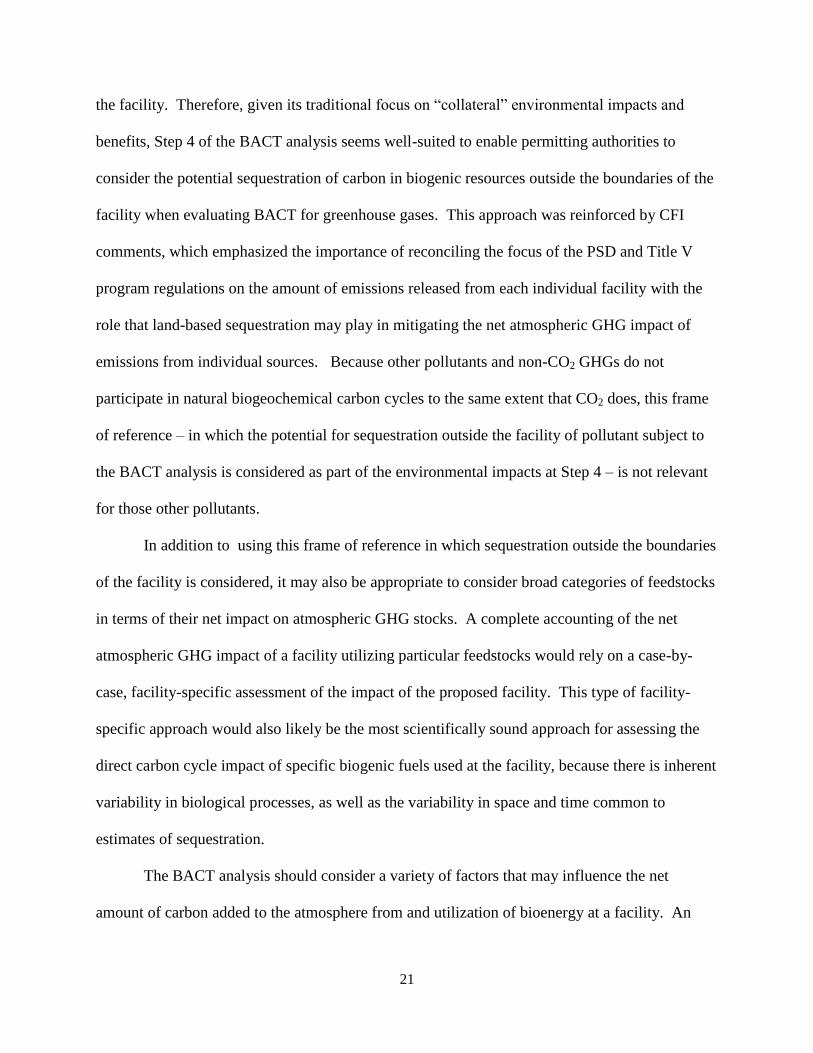
the facility. Therefore, given its traditional focus on “collateral” environmental impacts and
benefits, Step 4 of the BACT analysis seems well-suited to enable permitting authorities to
consider the potential sequestration of carbon in biogenic resources outside the boundaries of the
facility when evaluating BACT for greenhouse gases. This approach was reinforced by CFI
comments, which emphasized the importance of reconciling the focus of the PSD and Title V
program regulations on the amount of emissions released from each individual facility with the
role that land-based sequestration may play in mitigating the net atmospheric GHG impact of
emissions from individual sources. Because other pollutants and non-CO2 GHGs do not
participate in natural biogeochemical carbon cycles to the same extent that CO2 does, this frame
of reference – in which the potential for sequestration outside the facility of pollutant subject to
the BACT analysis is considered as part of the environmental impacts at Step 4 – is not relevant
for those other pollutants.
In addition to using this frame of reference in which sequestration outside the boundaries
of the facility is considered, it may also be appropriate to consider broad categories of feedstocks
in terms of their net impact on atmospheric GHG stocks. A complete accounting of the net
atmospheric GHG impact of a facility utilizing particular feedstocks would rely on a case-by-
case, facility-specific assessment of the impact of the proposed facility. This type of facility-
specific approach would also likely be the most scientifically sound approach for assessing the
direct carbon cycle impact of specific biogenic fuels used at the facility, because there is inherent
variability in biological processes, as well as the variability in space and time common to
estimates of sequestration.
The BACT analysis should consider a variety of factors that may influence the net
amount of carbon added to the atmosphere from and utilization of bioenergy at a facility. An

22
important area of consensus from commenters on the CFI was the idea that feedstocks are
different, and that the net impact of bioenergy and other biogenic emissions is associated with
the feedstock that is used. The level of sequestration that occurs naturally on the landscape
without additional intervention can be considered the “business as usual” (BAU) case. In other
words, this level of sequestration (or emissions) will likely continue into the future without
additional action. For example, if enhanced plant growth causes sequestration to increase
beyond the level expected in the BAU case for that region, then more carbon will be taken out of
the atmosphere than expected in the BAU case. Similarly, if certain activities, such as logging,
are accelerated in a particular region over a certain period of time, and associated emissions are
thereby increased, then sequestration on land will decline and net atmospheric carbon stocks will
increase over the BAU case. For bioenergy and other biogenic CO2 emissions, where such a
wide variety of potential feedstocks exists, the BAU case might be considered the emissions that
“would have happened anyway.” Using this approach, a permitting authority would have to
assess the extent to which a policy action or an activity increases or reduces CO2 emissions
above or below what would have occurred in comparison to the BAU case. From the perspective
of bioenergy and other biogenic CO2 emissions , emissions that would have occurred regardless
of whether or not the facility captured the energy from the biofuel use or carried out the process
using biological material as a feedstock might demonstrate that the cost of additional pollutant
controls for CO2 emissions is not justified.
Land use change has a separate set of considerations under the BAU case. Specifically, if
the rate of transition of land use from forest to agricultural use were to increase over and above
that which occurred in the BAU case, and if this increase were attributable to market demand for
the bioenergy crop, then it would be possible that these emissions would be additional to the
23
emissions expected under BAU. In that situation, the BAU case is the non-bioenergy case, such
that the bioenergy use might result in increased atmospheric CO2 levels.
However, such a case-by-case analysis of the net atmospheric impact of biomass fuels
would likely be prohibitively time-consuming and complex for facilities and permitting
authorities. The information we have collected to this point indicates that at present, attempting
to determine the net carbon cycle impact of particular facilities combusting particular types of
biomass feedstocks would require extensive analysis and would therefore entail extensive
workload requirements. Further, additional detailed examination of science and technical issues
is needed to ensure that permitting authorities would be able to reasonably calculate and
implement accounting for the amount of GHG emissions above BAU in particular instances, or
to assure consistency among the calculation methodologies of the various permitting authorities.
Given the challenge of conducting a complete analysis for each permit application, a more
practical approach to accounting is needed. Absent this, the burden on permitting authorities is
likely to be overwhelming.
For at least one category of biomass feedstocks that may be used in energy production, it
does appear possible at this time to conclude that the atmospheric impact is negligible. Some
commenters on the CFI suggested that utilizing mill residue (e.g. sawdust, planar shavings, panel
trim) to generate energy, rather than leaving the residue to decompose, likely would not cause
emissions over and above that which would have taken place if the energy use did not occur.
Given that this material would have decomposed under natural circumstances in a short period of
time (e.g., 10-15 years) in the absence of utilization as bioenergy, this conclusion appears
credible.
24
In some cases, the use of biological material as a fuel would clearly reduce net
atmospheric CO2 stocks in comparison with BAU fossil fuel emissions. In these cases, requiring
permitting at this time, before conducting the detailed analysis required to develop an appropriate
accounting system for bioenergy and other biogenic sources, might actually discourage projects
that would have a net benefit for the atmosphere. For example, requiring permitting for facilities
seeking to generate energy from the combustion of dead trees, especially those killed due to a
widespread event like the mountain pine beetle epidemic (that would emit CO2 anyway through
natural decomposition), is likely to discourage the utilization of a readily available resource that
would clearly reduce CO2 emissions, in comparison with BAU fossil fuel-related emissions.
In November 2010, EPA said it would provide guidance containing qualitative
information on useful issues to consider with respect to biomass combustion, such as specific
feedstock types and trends in carbon stocks at different spatial scales (e.g. national, regional,
state). Upon further review, EPA has concluded that it requires further discussion with partners
and scientists both inside and outside the federal government, as well as engagement with an
independent scientific panel, before it can make more qualitative characterizations beyond the
one described above for residue material.
2. Economic impacts
As discussed earlier in this section, EPA has previously advised that the economic
impacts component of BACT analysis should focus on direct economic impacts calculated in
terms of cost effectiveness (dollars per ton of emission reduction). As noted in the 2010 GHG
Permitting Guidance, EPA recognizes that at present add-on controls for CO2 are generally
expensive technologies, largely because of the costs associated with CO2 capture and storage.
As with other electric generating facilities, these direct costs will generally make the price of

25
electricity from bioenergy used in conjunction with add-on control technologies for CO2
uncompetitive compared to electricity from plants with other GHG controls, such as bioenergy
alone.
In addition to the direct economic impacts component of the BACT analysis, permitting
authorities may also consider indirect economic impacts, including potential economic benefits.
Such indirect considerations may include economic growth and the availability of employment
opportunities generated within a particular region or community by the utilization of biomass
fuels. As EPA noted in the 2010 GHG Permitting Guidance, it is appropriate for permitting
authorities to account for the underlying objectives of federal and state policies to foster
expansion of renewable resources and promote biomass. Tax incentives are an example of such
policies. Where one of the underlying objectives of a tax incentive or other type of policy
promoting renewable energy or biomass utilization is to foster economic growth and create jobs
in particular area, this may be considered as a relevant indirect economic impact or benefit that
can be considered in Step 4 of a BACT analysis. Where selecting a particular option as BACT
would further the goals of such policy, this may form part of the basis for selecting that option as
BACT. Likewise, where the record shows that requiring a particular control option as BACT
would counteract, or work at cross purposes from, policies that are intended to promote
renewable energy and biomass, this may form part of the justification for eliminating an option
from further consideration at Step 4 of the BACT analysis.
Many federal and state policies, along with a number of regional efforts, are currently
underway to foster the expansion of renewable resources and promote bioenergy projects as a
way of addressing climate change, increasing domestic alternative energy production, enhancing
forest management and creating related employment opportunities. For example, the federal
26
Renewable Electricity Production Tax Credit, a per-kilowatt-hour tax credit for electricity
generated by qualified energy resources including biomass, was originally enacted by the Energy
Policy Act of 1992 (largely by amending the Internal Revenue Code of 1986). Numerous pieces
of federal legislation, the most recent being the American Recovery and Reinvestment Tax Act
of 2009, have since been passed to extend certain related expiring tax provisions and expand the
scope of qualified biomass feedstocks, with the duel aims of domestic job creation and economic
stabilization.38,39 Such policies can improve the economy, especially in rural communities, by
generating jobs, income, and taxes through demand for local biogenic resources and construction
of bioenergy conversion facilities. Specifically, an improved market for biogenic fuels and forest
land could affect economic stabilization through increased incomes (from new jobs), higher local
tax base and possibly through the diversification of local energy sources, and increased
competition could lower energy prices.
As another example of such economic impacts, the Record of Decision for the Biomass
Crop Assistance Program (BCAP) –a program created by the 2008 Farm Bill that provides
financial assistance to biomass conversion facilities and owners of agricultural and non-industrial
private forest land who wish to establish, produce, and deliver biomass feedstocks – estimated
the total economic impact from broad BCAP implementation to include $88.5 billion in related
economic activity and the creation of nearly 700,000 jobs.40 Other potential indirect economic
considerations from biomass utilization as BACT could include, but are not limited to, increased
38
American Recovery and Reinvestment Tax Act of 2009. The Library of Congress.
http://thomas.loc.gov/home/h1/Recovery_Bill_Div_B.pdf 39
H. R. 1424 Emergency Economic Stabilization Act of 2008. The Library of Congress. http://thomas.loc.gov
H. R. 4520 American Jobs Creation Act of 2004. The Library of Congress. http://thomas.loc.gov
H. R. 3090 Job Creation and Worker Assistance Act of 2002. The Library of Congress. http://thomas.loc.gov 40
USDA Farm Service Agency. 2010. www.apfo.usda.gov/FSA
Programmatic Environmental Impact Statement for the Biomass Crop Assistance Program. 2010. http://public.geo-
marine.com/report.aspx?id=26

27
demand for traditional or new biogenic crops and reduced disposal costs for biogenic materials
that would otherwise be landfilled or destroyed.
3. Energy impacts
With respect to energy impacts, the BACT analysis should assess the relative energy
demands of the options under consideration for reducing emissions from the facility obtaining a
permit and may include an evaluation of impacts on fuel scarcity or a locally desired fuel mix in
a particular area. For bioenergy facilities, it is appropriate to broaden the scope of the energy
impacts analysis to consider policies that seek to promote diversity in fuels used in a local area,
within a state, or nationally.
A variety of federal and state policies have recognized that some types of biomass can be
part of a national strategy to reduce dependence on fossil fuels. Renewable fuels policies, which
in some cases provide incentives for the substitution of renewable fuels for fossil fuels, have not
traditionally been part of the BACT energy impacts analysis. However, consideration of
renewable energy policies could become part of the BACT analysis, especially if state policies
mandate the replacement of fossil fuel with biogenic fuel.41
In addition to numerous federal
programs, as of February 2011, 48 states have some kind of state-level financial or conservation
incentive program that includes biomass production and almost as many states have rules,
regulations or policies that promote bioenergy use.42 For example, certain states, such as
California43
, Washington,44
and Massachusetts45
have policies and programs to incentivize forest
41
See p. B.30 of the 1990 NSR Guidance, discussing locally scarce fuels. 42
Database of State Incentives for Renewables & Efficiency. Accessed February 1, 2011.
www.dsireusa.org/incentives/ 43
2009 Progress to a Plan: Bioenergy Action Plan for California. California Energy Commission. 2009.
www.energy.ca.gov/2010publications/CEC-500-2010-007/CEC-500-2010-007.PDF
Integrated Energy Policy Report. California Energy Commission. 2007. www.energy.ca.gov/2007publications/CEC-
100-2007-008/CEC-100-2007-008-CMF.PDF
28
management for biomass production. California, for example, as of 2009, has the technical
potential for 14.2 million bone dry tons a year available from forest residues.46
After trees are
harvested for timber, such forest residues are typically left in the forest or disposed of via open
burning because only timber of a certain quality can be used in lumber mills and other processing
facilities. An advantage of using forest residues for bioenergy production is that a collection
infrastructure is already in place to harvest the wood, it reduces the incidence of open burning
and provides an additional stream of revenue for forest owners. Programs and policies
established to meet the multiple goals of forest management plans -- to establish healthy and
naturally diverse forests with a balance between productive harvest and natural ecosystem and
wildlife health – can act as a foundation for sustainable bioenergy production.47
Conversely, if the proposed biogenic feedstock is scarce in the localized area of the
proposed project, then the scarcity of available fuel for the project might be an energy impact
suggesting that the proposed feedstock should not be selected as BACT.
C. Potential Conclusions in Step 4 Analysis
The considerations described above can support a conclusion that the exclusive
utilization of biomass fuel is BACT for greenhouse gases at a bioenergy facility. As discussed
above and in earlier EPA guidance, the costs of applying add-on pollution controls for
greenhouse gas emissions are expected to be expensive and thus would in most cases justify
Senate Bill (SB) 71. Economic Development: Sales And Use Tax Exclusions. Environmental Technology Project
California Alternative Energy and Advanced Transportation Financing Authority (CAEATFA).
www.treasurer.ca.gov/caeatfa/sb71/index.asp 44
Washington State Bioenergy Policy Framework. www.bioenergy.wa.gov/BiofuelIncentives.aspx 45
Massachusetts Green Power Purchasing Commitment, 2007, and Renewable Portfolio Standard. 2010.
www.dsireusa.org/incentives/index.cfm?EE=0&RE=1&SPV=0&ST=0&implementingsector=S&state=MA&technol
ogy=Biomass&sh=1
Act Related to Green Communities. Commonwealth of Massachusetts. 2008.
www.malegislature.gov/Laws/SessionLaws/Acts/2008/Chapter169 46
2009 Progress to a Plan: Bioenergy Action Plan for California. California Energy Commission. 2009.
www.energy.ca.gov/2010publications/CEC-500-2010-007/CEC-500-2010-007.PDF 47
California Forest Practice Rules. The California Department of Forestry and Fire Protection. 2011.
www.fire.ca.gov/resource_mgt/downloads/2011_FP_Rulebook_with_Diagrams_with_Tech_Rule_No_1.pdf.
29
elimination of this option based on direct economic impacts. However, EPA does not expect that
the projected cost of energy efficient technology will by itself justify eliminating this option for
biogenic CO2 emissions from consideration at bioenergy facilities. Nevertheless, where a
bioenergy facility is projected to provide the energy and economic benefits described above in
accordance with existing federal or state policies promoting utilization of biomass for energy
production, these considerations may justify selecting the option of exclusively using a biomass
fuel as BACT for biogenic CO2 emissions from a bioenergy facility. Furthermore, in the case of
residue material that would otherwise decompose in a 10-15 year time frame, the net carbon
cycle impact of this biomass fuel is expected to be negligible. Thus for a feedstock composed of
such residue material, the costs of applying strategies to reduce emissions from the facility do not
appear justified at this time because the carbon dioxide emissions from the individual facility
would not be increasing atmospheric impacts above the business as usual case. As discussed
above, additional information is needed before similar conclusions can be supported for other
types of biomass feedstocks, but EPA believes the energy and economic benefits of this fuel is
sufficient at this time to justify selecting biomass fuel as BACT for greenhouse gases without
further control.48
For facilities that are co-firing biomass with a primary fuel, the permitting record should
provide a reasoned justification for basing BACT for greenhouse gases on a specific proportional
48
This guidance is applicable to an assessment of BACT for greenhouse gases. When conducting a BACT analysis
for other regulated NSR pollutants at the type of source covered by this guidance, EPA recommends continuing to
focus on guidance EPA has previously provided on determining BACT using the top-down process. The
considerations described here, in terms of federal and state incentives for bioenergy production and sustainable
forest management, may still be relevant considerations in Step 4 of a top-down BACT analysis for another
regulated NSR pollutant, but these factors should be considered in the context of the particular pollutant for which
the BACT analysis is conducted. These considerations may not apply in the same manner to pollutants other than
GHGs, particularly where there is a more established record of the range of costs that have been acceptable in
previous BACT determinations for the pollutant.

30
allocation of fuels.49
The factors described above may be used to justify a higher proportional
allocation of biomass fuels as BACT (to the extent technically feasible) but not necessarily to
eliminate other strategies for reducing greenhouse gas emissions from a facility that utilizes
some proportion of fossil fuels. The costs of add-on pollution controls will still, in most cases,
justify eliminating this technology from a facility that utilizes biomass and another primary fuel
type. However, application of methods, systems, or techniques to increase energy efficiency
will remain a key GHG-reducing opportunity for facilities that utilize a significant proportion of
fossil fuels and cannot demonstrate the same degree of energy and economic benefits achieved
from the exclusive utilization of the biomass fuels, as described above. While some utilization
of biomass fuels will have some impact on reducing dependence on fossil fuels and promoting
economic growth in areas that supply biomass fuels, a small proportion of biomass fuel use may
not justify bypassing opportunities to reduce GHG emissions by improving energy efficiency at a
facility that still combusts a significant proportion of fossil fuels. However, when assessing the
proportional allocation for biomass and other fuel types at a co-fired energy facility, a permitting
authority may consider the relative benefit of using a greater proportion of biomass fuels and the
effect this may have on GHG emissions from an individual facility. Where a residue material is
utilized, any loss of energy efficiency attributable to the use of this type of biomass feedstock
may be offset by the absence of a significant net carbon cycle impact above the business as usual
case.
IX. Step 5 – Selecting BACT
49
See, In re: Northern Michigan University Ripley Heating Plant. PSD Appeal No. 08-02, Slip. Op at 18-23, 28
(EAB 2009) (remanding a permit for a co-fired electric generating facility where record did not contain justification
for establishing BACT limits based on specific proportional allocation of wood and coal).
31
When setting GHG emissions limitations for sources of biogenic CO2 emissions, one
should conduct the same evaluation as that described in the 2010 GHG Permitting Guidance.50
The permitting authority is responsible for defining the form of the BACT limits and making
them enforceable as a practical matter.51
In determining the form of the limit, the permitting
authority should consider issues such as averaging times and units of measurement.
For example, in the case of co-fired facilities, a final permit may include a standard that
specifies the proportional allocation of fuels to be used, thus limiting the options to the fuel mix
justified as BACT. When making sure the limit is practically enforceable, the permitting
authority must include information regarding the methods that will be used for determining
compliance with the limits (such as operational parameters, timing, testing methods, etc.) and
ensure that there is no ambiguity in the permit terms themselves.52
The permitting authority bears
the responsibility in Step 5 to fully justify the BACT decision in the permit record. Regardless of
the control level or feedstock proposed by the applicant as BACT, the ultimate determination of
BACT is made by the permitting authority.
50
2010 GHG Permitting Guidance at 45-47. 51
See generally EPA Guidance on Limiting Potential to Emit (PTE) in New Source Permitting (June 13, 1989),
available at http://www.epa.gov/reg3artd/permitting/t5_epa_guidance.htm. 52
In re Prairie State Generating Company, 13 E.A.D. at 83, 120.

32
Appendix: LULUCF data from the Inventory
Table 1: Carbon sequestered by LULUCF sinks as reported in the Inventory (Tg CO2 Eq.)53
, ranked in order of magnitude. Forest Land Remaining Forest Land has been further broken up into forest and harvested wood carbon pools.
IPCC Source Category LULUCF Sink 2008 *1990–2008 Average
Forest Land Remaining Forest Land
(Carbon Stock Changes)
Total Forest Sector C Stock Change (791.9) (688.0)
Forest (703.9) (576.7)
Aboveground Biomass (397.2) (373.5)
Soil Organic Carbon (145.9) (68.0)
Belowground Biomass (78.8) (74.1)
Litter (55.9) (35.8)
Dead Wood (26.2) (25.3)
Harvested Wood (88.0) (111.2)
SWDS (63.6) (63.7)
Products in Use (24.4) (47.6)
Settlements Remaining Settlements C Stock Changes in Urban Trees (93.9) (75.5)
Cropland Remaining Cropland Soil C Stock Changes for Mineral Soils (45.7) (51.5)
Land Converted to Grassland Soil C Stock Changes for Mineral Soils (25.1) (24.0)
Grassland Remaining Grassland Soil C Stock Changes in Mineral Soils (12.4) (23.3)
Other Changes in Yard Trimming and Food Scrap C
Stocks in Landfills (9.5) (13.6)
Gross Sequestration from LULUCF Sinks (978.5) (875.9)
* The U.S. Greenhouse Gas Inventories submitted to the UNFCCC provide annual estimates from 1990.
53
The Inventory of U.S. Greenhouse Gas Emissions and Sinks: 1990 –2008 (April 2010) and the archive of previous inventories are available online from the Environmental Protection Agency Inventory Report Web site, located at http://www.epa.gov/climatechange/emissions/usinventoryreport.html.

33
Table 2: Emissions from LULUCF sources as reported in the Inventory (Tg CO2 Eq.), ranked in order of magnitude.
IPCC Source Category LULUCF Source 2008 *1990–2008
Average
Cropland Remaining Cropland Soil C Stock Changes in Organic Soils 27.7 27.6
Forest Land Remaining Forest Land Non-CO2 Emissions from Forest Fires 21.7 15.7
Land Converted to Cropland Soil C Stock Changes for Mineral and Organic
Soils 5.9 2.8
Cropland Remaining Cropland Liming of Agricultural Soils 3.8 4.4
Cropland Remaining Cropland Urea Fertilization 3.8 3.1
Grassland Remaining Grassland Soil C Stock Changes in Organic Soils 3.7 3.7
Settlements Remaining Settlements Direct N2O Fluxes from Settlement Soils 1.6 1.2
Wetlands Remaining Wetlands CO2 and N2O Emissions from Peatlands
Remaining Peatlands 0.9 1.0
Land Converted to Grassland Soil C Stock Changes in Organic Soils 0.9 0.8
Forest Land Remaining Forest Land Direct N2O Emissions from Forest Soils 0.4 0.3
Gross Emissions from LULUCF Sources 70.4 60.6
* The U.S. Greenhouse Gas Inventories submitted to the UNFCCC provide annual estimates from 1990.
Related Documents


