DOT-VNTSC-RSPA-94-2 Guidance for Conducting Hazardous Materials Flow Surveys Final Report January 1995 U.S. Department of Transportation Prepared for the Research and Special Programs Administration Office of Hazardous Materials Safety John A. Volpe National Transportation Systems Center Research and Special Programs Administration Cambridge, MA 02142-1093 U.S. Department of Transportation Washington, D.C. 20590 U.S. Department of Transportation Research and Special Programs Administration

Welcome message from author
This document is posted to help you gain knowledge. Please leave a comment to let me know what you think about it! Share it to your friends and learn new things together.
Transcript
DOT-VNTSC-RSPA-94-2
Guidance for ConductingHazardousMaterials Flow Surveys
Final ReportJanuary 1995
U.S. Department of Transportation Prepared for theResearch and Special Programs Administration Office of Hazardous Materials SafetyJohn A. Volpe National Transportation Systems Center Research and Special Programs AdministrationCambridge, MA 02142-1093 U.S. Department of Transportation
Washington, D.C. 20590
U.S. Department ofTransportation
Research andSpecial ProgramsAdministration

NOTICEThis document is disseminated under the sponsorship of theDepartment of Transportation in the interest of information exchange. The United States Government assumes no liability for its contents oruse thereof.
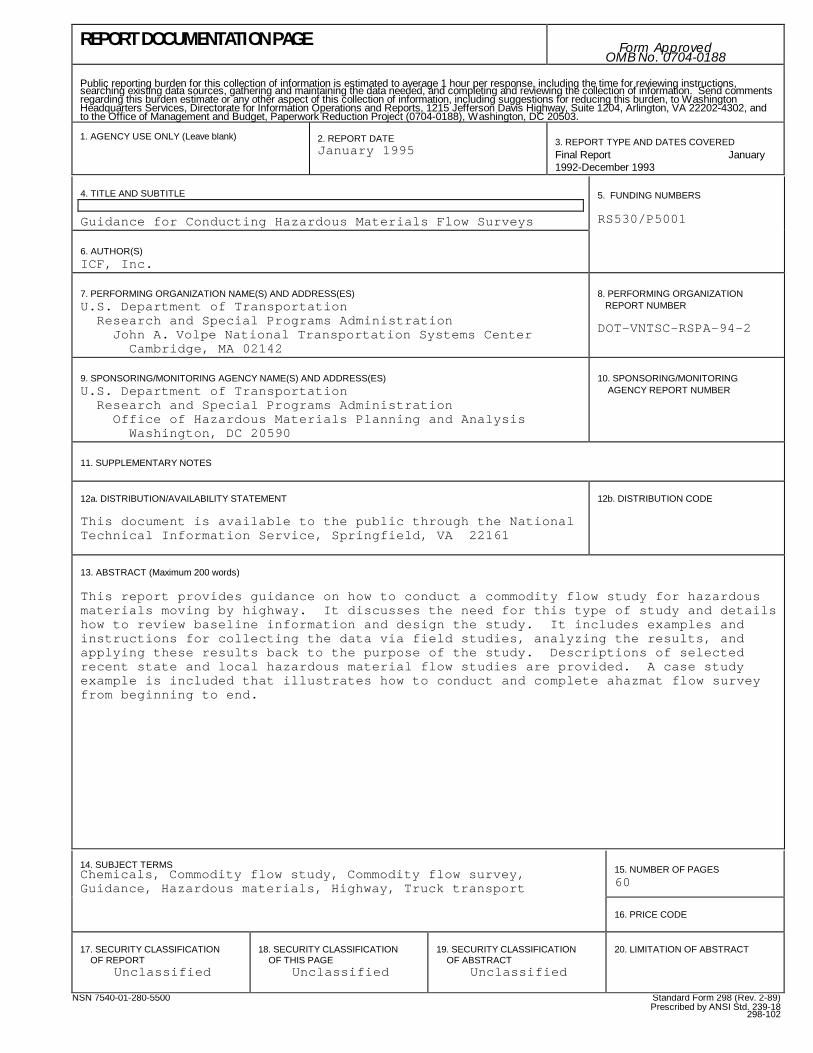
REPORT DOCUMENTATION PAGE Form ApprovedOMB No. 0704-0188
Public reporting burden for this collection of information is estimated to average 1 hour per response, including the time for reviewing instructions,searching existing data sources, gathering and maintaining the data needed, and completing and reviewing the collection of information. Send commentsregarding this burden estimate or any other aspect of this collection of information, including suggestions for reducing this burden, to WashingtonHeadquarters Services, Directorate for Information Operations and Reports, 1215 Jefferson Davis Highway, Suite 1204, Arlington, VA 22202-4302, andto the Office of Management and Budget, Paperwork Reduction Project (0704-0188), Washington, DC 20503.
1. AGENCY USE ONLY (Leave blank) 2. REPORT DATEJanuary 1995
3. REPORT TYPE AND DATES COVEREDFinal Report January1992-December 1993
4. TITLE AND SUBTITLE
Guidance for Conducting Hazardous Materials Flow Surveys
5. FUNDING NUMBERS
RS530/P5001
6. AUTHOR(S)ICF, Inc.
7. PERFORMING ORGANIZATION NAME(S) AND ADDRESS(ES)U.S. Department of Transportation Research and Special Programs Administration John A. Volpe National Transportation Systems Center Cambridge, MA 02142
8. PERFORMING ORGANIZATION REPORT NUMBER
DOT-VNTSC-RSPA-94-2
9. SPONSORING/MONITORING AGENCY NAME(S) AND ADDRESS(ES)U.S. Department of Transportation Research and Special Programs Administration Office of Hazardous Materials Planning and Analysis Washington, DC 20590
10. SPONSORING/MONITORING AGENCY REPORT NUMBER
11. SUPPLEMENTARY NOTES
12a. DISTRIBUTION/AVAILABILITY STATEMENT
This document is available to the public through the NationalTechnical Information Service, Springfield, VA 22161
12b. DISTRIBUTION CODE
13. ABSTRACT (Maximum 200 words)
This report provides guidance on how to conduct a commodity flow study for hazardousmaterials moving by highway. It discusses the need for this type of study and detailshow to review baseline information and design the study. It includes examples andinstructions for collecting the data via field studies, analyzing the results, andapplying these results back to the purpose of the study. Descriptions of selectedrecent state and local hazardous material flow studies are provided. A case studyexample is included that illustrates how to conduct and complete a hazmat flow surveyfrom beginning to end.
14. SUBJECT TERMSChemicals, Commodity flow study, Commodity flow survey,Guidance, Hazardous materials, Highway, Truck transport
15. NUMBER OF PAGES60
16. PRICE CODE
17. SECURITY CLASSIFICATION OF REPORT
Unclassified
18. SECURITY CLASSIFICATION OF THIS PAGE
Unclassified
19. SECURITY CLASSIFICATION OF ABSTRACT
Unclassified
20. LIMITATION OF ABSTRACT
NSN 7540-01-280-5500 Standard Form 298 (Rev. 2-89)Prescribed by ANSI Std. 239-18
298-102

iii
PREFACE
This report was prepared by the U.S. Department of Transportation=s Research andSpecial Programs Administration (RSPA), Volpe National Transportation SystemsCenter. The effort was supported by RSPA=s Office of Hazardous Materials Planningand Analysis under the Associate Administrator for Hazardous Materials Safety. Thisreport provides step-wise guidance for conducting commodity flow studies forhazardous materials moving by highway.
The technical advice of Joseph Nalevanko, Ann Mazzulo, and Richard Hannon ofRSPA is gratefully acknowledged.

iv
METRIC/ENGLISH CONVERSION FACTORS
ENGLISH TO METRIC METRIC TO ENGLISHLENGTH (APPROXIMATE) LENGTH (APPROXIMATE)
1 inch (in) = 2.5 centimeters (cm) 1 millimeter (mm) = 0.04 inch (in)1 foot (ft) = 30 centimeters (cm) 1 centimeter (cm) = 0.4 inch (in)
1 yard (yd) = 0.9 meter (m) 1 meter (m) = 3.3 feet (ft)
1 mile (mi) = 1.6 kilometers (km) 1 meter (m) = 1.1 yards (yd)
1 kilometer (km) = 0.6 mile (mi)
AREA (APPROXIMATE) AREA (APPROXIMATE)
1 square inch (sq in, in2) = 6.5 square centimeters(cm2)
1 square centimeter (cm2) = 0.16 square inch (sq in, in2)
1 square foot (sq ft, ft2) = 0.09 square meter (m2) 1 square meter (m2) = 1.2 square yards (sq yd, yd2)
1 square yard (sq yd, yd2) = 0.8 square meter (m2) 1 square kilometer (km2) = 0.4 square mile (sq mi, mi2)
1 square mile (sq mi, mi2) = 2.6 square kilometers(km2)
10,000 square meters (m2) = 1 hectare (ha) = 2.5 acres
1 acre = 0.4 hectare (he) = 4,000 square meters (m2)
MASS - WEIGHT (APPROXIMATE) MASS - WEIGHT (APPROXIMATE)
1 ounce (oz) = 28 grams (gm) 1 gram (gm) = 0.036 ounce (oz)
1 pound (lb) = 0.45 kilogram (kg) 1 kilogram (kg) = 2.2 pounds (lb)
1 short ton = 2,000 pounds (lb) = 0.9 tonne (t) 1 tonne (t) =1,000 kilograms (kg) = 1.1 short tons
VOLUME (APPROXIMATE) VOLUME (APPROXIMATE)
1 teaspoon (tsp) = 5 milliliters (ml) 1 milliliter (ml) = 0.03 fluid ounce (fl oz)1 tablespoon (tbsp) = 15 milliliters (ml) 1 liter (l) = 2.1 pints (pt)
1 fluid ounce (fl oz) = 30 milliliters (ml) 1 liter (l) = 1.06 quarts (qt)
1 cup (c) = 0.24 liter (l) 1 liter (l) = 0.26 gallon (gal)
1 pint (pt) = 0.47 liter (l)
1 quart (qt) = 0.96 liter (l)
1 gallon (gal) = 3.8 liters (l)
1 cubic foot (cu ft, ft3) = 0.03 cubic meter (m3) 1 cubic meter (m3) = 36 cubic feet (cu ft, ft3)
1 cubic yard (cu yd, yd3) = 0.76 cubic meter (m3) 1 cubic meter (m3) = 1.3 cubic yards (cu yd, yd3)
TEMPERATURE (EXACT) TEMPERATURE (EXACT)
[(x-32)(5/9)] °F = y °C [(9/5) y + 32] °C = x °F
QUICK INCH - CENTIMETER LENGTH CONVERSION10 2 3 4 5
InchesCentimeters 0 1 3 4 52 6 1110987 1312
v
QUICK FAHRENHEIT - CELSIUS TEMPERATURE CONVERSION -40° -22° -4° 14° 32° 50° 68° 86° 104° 122° 140° 158° 176° 194° 212°
°F
°C -40° -30° -20° -10° 0° 10° 20° 30° 40° 50° 60° 70° 80° 90° 100°
For more exact and or other conversion factors, see NIST Miscellaneous Publication 286, Units of Weights and Measures. Price $2.50 SDCatalog No. C13 10286 Updated 1/23/95
vi
TABLE OF CONTENTS
Chapter Page
1 INTRODUCTION ....................................................................................................................... 1
1.1 Need for Document ................................................................................................................... 1
1.2 Organization of Document......................................................................................................... 3
2 STEP-WISE GUIDANCE ........................................................................................................... 4
2.1 Identify Specific Purpose of Study............................................................................................. 4
2.2 Review Baseline Information ..................................................................................................... 6
2.2.1 Identify Roads Available for Hazardous MaterialsTransportation ............................................................................................................... 6
2.2.1.1 Local Statutes .................................................................................................. 72.2.1.2 High Performance Monitoring System (HPMS) ............................................. 7
2.2.2 Highway-Specific Information ...................................................................................... 7
2.2.2.1 Truck Flow....................................................................................................... 72.2.2.2 Accident History .............................................................................................. 92.2.2.3 Commodity Type........................................................................................... 11
2.3 Design the Study ....................................................................................................................... 13
2.3.1 Survey Locations ......................................................................................................... 132.3.2 Seasonal/Repetition .................................................................................................... 142.3.3 Personnel Needs......................................................................................................... 152.3.4 Study Design and Resources ..................................................................................... 15
2.4 Collect Original Data - Field Surveys ....................................................................................... 16
2.4.1 Data Collection Methods............................................................................................. 16
2.4.1.1 Placard Surveys ............................................................................................. 172.4.1.2 Review of Shipping Papers............................................................................ 172.4.1.3 Driver Interviews............................................................................................. 172.4.1.4 Facility Survey ................................................................................................ 19
2.4.2 Recording Procedures ................................................................................................ 19
2.5 Analyze results.......................................................................................................................... 21
2.5.1 Statistical Considerations ............................................................................................ 212.5.2 Implications for Study Design ..................................................................................... 25
vii
2.6 Apply Results to Purposes........................................................................................................ 26
TABLE OF CONTENTS(continued)
Chapter Page
3 STATE AND LOCAL SURVEYS............................................................................................. 28
3.1 Colorado.................................................................................................................................... 28
3.2 Idaho......................................................................................................................................... 29
3.3 Nevada ..................................................................................................................................... 29
3.4 Oregon...................................................................................................................................... 31
3.5 Virginia...................................................................................................................................... 32
3.6 Dallas Central Business District .............................................................................................. 32
3.7 Comparing Survey Experiences .............................................................................................. 34
4 CASE STUDY EXAMPLE........................................................................................................ 36
4.1 Identify Purpose of Study......................................................................................................... 36
4.2 Assemble Existing Information ................................................................................................ 36
4.3 Design Study ............................................................................................................................ 37
4.4 Conduct Study.......................................................................................................................... 37
4.5 Analyze Results ....................................................................................................................... 37
4.6 Apply Results to Purpose ........................................................................................................ 37
APPENDIX A DESCRIPTION AND OUTPUT OF A COMMODITY FLOW ALLOCATION MODEL(SRI International, 1993) ................................................................................................................. A-1
REFERENCES .......................................................................................................................................... R-1
8
LIST OF EXHIBITS
Exhibit Page
1 The International Hazard Classification System.............................................................................. 2
2 The Use of Data from a Commodity Flow Survey........................................................................... 5
3 Sources of Existing Data................................................................................................................... 8
4 Incidents Reported in HMIS............................................................................................................ 10
5 Addresses for Selected National Associations.............................................................................. 12
6 Information to be Recorded During Field Surveys ........................................................................ 16
7 Examples of Placards and Identification Numbers ....................................................................... 18
8 Advantages and Disadvantages of Various Data Recording Procedures.................................... 20
9 Hypothetical Constant Traffic Flow ................................................................................................ 21
10 Weekly Traffic Flow Pattern that is Random with No Seasonal Component............................... 22
11 Weekly Traffic Flow Pattern that is Random with a Seasonal Component ................................. 23
12 Confidence Intervals Versus Number Observed........................................................................... 24
13 Confidence Interval Versus Number of Observations................................................................... 25
14 Comparison of Findings of Five Truck Traffic Surveys andStatistics from Public Use Federal Data Bases............................................................................. 35
15 Results of Hypothetical Truck Traffic Survey ................................................................................ 38
A-1 List of 147 Large Volume Chemicals............................................................................................ A-3
A-2 1-Butanol Flows by Highway ......................................................................................................... A-6
A-3 Dodecene-1 Flows by Highway..................................................................................................... A-7
A-4 Phosphorus Pentasulfide Flows by Highway................................................................................ A-8
9
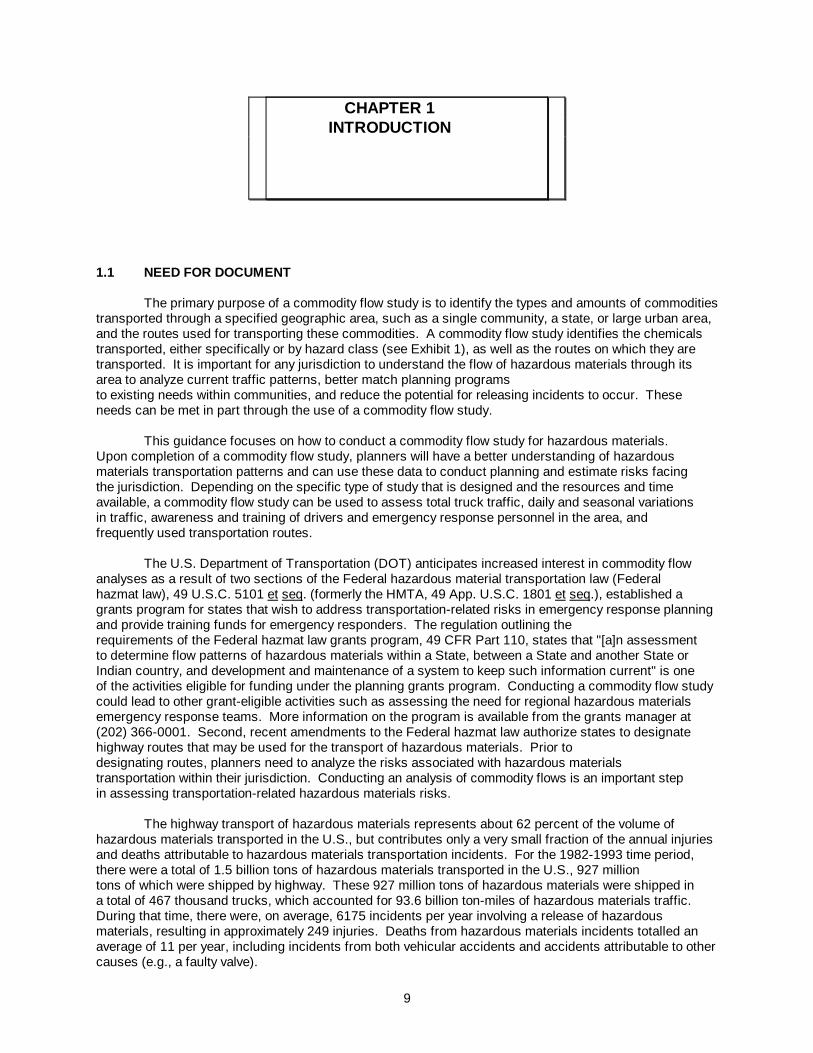
1.1 NEED FOR DOCUMENT
The primary purpose of a commodity flow study is to identify the types and amounts of commoditiestransported through a specified geographic area, such as a single community, a state, or large urban area,and the routes used for transporting these commodities. A commodity flow study identifies the chemicalstransported, either specifically or by hazard class (see Exhibit 1), as well as the routes on which they aretransported. It is important for any jurisdiction to understand the flow of hazardous materials through itsarea to analyze current traffic patterns, better match planning programsto existing needs within communities, and reduce the potential for releasing incidents to occur. Theseneeds can be met in part through the use of a commodity flow study.
This guidance focuses on how to conduct a commodity flow study for hazardous materials. Upon completion of a commodity flow study, planners will have a better understanding of hazardousmaterials transportation patterns and can use these data to conduct planning and estimate risks facingthe jurisdiction. Depending on the specific type of study that is designed and the resources and timeavailable, a commodity flow study can be used to assess total truck traffic, daily and seasonal variationsin traffic, awareness and training of drivers and emergency response personnel in the area, andfrequently used transportation routes.
The U.S. Department of Transportation (DOT) anticipates increased interest in commodity flowanalyses as a result of two sections of the Federal hazardous material transportation law (Federalhazmat law), 49 U.S.C. 5101 et seq. (formerly the HMTA, 49 App. U.S.C. 1801 et seq.), established agrants program for states that wish to address transportation-related risks in emergency response planningand provide training funds for emergency responders. The regulation outlining therequirements of the Federal hazmat law grants program, 49 CFR Part 110, states that "[a]n assessmentto determine flow patterns of hazardous materials within a State, between a State and another State orIndian country, and development and maintenance of a system to keep such information current" is oneof the activities eligible for funding under the planning grants program. Conducting a commodity flow studycould lead to other grant-eligible activities such as assessing the need for regional hazardous materialsemergency response teams. More information on the program is available from the grants manager at(202) 366-0001. Second, recent amendments to the Federal hazmat law authorize states to designatehighway routes that may be used for the transport of hazardous materials. Prior todesignating routes, planners need to analyze the risks associated with hazardous materialstransportation within their jurisdiction. Conducting an analysis of commodity flows is an important stepin assessing transportation-related hazardous materials risks.
The highway transport of hazardous materials represents about 62 percent of the volume ofhazardous materials transported in the U.S., but contributes only a very small fraction of the annual injuriesand deaths attributable to hazardous materials transportation incidents. For the 1982-1993 time period,there were a total of 1.5 billion tons of hazardous materials transported in the U.S., 927 milliontons of which were shipped by highway. These 927 million tons of hazardous materials were shipped ina total of 467 thousand trucks, which accounted for 93.6 billion ton-miles of hazardous materials traffic. During that time, there were, on average, 6175 incidents per year involving a release of hazardousmaterials, resulting in approximately 249 injuries. Deaths from hazardous materials incidents totalled anaverage of 11 per year, including incidents from both vehicular accidents and accidents attributable to othercauses (e.g., a faulty valve).
CHAPTER 1INTRODUCTION

10
EXHIBIT 1THE INTERNATIONAL HAZARD CLASSIFICATION SYSTEM
Of the 1.5 billion tons of hazardous materials transported, the majority represent a small subsetof hazardous materials and hazard classes. Almost 50 percent of the shipments were gasoline andpetroleum products, and approximately 13 percent were chemicals. By decreasing total volume (tons), themajor hazard classes/divisions shipped were Class 3 (flammable and combustible liquids), Division6.1 (poison B), Division 2.3 (poison A), Division 2.1 (flammable compressed gases), and Division 4.1(flammable solids); by decreasing volume shipped per ton-mile, the hazard classes/divisions were Class 3(flammable and combustible liquids), Division 6.1 (poison B), Division 4.1 (flammable solids), andClass 8 (corrosives).
A model was recently developed in a study for DOT's Research and Special ProgramsAdministration (RSPA) to allocate commodity flows between producers and consumers. The study wasintended to determine whether secondary data sources used in a model could provide estimates oftruck movements in the absence of specific data. Using the model, truck movements were estimatedfor three chemicals, dodecene-1, phosphorus pentasulfide, and 1-butanol. These chemicals were selectedfrom a list of 147 large-volume chemicals that were identified as accounting for at least 80 percent of truckshipments of hazardous chemicals in the United States. Appendix A of this document provides a briefdescription of the model, a list of the 147 large-volume chemicals, brief overviews of the three chemicalsassessed, and graphic displays of the model output for these three chemicals. The results of the threechemicals presented in Appendix A are preliminary. Revised results, which will be presented in subsequentindividual reports on the three chemicals, may differ from those reported in Appendix A.
Although such a model may be useful for predicting national trends, state movements ofhazardous chemicals can be determined more accurately using a commodity flow study. This guide isintended to assist states in understanding the purposes and uses of commodity flow studies, and to
Class numbers represent general categories of chemicals; some classes are further segmentedinto several divisions to provide a more accurate description of the hazard. Class or division numbers aredisplayed in the bottom of placards or in the hazardous materialsdescription on shipping papers. Class numbers have the following meanings:
Class 1 Explosive
Class 2 Gas
Class 3 Flammable and
Class 4 Flammable Solid; SpontaneouslyCombustible Material; Dangerous WhenWet Material
Class 5 Oxidizer and Organic Peroxide
Class 6 Poisonous Material and InfectiousSubstance
Class 7 Radioactive Material
Class 8 Corrosive Material
Class 9 Miscellaneous Hazardous Material
xi
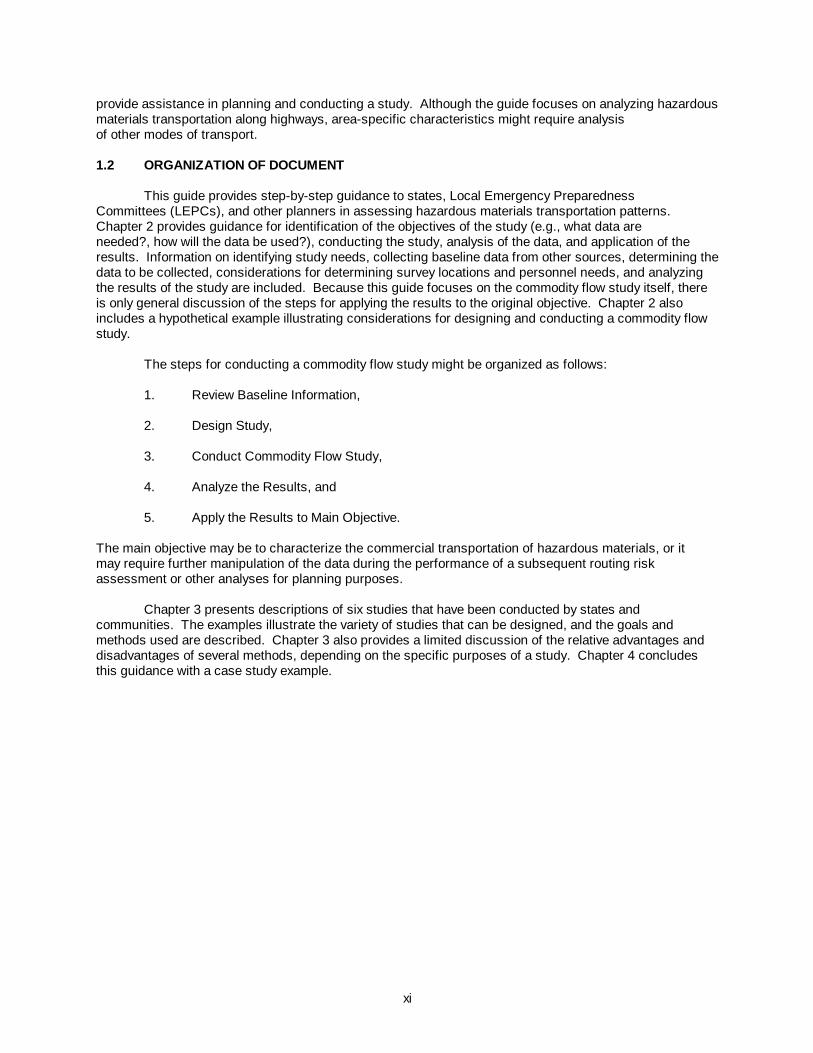
provide assistance in planning and conducting a study. Although the guide focuses on analyzing hazardousmaterials transportation along highways, area-specific characteristics might require analysisof other modes of transport.
1.2 ORGANIZATION OF DOCUMENT
This guide provides step-by-step guidance to states, Local Emergency PreparednessCommittees (LEPCs), and other planners in assessing hazardous materials transportation patterns. Chapter 2 provides guidance for identification of the objectives of the study (e.g., what data areneeded?, how will the data be used?), conducting the study, analysis of the data, and application of theresults. Information on identifying study needs, collecting baseline data from other sources, determining thedata to be collected, considerations for determining survey locations and personnel needs, and analyzingthe results of the study are included. Because this guide focuses on the commodity flow study itself, thereis only general discussion of the steps for applying the results to the original objective. Chapter 2 alsoincludes a hypothetical example illustrating considerations for designing and conducting a commodity flowstudy.
The steps for conducting a commodity flow study might be organized as follows:
1. Review Baseline Information,
2. Design Study,
3. Conduct Commodity Flow Study,
4. Analyze the Results, and
5. Apply the Results to Main Objective.
The main objective may be to characterize the commercial transportation of hazardous materials, or itmay require further manipulation of the data during the performance of a subsequent routing riskassessment or other analyses for planning purposes.
Chapter 3 presents descriptions of six studies that have been conducted by states andcommunities. The examples illustrate the variety of studies that can be designed, and the goals andmethods used are described. Chapter 3 also provides a limited discussion of the relative advantages anddisadvantages of several methods, depending on the specific purposes of a study. Chapter 4 concludesthis guidance with a case study example.
4
CHAPTER 2STEP-WISE GUIDANCE
2.1 IDENTIFY SPECIFIC PURPOSE OF STUDY
A commodity flow study is the collection of data on transportation patterns within a jurisdiction. There are a variety of activities and survey methods that can be used to perform a commodity flow survey; many include a road-side survey where truck data (e.g., placard type, UN/NA commodity number, route used, truck type) are recorded and some form of driver interview is conducted. Depending on the methods used and goals of the study, some subset of the information listed below can be gathered for a particular hazardous materials commodity flow study:
< Major traffic corridors used.
< Primary origin and destination locations.
< Primary hazard classes transported.
< Actual materials transported.
< Hazardous materials tonnages shipped.
< Number of hazardous materials trucks.
< Fraction of hazardous materials traffic in all truck traffic.
< Truck types used for hazardous materials.
< Container types used for hazardous materials.
< Driver training and awareness.
< Degree of regulatory compliance.
< Peak transportation times and days.
< Seasonal transportation variations.
A jurisdiction will have specific objectives for conducting a commodity flow study based on itsparticular needs; frequently, a commodity flow study is only one element of a larger study, such as ahazardous materials routing analysis. Most larger studies will require the use of numerous data sources,with the commodity flow study providing a characterization of the traffic and hazardous materials flowswithin a jurisdiction. There are many other sources of data that can be used in conjunction with the datafrom a commodity flow study, including databases that provide information on a local, statewide,regional, or national basis, as well as industry associations and state and local planning organizations;potentially available data may include population data, annual accident type and location data, andannual average shipments by hazard class/division.
Exhibit 2 illustrates the interplay of data for a larger study. Both data from a commodity flowstudy and other sources may be required; in addition, either data set can be used to enhance the other. For example, statewide accident data can be used to identify routes to be surveyed in a commodity flowstudy. Likewise, an estimate of the average hazardous materials transportation from a commodity flow
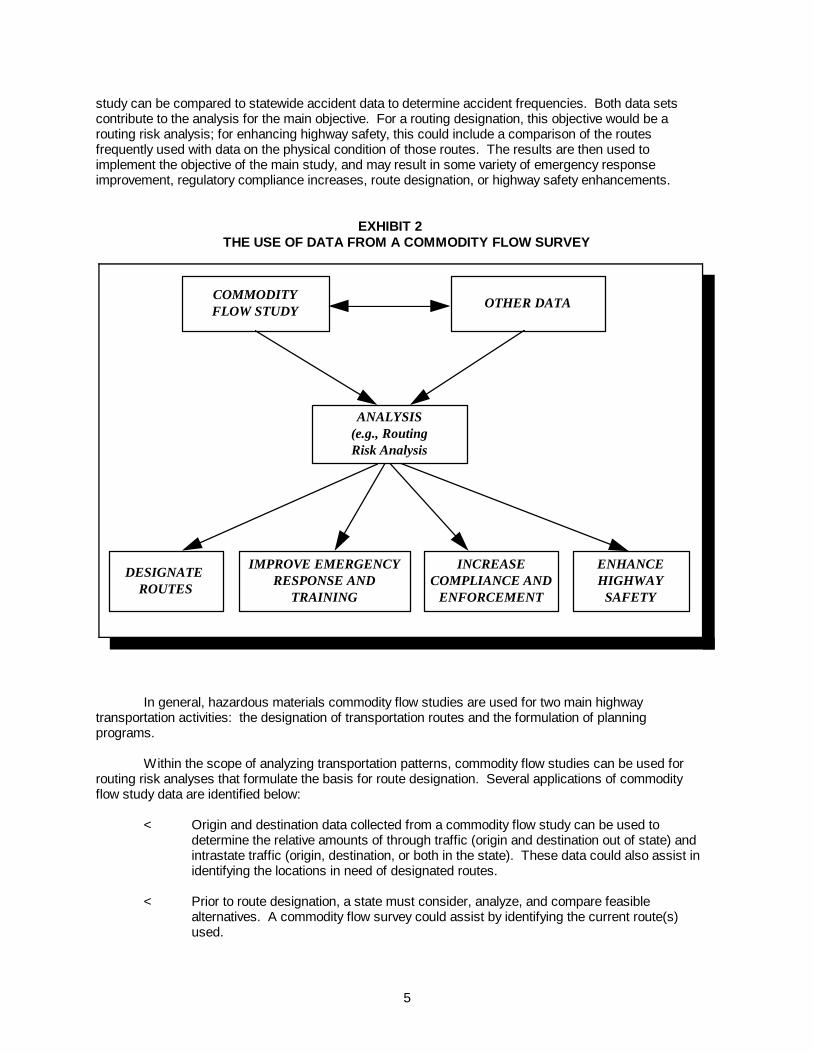
5
OTHER DATACOMMODITYFLOW STUDY
INCREASECOMPLIANCE AND
ENFORCEMENT
IMPROVE EMERGENCYRESPONSE AND
TRAINING
DESIGNATE ROUTES
ANALYSIS(e.g., RoutingRisk Analysis
ENHANCEHIGHWAY
SAFETY
study can be compared to statewide accident data to determine accident frequencies. Both data setscontribute to the analysis for the main objective. For a routing designation, this objective would be arouting risk analysis; for enhancing highway safety, this could include a comparison of the routesfrequently used with data on the physical condition of those routes. The results are then used toimplement the objective of the main study, and may result in some variety of emergency responseimprovement, regulatory compliance increases, route designation, or highway safety enhancements.
EXHIBIT 2THE USE OF DATA FROM A COMMODITY FLOW SURVEY
In general, hazardous materials commodity flow studies are used for two main highwaytransportation activities: the designation of transportation routes and the formulation of planningprograms.
Within the scope of analyzing transportation patterns, commodity flow studies can be used forrouting risk analyses that formulate the basis for route designation. Several applications of commodityflow study data are identified below:
< Origin and destination data collected from a commodity flow study can be used todetermine the relative amounts of through traffic (origin and destination out of state) andintrastate traffic (origin, destination, or both in the state). These data could also assist inidentifying the locations in need of designated routes.
< Prior to route designation, a state must consider, analyze, and compare feasiblealternatives. A commodity flow survey could assist by identifying the current route(s)used.
6
< Data from a commodity flow study on the types and quantities of materials carried couldbe used in the consequence assessment component of a routing risk analysis.
Within the scope of planning, a commodity flow study can contribute to an analysis of currentprograms and help in assessing future needs. Specific examples are identified below:
< Used with data on equipment distribution, training and preparedness of responsepersonnel, and accident rates, data on driver training and compliance from a commodityflow study could assist in identification of training needs and staffing requirements foremergency responders and strategic deployment of hazardous materials responseteams.
< A commodity flow study could provide data on the hazard classes and individualhazardous materials being transported through the state; these data could pinpointspecific, extremely high-risk chemicals that require specific training or preparednessefforts.
< Many commodity flow studies include a review of shipping papers to identify shipmentcontent and destination. This information, compared to Federal, state, and localregulations, could assist in determining rates of shipper compliance with hazardousmaterials transportation regulations.
< Data from a commodity flow study on frequency of route usage could be used withaccident and roadway conditions data to assist in allocating resources for such measuresas highway improvements that enhance public safety.
< The commodity flow data could be compiled to provide an average daily or annualprofile of commercially transported hazardous materials in the jurisdiction. These datacould provide the jurisdiction with baseline data that, compared with data from multiplesampling events, could highlight changing transportation patterns and needs.
These goals do not cover the entire range of objectives for which hazardous materialscommodity flow studies can be used. However, these examples can be used as a starting point toillustrate the variety of ways in which data from a commodity flow study can be used to fulfill the datarequirements for larger analyses.
2.2 REVIEW BASELINE INFORMATION
To select routes to focus on during the study, it is important to determine which roads within ageographic area are capable of supporting hazardous materials and to identify the amounts and types ofmaterials that are being transported over those roads. The information sources discussed in this sectionsupport this determination.
2.2.1 Identify Roads Available for Hazardous Materials Transportation
By determining which roads are physically accessible for hazardous materials transportation, thescope of the commodity flow study can be narrowed. Identification of the routes that are capable ofcarrying hazardous materials can be completed fairly quickly by examining state and county maps, roadatlases produced for the trucking industry, and familiarity with the study area. Rand McNally publishesan atlas that shows the legal weight truck route system in each state; communities located on one ofthese routes can be fairly certain that hazardous materials, particularly gasoline, are passing through at some point during the year. Updated annually, the Motor Carrier's Road Atlas is available at retail outletsor by calling Rand McNally at (800) 284-6565.

7
2.2.1.1 Local Statutes
8
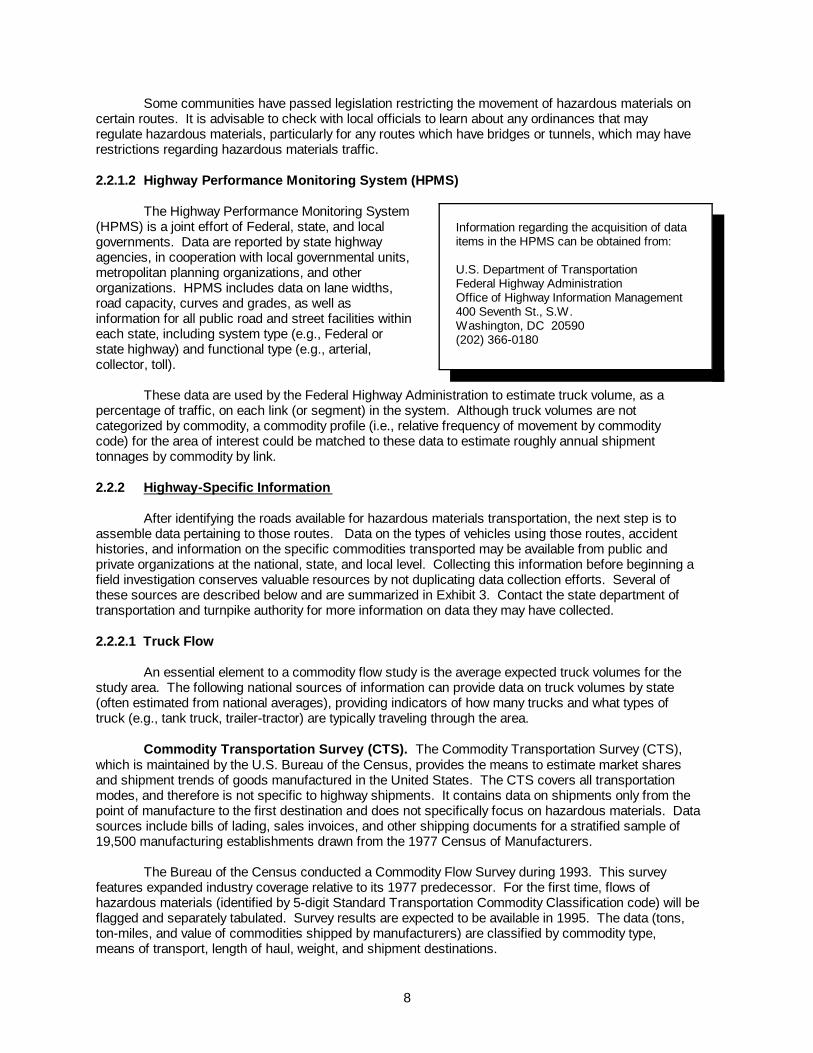
Information regarding the acquisition of dataitems in the HPMS can be obtained from:
U.S. Department of TransportationFederal Highway AdministrationOffice of Highway Information Management400 Seventh St., S.W.Washington, DC 20590(202) 366-0180
Some communities have passed legislation restricting the movement of hazardous materials oncertain routes. It is advisable to check with local officials to learn about any ordinances that mayregulate hazardous materials, particularly for any routes which have bridges or tunnels, which may haverestrictions regarding hazardous materials traffic.
2.2.1.2 Highway Performance Monitoring System (HPMS)
The Highway Performance Monitoring System(HPMS) is a joint effort of Federal, state, and localgovernments. Data are reported by state highwayagencies, in cooperation with local governmental units,metropolitan planning organizations, and otherorganizations. HPMS includes data on lane widths,road capacity, curves and grades, as well asinformation for all public road and street facilities withineach state, including system type (e.g., Federal orstate highway) and functional type (e.g., arterial,collector, toll).
These data are used by the Federal Highway Administration to estimate truck volume, as apercentage of traffic, on each link (or segment) in the system. Although truck volumes are notcategorized by commodity, a commodity profile (i.e., relative frequency of movement by commoditycode) for the area of interest could be matched to these data to estimate roughly annual shipmenttonnages by commodity by link.
2.2.2 Highway-Specific Information
After identifying the roads available for hazardous materials transportation, the next step is toassemble data pertaining to those routes. Data on the types of vehicles using those routes, accidenthistories, and information on the specific commodities transported may be available from public andprivate organizations at the national, state, and local level. Collecting this information before beginning afield investigation conserves valuable resources by not duplicating data collection efforts. Several ofthese sources are described below and are summarized in Exhibit 3. Contact the state department oftransportation and turnpike authority for more information on data they may have collected.
2.2.2.1 Truck Flow
An essential element to a commodity flow study is the average expected truck volumes for thestudy area. The following national sources of information can provide data on truck volumes by state(often estimated from national averages), providing indicators of how many trucks and what types oftruck (e.g., tank truck, trailer-tractor) are typically traveling through the area.
Commodity Transportation Survey (CTS). The Commodity Transportation Survey (CTS),which is maintained by the U.S. Bureau of the Census, provides the means to estimate market sharesand shipment trends of goods manufactured in the United States. The CTS covers all transportationmodes, and therefore is not specific to highway shipments. It contains data on shipments only from thepoint of manufacture to the first destination and does not specifically focus on hazardous materials. Datasources include bills of lading, sales invoices, and other shipping documents for a stratified sample of19,500 manufacturing establishments drawn from the 1977 Census of Manufacturers.
The Bureau of the Census conducted a Commodity Flow Survey during 1993. This surveyfeatures expanded industry coverage relative to its 1977 predecessor. For the first time, flows ofhazardous materials (identified by 5-digit Standard Transportation Commodity Classification code) will beflagged and separately tabulated. Survey results are expected to be available in 1995. The data (tons,ton-miles, and value of commodities shipped by manufacturers) are classified by commodity type,means of transport, length of haul, weight, and shipment destinations.
9
Databases and Other Statistical Reports
Commodity Transportation Survey ! Total U.S. flow of each hazardous material by volumeshipped
HPMS/FHWA ! Approximate state total truck miles
Truck Inventory and Use Survey ! Hazardous materials carried by trucks registered in state
HMIS ! Hazardous material transportation accident type and location data
Safety Net (OMC 50-T) - Accident information including carrier identification, location, andcargo description
LEPCs and Other Planning Groups
Data provided through TRANSCAER
Substances that originate and terminate locally
Quantities stored locally
Existing Studies
Findings of studies in neighboring or other states
SRI Study (See Appendix A)
Forms for ordering CTS and TIUS reportscan be obtained from Department ofCommerce district offices or from:
Customer Services BranchData User Services DivisionU.S. Bureau of the CensusWashington, DC 20233(301) 763-7662
EXHIBIT 3SOURCES OF EXISTING DATA
Truck Inventory and Use Survey (TIUS). The Truck Inventory and Use Survey (TIUS) ismaintained by the U.S. Bureau of the Census, and is part of the Census of Transportation which isconducted once every 5 years. Reports for 1977, 1982 and 1987 are currently available; the 1992 report is expected to be published early in 1995. The TIUS provides data on the physical and operational characteristics of the nation's trucks. Also, hazardous materials truck miles by state areprovided. Truck type and truck-mile data for hazardous shipments are included, but origin and destination data are not.
The TIUS contains such information as:
< Physical characteristics of eachvehicle.
< Operator class.

10
HMIS data for a single year can be obtained ondiskette; additional data may require the use ofopen reel tape. For more information, contact:
U.S. Department of TransportationResearch and Special Programs AdministrationInformation Systems Unit, DHM-63, Room 8112400 Seventh Street, S.W.Washington, D.C. 20590(202) 366-4555
< Annual mileage and range of operation.
< Percentage of miles operated in home state.
< Commodities carried by hazard class.
< Percentage of travel miles accounted for by hazardous materials shipments.
Published data from the above two surveys are also available on computer tapes that containdiscrete rather than summary data. Depending upon the goals of a study and the quality of dataavailable, the discrete data may be more useful and reduce unnecessary repetitive research.
2.2.2.2 Accident History
Another important data set is the determination of the number, location, and types of accidentsoccurring in the survey area. The historical record of local transportation accidents and incidents isuseful because many carriers are consistent in their routing practices. In other words, if an accidentinvolving a specific substance, occurred during shipment from an origin to a destination, the same routeis probably still being used for shipments of that substance, and probably for shipments to other points aswell. Even in the absence of detailed records, valuable information can be obtained from newspaperfiles, from state and local police reports, and from interviews with local emergency responders. Thefollowing sources can provide information on highway releases of hazardous materials as well asaverage accident rates.
Hazardous Materials IncidentReporting System (HMIS). The HazardousMaterials Incident Reporting System (HMIS)became the official Federal record keepingsystem for hazardous materials release datasince 1971, and is maintained by the U.S.Department of Transportation. A release isdefined as an unintentional release of ahazardous material during or in connectionwith its transport. All rail, truck, non-bulk waterand air releases occurring during interstatecommerce are covered by the HMIS. However, intrastate highway and bulk marinetransport are excluded. 49 CFR Sec. 171.16 requires detailed, written hazardous materials incidentreports to be submitted, within 30 days of the date of the incident, to the Department of Transportationfor each incident that occurs during the course of transportation (including loading, unloading, andtemporary storage). HMIS allows isolation of incidents involving specific hazardous materials. Approximately 182,000 records were in the file as of December, 1990. Required reporting categories arelisted in Exhibit 4.
The HAZMAT (incident record) file includes information about the incident and hazardousmaterial(s) involved. A second file, the HAZCON file, reports details about the hazardous material
container(s) involved in each accident (e.g., container type, container capacity, number of failedcontainers, label or placard, cause of failure).
EXHIBIT 4INCIDENTS REPORTED IN HMIS

11
As the direct result of the presence of hazardous materials:
< A person is killed or receives injuries requiring hospitalization.
< Estimated carrier or other property damage exceeds $50,000.
< An evacuation of the general public occurs lasting one hour or more.
< One or more major transportation arteries or facilities are closed or shut down for one hour ormore.
< The operational flight pattern or routine of an aircraft is altered.
< Fire, breakage, spillage, or suspected radioactive contamination occurs involving shipment ofradioactive material or etiologic agents.
< A situation exists of such a nature that, in the judgment of the carrier, it should be reported to theDepartment even though it does not meet specific criteria of these categories.
< There has been an unintentional release of hazardous materials from a package (including a tank).
< Any quantity of hazardous waste has been discharged during transportation.
The 50-T file is available on open reel tape. TheSafety Net file is available upon written request. Details may be obtained from:
U.S. Department of TransportationFederal Highway AdministrationOffice of Motor Carriers400 Seventh Street, S.W.Washington, D.C. 20590Contact: Linda Giles(202) 366-2971
In addition, commercial sources have preparedreports (on a state or national basis) that present andanalyze OMC 50-T data.
Office of Motor Carriers. Since 1973, the U.S. Department of Transportation, Federal HighwayAdministration, Office of Motor Carriers (OMC) (formerly the Bureau of Motor Carrier Safety) hasmaintained a database of accidents involvingmotor carriers of property.
From 1973 to 1993, accidents werereported to the OMC and reports were filed onForm 50-T. A "reportable accident" was anoccurrence involving a motor vehicleengaged in the interstate, foreign, orintrastate operations of a motor carrier thatresulted in:
< The death of a human being.
< Bodily injury to a person who,as a result of the injury,immediately receives medicaltreatment away from thescene of the accident.
< Total damage to all property that aggregates to $4,400 or more based upon actual costsor reliable estimates.
From 1973 to 1985 the minimum property damage threshold for reporting was $2,000. Theminimum damage threshold was raised to $4,200 in January 1986 and to $4,400 in March 1987.
Form 50-T requested carrier identification and address, location of the incident, characteristics ofthe event, cause, information on the cargo, and consequences of the accident. The carrier identification,cargo description, and certain accident characteristics were recorded, so that users of the HMIS
12
database and the OMC 50-T database might compare data on releases caused by vehicular accidents. In a small percentage of the records, the milepoint data was also included, resulting in more preciseaccident location determination. The 50-T accident file, which is no longer updated but still available,contains a hazardous materials flag that permits the isolation of vehicular accidents involving hazardousmaterials.
As of 1993, the OMC no longer collects the Form 50-T. The new Safety Net databasesupersedes the OMC 50-T database. Accident information from March of 1993 on is now collected bythe OMC from police accident reports and put into the Safety Net database. The reports includecommercial vehicles of 26,000 lbs. or more, that are involved in an accident resulting in a fatality, injury,or tow away. The OMC is collecting these reports from 40 states for the Safety Net database at thistime, and the remaining states should be included sometime during 1995.
2.2.2.3 Commodity Type
The above data sources on road type, truck volumes, and accident rates should provide ageneral overview of the average truck flow within the study area. Information on hazardous materialsvolumes, usually by hazard class, may also be collected (Exhibit 1 describes the DOT hazardclassification system). Planners should keep in mind that these data are general and often based onnational averages; this information, however, can help to focus further research on specific truck types orhazard classes passing through the study area. Data sources discussed in this section are for collectinginformation on hazard classes and specific commodities.
Determining specific or even general types of hazardous materials that are transported throughthe study area can be one objective of a commodity flow study. Keep in mind, however, that it may bevery difficult to identify every single chemical that passes through a jurisdiction. Depending on thenature and amount of hazardous materials traffic, it might be advisable to concentrate on determiningwhich general classes of chemicals (e.g., flammables, corrosives) are being transported. Plannersinvolved in a commodity flow study in the Kanawha Valley region of West Virginia (an area with anextremely high concentration of chemical manufacturers and shippers) learned that there were just toomany individual chemicals being transported through the region to study each in depth or to focusplanning efforts on each individually. They concentrated on determining general classes of chemicalsinstead. The following sections discuss several sources of existing information on commodity type.
Information Developed under SARA Title III. The reporting requirements of Title III of theSuperfund Amendments and Reauthorization Act of 1986 (SARA) have increased the information that isavailable about hazardous materials stored in fixed facilities; unfortunately, information on the transportof hazardous materials is neither required nor typically provided to Local Emergency PlanningCommittees (LEPCs). However, important information can be surmised from the materials submitted toLEPCs.
Information about substances used to produce the final products at a manufacturing plant can bea key indicator of local hazardous materials flow patterns. For example, a chemical plant producingnylon is likely to receive shipments of and/or store significant quantities of furan or furfural. Thesematerials, classified as flammable liquids, are used extensively in processing nylon and are frequentlytransported by road and rail. Thus, even though data provided by the plant to the LEPC may notexplicitly state that such process chemicals are being received from shippers, if they are not produced onsite, it may be assumed that they are transported to the plant.
Because each facility must submit information regarding the specific amounts of hazardousmaterials located on site, both the type and quantity of substances likely to be involved in locallyoriginating and terminating shipments are a matter of public record. LEPC(s) within the study area canprovide a list of facilities that report under SARA Title III, including specific substances used on site.
National Associations/Other Sources. Industry associations and other private organizationscan be an important resource for collecting existing information. Associations such as the American
13
American Trucking Associations2200 Mill RoadAlexandria, VA 22314703-838-1700
National Association of Chemical Distributors1101 17th Street, N.W.Suite 1200Washington, D.C. 20036202-296-9200
National Tank Truck Carriers Inc.2200 Mill RoadAlexandria, VA 22314703-838-1960
American Petroleum Institute1220 L Street, N.W.Washington, D.C. 20005202-682-8000
Chemical Manufacturers Association2501 M Street, N.W.Washington, D.C. 20037202-887-1100
International Bridge Tunnel and TurnpikeAssociation2120 L Street, N.W.Suite 305Washington, D.C. 20037 202-659-4620
Trucking Association, National Association of Chemical Distributors, National Tank Truck Carriers, theAmerican Petroleum Institute, the Chemical Manufacturers Association, and the International BridgeTurnpike and Tunnel Association (IBTTA) may be able to provide data, resources, and/or contacts in ajurisdiction to aid in commodity flow study efforts. Addresses and phone numbers for each of theseassociations is provided in Exhibit 5.
EXHIBIT 5ADDRESSES FOR SELECTED NATIONAL ASSOCIATIONS
State agencies can provide information on industries, transportation routes, accident histories,and other data within a specific geographic area. The state transportation department may be able toprovide information on transporters registered in-state, depending on state law. The state department ofenvironmental protection or natural resources as well as state and local health departments may be ableto provide information on known health risks and accident rates, as well as sensitive populations thatmay require protection (e.g., homes for the elderly, schools) during an incident. State economicdevelopment agencies or the state department of environmental protection may have data on facilitiesregistered in-state, including information on materials manufactured or stored on-site. Through the stateturnpike authority, the IBTTA can assist collecting original data.
Transportation Community Awareness and Emergency Response (TRANSCAER) is a nationwidecommunity outreach program developed by the Chemical Manufacturers Association (CMA) andimplemented by CMA-member firms that ship hazardous materials. Its purpose, in part, is to encouragepartnerships between citizens and industry to develop mutual understanding about the transport ofhazardous materials and to help community emergency planning groups identify hazardous materialsmoving through their communities. Industry representatives work with the LEPC and/or local respondersand planners to improve awareness and response capabilities by providing information and resources. Additional information can be obtained from CMA (see Exhibit 5).
2.3 DESIGN THE STUDY
By comparing the data collected from the sources discussed above with the project goals, itshould be possible to determine whether a field investigation should be undertaken. Because theexisting data may prove to be out of date or the study's goals might require more specific data than isalready available, it may be necessary to collect original data. For example, if the goal of the study is to
14
IDAHO - Peak Transportation Times . Idaho's riskassessment was conducted by surveying trucktraffic at eight sites. To obtain data representativeof weekly information, each location was surveyedfor three days, once in July, and once in August. Atotal of 46 survey events, all over three days of theweek (Sunday - Tuesday) occurred. Although thesurvey did not cover the entire week, the datagathered did allow initial conclusions to be madeabout which days and hours in the first part of theweek are peak transportation times. These datacan be useful for emergency response planningand scheduling.
quantify the level of awareness of drivers carrying specific high-risk chemicals, additional analysis and/orfield surveys that supplement existing data will probably be necessary.
2.3.1 Survey Locations
If a hazardous materials flow study canbe made part of a routine function, such as port-of-entry and weigh-station checks, collectingoriginal data can be minimally disruptive andless likely to burden the carrier. However, suchdata will largely reflect interstate movementsand may therefore miss sizable intrastateshipments.
Many states conduct random safetychecks of heavy trucks in transit through theirjurisdictions, occasionally utilizing rest stopsthat afford a safe location for extensivevehicular examination. Shipping paperinformation can be recorded during the safety examination. Because rest stops are distributedthroughout a state's highway network (though chiefly on the Interstate system), they are better thanpoints of entry or established weigh stations for surveying of intrastate movements. In general, surveyteams should set up wherever there are appropriate combinations of the following:
< High truck volumes.
< Adequate space for safe pullover and isolation of up to about five trucks fromthe flow of traffic.
< Good visibility along the highway, in the event it becomes necessary to allowtrucks to pass by because of long queues without recording shipping data. Inthis case, placards could still be read and noted.
< Absence of legal restrictions on survey activity.
< At least one other valid reason (e.g., cargo check, safety check, or weight check)for pulling the vehicle off the highway.
The study should keep in mind that truckers may evade the survey point either to save time or toconceal something. Alternate routes in a corridor are generally few in number and easy to identify. As acontingency, an individual should be stationed on each of these alternate routes to record the placards ofdrive-by trucks.
One type of easily accessible location for surveying trucks is points of entry, that is, state linecrossings. States commonly locate a rest area just before or after state line crossings. Establishing asurvey location at one or more of these rest areas (points of entry) would include trucks just as they wereentering or exiting the state, and could provide information on the percentages of trucks that are passing

15
NEVADA ! Links. By locating survey sitesthroughout the state and dividing the roads intolinks, Nevada was able to create an overview ofstatewide hazardous materials transportation. Toobtain an average daily profile of commerciallytransported commodities via Nevada's highwaysystem a total of 45 statewide informationcollection sites were used, including 19 points ofentry, scattered across the state. The routes weredivided into 95 "links" to track commoditymovement.
At the conclusion of the study, each of the 95 linkswas analyzed to determine the average dailyvolume of hazardous materials, and the links weremapped accordingly. Using links identifiesfrequencies along specific route segments, insteadof frequencies along an entire route, which canmisrepresent traffic volumes. The mapping methodemployed is also useful because it creates areference to identify at a glance the routes usedmost frequently, as well as the connector roads orsegments of roads used as feeders to the majorhighway system, without having to know andcompare exact volumes shipped over differentroutes.
OREGON ! Multiple survey events and seasons . Oregon spread its survey over eight months toidentify seasonal variations in transportation. Theentire survey was completed in three phases, overa total of 18 days consisting of periods that beganon a Monday or Tuesday at 12:01 am andcontinued for 72 hours (3 days). Phases one andtwo were conducted in March and August at sevensites outbound from Portland. In phase three,hazardous materials shipments entering Oregonthrough four border ports of entry were surveyedduring the third week of November.
The use of three survey periods assists inidentifying seasonal differences in truck traffic andhazardous materials shipments. Ideally, a surveyto identify seasonal variations would be done at thesame sites for each of the multiple events. Despitethe fact that Oregon's third phase was conducted atdifferent sites, the data from the seven sitessurveyed twice can be used to make initialconclusions about seasonal traffic variations.
through, importing to, or exporting materialsfrom the state. These locations would not,however, survey all truck shipments that bothoriginate and terminate within the state.
Depending on the purpose of the study,it may be useful to divide the routes beingstudied into segments or "links" to trackcommodity movements between specificpoints. Typically, this type of survey wouldrequire a large commitment of resources andwould be conducted for a survey of an entirestate because it requires a large number ofsurvey locations and/or extensive interviewswith drivers. Using links is useful because itprovides more information on travel betweentwo sites on the same (or adjoining) roads,rather than general information on truckvolume on a particular route. For example, byusing links, it would be possible to determinethat truck volume is higher on a segment of aneast-west highway between interchanges withtwo major north-south highways. It may beuseful to consider Points A and B as the endpoints of the east-west highway interchanges Xand Y with 2 north-south highways in betweenthem. If the east-west highway is surveyedonly at endpoints A and B, the traffic using thehighway only for the connecting link betweeninterchanges X and Y and the north-south highways would be missed. Under these circumstances, itwould be important to collect data between interchanges X and Y.
The routing plans of highway commoncarriers tend to favor the interstate systembecause this network offers the most direct,fastest, and safest alternative. Nevertheless,legal-weight carriers are restricted to routesdesignated by the requirements of the SurfaceTransportation Assistance Act (STAA) of 1982which are numerous in some states. Carriersmay avoid an Interstate option if the delay,including weight, cargo, safety, and shippingpaper checks, is less on another route with alower classification.
2.3.2 Seasonal/Repetition
To obtain the most representative data,it is advisable to conduct field studies usingnumerous repetitions during multiple seasons. Using a continuous survey of truck traffic onconsecutive days during at least two distinctseasons of the year may well represent aminimally acceptable standard for overcomingthe sampling difficulties as discussed in section2.5 below. Surveying for an entire week during
16
more than one season may be somewhat better, though undoubtedly more resource intensive. Theselection of survey weeks should take into account the relevant economic characteristics of the areabeing studied (e.g., agricultural cycles, heating oil stockpiling, and industrial production schedules). Tocontain costs and collect data that are statistically reliable, it may be preferable to conduct field studiesfor two full weeks in a given month (not necessarily consecutive weeks) with identical follow-up surveyswithin four to six months after the initial surveys.
2.3.3 Personnel Needs
Law enforcement personnel, technical staff of state administrative departments, and collegestudents have all been employed to collect hazardous materials flow data. No particular technicalqualifications are required to perform field duties beyond the ability to read and record verbal or printedinformation accurately. However, technical qualifications would be required for interpreting andanalyzing the data. All survey staff should attend at least one training session in survey procedures tofacilitate data collection. This session should precede actual data collection by no more than one weekand should include opportunities for personnel to demonstrate their competence. Survey staff can alsoparticipate in dry runs at the survey site that involve transport trucks and interactions with personsplaying the role of driver. It is also very important that an individual understand and appreciate thesurvey's purpose. The goals of and rationale for conducting the survey should be central themes of thetraining sessions.
Staffing needs (in person-hours) will vary with the scope of the survey, irrespective of staffqualifications. If a survey is expected to reflect daily and seasonal fluctuations in hazardous materialsflows at locations across a state, the person-hours required for data collection and transcription will bemuch larger than if a survey is intended only to reflect an average one day truck flow. If there aremultiple sampling points in a state with a dense network of designated legal truck routes or a largenumber of origins and destinations of hazardous materials, the required person-hours will probably bemuch larger. Personnel considerations for surveys that have been conducted (and are discussed inmore detail in Chapter 3) include the following:
< Idaho's study was conducted predominantly in daylight hours and spanned sevencalendar months, three of which were survey months. The 1,520 person-hours involvedin this study indicate that survey staff worked an eight-hour day at each of two locations.
< By contrast, Oregon's 3,460 person-hour effort involved continuous 72-hour monitoringperiods at 11 sites; thus, each of the study's three phases required at least 99 eight-hour(two-person) shifts. The effort expended by the truck inspectors added to the total.
< In the case of the Dallas/Ft. Worth survey, the 100 person-hour commitment wasprobably appropriate for the spot survey procedure adopted, that is, no truck pullovers,no interviews, and no examination of shipping papers. However, the vigilance requiredto spot, record, and count all passing placarded trucks dictated shifts no longer than fourhours. Accuracy is important, especially in the transcription of placard codes and verballading descriptions.
2.3.4 Study Design and Resources
Prior to conducting the commodity flow survey, it will be necessary to ensure that the goals ofthe survey can be achieved by the study method, and that the method requirements can be met by theresources allocated to the survey. It is important to take some time to review the study and determinewhether any modifications are required and determine whether the study needs can be met by theresources available. Budget resources, personnel, equipment, and time restrictions imposed upon thesurvey must all be considered. If the needs cannot be met by the resources allocated, it may be
necessary to restrict some portions of the survey. For example, a survey may require three surveys tobe conducted over a period of one year, using three people at each of 25 locations for each survey. Ifseasonal variations are more important than obtaining detailed statewide information, it might be
17
SOURCE MINIMAL DATA ADDITIONAL DATA
SURVEYPERSONNEL
T Date and time sample record was taken
VEHICLE T Truck typeT Cargo typeT DOT placardT Four digit UN/NA ID #
Ú Tank or trailer rated capacity
SHIPPINGPAPERS
T Any routing instructionsT Four digit UN/NA commodity T ID # (Compare with placard)T Destination of shipment (city and state)
Ú Four digit STCC code numberÚ DOT shipping nameÚ Quantity of lading (weight or volume)Ú Origin of shipment (city and state)
appropriate to reduce the number of survey locations while keeping the three survey seasons. Likewise,if statewide variations are vital, having only two surveys at each of the 25 sites may be more practical. Reviewing the survey objectives and study design side by side is an important step in ensuring that thesurvey results are achieved within the resources allocated for that purpose and that they are meaningfulin achieving the stated goal of the survey.
2.4 COLLECT ORIGINAL DATA - FIELD SURVEYS
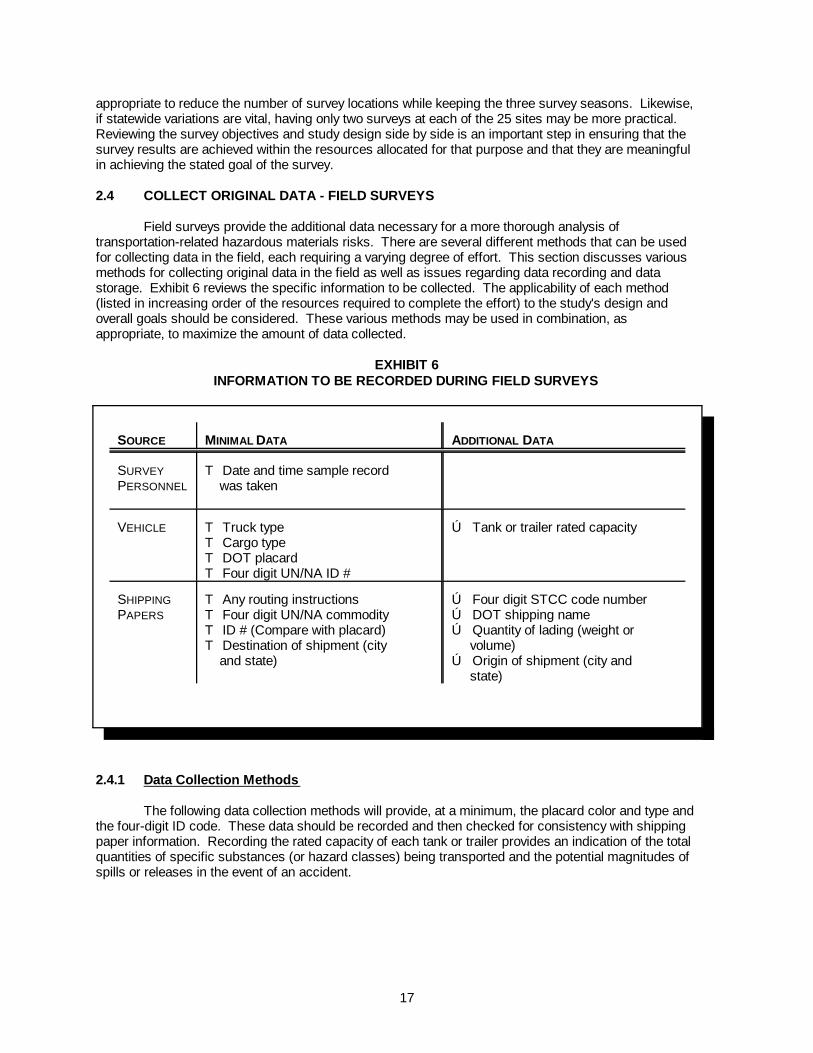
Field surveys provide the additional data necessary for a more thorough analysis oftransportation-related hazardous materials risks. There are several different methods that can be usedfor collecting data in the field, each requiring a varying degree of effort. This section discusses variousmethods for collecting original data in the field as well as issues regarding data recording and datastorage. Exhibit 6 reviews the specific information to be collected. The applicability of each method(listed in increasing order of the resources required to complete the effort) to the study's design andoverall goals should be considered. These various methods may be used in combination, asappropriate, to maximize the amount of data collected.
EXHIBIT 6INFORMATION TO BE RECORDED DURING FIELD SURVEYS
2.4.1 Data Collection Methods
The following data collection methods will provide, at a minimum, the placard color and type andthe four-digit ID code. These data should be recorded and then checked for consistency with shippingpaper information. Recording the rated capacity of each tank or trailer provides an indication of the totalquantities of specific substances (or hazard classes) being transported and the potential magnitudes ofspills or releases in the event of an accident.
18
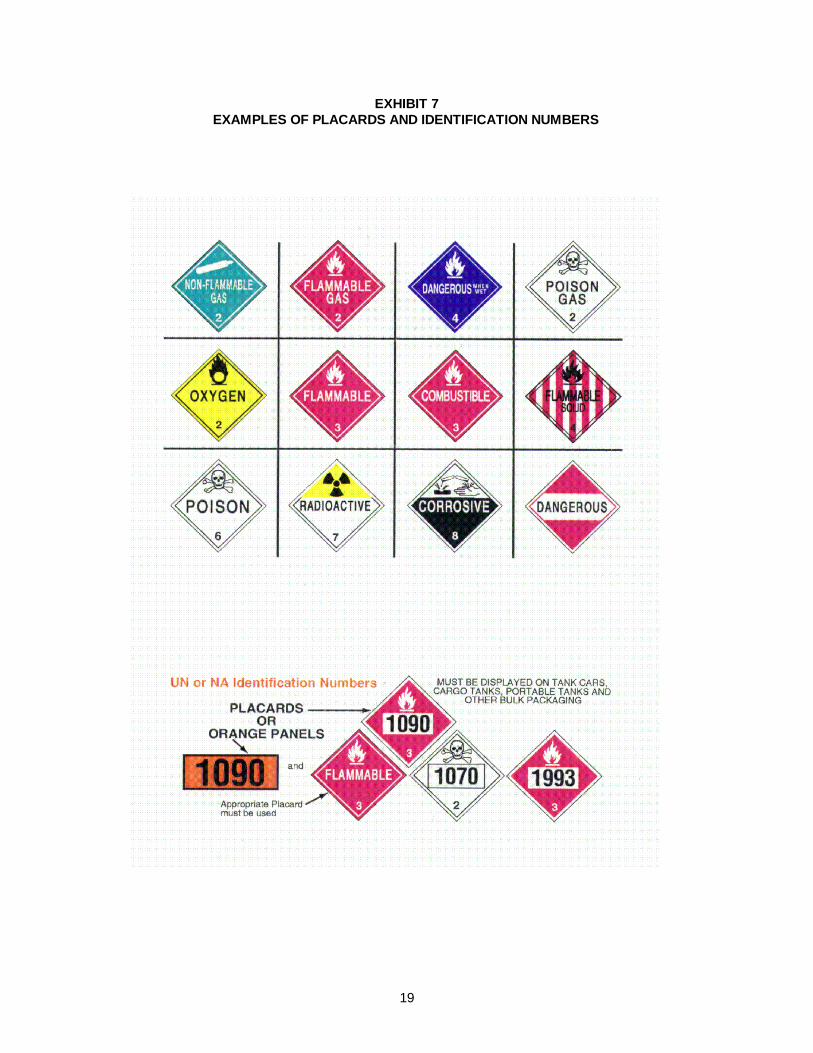
2.4.1.1 Placard Surveys
It is relatively easy to determine the hazard class of the contents of a properly placarded trucktrailer (see Exhibit 7 for examples of placards and identification numbers). Survey personnel note thematerial's identification number displayed on trucks moving past a survey point. Binoculars, of course,can assist in reading the four digit ID number, which is displayed either on the placard itself, on anorange panel below the placard, or on the side of the vehicle.
Sheriff's deputies or local law enforcement personnel on routine patrol may be able to conductthese informal checks if they are stationed at or near road arteries passing through the community. Properly trained volunteers (e.g., students, environmental groups) can also provide valuable resources. It is important to select a location for personnel that is safe and has a clear line-of-sight to the right-of-way.
2.4.1.2 Review of Shipping Papers
Each vehicle's shipping papers contains precise information on the quantities and types ofhazardous materials being transported. The shipping papers for vehicles transporting hazardousmaterials must contain:
< Number of packages of lading.
< DOT shipping name of lading.
< DOT hazard class of lading.
< UN/NA four-digit ID number.
< Package weight or volume for each product carried.
In addition, virtually all bills of lading identify either the shipper or forwarding carrier from whichthe consignment was received, the point of origin of the shipment (or location of receipt), and theshipment's point of destination. There may also be special handling instructions for the driver andrecipient, as well as a routing plan for the driver. This plan may be spelled out in some detail, but ingeneral provides only the sequence of routes to be followed (e.g., US 45 north to I-65 north to I-90 east). Comparing the routing instructions with the points of origin and destination can provide a quick qualityassurance check.
As trucks pull into the survey area, survey personnel should ask the driver for the shippingpapers, which should be readily available. For any hazardous materials shipment, a copy of the shippingpapers and any other relevant documents must be placed in the cab before starting the haul.
Survey personnel could be tasked to photocopy the shipping papers while the truck is stopped ata toll booth or weigh station and additional information from the vehicle is recorded. Minimizing thedelay to the driver, this approach allows for a detailed examination of the information on the shippingpapers away from the site after the field surveys are complete. It is important to note that shippingpapers are not standardized; the review process, therefore, could prove lengthy. In addition, the cost ofmaintaining portable copiers at the survey locations may be prohibitive to some jurisdictions.
2.4.1.3 Driver Interviews
Driver interviews provide "hands on" information. A list of questions should be prepared andsurvey personnel should be briefed on the types of information to look for. The survey goals will point tothe correct questions to ask, for example: If the driver works for a particular company often, does
19
EXHIBIT 7EXAMPLES OF PLACARDS AND IDENTIFICATION NUMBERS
20
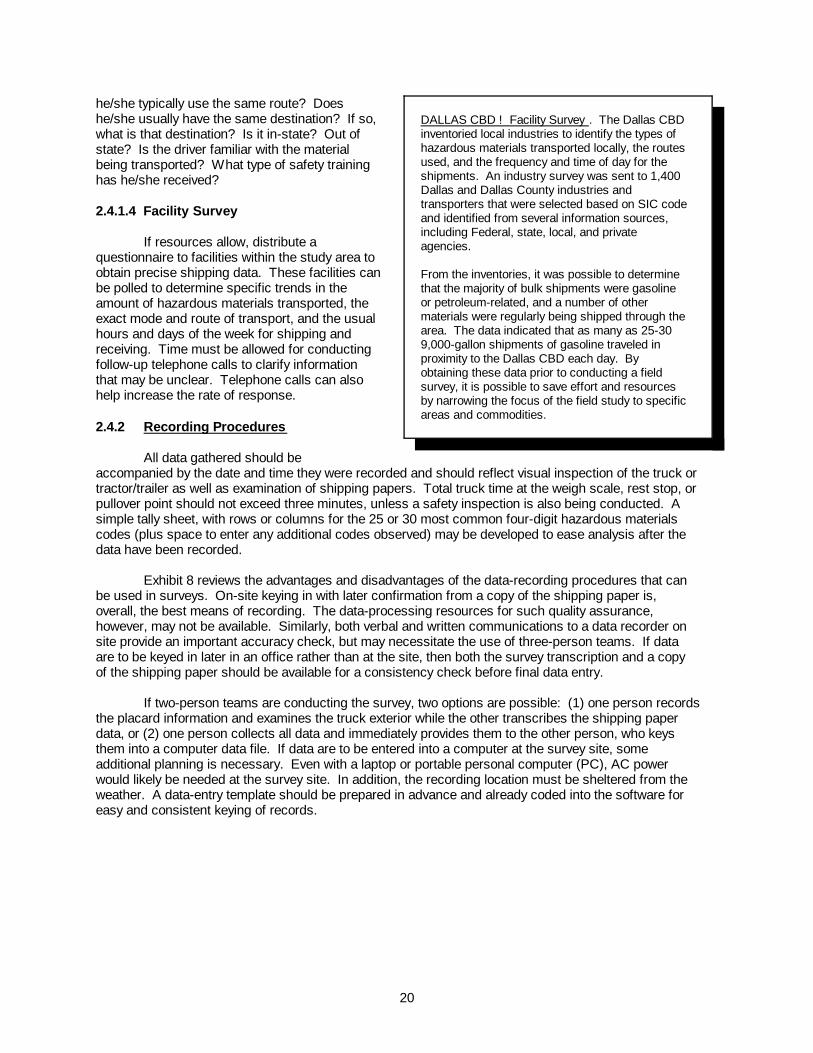
DALLAS CBD ! Facility Survey . The Dallas CBDinventoried local industries to identify the types ofhazardous materials transported locally, the routesused, and the frequency and time of day for theshipments. An industry survey was sent to 1,400Dallas and Dallas County industries andtransporters that were selected based on SIC codeand identified from several information sources,including Federal, state, local, and privateagencies.
From the inventories, it was possible to determinethat the majority of bulk shipments were gasolineor petroleum-related, and a number of othermaterials were regularly being shipped through thearea. The data indicated that as many as 25-309,000-gallon shipments of gasoline traveled inproximity to the Dallas CBD each day. Byobtaining these data prior to conducting a fieldsurvey, it is possible to save effort and resourcesby narrowing the focus of the field study to specificareas and commodities.
he/she typically use the same route? Doeshe/she usually have the same destination? If so,what is that destination? Is it in-state? Out ofstate? Is the driver familiar with the materialbeing transported? What type of safety traininghas he/she received?
2.4.1.4 Facility Survey
If resources allow, distribute aquestionnaire to facilities within the study area toobtain precise shipping data. These facilities canbe polled to determine specific trends in theamount of hazardous materials transported, theexact mode and route of transport, and the usualhours and days of the week for shipping andreceiving. Time must be allowed for conductingfollow-up telephone calls to clarify informationthat may be unclear. Telephone calls can alsohelp increase the rate of response.
2.4.2 Recording Procedures
All data gathered should beaccompanied by the date and time they were recorded and should reflect visual inspection of the truck ortractor/trailer as well as examination of shipping papers. Total truck time at the weigh scale, rest stop, orpullover point should not exceed three minutes, unless a safety inspection is also being conducted. Asimple tally sheet, with rows or columns for the 25 or 30 most common four-digit hazardous materialscodes (plus space to enter any additional codes observed) may be developed to ease analysis after thedata have been recorded.
Exhibit 8 reviews the advantages and disadvantages of the data-recording procedures that canbe used in surveys. On-site keying in with later confirmation from a copy of the shipping paper is,overall, the best means of recording. The data-processing resources for such quality assurance,however, may not be available. Similarly, both verbal and written communications to a data recorder onsite provide an important accuracy check, but may necessitate the use of three-person teams. If dataare to be keyed in later in an office rather than at the site, then both the survey transcription and a copyof the shipping paper should be available for a consistency check before final data entry.
If two-person teams are conducting the survey, two options are possible: (1) one person recordsthe placard information and examines the truck exterior while the other transcribes the shipping paperdata, or (2) one person collects all data and immediately provides them to the other person, who keysthem into a computer data file. If data are to be entered into a computer at the survey site, someadditional planning is necessary. Even with a laptop or portable personal computer (PC), AC powerwould likely be needed at the survey site. In addition, the recording location must be sheltered from theweather. A data-entry template should be prepared in advance and already coded into the software foreasy and consistent keying of records.

21
Pros Cons
1. Hand Record for Remote Entry
No need for electrical or telecommunications links Requires considerable paper processing andtracking
One-person survey team feasible Subsequent verification of shipping paper data notpossible
Resource requirement relatively low Long per-vehicle survey time
2. Hand Record for On-Site Entry
Immediate verification and accuracy checkfeasible, especially if data screen has sameformat as check sheet
At minimum, two person team required
Subsequent verification of shipping paper data notpossible
3. Copy Shipping Paper
One-person survey team feasible Heavy-duty portable copier required
Fast (survey taker notes placard, copies bill, andsends trucker on his or her way)
Excessive paper handling and tracking required
Easily piggy-backed onto weigh station operations No explicit check of placard/shipping paperconsistency
4. Dictation Key-In
Data recorder reports each value verbally to dataentry specialist
Instantaneous data recording No paper record for subsequent verification
Fast processing of each vehicle
5. Combining (2) and (3)
Best verification and quality control option Requires data entry and checking both during andafter survey (i.e., more costly)
Data record in computer file is given same ID asshipping paper copy, assuring no mismatch ormiscoding
6. Combining (3) and (4)
Faster than (5) and potentially as accurate Same as (5)
7. Inclusion of Driver Interview
May provide added insight on shipment frequencyfor a commodity of interest
Time consuming; increases survey cost, increasesmean truck delay, and may require four-personteams
EXHIBIT 8ADVANTAGES AND DISADVANTAGES OF VARIOUS
DATA RECORDING PROCEDURES
22
2.5 ANALYZE RESULTS
This section introduces the application of appropriate sampling techniques to the collection ofhighway hazardous materials flow data. It reviews some basic but important principles of samplingtheory that are relevant to the planning of any survey of road traffic. Understanding the points covered iscrucial to understanding why some surveys work while others do not, and why even a well-plannedsurvey can sometimes yield erroneous, incomplete, or misleading results.
2.5.1 Statistical Considerations
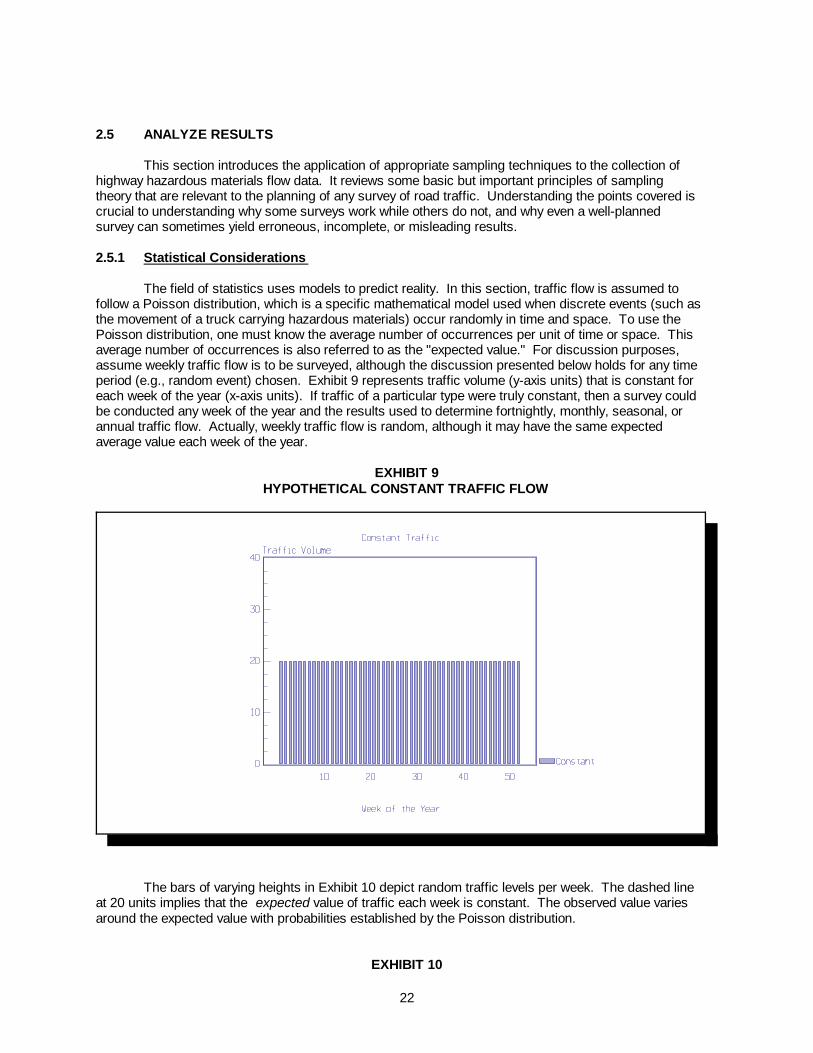
The field of statistics uses models to predict reality. In this section, traffic flow is assumed tofollow a Poisson distribution, which is a specific mathematical model used when discrete events (such asthe movement of a truck carrying hazardous materials) occur randomly in time and space. To use thePoisson distribution, one must know the average number of occurrences per unit of time or space. Thisaverage number of occurrences is also referred to as the "expected value." For discussion purposes,assume weekly traffic flow is to be surveyed, although the discussion presented below holds for any timeperiod (e.g., random event) chosen. Exhibit 9 represents traffic volume (y-axis units) that is constant foreach week of the year (x-axis units). If traffic of a particular type were truly constant, then a survey couldbe conducted any week of the year and the results used to determine fortnightly, monthly, seasonal, orannual traffic flow. Actually, weekly traffic flow is random, although it may have the same expectedaverage value each week of the year.
EXHIBIT 9HYPOTHETICAL CONSTANT TRAFFIC FLOW
The bars of varying heights in Exhibit 10 depict random traffic levels per week. The dashed lineat 20 units implies that the expected value of traffic each week is constant. The observed value variesaround the expected value with probabilities established by the Poisson distribution.
EXHIBIT 10
23
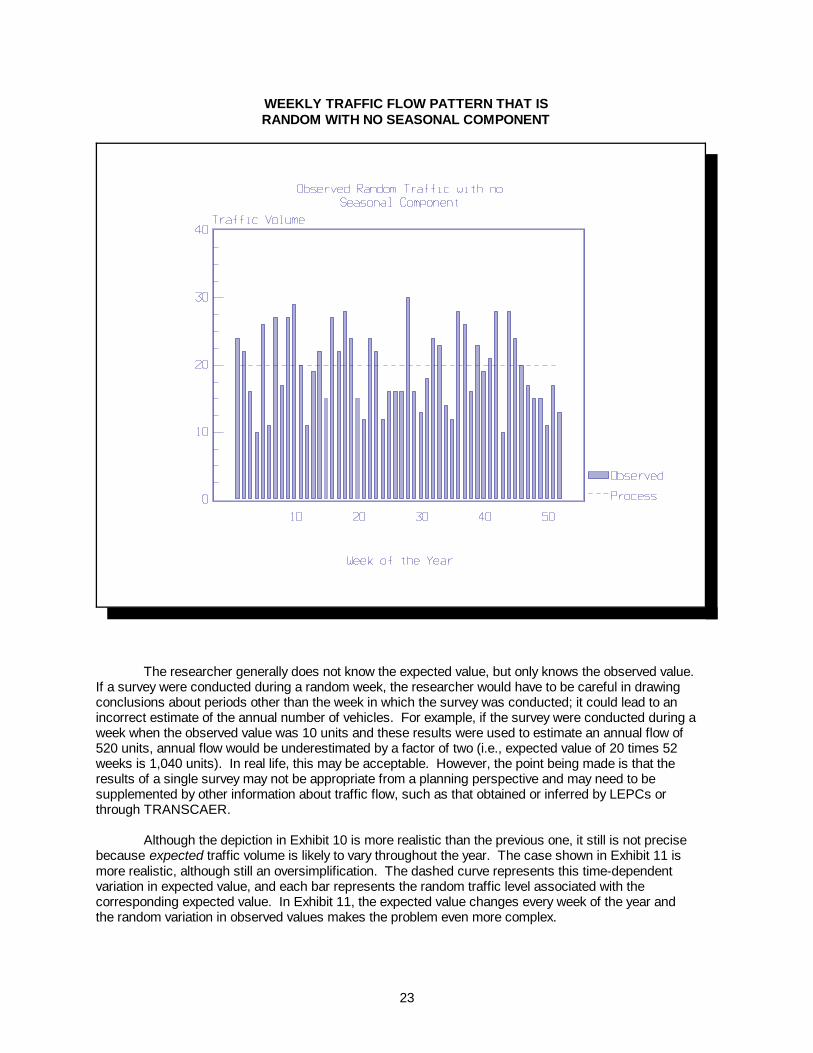
WEEKLY TRAFFIC FLOW PATTERN THAT ISRANDOM WITH NO SEASONAL COMPONENT
The researcher generally does not know the expected value, but only knows the observed value. If a survey were conducted during a random week, the researcher would have to be careful in drawingconclusions about periods other than the week in which the survey was conducted; it could lead to anincorrect estimate of the annual number of vehicles. For example, if the survey were conducted during aweek when the observed value was 10 units and these results were used to estimate an annual flow of520 units, annual flow would be underestimated by a factor of two (i.e., expected value of 20 times 52weeks is 1,040 units). In real life, this may be acceptable. However, the point being made is that theresults of a single survey may not be appropriate from a planning perspective and may need to besupplemented by other information about traffic flow, such as that obtained or inferred by LEPCs orthrough TRANSCAER.
Although the depiction in Exhibit 10 is more realistic than the previous one, it still is not precisebecause expected traffic volume is likely to vary throughout the year. The case shown in Exhibit 11 ismore realistic, although still an oversimplification. The dashed curve represents this time-dependentvariation in expected value, and each bar represents the random traffic level associated with thecorresponding expected value. In Exhibit 11, the expected value changes every week of the year andthe random variation in observed values makes the problem even more complex.

24
EXHIBIT 11WEEKLY TRAFFIC FLOW PATTERN THAT ISRANDOM WITH A SEASONAL COMPONENT
Because of the nature of random traffic, what is seen at a particular observation point at any onelocation or any one time may not necessarily be a good indicator of overall average conditions. Forexample, if a traffic survey conducted over a week observes 100 shipments of a particular type, whatcan be reliably assumed about the actual number of shipments of this type at that specific location andtime of year? First of all, unless other information is known, the average intensity of traffic flow (e.g., theexpected value) can be assumed to be 100. However, the actual intensity may be higher or lower than100, with 100 shipments having been observed simply by chance.
Exhibit 12 summarizes three confidence intervals (90%, 95%, and 99%) about a specific set ofobserved values. The middle column lists the observed values. Any particular confidence interval abouta specific observed value is listed at the intersection of the appropriate row and pair of columns. The90% confidence interval about the observed value of 100 is given under the third and fifth columns:namely, 85 to 118. Similarly, the 95% confidence interval is given under the second and sixth columns:namely, 82 to 122; and the 99% confidence interval is given under the first and seventh columns:namely, 77 to 129. When a researcher has an observed value, but does not know the expected value,Exhibit 12 can be used to determine the range of possible expected values that would be consistent withthe one observed value. In other words, the 90% confidence interval (the range of plausible expectedvalues 90% of the time) about the observed value of 100 is 85 to 118. In fact, there is a 5% chance that100 or fewer shipments

25
EXHIBIT 12CONFIDENCE INTERVALS VERSUS NUMBER OBSERVED
99% Confidence Interval 99% Confidence Interval
95% Confidence Interval 95% Confidence Interval
90% CI 90% CI
LCL3 LCL2 LCL1b Na UCL1c UCL2 UCL3 LCL3 LCL2 LCL1b Na UCL1c UCL2 UCL3
000112233455667889
10111119273543526069778695
104113122131140149158167
0011223345567889
1011111213212938475564738291
100109119128137146156165174
001122345567789
101111121314223140495867768594
103113122131141150159169178
0123456789
101112131415161718192030405060708090
100110120130140150160170180190200
34689
10121314151718192022232425262829405263748596
107118129139150161172182193203214225
4679
10121314161718202122242526272830314354667788
100111122133143154165176187198208219230
79
101213151618192122232526282930313334354860728495
107118129141152163174185196207218229240
176185194203212222231240249259268277286296305314324333342352361370380389399408417427436446493540588635683730778826874922
183193202202221230240249258268277287296306315325334344353363372382391401410420429439448458506554602650698746795843891940
187197206206225235244254263273282292301311321330340349359368378388397407416426436445455465513561609658706755803852901949
210220230240250260270280290300310320330340350360370380390400410420430440450460470480490500550600650700750800850900950
1000
235246256256277288298309319330340351361372382393403413424434445455465476486497507517528538590642693745796848899951
10021053
240251262262283294304315325336346357368378389399410420431441452462473483494504514525535546598650702754806857909961
10121064
251262273273294305316327337348359370380391402412423434444455466476487497508519529540550561614667719772824876928981
10331085
a N is the number observed.b LCLn is the lower confidence limit (the probability is (1 - CI)/2 that the "true" intensity is less than the LCL for that CI).c UCLn is the upper confidence limit (the probability is (1 - CI)/2 that the "true" intensity is greater than the UCL for that CI).
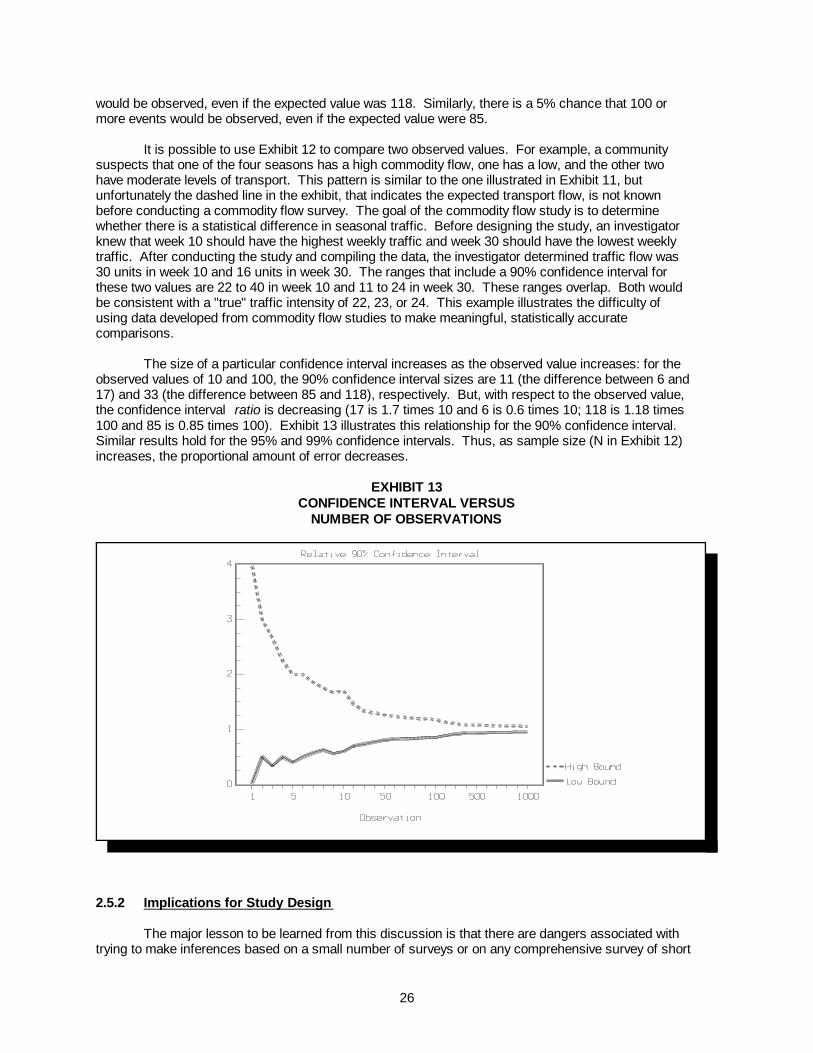
26
would be observed, even if the expected value was 118. Similarly, there is a 5% chance that 100 or more events would be observed, even if the expected value were 85.
It is possible to use Exhibit 12 to compare two observed values. For example, a communitysuspects that one of the four seasons has a high commodity flow, one has a low, and the other two have moderate levels of transport. This pattern is similar to the one illustrated in Exhibit 11, butunfortunately the dashed line in the exhibit, that indicates the expected transport flow, is not known before conducting a commodity flow survey. The goal of the commodity flow study is to determinewhether there is a statistical difference in seasonal traffic. Before designing the study, an investigatorknew that week 10 should have the highest weekly traffic and week 30 should have the lowest weeklytraffic. After conducting the study and compiling the data, the investigator determined traffic flow was 30 units in week 10 and 16 units in week 30. The ranges that include a 90% confidence interval for these two values are 22 to 40 in week 10 and 11 to 24 in week 30. These ranges overlap. Both would be consistent with a "true" traffic intensity of 22, 23, or 24. This example illustrates the difficulty of using data developed from commodity flow studies to make meaningful, statistically accuratecomparisons.
The size of a particular confidence interval increases as the observed value increases: for theobserved values of 10 and 100, the 90% confidence interval sizes are 11 (the difference between 6 and17) and 33 (the difference between 85 and 118), respectively. But, with respect to the observed value, the confidence interval ratio is decreasing (17 is 1.7 times 10 and 6 is 0.6 times 10; 118 is 1.18 times 100 and 85 is 0.85 times 100). Exhibit 13 illustrates this relationship for the 90% confidence interval. Similar results hold for the 95% and 99% confidence intervals. Thus, as sample size (N in Exhibit 12)increases, the proportional amount of error decreases.
EXHIBIT 13CONFIDENCE INTERVAL VERSUS
NUMBER OF OBSERVATIONS
2.5.2 Implications for Study Design
The major lesson to be learned from this discussion is that there are dangers associated withtrying to make inferences based on a small number of surveys or on any comprehensive survey of short
27
DALLAS CBD ! Statistics. After tallying the fieldand questionnaire data, several sources ofinformation (MTB data, National TransportationSafety Board (NTSB) accident reports, and a DOEreport on the risk of transporting gasoline by truck)were reviewed to better understand the causes andresults of hazmat accidents. By reviewing theseother sources of data and applying the informationto local data, the Dallas CBD saved time and effortthrough its application of national trends to localrealities. The Dallas CBD used statistics todetermine how the national trends correlated tolocal data; this enabled the Dallas CBD to developsound conclusions from its data without having tocome up with its own complex methodology orhypotheses.
duration. Traffic flows for longer or different periods of time may be grossly miscalculated and incorrectconclusions drawn. For example, statistical theory reveals, as shown in Exhibit 12, that 5% of the timewhen the observed value of a particular traffic type is 0, the expected value may be three. In thisinstance, it could be concluded that none of this type of traffic is ever present when in fact it may bepresent sometimes.
It is possible to make inferences based on small samples if the characteristics of the samplepopulation are well known (i.e., if the expected value is known in advance of the survey). The knowncharacteristics allow statisticians to adjust the observed results. For example, forecasts of economicindicators are made early in the year because the observations can be "seasonally adjusted" on the basisof historical data.
Thus, if reliable use is to be made of one or two surveys, information must be obtained abouthistorical traffic patterns (e.g., peak periods, slack periods, and typical periods), and fixed sources ofhazardous materials as well as the traffic flow from these sources (e.g., volumes, seasonality, anddelivery routes) must be identified. LEPCs and public-use data bases (as described in section 2.2.2) canpotentially provide this information.
Given the inherent difficulties and potentially high costs of traffic surveys, the followingconclusions are generally applicable.
< Surveys should be done at the state level; that is, surveys should not be conductedunilaterally by local jurisdictions because it would not be valid to extrapolate data from alocal survey to state-level conclusions, and components in state-level analyses shouldbe based on consistent methods and data sources;
< Surveys should be carefully designed to ensure obtaining valid and useful results;
< Because when more "events" are observed the proportional size of the confidence rangedecreases, it may be more effective to sample for fewer time periods of longer duration;and
< Strange or unexpected results should be investigated further so that reasonableexplanations can be found.
2.6 APPLY RESULTS TO PURPOSES
The results of the commodity flowstudy can be used to improve preparedness,prevention, and response capabilities bydesignating specific routes to be used for thetransportation of hazardous materials andother focused planning efforts. For example,it may be useful to display the data on a map(or a series of maps) to obtain a picture ofhazardous materials transport. Compare thedata and conclusions that have been drawnfrom the study against the project goalsidentified at the beginning of the process inorder to develop action items and a schedulefor implementing the results. The study dataand conclusions should be compared to theproject goals identified at the beginning of theprocess. For example, if the study shows that a particularly large amount of a specific chemical istransported on a specific route, emergency responders along that route could benefit from training in theproperties and effects of that substance. Equipment purchases could also be made with this information in mind.

28
In some cases, those who develop and analyze the results of the commodity flow study might not be the most appropriate agent to take action on a particular recommendation. To implement the action items resulting from the study, it might be necessary to work with the state legislature, localgoverning bodies, or any one of the various state and federal agencies with responsibilities intransportation and environmental planning and emergency response.
28
CHAPTER 3STATE AND LOCAL SURVEYS
Several states and one local community have conducted surveys to determine the types andquantities of hazardous materials transported on their highways. Each survey is briefly described in thesections below, and the chapter concludes with a comparison of the survey experiences.
3.1 COLORADO
Colorado Senate Bill (SB) 156, the Hazardous Materials Transportation Act of 1987, was passedin recognition of increasing concern about the potential for serious problems resulting from hazardousmaterials transportation accidents. One provision of SB 156 directed the State Patrol to designate whichColorado roads can be used for hazardous materials transportation. A truck survey was conducted fromDecember 1987 to May 1988 to learn more about the types and quantities of hazardous materials thatwere being transported and patterns of hazardous materials movements throughout the state.
Trucks were surveyed at ten sites throughout the state, including selected weigh stations,roadways, and ports of entry. Truck placards were counted, shipping papers were examined, and driverswere interviewed to determine the types and quantities of hazardous materials as well as shipment originand destination. Ports of entry officers, who deal with trucks on a full-time basis conducted the trucksurveys.
Data collected at the survey sites indicated that:
< Ten percent of the shipments surveyed carried hazardous materials, 90% of whichconsisted of petroleum products.
< Sixty-three percent of the hazardous materials shipments surveyed were flammable andcombustible liquids, 27% were flammable gases, 4% were nonflammable gases, 3%were corrosives, 2% were miscellaneous hazardous materials, and 1% were oxidizers.
< Of the hazardous materials shipments surveyed, 52% had both origin and destinationwithin the state, and 45% percent had either origin or destination within the state. Only3% of the shipments were passing through the state.
Other analyses that were conducted included comparing the placards and interview informationover the same 7-day period to identify any differences. In addition, the state looked at accident rates onthe highway system. Unlike many other investigations, Colorado looked at accident rates on all roads,not just on those used by truck traffic. This provided an opportunity to contrast accident rates on theroutes typically used by trucks to all other traffic accident rates.
Colorado used this information to help identify routes to be designated for hazardous materialstransportation. This survey, however, was only one of several methods used to identify hazardousmaterials routes.
3.2 IDAHO
The goal of this study was to identify factors involving transportation of hazardous materials todetermine the health risk to motorists in Idaho. The first phase of the study determined the types andquantities of hazardous material being transported across the state. The second phase assessed theemergency response capabilities of statewide agencies.
29
Hazardous Material Transportation Monitoring andCapability Study for the Purpose of Assessing Riskto the Public , January 1988 by College of HealthScience, Boise State UniversityIdaho Department of Law EnforcementIdaho State Police6050 Corporal LaneBoise ID 83704(208) 327-7180
This information is used to gain furtherunderstanding of commodity movement throughoutNevada, both for use in hazardous materials routingas well as for other general highway planningrequirements.
Commodity ReportJanuary 1993Nevada Department of TransportationResearch Division1263 S. Stewart StreetCarson City, NV 89712(702) 687-3452
The assessment was conducted through surveys of the actual truck traffic on several days duringJuly and August 1987. All trucks at eight ports of entry were counted and, if trucks carried hazardousmaterials, drivers were interviewed for further information on the types and quantities of materials,shipment origin and destination, driver's training and knowledge of hazardous materials permits andendorsements.
Out of the 11,335 trucks counted, 424(3.7%) trucks were stopped for interviewing. Hazard placarded trucks ranged from 1.9% to9.2% of total truck traffic at the different ports ofentry surveyed; on average 4% of all trucks onIdaho highways carry hazardous materials, andon average 1% carry a high hazard material,such as radioactive material. Gasoline andother fuel products accounted for the mostfrequently shipped hazardous materials. Mostof the shipments originating outside of Idahohad origins in the neighboring states of Utah,Washington, and California; a majority of the shipments with destinations outside of Idaho were alsodestined for neighboring states: Montana, Oregon, Washington, and Utah. The highest frequency ofhazardous materials traffic occurred on Tuesdays, and peak hours every day occurred between 8:00a.m. and 3:00 p.m. Fifteen percent of the drivers reported no training for hazardous materialstransportation, 12% did not know they needed a hazardous material endorsement, while 25% did nothave an endorsement.
Seventy-nine (74%) of the 107 agencies interviewed responded to the agency inventoryquestionnaires. Among the major findings were that 33% of the agencies did not have a copy of theState Disaster Plan, 17% of the agencies were unaware of the State Emergency Management SystemCommunication System, and there was general confusion as to who had responsibility for response toany hazardous materials incident in a specific county.
All the data collected was entered into a computer database and given to the Idaho State Policefor further study and use. The study concluded that it is apparent from the numbers of hazardousmaterials shipments occurring each day and the lack of awareness among agencies regarding statehazardous materials response procedures that motorists in Idaho may be at significant risk from ahazardous materials accident. Some agencies have already taken steps to improve their hazardousmaterials training and response capabilities, and the Idaho Legislature and other agencies are takingsteps to improve training and preparedness and ensure that the public is adequately protected from anyhazardous materials incidents in Idaho.
3.3 NEVADA
The purpose of the Nevada DOT(NDOT)'s Nevada Commodity Report was topresent an average day profile of allcommodities, including those classified ashazardous materials, being commerciallytransported via Nevada's highway system. Finalresults analyzed total truck traffic, and provideda separate analysis of hazardous materialsshipments.
Formulas were developed to convertsurvey numbers to average daily numbers. Factors looked at included an adjusted averagedaily volume for commercial trucks; each
30
Hazardous Material Movements on Oregon Highways1988 by the Public Utility Commission of Oregonand the Oregon Department of Transportation
commodity type by vehicle type; and net weight by vehicle type and commodity type.
Hazardous materials tonnages are reported even though the perceived degree of public safetyregarding the potential for hazardous materials incidents is more closely related to exposure (frequency)than to the amount (tonnage) of hazardous materials involved. For this reason, the analysis ofhazardous materials movements emphasizes frequency rather than tonnage.
There were a total of 45 statewide information collection sites, including 19 points of entry; theroutes were divided into 95 "links" to track commodity movement. All drivers of trucks with hazardplacards were interviewed, including empty trucks with residual materials; shipments by the Departmentof Defense are not included because the state does not have the authority to stop these trucks. Driverswere questioned as to points of origin and destination, routes traveled within the state, and details on thespecific commodities being transported.
Data were collected in 1989, 1990, and 1992, from a total sample of 19,838 trucks. Results ofthe study indicated that :
< Hazardous materials trucks accounted for 3.6% of total statewide shipments (3.1% onInterstate routes, 5.2% on U.S. routes, and 6.0% on state routes), and 8.9% of statewidetonnage. Daily tonnage of hazardous materials shipments peaked at 3,489 tons per dayon I-15, with a total of 13,576 tons being transported daily throughout the state.
< Of all hazardous materials trucks, 32% were passing through the state, 28% wereimporting shipments, 22% were exporting shipments, and 18% were intrastateshipments.
< On I-15, the route with the largest hazardous materials traffic, flammable liquids madeup 61% of the hazardous materials traffic, corrosives accounted for 18%, and gasesaccounted for 15%. On all the routes together, flammable liquids made up the largestportion of the hazardous materials traffic, accounting for 50% to 80% of the volume, andup to 86% of the tonnage on any single route.
The collected data were analyzed to determine total numbers as well as percentages ofindividual commodity shipments and frequency of shipments on different routes. These data were usedas background information to assist NDOT in highway planning.
NDOT conducts a similar study every other year, so the information is continually being updated. NDOT is compiling a database of this information; so far the number of trucks surveyed have increasedduring every survey, but the numbers are expected to begin to level off during the next survey scheduledfor 1994. NDOT has not changed its survey methods, except to modify survey locations as indicated bytravel patterns.
3.4 OREGON
A study was conducted in response tothe December 1986 recommendations of theOregon Interagency Hazard CommunicationsCouncil to quantify the level of risk to thestate's citizens. The Council requested theOregon Department of Transportation (ODOT) and the Public Utility Commission (PUC) to undertake astudy to gather information on the types and quantities of hazardous materials transported on Oregonhighways, as well as on container types, load origins and destinations, routes traveled, and cities andcounties exposed to hazardous materials traffic.
Ten truck weigh scale locations in Oregon and one in Washington were chosen for the surveybecause they provided facilities for separating hazard-placarded trucks from the general traffic. Five ofthe survey sites were located on the Interstate system, three were on U.S. (primary) highways, and three

31
were on Oregon state highways. In conducting the surveys, ODOT and PUC personnel stopped hazard-placarded trucks to examine shipping papers and to gather information regarding routes traveled. Non-placarded trucks carrying Other Regulated Materials were also included in the survey. Information wascollected from a total of 2,511 placarded vehicles.
A preliminary survey was conducted in March to determine placard compliance, which was thenused to estimate the reliability of data collected from placarded vehicles only. Two-person teams visitedeach survey site to selectively examine trucks and cargo; 35 vehicles were inspected, and only oneplacard violation (3%) was found.
The primary surveys were completed in three phases, over a total of 18 days in 1987, consistingof periods that began on a Monday or Tuesday at 12:01 am and continued for 72 hours (3 days). Phaseone was conducted during the second and third weeks of March at seven sites outbound from Portland. During phase two, the same seven sites were revisited during the first and second weeks of August toreveal any seasonal differences in truck traffic and hazardous materials shipments. In phase three,during the third week of November, hazardous materials shipments entering Oregon through four borderports of entry were surveyed.
The results of the study indicated that:
< Hazardous materials movements averaged nearly 2 per hour, ranging from 6.4movements per hour at Woodburn (southbound from Portland) in August, to less than 1every four hours at Tillamook (westbound from Portland).
< The heaviest total truck traffic consistently occurred at the Interstate survey sites: threelocations on I-5 (the main north-south route through Oregon and Washington) and onelocation on I-84 east out of Portland.
< For the 7 sites surveyed in both March and August, there was a total increase inhazardous materials movements of 44%. The Brightwood location (eastbound fromPortland) showed the largest seasonal change in total truck traffic, increasing 50% inAugust.
< For all the surveys combined, flammables were most common (54%), followed bycorrosives (16%) and dangerous shipments (e.g., a combination of flammables andcorrosive materials) (6%). There was a noticeable difference in hazard classbreakdowns at the four inbound locations: only 38% were flammable, 21% werecorrosives, and nearly 16% were dangerous.
< Petroleum products accounted for 30% of all movements, and averaged 6,000 to 9,000gallons per shipment. By number of shipments, paint was the most commonly importedcommodity, accounting for 14% of inbound commodities, ranging from 3,000 to 5,000pounds per shipment. A large percentage of total movements were hazardous waste,but this was largely attributed to temporary cleanup activities at a nearby Superfund site.
< Of the traffic originating outside of Oregon, 83% originated in the border states: California, Nevada, Washington, and Idaho.
3.5 VIRGINIA
Multi Modal Hazardous Materials Transportation in Virginia describes two surveys, one conductedin 1977 and one in 1978, that were part of a series of six studies undertaken to identify the nature andvolume of hazardous materials flows and the associated accident potential for certain transport modes inVirginia.
The 1977 highway study was based on data collected in July and August, from 8 a.m. to 5 p.m.at 38 locations throughout Virginia: ten weigh stations and 28 locations along the Federal-Aid Primary
32
Hazardous Materials Routing Study Phase II:Analysis of Hazardous Materials Truck Routes inProximity to the Dallas Central Business DistrictOctober 1985
North Central Texas Council of GovernmentsRegional Information CenterP.O. Box 5888Arlington TX 76005-5888(817) 640-3300
system. The 1978 study was conducted from April through December on days with two 12-hour shifts,beginning at 7 a.m. at nine weigh stations throughout the state. All trucks were surveyed by examiningshipping papers and interviewing drivers. Survey staff for both studies were graduate assistants from theVirginia Polytechnic Institute and State University.
The surveys provided daily estimates of the total number of hazardous materials shipments andthe total tonnage of hazardous materials shipped, along with their routing characteristics, for each sectionof each route on the primary and Interstate systems in Virginia.
The percentage of trucks transporting hazardous materials dropped from approximately 13% in1977 to approximately 7% in 1978. However, the average load per truck nearly doubled during the sameperiod.
The hazard class breakdowns changed very little between the two studies. In 1977, flammableand combustible liquids, and corrosives accounted for approximately 75% of all hazardous materialstransported, of which approximately 64% were flammable and combustible liquids. In 1978, flammableand combustible liquids and corrosives still accounted for approximately 75% of the total, withapproximately 62% representing flammable and combustible liquids. Both surveys showed heaviesthazardous materials traffic occurring on the Interstate system, particularly in and around urban areas,although during an average trip, most truck traffic in Virginia uses portions of both the Interstate andprimary systems.
Time of day and seasonal variations in hazardous materials flows were determined for the 1978survey only. Of all the truck traffic, 8% of the trucks carried hazardous materials during daylight hoursand nearly 5% transported hazardous materials at night. The percentage of all trucks surveyedtransporting hazardous materials was 10% during the spring, 6.2% during the summer, and 7.1% duringthe fall.
3.6 DALLAS CENTRAL BUSINESS DISTRICT
In 1978, the Dallas City Council amended the city codes to prohibit trucks transporting hazardousmaterial from using depressed and elevated portions of Interstate Highways 30 and 45 near the DallasCentral Business District (CBD) and specified a set of arterial routes to bypass the restricted Interstatesegments. As follow-up, Dallas conducted this study to analyze and compare the risks associated withhazardous materials shipments on the restricted highway routes to the designated arterial bypass routes. Concern over the potential for motorists to be trapped in depressed or elevated portions of the highwaysystem during a hazardous materials emergency was a motivating factor for this study.
An initial inventory was conductedby assembling available information fromFederal, state and local agencies, includingthe Dallas Fire, Emergency Preparedness,Streets and Sanitation, and Water UtilityDepartments, as well as the TexasDepartment of Water Resources, the U.S.DOT Materials Transportation Bureau(MTB), and the U.S. EnvironmentalProtection Agency. Little of thisinformation was useful due to theregulatory and reporting framework withinwhich it was collected, therefore, Dallasdecided to conduct its own data collection activities.
Dallas used the FHWA Report Guidelines for Applying Criteria to Designate Routes forTransporting Hazardous Materials as a basic framework to design its study. Several enhancements weremade to FHWA's risk assessment approach, including modifications to both the risk assessment

33
algorithm and the information collection regarding the types and quantities of materials beingtransported.
Three data collection efforts were designed: an inventory of local industries, a visual count ofhazard placarded vehicles, and the identification of bulk gasoline storage facilities in the Dallas-FortWorth area. The inventory sought to identify the types of hazardous materials transported locally, theroutes used, and the frequency and time of day for the shipments. An industry survey was sent to 1,400Dallas and Dallas County industries and transporters that were selected based on SIC code andidentified from several information sources, including federal, state, local, and private agencies.
Of the 1,400 industries surveyed, about 300 industries responded; only 100 of these provideddetailed information. The majority of bulk shipments are gasoline or petroleum-related, and a number ofother materials are regularly being shipped through the area. The data indicated that as many as 25 to30 9,000-gallon shipments of gasoline travelled in proximity to the Dallas CBD each day.
The vehicle count was designed to complete the picture of local shipments and to establish anestimate of the frequency and types of hazardous materials transported in proximity to downtown Dallas. Six locations for the counts were established surrounding the CBD; all locations were on the freewaysystem, not on the arterial routes designated by the City Council. Four survey teams of two to three menconducted windshield counts over 10 four-hour periods, all of which occurred on weekdays over severalweeks. Counts were completed for 20 hours of a 24-hour period. For about half of the survey time, alltrucks passing the survey locations were counted in order to determine the percentage of total trucktraffic that was hazardous.
The vehicle counts indicated that hazardous materials account for 5.2% of the total truck traffic,with most shipments occurring during the day. Seventy-four percent of the vehicles recorded were tanktrucks; of those, over 70% were carrying gasoline. Most of these counts were consistent with nationalstatistics.
After tallying the data, several sources of information (MTB data, NTSB accident reports, and aDOE report on the risk of transporting gasoline by truck) were reviewed to better understand the causesand results of hazardous materials accidents. These data indicated that a majority of accidents involvedflammable liquids (e.g., gasoline), and also that most fatalities or injuries occurred simultaneously withthe accident, and thus emergency response actions could have done little to alleviate the fatalities andinjuries.
The survey data, the above information, and the fact that the arterial routes selected are morecongested with more exposure to the public (e.g., closer to schools, stores, sidewalk traffic) led theDallas City council to the conclusion that the arterial routes do not decrease the risk to the public, butmight actually increase it. Accident probabilities were calculated taking into account potential for tankrupture (perhaps resulting from abrasion), speed, proximity of other motorists, and road geometries;these showed that the highways might actually be safer than the arterial routes. Based upon the dataanalysis, the city of Dallas has seriously questioned the use of arterial routes for the transportation ofhazardous materials and would continue to reevaluate their routing plans. Also, safety, training,inspection, enforcement and other programs are being considered to reduce potential risks to motoristsand the public.
3.7 COMPARING SURVEY EXPERIENCES
As described above, several states and at least one major metropolitan area conducted highwayhazardous materials flow studies of varying complexity. However, all of these studies were designed toprovide specific and reliable information that was previously unavailable or difficult to assemble fordecision-making purposes. Because this objective was achieved to an acceptable degree, the surveyprocedures adopted, with emphasis on key elements of survey design, are discussed below.
34
All surveys reviewed, with the exception of those in Dallas-Ft. Worth, Nevada, and possiblyIdaho, were conducted in ways that revealed important daily and seasonal fluctuations in hazardousmaterials flows. On average, those surveys spanned eight, but not necessarily consecutive, calendarmonths and at least two seasons. Oregon's survey (three days of continuous sampling during differentseasons) was probably successful in establishing whether fluctuations in flows exist. But the selection ofsurvey sites in Oregon may not be a good model for other states whose objectives encompass a broader(i.e., statewide) base of inquiry. Seven of the ten Oregon survey sites were within 100 miles of thePortland metropolitan area, primarily because flows into and out of Portland were the study's primaryfocus. It would not therefore be appropriate to term Oregon's survey a statewide effort. Similarly, resultsof the Dallas/Ft. Worth survey should neither be applied statewide nor necessarily consideredrepresentative of other major metropolitan areas in Texas.
Data from the Virginia survey were more comprehensive than Oregon's and likely to include late-week and weekend activity that Oregon would have missed. However, the Oregon interviewers mayhave observed more about individual trucks and shipments because of their relevant professionalexperience and because of the selective truck inspections conducted.
Exhibit 14 summarizes the results of five of these hazardous truck traffic studies with respect tothe surveyed distribution of hazardous commodities by type and compares these results to thedistribution of highway hazardous materials transportation accidents by hazardous materials type in eachstate for:
< The two-year period 1989-90 based on data reported to DOT/RSPA Hazardous MaterialInformation Reporting System (HMIS); and
< The two-year period 1987-88 from the DOT/OMC 50-T Master File of Accidents of MotorCarriers of Property.
The exhibit shows that considerable insight can be gained from these databases prior to planningand conducting a flow study. Even though the HMIS and OMC 50-T data are compiled fromtransportation accidents, rather than flows, distribution of incidents in some cases closely parallels therevealed survey share of commodity flow within both state of occurrence and hazardous materials class.
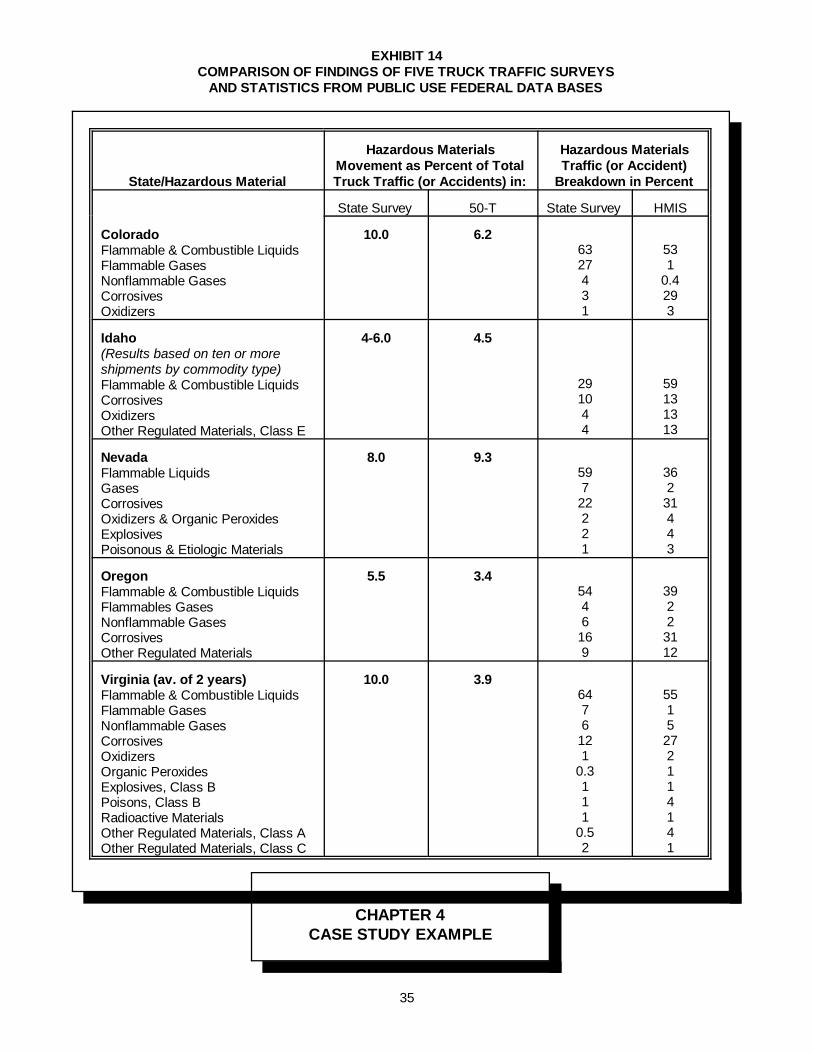
35
State/Hazardous Material
Hazardous MaterialsMovement as Percent of TotalTruck Traffic (or Accidents) in:
Hazardous MaterialsTraffic (or Accident)
Breakdown in Percent
State Survey 50-T State Survey HMIS
ColoradoFlammable & Combustible LiquidsFlammable GasesNonflammable GasesCorrosivesOxidizers
10.0 6.26327431
531
0.4293
Idaho(Results based on ten or moreshipments by commodity type)Flammable & Combustible LiquidsCorrosivesOxidizersOther Regulated Materials, Class E
4-6.0 4.5
291044
59131313
NevadaFlammable LiquidsGasesCorrosivesOxidizers & Organic PeroxidesExplosivesPoisonous & Etiologic Materials
8.0 9.3597
22221
362
31443
OregonFlammable & Combustible LiquidsFlammables GasesNonflammable GasesCorrosivesOther Regulated Materials
5.5 3.45446
169
3922
3112
Virginia (av. of 2 years)Flammable & Combustible LiquidsFlammable GasesNonflammable GasesCorrosivesOxidizersOrganic PeroxidesExplosives, Class BPoisons, Class BRadioactive MaterialsOther Regulated Materials, Class AOther Regulated Materials, Class C
10.0 3.96476
121
0.3111
0.52
5515
272114141
CHAPTER 4CASE STUDY EXAMPLE
EXHIBIT 14COMPARISON OF FINDINGS OF FIVE TRUCK TRAFFIC SURVEYS
AND STATISTICS FROM PUBLIC USE FEDERAL DATA BASES

36
To conclude this guidance, this chapter presents a hypothetical example of how a state designed andcarried out a study and the conclusions they reached following the step-wise guidance presented in Chapter 2. The user of this guidance can also consult Chapter 3 for examples of studies that have actually been carried out.
4.1 IDENTIFY PURPOSE OF STUDY
State officials know that several counties lie along a well traveled highway corridor between a majorbenzene plant and a petroleum refinery complex at which large volumes of premium-grade gasoline areproduced. They need to determine whether the quantity of benzene and other aromatic hydrocarbons shippedthrough the counties warrants new emergency response training for local fire and public safety agencies orwhether a state emergency response team headquartered nearby has adequate response capability. To answerthe above questions, a flow study is planned at survey locations on the two major highways serving the shippingcorridor.
4.2 ASSEMBLE EXISTING INFORMATION
Prior to undertaking the actual survey, available data are examined for possible insights into the flowpattern as it exists. Count data from a Highway Performance Monitoring System (HPMS) surveillance point onthe most-travelled (>13,500 vehicles/day) of the two highways indicates a heavy combination truck volume of6.3 percent in spring and 6.7 percent in autumn, or between 850 and 900 large trucks per average weekday. Expanded to the entire corridor, this estimate could approach 1,600 trucks. The Hazardous Materials InformationSystem (HMIS) data base for 1985-90 shows that four incidents involving hazardous materials releases occurredduring truck hauls from the community containing benzene plant to the refinery complex site; all but one involvedaromatic hydrocarbons. This statistic is generally consistent with records of the Office of Motor Carriers 50-Tdatabase (historically available, but now superseded by the Safety Net database, see page 8) for the sameperiod, although one of the incidents included in the HMIS apparently did not meet the damage threshold forreporting to the DOT Office of Motor Carriers, and another did not involve an interstate-registered carrier. The50-T indicates that 12 percent of interstate-registered heavy combination truck accidents reported in that corridorfrom 1985 through 1990 involved at least one vehicle carrying hazardous cargo. Assuming that accidents bycargo type are proportional to flows by cargo type, upwards of 200 trucks per day could be hauling hazmatsthrough the corridor.
The State Highway Division follows up with each of the carriers involved in the HMIS incidents to a)verify shipment origin, destination, and location of incident, and b) confirm the nature and cause of the release. The carriers are also asked about how many hazardous shipments per year they handle between the benzeneplant and the refineries; two of the three carriers provide complete shipment records for the relevantconsignments that cover the year just preceding (the third carrier provides a rough estimate). Finally, the LEPCprovides inventories of hazardous materials stored on site submitted to them by the refinery operators underSARA Title III. The quantity of aromatic hydrocarbons available at any one time at the refineries representsabout 20 percent of the monthly production capacity of the benzene plant; thus, it is possible that the plant issupplying up to 100 percent of the refineries' collective benzene requirements.
4.3 DESIGN STUDY
Survey stations are established at four locations, one near each end of the two corridor routes. For twoof the four locations, existing weigh station facilities are available. The other two are set up 1) adjacent to afreeway rest area and 2) by a large restaurant/service station facility catering primarily to truckers. Truck trafficis sampled for sixteen hours a day (6 a.m. to 12 a.m.) in two working shifts over two-week periods in early springand mid-autumn.
4.4 CONDUCT STUDY
A total of 13,986 (non-duplicate) trucks are surveyed in the spring and 14,777 in the autumn; based onHPMS data, this is believed to represent better than a 60 percent (three-fifths) sample of all truck movements
37
during each recording period. Survey data are processed such that they can be sorted, tabulated or summed onany variable. Results of this (hypothetical) survey are summarized in Exhibit 14.
4.5 ANALYZE RESULTS
Based on the count results only, the Highway Division can interpolate the values in Exhibit 15 to be 99%confident that the survey may have missed as many as 44 trucks carrying combustible liquids during the springsurvey period, or over-represented the typical bi-weekly spring flow of such combustibles by as many as 38trucks. Other confidence ranges by hazmat class are similarly computed.
Although the limited routing data collected from truckers clearly indicate a strong linkage between thebenzene producer and the refinery complex, the total volumes of aromatics shipped are not especially high. However, important seasonal and time-of-week variations in the number of shipments are revealed by thesurvey. Larger quantities of benzene are shipped in the spring than in the fall, as the refineries gear up toproduce enough gasoline to meet peak summertime demand. In the autumn, more distillate oil production forwinter heating significantly reduces benzene shipments and quantities. Moreover, more benzene is shipped onMondays, Tuesdays, and Fridays (apparently to accommodate refinery production schedules) than onWednesdays, Thursdays, and weekends. About 30 percent of this movement is taking place during the nighttimehours.
An unexpected survey finding is that large volumes of highly corrosive metal-processing wastegenerated in a neighboring state are being shipped along the corridor for disposal in another state. Thehazardous waste facility in that state to which the effluent had been sent for disposal for the past 20 years wasnow closed, creating the need to move the waste much greater distances for disposal.
4.6 APPLY RESULTS TO PURPOSE
On the basis of their analysis of the flow data, the state officials determine that additional preparednesstraining for an emergency involving aromatics is not needed at the local level. However, additional capabilitiesand procedures for off-hours notification of the state's hazmat team need to be installed in all local emergencyresponse vehicles and departments in the corridor. The state officials also adjust their estimate of delay betweenthe time of occurrence of a benzene transportation emergency and the hazmat team's arrival at the scene. Itsformer "worst case" (i.e., late night hours) is now a "probable case." In addition, they decide to increaseinventories of chemical neutralizing agents, surfactants, and foams at fire departments throughout the affectedcounties.
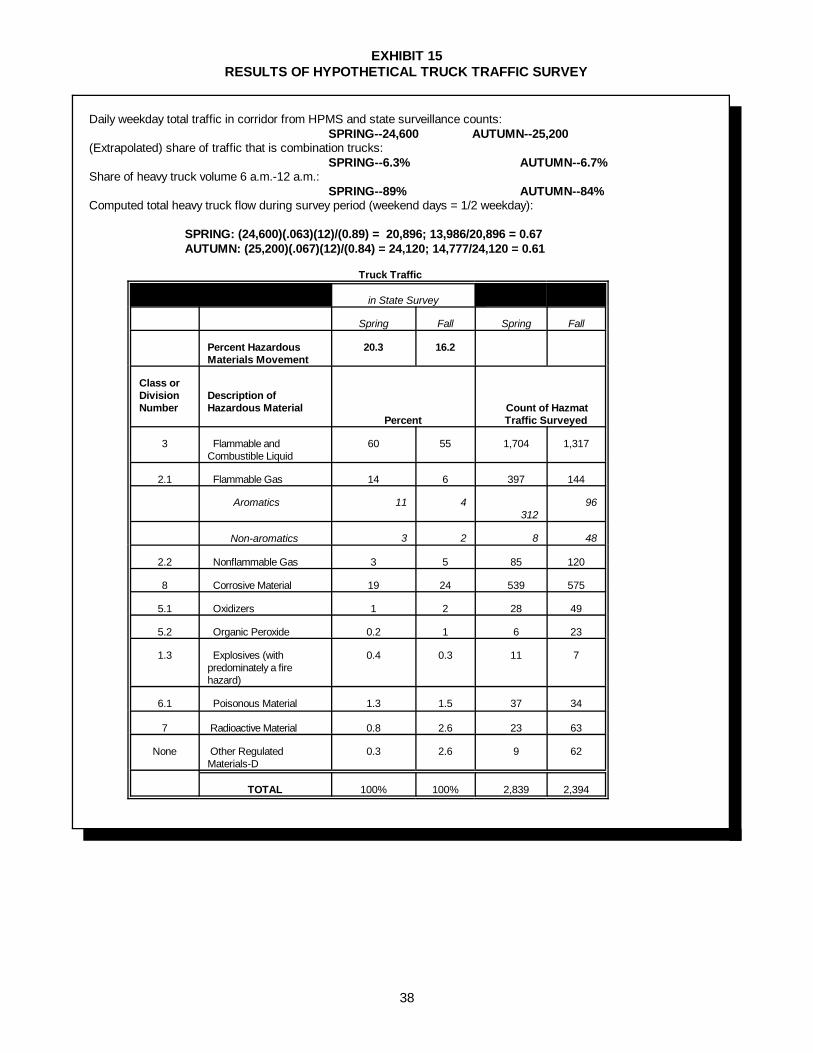
38
Daily weekday total traffic in corridor from HPMS and state surveillance counts:SPRING--24,600 AUTUMN--25,200
(Extrapolated) share of traffic that is combination trucks:SPRING--6.3% AUTUMN--6.7%
Share of heavy truck volume 6 a.m.-12 a.m.:SPRING--89% AUTUMN--84%
Computed total heavy truck flow during survey period (weekend days = 1/2 weekday):
SPRING: (24,600)(.063)(12)/(0.89) = 20,896; 13,986/20,896 = 0.67AUTUMN: (25,200)(.067)(12)/(0.84) = 24,120; 14,777/24,120 = 0.61
Truck Traffic
in State Survey
Spring Fall Spring Fall
Percent HazardousMaterials Movement
20.3 16.2
Class orDivisionNumber
Description of Hazardous Material Percent
Count of HazmatTraffic Surveyed
3 Flammable and Combustible Liquid
60 55 1,704 1,317
2.1 Flammable Gas 14 6 397 144
Aromatics 11 4 312
96
Non-aromatics 3 2 8 48
2.2 Nonflammable Gas 3 5 85 120
8 Corrosive Material 19 24 539 575
5.1 Oxidizers 1 2 28 49
5.2 Organic Peroxide 0.2 1 6 23
1.3 Explosives (with predominately a fire hazard)
0.4 0.3 11 7
6.1 Poisonous Material 1.3 1.5 37 34
7 Radioactive Material 0.8 2.6 23 63
None Other Regulated Materials-D
0.3 2.6 9 62
TOTAL 100% 100% 2,839 2,394
EXHIBIT 15RESULTS OF HYPOTHETICAL TRUCK TRAFFIC SURVEY
A-1
APPENDIX ADESCRIPTION AND OUTPUT
OF ACOMMODITY FLOW
ALLOCATION MODEL(SRI International, 1993)
A.1 DESCRIPTION OF THE COMMODITY FLOW ALLOCATION MODEL
A commodity flow allocation model was used by SRI International to assign hazardous chemicalflows between producers and consumers. The model is a modified gravity model based on the premisethat the shorter the distance between an origin-destination pair (e.g., a chemical production facility and aconsumer of that chemical), the greater the likelihood of cargo flow between that pair. In this study, thefollowing assumptions were used in the implementation of the gravity model:
< Available supply at each origin (e.g., production location) was set equal to the netproduction available for truck shipments.
< The total amount demanded at each destination was set equal to the estimated demandfor truck delivery.
< The impedance relation was modified to reflect corporate affiliations (captiveconsumers) and possible use of terminal facilities.
< After discussions with chemical producers, it was discovered that some consumingplants, as a matter of policy, do not purchase from specified companies. For thesecases, the flow between origin and destination was set to zero.
To estimate the highway distances between origins and destinations and highway routes used by truckingcompanies, an off-the-shelf software package called PCMiler is used. PCMiler identifies the minimumdistance between two points for specified types of highway (e.g., interstates). ZIP codes were used toidentify the locations of producing and consuming plants.
The unaltered gravity model has a tendency to attempt to assign at least a small increment offlow to all possible origin-destination pairs. In reality, such small commodity flows do not occur. Themodel, therefore, truncates all flows below a minimum threshold value and sets the cell value to zero. The minimum threshold was set equal to 20 tons per year (e.g., the approximate weight of one average-sized bulk truck load per year).
A.2 OVERVIEW OF CHEMICALS STUDIED
Using a generalized gravity flow model, SRI developed a list of 147 large-volume chemicals thataccount for at least 80% of U.S. truck shipments of hazardous chemicals. Exhibit A-1 lists thesechemicals and their estimated production volumes, in decreasing order. Three chemicals were selectedfor detailed analysis using the model: 1-butanol, dodecene-1, and phosphorus pentasulfide. In the nextsubsections, brief overviews of the characteristics, uses, and geographical distribution of producers andconsumers are presented.

A-2
DOT Emergency ResponseGuidebook (ERG) . The ERG is not aregulatory guide, but is designed forthe sole purpose of aiding emergencyresponders in the initial phases of anincident.
A.2.1 1-Butanol
1-Butanol, which appears in the top one-thirdof the chemicals listed in Exhibit A-1, is a low-boilingliquid classified as a fire or explosion and healthhazard (Guide No. 26 in the DOT EmergencyResponse Guidebook [ERG]). The chemical isprincipally used for the production of methacrylateesters, glycol ethers, and butyl acetate, as well asdirect use as a solvent.
U.S. production of 1-butanol in 1987 is estimated at 575,000 short tons, of which 450,000 shorttons was available for shipment to off-site consumers. All production is in the Texas-Louisiana region,while consumption of the chemical is concentrated in the Chicago, Illinois, New Jersey, and Los Angeles,California areas. There are six producers (five of which have terminals) and 67 major consuming plants.
1-Butanol is shipped by barge, rail, and truck. Most large volume shipments of 1-butanol aremade by barge using inland and coastal waterways. Rail shipments are used for large volumemovements that do not follow navigable waterways. Truck movements tend to be limited to short haul(i.e., from a terminal to the end-user) or small volume shipments in drums. Companies using 1-butanol as a solvent have it delivered by truck in mixed shipments using compartmented tankwagonsor cargo tank trucks. Most tankwagon shipments originate from terminals located near major consumingcenters. It is estimated that 83,200 short tons are delivered annually by truck.
A.2.2 Dodecene-1
Dodecene-1, with an estimated 1987 production of 200,000 short tons, is in the middle third ofthe list of 147 chemicals. It is a high-boiling liquid identified as propylene tetramer and is classified as afire, explosion, and health hazard (Guide No. 27 in the DOT ERG). Consumption of dodecene-1 isprimarily for the production of branched dodecylbenzene, tridecyl alcohol, and dodecylphenol.
Because dodecene-1 is used in the manufacture of other chemicals at its producing plants, thequantities used in captive production are not available for shipment elsewhere. Of the plants producingdodecene-1, four were identified as net producers that ship their product domestically, either directlyfrom their plant or from terminals supplied by barge or other ocean-going vessels. Several additionalproduction plants were eliminated from the analysis because contacts in the industry confirmed that noproduct was available for off-site shipment by highway.
Thirteen plants were identified as net consumers of the chemical, and of these only eightreceived shipments by truck. An estimated 15,100 tons are shipped by highway.
A.2.3 Phosphorus Pentasulfide
Phosphorus pentasulfide, with an estimated U.S. production of 70,000 short tons in 1987, is inthe lower third of the list of chemicals given in Exhibit A-1. It is a high-melting solid that may ignite in thepresence of moisture and produce poisonous gas, as identified in DOT ERG Guide No. 41. Phosphoruspentasulfide is used primarily for production of pesticides and lubricating oil additives. Production andconsumption are widely distributed from the Northeast to the Southeast.
Four plants produce phosphorus pentasulfide, and thirteen plants are identified as net consumersof phosphorus pentasulfide. Most consuming plants are located in the Mid-Atlantic and Southern states,and the producing plants are in Illinois, Kansas, Pennsylvania, and Tennessee. One of the consumingplants receives shipments exclusively by rail, and the remaining twelve have an estimated demand of52,500 tons.
EXHIBIT A-1LIST OF 147 LARGE VOLUME CHEMICALS

A-3
Production Production Volume, 1987 Volume, 1987(thousands of (thousands of
Chemical Short Tons) Chemical Short Tons)
Sulfuric AcidPropaneNitrogenOxygenAmmoniaCalcium OxideSodium HydroxideChlorine GasPhosphoric AcidSulfurCarbon DioxideEthylene DichlorideAmmonium NitrateNitric Acid (100% HNO3 Basis)BenzeneEthylbenzeneVinyl ChlorideStyreneMethanolTolueneEthylene OxideHydrochloric Acid (100%)P-XyleneMethyl-T-Butyl EtherPhenolAcetic Acid, Synthetic1,3-ButadieneEthanol (Synthetic)Aluminum SulfateCarbon Black (Furnace Black)Vinyl AcetateAcrylonitrileFormaldehydeCyclohexanePropylene OxideAcetoneButyraldehydeAcetic AnhydrideAdipic AcidIsopropanolNitrobenzene1-ButanolArgon
39,23526,89624,51516,66916,10015,73311,48611,01910,68510,3218,3077,8787,6127,2255,9044,6304,2014,0073,7693,2232,9212,8692,5781,7571,6761,6231,4651,4341,4261,3621,2531,2501,2321,1371,1051,048879858795685625575560
Acrylic AcidHexamethylenediamineIsobutyleneHydrogen CyanideMethyl MethacrylatePhthalic AnhydrideO-XyleneMethylene-Diphenylene DiisocyanateCyclohexanoneBariteAnilineHexanePhosgeneLinear Alkylate SulfonateHydrogenCarbon TetrachlorideAcetaldehydeToluene DiisocyanateMethylchloroformPhosphorusMethyl Ethyl KetoneSodium ChlorateTripropylene (Nonene)Hydrofluoric AcidMethyl ChlorideMethylene DichlorideN-Butyl AcrylatePotassium HydroxidePerchloroethylene1-ButeneCalcium CarbideSulfur DioxideEpichlorohydrinChloroformPropylene Tetramer (Dodecene)Maleic AnhydrideDichlorodifluoromethane (F12)AcetyleneCarbon DisulfideEthylene Glycol Monobutyl EtherBromineEthyle Acrylate
550543518516514508470467
465448430426421399389374363357347344336289275274261259258246237231230229225224200193184182180175168162
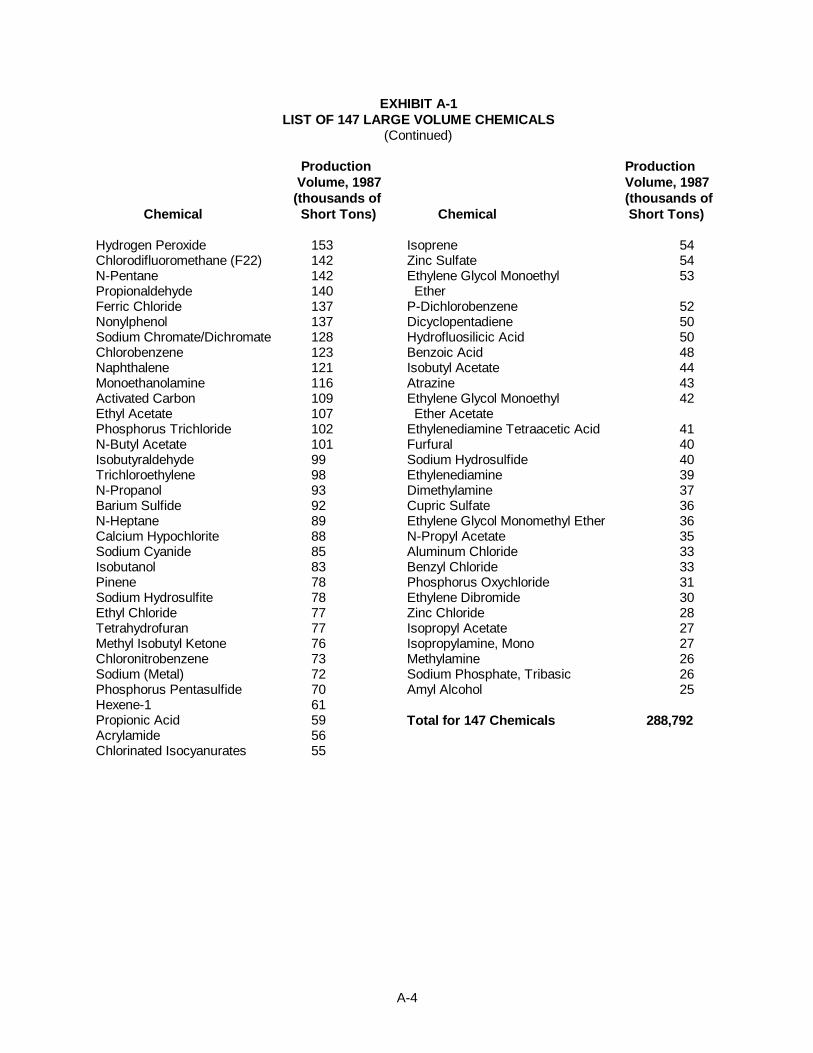
A-4
EXHIBIT A-1LIST OF 147 LARGE VOLUME CHEMICALS
(Continued)
Production Production Volume, 1987 Volume, 1987(thousands of (thousands of
Chemical Short Tons) Chemical Short Tons)
Hydrogen PeroxideChlorodifluoromethane (F22)N-PentanePropionaldehydeFerric ChlorideNonylphenolSodium Chromate/DichromateChlorobenzeneNaphthaleneMonoethanolamineActivated CarbonEthyl AcetatePhosphorus TrichlorideN-Butyl AcetateIsobutyraldehydeTrichloroethyleneN-PropanolBarium SulfideN-HeptaneCalcium HypochloriteSodium CyanideIsobutanolPineneSodium HydrosulfiteEthyl ChlorideTetrahydrofuranMethyl Isobutyl KetoneChloronitrobenzeneSodium (Metal)Phosphorus PentasulfideHexene-1Propionic AcidAcrylamideChlorinated Isocyanurates
1531421421401371371281231211161091071021019998939289888583787877777673727061595655
IsopreneZinc SulfateEthylene Glycol Monoethyl EtherP-DichlorobenzeneDicyclopentadieneHydrofluosilicic AcidBenzoic AcidIsobutyl AcetateAtrazineEthylene Glycol Monoethyl Ether AcetateEthylenediamine Tetraacetic AcidFurfuralSodium HydrosulfideEthylenediamineDimethylamineCupric SulfateEthylene Glycol Monomethyl EtherN-Propyl AcetateAluminum ChlorideBenzyl ChloridePhosphorus OxychlorideEthylene DibromideZinc ChlorideIsopropyl AcetateIsopropylamine, MonoMethylamineSodium Phosphate, TribasicAmyl Alcohol
Total for 147 Chemicals
545453
52505048444342
414040393736363533333130282727262625
288,792
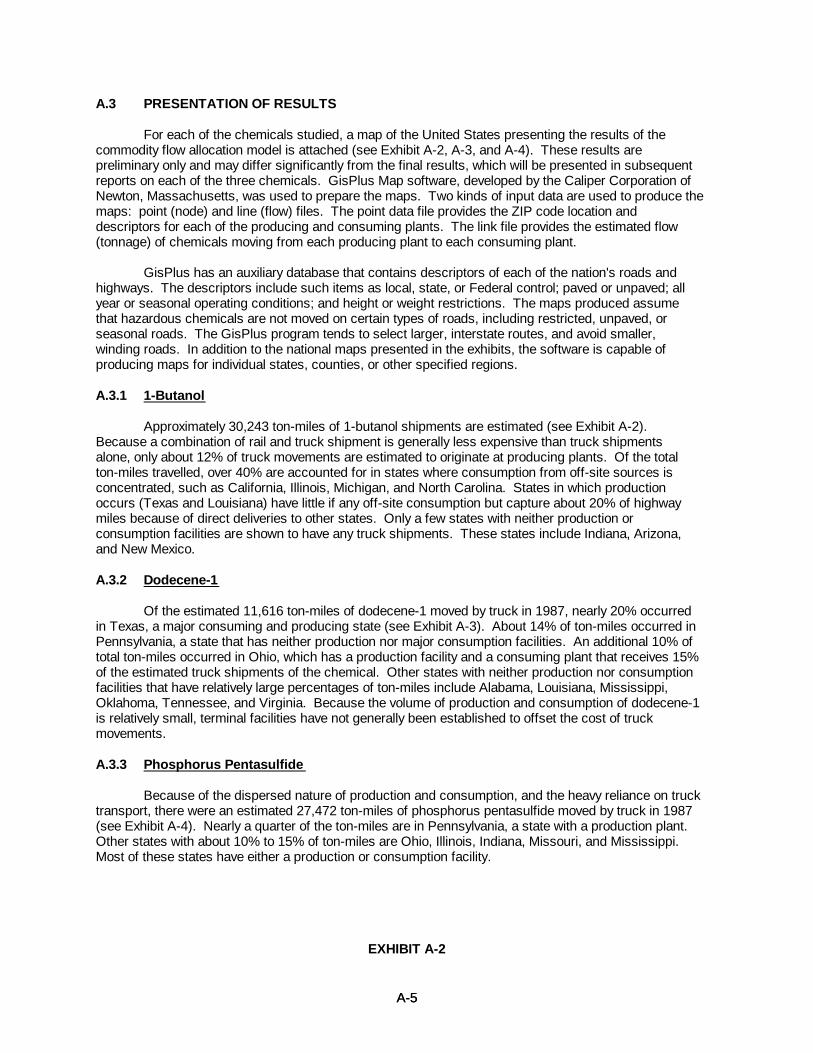
A-5A-5
A.3 PRESENTATION OF RESULTS
For each of the chemicals studied, a map of the United States presenting the results of thecommodity flow allocation model is attached (see Exhibit A-2, A-3, and A-4). These results arepreliminary only and may differ significantly from the final results, which will be presented in subsequentreports on each of the three chemicals. GisPlus Map software, developed by the Caliper Corporation ofNewton, Massachusetts, was used to prepare the maps. Two kinds of input data are used to produce themaps: point (node) and line (flow) files. The point data file provides the ZIP code location anddescriptors for each of the producing and consuming plants. The link file provides the estimated flow(tonnage) of chemicals moving from each producing plant to each consuming plant.
GisPlus has an auxiliary database that contains descriptors of each of the nation's roads andhighways. The descriptors include such items as local, state, or Federal control; paved or unpaved; allyear or seasonal operating conditions; and height or weight restrictions. The maps produced assumethat hazardous chemicals are not moved on certain types of roads, including restricted, unpaved, orseasonal roads. The GisPlus program tends to select larger, interstate routes, and avoid smaller,winding roads. In addition to the national maps presented in the exhibits, the software is capable ofproducing maps for individual states, counties, or other specified regions.
A.3.1 1-Butanol
Approximately 30,243 ton-miles of 1-butanol shipments are estimated (see Exhibit A-2). Because a combination of rail and truck shipment is generally less expensive than truck shipmentsalone, only about 12% of truck movements are estimated to originate at producing plants. Of the totalton-miles travelled, over 40% are accounted for in states where consumption from off-site sources isconcentrated, such as California, Illinois, Michigan, and North Carolina. States in which productionoccurs (Texas and Louisiana) have little if any off-site consumption but capture about 20% of highwaymiles because of direct deliveries to other states. Only a few states with neither production orconsumption facilities are shown to have any truck shipments. These states include Indiana, Arizona,and New Mexico.
A.3.2 Dodecene-1
Of the estimated 11,616 ton-miles of dodecene-1 moved by truck in 1987, nearly 20% occurredin Texas, a major consuming and producing state (see Exhibit A-3). About 14% of ton-miles occurred inPennsylvania, a state that has neither production nor major consumption facilities. An additional 10% oftotal ton-miles occurred in Ohio, which has a production facility and a consuming plant that receives 15%of the estimated truck shipments of the chemical. Other states with neither production nor consumptionfacilities that have relatively large percentages of ton-miles include Alabama, Louisiana, Mississippi,Oklahoma, Tennessee, and Virginia. Because the volume of production and consumption of dodecene-1is relatively small, terminal facilities have not generally been established to offset the cost of truckmovements.
A.3.3 Phosphorus Pentasulfide
Because of the dispersed nature of production and consumption, and the heavy reliance on trucktransport, there were an estimated 27,472 ton-miles of phosphorus pentasulfide moved by truck in 1987(see Exhibit A-4). Nearly a quarter of the ton-miles are in Pennsylvania, a state with a production plant. Other states with about 10% to 15% of ton-miles are Ohio, Illinois, Indiana, Missouri, and Mississippi. Most of these states have either a production or consumption facility.
EXHIBIT A-2
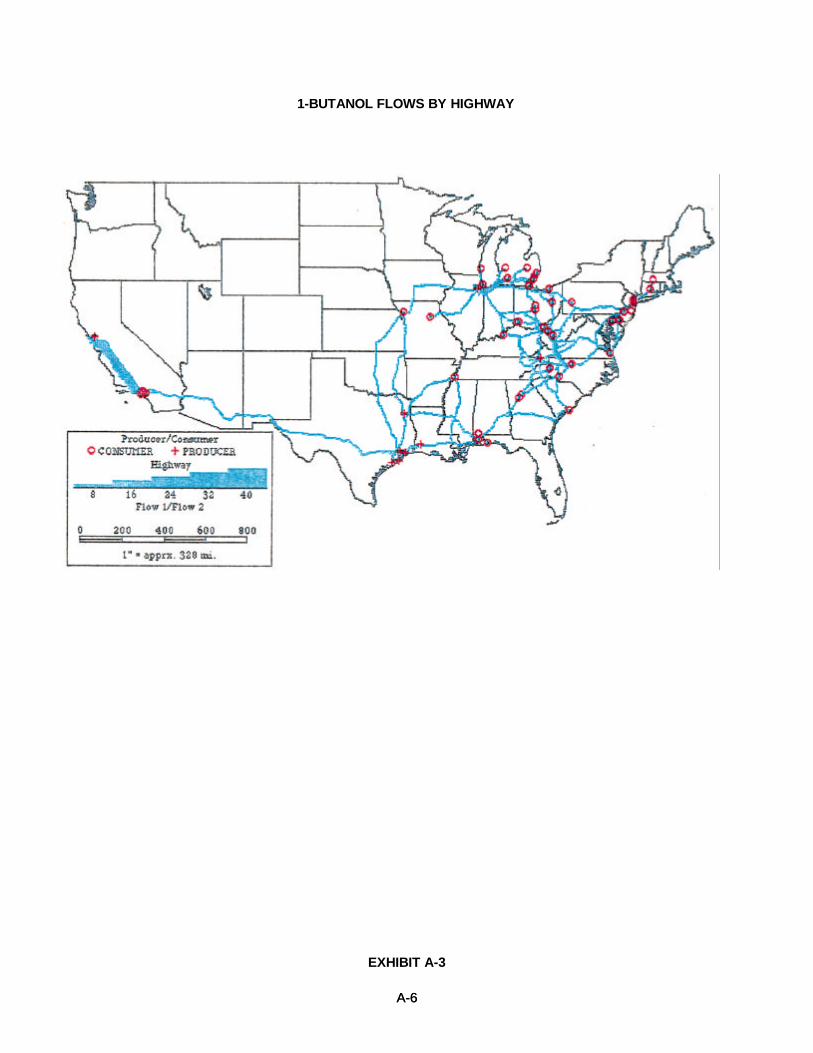
A-6A-6
1-BUTANOL FLOWS BY HIGHWAY
EXHIBIT A-3
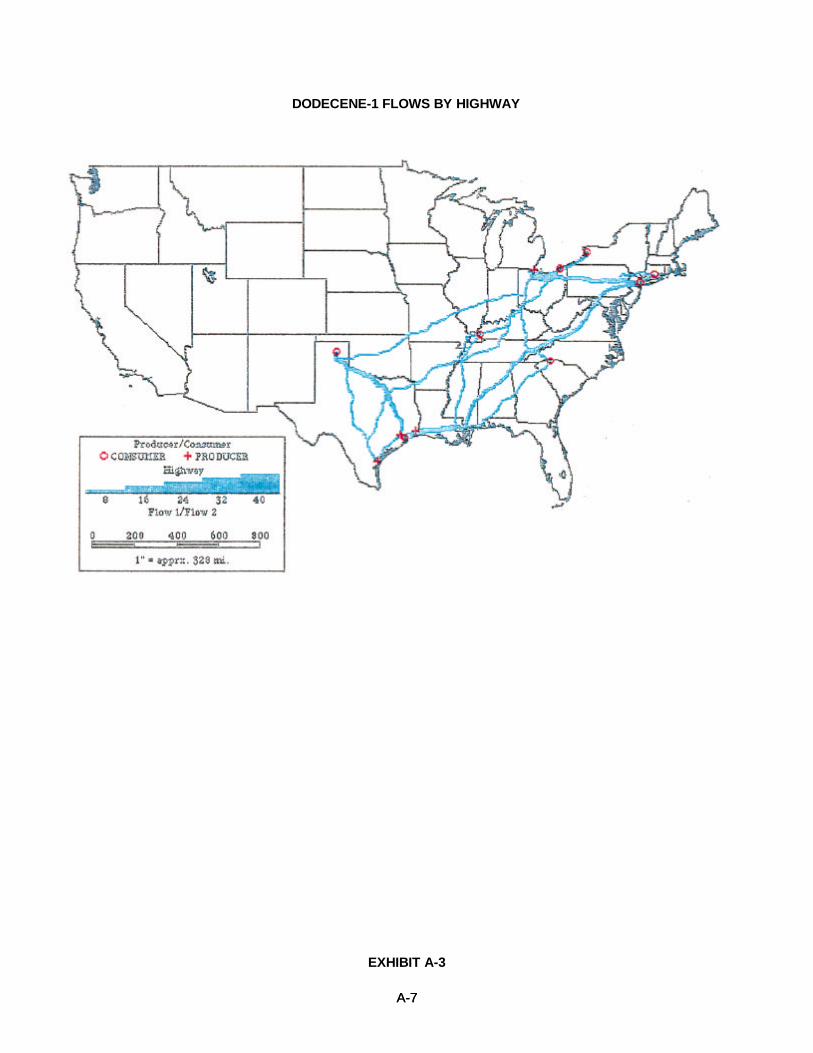
A-7A-7
DODECENE-1 FLOWS BY HIGHWAY
EXHIBIT A-3
A-8A-8
DODECENE-1 FLOWS BY HIGHWAY

A-9A-9
R-1
REFERENCES
Guidelines for Applying Criteria to Designate Routes for Transporting Hazardous Materials , ReportNumber: DOT/RSPA/OHMT-89-02, Washington, D.C., July 1989.
Guidelines for Selecting Preferred Highway Routes for Highway Route Controlled Quantity Shipments ofRadioactive Materials , Report Number: DOT/RSPA/HMS/92-02, Washington, D.C., August1992.
Kessler, Dan, Hazardous Materials Routing Study Phase II: Analysis of Hazardous Materials TruckRoutes in Proximity to the Dallas Central Business District , No. Central Texas Council ofGovernments, Arlington, TX, October 1985.
Hildebrand, L.K. and Edward J. Barber, Implementation Package: Guidelines for Applying Criteria toDesignate Routes for Transporting Hazardous Materials , Report Number FHWA-IP-80-15,Washington, D.C., 1980.
Urbanek, Gary L. and Edward J. Barber, Development of Criteria to Designate Routes for TransportingHazardous Materials , Report Number FHWA-RD-80-105, Washington, D.C., 1980.
Risk Assessment/Vulnerability Users Manual for Small Communities and Rural Areas , Report Number: DOT/RSPA/DPB-50/81/29, Washington, D.C., October 1981.
Conference on Recent Advances in Hazardous Materials Transportation Research: An InternationalExchange , Preprint Volume, Transportation Research Board, National Research Council,Washington, D.C., November 1985.
Hazardous Material Transportation Monitoring and Capability Study: Agency Resource Capability , BoiseState University, September 1988. Prepared for Idaho Department of Law Enforcement, andIdaho State Police.
Hazardous Material Transportation Monitoring and Capability Study for the Purpose of Assessing Risk tothe Public , Boise State University, January 1988. Prepared for Idaho Department of LawEnforcement, and Idaho State Police.
Present Practices of Highway Transportation of Hazardous Materials , Task B Final Report, LiteratureReview , Report Number: USDOT/FHWA-RD-89-013, McLean, Virginia, January 1987. Prepared by Midwest Research Institute.
Starry, Claire, Kirtland E. McCaleb, and William A. Stock, Study of Truck Transportation of HazardousChemicals, SRI International, Menlo Park, California.
Transportation of Hazardous Materials , Report Number: OTA-SET-304, U.S. Congress, Office ofTechnology Assessment, Washington, D.C., July 1986.
Transportation of Hazardous Materials: Toward a National Strategy , Vols. 1 and 2, Special Report 197,Transportation Research Board, National Academy of Sciences, National Research Council,Washington, D.C., 1983.
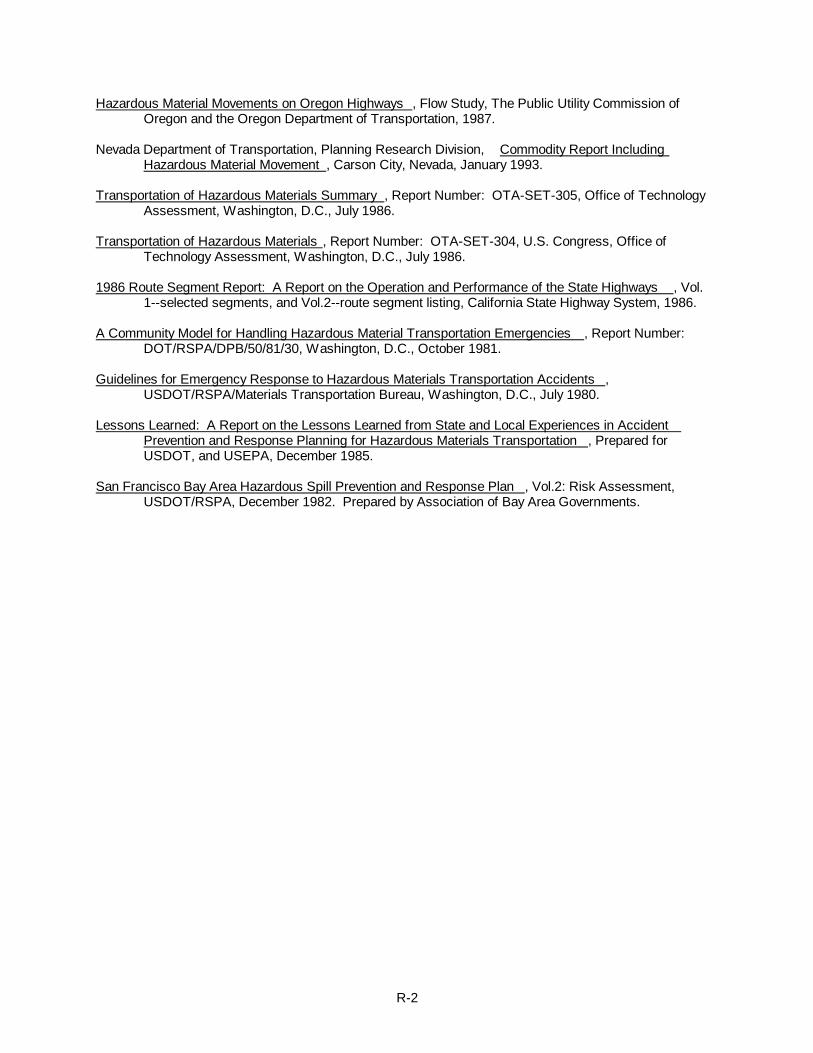
R-2
Hazardous Material Movements on Oregon Highways , Flow Study, The Public Utility Commission ofOregon and the Oregon Department of Transportation, 1987.
Nevada Department of Transportation, Planning Research Division, Commodity Report IncludingHazardous Material Movement , Carson City, Nevada, January 1993.
Transportation of Hazardous Materials Summary , Report Number: OTA-SET-305, Office of TechnologyAssessment, Washington, D.C., July 1986.
Transportation of Hazardous Materials , Report Number: OTA-SET-304, U.S. Congress, Office ofTechnology Assessment, Washington, D.C., July 1986.
1986 Route Segment Report: A Report on the Operation and Performance of the State Highways , Vol.1--selected segments, and Vol.2--route segment listing, California State Highway System, 1986.
A Community Model for Handling Hazardous Material Transportation Emergencies , Report Number: DOT/RSPA/DPB/50/81/30, Washington, D.C., October 1981.
Guidelines for Emergency Response to Hazardous Materials Transportation Accidents ,USDOT/RSPA/Materials Transportation Bureau, Washington, D.C., July 1980.
Lessons Learned: A Report on the Lessons Learned from State and Local Experiences in AccidentPrevention and Response Planning for Hazardous Materials Transportation , Prepared forUSDOT, and USEPA, December 1985.
San Francisco Bay Area Hazardous Spill Prevention and Response Plan , Vol.2: Risk Assessment,USDOT/RSPA, December 1982. Prepared by Association of Bay Area Governments.
Related Documents