National Longitudinal Study of Children Growing Up in Ireland MOTHERS’ RETURN TO WORK AND CHILDCARE CHOICES FOR INFANTS IN IRELAND INFANT COHORT REPORT 2

Welcome message from author
This document is posted to help you gain knowledge. Please leave a comment to let me know what you think about it! Share it to your friends and learn new things together.
Transcript
If you would like further information aboutGrowing Up in Ireland, please visit
www.growingup.ie
e-mail [email protected]
or freephone 1800 200 434
BAILE ÁTHA CLIATH
ARNA FHOILSIÚ AG OIFIG AN tSOLÁTHAIR
Le ceannach díreach ó
FOILSEACHÁIN RIALTAIS,
52 FAICHE STIABHNA, BAILE ÁTHA CLIATH 2
(Teil: 01 – 6476834 nó 1890 213434; Fax 01 – 6476843)
nó trí aon díoltóir leabhar.
DUBLIN
PUBLISHED BY THE STATIONERY OFFICE
To be purchased from
GOVERNMENT PUBLICATIONS,
52 ST. STEPHEN'S GREEN, DUBLIN 2.
(Tel: 01 – 6476834 or 1890 213434; Fax: 01 – 6476843)
or through any bookseller.
REP
OR
T 2IN
FAN
T CO
HO
RT
GR
OW
ING
UP
IN IR
ELAN
DM
OTHER
S’ RETU
RN
TO W
OR
K A
ND
CHILD
CAR
E CHO
ICES FOR
INFA
NTS IN
IRELA
ND
National Longitudinal Study of Children
Growing Up in Ireland
MOTHERS’ RETURN TO WORK AND CHILDCARECHOICES FOR INFANTS IN IRELAND
INFANT COHORT
REPORT 2

Design and production: www.slickfish.ie0713
National Longitudinal Study of Children
Growing Up in Ireland
MOTHERS’ RETURN TO WORK ANDCHILDCARE CHOICES FOR INFANTS IN IRELAND
July 2013The views expressed in this report are those of theauthors and do not necessarily reflect the views of thefunders or of either of the two institutions involved inpreparing the report.
Frances McGinnity, Aisling Murray and Sinéad McNally

Growing Up in Ireland • MOTHERS’ RETURN TO WORK AND CHILDCARE CHOICES FOR INFANTS IN IRELAND • REPORT 2
2
Copyright © Minister for Children and Youth Affairs, 2013
Department of Children and Youth Affairs 43-49 Mespil RoadDublin 4Tel: +353 (0) 1 647 3000Fax: +353 (0) 1 647 3101Email: [email protected]: www.dcya.gov.iePublished by The Stationery Office, Dublin
ISBN 978-1-4064-2775-2
All rights reserved. No part of this publication may be reproduced, storedin a retrieval system, or transmitted, in any form or by any means,electronic, mechanical, photocopying, recording or otherwise, without theprior permission in writing of the copyright holder.
For rights of translation or reproduction, applications should be made tothe Head of Communications, Department of Children and Youth Affairs43-49 Mespil RoadDublin 4

ACKNOWLEDGEMENTS
3
ACKNOWLEDGEMENTS
This report benefited from the comments and assistance of a number of people, and we would like to takethis opportunity to thank them.
Firstly, we wish to acknowledge the funding of the project by the Department of Children and Youth Affairs,in association with the Department of Social Protection and the Central Statistics Office.
Professor Ann Sanson of the University of Melbourne and Dr. Satya Brink of Human Resources and SocialDevelopment, gave their time and careful attention to earlier drafts and provided a large number ofsuggestions, many of which are reflected in the report.
We would like to thank Officials from the Central Statistics Office, the Early Years Unit of the Department ofEducation and the Department of Social Protection for their insights into an earlier draft of this report.
Thanks to colleagues in the ESRI - Dorothy Watson, Helen Russell and Richard Layte - for their useful andencouraging comments, and to the GUI team for their assistance. In particular we would like to thank JamesWilliams for his encouragement and support throughout.
Thanks to the infants’ non-parental carers – centre workers, childminders, relatives and others – for takingthe time to fill out the questionnaires about the infants and the care they provide for them.
The biggest thanks goes to the more than 11,000 families of nine-month-olds who participated in the InfantCohort of the Study. This report, and the many other publications from the study, would not have beenpossible without the time and assistance they generously gave.
Frances McGinnity, ESRI
Aisling Murray, ESRI
Sinead McNally, TCD
TABLE OF CONTENTS
EXECUTIVE SUMMARY 7
CHAPTER 1: INTRODUCTION 91.1 Why Analyse Return to Work and Childcare Choices? 101.2 Conceptual Framework 101.3 Research and Debates on Mothers’ Return to Work and Childcare 121.4 Key Features of the Growing Up in Ireland Infant Survey 16
CHAPTER 2: CARE OF VERY YOUNG CHILDREN – THE POLICY CONTEXT IN IRELAND 192.1 Introduction 202.2 Parenting and Paid Work: Leave Policies and Flexible Work Arrangements 202.3 The Economic and Labour Market Context for Mothers’ Employment 222.4 State Support for Non-Parental Care of Pre-School Children 232.5 Governance, Regulation and Quality of Childcare 262.6 Summary 27
CHAPTER 3: MATERNAL CARE AND RETURN TO PAID WORK 293.1 Introduction 303.2 Previous Research on Mother’s Return to Work after Childbirth 313.3 Patterns of Return to Work by Mothers of Infants 323.4 Which Parents Take Leave? 353.5 The Timing of Return to Work 383.6 Return to Work: Motivation and Previous Job 403.7 Timing of Return to Work and Maternity Leave 423.8 Discussion 43
CHAPTER 4: USE AND HOURS OF CHILDCARE 454.1 Introduction 464.2 Use of Non-Parental Childcare 474.3 Which Children Spent More Hours in Care? 514.4 Discussion 54
CHAPTER 5: CHILDCARE SETTINGS AND CHILDCARE CHOICE 555.1 Introduction 565.2 Childcare Settings – Use, Cost and Context 565.3 Factors Associated with Choice of Childcare 615.4 Discussion 64
CHAPTER 6: CHILDCARE AND INFANT HEALTH 676.1 Introduction 686.2 Association between Non-Parental Childcare and the Infant’s Current Overall Health 696.3 Association between Non-Parental Care and Incidence of Childhood Infections and
Wheezing/Asthma 716.4 Discussion 76
CHAPTER 7: CONCLUSION 797.1 Summary of Findings 807.2 Policy Implications 817.3 Avenues for Future Research 83
REFERENCES 84
Growing Up in Ireland • MOTHERS’ RETURN TO WORK AND CHILDCARE CHOICES FOR INFANTS IN IRELAND • REPORT 2
4
LIST OF TABLES
Table 3.1: Factors associated with timing of mothers’ return to work (multinomial regression) 39Table 3.2: Main reason for return to work (for those who had returned to work or had
intended to), by mother’s education 41Table 3.3: Timing of return to work: reasons for return and previous occupational class 41Table 3.4: Timing of return and maternity leave 42Table 4.1: Results of logistic regression model on factors associated with the Study Infant
being in regular non-parental childcare, with and without mother’s work status 49Table 4.2: Results of linear regression explaining factors associated with hours per week in
non-parental childcare 52Table 5.1: Distribution of infants’ main care across different care types (for infants with
some regular non-parental care) including percentage of paid care and mean cost per hour in euro 58
Table 5.2: Factors affecting choice of childcare type (non-relative and centre-based care rather than relative care) 62
Table 6.1: Association between infants’ current health being rated as ‘less healthy’ and non-parental care and other factors 70
Table 6.2: Risk of common childhood acute illnesses (for which medical attention was sought) according to type of childcare, showing fully adjusted odds ratios 73
Table 6.3: Selected adjusted odds ratios for risk of each illness according to weekly time spent in childcare and age of starting current childcare arrangement, for infantsin some form of non-parental care 75
Table 6.4: Selected adjusted odds ratios for risk of chest infection and wheezing or asthma according to age of starting current childcare arrangement, separately for relative, non-relative and centre-based care 76
CONTENTS
5
LIST OF FIGURES
Figure 1.1: Conceptual model of childcare decision-making in the first year 11Figure 2.1: Employment rates for men and women in Ireland compared to the EU average 22Figure 2.2a: Net childcare costs as a % of family net income for a dual-earner family, 2004 24Figure 2.2b: Net childcare costs as a % of family net income for a single-parent family, 2004 25Figure 3.1: Percentage of mothers in the GUI Infant Cohort at work in each month after
giving birth to the Study Child 33Figure 3.2: Percentage of mothers at work in each month after giving birth, by family type 34Figure 3.3: Percentage of mothers at work in each month after giving birth, by maternal
education 34Figure 3.4: Percentage of mothers at work in each month after giving birth, by family size 35Figure 3.5: Percentage of mothers who had worked prior to birth who took paid maternity
leave (excluding those unlikely to return to work), by socio-demographic characteristics 36
Figure 3.6: Proportion of mothers who had worked prior to birth who took unpaid maternity leave (excluding those unlikely to return), by socio-demographic characteristics 37
Figure 4.1: Cumulative percentage of infants in regular non-parental childcare (for those infants still in that arrangement at the time of interview) 47
Figure 4.2: Percentage of infants in each family income quintile for whom regular non-parental childcare was used, and fully adjusted odds ratio from the logistic regression model 50
Figure 4.3: Percentage of all infants and percentage of infants in regular non-parental childcare, by hours of childcare per week 51
Figure 5.1: Use of different forms of non-parental childcare 57Figure 5.2: Highest childcare qualification of home (relative and non-relative) and
centre-based carers (directors and employees/others) among carers of infants who returned questionnaires 60
Figure 5.3: Choice of relative, non-relative or centre-based care according to family income quintile – for infants in regular non-parental care only 63
Figure 6.1: Prevalence rates for various childhood illnesses according to childcare type or no regular childcare 72
Growing Up in Ireland • MOTHERS’ RETURN TO WORK AND CHILDCARE CHOICES FOR INFANTS IN IRELAND • REPORT 2
6
EXECUTIVE SUMMARY
This report investigates three key research questions relating to the care of infants in Ireland: thecharacteristics of those mothers who take up paid employment before their infant is nine months old, andwhen exactly they do so; the extent and nature of non-parental childcare for infants; and the associationbetween childcare and infant health. The report uses a large sample of mothers and infants from the nine-month Infant Cohort of the national longitudinal study of children: Growing Up in Ireland.
To set the context, the report considers key features of the labour market and maternity leave and childcarepolicy in Ireland. The period preceding the fieldwork saw an economic boom in Ireland accompanied by arapid rise in employment opportunities for women. Following a number of extensions to maternity leave, by2008-2009, most mothers were entitled to six months’ paid leave, and up to sixteen weeks’ unpaid maternityleave. Childcare is and has been a major issue for parents and policymakers for many years now. In 2008-2009 state funding for early care and education services for pre-school children was limited, and costs weresome of the highest in the OECD. There have been some policy developments since the survey, such as theFree Pre-School year, but not for the 0-2 age group.
This research found that relatively few mothers in Ireland returned to work before the infant was six monthsold. More specifically:
• Early returns (before 6 months) were more likely to be by self-employed mothers, young mothers orlone mothers.
• Those who returned in the 8-9 month period were more likely to be highly educated, older, Irish and mothers living in a couple.
• Those who had not yet returned at nine months tended to be low-educated mothers, and either very young or older mothers, and lone mothers.
• Highly educated mothers were more likely to return to work than low-educated mothers, but only when paid leave had ended.
• Mothers of three or more children were much more likely to have been out of the labour market prior to childbirth, and their employment rates at nine months were lower than those with one or two children.
Mothers most often cited financial reasons as the main reason for returning to work, though other reasons,such as getting out of the house and career reasons, also played a role, the latter particularly for highlyeducated mothers.
Almost all mothers working before childbirth took paid maternity leave; a smaller proportion also tookunpaid leave, and these tended to be more privileged in terms of income and education. Relatively fewmothers returned before 6 months, and a significant proportion returned to work at 6 - 7 months. Thissuggests that in Ireland, as in other countries, the duration of paid maternity leave plays a strong role inmothers’ employment patterns after childbirth.
Just under two-in-five infants (39%) were in regular non-parental childcare at nine months of age.Following the pattern of return to work, most children started non-parental childcare around six months ofage; at nine months, the majority (62% of those in care) were in care for less than 30 hours. Use of non-parental childcare for infants at nine months was closely related to mothers’ employment. Even accountingfor this, family income also played a salient role, with higher-income families more likely to use childcare.Infants from larger families were also less likely to be in non-parental care: this is also likely to be related tocost.
EXECUTIVE SUMMARY
7
The report also examined differences between childcare settings in terms of use, costs and qualifications ofcarers. The most common main form of childcare was that provided by a relative (42%, predominantlygrandparents), followed by non-relatives (31%, predominantly childminders), with centre-based care such ascrèches coming third (27%). Multiple care settings were used each week for around 13% of the infants whowere in any kind of regular non-parental care. Carer surveys revealed interesting differences in the caresettings, with less one-to-one interaction in centre-based settings, but more books available. Many peoplecaring for infants did not have any childcare-related qualifications. Qualification levels were highest amongcentre-based carers, but even here they were relatively low.
Relatives emerged as the main non-parental carer for a majority of infants in childcare; the presence offamily members living nearby influenced not just the choice of relative care over other care types but alsowhether non-parental care was used at all. While the infants of more advantaged mothers – in terms ofeducation and income – were less reliant on care provided by relatives, relatives (most of whom weregrandparents) were an important source of childcare for low-income families and for younger mothers. Boththe strong patterning of childcare choices by income – with low–income families choosing relative care evenafter accounting for whether family members live nearby, and also parents’ own responses on financialconstraints – suggest that the cost of childcare was an important factor in childcare choices.
The report also analysed infant health outcomes associated with different childcare settings. Use of achildcare centre was associated with a proportionally low, but statistically significant, increased risk ofpoorer overall health when compared with parental care. In addition, though there is uncertainty about thetiming of infections relative to starting in childcare, infants in centre-based care were at a higher risk forinfections of the respiratory tract, ear and gastro-intestinal system. In general, infants in home-based caresettings (e.g. relative care or childminders) did not differ in terms of these health risks from infants still inexclusive parental care. The increased risk associated with centre-based care remained, even when adjustingfor factors such as child’s health at birth and family income.
This report is relevant to two important and related policy issues concerning children: maternity leave andchildcare policy. Although causal conclusions cannot be drawn from these data, the evidence in this reportsuggests that paid maternity leave is an effective instrument influencing the duration of sole maternal care.If government’s aim were to extend the duration of sole parental care, extending paid leave would be apotentially successful policy strategy. Whether this leave should be for mothers or fathers or both is anotherrelevant policy decision. Fathers did not benefit from leave extensions to the same extent as mothers, andthe data showed that take-up of the existing provision, of unpaid parental leave, was very low.
Paid childcare for infants aged under three in Ireland is very expensive. In particular, low-income, low-educated parents were much more likely to use relative care, or no non-parental care at all. Given the roleof employment in protecting low-income families from income poverty, high childcare costs are likely to actas a particular disincentive to employment for this group and have implications for income poverty. High-quality affordable childcare would also promote women’s continuity in employment, a key issue in terms ofthe gender wage gap.
Quality of childcare has been shown to be a key factor in child developmental outcomes, and previousresearch has demonstrated a clear link between carer qualifications and quality of care. To advance thequality of care, it would be beneficial to promote training and qualification of childcare workers. Given theimportance of paid childminders as carers for infants in Ireland, consideration should also be given to theregulatory requirements and training supports for childminders.
Growing Up in Ireland • MOTHERS’ RETURN TO WORK AND CHILDCARE CHOICES FOR INFANTS IN IRELAND • REPORT 2
8

9
INTRODUCTION
Chapter 1
1.1. WHY ANALYSE RETURN TO WORK AND CHILDCARE CHOICES?
Who looks after infants in the first year of their life and the potential implications of this has been thesubject of much recent debate (OECD, 2009). While there has been a dramatic rise in women’s labour marketparticipation in Ireland, including mothers’ returning to work after having a child, little is known about whois caring for infants in Ireland and the impact of this on the child and their parents (Russell et al., 2009).Using a large sample of mothers and infants from the nine-month Infant Cohort of Growing Up in Ireland,this report investigates three key research questions relating to the care of infants in Ireland: which motherstake up paid employment before nine months and when they do so; the extent and nature of non-parentalchildcare for infants; and the association between childcare and infant health.
The report contributes to research on caring for children in two main ways. It uses a very large nationallyrepresentative sample of infants to provide the first detailed analysis of childcare in Ireland. It alsocontributes to the international literature by investigating mothers’ return to work and childcare in aparticular policy setting.
The report is therefore particularly relevant to two important policy issues: maternity leave and childcarepolicy. Previous research has highlighted the role of maternity leave in incentivising maternal care in theearly months (Gregg and Waldfogel, 2005; OECD, 2007). It has also made clear the impact of policy onchildcare choices (Sylva et al., 2007). There are many aspects of a young child’s life that the State has littleinfluence over, but it does have direct influence over leave provision and many aspects of non-parentalchildcare.
In the next section (1.2), a conceptual framework for the report is presented, which informs our analysis ofinfant childcare and the factors associated with it. Section 1.3 provides a broad overview of key issues inprevious research and how it has highlighted various factors in the conceptual framework. In Section 1.4, theGrowing Up in Ireland survey is discussed, with an emphasis on how it is excellently suited to our researchquestions on maternal return to work and use of childcare; and a description of how key factors influencingparental and non-parental childcare are measured.
1.2 CONCEPTUAL FRAMEWORK
Figure 1.1 presents a conceptual model which underpins much of the empirical analysis of this study. Themodel ultimately rests on a bio-ecological model (Bronfenbrenner and Morris, 2006), and also draws onSylva et al. (2007) in their analysis of childcare. It places the selection and timing of childcare within a seriesof nested contexts, with the child at the centre and the parents, family and neighbourhood context allcontributing to (and being influenced by) the mothers’ decision to return to work and the choice ofchildcare. The choice of childcare is then seen as having a potential impact on both current infant outcomes(such as infant health) and later developmental outcomes. The ‘macro level’ here includes governmentpolicy and the labour market context, in which the decisions at the ‘micro’ and ‘exo’ levels are embedded.
Growing Up in Ireland • MOTHERS’ RETURN TO WORK AND CHILDCARE CHOICES FOR INFANTS IN IRELAND • REPORT 2
10
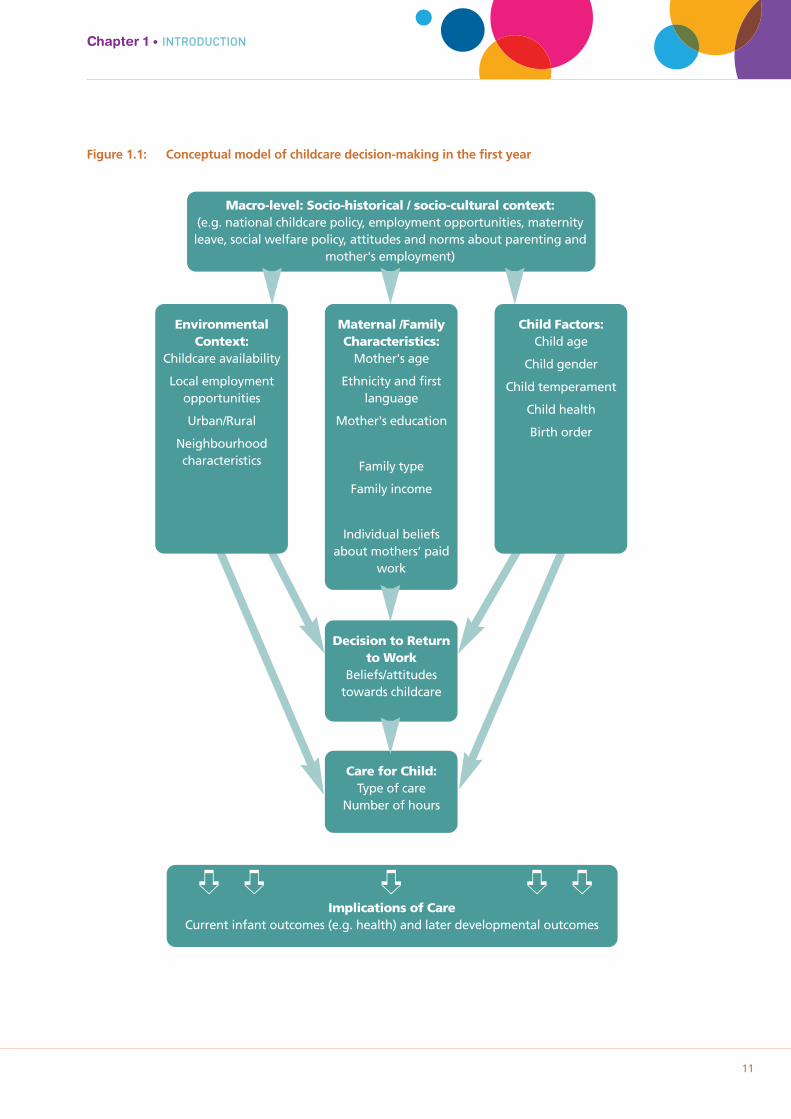
Figure 1.1: Conceptual model of childcare decision-making in the first year
Chapter 1 • INTRODUCTION
11
Macro-level: Socio-historical / socio-cultural context:(e.g. national childcare policy, employment opportunities, maternityleave, social welfare policy, attitudes and norms about parenting and
mother's employment)
Maternal /FamilyCharacteristics:
Mother's age
Ethnicity and firstlanguage
Mother's education
Family type
Family income
Individual beliefsabout mothers’ paid
work
Decision to Returnto Work
Beliefs/attitudestowards childcare
Care for Child:Type of care
Number of hours
Implications of CareCurrent infant outcomes (e.g. health) and later developmental outcomes
EnvironmentalContext:
Childcare availability
Local employmentopportunities
Urban/Rural
Neighbourhoodcharacteristics
Child Factors:Child age
Child gender
Child temperament
Child health
Birth order
➪ ➪ ➪ ➪ ➪
1 See also Layte and McCrory (forthcoming). 12
Growing Up in Ireland • MOTHERS’ RETURN TO WORK AND CHILDCARE CHOICES FOR INFANTS IN IRELAND • REPORT 2
While this is a useful model for understanding the care of infants, it is of course a simplification of theprocess. Mothers’ paid employment varies widely in terms of hours, for example. Figure 1.1 does not includeall possible factors and, perhaps more saliently, does not incorporate all possible directions of effect. Theimplications of care, in terms of outcomes, are likely to feed back into beliefs and attitudes towardschildcare.
Figure 1.1 does, however, highlight key factors that should be considered and how they fit together, and themodel it presents underlies the structure of the report. In Chapter 2 the policy context in relation tomaternity leave, childcare policy and employment opportunities is outlined. Chapter 3 examines the timingof mothers’ return to work and its association with maternal, child and family characteristics, as well asreasons for return and maternity leave policy. Chapter 4 examines the choice between parental and non-parental care, and the quantity of non-parental care provided. In Chapter 5 descriptive information on typesof childcare, cost and aspects of quality is provided, as a prelude to analysing how the type of non-parentalcare is associated with child-related, mother and family characteristics, neighbourhood context and policycontext. In Chapter 6 the association between childcare and an outcome particularly relevant for infants,namely health, is analysed. The final chapter summarises the results and reflects on the implications forpolicy.
1.3 RESEARCH AND DEBATES ON MOTHERS’ RETURN TO WORK AND CHILDCARE
1.3.1 PARENTAL CARE AND RETURN TO WORK Given that regular non-parental care of infants is so strongly linked to the employment status of theirmothers, one key issue in understanding the care of infants in the first year of their life is how long theirmother stays at home to be the sole carer of her child. A growing international literature investigates thefactors that influence a mother’s decision to return to paid work after childbirth and its timing. Often thisresearch is concerned with the impact of childbirth on gender equality in the labour market, but it is alsohighly informative about the duration of sole maternal care. There is much interest in the impact thatmaternity leave policy has on the timing of return to work, but also on how the characteristics of the motherand her family are associated with return to work.
Previous research has found that women with higher education typically return to work more quickly thanthose with lower education in the UK, and also in Ireland (Russell et al., 2006). However, some authors havefound it is low-educated women who return early, as they are under financial pressure (Smeaton, 2006). Ofcourse, the association between educational qualifications and return to work may be related to maternityleave provision, an issue highlighted by Waldfogel et al. (1999). For example, educational qualifications mayplay a limited role before the end of paid maternity leave.
The impact of a mother’s age on her return to work is less clear, and has been found to vary across countries(Russell and Banks, 2011). Whether or not a mother has a partner may also influence if and when she returnsto work. The financial pressure to return to work may be particularly acute for women who bear solefinancial responsibility for their children. However, caring for a small infant may be difficult to combine withpaid work for mothers without a partner, particularly if reliable and affordable childcare is not available.Previous research shows that patterns of return to work are very sensitive to benefit provisions for lonemothers (Pedersen et al., 2000). Research from the US suggests that mother’s ethnicity may be associatedwith her return to work after childbirth, though this often depends on the nature of the ethnic group andthe national context (Sylva et al., 2007). In terms of the infant’s characteristics, studies that examined theeffect of child temperament on mothers’ return to work usually found weak or no associations (Pungelloand Kurtz Costes, 1999). Studies do typically find associations between breastfeeding and both the timing ofreturn to work and hours of work (Lindberg, 1996).1 Studies of infant health at birth and mothers’
2 NICHD was set up in 1987 by the National Institute of Child Health and Human Development. The study sampled 1,364 children from different communities in the US and followed them longitudinally; collecting detailed information on thequality and quantity of early non-maternal childcare and taking into account a wide array of relevant background variables.
13
Chapter 1 • INTRODUCTION
employment are less common, though typically child disability is associated with much lower rates of employment for mothers than for children without a disability (Powers, 2001).
Factors other than a woman’s personal or family characteristics may influence return to work. Some authorshave argued that individual women’s work orientation and personal preferences play a role in her choicebetween full-time motherhood and a combination of paid and unpaid work (Hakim, 2004). The type of joband organisation a woman worked for before the birth of her child may also influence her return to work,such as employment status, the size of the organisation she worked for, industrial sector and security oftenure (Russell et al., 2011). Finally, international research suggests that the timing of return to work is verysensitive to policy provision, though more to paid than unpaid leave (Berger et al., 2005; OECD, 2007).
1.3.2 NON-PARENTAL CHILDCARE CHOICESThere is a considerable amount of research and policy interest in the impact on child development of non-parental childcare in the first 12 months, and much debate (Gregg and Waldfogel, 2005; Belsky, 2005). Atfirst, research was primarily concerned with whether children in childcare centres developed differently fromthose not attending such centres, though later results highlighted that childcare was diverse and thatquality of care mattered (NICHD ECCRN, 2002; Harrison, 2008). Additional research drew attention to thefact that the impact of non-parental childcare may vary depending on the child’s home background, inparticular that disadvantaged children are more sensitive to variations in quality of care than other children(Phillips and Lowenstein, 2011). Much of this research originates in the US, where the policy context is quitedifferent from Ireland, and it focuses on centre-based ‘daycare’. Some more recent studies, particularly in theUK, also examine care by relatives and childminders (Sammons et al., 2003). Research has looked at child-parent attachment, social and emotional outcomes, and cognitive and language development (Melhuish,2004).
A child’s attachment to the mother has come to be seen as a fundamental aspect of development. In anearly report, Belsky (1988) argued that insecure attachment patterns were over-represented within adaycare group compared to a home-reared group. More recent work from a large study of daycare in theUS, the National Institute of Child Health and Development Early Child Care Research Network study (NICHDECCRN), found no overall effect of daycare on child-parent attachment, but that the combination of poor-quality care in the home combined with more than 10 hours per week of day care, more than one childcarearrangement or poor-quality childcare was associated with increased risk of insecure attachment (NICHDECCRN, 1997).2
In terms of social and emotional outcomes, there is some evidence that high exposure to non-parentalchildcare, in particular group care in the first two years, may increase the risk of developing antisocialbehaviour at 3-5 years, though this finding is only for low-quality care (NICHD ECCRN, 2003a). This researchshows no harmful effects where quality is high. Gunnar et al (2010) compared cortisol levels of children aged3 - 4.5 years in family daycare in the US and a group of children in sole parental care. They found higherlevels of cortisol in the majority of children (63%) in day care, with 40% classified as showing a stressresponse, compared to no increase for children at home. Quality of caregiver interaction was crucial:intrusive, overcontrolling care was associated with the cortisol rise. In the UK, Sammons et al. (2003) foundno impact on behavioural outcomes for care by relatives. In terms of language and cognitive development,the quality of care has been shown to have differential effects depending on the child’s home environment:high-quality care had little or no impact on children who were not disadvantaged in their homeenvironment, but had positive effects on disadvantaged children. Poor-quality care is associated with poorerlanguage development for children overall, though the effect is smaller for disadvantaged children(Melhuish, 2004).
Gregg et al. (2005), commenting on the effect of mothers’ return to work on child development in the UK,
suggest adverse effects in the case of full-time working in the first year; overall, the size and scale of theseeffects are smaller than in the US. They suggest that this is due to the greater use of part-time working andthe lower incidence of return to work in the first three months as a result of better maternity-leave rights.They conclude that, on average, it is only full-time work up to when the child is 18 months that has adverseeffects on child cognitive development, with both part-time work and work after 18 months having noeffect.
Typically, research on the impact of non-parental care in the first year on developmental outcomes considersoutcomes at 18 months, or more typically 3-5 years. Nine months is very early to examine language andcognitive development. Further, many of these children have not been in childcare for very long – anaverage of two months. Many of the developmental indicators (communication, gross motor skills, finemotor skills, problem-solving, socio-emotional skills) are evolving and unstable at nine months. This reportfocuses on a child outcome where it is plausible that there will be an immediate association, such asinfectious illness.
Some of the inconsistencies in findings in early childcare research are due to the fact that research has notalways taken account of the complexity and diversity of childcare arrangements (Sylva et al., 2007). One keyfocus of the current report is on type of care for infants, its quantity and cost; on which infants are in whichtype of care and for how long. Features of the care settings for infants which are likely to be linked toquality are also discussed.
Child, mother, family, neighbourhood and policy factors influence use of non-parental childcare, and likelyrelate to our understanding of developmental outcomes (Pungello and Kurtz-Costes, 1999). Much of thework on childcare has focused on centre-based care. However, previous work in Ireland has found high levelsof relative care of infants, as well as non-relative home-based care (childminders, nannies, etc) (CSO, 2009;Williams et al., 2010).
Following Figure 1.1, factors influencing the type and intensity of non-parental childcare are linked to thechild, the maternal/family context, the neighbourhood/local environment, and the mother’s employmentstatus. Previous research has found that the age of the child is related to use of childcare; typically, youngerchildren are more likely to be in home-based care and older children in centre-based care (Pungello andKurtz Costes, 1999). Use of childcare is also clearly related to birth order: first-borns are more likely to be incare than second or subsequent children (Sylva et al., 2007).
Economic circumstances often drive a family’s use and timing of childcare, particularly in the US and the UK.A UK study found that at three months low-income children were more likely to be in childcare while at 10months more advantaged families used childcare (Sylva et al., 2007). Psychological factors also play a role;children of mothers who believe employment brings benefits to children are more likely to be in non-parental childcare (Greenberger et al., 1988).
Finally, policy forms the context in which childcare decisions are made (see Figure 1.1.). This includes nationalchildcare policy – the funding and cost/organisation of childcare; maternity leave and benefit regulations,and employment opportunities for mothers. The policy context is discussed in detail in Chapter 2.
1.3.3 QUALITY OF CHILDCAREA clear conclusion emerging from recent literature is that the quality of non-parental childcare matters forchildren’s outcomes. How is quality of care defined? Research on quality of care typically distinguishesbetween process and structural aspects of quality: (1) process refers to the characteristics of the child’sexperience, e.g. interactions with others, learning experiences, variety in stimulation; (2) structural factorsinclude aspects of the environment, such as accommodation, group size, adult-child ratio, training of staff
Growing Up in Ireland • MOTHERS’ RETURN TO WORK AND CHILDCARE CHOICES FOR INFANTS IN IRELAND • REPORT 2
14
and management structure. Research has shown how staff behaviour may be associated with enhancedsocial and cognitive development. Staff who are highly responsive, have high levels of positive interaction,provide informative verbal information and are not harsh and controlling may enhance children’scognitive/language development and their social behaviour (compliance, cooperativeness, peer interactions)(Howes, 1990; NICHD ECCRN, 2002). Structural factors such as smaller group sizes, low staff turnover andbetter-trained staff are also associated with improved cognitive and language development (Clarke-Stewart,1987).
Of course, structural and process aspects of quality are closely related: structural features of good qualityprovide the conditions that support quality processes (Harrison et al., 2009). For example, carers’qualifications and specific preparation in early childhood care and education are closely related to thequality of language and cognitive interactions, and the extent to which interactions with children arepositive, sensitive and warm (Oberhuemer, 2005; OECD, 2006; European Commission, 2011).
In the Growing Up in Ireland survey, self-report questionnaires were sent to the children’s carers, whetherhome- or centre-based. While these questionnaires do not provide the kind of detailed information onquality that comes from observational studies, like the Quality of Childcare Settings module in theMillennium Cohort Study in the UK, they do provide a rich source of indicators shown by previous researchto be associated with quality, from both centre- and home-based settings, including number of children,number of staff, staff qualifications, time spent on activities and resources for play and learning. In Chapter5 these features are described in more detail and compared for different kinds of non-parental childcaresettings: centre-based care, non-relative home care and relative care.
1.3.4 CHILDCARE AND THE HEALTH OF INFANTS The Growing Up in Ireland Infant Cohort measures a range of developmental and health outcomes at ninemonths, including developmental outcomes (communication, gross motor skills, fine motor skills, problem-solving, social-emotional skills) and general health and experience of specific infections and illnesses;however, as noted above, there are methodological problems with associating use of childcare anddevelopmental outcomes at this age. In this study, rate of infections is used as an indicator of healthoutcomes. The impact of childcare on prevalence of infections is more likely to be immediate rather thanlong-term. However, it will not be possible to compare infections before childcare with infections during oneor two months of childcare.
The apparent increase in infections among children who attend centre-based care has been a major focus ofthe literature in recent years. Research from countries as diverse as the USA, Australia and Norway typicallyreport higher incidents of infections affecting the respiratory tract, ears and gastro-intestinal system amongchildren in centre-based care compared to parental or other home-based care (NICHD ECCRN, 2001; Nafstadet al., 1999). There is some evidence that children aged one year and under may be particularly vulnerable topicking up infections in centre-based care settings (Kamper-Jorgensen et al., 2008). It is likely that the higherrisk associated with centre-based care arises from the greater number of children that the infant comes into contact with.
More frequent infections for children as young as nine months may have implications beyond theexperience of the illness itself. Increased infections may lead to greater use of antibiotics, and an additionalburden and stress for parents in terms of medical fees, absenteeism from work or the need to arrange back-up childcare. While such immediate detrimental effects are clear, the impact is not straightforward: someresearch suggests that early exposure to illness or infection through care settings may benefit children byboosting immunity over the long term. Findings from the National Institute of Child Health andDevelopment Early Child Care Research Network, for example, have indicated that children whoexperienced large-group care in their third year were less likely to get stomach and upper respiratory tract
Chapter 1 • INTRODUCTION
15
infections in later childhood (NICHD ECCRN, 2003b). Chapter 6 examines the association between overallinfant health and the incidence of specific infections, and use and choice of non-parental childcare.
1.4 KEY FEATURES OF THE GROWING UP IN IRELAND INFANT SURVEY
1.4.1 OVERVIEW OF PARTICIPANTS AND FIELDWORKThe primary sampling unit was the nine-month-old infant. Age-eligible infants, born between December2007 and May 2008, were randomly selected from the Child Benefit Register. Interviews with the mother ofthe infant were conducted in the home when the infant was nine months old during the period September2008 to March 2009. The response rate was 65%. A total of 11,134 infants and their families took part in thesurvey, representing approximately one-in-seven of the total infant population for that cohort. The sample isreweighted to ensure that it is representative of the full population of 73,600 nine-month-olds resident inIreland at the time of the fieldwork (see Williams et al., 2010, for more details of the survey). This samplerepresents a unique opportunity to investigate issues relating to childcare for a large, nationallyrepresentative sample of very young children. Note that, in the analytic chapters of this report, the primarycaregivers are referred to as mothers, though in a tiny number of cases they were not the biological mother.
In addition to the main fieldwork with the infants’ families, a postal survey of childcare providers wasundertaken. Mothers of infants who typically spent eight or more hours per week in a regular non-parentalcare arrangement were asked for permission to contact their main childcare provider. Where permission andvalid contact details were obtained, a self-complete questionnaire was posted to the care-provider. Therewere different versions of the questionnaire depending on whether the care-provider was home-based(relatives, childminders, etc) or centre-based (e.g. crèche). In total 770 questionnaires were returned fromcentre-based carers and 1,114 from home-based carers. This represents a response rate of 46% overall; 72%for centre-based carers and 41% for home-based carers. Further details of these questionnaires and patternsof response are discussed in Chapter 5, where the results are also presented.
1.4.2 DESCRIPTION OF KEY DERIVED VARIABLESChild variablesTemperament: Temperament was measured using the Infant Characteristics Questionnaire (Bates et al.,1979). The primary caregiver rated the infant from 1-7 on a set of items that form four subscales: ‘fussy-difficult’, ‘unadaptable’, ‘dull’ and ‘unpredictable’.
Birth order/number of siblings: This variable was based on the number of children in the house, other thanthe Study Infant, who were aged under 14 years and who were either a full, half, step, adoptive or fostersibling to him/her. This figure was re-coded as ‘only child’, ‘one sibling’ and ‘two or more siblings’.
Child health at birth: the child’s health at birth was measured in response to the question, ‘In general, howwould you describe infant’s health at birth?’. Anything other than ‘very healthy at birth’ was coded as ‘lesshealthy’.
Duration of breastfeeding: These measures were based on answers to two questions, ‘Was infant everbreastfed?’ and ‘How old was infant when s/he stopped being breastfed?’. Responses were classified as‘never breastfed’; ‘breastfed for less than 3 months’; ‘breastfed for 3 months or more’.
Maternal and family variablesAge: Age of the primary caregiver was re-coded, in general, into into four categories as follows: ‘under 25years’, ’25-29 years’, ’30-34 years’ and ’35 years or older’.
Growing Up in Ireland • MOTHERS’ RETURN TO WORK AND CHILDCARE CHOICES FOR INFANTS IN IRELAND • REPORT 2
16
Chapter 1 • INTRODUCTION
17
Ethnicity: Ethnicity of the mother was self-reported by the respondent and subsequently regrouped, ingeneral, into into three categories: ‘Irish’ (Irish, Irish Traveller), ‘White non-Irish’, and ‘other ethnic minorities’(African, Black not African, Chinese, Asian not Chinese, Other/Mixed).
Education: Mothers initially chose one of 13 answer categories ranging from ‘no formal education’ to‘doctorate’. These were re-coded as a four-level variable as follows: ‘lower secondary education or less’,‘Leaving Certificate or equivalent’, ‘Post Leaving Certificate’ (FETAC, HETAC, etc) and ‘Degree or higher’.
Family structure: In this report, family structure is summarised as the mother living with or without a partner– and in the latter case being classified as a lone parent.
Family income: Family income was recorded in the interview as an exact figure or as a ‘best guess estimate’.This figure was then ‘equivalised’ to take account of the number and ages of family members. Finally theequivalised income figure was divided into quintiles, with the wealthiest families being in the highestincome quintile.
Area/neighbourhood characteristicsRegion: This variable is based on the location of the family home (open country, small town, Dublin city, etc).It is summarised for this report as either ‘rural’ or ‘urban’.
Other family members living in the area: This was a direct yes/no question to the mother and was to includetheir partner’s family (i.e. in-laws).
Availability of centre-based childcare: Mothers were asked a yes/no question on whether ‘crèche, day-care,mother-and-toddler groups, etc’ were available within relatively easy access of their local area. ‘Local area’was self-defined.
Regular contact with grandparents: This was coded as yes if the primary caregiver said they were in regularcontact with the infant’s grandparents living in Ireland.
Neighbourhood disadvantage/condition: This variable is an index derived from four statements about thelocal area which the mother rated on a four-point scale from ‘not at all common’ to ‘very common’. Theitems referred to ‘rubbish and litter lying about’, ‘homes and gardens in bad condition’, ‘vandalism anddeliberate damage to property’ and ‘people being drunk or taking drugs in public’. The new index wascreated by reversing the scoring and summing the four items such that higher scores indicated greaterdisadvantage. The Cronbach’s alpha for the derived index was .86. For analysis, the total score was dividedinto quartiles, with the highest quartile reflecting particularly disadvantaged/poorest-conditionneighbourhoods.

Growing Up in Ireland • MOTHERS’ RETURN TO WORK AND CHILDCARE CHOICES FOR INFANTS IN IRELAND • REPORT 2
18
19
CARE OF VERY YOUNG CHILDREN –THE POLICY CONTEXT IN IRELAND
Chapter 2
3 The entitlement to a basic period of maternity leave from employment extends to all female employees in Ireland (including casualworkers), regardless of how long they have been working for the organisation or the number of hours worked per week.20
Growing Up in Ireland • MOTHERS’ RETURN TO WORK AND CHILDCARE CHOICES FOR INFANTS IN IRELAND • REPORT 2
2.1 INTRODUCTION
The previous chapter outlined research which shows why non-parental childcare matters for young children:it has an important influence on an infant’s wellbeing and development. In addition, the care an infantreceives in the early years of his or her life can have a crucial impact on a range of later outcomes (Melhuish,2004). The purpose of this chapter is to consider the policy and labour market context for care of infants inIreland – the ‘macro’ context in Figure 1.1. There are many aspects of a young child’s life over which theState has little direct influence; for example, what a child eats and drinks, parenting styles, many aspects ofthe home learning environment. In contrast, the State has direct influence over parental leave and manyaspects of non-parental childcare, which is why it is important to consider the nature of State support.
For the vast majority of infants in Ireland, parental care is the sole or dominant form of care in their veryearly months. State-provided leave entitlements may influence the duration of this care, so in Section 2.2leave provision in Ireland is considered. Policies to combine paid work and caring may also influence thehours of work of the primary carer when they do return to paid work, as well as the flexibility in allocatingthose hours to respond to their infant’s needs. This can include flexible working hours, the right to workpart-time for the parents of young children, and being able to take time off when the infant is sick. Thelabour market situation will influence the opportunities for mothers to take up paid employment, so inSection 2.3 the remarkable changes in the Irish labour market in the years preceding the survey, in particularthe growth in female employment, are documented.
The system, funding and organisation of childcare provision will influence the nature and quality of non-parental care. How non-parental care for young children is funded and organised varies considerably acrosscountries, and the Irish system is unique in a number of respects; this is the focus of Sections 2.4 and 2.5. Asthe main purpose of this chapter is to provide a context for the empirical analysis which follows, the focus ison policy provision at the time of the survey, Sept 2008-April 2009. There have been some significantdevelopments in childcare policy since then; these are noted in the text where relevant and summarised inBox 2.1 at the end of the chapter.
2.2 PARENTING AND PAID WORK: LEAVE POLICIES AND FLEXIBLE WORK ARRANGEMENTS
As noted in Chapter 1, some commentators have argued that, in most cases, parental care should be thedominant form of care in the first year of a child’s life (UNICEF, 2008). Debates on child wellbeing highlightthe role of maternity leave in incentivising maternal care in the early months (OECD, 2007). Internationalresearch suggests that the timing of return to work is very sensitive to policy provision (OECD, 2007).
All women who become pregnant while in employment in Ireland are entitled to take leave after the birthof their infant, and have the right to return to the same job or to a job on a similar level.3 Many women, ifthey satisfy certain qualifying conditions (described below), are entitled to receive payment from the Stateduring all or part of this leave. The duration of maternity leave in Ireland was low compared to otherEuropean countries at the beginning of the economic boom in the mid-1990s; although legislation, partly inresponse to an EU Directive, has now improved provision considerably. A series of successive changes meantthat, by April 2007, paid maternity leave was 26 weeks, and unpaid leave was 16 weeks. The duration oftotal maternity leave provision in Ireland now compares well to other West European countries (Moss, 2010,2012).
4 No information is provided in their study about the amount of the payment. The receipt of ‘top-up’ payments is more common amongwomen in the public sector and in larger organisations.
5 A new directive on parental leave, agreed by the Council of Ministers in 2010, was implemented in Ireland in March 2013. This increasesthe amount of parental leave available for each child to 18 weeks, and also provides a right for employees returning from parental leaveto request flexible working and/or reduced hours for a set period of time.
6 The Parental Leave Act also gives all employees limited paid leave for family emergencies (force majeure leave) – three days in 12 months.7 Since March 2013 the entitlement is 18 weeks per child. Parental leave, which is unpaid in Ireland and can be taken up to when the child is
eight years old, is not the same as paternity leave, which is time off at the birth of a child.
21
To qualify for paid maternity leave (maternity benefit), the woman needs to (a) have been in insurableemployment immediately before the first day of maternity leave and (b) satisfy certain social insurance (PRSI)contribution conditions in the year or years prior to birth. Under these eligibility requirements, the mainreasons women may not qualify for payment are either inadequate social insurance contributions due toshort service, self-employment or informal employment, or leaving employment more than 16 weeks beforethe birth of a child (Russell et al., 2011). Payment is calculated as 80% of average gross monthly income inthe relevant tax year, subject to a minimum payment of €222 per week and maximum of €280 per week (in2008, the time of the survey). The relatively low maximum threshold means that the statutory replacementrate for maternity benefit in Ireland falls below the level in a number of comparable EU countries (Moss2012). Some women receive additional payments from their employer during maternity leave, known as‘top-up’ benefits. Russell et al. (2011) found that around half of women (48%) received such top-uppayments from their employer.4
Parental leave is employment-protected leave of absence to allow employed parents to care for an infant oryoung child. The 1998 Parental Leave Act introduced a statutory entitlement for both parents to 14 weeks ofunpaid parental leave. The EU Directive on which the Parental Leave Act is based allowed individualcountries to decide whether this should be paid or unpaid; Ireland chose to have unpaid parental leave.5
This lack of payment means many parents cannot afford to avail of leave, and also that men are less likely toavail of it. There is no legal entitlement to paid paternity leave (i.e. time off for the father following thebirth of a child) in Ireland. In fact, while the duration of maternity leave has been substantially extended inthe last decade, fathers have not benefited to the same extent as mothers. In some other Europeancountries, including the UK, a recent trend has been towards sharing of some portion of post-birth leave(Moss, 2010).
While maternity leave may affect when and if a mother returns to work, the ability to vary working hours totake account of family demands may also influence both when and if women return to work. Such measurescould include: the right for parents (or others) to reduce hours when caring for small children; flexibleworking time or flexi time; job sharing, and working from home.6
In Ireland there is no legislative right for parents to work part-time, as is the case in, for example, France,Germany, Holland, Finland, Belgium and France (Gornick and Meyers, 2003); and in Britain for parents ofsmall children. The closest de facto part-time work for parents in Ireland is parental leave, though whetherthis can be taken weekly is at the discretion of the employer, and each parent is limited to 14 weeks perchild (Russell et al., 2009).7 Rates of part-time work for women rose from 21% of those employed in 1993 to31% in 2003, but were more stable thereafter (e.g. 32% in 2007). Survey estimates are that the rate of take-up of flexi-time reported for employees in Ireland in early 2009 was around 30% in total, and somewhathigher for women (Russell and McGinnity, 2011). The rate of job sharing (9% of employees) and homeworking (12% of employees) was much lower. There was a marked increase in both the availability of anduse of flexible working arrangements between 2003 and 2009 (Russell and McGinnity, 2011), thoughconsiderable variation across occupations and sectors of the labour market.
In Ireland, research has found very high rates of poverty among lone parents and their children, and lowrates of labour market participation compared to other European countries – the lowest in the OECD (OECD,2007). In light of this, consideration was given in Irish policy to reforming the income supports and measuresto facilitate return to work for lone parents (Department of Social and Family Affairs, 2006). Such reformswould be in line with practice in many European countries, and would help reduce poverty among loneparents, but authors have argued that their success would depend crucially on childcare supports beingavailable, which is a challenge in the Irish context (Callan et al., 2008). The costs of paid childcare for loneparents represent a very substantial proportion of their income (see Section 2.4). Another key decision in thedesign of the system is whether engagement in training, education or employment should be compulsory,
Chapter 2 • CARE OF VERY YOUNG CHILDREN – THE POLICY CONTEXT IN IRELAND
Lone-parent, 1 child Lone-parent, 2 or morechildren
Two-parent, 1 child Two-parent, 2 or morechildren
% o
f in
fan
ts
25
20
15
10
5
0
24
18
32
Living with grandparents
90
80
70
60
50
40
30
Perc
ent
emp
loye
d
Men EU
Men Ireland
Women EU
Women Ireland
1992
1993
1994
1995
1996
1997
1998
1999
2000
2001
2002
2003
2004
2005
2006
2007
2008
2009
2010
Growing Up in Ireland • MOTHERS’ RETURN TO WORK AND CHILDCARE CHOICES FOR INFANTS IN IRELAND • REPORT 2
228 Proposals for reforming the one-parent family payment have been introduced since early 2012 which involve a progressive lowering of
the upper age threshold for the youngest child for receipt of the one-parent family payment. See http://www.welfare.ie/en/Pages/One-Parent-Family-Payment.aspx for further details.
though once again, compulsion is predicated on the existence of high-quality and affordable childcaresupport (Callan et al., 2008).8
2.3 THE ECONOMIC AND LABOUR MARKET CONTEXT FOR MOTHERS’ EMPLOYMENT
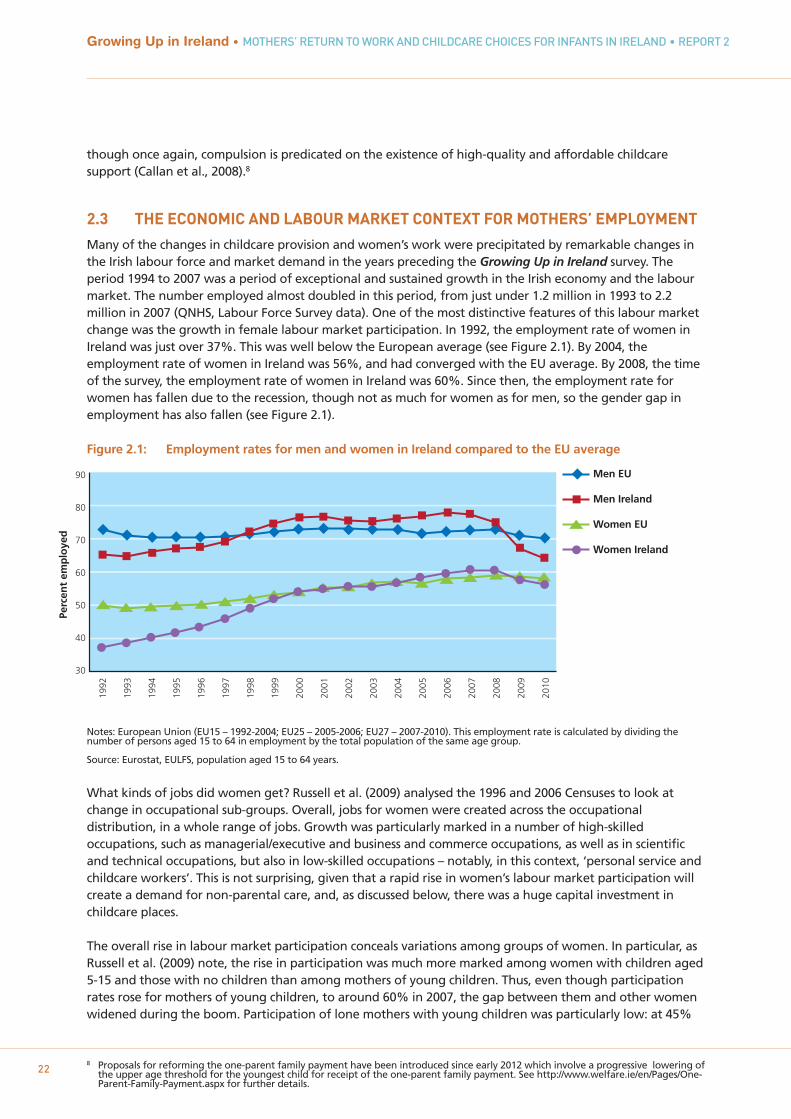
Many of the changes in childcare provision and women’s work were precipitated by remarkable changes inthe Irish labour force and market demand in the years preceding the Growing Up in Ireland survey. Theperiod 1994 to 2007 was a period of exceptional and sustained growth in the Irish economy and the labourmarket. The number employed almost doubled in this period, from just under 1.2 million in 1993 to 2.2million in 2007 (QNHS, Labour Force Survey data). One of the most distinctive features of this labour marketchange was the growth in female labour market participation. In 1992, the employment rate of women inIreland was just over 37%. This was well below the European average (see Figure 2.1). By 2004, theemployment rate of women in Ireland was 56%, and had converged with the EU average. By 2008, the timeof the survey, the employment rate of women in Ireland was 60%. Since then, the employment rate forwomen has fallen due to the recession, though not as much for women as for men, so the gender gap inemployment has also fallen (see Figure 2.1).
Figure 2.1: Employment rates for men and women in Ireland compared to the EU average
Notes: European Union (EU15 – 1992-2004; EU25 – 2005-2006; EU27 – 2007-2010). This employment rate is calculated by dividing the number of persons aged 15 to 64 in employment by the total population of the same age group.
Source: Eurostat, EULFS, population aged 15 to 64 years.
What kinds of jobs did women get? Russell et al. (2009) analysed the 1996 and 2006 Censuses to look atchange in occupational sub-groups. Overall, jobs for women were created across the occupationaldistribution, in a whole range of jobs. Growth was particularly marked in a number of high-skilledoccupations, such as managerial/executive and business and commerce occupations, as well as in scientificand technical occupations, but also in low-skilled occupations – notably, in this context, ‘personal service andchildcare workers’. This is not surprising, given that a rapid rise in women’s labour market participation willcreate a demand for non-parental care, and, as discussed below, there was a huge capital investment inchildcare places.
The overall rise in labour market participation conceals variations among groups of women. In particular, asRussell et al. (2009) note, the rise in participation was much more marked among women with children aged5-15 and those with no children than among mothers of young children. Thus, even though participationrates rose for mothers of young children, to around 60% in 2007, the gap between them and other womenwidened during the boom. Participation of lone mothers with young children was particularly low: at 45%
Chapter 2 • CARE OF VERY YOUNG CHILDREN – THE POLICY CONTEXT IN IRELAND
23
9 This is less true of the past two years; see Box 2.1.10 The Early Childcare Supplement was discontinued in December 2009. From January 2010 it was replaced with a free pre-school year of
Early Childhood Care and Education (ECCE); see Box 2.1.11 Child benefit rates have since been reduced. 12 The Childcare Employment and Training Support (CETS) Scheme replaced the FAS childcare allowance and applies to people starting a
training programme from September 2010 onwards.
in 2007, compared to a participation rate of 68% for lone mothers with older children (5-15 years).Participation of lone mothers did not rise during the boom (Russell et al., 2009).
Following two decades of rapid economic growth, by 2008 Ireland was experiencing a severe economic andlabour market crisis, the worst recession since the foundation of the State. The numbers employed felldramatically, and unemployment soared. The decline in employment was steepest among men, driven bythe collapse in the construction sector, but employment rates and job opportunities also fell for women,since the peak in 2007 (see Figure 2.1). The crisis in public finances led to swingeing cuts in public spending,including cuts in public-sector pay and some welfare benefits, and poverty has risen, including povertyamong children (CSO, 2011; Watson et al., 2012).
2.4 STATE SUPPORT FOR NON-PARENTAL CARE OF PRE-SCHOOL CHILDREN
Government support for childcare in Ireland has been guided by a number of competing objectives:supporting child development, female employment (and gender equality), social inclusion and high birthrates (Fahey & Russell, 2006). Significantly, the Government tried to steer a course that was neutral in termsof providing support for care in the home (by parents) and care outside the home.9 This distinguishes Irelandfrom many European counterparts, and had a significant impact on policy at the time of the survey.
A key example of this principle is that raising the Universal Child Benefit (UCB) was designated as animportant element of the ‘Childcare strategy’. Furthermore, in 2006 the Government announced an EarlyChildcare Supplement, a benefit payable with respect to all children under 5/6 (the qualifying age variedover time). It was explicitly introduced to help parents of pre-school children to meet their childcare needs.The payment was substantial. For example, in late 2008, at the time of the fieldwork for this survey, parentswere entitled to €92 per month per child under 5½.10 This was in addition to €163 per child under 18 inChild Benefit.11 However, as an important OECD report argues, the policy strategy of raising Child Benefit, acash transfer paid whether parents are working or not, is poorly targeted expenditure in terms of childcareprovision (OECD, 2007).
Another important element of policy is that in Ireland, when the demand for childcare rose during theboom, much financial support was indirectly provided in the form of capital grants to encourage private andcommunity-sector provision, in contrast to other northern European countries and continental Europewhere there was (or is) more emphasis on state provision of services. In response to the rapid economicboom and rising participation of women in the workforce (described below), the Equal OpportunitiesChildcare Programme (2000–2006) and its successor, the National Childcare Investment Programme (2006–2010) stimulated the creation and subsequent retention of over 40,000 childcare places through capitalfunding and subvention of the cost of delivery of services (Department of Education and Science, 2009).Capital grants were available to both private and voluntary-sector organisations, while staffing grants wereavailable for the community/voluntary sector only. These grants allowed some subsidy to those availing ofcommunity/voluntary-sector places but the amount of subsidy was variable and the number of places wasvery limited, being available only in disadvantaged areas, representing about 20% of centre-based childcareproviders. In 2008 the funding scheme for delivering community childcare was changed, with funding ofcommunity childcare schemes now being linked to social welfare receipt. Under the Community ChildcareSubvention Scheme, low-income parents in receipt of specified welfare payments are eligible to a subsidy inparticipating community services only. Another small scheme, the FÁS (Foras Áiseanna Saothair – NationalTraining and Employment Authority) childcare allowance scheme, offered free, full-time, temporarychildcare places to parents on certain vocational training programmes run by FÁS.12
However, for the large majority of parents of children aged up to about three and a half, there was and stillis no financial support specifically directed towards childcare. Childcare costs are not tax-deductible andthere are no childcare tax credits. The Child Benefit and, at the time of the survey, the Early Childcare
Growing Up in Ireland • MOTHERS’ RETURN TO WORK AND CHILDCARE CHOICES FOR INFANTS IN IRELAND • REPORT 2
24
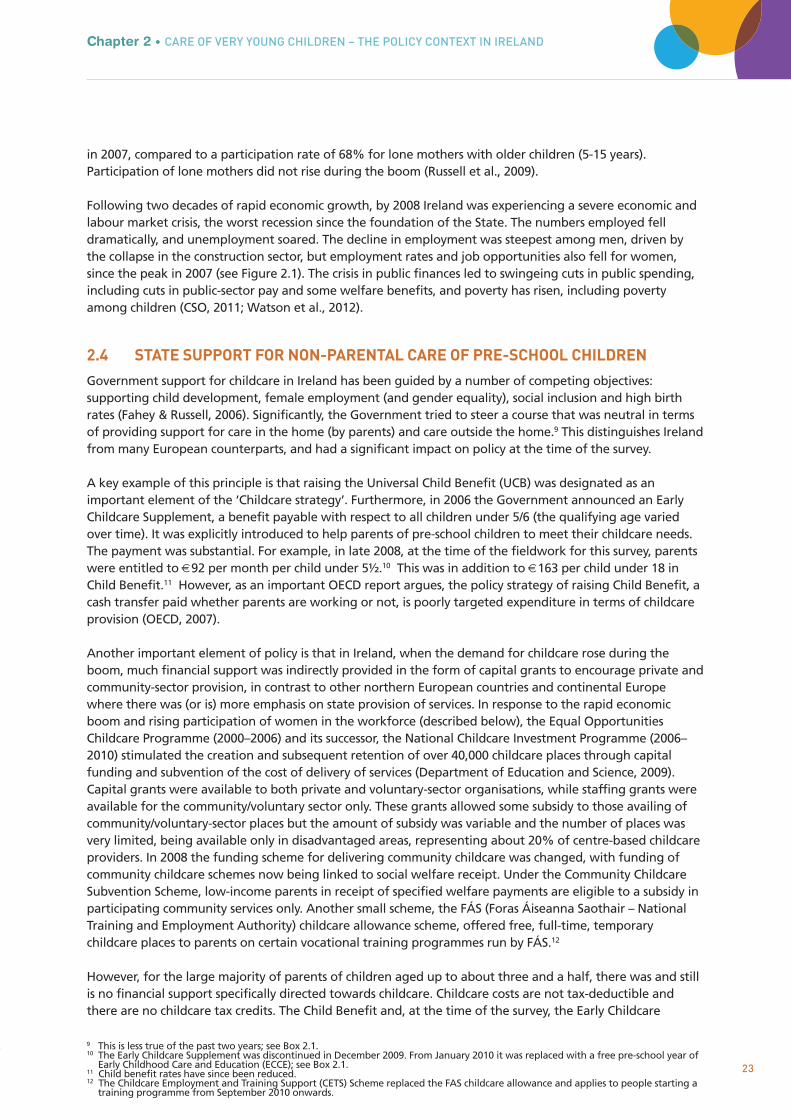
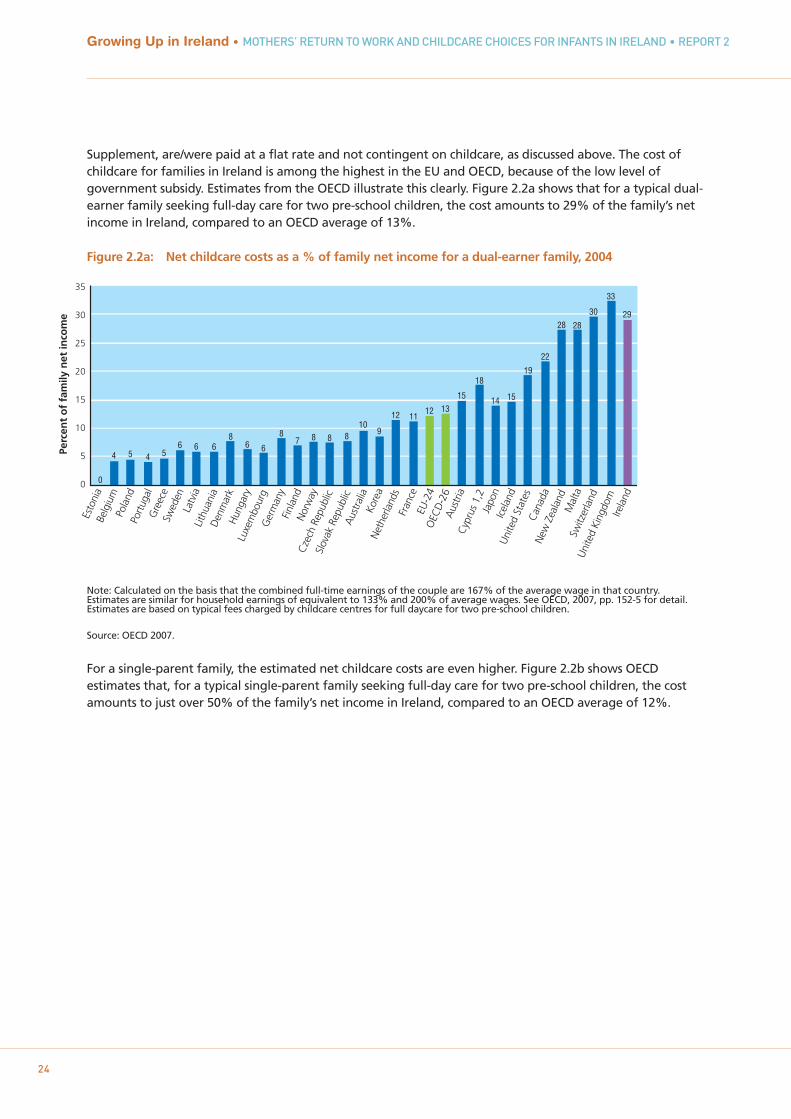
Supplement, are/were paid at a flat rate and not contingent on childcare, as discussed above. The cost ofchildcare for families in Ireland is among the highest in the EU and OECD, because of the low level ofgovernment subsidy. Estimates from the OECD illustrate this clearly. Figure 2.2a shows that for a typical dual-earner family seeking full-day care for two pre-school children, the cost amounts to 29% of the family’s netincome in Ireland, compared to an OECD average of 13%.
Figure 2.2a: Net childcare costs as a % of family net income for a dual-earner family, 2004
Note: Calculated on the basis that the combined full-time earnings of the couple are 167% of the average wage in that country. Estimates are similar for household earnings of equivalent to 133% and 200% of average wages. See OECD, 2007, pp. 152-5 for detail. Estimates are based on typical fees charged by childcare centres for full daycare for two pre-school children.
Source: OECD 2007.
For a single-parent family, the estimated net childcare costs are even higher. Figure 2.2b shows OECDestimates that, for a typical single-parent family seeking full-day care for two pre-school children, the costamounts to just over 50% of the family’s net income in Ireland, compared to an OECD average of 12%.
35
30
25
20
15
10
5
0 0
4 5 4 56 6 6
86 6
87 8 8 8
109
12 1112 13
15
18
14 15
19
22
28 28
30
33
29
Esto
nia
Belg
ium
Pola
ndPo
rtug
alG
reec
eSw
eden
Latv
iaLi
thua
nia
Den
mar
kH
unga
ryLu
xem
bour
gG
erm
any
Finl
and
Nor
way
Cze
ch R
epub
licSl
ovak
Rep
ublic
Aus
tral
iaKo
rea
Net
herla
nds
Fran
ceEU
-24
OEC
D-2
6A
ustr
iaC
ypru
s 1,
2Ja
pon
Icel
and
Uni
ted
Stat
esC
anad
aN
ew Z
eala
ndM
alta
Switz
erla
ndU
nite
d Ki
ngdo
mIre
land
Perc
ent
of
fam
ily n
et in
com
e
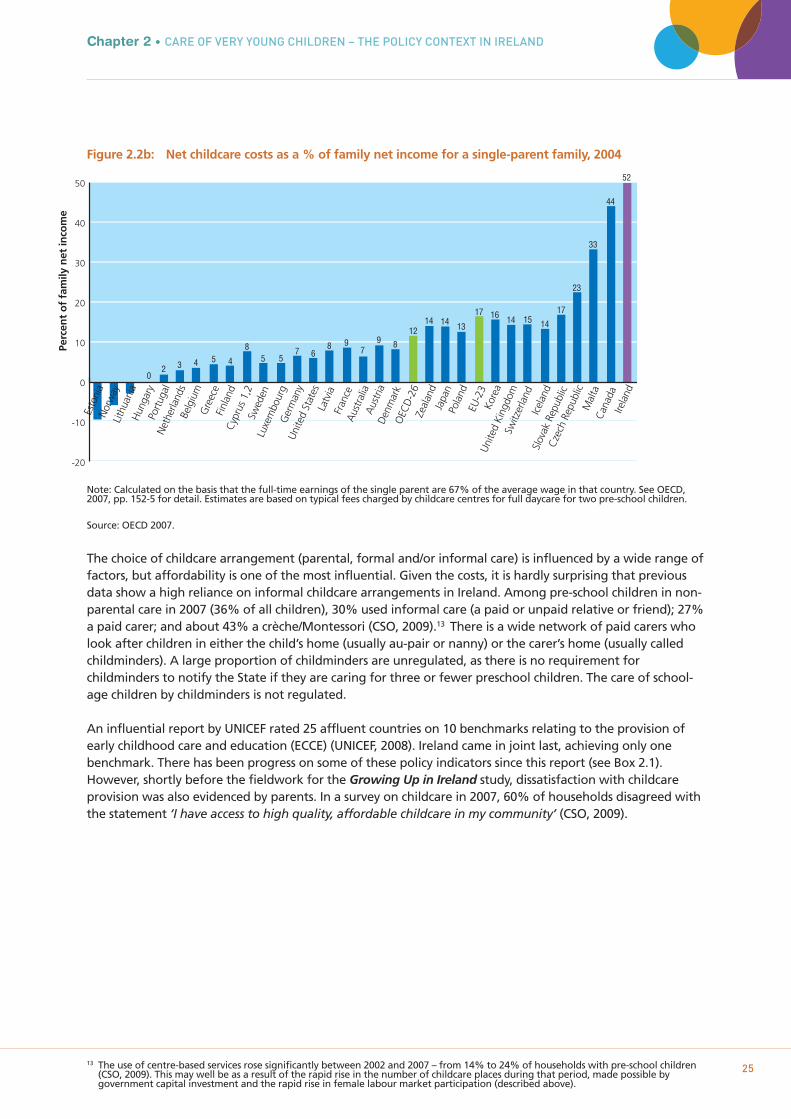
Figure 2.2b: Net childcare costs as a % of family net income for a single-parent family, 2004
Note: Calculated on the basis that the full-time earnings of the single parent are 67% of the average wage in that country. See OECD, 2007, pp. 152-5 for detail. Estimates are based on typical fees charged by childcare centres for full daycare for two pre-school children.
Source: OECD 2007.
The choice of childcare arrangement (parental, formal and/or informal care) is influenced by a wide range offactors, but affordability is one of the most influential. Given the costs, it is hardly surprising that previousdata show a high reliance on informal childcare arrangements in Ireland. Among pre-school children in non-parental care in 2007 (36% of all children), 30% used informal care (a paid or unpaid relative or friend); 27%a paid carer; and about 43% a crèche/Montessori (CSO, 2009).13 There is a wide network of paid carers wholook after children in either the child’s home (usually au-pair or nanny) or the carer’s home (usually calledchildminders). A large proportion of childminders are unregulated, as there is no requirement forchildminders to notify the State if they are caring for three or fewer preschool children. The care of school-age children by childminders is not regulated.
An influential report by UNICEF rated 25 affluent countries on 10 benchmarks relating to the provision ofearly childhood care and education (ECCE) (UNICEF, 2008). Ireland came in joint last, achieving only onebenchmark. There has been progress on some of these policy indicators since this report (see Box 2.1).However, shortly before the fieldwork for the Growing Up in Ireland study, dissatisfaction with childcareprovision was also evidenced by parents. In a survey on childcare in 2007, 60% of households disagreed withthe statement ‘I have access to high quality, affordable childcare in my community’ (CSO, 2009).
Chapter 2 • CARE OF VERY YOUNG CHILDREN – THE POLICY CONTEXT IN IRELAND
2513 The use of centre-based services rose significantly between 2002 and 2007 – from 14% to 24% of households with pre-school children
(CSO, 2009). This may well be as a result of the rapid rise in the number of childcare places during that period, made possible bygovernment capital investment and the rapid rise in female labour market participation (described above).
50
40
30
20
10
0
-10
-20
20
3 4 5 4
85 5
7 68 9
79 8
1214 14 13
17 16 14 15 14
17
23
33
44
52
Esto
nia
Nor
way
Lith
uani
aH
unga
ryPo
rtug
alN
ethe
rland
sBe
lgiu
mG
reec
eFi
nlan
dC
ypru
s 1,
2Sw
eden
Luxe
mbo
urg
Ger
man
yU
nite
d St
ates
Latv
iaFr
ance
Aus
tral
iaA
ustr
iaD
enm
ark
OEC
D-2
6Ze
alan
dJa
pan
Pola
ndEU
-23
Kore
aU
nite
d Ki
ngdo
mSw
itzer
land
Icel
and
Slov
ak R
epub
licC
zech
Rep
ublic
Mal
taC
anad
aIre
land
Perc
ent
of
fam
ily n
et in
com
e
Box 2.1: Recent Developments in Childcare Policy in Ireland
The introduction of the Free Pre-School Year in January 2010, which is available in the academic yearpreceding school entry, represents an important recent development in childcare policy. It replaced auniversal cash supplement (Early Childcare Supplement) with an early care and education service, albeit for alimited number of hours. Children can start the scheme at any age between 3 years 2 months and 4 years 7months, and it is estimated that it now has around 94% take-up.14 The Free Pre-School Year is phasing inqualification requirements, at a low level, and only in relation to pre-school leaders in the pre-school year:since 2012 leaders are required to have at least a qualification at level 5 on the National Framework ofQualifications.15 These requirements are not directly related to the care of infants, but may have a knock-oneffect in centres where infants are being cared for in the same childcare setting as 3-4 year-olds.
In early 2012, the Minister for Children and Youth Affairs announced that Ireland’s first National Early YearsStrategy for children aged 0-6 years would be developed during the course of 2012, and an expert advisorygroup was established. According to the Department of Children and Youth Affairs (DCYA), “The Early YearsStrategy will cover all aspects of children’s experiences in their early years including health, family support,care and education and will identify the structures and policies needed to improve early years experiences inIreland” (DCYA, 2012).16
2.5 GOVERNANCE, REGULATION AND QUALITY OF CHILDCARE
Developments in policies for the provision of childcare in Ireland over the past 15 years include theintroduction of a national policy framework (Síolta, 2006), a curriculum framework (Aistear, 2009) andEquality and Diversity Guidelines (2006). However, by 2011 there was no national plan for early childhoodcare and education, in spite of recommendations from the OECD, the National Economic and Social Forum(NESF) and the Social Partners (Start Strong, 2010). Ireland’s first National Early Years Strategy, for childrenaged 0-6, is still being developed at the time of writing (see Box 2.1).
The Office of the Minister for Children and Youth Affairs (OMCYA) was established in 2005 and in 2011became the Department of Children and Youth Affairs (DYCA). This department is responsible for early careand education services. The Health Services Executive (HSE) is responsible for the inspection of childcareservices and implementing regulations. A number of institutions are responsible for training childcareworkers (primarily Vocational Educational Colleges and Institutes of Technology). At local level, City andCounty Childcare Committees were established in 2001 to support childcare services. They mainly offersupports to childcare service providers.
The regulation of childcare in Ireland has tended to focus on health and safety issues, as opposed to qualityof care. For example, the Child Care (Pre-school Services) Regulations (DHC, 1996), which came into effect in1997, outlined the requirements for services to provide a quality environment, including health and safetyissues, staff-child ratios, space afforded per child, ventilation, lighting and insurance requirements.17
Adult-to-child ratios are specified to range from 1:3 for children under one year old in full-time day care; 1:5for 1-2 year- olds; 1:6 for 2-3 year-olds and 1:8 for children over three (Department of Health and Children,2006). Childminders may not look after more than five pre-school children, including their own, or morethan two children less than 15 months old. The regulations are also limited to those caring for three or morechildren, which excludes many childminders.
Growing Up in Ireland • MOTHERS’ RETURN TO WORK AND CHILDCARE CHOICES FOR INFANTS IN IRELAND • REPORT 2
26
14 There are a number of variants in the scheme. The most common is 15 free hours per week spread over 38 weeks per year, i.e. in linewith the school terms. (A large proportion of 3-4 year-olds are now in sessional services for exactly 15 hours per week, i.e. zero net costto parents.) Other variants have included 11 hours 15 minutes per week spread over 50 weeks (reducing the net fee charged for fulldaycare services).
15 In addition there is a higher capitation grant payable for sessional services led by a graduate with at least three years' experience.16 http://www.dcya.gov.ie/viewdoc.asp?DocID=1809%20. 17 These apply to pre-schools, playgroups, day nurseries, crèches, childminders looking after three or more children, and similar services
catering for children aged birth to six, though not children aged four, five and six attending national schools.
The 1996 regulations did not focus on many important elements of practice such as adult-child interactions,extending and enriching children’s learning by understanding each child as a learner, and planning, creatingand using a stimulating and nurturing learning environment (Department of Education and Science, 2009).The revised Child Care (Pre-school Services) (No 2) Regulations 2006 recognise the role of carers in children’slearning and development, and include children’s welfare and development, though in 2008-2009, at thetime of this survey, there were no requirements regarding staff qualifications (Department of Health andChildren, 2006).
More recent debates on childcare policy have recognised the importance of the quality of care,qualifications and the professionalisation of childcare work, as illustrated, for example, by the publication of‘Developing the workforce in the early childhood care and education sector: Background discussion paper’by the Department of Education in 2011. This is very much in line with international literature whichhighlights the relationship between the qualifications of staff and the quality of service provision(Oberhuemer, 2005; OECD, 2006; European Commission, 2011). Some qualification requirements have beenintroduced with the Free Pre-School Year (see Box 2.1), though these do not directly relate to the care ofinfants.
Overall, there is very little research on the characteristics of non-parental childcare settings in Ireland(Mahony and Hayes, 2006), particularly involving nationally representative data. Chapter 5 examines in moredetail selected features of the childcare settings that nine-month-olds attend, in terms of facilities andactivities, one-to-one interactions, ratio of carers to children and carers’ qualifications.
2.6 SUMMARY
The purpose of this chapter was to describe the policy context for the care of young children in Ireland, as aprelude to analysing data on care of infants. As noted at the start of the chapter, leave policy and childcarepolicy may play an important role in influencing who is caring for children.
The years preceding this survey were of unprecedented economic growth, accompanied by a rapid rise infemale labour market participation and job opportunities for mothers. The demand for childcare places roserapidly.
There were successive extensions to maternity leave in the decade prior to the survey, and paid maternityleave is now of six months’ duration while unpaid leave is sixteen weeks. The total duration of leave formothers now compares well to that in other European countries. There was less policy development in theperiod for fathers, with no paid leave entitlement at all at the time of the survey.
Childcare is and has been a major issue for both parents and policymakers for many years. When thedemand for childcare rose during the boom, much financial support was indirectly provided in the form ofcapital grants to encourage private and community-sector, rather than State, provision. For some low-income parents there are childcare subsidies, but for the large majority of parents of children aged up toabout three and a half, there was and still is no financial support specifically directed towards childcare, andno State provision. In 2008-2009 the quality of non-parental childcare – though one of the most expensive inthe OECD – was not the primary focus of policy in Ireland.
Chapter 2 • CARE OF VERY YOUNG CHILDREN – THE POLICY CONTEXT IN IRELAND
27

Growing Up in Ireland • MOTHERS’ RETURN TO WORK AND CHILDCARE CHOICES FOR INFANTS IN IRELAND • REPORT 2
28
29
Chapter 3MATERNAL CARE AND
RETURN TO PAID WORK

30
Growing Up in Ireland • MOTHERS’ RETURN TO WORK AND CHILDCARE CHOICES FOR INFANTS IN IRELAND • REPORT 2
3.1 INTRODUCTION
One of the most striking changes in recent decades in Irish society has been the rapid rise in the labourmarket participation and employment rates of women. By 2004, female employment rates in Ireland hadconverged with the EU average. In this chapter the implications of this rise for the employment of mothersin the first nine months of a child’s life is examined, by analysing the duration of sole maternal care for alarge sample of mothers with infants.
The key research questions in this chapter are: when do mothers return to work and how is this associatedwith several key characteristics such as mother’s education, age, ethnic background and partnership status(along with the other factors highlighted in Figure 1.1). It also considers the role of child factors (number ofsiblings, breastfeeding, child health, and child temperament) in the timing of return to work, as well as therole of family support, including the proximity of extended family and contact with grandparents. Thereasons for return to work of mothers are complex, so as well as accounting for the mother’s previous job,the models also investigate the reasons a mother gives for return to work and how this is related to thetiming of return. As the focus is on biological mothers who may have been entitled to maternity leave, thevery small number of other primary caregivers are excluded from the analysis in this chapter.
Mothers who had worked prior to the birth were also asked about whether they took paid or unpaidmaternity leave. Chapter 2 discussed how maternity leave in Ireland had been progressively extended in themonths prior to the study, and other studies have highlighted the role leave plays in the timing of return towork. This chapter considers the take-up of both paid and unpaid maternity leave for mothers who wereworking prior to the birth of their infant, as well as leave uptake by fathers. The association between thetiming of return to work and taking maternity leave was also studied.
The nine-month observation period for the Infant Cohort of the Growing Up in Ireland study was relativelyshort, and many women who planned to return to work would not yet have done so, but it is nevertheless acrucial period for analysing return to work. Given the events were so recent, recall error was unlikely to be aproblem since it was the last nine months that were covered.
31
Chapter 3 • MATERNAL CARE AND RETURN TO PAID WORK
3.2 PREVIOUS RESEARCH ON MOTHER’S RETURN TO WORK AFTER CHILDBIRTH
As noted in Chapter 1, the growing international literature investigating the factors that influence amother’s decision to return to paid work after childbirth and its timing is often concerned with the impact ofchildbirth on gender equality in the labour market, but it is also highly informative about the duration ofsole maternal care. Most of this research has been conducted internationally but special attention is paidhere to two Irish studies of the topic (Russell et al., 2006 and Russell et al., 2011).
Women with higher educational qualifications and those who occupy ‘privileged’ jobs prior to having aninfant are likely to have both stronger financial motives to return to work, as they earn more, and strongernon-financial motives to return to work, as the consequences of a break in terms of career development maybe higher for them than for women with lower education in low-skilled jobs (OECD, 2007). They may alsoenjoy work more. Previous research has certainly found that women with higher education typically returnto work more quickly in the UK (McRae, 1993; La Valle et al., 2008) and also in Ireland (Russell et al., 2006).However, analysing UK data, Smeaton (2006) highlighted a countervailing influence: low-educated womenreturned early for financial reasons. For example, Russell et al. (2011) found low-educated women in Irelandare more likely than those with a degree to either return to work early, or to remain outside the labourmarket for more than two years. Of course, the influence of educational qualifications may be conditionedby maternity-leave provision, an issue highlighted by Waldfogel et al. (1999). It may be that educationalqualifications play a role in the decision at the end of paid maternity leave.
In terms of demographic characteristics, the impact of a mother’s age on her return to work has been foundto vary across countries (Russell et al., 2011). For example, research in France and Ireland has found thatolder mothers have slower and lower return to work rates, even after controlling for other factors (Russell etal., 2006; Saurel-Cubizolles et al., 1999); however, in Spain older mothers are more likely return to work(Saurel-Cubizolles et al., 1999).
Whether or not a mother has a partner may influence if and when she returns to work. The financialpressure to return to work may be particularly acute for women who bear the sole financial responsibilityfor their children. However, caring for a small infant may be difficult to combine with paid work for motherswithout a partner, particularly if reliable and affordable childcare is not available. Previous research showsthat patterns of return to work are very sensitive to benefit provision for lone mothers (Pedersen et al.,2000). For those in partnerships, their partner’s employment status or earnings may influence their return towork, and this may vary cross-nationally (Blossfeld and Drobnic, 2001). McCulloch and Dex (2001) found noimpact of partner’s resources on return to work in the UK, but more recent work from the UK found thatwomen’s likelihood of returning to work increased as their partners’ earnings decreased (LaValle et al.,2008).
Typically, second and subsequent births are associated with lower return-to-work rates (Russell et al., 2006).Here it is important to distinguish whether the focus is limited to those working during pregnancy with thischild, or mothers who had ever worked. Studies that examined the effect of child temperament on mothers’return to work usually found weak or no associations (Pungello and Kurtz Costes, 1999). Mothers’ return towork, particularly full-time work, is associated with cessation of breastfeeding, so we would expectbreastfeeding to be associated with later return to work (Lindberg, 1996; Layte and McCrory, forthcoming).Infant health problems may also delay return to work (Derigne and Porterfield, 2010).
Factors other than a woman’s personal or family characteristics may influence return to work. Some authorshave argued that individual women’s work orientation and personal preferences play a decisive role in herchoice between full-time motherhood or a combination of paid work and motherhood (Hakim, 2004;Pungello and Kurtz Costes, 1999). In practice it is hard to distinguish whether preferences influencebehaviour, or behaviour influences preferences, as individuals may fit their preferences to match their
32
Growing Up in Ireland • MOTHERS’ RETURN TO WORK AND CHILDCARE CHOICES FOR INFANTS IN IRELAND • REPORT 2
circumstances. In addition, individuals may not exercise their preference because of financial or other (e.g.childcare) constraints. Whatever a mother’s individual preference, societal attitudes may influence mothers’return to work too (Pungello and Kurtz Costes, 1999). In recent decades, attitudes in Irish society havebecome considerably more supportive of mothers working. In 2002, for example, attitudes towards mothersof pre-school children working were more supportive in Ireland than in the USA, France or Spain (Russell etal., 2009, using ISSP data).
The type of job and organisation a woman worked for before the birth of her child may also influence herreturn to work. For example, Russell et al. (2011) found that self-employment was strongly associated withearly return to work: self-employed women were five times more likely to return to work within 22 weeksthan employees. This may be linked to lower benefit receipt for this group, and/or greater flexibility inscheduling work (Russell et al., 2011). Other factors associated with the timing of return to work in Irelandwere the size of organisations, industrial sector and security of tenure (Russell et al., 2011).
International research suggests that the timing of return to work is very sensitive to provisions of maternity-leave policy, though more to paid than unpaid leave (OECD, 2007). In the US, Berger and Waldfogel (2004)found a strong association between leave entitlement and return to work: mothers who were entitled totake paid maternity leave (in this case 12 weeks’ duration) were unlikely to return to work before 12 weekspost-birth, but were also considerably less likely to take leave of more than 12 weeks. Berger et al. (2005)found that, although maternity leave is associated with longer leave-taking (which may have certaineconomic costs) and may increase leave lengths up to a certain threshold, after a certain point evidencesuggests it in fact facilitates increased return of mothers to work. Similarly, Saurel-Cubizolles et al. (1999),who compared return to work after childbirth in France, Italy and Spain, found that the patterns of returnto work were consistent with the duration of paid post-natal leave in each country. Ondrich et al. (1996)used longitudinal data from the German socio-economic panel to estimate the impact of various changes topaid maternity-leave provision on the timing of mothers’ return to work in Germany. They found no effectfor the size of payment, but did find that mothers tended to take advantage of the full extent of paid leave,and lengthening the paid leave period had the effect of mothers interrupting paid work for longer.Together, this international evidence suggests that the duration of paid maternity leave is a powerful policylever influencing the behaviour of mothers in the immediate post-natal period.
3.3 PATTERNS OF RETURN TO WORK BY MOTHERS OF INFANTS
Figure 3.1, based on the Growing Up in Ireland Infant Cohort, shows the percentage of mothers at work inthe nine months after giving birth. As the key focus of this report is on the infants and who was caring forthem, all mothers of infants were considered, and not just those who were working prior to birth, as istypical in analyses of interruptions to women’s careers following childbirth. This graph and those that followthus include those who worked before the birth of their infant, and those who did not.
An extremely low proportion of mothers started work in the first four months after childbirth, and even byfive months only 8% were working. A rapid increase occurred at six months, which coincides with the end ofpaid maternity leave in Ireland. There was then a continual increase in subsequent months to 44% ofmothers working by the time of interview. Some mothers supplemented paid leave with annual leave, andsome also took unpaid leave; paid and unpaid leave together end at around nine months. Mothers alsovaried in terms of the amount of the 26 weeks’ paid leave they took before the birth; 78% of mothers in thissample were working prior to birth. If the focus is limited to those who had worked, 57% of them wereback to work by the time of interview at nine months.
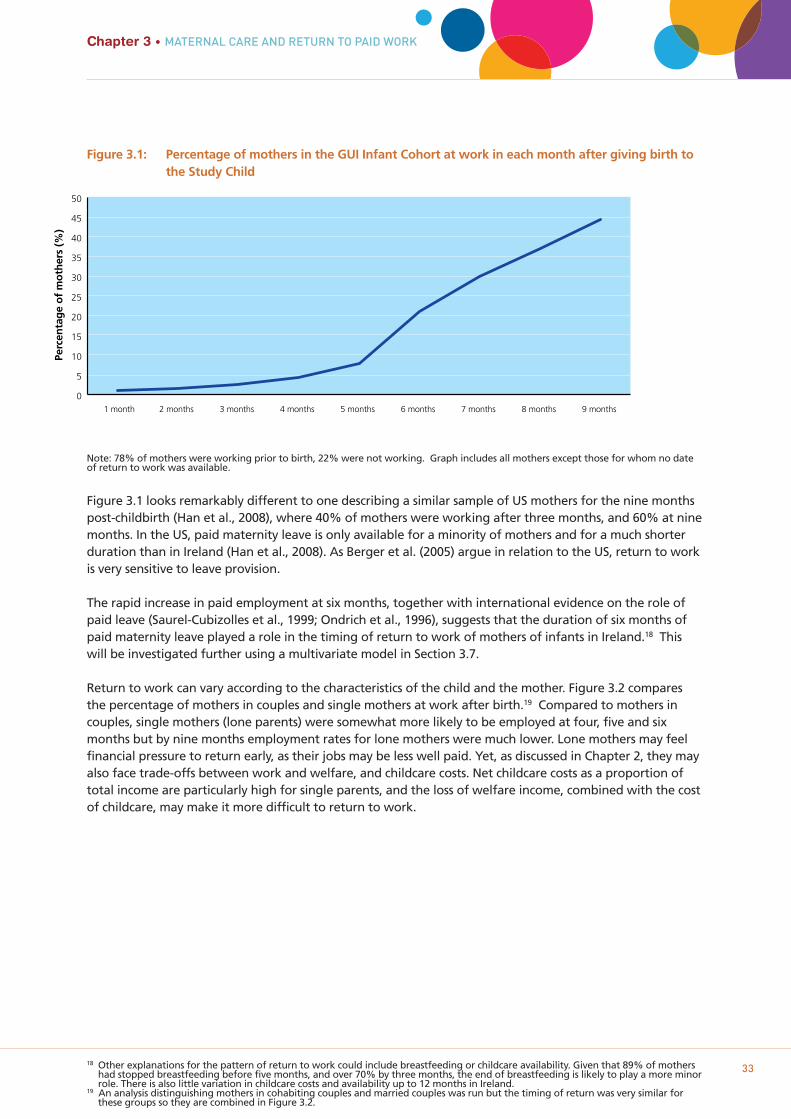
18 Other explanations for the pattern of return to work could include breastfeeding or childcare availability. Given that 89% of mothershad stopped breastfeeding before five months, and over 70% by three months, the end of breastfeeding is likely to play a more minorrole. There is also little variation in childcare costs and availability up to 12 months in Ireland.
19 An analysis distinguishing mothers in cohabiting couples and married couples was run but the timing of return was very similar forthese groups so they are combined in Figure 3.2.
33
Chapter 3 • MATERNAL CARE AND RETURN TO PAID WORK
Figure 3.1: Percentage of mothers in the GUI Infant Cohort at work in each month after giving birth to the Study Child
Note: 78% of mothers were working prior to birth, 22% were not working. Graph includes all mothers except those for whom no dateof return to work was available.
Figure 3.1 looks remarkably different to one describing a similar sample of US mothers for the nine monthspost-childbirth (Han et al., 2008), where 40% of mothers were working after three months, and 60% at ninemonths. In the US, paid maternity leave is only available for a minority of mothers and for a much shorterduration than in Ireland (Han et al., 2008). As Berger et al. (2005) argue in relation to the US, return to workis very sensitive to leave provision.
The rapid increase in paid employment at six months, together with international evidence on the role ofpaid leave (Saurel-Cubizolles et al., 1999; Ondrich et al., 1996), suggests that the duration of six months ofpaid maternity leave played a role in the timing of return to work of mothers of infants in Ireland.18 Thiswill be investigated further using a multivariate model in Section 3.7.
Return to work can vary according to the characteristics of the child and the mother. Figure 3.2 comparesthe percentage of mothers in couples and single mothers at work after birth.19 Compared to mothers incouples, single mothers (lone parents) were somewhat more likely to be employed at four, five and sixmonths but by nine months employment rates for lone mothers were much lower. Lone mothers may feelfinancial pressure to return early, as their jobs may be less well paid. Yet, as discussed in Chapter 2, they mayalso face trade-offs between work and welfare, and childcare costs. Net childcare costs as a proportion oftotal income are particularly high for single parents, and the loss of welfare income, combined with the costof childcare, may make it more difficult to return to work.
Perc
enta
ge
of
mo
ther
s (%
)
0
5
10
15
20
25
30
35
40
45
50
1 month 2 months 3 months 4 months 5 months 6 months 7 months 8 months 9 months
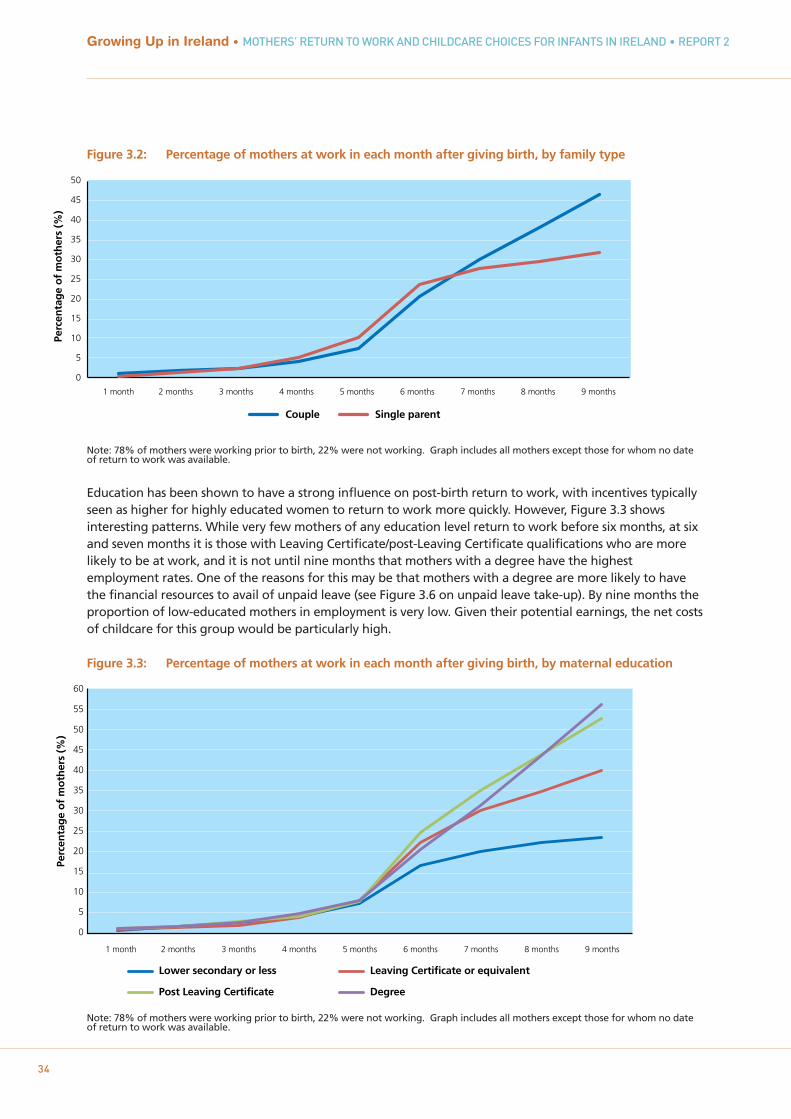
34
Growing Up in Ireland • MOTHERS’ RETURN TO WORK AND CHILDCARE CHOICES FOR INFANTS IN IRELAND • REPORT 2
Figure 3.2: Percentage of mothers at work in each month after giving birth, by family type
Note: 78% of mothers were working prior to birth, 22% were not working. Graph includes all mothers except those for whom no dateof return to work was available.
Education has been shown to have a strong influence on post-birth return to work, with incentives typicallyseen as higher for highly educated women to return to work more quickly. However, Figure 3.3 showsinteresting patterns. While very few mothers of any education level return to work before six months, at sixand seven months it is those with Leaving Certificate/post-Leaving Certificate qualifications who are morelikely to be at work, and it is not until nine months that mothers with a degree have the highestemployment rates. One of the reasons for this may be that mothers with a degree are more likely to havethe financial resources to avail of unpaid leave (see Figure 3.6 on unpaid leave take-up). By nine months theproportion of low-educated mothers in employment is very low. Given their potential earnings, the net costsof childcare for this group would be particularly high.
Figure 3.3: Percentage of mothers at work in each month after giving birth, by maternal education
Note: 78% of mothers were working prior to birth, 22% were not working. Graph includes all mothers except those for whom no dateof return to work was available.
Perc
enta
ge
of
mo
ther
s (%
)
Couple Single parent
0
5
10
15
20
25
30
35
40
45
50
1 month 2 months 3 months 4 months 5 months 6 months 7 months 8 months 9 months
Perc
enta
ge
of
mo
ther
s (%
)
0
5
10
15
20
25
30
35
40
45
50
55
60
1 month 2 months 3 months 4 months 5 months 6 months 7 months 8 months 9 months
Lower secondary or less Leaving Certificate or equivalent
Post Leaving Certificate Degree
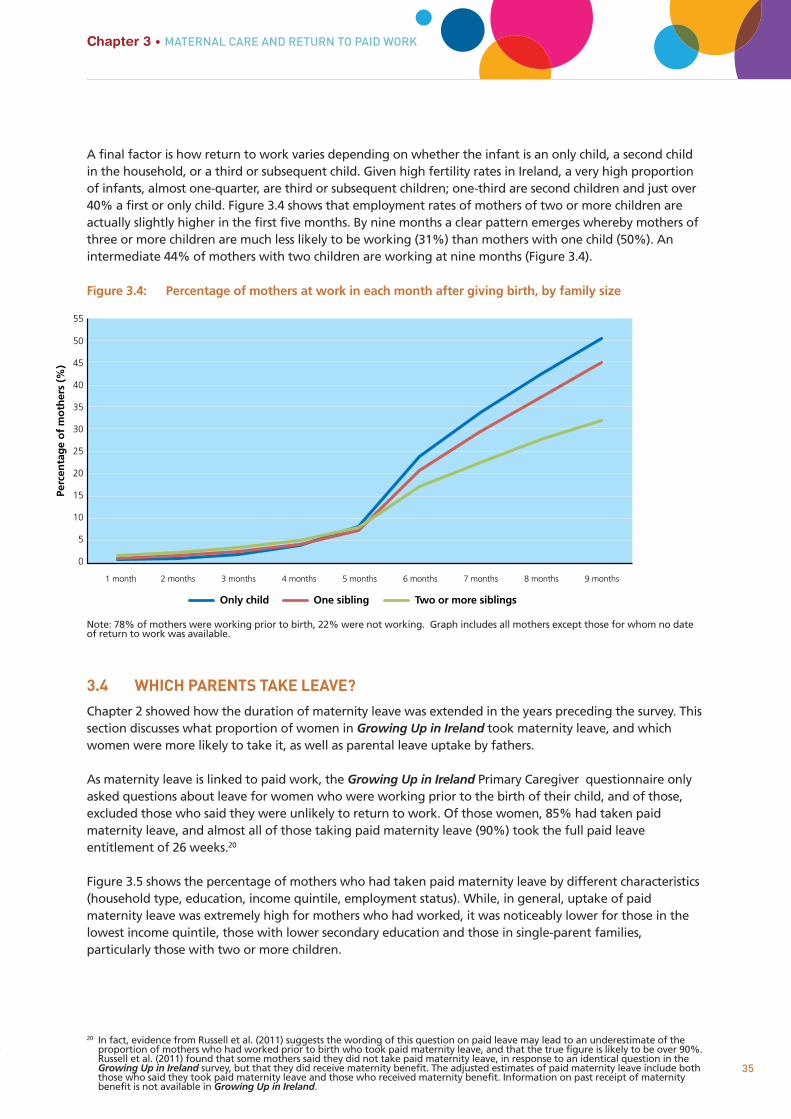
20 In fact, evidence from Russell et al. (2011) suggests the wording of this question on paid leave may lead to an underestimate of theproportion of mothers who had worked prior to birth who took paid maternity leave, and that the true figure is likely to be over 90%.Russell et al. (2011) found that some mothers said they did not take paid maternity leave, in response to an identical question in theGrowing Up in Ireland survey, but that they did receive maternity benefit. The adjusted estimates of paid maternity leave include boththose who said they took paid maternity leave and those who received maternity benefit. Information on past receipt of maternitybenefit is not available in Growing Up in Ireland.
35
Chapter 3 • MATERNAL CARE AND RETURN TO PAID WORK
A final factor is how return to work varies depending on whether the infant is an only child, a second childin the household, or a third or subsequent child. Given high fertility rates in Ireland, a very high proportionof infants, almost one-quarter, are third or subsequent children; one-third are second children and just over40% a first or only child. Figure 3.4 shows that employment rates of mothers of two or more children areactually slightly higher in the first five months. By nine months a clear pattern emerges whereby mothers ofthree or more children are much less likely to be working (31%) than mothers with one child (50%). Anintermediate 44% of mothers with two children are working at nine months (Figure 3.4).
Figure 3.4: Percentage of mothers at work in each month after giving birth, by family size
Note: 78% of mothers were working prior to birth, 22% were not working. Graph includes all mothers except those for whom no dateof return to work was available.
3.4 WHICH PARENTS TAKE LEAVE?
Chapter 2 showed how the duration of maternity leave was extended in the years preceding the survey. Thissection discusses what proportion of women in Growing Up in Ireland took maternity leave, and whichwomen were more likely to take it, as well as parental leave uptake by fathers.
As maternity leave is linked to paid work, the Growing Up in Ireland Primary Caregiver questionnaire onlyasked questions about leave for women who were working prior to the birth of their child, and of those,excluded those who said they were unlikely to return to work. Of those women, 85% had taken paidmaternity leave, and almost all of those taking paid maternity leave (90%) took the full paid leaveentitlement of 26 weeks.20
Figure 3.5 shows the percentage of mothers who had taken paid maternity leave by different characteristics(household type, education, income quintile, employment status). While, in general, uptake of paidmaternity leave was extremely high for mothers who had worked, it was noticeably lower for those in thelowest income quintile, those with lower secondary education and those in single-parent families,particularly those with two or more children.
Perc
enta
ge
of
mo
ther
s (%
)
0
5
10
15
20
25
30
35
40
45
50
55
1 month 2 months 3 months 4 months 5 months 6 months 7 months 8 months 9 months
Only child One sibling Two or more siblings
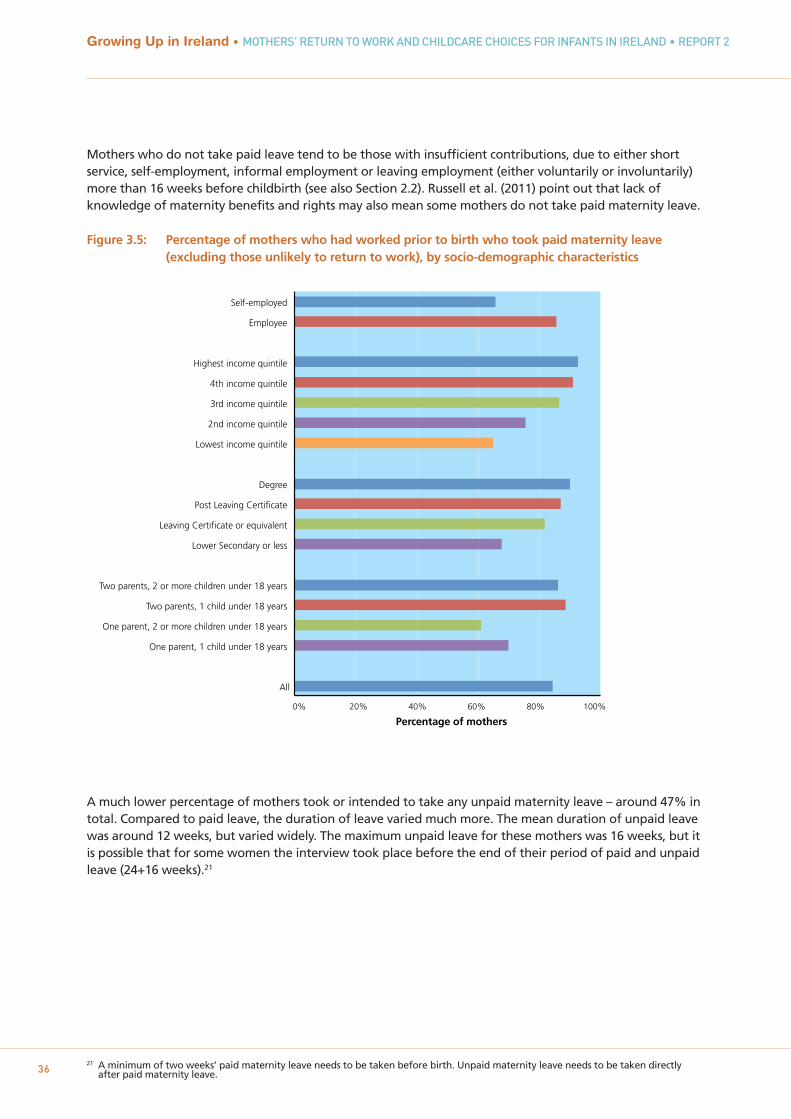
21 A minimum of two weeks’ paid maternity leave needs to be taken before birth. Unpaid maternity leave needs to be taken directlyafter paid maternity leave. 36
Growing Up in Ireland • MOTHERS’ RETURN TO WORK AND CHILDCARE CHOICES FOR INFANTS IN IRELAND • REPORT 2
Mothers who do not take paid leave tend to be those with insufficient contributions, due to either shortservice, self-employment, informal employment or leaving employment (either voluntarily or involuntarily)more than 16 weeks before childbirth (see also Section 2.2). Russell et al. (2011) point out that lack ofknowledge of maternity benefits and rights may also mean some mothers do not take paid maternity leave.
Figure 3.5: Percentage of mothers who had worked prior to birth who took paid maternity leave (excluding those unlikely to return to work), by socio-demographic characteristics
A much lower percentage of mothers took or intended to take any unpaid maternity leave – around 47% intotal. Compared to paid leave, the duration of leave varied much more. The mean duration of unpaid leavewas around 12 weeks, but varied widely. The maximum unpaid leave for these mothers was 16 weeks, but itis possible that for some women the interview took place before the end of their period of paid and unpaidleave (24+16 weeks).21
0% 20% 40% 60% 80% 100%
Percentage of mothers
All
One parent, 1 child under 18 years
One parent, 2 or more children under 18 years
Two parents, 1 child under 18 years
Two parents, 2 or more children under 18 years
Lower Secondary or less
Leaving Certificate or equivalent
Post Leaving Certificate
Degree
Lowest income quintile
2nd income quintile
3rd income quintile
4th income quintile
Highest income quintile
Employee
Self-employed
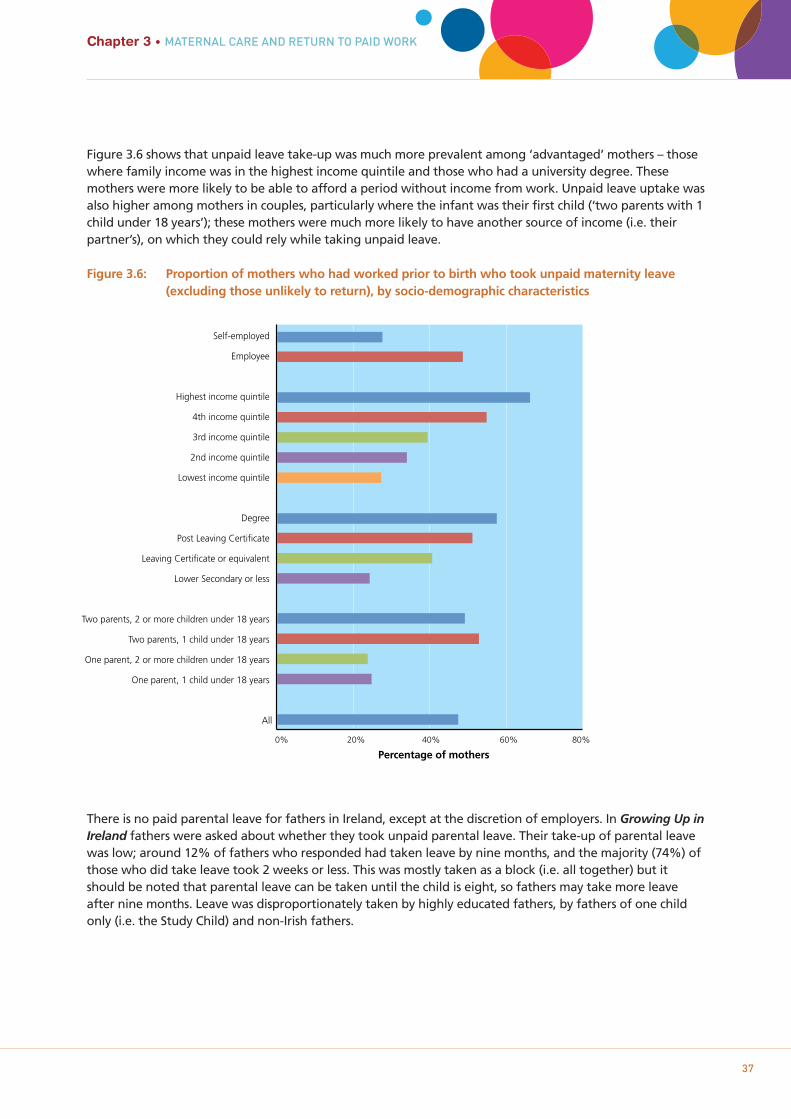
37
Chapter 3 • MATERNAL CARE AND RETURN TO PAID WORK
Figure 3.6 shows that unpaid leave take-up was much more prevalent among ‘advantaged’ mothers – thosewhere family income was in the highest income quintile and those who had a university degree. Thesemothers were more likely to be able to afford a period without income from work. Unpaid leave uptake wasalso higher among mothers in couples, particularly where the infant was their first child (‘two parents with 1child under 18 years’); these mothers were much more likely to have another source of income (i.e. theirpartner’s), on which they could rely while taking unpaid leave.
Figure 3.6: Proportion of mothers who had worked prior to birth who took unpaid maternity leave (excluding those unlikely to return), by socio-demographic characteristics
There is no paid parental leave for fathers in Ireland, except at the discretion of employers. In Growing Up inIreland fathers were asked about whether they took unpaid parental leave. Their take-up of parental leavewas low; around 12% of fathers who responded had taken leave by nine months, and the majority (74%) ofthose who did take leave took 2 weeks or less. This was mostly taken as a block (i.e. all together) but itshould be noted that parental leave can be taken until the child is eight, so fathers may take more leaveafter nine months. Leave was disproportionately taken by highly educated fathers, by fathers of one childonly (i.e. the Study Child) and non-Irish fathers.
0% 20% 40% 60% 80%
Percentage of mothers
All
One parent, 1 child under 18 years
One parent, 2 or more children under 18 years
Two parents, 1 child under 18 years
Two parents, 2 or more children under 18 years
Lower Secondary or less
Leaving Certificate or equivalent
Post Leaving Certificate
Degree
Lowest income quintile
2nd income quintile
3rd income quintile
4th income quintile
Highest income quintile
Employee
Self-employed
3.5 THE TIMING OF RETURN TO WORK
It is clear from Section 3.3 that, for those who do return to work, the timing of return also variesconsiderably across time, particularly in the period of six to nine months post-birth. It is useful to knowwhether those not working when the infant was nine months old were working prior to childbirth and hadnot yet returned to work, or whether they were not working prior to childbirth, to give a comprehensivepicture of sole maternal care in the first nine months of an infant’s life.22
A multinomial logistic regression model was estimated in order to compare mothers who return to work atsix to seven months (the modal group) with other mothers: those who return before six months (earlyreturn); those who return at eight to nine months; those who have not yet returned, and those who werenot working prior to birth.23 This model allows us to estimate the association between the timing of returnto work and mothers’ characteristics, child factors and neighbourhood characteristics, while holding othercharacteristics constant. For example, are younger mothers more likely to return in a certain period thanolder mothers, even if we hold their educational level constant? In each case a subcategory within a group –e.g. third-level degree within education – is used as the reference group, and the model estimates odds ofreturn to work for other subcategories (lower secondary education, Leaving Certificate, post-LeavingCertificate) relative to this reference group. In logistic regression modelling, odds ratios are estimated (seeTable 3.1). If the odds ratio for any subgroup is greater than one, this group is more likely to return to workin this period than the reference group. By contrast, if the odds ratio is less than one, the group is less likelyto return to work in this period. Subsequent models investigate associations between the timing of returnand mother’s motivation and previous job (Table 3.3), and between timing and maternity leave (Table 3.4),after controlling for other characteristics.24 The column ‘at 6-7 months’ is the reference category. Model fitstatistics for this and the other logistic models in the report are the model chi square and Nagelkerke Rsquare.25
This modelling framework is similar to that in Russell et al. (2011) in their study of mothers in autumn 2009,except that the observation window in Growing Up in Ireland stops at nine months, whereas the sample inRussell et al. (2011) was to two years. Russell et al. (2011) also focus on women working prior to birth,whereas in this model those who were not working were also included, and there were more child-relatedcharacteristics such as temperament, health and breastfeeding, as well as information about wider familysupport.
The first column in Table 3.1 shows those mothers more likely to return to work in the first five months:young mothers (under 20), white non-Irish mothers, single parents and mothers of two or more children.Overall employment of both young mothers and lone mothers was low, but those that do return to work doso quickly, presumably because of financial necessity. This pattern was also found by Russell et al. (2011). Noother child or neighbourhood factors are associated with early return to work.
Growing Up in Ireland • MOTHERS’ RETURN TO WORK AND CHILDCARE CHOICES FOR INFANTS IN IRELAND • REPORT 2
38
22 A small number of those mothers who were not working prior to birth were working at the time of interview (1.5% of all mothers).Because the focus in the survey is on return to work, there is no information on the age of the infant when these mothers returned, sothey are included in the ‘Not working prior to birth’ category in the model presented in Table 3.2. These mothers share similarcharacteristics to other mothers who were not working before the birth of their infant. The results of this model do not change if thisgroup are excluded.
23 An alternative modelling strategy would be to use discrete-time event history modelling. This allows precise estimation of transitionrates at any given month. However, it does not permit separately identifying mothers who did not work prior to birth, and it is alsomore difficult to allow the effect of covariates according to specific time periods than using this model. In addition, a key strength ofevent history modelling is the ability to use characteristics that vary over time, which are not available here.
24 The models also allow us to determine whether the results are robust or ‘statistically significant’, i.e. whether we can be confident thatthe differences would not have been generated by chance, given the sample size in each case.
25 The model chi square shows the improvement in the -2 log likelihood from adding the explanatory factors (age, education, etc) versusthe model with none. Higher values indicate a better fit. The Nagelkerke is a pseudo R-squared measure which values from 0-1. It isuseful to compare how models of the same outcome and the same number of cases compare in terms of predictive power, a higher R-squared indicating greater predictive power.
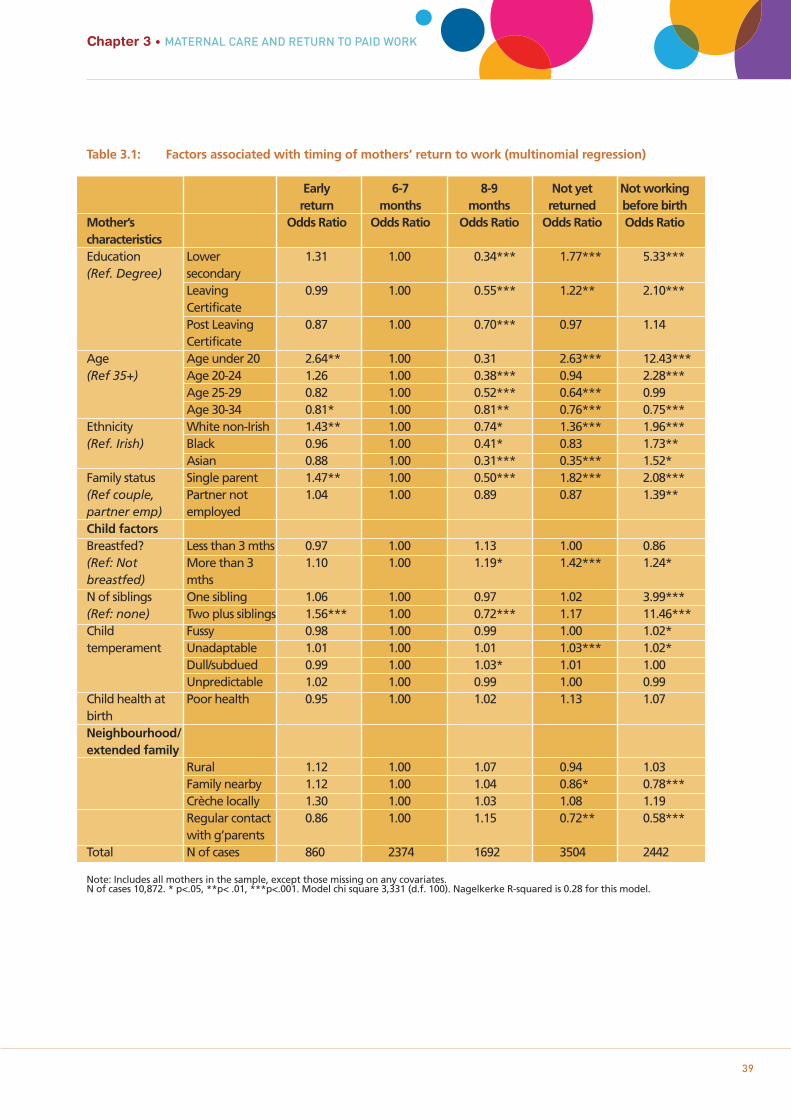
Chapter 3 • MATERNAL CARE AND RETURN TO PAID WORK
39
Table 3.1: Factors associated with timing of mothers’ return to work (multinomial regression)
Early 6-7 8-9 Not yet Not workingreturn months months returned before birth
Mother’s Odds Ratio Odds Ratio Odds Ratio Odds Ratio Odds RatiocharacteristicsEducation Lower 1.31 1.00 0.34*** 1.77*** 5.33***(Ref. Degree) secondary
Leaving 0.99 1.00 0.55*** 1.22** 2.10***CertificatePost Leaving 0.87 1.00 0.70*** 0.97 1.14Certificate
Age Age under 20 2.64** 1.00 0.31 2.63*** 12.43***(Ref 35+) Age 20-24 1.26 1.00 0.38*** 0.94 2.28***
Age 25-29 0.82 1.00 0.52*** 0.64*** 0.99Age 30-34 0.81* 1.00 0.81** 0.76*** 0.75***
Ethnicity White non-Irish 1.43** 1.00 0.74* 1.36*** 1.96***(Ref. Irish) Black 0.96 1.00 0.41* 0.83 1.73**
Asian 0.88 1.00 0.31*** 0.35*** 1.52*Family status Single parent 1.47** 1.00 0.50*** 1.82*** 2.08***(Ref couple, Partner not 1.04 1.00 0.89 0.87 1.39**partner emp) employedChild factorsBreastfed? Less than 3 mths 0.97 1.00 1.13 1.00 0.86(Ref: Not More than 3 1.10 1.00 1.19* 1.42*** 1.24*breastfed) mthsN of siblings One sibling 1.06 1.00 0.97 1.02 3.99***(Ref: none) Two plus siblings 1.56*** 1.00 0.72*** 1.17 11.46***Child Fussy 0.98 1.00 0.99 1.00 1.02*temperament Unadaptable 1.01 1.00 1.01 1.03*** 1.02*
Dull/subdued 0.99 1.00 1.03* 1.01 1.00Unpredictable 1.02 1.00 0.99 1.00 0.99
Child health at Poor health 0.95 1.00 1.02 1.13 1.07birth Neighbourhood/ extended family
Rural 1.12 1.00 1.07 0.94 1.03Family nearby 1.12 1.00 1.04 0.86* 0.78***Crèche locally 1.30 1.00 1.03 1.08 1.19Regular contact 0.86 1.00 1.15 0.72** 0.58***with g’parents
Total N of cases 860 2374 1692 3504 2442
Note: Includes all mothers in the sample, except those missing on any covariates. N of cases 10,872. * p<.05, **p< .01, ***p<.001. Model chi square 3,331 (d.f. 100). Nagelkerke R-squared is 0.28 for this model.
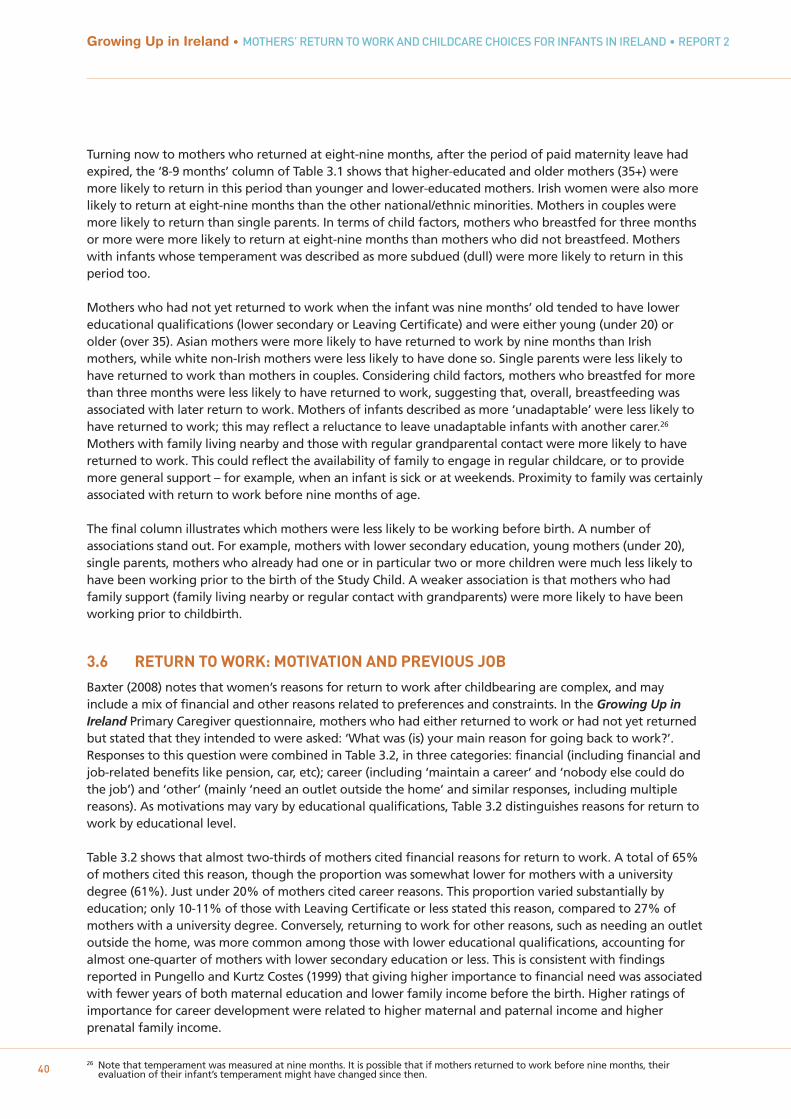
26 Note that temperament was measured at nine months. It is possible that if mothers returned to work before nine months, theirevaluation of their infant’s temperament might have changed since then. 40
Growing Up in Ireland • MOTHERS’ RETURN TO WORK AND CHILDCARE CHOICES FOR INFANTS IN IRELAND • REPORT 2
Turning now to mothers who returned at eight-nine months, after the period of paid maternity leave hadexpired, the ‘8-9 months’ column of Table 3.1 shows that higher-educated and older mothers (35+) weremore likely to return in this period than younger and lower-educated mothers. Irish women were also morelikely to return at eight-nine months than the other national/ethnic minorities. Mothers in couples weremore likely to return than single parents. In terms of child factors, mothers who breastfed for three monthsor more were more likely to return at eight-nine months than mothers who did not breastfeed. Motherswith infants whose temperament was described as more subdued (dull) were more likely to return in thisperiod too.
Mothers who had not yet returned to work when the infant was nine months’ old tended to have lowereducational qualifications (lower secondary or Leaving Certificate) and were either young (under 20) orolder (over 35). Asian mothers were more likely to have returned to work by nine months than Irishmothers, while white non-Irish mothers were less likely to have done so. Single parents were less likely tohave returned to work than mothers in couples. Considering child factors, mothers who breastfed for morethan three months were less likely to have returned to work, suggesting that, overall, breastfeeding wasassociated with later return to work. Mothers of infants described as more ‘unadaptable’ were less likely tohave returned to work; this may reflect a reluctance to leave unadaptable infants with another carer.26
Mothers with family living nearby and those with regular grandparental contact were more likely to havereturned to work. This could reflect the availability of family to engage in regular childcare, or to providemore general support – for example, when an infant is sick or at weekends. Proximity to family was certainlyassociated with return to work before nine months of age.
The final column illustrates which mothers were less likely to be working before birth. A number ofassociations stand out. For example, mothers with lower secondary education, young mothers (under 20),single parents, mothers who already had one or in particular two or more children were much less likely tohave been working prior to the birth of the Study Child. A weaker association is that mothers who hadfamily support (family living nearby or regular contact with grandparents) were more likely to have beenworking prior to childbirth.
3.6 RETURN TO WORK: MOTIVATION AND PREVIOUS JOB
Baxter (2008) notes that women’s reasons for return to work after childbearing are complex, and mayinclude a mix of financial and other reasons related to preferences and constraints. In the Growing Up inIreland Primary Caregiver questionnaire, mothers who had either returned to work or had not yet returnedbut stated that they intended to were asked: ‘What was (is) your main reason for going back to work?’.Responses to this question were combined in Table 3.2, in three categories: financial (including financial andjob-related benefits like pension, car, etc); career (including ‘maintain a career’ and ‘nobody else could dothe job’) and ‘other’ (mainly ‘need an outlet outside the home’ and similar responses, including multiplereasons). As motivations may vary by educational qualifications, Table 3.2 distinguishes reasons for return towork by educational level.
Table 3.2 shows that almost two-thirds of mothers cited financial reasons for return to work. A total of 65%of mothers cited this reason, though the proportion was somewhat lower for mothers with a universitydegree (61%). Just under 20% of mothers cited career reasons. This proportion varied substantially byeducation; only 10-11% of those with Leaving Certificate or less stated this reason, compared to 27% ofmothers with a university degree. Conversely, returning to work for other reasons, such as needing an outletoutside the home, was more common among those with lower educational qualifications, accounting foralmost one-quarter of mothers with lower secondary education or less. This is consistent with findingsreported in Pungello and Kurtz Costes (1999) that giving higher importance to financial need was associatedwith fewer years of both maternal education and lower family income before the birth. Higher ratings ofimportance for career development were related to higher maternal and paternal income and higherprenatal family income.
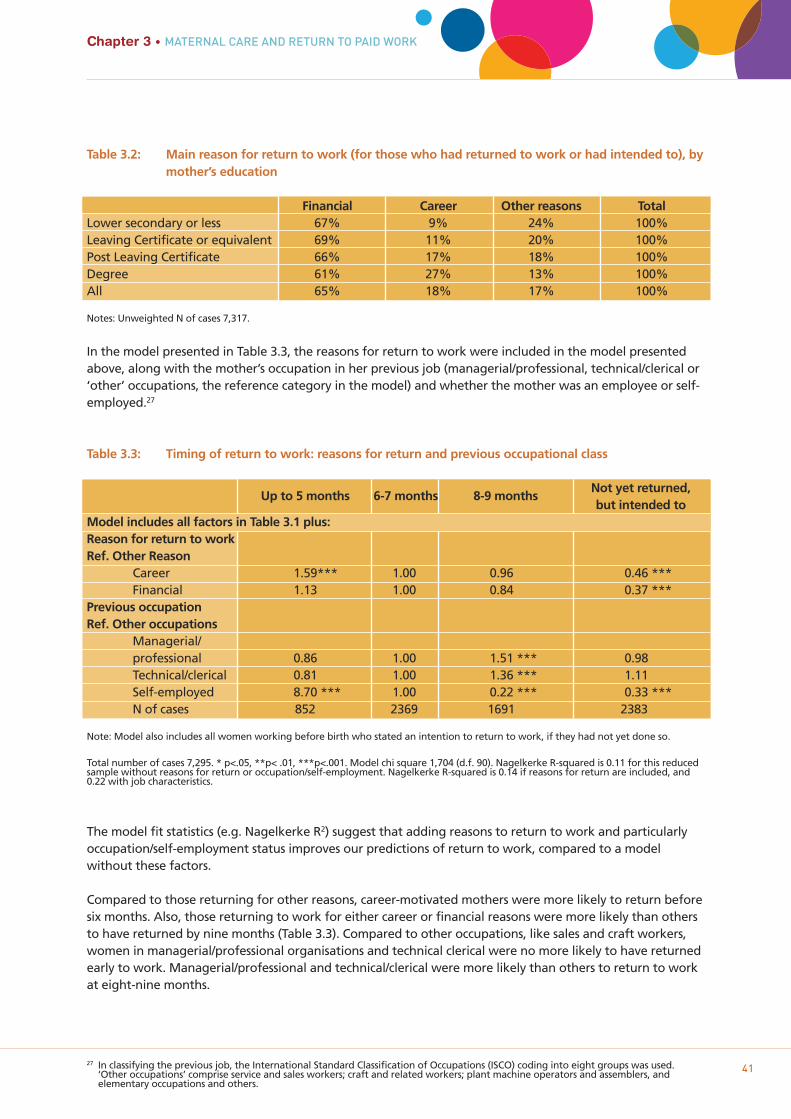
27 In classifying the previous job, the International Standard Classification of Occupations (ISCO) coding into eight groups was used.‘Other occupations’ comprise service and sales workers; craft and related workers; plant machine operators and assemblers, andelementary occupations and others.
41
Chapter 3 • MATERNAL CARE AND RETURN TO PAID WORK
Table 3.2: Main reason for return to work (for those who had returned to work or had intended to), bymother’s education
Financial Career Other reasons TotalLower secondary or less 67% 9% 24% 100%Leaving Certificate or equivalent 69% 11% 20% 100%Post Leaving Certificate 66% 17% 18% 100%Degree 61% 27% 13% 100%All 65% 18% 17% 100%
Notes: Unweighted N of cases 7,317.
In the model presented in Table 3.3, the reasons for return to work were included in the model presentedabove, along with the mother’s occupation in her previous job (managerial/professional, technical/clerical or‘other’ occupations, the reference category in the model) and whether the mother was an employee or self-employed.27
Table 3.3: Timing of return to work: reasons for return and previous occupational class
Up to 5 months 6-7 months 8-9 monthsNot yet returned, but intended to
Model includes all factors in Table 3.1 plus:Reason for return to workRef. Other Reason
Career 1.59*** 1.00 0.96 0.46 ***Financial 1.13 1.00 0.84 0.37 ***
Previous occupation Ref. Other occupations
Managerial/professional 0.86 1.00 1.51 *** 0.98Technical/clerical 0.81 1.00 1.36 *** 1.11Self-employed 8.70 *** 1.00 0.22 *** 0.33 ***N of cases 852 2369 1691 2383
Note: Model also includes all women working before birth who stated an intention to return to work, if they had not yet done so.
Total number of cases 7,295. * p<.05, **p< .01, ***p<.001. Model chi square 1,704 (d.f. 90). Nagelkerke R-squared is 0.11 for this reducedsample without reasons for return or occupation/self-employment. Nagelkerke R-squared is 0.14 if reasons for return are included, and0.22 with job characteristics.
The model fit statistics (e.g. Nagelkerke R2) suggest that adding reasons to return to work and particularlyoccupation/self-employment status improves our predictions of return to work, compared to a modelwithout these factors.
Compared to those returning for other reasons, career-motivated mothers were more likely to return beforesix months. Also, those returning to work for either career or financial reasons were more likely than othersto have returned by nine months (Table 3.3). Compared to other occupations, like sales and craft workers,women in managerial/professional organisations and technical clerical were no more likely to have returnedearly to work. Managerial/professional and technical/clerical were more likely than others to return to workat eight-nine months.
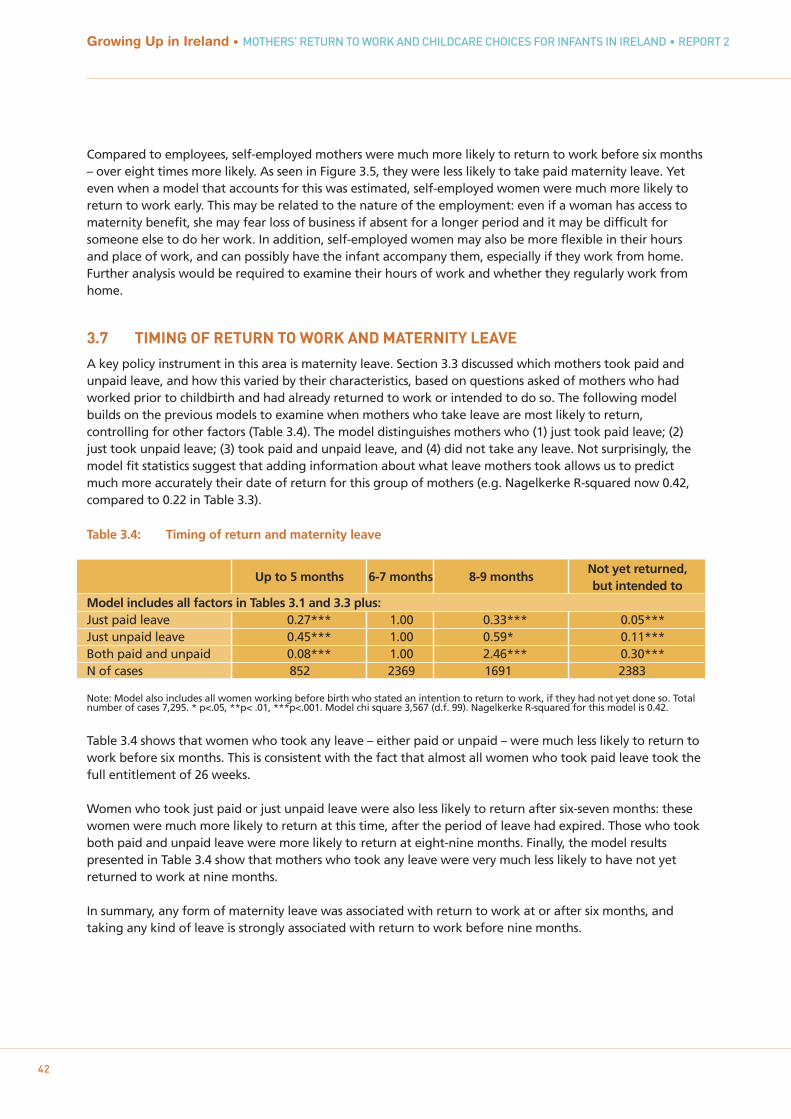
42
Growing Up in Ireland • MOTHERS’ RETURN TO WORK AND CHILDCARE CHOICES FOR INFANTS IN IRELAND • REPORT 2
Compared to employees, self-employed mothers were much more likely to return to work before six months– over eight times more likely. As seen in Figure 3.5, they were less likely to take paid maternity leave. Yeteven when a model that accounts for this was estimated, self-employed women were much more likely toreturn to work early. This may be related to the nature of the employment: even if a woman has access tomaternity benefit, she may fear loss of business if absent for a longer period and it may be difficult forsomeone else to do her work. In addition, self-employed women may also be more flexible in their hoursand place of work, and can possibly have the infant accompany them, especially if they work from home.Further analysis would be required to examine their hours of work and whether they regularly work fromhome.
3.7 TIMING OF RETURN TO WORK AND MATERNITY LEAVE
A key policy instrument in this area is maternity leave. Section 3.3 discussed which mothers took paid andunpaid leave, and how this varied by their characteristics, based on questions asked of mothers who hadworked prior to childbirth and had already returned to work or intended to do so. The following modelbuilds on the previous models to examine when mothers who take leave are most likely to return,controlling for other factors (Table 3.4). The model distinguishes mothers who (1) just took paid leave; (2)just took unpaid leave; (3) took paid and unpaid leave, and (4) did not take any leave. Not surprisingly, themodel fit statistics suggest that adding information about what leave mothers took allows us to predictmuch more accurately their date of return for this group of mothers (e.g. Nagelkerke R-squared now 0.42,compared to 0.22 in Table 3.3).
Table 3.4: Timing of return and maternity leave
Up to 5 months 6-7 months 8-9 monthsNot yet returned, but intended to
Model includes all factors in Tables 3.1 and 3.3 plus:Just paid leave 0.27*** 1.00 0.33*** 0.05***Just unpaid leave 0.45*** 1.00 0.59* 0.11***Both paid and unpaid 0.08*** 1.00 2.46*** 0.30***N of cases 852 2369 1691 2383
Note: Model also includes all women working before birth who stated an intention to return to work, if they had not yet done so. Total number of cases 7,295. * p<.05, **p< .01, ***p<.001. Model chi square 3,567 (d.f. 99). Nagelkerke R-squared for this model is 0.42.
Table 3.4 shows that women who took any leave – either paid or unpaid – were much less likely to return towork before six months. This is consistent with the fact that almost all women who took paid leave took the full entitlement of 26 weeks.
Women who took just paid or just unpaid leave were also less likely to return after six-seven months: thesewomen were much more likely to return at this time, after the period of leave had expired. Those who tookboth paid and unpaid leave were more likely to return at eight-nine months. Finally, the model resultspresented in Table 3.4 show that mothers who took any leave were very much less likely to have not yetreturned to work at nine months.
In summary, any form of maternity leave was associated with return to work at or after six months, andtaking any kind of leave is strongly associated with return to work before nine months.
43
Chapter 3 • MATERNAL CARE AND RETURN TO PAID WORK
3.8 DISCUSSION
The key research question in this chapter was the timing of return to work, and how this was related to thecharacteristics of the mother, the child, the wider family support network, reasons for return to work andmaternity leave. Very few mothers were in paid employment in the first five months after childbirth in thissample – 8% at five months. Four months later, by nine months after birth, around 44% of all mothers werein employment.
Mothers’ characteristics played a major role in understanding their patterns of paid work after childbirth.The small proportion of ‘early returners’, defined here as returning to work earlier than six months, weremore likely to be young mothers and lone mothers, and also white non-Irish mothers. Those who returnedin the eight-nine month period were more likely to be highly educated, older, Irish and mothers living in acouple. Those who had not yet returned tended to be low-educated mothers, either very young or oldermothers, and lone mothers. Highly-educated mothers were more likely to return to work than low-educatedmothers in the period, but this effect was only evident after the end of paid maternity leave.
Child factors in general played a weaker role in when and if a mother had returned to work by the time theinfant was nine months old. Two notable exceptions were the number of siblings an infant had and whethers/he was breastfed. Compared to those who did not breastfeed, mothers who breastfed for three months ormore were more likely to have returned to work later - at either eight-nine months, or even later (that isthey had not returned by nine months). Mothers of three or more children were much more likely to havebeen out of the labour market prior to childbirth and their employment rates at nine months were lowerthan those with one or two children. Temperament and child health seemed to play a minor role in returnto work. In terms of neighbourhood characteristics, having family close by and being in regular contact withgrandparents (in Ireland) was associated with return to work before nine months. Whether this is because ofmore general childrearing support provided by the parents’ wider family or because relatives were regularlycaring for children is explored in more detail in Chapter 5.
A majority of mothers of all levels of education cited financial reasons as the primary motive for returning towork. Compared to those returning for other reasons, career-motivated mothers were more likely to returnto work early (before six months). Also, those returning to work for either career or financial reasons weremore likely than others to have returned by nine months.
A very high proportion of mothers who worked prior to birth took paid maternity leave, and they did so forsix months. The models show that mothers who took paid leave were much less likely to return to workbefore six months than those who did not. Unpaid leave is also associated with the timing of return to work,though take-up of unpaid leave is much lower and unpaid leave is more likely to be taken by (relatively)privileged mothers.
Without a comparison of return to work before and after changes to paid maternity leave, firm conclusionsare not possible, but this evidence, combined with international findings, suggests that paid maternity leaveis a powerful instrument in influencing behaviour of mothers in the immediate period after childbirth. There are many interesting questions remaining about return to work, even in this short period. Givenresearch on the impact on children of high hours of childcare, it would be interesting to investigate whichmothers engage in full-time and part-time work at nine months. Given policy debates about the labourmarket participation of lone mothers in Ireland, further modelling could also investigate which lone mothersreturn to work before the infant is six months old and how age and educational qualifications affect thedecision.

44
Growing Up in Ireland • MOTHERS’ RETURN TO WORK AND CHILDCARE CHOICES FOR INFANTS IN IRELAND • REPORT 2
45
USE AND HOURS OF CHILDCARE
Chapter 4
4.1 INTRODUCTION
Which Irish infants are in non-parental childcare and for how long each week? As illustrated in theconceptual framework shown in Figure 1.1 (Chapter 1), factors influencing the type and quantity of non-parental childcare could include child characteristics, the maternal/family context, and theneighbourhood/local environment. According to previous research, use of non-parental childcare is closelyrelated to mothers’ employment patterns; therefore, estimating models with and without mothers’employment are used to investigate which infants are in childcare, and the importance of mother’semployment in understanding the patterns relative to other factors. The impact of a rural compared to anurban location and the condition of the neighbourhood (in terms of litter, public disorder, etc) are alsoconsidered.
Use of childcare has been found to be related to birth order. For example, Sylva et al. (2007), found that first-borns were more likely to be in care at 10 months old than second or subsequent children. Similarly, in theUS, children in smaller families were more likely to enter childcare between three and five months (NICHDECCRN, 1997). This was presumably linked to the employment of mothers in the first year, which tends to fallas the number of children rises (as found in Chapter 3). Findings on infant gender and temperament wereless clear. Many studies find no effect of gender (e.g. girls were no more likely to be in childcare than boys).On temperament, Sylva et al. (2007) found that infants rated by their mothers as more ‘fussy’ spent morehours in childcare.
Regarding the characteristics of the primary caregiver, studies often find no impact of maternal age (NICHDECCRN, 1997; Sylva et al., 2007), although it might be expected that this would be associated with othervariables such as educational level and the timing of a pregnancy in relation to career trajectories. In termsof ethnicity, the findings were inconsistent, and depend on study samples and national contexts. However,variation in cultural attitudes towards non-parental care may reasonably be expected and again could alsoinfluence the availability of childcare by relatives for non-national families (Sylva et al., 2007).
Other characteristics such as mothers’ education may influence attitudes towards types of non-parental care;mothers who believe employment brings benefits to children were more likely to use non-parental childcare(Greenberger et al., 1988; Sylva et al., 2007). However, education may act more directly as a mediator of thelikelihood of the mother returning to work (see Chapter 3), and the family’s ability to afford non-parentalcare. The presence of a spouse or partner in the home would normally be expected to reduce the need fornon-parental care, but being a lone parent may make it less feasible to afford the levels of childcarenecessary to work outside the home. While some US research found that single-parent families use childcareearlier, in the UK Sylva et al. (2007) found no impact of single motherhood on care choices, after controllingfor family income.
Economic circumstances are often the driving force behind use of childcare, particularly in countries wherechildcare is expensive and costs are a factor. A UK study found that, at three months old, low-incomechildren were more likely to be in childcare, while at 10 months advantaged families used more childcare(maternity benefit at the time of the survey in the UK covered four months) (Sylva et al., 2007). Familyincome is also likely to correlate with mother’s characteristics, such as education, and work status if she has awell-paid job to which she is highly motivated to return.
Studies typically focused less on the environmental context such as neighbourhood conditions and location.Factors likely to be linked to childcare choices outside the immediate family were whether the infant hadextended family living locally, if there was regular contact with grandparents living within the State, andwhether there was centre-based childcare available in the local area.
Growing Up in Ireland • MOTHERS’ RETURN TO WORK AND CHILDCARE CHOICES FOR INFANTS IN IRELAND • REPORT 2
46
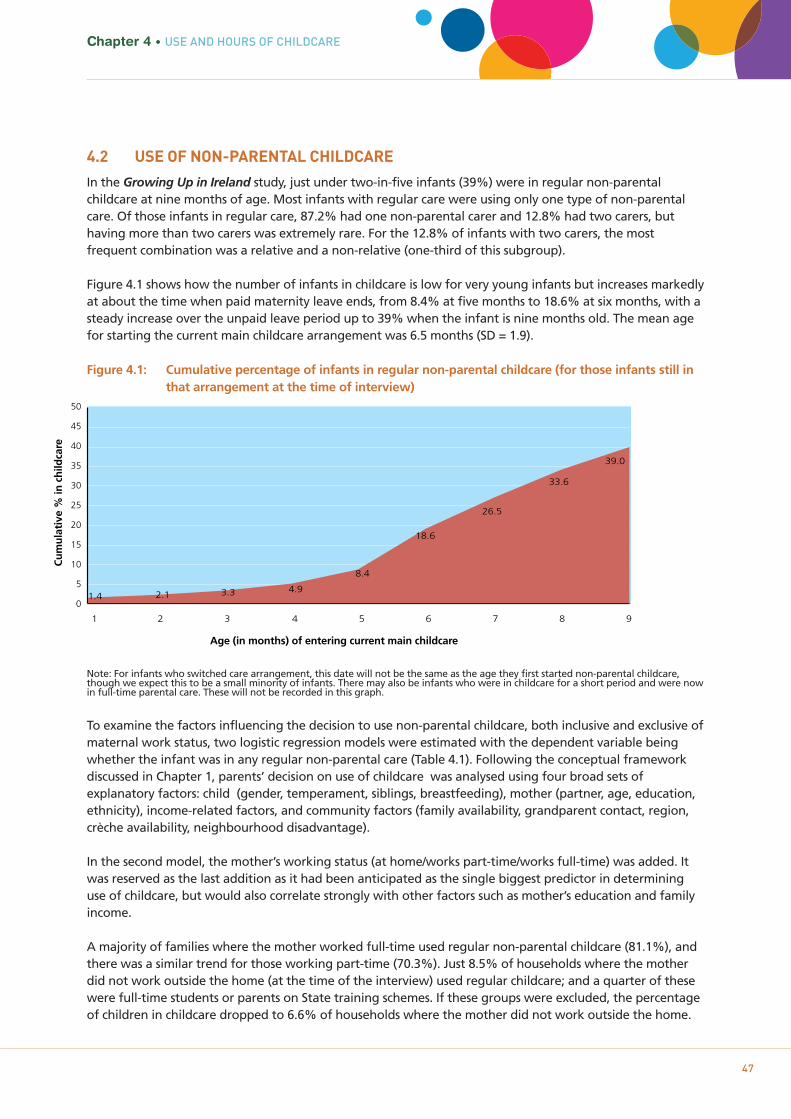
4.2 USE OF NON-PARENTAL CHILDCARE
In the Growing Up in Ireland study, just under two-in-five infants (39%) were in regular non-parentalchildcare at nine months of age. Most infants with regular care were using only one type of non-parentalcare. Of those infants in regular care, 87.2% had one non-parental carer and 12.8% had two carers, buthaving more than two carers was extremely rare. For the 12.8% of infants with two carers, the mostfrequent combination was a relative and a non-relative (one-third of this subgroup).
Figure 4.1 shows how the number of infants in childcare is low for very young infants but increases markedlyat about the time when paid maternity leave ends, from 8.4% at five months to 18.6% at six months, with asteady increase over the unpaid leave period up to 39% when the infant is nine months old. The mean agefor starting the current main childcare arrangement was 6.5 months (SD = 1.9).
Figure 4.1: Cumulative percentage of infants in regular non-parental childcare (for those infants still in that arrangement at the time of interview)
Note: For infants who switched care arrangement, this date will not be the same as the age they first started non-parental childcare, though we expect this to be a small minority of infants. There may also be infants who were in childcare for a short period and were now in full-time parental care. These will not be recorded in this graph.
To examine the factors influencing the decision to use non-parental childcare, both inclusive and exclusive ofmaternal work status, two logistic regression models were estimated with the dependent variable beingwhether the infant was in any regular non-parental care (Table 4.1). Following the conceptual frameworkdiscussed in Chapter 1, parents’ decision on use of childcare was analysed using four broad sets ofexplanatory factors: child (gender, temperament, siblings, breastfeeding), mother (partner, age, education,ethnicity), income-related factors, and community factors (family availability, grandparent contact, region,crèche availability, neighbourhood disadvantage).
In the second model, the mother’s working status (at home/works part-time/works full-time) was added. Itwas reserved as the last addition as it had been anticipated as the single biggest predictor in determininguse of childcare, but would also correlate strongly with other factors such as mother’s education and familyincome.
A majority of families where the mother worked full-time used regular non-parental childcare (81.1%), andthere was a similar trend for those working part-time (70.3%). Just 8.5% of households where the motherdid not work outside the home (at the time of the interview) used regular childcare; and a quarter of thesewere full-time students or parents on State training schemes. If these groups were excluded, the percentageof children in childcare dropped to 6.6% of households where the mother did not work outside the home.
Chapter 4 • USE AND HOURS OF CHILDCARE
47
Cu
mu
lati
ve %
in c
hild
care
Age (in months) of entering current main childcare
0
5
10
15
20
25
30
35
40
45
50
1.4 2.1 3.3 4.9
8.4
18.6
26.5
33.6
39.0
1 2 3 4 5 6 7 8 9
Child factorsOne of the most salient child characteristics is number of siblings. Only-children are more likely to be placedin non-parental care than those with either one sibling (OR=0.88) or multiple siblings (OR=0.74), althoughthe statistical significance for just one extra sibling is reduced to marginal after adjustment for income andwork status. There are a number of possible explanations for this trend. Childcare for multiple children maybecome too expensive relative to wages; stay-at-home mothers may choose to have bigger families and/orhaving three or more children may be more difficult to combine with paid employment in terms of time andenergy, leading to the mother’s decision not to work.
Another salient child factor is whether the infant was breastfed. Even after controlling for mother’scharacteristics and work status, infants who were breastfed for three months or more were less likely to bein non-parental childcare at nine months than those who were never breastfed (Odds Ratio=0.75).Breastfeeding was also associated with later return to work after childbirth (see Chapter 3). The precisemechanism by which this operates was not clear, but it could be that breastfeeding is difficult to combinewith paid work, and/or that longer breastfeeding is associated with particular attitudes regarding maternalwork or parenting values not measured in the survey.
The other child variables included in the model were four dimensions of temperament and the child’sgender. Overall these factors had no or moderate associations with use of non-parental care, although therewere some changes after the inclusion of work status when girls became less likely to be in non-parentalcare than boys (odds ratio decreased from 0.92 in Model 4 to just 0.86). The models suggest that infantsrated by mothers as less adaptable have a slightly lower likelihood of being in non-parental care (andmothers of these infants are less likely to be at work at nine months; see Chapter 3), and that infants ratedas more ‘fussy’ are marginally more likely to be in non-parental care, though the effects are small.
Maternal and neighbourhood factorsIn Table 4.1, the relationships between use of non-parental care and the mother’s characteristics (such aseducation, ethnicity and age) were to a large extent mediated by family income and work status. Thus, forexample, much of the difference in non-parental childcare use between highly educated mothers and low-educated mothers was explained by the fact that highly educated mothers were much more likely to be inpaid employment at nine months (see Chapter 3).
However, even after controlling for work status, infants of mothers with the lowest levels of education werestill less likely to be in non-parental care than infants whose primary caregivers had degree-level education.Comparing non-parental childcare among infants of mothers aged under 25 with those in the 30-35 agegroup, the model indicated that once other factors, particularly work status, were taken into account,younger mothers who worked were actually more likely to use non-parental care for their infants (OR=1.31).However, as a group they were less likely to work full-time and had a lower usage of childcare overall (seealso Chapter 3).
Considering family status, in the bivariate relationship the use of non-parental care was higher amongpartnered mothers (the completely unadjusted odds ratio for the ‘partner’ variable – not shown in Table 4.1– is 1.16). Yet, as seen in Table 4.1, once the model controlled for the low employment rate among singleparents at nine months (see Chapter 3) and their lower average income and education, partnered womenwere actually much less likely to use non-parental childcare for their infants than lone parents (odds ratio is0.34 in model 2).
Growing Up in Ireland • MOTHERS’ RETURN TO WORK AND CHILDCARE CHOICES FOR INFANTS IN IRELAND • REPORT 2
48
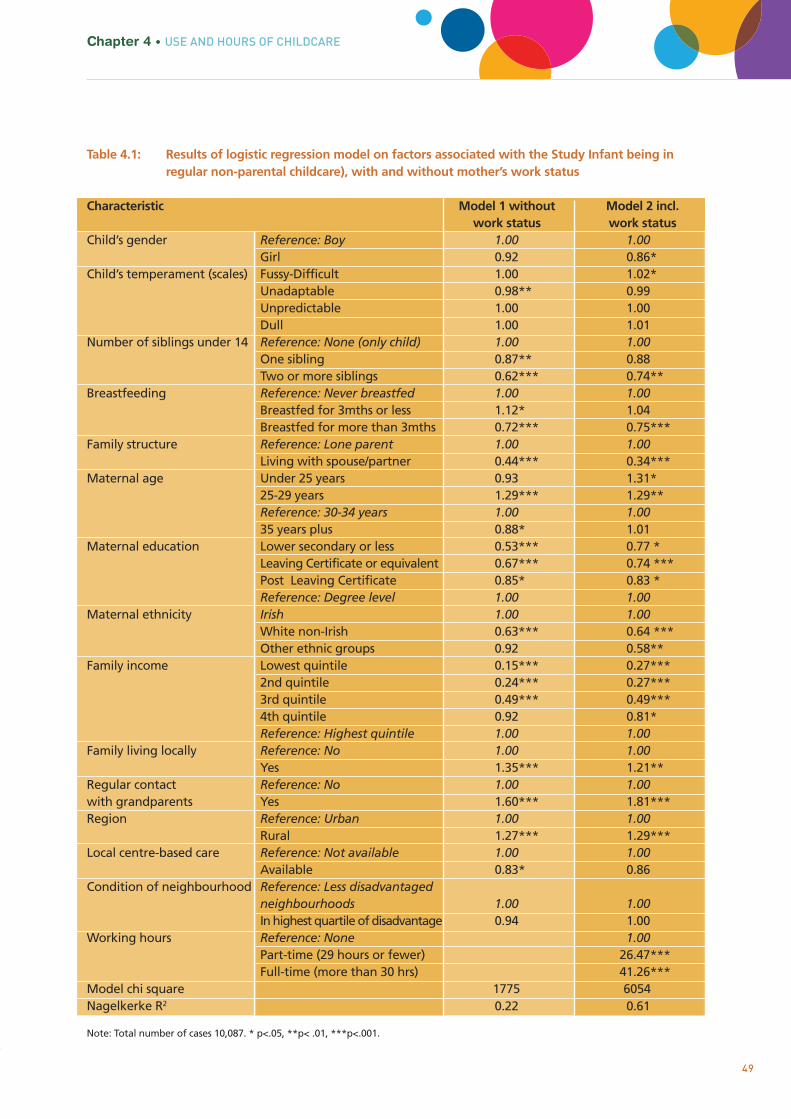
Table 4.1: Results of logistic regression model on factors associated with the Study Infant being in regular non-parental childcare), with and without mother’s work status
Characteristic Model 1 without Model 2 incl. work status work status
Child’s gender Reference: Boy 1.00 1.00Girl 0.92 0.86*
Child’s temperament (scales) Fussy-Difficult 1.00 1.02*Unadaptable 0.98** 0.99Unpredictable 1.00 1.00Dull 1.00 1.01
Number of siblings under 14 Reference: None (only child) 1.00 1.00One sibling 0.87** 0.88Two or more siblings 0.62*** 0.74**
Breastfeeding Reference: Never breastfed 1.00 1.00Breastfed for 3mths or less 1.12* 1.04Breastfed for more than 3mths 0.72*** 0.75***
Family structure Reference: Lone parent 1.00 1.00Living with spouse/partner 0.44*** 0.34***
Maternal age Under 25 years 0.93 1.31*25-29 years 1.29*** 1.29**Reference: 30-34 years 1.00 1.0035 years plus 0.88* 1.01
Maternal education Lower secondary or less 0.53*** 0.77 *Leaving Certificate or equivalent 0.67*** 0.74 ***Post Leaving Certificate 0.85* 0.83 *Reference: Degree level 1.00 1.00
Maternal ethnicity Irish 1.00 1.00White non-Irish 0.63*** 0.64 ***Other ethnic groups 0.92 0.58**
Family income Lowest quintile 0.15*** 0.27***2nd quintile 0.24*** 0.27***3rd quintile 0.49*** 0.49***4th quintile 0.92 0.81*Reference: Highest quintile 1.00 1.00
Family living locally Reference: No 1.00 1.00Yes 1.35*** 1.21**
Regular contact Reference: No 1.00 1.00with grandparents Yes 1.60*** 1.81***Region Reference: Urban 1.00 1.00
Rural 1.27*** 1.29***Local centre-based care Reference: Not available 1.00 1.00
Available 0.83* 0.86Condition of neighbourhood Reference: Less disadvantaged
neighbourhoods 1.00 1.00In highest quartile of disadvantage 0.94 1.00
Working hours Reference: None 1.00Part-time (29 hours or fewer) 26.47***Full-time (more than 30 hrs) 41.26***
Model chi square 1775 6054Nagelkerke R2 0.22 0.61
Note: Total number of cases 10,087. * p<.05, **p< .01, ***p<.001.
Chapter 4 • USE AND HOURS OF CHILDCARE
49
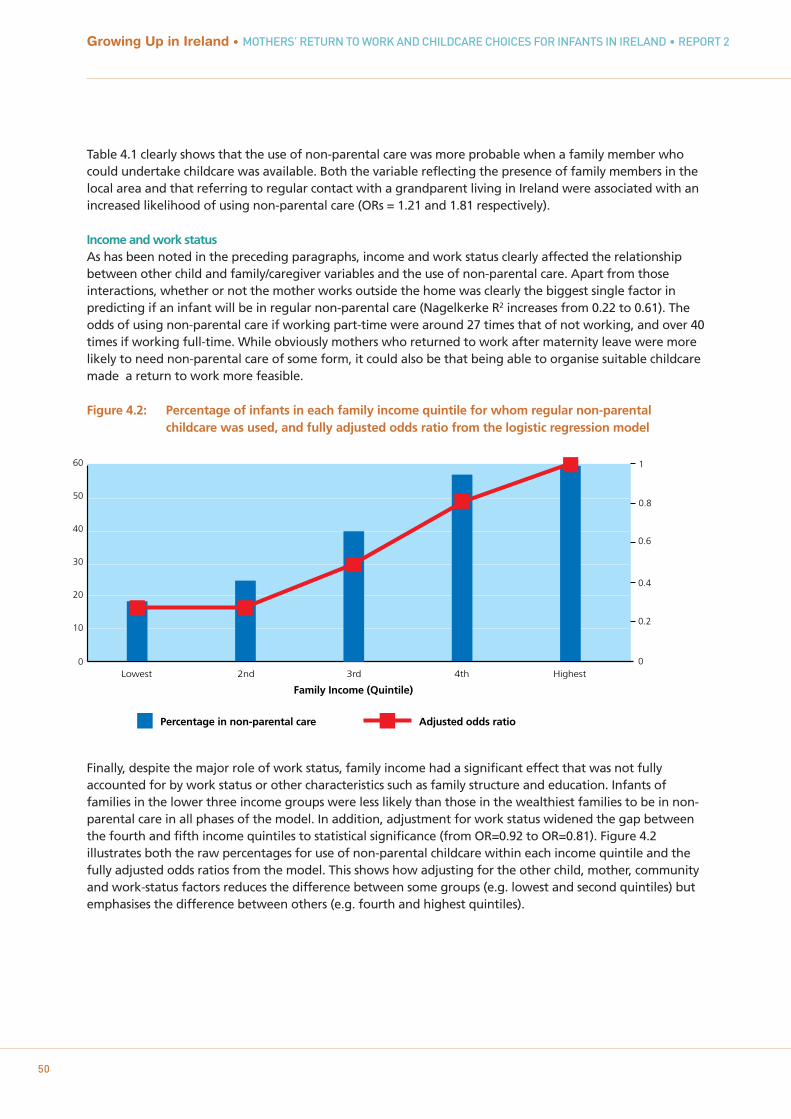
50
Growing Up in Ireland • MOTHERS’ RETURN TO WORK AND CHILDCARE CHOICES FOR INFANTS IN IRELAND • REPORT 2
Table 4.1 clearly shows that the use of non-parental care was more probable when a family member whocould undertake childcare was available. Both the variable reflecting the presence of family members in thelocal area and that referring to regular contact with a grandparent living in Ireland were associated with anincreased likelihood of using non-parental care (ORs = 1.21 and 1.81 respectively).
Income and work statusAs has been noted in the preceding paragraphs, income and work status clearly affected the relationshipbetween other child and family/caregiver variables and the use of non-parental care. Apart from thoseinteractions, whether or not the mother works outside the home was clearly the biggest single factor inpredicting if an infant will be in regular non-parental care (Nagelkerke R2 increases from 0.22 to 0.61). Theodds of using non-parental care if working part-time were around 27 times that of not working, and over 40times if working full-time. While obviously mothers who returned to work after maternity leave were morelikely to need non-parental care of some form, it could also be that being able to organise suitable childcaremade a return to work more feasible.
Figure 4.2: Percentage of infants in each family income quintile for whom regular non-parental childcare was used, and fully adjusted odds ratio from the logistic regression model
Finally, despite the major role of work status, family income had a significant effect that was not fullyaccounted for by work status or other characteristics such as family structure and education. Infants offamilies in the lower three income groups were less likely than those in the wealthiest families to be in non-parental care in all phases of the model. In addition, adjustment for work status widened the gap betweenthe fourth and fifth income quintiles to statistical significance (from OR=0.92 to OR=0.81). Figure 4.2illustrates both the raw percentages for use of non-parental childcare within each income quintile and thefully adjusted odds ratios from the model. This shows how adjusting for the other child, mother, communityand work-status factors reduces the difference between some groups (e.g. lowest and second quintiles) butemphasises the difference between others (e.g. fourth and highest quintiles).
Family Income (Quintile)
Percentage in non-parental care Adjusted odds ratio
0
10
20
30
40
50
0
60
Lowest 2nd 3rd 4th Highest
0.2
0.4
0.6
0.8
1
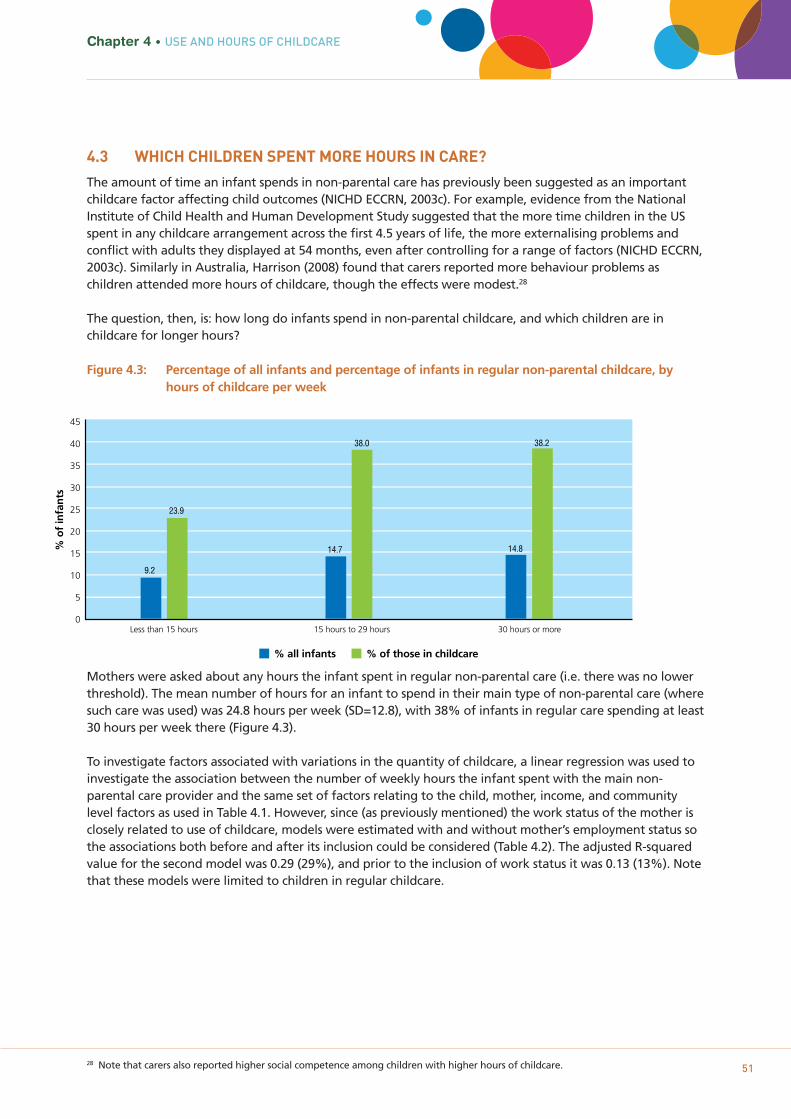
28 Note that carers also reported higher social competence among children with higher hours of childcare. 51
Chapter 4 • USE AND HOURS OF CHILDCARE
4.3 WHICH CHILDREN SPENT MORE HOURS IN CARE?
The amount of time an infant spends in non-parental care has previously been suggested as an importantchildcare factor affecting child outcomes (NICHD ECCRN, 2003c). For example, evidence from the NationalInstitute of Child Health and Human Development Study suggested that the more time children in the USspent in any childcare arrangement across the first 4.5 years of life, the more externalising problems andconflict with adults they displayed at 54 months, even after controlling for a range of factors (NICHD ECCRN,2003c). Similarly in Australia, Harrison (2008) found that carers reported more behaviour problems aschildren attended more hours of childcare, though the effects were modest.28
The question, then, is: how long do infants spend in non-parental childcare, and which children are inchildcare for longer hours?
Figure 4.3: Percentage of all infants and percentage of infants in regular non-parental childcare, by hours of childcare per week
Mothers were asked about any hours the infant spent in regular non-parental care (i.e. there was no lowerthreshold). The mean number of hours for an infant to spend in their main type of non-parental care (wheresuch care was used) was 24.8 hours per week (SD=12.8), with 38% of infants in regular care spending at least30 hours per week there (Figure 4.3).
To investigate factors associated with variations in the quantity of childcare, a linear regression was used toinvestigate the association between the number of weekly hours the infant spent with the main non-parental care provider and the same set of factors relating to the child, mother, income, and communitylevel factors as used in Table 4.1. However, since (as previously mentioned) the work status of the mother isclosely related to use of childcare, models were estimated with and without mother’s employment status sothe associations both before and after its inclusion could be considered (Table 4.2). The adjusted R-squaredvalue for the second model was 0.29 (29%), and prior to the inclusion of work status it was 0.13 (13%). Notethat these models were limited to children in regular childcare.
% o
f in
fan
ts
45
40
35
30
25
20
15
10
5
0
% all infants % of those in childcare
Less than 15 hours 15 hours to 29 hours 30 hours or more
9.2
23.9
14.7 14.8
38.0 38.2
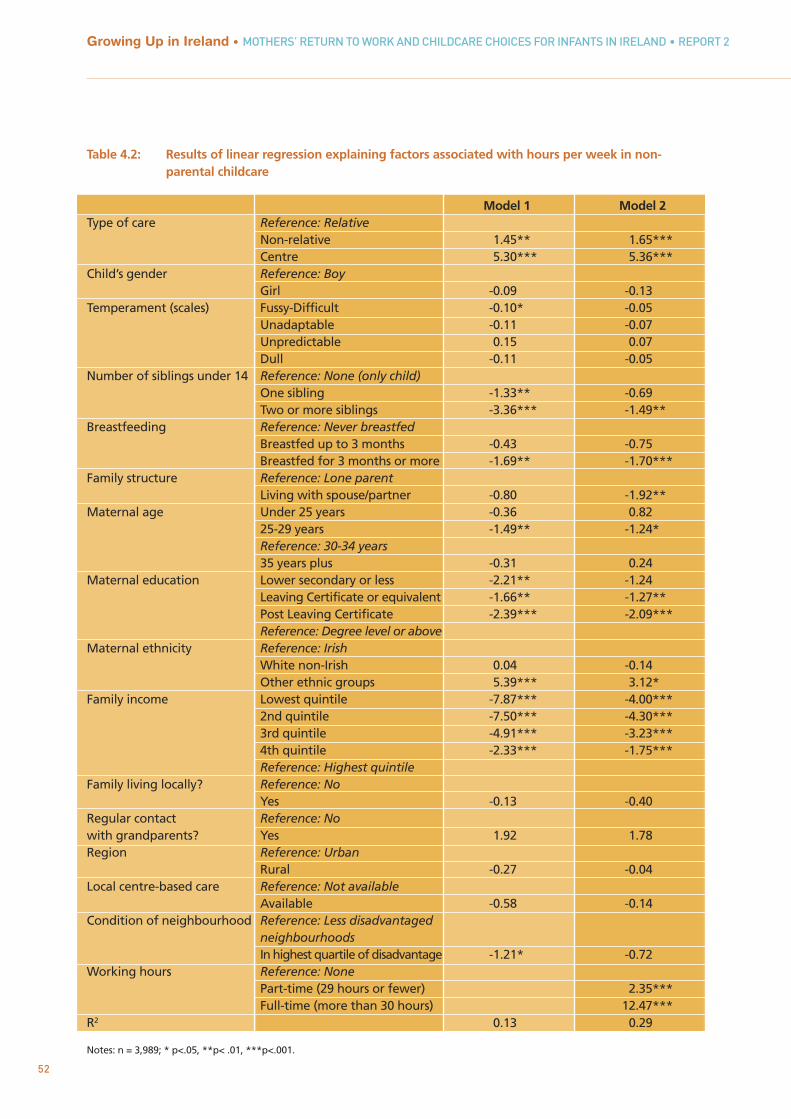
52
Growing Up in Ireland • MOTHERS’ RETURN TO WORK AND CHILDCARE CHOICES FOR INFANTS IN IRELAND • REPORT 2
Table 4.2: Results of linear regression explaining factors associated with hours per week in non-parental childcare
Model 1 Model 2Type of care Reference: Relative
Non-relative 1.45** 1.65***Centre 5.30*** 5.36***
Child’s gender Reference: BoyGirl -0.09 -0.13
Temperament (scales) Fussy-Difficult -0.10* -0.05Unadaptable -0.11 -0.07Unpredictable 0.15 0.07Dull -0.11 -0.05
Number of siblings under 14 Reference: None (only child)One sibling -1.33** -0.69Two or more siblings -3.36*** -1.49**
Breastfeeding Reference: Never breastfedBreastfed up to 3 months -0.43 -0.75Breastfed for 3 months or more -1.69** -1.70***
Family structure Reference: Lone parentLiving with spouse/partner -0.80 -1.92**
Maternal age Under 25 years -0.36 0.8225-29 years -1.49** -1.24*Reference: 30-34 years35 years plus -0.31 0.24
Maternal education Lower secondary or less -2.21** -1.24Leaving Certificate or equivalent -1.66** -1.27**Post Leaving Certificate -2.39*** -2.09***Reference: Degree level or above
Maternal ethnicity Reference: IrishWhite non-Irish 0.04 -0.14Other ethnic groups 5.39*** 3.12*
Family income Lowest quintile -7.87*** -4.00***2nd quintile -7.50*** -4.30***3rd quintile -4.91*** -3.23***4th quintile -2.33*** -1.75***Reference: Highest quintile
Family living locally? Reference: NoYes -0.13 -0.40
Regular contact Reference: Nowith grandparents? Yes 1.92 1.78Region Reference: Urban
Rural -0.27 -0.04Local centre-based care Reference: Not available
Available -0.58 -0.14Condition of neighbourhood Reference: Less disadvantaged
neighbourhoodsIn highest quartile of disadvantage -1.21* -0.72
Working hours Reference: NonePart-time (29 hours or fewer) 2.35***Full-time (more than 30 hours) 12.47***
R2 0.13 0.29
Notes: n = 3,989; * p<.05, **p< .01, ***p<.001.
53
Chapter 4 • USE AND HOURS OF CHILDCARE
Child factorsEven after controlling for a range of factors expected to be associated with time spent in childcare in thesemodels, infants who were looked after in centres, as their main form of non-parental care, spent over fivehours longer per week in that care than did infants in relative care. Infants in mainly non-relative care spentaround 1.5 hours longer on average in care than relative care.
Previous analyses have shown that mothers with one or particularly two other children are less likely to be atwork at nine months (see Figure 3.4) and to use childcare (Table 4.1). In this model, which is confined to justthose infants in some form of regular non-parental care, having two siblings was associated with 1.5 hoursless in the main form of childcare than having no siblings. This may be because mothers with three childrenmay work fewer hours.
Breastfeeding status also showed statistically significant trends in the second, fully adjusted model; infantswho had been breastfed for more than three months spent around 1.7 hours fewer in care per week thanthose who had never been breastfed. The difference between infants who had been breastfed for less thanthree months and those who had never been breastfed was not significant. There were no significantrelationships between hours in care and any of the temperament dimensions in the second model, nor werethere any differences in regard to the child’s gender.
Maternal and neighbourhood factorsIn these models, mothers with the highest level of education used the longest hours of childcare, althoughadjustment for work status diminished the difference between them and the lowest-educated to marginalsignificance (1.2 hours fewer, p=.074), whereas prior to that the difference had been over 2 hours. Mothersfrom other ethnic minorities – albeit less likely overall to have non-parental care available – consistently usedmore hours of non-parental childcare than their Irish peers when they did avail of it – over three hourslonger in the final model. There were no differences between Irish and white non-Irish mothers. Consideringmother’s age, the only group to have significantly different hours to the 30-35 year reference group werethose aged 25-29 years, with 1.2 hours fewer per week in the final model. In terms of family structure, onceincome, education and work status were controlled, infants whose parents were married or cohabitingspent an estimated two hours less in non-parental childcare per week than infants living with a singleparent. Lone parents were much less likely to be working at nine months (see Chapter 3), but when they didso they may have needed to work longer hours, as sole earners. In the second model, none of theneighbourhood factors was significantly associated with duration of weekly childcare hours.
Income and work statusBy far the strongest associations with hours spent in non-parental childcare were maternal work status andincome, in these models. Not surprisingly, infants whose mothers worked full-time outside the home spentmore time in non-parental care per week (nearly 12.5 hours longer) than those whose mothers did not workoutside the home. Working part-time outside the home was also associated with longer time in non-parental care – approaching 2.5 hours longer. This highlights the key role of mother’s working hours inunderstanding an infant’s hours in childcare.
In all models in this chapter, the coefficients for family income highlighted the differences between thewealthiest families and all the others. Even after adjustment for work status, infants from families in thelowest income quintile were spending nearly four hours fewer in non-parental care than those in thehighest quintile; before this adjustment the difference was almost eight hours fewer – effectively a wholeday’s difference.
54
Growing Up in Ireland • MOTHERS’ RETURN TO WORK AND CHILDCARE CHOICES FOR INFANTS IN IRELAND • REPORT 2
4.4 DISCUSSION
The decision on whether or not to use non-parental childcare, and on who will provide it, are importantdecisions for parents and their infants. Previous research and the analyses presented in this chapter indicatethe complex nature of this decision and how many factors both within and external to the family mayinfluence the choices made. As expected, a strong factor associated with the use of non-parental care, andthe hours used per week, was the work status of the mother, with those who work full-time more likely toneed non-parental care and to use it for more hours per week. Family income, which largely determines theaffordability of childcare for parents, was another very significant factor in predicting use and hours of care.The association is related to, but not fully explained by, the work status of the mother. The salience ofincome is not surprising, given the very high costs of paid childcare in Ireland (described earlier in thisreport). Lower-income households are much less likely to use childcare than those with higher familyincomes. Yet previous research has shown that children from lower-income families often benefit more frompre-school care and education than children from higher-income families (NICHD, 2003a).
Of the child-level variables, the most consistently relevant factor was the number of siblings under 14 yearsliving with the infant. It would appear that, where there were a number of young children requiring care, itwas less likely that non-parental care would be used for the infant; and where it was used, for fewer hours.This was particularly noticeable for families where there were more than two young children. Part of theexplanation is that mothers with three or more children were less likely to work at all, and if they did so,were likely to work for fewer hours. Cost is likely to be a factor in both the decision to work and the numberof hours used, due to the high costs of paid childcare for multiple pre-school children. The child’s owntemperament was not a strong predictor of use of care.
Breastfeeding for three months or more had a significant association with use and extent of non-parentalchildcare. These mothers were less likely to use non-parental childcare, and when they did, for fewer hours,even after controlling for potentially confounding variables such as education, age and ethnicity.
In terms of education, infants whose mothers had a university degree were more likely to be in childcareand for longer hours, even accounting for work status; these mothers were also more likely to be working atnine months. The most important neighbourhood characteristic associated with use of care was thepotential availability of relatives to provide childcare, measured by family living locally and regular contactwith grandparents living in Ireland.

55
Chapter 5CHILDCARE SETTINGS AND
CHILDCARE CHOICE
5.1 INTRODUCTION
Much of the research on childcare is concerned with centre-based care, particularly in the US. However,previous Irish research has found high levels of relative care of infants, as well as non-relative home-basedcare (CSO, 2009). Sylva et al. (2007) argued that research on early childcare needs to take account of thevariation and complexity of childcare arrangements. This chapter takes a first step towards unpacking thatcomplexity by examining different types of care for infants in Ireland.
First, how many children are in each care type, how do these settings differ in terms of cost and how doparents feel about the arrangements? The chapter explores differences in the settings that may be relatedto the quality of that care: the number of adults and children in each, one-to-one interaction with the carer,time spent on activities, and other facilities available.
Second, which infants were in which type of child care? Following Figure 1.1, the type and quantity of non-parental childcare were analysed in relation to factors linked to the child, the maternal/family context, theneighbourhood/local environment, and the mother’s employment status. Previous research has found thatchildcare is related to birth order, with second and subsequent children more likely to be in relative orhome-based care than first-borns (Johanson et al., 1996). Typically, research has found no link betweentemperament and type of childcare (Melhuish et al., 1991), or childcare and gender (Sylva et al., 2007).
Economic circumstances often play a key role in a family’s use of childcare, particularly in the US and the UK,where childcare is expensive. More advantaged/higher-income families tend to use non-familial childcare,with disadvantaged families using care by relatives (Sylva et al., 2007). Studies typically focus less on theenvironmental context (such as neighbourhood conditions and location). Two factors likely to be linked tochildcare choices are whether the infant has extended family living locally, and whether there is centre-based childcare available in the local area. Grandparental contact is also considered.
Mothers’ beliefs about maternity leave, employment and childcare may also influence the choice of type.Some studies have found that parents who rate learning highly in childcare may be more likely to choosecentre-based care, and those who value a ‘home-from-home’ more likely to choose a home-based setting(Pungello and Kurtz Costes, 1999). Of course this issue is complex to investigate; Pungello and Kurtz Costeshighlight that maternal belief and childcare behaviours are bidirectional, in that attitudes influencebehaviour and current behaviour or situation influences attitudes. Growing Up in Ireland did not collectdata on beliefs about employment and childcare, though satisfaction with childcare is examined briefly.
5.2 CHILDCARE SETTINGS – USE, COST AND CONTEXT
When parents select a particular type of childcare for their infant, they may find themselves jugglingaspirations with practical constraints such as cost, convenience and availability. In some families, childcaremay be required for other children in addition to the Study Infant; arrangements may thus have to beadapted to provide the best fit for everybody’s needs. Data from the Quarterly National Household Survey(e.g. 2009) indicated that childcare by relatives was the most common within the Irish population. There areseveral possible reasons for its popularity, including that parents may place more trust in their own relatives,particularly their own parents (i.e. the child’s grandparents) and prefer a home-based setting, particularly forinfants, that is similar to their own home, perhaps quieter, and where they may be less likely to pick upcommon childhood infections from other children, but there are several practical benefits as well. Care byrelatives is usually cheaper (or free) than professional childcare and is likely to be more flexible in terms oftimes a child can be left or collected. However, relative care may not be available to everyone; familymembers may not live close enough or be able or willing to provide the amount or regularity of carerequired. Alternatively, some parents may have a preference for a particular childminder who already looks
Growing Up in Ireland • MOTHERS’ RETURN TO WORK AND CHILDCARE CHOICES FOR INFANTS IN IRELAND • REPORT 2
56
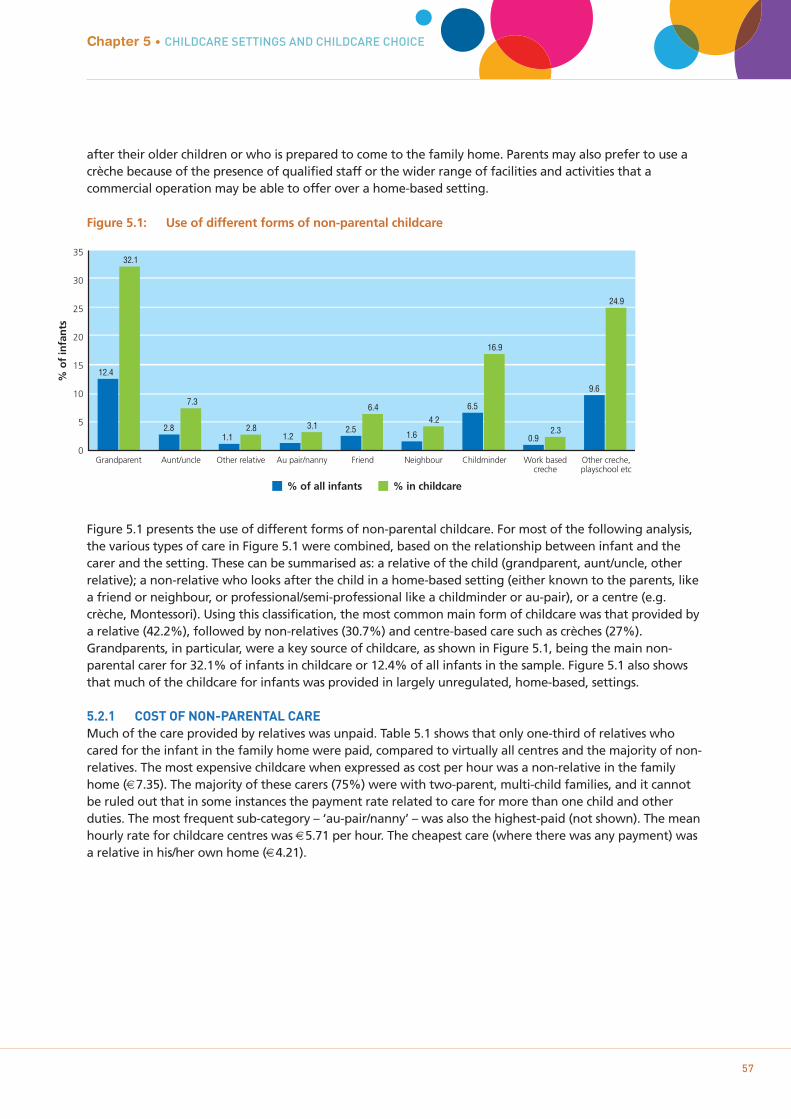
57
after their older children or who is prepared to come to the family home. Parents may also prefer to use acrèche because of the presence of qualified staff or the wider range of facilities and activities that acommercial operation may be able to offer over a home-based setting.
Figure 5.1: Use of different forms of non-parental childcare
Figure 5.1 presents the use of different forms of non-parental childcare. For most of the following analysis,the various types of care in Figure 5.1 were combined, based on the relationship between infant and thecarer and the setting. These can be summarised as: a relative of the child (grandparent, aunt/uncle, otherrelative); a non-relative who looks after the child in a home-based setting (either known to the parents, likea friend or neighbour, or professional/semi-professional like a childminder or au-pair), or a centre (e.g.crèche, Montessori). Using this classification, the most common main form of childcare was that provided bya relative (42.2%), followed by non-relatives (30.7%) and centre-based care such as crèches (27%).Grandparents, in particular, were a key source of childcare, as shown in Figure 5.1, being the main non-parental carer for 32.1% of infants in childcare or 12.4% of all infants in the sample. Figure 5.1 also showsthat much of the childcare for infants was provided in largely unregulated, home-based, settings.
5.2.1 COST OF NON-PARENTAL CAREMuch of the care provided by relatives was unpaid. Table 5.1 shows that only one-third of relatives whocared for the infant in the family home were paid, compared to virtually all centres and the majority of non-relatives. The most expensive childcare when expressed as cost per hour was a non-relative in the familyhome (€7.35). The majority of these carers (75%) were with two-parent, multi-child families, and it cannotbe ruled out that in some instances the payment rate related to care for more than one child and otherduties. The most frequent sub-category – ‘au-pair/nanny’ – was also the highest-paid (not shown). The meanhourly rate for childcare centres was €5.71 per hour. The cheapest care (where there was any payment) wasa relative in his/her own home (€4.21).
Chapter 5 • CHILDCARE SETTINGS AND CHILDCARE CHOICE
% o
f in
fan
ts
35
30
25
20
15
10
5
0
% of all infants % in childcare
12.4
32.1
Grandparent
2.8
7.3
Aunt/uncle
1.12.8
Other relative
1.23.1
Au pair/nanny
2.5
6.4
Friend
1.6
4.2
Neighbour
6.5
16.9
Childminder
0.92.3
Work basedcreche
9.6
24.9
Other creche,playschool etc
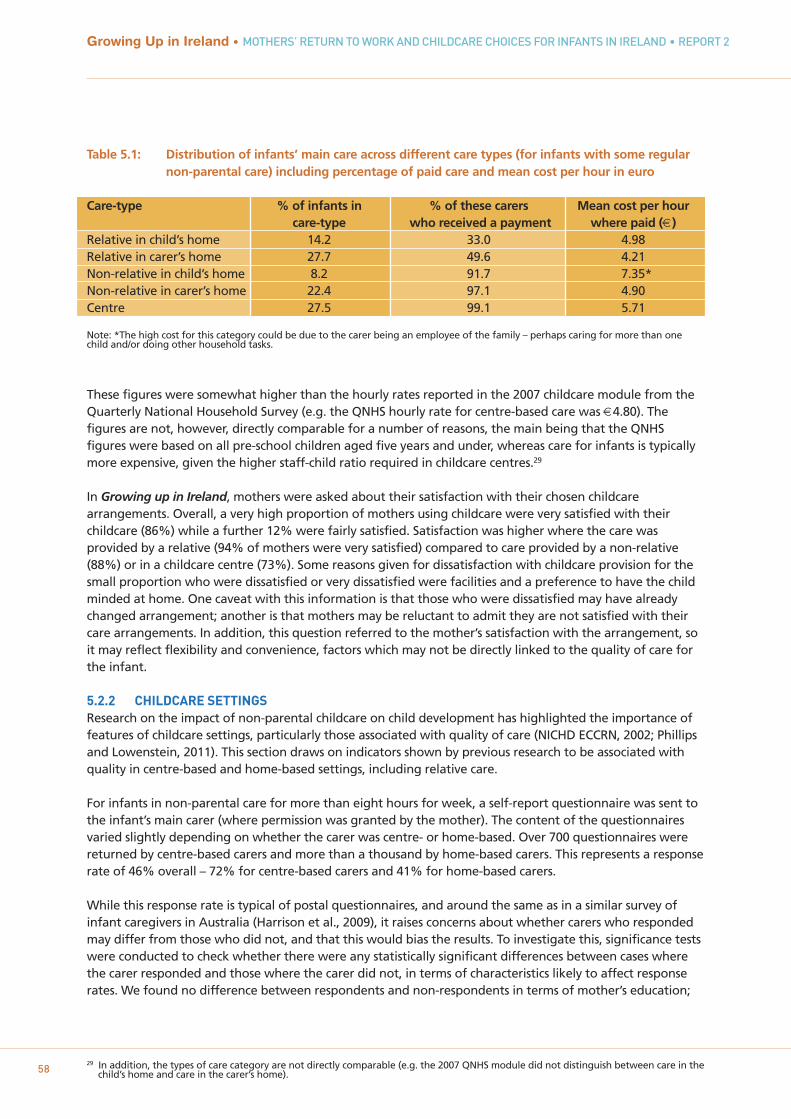
29 In addition, the types of care category are not directly comparable (e.g. the 2007 QNHS module did not distinguish between care in thechild’s home and care in the carer’s home).58
Growing Up in Ireland • MOTHERS’ RETURN TO WORK AND CHILDCARE CHOICES FOR INFANTS IN IRELAND • REPORT 2
Table 5.1: Distribution of infants’ main care across different care types (for infants with some regular non-parental care) including percentage of paid care and mean cost per hour in euro
Care-type % of infants in % of these carers Mean cost per hour care-type who received a payment where paid (€)
Relative in child’s home 14.2 33.0 4.98Relative in carer’s home 27.7 49.6 4.21Non-relative in child’s home 8.2 91.7 7.35*Non-relative in carer’s home 22.4 97.1 4.90Centre 27.5 99.1 5.71
Note: *The high cost for this category could be due to the carer being an employee of the family – perhaps caring for more than one child and/or doing other household tasks.
These figures were somewhat higher than the hourly rates reported in the 2007 childcare module from theQuarterly National Household Survey (e.g. the QNHS hourly rate for centre-based care was €4.80). Thefigures are not, however, directly comparable for a number of reasons, the main being that the QNHSfigures were based on all pre-school children aged five years and under, whereas care for infants is typically more expensive, given the higher staff-child ratio required in childcare centres.29
In Growing up in Ireland, mothers were asked about their satisfaction with their chosen childcarearrangements. Overall, a very high proportion of mothers using childcare were very satisfied with theirchildcare (86%) while a further 12% were fairly satisfied. Satisfaction was higher where the care wasprovided by a relative (94% of mothers were very satisfied) compared to care provided by a non-relative(88%) or in a childcare centre (73%). Some reasons given for dissatisfaction with childcare provision for thesmall proportion who were dissatisfied or very dissatisfied were facilities and a preference to have the childminded at home. One caveat with this information is that those who were dissatisfied may have alreadychanged arrangement; another is that mothers may be reluctant to admit they are not satisfied with theircare arrangements. In addition, this question referred to the mother’s satisfaction with the arrangement, soit may reflect flexibility and convenience, factors which may not be directly linked to the quality of care forthe infant.
5.2.2 CHILDCARE SETTINGS Research on the impact of non-parental childcare on child development has highlighted the importance offeatures of childcare settings, particularly those associated with quality of care (NICHD ECCRN, 2002; Phillipsand Lowenstein, 2011). This section draws on indicators shown by previous research to be associated withquality in centre-based and home-based settings, including relative care.
For infants in non-parental care for more than eight hours for week, a self-report questionnaire was sent tothe infant’s main carer (where permission was granted by the mother). The content of the questionnairesvaried slightly depending on whether the carer was centre- or home-based. Over 700 questionnaires werereturned by centre-based carers and more than a thousand by home-based carers. This represents a responserate of 46% overall – 72% for centre-based carers and 41% for home-based carers.
While this response rate is typical of postal questionnaires, and around the same as in a similar survey ofinfant caregivers in Australia (Harrison et al., 2009), it raises concerns about whether carers who respondedmay differ from those who did not, and that this would bias the results. To investigate this, significance testswere conducted to check whether there were any statistically significant differences between cases wherethe carer responded and those where the carer did not, in terms of characteristics likely to affect responserates. We found no difference between respondents and non-respondents in terms of mother’s education;
30 Centre-based care: Infants whose carers did not respond were somewhat more likely to have a mother who was not ethnically Irish(14%) than infants whose carers did (10%). They were more likely to have a parent who was less satisfied with the childcarearrangement (67% very satisfied among carers who did not respond, 73% very satisfied among carers who did). Home-based care:Infants whose carers did not respond were more likely to have a mother who was not ethnically Irish (12%) than infants whose carerdid respond (8%) and a mother who was of non-Irish nationality (11% v 7.5%).
31 Centre-based carers were asked to report the total number of children in the centre and the total number of childcare staff (in whole-time equivalents) who look after them.
32 Some 4 year olds are not at school, so the true figure for the proportion of non-relative carers with 3 or fewer preschoolers is likely tobe somewhat lower than this. 4 year olds are grouped with 6 year olds in this data on ages of children being cared for, so a precisepreschool/afterschool breakdown is not possible.
33 ‘Do you have any specific qualification in childcare excluding your experience of raising your own children?’34 See http://www.earlychildhoodireland.ie/childcare-training-and-childcare-education/accredited-childcare-training/ for more details.
Note that the FETAC qualifications are modular, and it is possible for carers to report having FETAC 4, 5, 6 while only having completedsome of the required modules, which would lead to a slight overestimate of this qualification.
59
Chapter 5 • CHILDCARE SETTINGS AND CHILDCARE CHOICE
whether she worked full-time, part-time or not at all; family income quintile, mother’s nationality (centre-based carers), household type (number of parents and children); social class, and mothers’ satisfaction withchildcare arrangement (home-based carers). Carers of infants whose mother was of minority ethnicity weresomewhat less likely to respond (both home-based and centre-based carers); home-based carers of infants ofnon-Irish nationality were less likely to respond; and centre-based carers of infants whose parents were notsatisfied with the care arrangement were somewhat less likely to respond.30 Overall though, the householdcharacteristics of respondents and non-respondents are very similar.
The information supplied by responding carers supplemented that which had already been provided by themother. Data were collected on:
1. Structural features – number of children and adults, and staff characteristics such as qualifications and experience
2. Practice features – one-to-one interaction, time spent watching TV, time spent sleeping3. Provision of resources – availability of materials and equipment to support children’s play and
learning, such as developmentally appropriate toys and books
In terms of group size, infants in home-based care were typically either on their own or with just one or twoother children. As might be expected, groups in centres were larger, with a mean of nearly 50 children intotal in the centre, according to centre respondents, though a median of 40 (that is, half of centres had 40children or fewer). In around half of the centres, there were just four other infants under a year old.Typically the majority of other children in the centres were aged one to three years.
Regarding staff-child ratios, the average number of children (including the Study Infant) for each staffmember in centres was between four and five, but the ratio for the infant section (if there were multipleages in the centre) may well have been lower.31 If it is assumed that there was one carer in all home-basedcare situations, the average number of children cared for by relatives was two; the average number for non-relatives was three. Notably, over 60% of non-relative carers cared for three children or fewer. Childmindersare exempt from notification if they are caring for three or fewer preschool children; 87% of non-relativecarers cared for three children or fewer aged three and under.32 Given that the majority of these arechildminders, this suggests that a sizeable proportion of childminders were exempt from notifying the HSEand therefore unregulated. Group sizes and ratios certainly tend to be lower for home-based care,particularly care by relatives.
Figure 5.2 presents the qualifications of carers in childcare33 reported by carers, distinguishing relative andnon-relative home-based carers, and centre-based carers according to whether the respondent was thedirector (one-third of centre-based respondents) or another employee (the remaining two-thirds).Qualifications are grouped into the following categories: no formal childcare qualification; FETAC level 4, 5and 6; HETAC or third-level qualification; a childcare award from outside Ireland, and other related courses(teaching, nursing).34
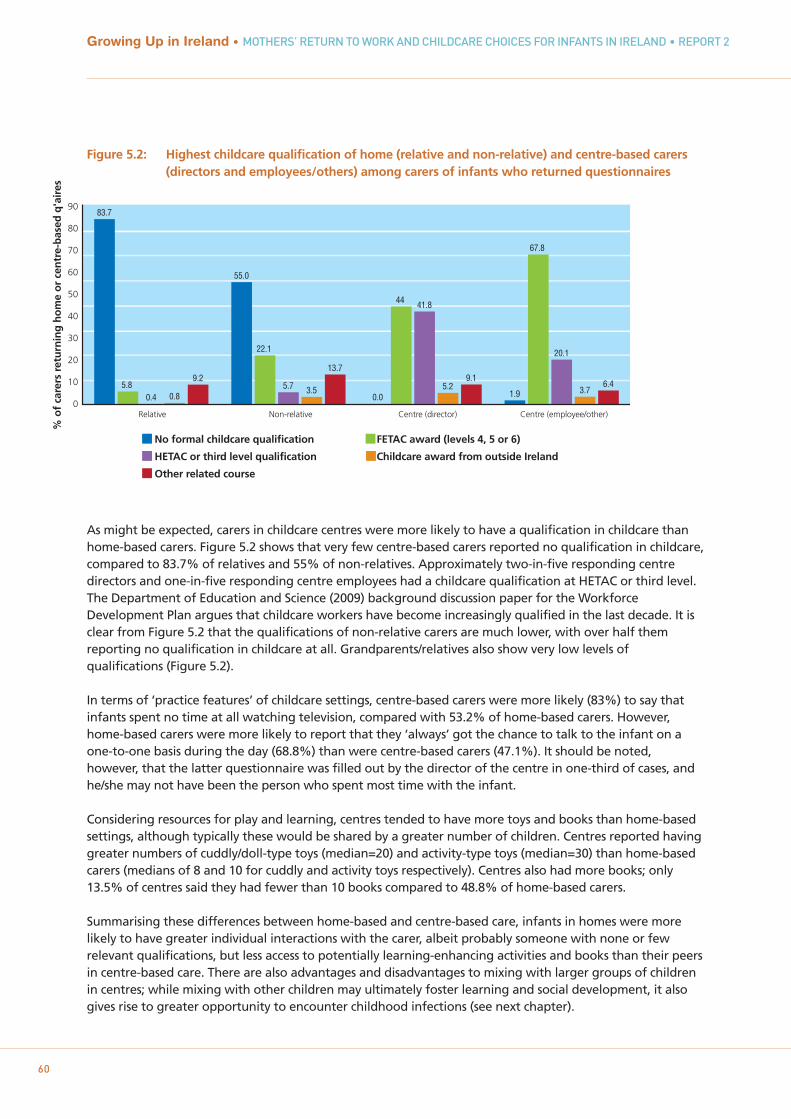
60
Growing Up in Ireland • MOTHERS’ RETURN TO WORK AND CHILDCARE CHOICES FOR INFANTS IN IRELAND • REPORT 2
Figure 5.2: Highest childcare qualification of home (relative and non-relative) and centre-based carers (directors and employees/others) among carers of infants who returned questionnaires
As might be expected, carers in childcare centres were more likely to have a qualification in childcare thanhome-based carers. Figure 5.2 shows that very few centre-based carers reported no qualification in childcare,compared to 83.7% of relatives and 55% of non-relatives. Approximately two-in-five responding centredirectors and one-in-five responding centre employees had a childcare qualification at HETAC or third level.The Department of Education and Science (2009) background discussion paper for the WorkforceDevelopment Plan argues that childcare workers have become increasingly qualified in the last decade. It isclear from Figure 5.2 that the qualifications of non-relative carers are much lower, with over half themreporting no qualification in childcare at all. Grandparents/relatives also show very low levels ofqualifications (Figure 5.2).
In terms of ‘practice features’ of childcare settings, centre-based carers were more likely (83%) to say thatinfants spent no time at all watching television, compared with 53.2% of home-based carers. However,home-based carers were more likely to report that they ‘always’ got the chance to talk to the infant on aone-to-one basis during the day (68.8%) than were centre-based carers (47.1%). It should be noted,however, that the latter questionnaire was filled out by the director of the centre in one-third of cases, andhe/she may not have been the person who spent most time with the infant.
Considering resources for play and learning, centres tended to have more toys and books than home-basedsettings, although typically these would be shared by a greater number of children. Centres reported havinggreater numbers of cuddly/doll-type toys (median=20) and activity-type toys (median=30) than home-basedcarers (medians of 8 and 10 for cuddly and activity toys respectively). Centres also had more books; only13.5% of centres said they had fewer than 10 books compared to 48.8% of home-based carers.
Summarising these differences between home-based and centre-based care, infants in homes were morelikely to have greater individual interactions with the carer, albeit probably someone with none or fewrelevant qualifications, but less access to potentially learning-enhancing activities and books than their peersin centre-based care. There are also advantages and disadvantages to mixing with larger groups of childrenin centres; while mixing with other children may ultimately foster learning and social development, it alsogives rise to greater opportunity to encounter childhood infections (see next chapter).
Relative Non-relative Centre (director) Centre (employee/other)
90
80
70
60
50
40
30
20
10
0
% o
f ca
rers
ret
urn
ing
ho
me
or
cen
tre-
bas
ed q
'air
es
83.7
5.80.4 0.8
9.2
55.0
22.1
5.7 3.5
13.7
0.0
44 41.8
5.29.1
1.9
67.8
20.1
3.76.4
No formal childcare qualification FETAC award (levels 4, 5 or 6)
HETAC or third level qualification Childcare award from outside Ireland
Other related course
35 Note that this effectively means that the choice between non-relative care and centre-based care is not directly addressed. 61
5.3 FACTORS ASSOCIATED WITH CHOICE OF CHILDCARE
This section investigates which factors are associated with childcare choice for infants at nine months of age. Amultinomial regression model is used, following the strategy employed by Sylva et al. (2007); the focus islimited to those children who had regular non-parental care at the time of the interview. As care by relativeswas the most common (42.2%), this was used as the reference group such that the model effectively asks twoquestions: why might non-relative care be used instead of relative care, and, separately, why centre-based careinstead of relatives?35 Broadly the same potential factors were considered as in the previous chapterexamining use of any type of non-parental care: child (gender, temperament, siblings, breastfeeding), mother(partner, age, education, ethnicity), income, community (family availability, grandparent contact, region, crècheavailability, neighbourhood disadvantage). Table 5.2 provides the results of the multinomial regression whenall variables are included in the model (n=4012).
Child factorsAs with use of any childcare, number of siblings was a key child factor to emerge in choice of main childcaretype. Parents of infants with one sibling were more likely than parents of only-children to choose either non-relative care (OR=1.38) or centre-based care (OR=1.34) over relative care. Families with three or more children(including the Study Child) were twice as likely to choose non-relative over relative care (OR=2.25) compared toone-child families, but did not differ when it came to choosing centre-based care instead of care by relatives(OR=1.11). Again, however, it is difficult to determine whether these reflect ‘unconstrained’ choices or whetherrelatives, particularly older grandparents, are more reluctant to take on caring for several children or olderchildren.
Breastfeeding duration was also significantly associated with choosing an alternative to relative care. Bothlevels of breastfeeding (up to three months and three months plus) were associated with an increasedlikelihood (around 50%) of using either non-relative or centre-based care instead of relative care, whencompared to infants of mothers who never breastfed. The explanation underlying this pattern is unclear, but itpersists despite adjustment for other potentially confounding socio-demographic variables such as mother’sage and education level. It may be related to attitudes to child-rearing that favour breastfeeding andprofessional care. These were not measured in the survey.
Infant temperament appeared to play somewhat more of a role in choice of childcare type than in use ofchildcare per se. Infants rated as more ‘unadaptable’ were less likely to be placed in either non-relative (OR=0.97) or centre-based care (OR=0.96) in preference to relative care as the main care type. However, ‘fussier’infants were somewhat more likely to be placed in either of these types of care (OR=1.02 for both, but notstatistically significant for the latter), and infants who were rated as more ‘dull’ (i.e. more subdued, less active)were more likely to be in either non-relative (OR=1.04) or centre-based care (OR=1.07) than relative care. Theinfant’s gender was not associated with choice of care.
Maternal factorsThe choice of both non-relative and centre-based care over relative care was strongly associated with the ageof the mother, with those under 25 years only about half as likely to choose either of these alternativescompared to mothers in the 30-35 year age group. In contrast, mothers aged over 35 years were 50% morelikely to choose non-relative or centre-based care over relative care than the slightly younger reference group.
Choosing non-relative care had an association with the educational level of the mother such that those withlower than degree-level education were less likely to take this option. Interestingly, however, mothers with thelowest level of education did not differ significantly in their likelihood of opting for centre-based care(OR=0.83) compared to degree-level mothers in the reference group, although both upper-secondary and post-Leaving Certificate did have lower odds (OR=0.54 and 0.79 respectively). Possibly this reflects the availability ofsubsidised or community-run centre-based care for the more disadvantaged groups (see Chapter 2), as well asthe more advantaged group being better placed to pay for professional childcare.
Chapter 5 • CHILDCARE SETTINGS AND CHILDCARE CHOICE
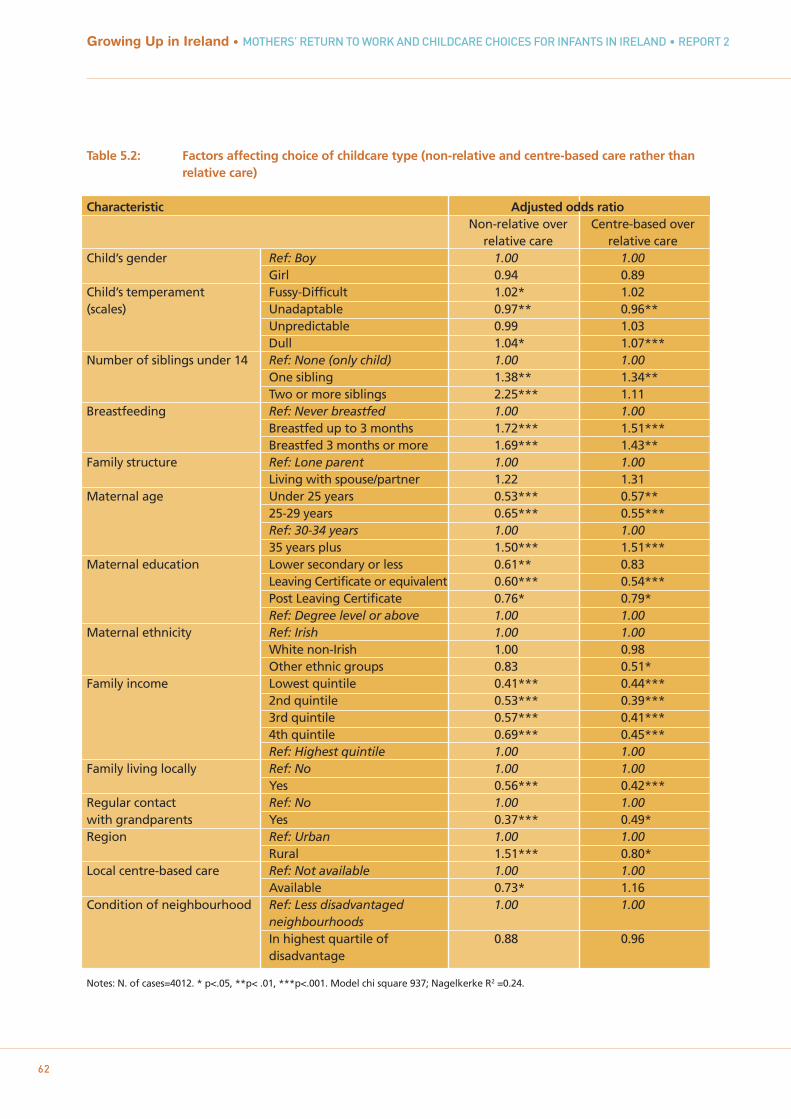
Table 5.2: Factors affecting choice of childcare type (non-relative and centre-based care rather than relative care)
Characteristic Adjusted odds ratioNon-relative over Centre-based over
relative care relative careChild’s gender Ref: Boy 1.00 1.00
Girl 0.94 0.89Child’s temperament Fussy-Difficult 1.02* 1.02(scales) Unadaptable 0.97** 0.96**
Unpredictable 0.99 1.03Dull 1.04* 1.07***
Number of siblings under 14 Ref: None (only child) 1.00 1.00One sibling 1.38** 1.34**Two or more siblings 2.25*** 1.11
Breastfeeding Ref: Never breastfed 1.00 1.00Breastfed up to 3 months 1.72*** 1.51***Breastfed 3 months or more 1.69*** 1.43**
Family structure Ref: Lone parent 1.00 1.00Living with spouse/partner 1.22 1.31
Maternal age Under 25 years 0.53*** 0.57**25-29 years 0.65*** 0.55***Ref: 30-34 years 1.00 1.0035 years plus 1.50*** 1.51***
Maternal education Lower secondary or less 0.61** 0.83Leaving Certificate or equivalent 0.60*** 0.54***Post Leaving Certificate 0.76* 0.79*Ref: Degree level or above 1.00 1.00
Maternal ethnicity Ref: Irish 1.00 1.00White non-Irish 1.00 0.98Other ethnic groups 0.83 0.51*
Family income Lowest quintile 0.41*** 0.44***2nd quintile 0.53*** 0.39***3rd quintile 0.57*** 0.41***4th quintile 0.69*** 0.45***Ref: Highest quintile 1.00 1.00
Family living locally Ref: No 1.00 1.00Yes 0.56*** 0.42***
Regular contact Ref: No 1.00 1.00with grandparents Yes 0.37*** 0.49*Region Ref: Urban 1.00 1.00
Rural 1.51*** 0.80*Local centre-based care Ref: Not available 1.00 1.00
Available 0.73* 1.16Condition of neighbourhood Ref: Less disadvantaged 1.00 1.00
neighbourhoodsIn highest quartile of 0.88 0.96disadvantage
Notes: N. of cases=4012. * p<.05, **p< .01, ***p<.001. Model chi square 937; Nagelkerke R2 =0.24.
Growing Up in Ireland • MOTHERS’ RETURN TO WORK AND CHILDCARE CHOICES FOR INFANTS IN IRELAND • REPORT 2
62
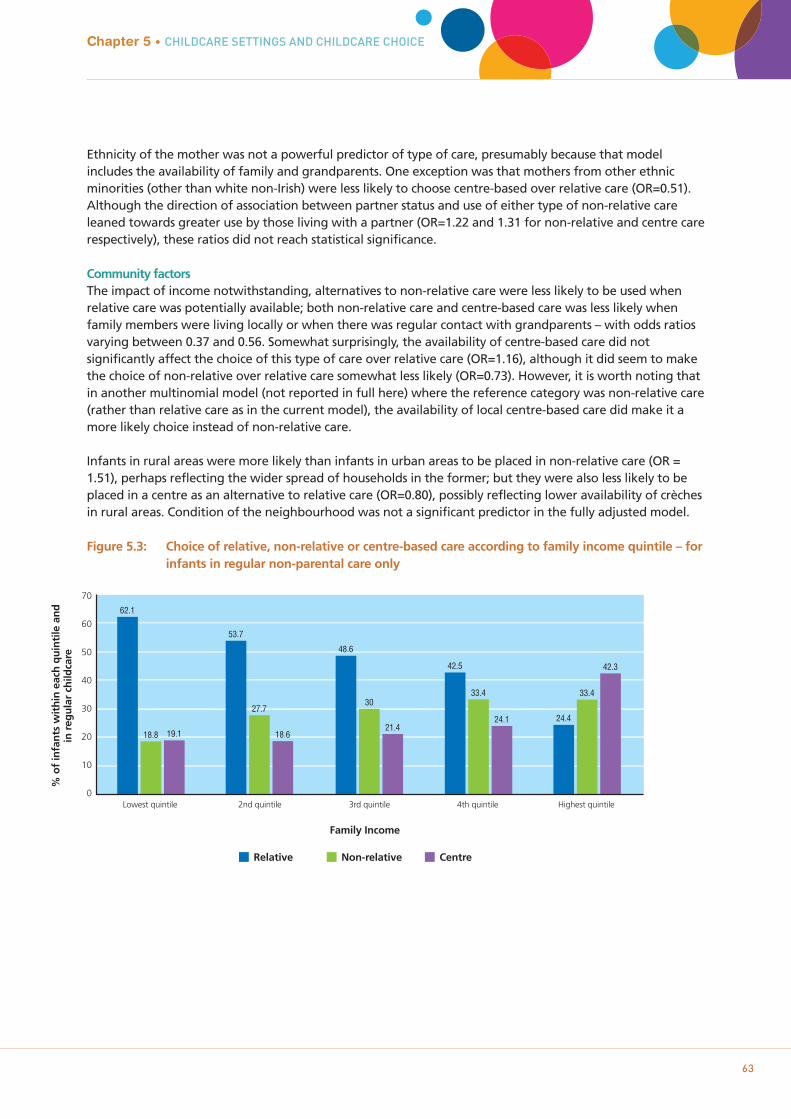
Ethnicity of the mother was not a powerful predictor of type of care, presumably because that modelincludes the availability of family and grandparents. One exception was that mothers from other ethnicminorities (other than white non-Irish) were less likely to choose centre-based over relative care (OR=0.51).Although the direction of association between partner status and use of either type of non-relative careleaned towards greater use by those living with a partner (OR=1.22 and 1.31 for non-relative and centre carerespectively), these ratios did not reach statistical significance.
Community factorsThe impact of income notwithstanding, alternatives to non-relative care were less likely to be used whenrelative care was potentially available; both non-relative care and centre-based care was less likely whenfamily members were living locally or when there was regular contact with grandparents – with odds ratiosvarying between 0.37 and 0.56. Somewhat surprisingly, the availability of centre-based care did notsignificantly affect the choice of this type of care over relative care (OR=1.16), although it did seem to makethe choice of non-relative over relative care somewhat less likely (OR=0.73). However, it is worth noting thatin another multinomial model (not reported in full here) where the reference category was non-relative care(rather than relative care as in the current model), the availability of local centre-based care did make it amore likely choice instead of non-relative care.
Infants in rural areas were more likely than infants in urban areas to be placed in non-relative care (OR =1.51), perhaps reflecting the wider spread of households in the former; but they were also less likely to beplaced in a centre as an alternative to relative care (OR=0.80), possibly reflecting lower availability of crèchesin rural areas. Condition of the neighbourhood was not a significant predictor in the fully adjusted model.
Figure 5.3: Choice of relative, non-relative or centre-based care according to family income quintile – forinfants in regular non-parental care only
Chapter 5 • CHILDCARE SETTINGS AND CHILDCARE CHOICE
63
70
60
50
40
30
20
10
0Lowest quintile
% o
f in
fan
ts w
ith
in e
ach
qu
inti
le a
nd
in r
egu
lar
child
care
62.1
18.8 19.1
2nd quintile
53.7
27.7
18.6
3rd quintile
48.6
30
21.4
4th quintile
42.5
33.4
24.1
Highest quintile
24.4
33.4
42.3
Family Income
Relative Non-relative Centre
IncomeFigure 5.3 shows a strong pattern of choice of childcare by income, with lower-income families much morelikely to choose relative care and those from the highest quintile more likely to choose centre-based care.Despite adjustment for the other socio-demographic factors (such as education and age of mother), familyincome remained strongly associated with choice of childcare. Families with incomes below the highestquintile were, for the most part, only around half as likely as the wealthiest reference group to chooseeither non-relative or centre-based care over relative care (Table 5.2). This suggests that affordability affectschoice of non-parental care.
Mothers responded to a question about the extent to which their choice of childcare was determined bycost.36 Of mothers who said their choice of childcare was completely determined by price (7.8% overall),more than half (57.1%) used relative care compared to 21.9% non-relative and 21% centres. This comparesto 42% of the sample overall who used relative care. However, at the other end of the spectrum, among the50.9% who said choice was ‘not at all’ determined by cost, relative care still pre-dominated (46.4%compared to 28.0% and 25.6% for non-relative and centres respectively). Thus it seems that mothers whosemain source of childcare was provided by a relative were divided between some who actively chose it astheir preferred option and those who were driven largely by financial constraints. Not surprisingly, financialconstraints were more keenly felt among lower-income groups: 17-18% of mothers in the lowest twoincome quintiles said their childcare choice was completely determined by cost, compared to 2% in thehighest income quintile.
5.4 DISCUSSION
While much previous research, particularly in the US, has focused on centre-based care, for infants in Irelandthe primary type of non-parental childcare was relative care, predominantly grandparents, followed by non-relative home-based care and then centre-based care. Most relative care was unpaid; non-relative care andcentre-based care was almost all paid, and is expensive, as noted in Chapter 2. Mothers reported high levelsof satisfaction with current childcare arrangements.
Qualifications tended to be higher among carers in centre-based care than either non-relatives or particularrelative carers, though home-based carers tended to look after fewer children, and group sizes are smaller.Home-based carers – either relatives or non-relatives – generally had fewer learning-based resources, buthad more opportunities for one-to-one interaction with the Study Child.
The choice of which type of non-parental care to use was an important decision for parents and theirinfants, and a whole range of factors were associated with this choice. Of the child-level variables, the mostsalient factor was the number of siblings under 14 years living with the infant. Results from Chapter 4showed that, where there were a number of young children requiring care, it was less likely that non-parental care would be used. Analysis showed that where it was used, the care was less likely to be from arelative and more likely to be from a professional caregiver. This was particularly noticeable for familieswhere there were more than two young children, where the infant was more likely to be cared for by a non-relative (childminder or au-pair). It may become more efficient to use home-based paid care for multiplechildren (compared to one child), as the cost per child is likely to be lower for second and subsequentchildren, particularly for a carer in the child’s home. Associations with other child factors showed that‘unadaptable’ infants were more likely to be cared for by relatives (perhaps a familiar setting suited thembetter); and ‘dull/subdued’ infants, ‘fussy’ infants and those breastfed for more than three months weremore likely to be cared for by non-relatives or centre-based carers.
Growing Up in Ireland • MOTHERS’ RETURN TO WORK AND CHILDCARE CHOICES FOR INFANTS IN IRELAND • REPORT 2
6436 Answers were in response to the question: ‘To what extent was your choice of childcare determined by financial constraints?’
Mothers’ characteristics (such as education, age and ethnicity) tended to conform to expectations for themost part, with generally more advantaged families less reliant on care provided by relatives. The status ofthe mother as either a lone parent or living with a partner had more complex associations with choice ofcare: while lone parents were more likely to rely on relative care, this factor was heavily influenced byinteractions with other variables such as income and education. The most important communitycharacteristics were the potential availability of relatives to provide childcare, such as family living locallyand regular contact with grandparents living in Ireland. The model fit statistics suggest the factors exploredhave reasonable predictive power (Nagelkerke R2=0.24), but also that much of the variance in childcarechoice is explained by other factors not included.
Without data on parental preferences for relative versus non-relative childcare, it was impossible to assessthe extent to which parents freely chose between relative, non-relative and centre-based childcare.Preferences in this area were extremely difficult to ascertain, given that people often adapt theirpreferences to their current situation. Whatever about the type of care parents would choose in an idealworld; these models certainly suggest likely constraints: parents who pay for childcare might choose relativecare if their extended family lived nearby; equally, other parents using relative care might choose paidchildcare if they could afford it. The strong patterning of childcare choices by income in Ireland, with low-income families choosing relative care even after accounting for whether family members live nearby, andalso parents’ own responses on financial constraints, suggest that the cost of childcare is an important factorin childcare choices.
Despite the reduced likelihood of them providing care for larger families, and for fewer hours (see Chapter4), relatives emerged as a highly important source of childcare in Irish society. As well as them being themain non-parental carers for a majority of infants in childcare, the presence of family members living in thearea affected not just the choice of relative care over other care types but also whether non-parental carewas used at all (Chapter 4). In particular, relatives (most of whom are grandparents) were an importantsource of childcare for low-income families and for younger mothers. The extent to which this represents atrue choice – not just for parents but also for the relatives providing the care – is not clear.
Chapter 5 • CHILDCARE SETTINGS AND CHILDCARE CHOICE
65

Growing Up in Ireland • MOTHERS’ RETURN TO WORK AND CHILDCARE CHOICES FOR INFANTS IN IRELAND • REPORT 2
66
67
Chapter 6CHILDCARE AND INFANT HEALTH
6.1 INTRODUCTION
Rates of infection among infants are one of the few outcomes where differences might be expected to arisewithin the relatively short period that most infants have been in non-parental care. Indeed, the issue as towhether putting children, especially infants, in centre-based care places them at higher risk of commonchildhood infections is currently a matter of some concern and debate among Irish parents. It is also ofrelevance to the medical community given concerns about the over-prescribing of antibiotics and the longer-term consequences of this.37 This chapter explores whether there is any indication from the Growing Up inIreland data that infants who are in regular non-parental care are generally less healthy and more prone toinfections, and if the trends for home-based care differ from centre-based care.
Much of the research into the effects of childcare on health concerns the level of infection, particularlyrespiratory, ear and gastro-intestinal illnesses. In the USA, the National Institute of Child Health andDevelopment Study of Early Child Care (with over 1,000 children) found that infants in either centre- orhome-based care settings were at a greater risk of ear infections and upper respiratory tract infections(NICHD ECCRN, 2001; 2003b). Children in centre care were at greater risk of stomach illnesses compared toother non-parental care settings. For children in large group settings (more than six children), there was anincreased risk of upper respiratory infection, stomach illness and ear infections compared to children caredfor at home or in smaller group settings.
An even larger-scale study, the Longitudinal Study of Australian Children (nearly 4,000 infants) found thatinfants in any type of non-parental care except for “family day care”38 were at greater risk of having “lowphysical health”39 (Harrison et al., 2009). Infants cared for in childcare centres for more than 20 hours perweek had more than twice the risk of poor health than those cared for exclusively by parents. Infants whosechildcare started when they were older (10 months or older) had a lower risk than those whose childcarebegan in the first three months. In terms of the risk of acute infection, infants in long hours of centre-basedcare had the highest risk of infection, but infants in home-based settings did not differ from those inparental care.
A Danish study of over one million pre-school children using hospital admissions data found that infantsunder one year of age in centre-based care had an increased risk of hospitalisation for gastro-intestinalinfection compared to those in home care (Kamper-Jorgensen et al., 2008), but this did not apply to olderchildren. Similar findings emerged from the same research group in relation to hospitalisation forrespiratory infections (Kamper-Jorgensen, et al., 2006), with increased risk for infants under one year incentre-based care – particularly those younger than six months.
Other large-scale studies have also found that younger children are at particularly increased risk of infectionwhen placed in centre-based rather than home-based care. A Finnish study of over 2,500 children agedbetween one and seven years found that the one-year-olds had the greatest risk of diarrhoea episodes (thatappeared to be linked to the use of centre-based care) (Louhiala et al., 1997). An American study of nearly6,000 children under six years old, using data from the 1988 National Health Interview Survey of ChildHealth (rather than NICHD data), found that children in centre-based care had a 50% higher risk of repeatedear infections, and that the risk was greatest for children aged 1-2 years (Hardy & Fowler, 1993). Similarfindings in relation to recurrent ear infections were reported in a Norwegian study by Nafstad et al. (1999)who also found evidence of a later increased risk of asthma for children who had started in childcare centresbefore the age of two years. The NICHD study found that, while children in childcare had significantly moreillnesses in the first two years of life than those in parental care, by the age of three years these differenceswere no longer significant, suggesting that the increased risk may be temporary (NICHD ECCRN, 2001).
The contraction of illness in infancy can have implications for child development other than the unpleasantexperience of the illness in itself. In a review of findings, Shope and Aronson (2005) reported that along with
Growing Up in Ireland • MOTHERS’ RETURN TO WORK AND CHILDCARE CHOICES FOR INFANTS IN IRELAND • REPORT 2
6837 For example, the Health Service Executive is currently running a public information campaign to discourage it: ‘Action on Antibiotics’,
see http://www.hse.ie/antibiotics38 This type of care involves a childminder caring for a small group of children in the carer’s home.39 A composite variable combining a global health rating similar to that used in Growing Up in Ireland combined with a binary variable
based on answers to questions about medical needs for a longer-term health condition (Harrison et al., 2009, p121).
an increased risk of middle ear infections and requirements for ear grommets, children in large-group caresettings received more treatments with antibiotics, were more often colonised by antibiotic-resistantbacteria, and required more healthcare visits than children in home or small-group care. Increased use ofantibiotics may have further implications for child health. Exposure to antibiotics in infancy was associatedwith increased risk of asthma (Marra et al., 2006) and atopy (tendency to develop allergies) in certain groupsof children (Cole Johnson et al., 2005). The use of the antibiotic amoxicillin during infancy has been linked todefects in the tooth enamel of permanent teeth (Hong, Levy, Warren, et al., 2005).
However, some research suggests that early exposure to illness or infection through care settings may alsohave some immunity-boosting function. The increased exposure to common infections in the first year of lifethrough participation in group-setting childcare was found to reduce the risk of developing acutelymphoblastic leukaemia in childhood, in a study by Gilham et al. (2005). A meta-analysis by Kaila andTayback (2001) suggested a protective role for early exposure to infection through childcare in thedevelopment of Type 1 diabetes, at least for some subgroups. Findings from the NICHD study indicated thatchildren who experienced large-group care in their third year were less likely to get stomach illnesses andupper respiratory tract infections in their early school years (NICHD ECCRN, 2003b).
Set against these potential benefits, however, is a wide range of other disadvantages associated withrecurring ill-health in young children. For example, experience of chronic ear infections for children inchildcare has been linked to poorer attention in book-reading sessions (Feagans et al., 1994). Lamb andAhnert (2006) suggested that the differential rates of illness for children who have experienced varying caresettings might explain some of the inconsistencies in findings examining the effect of early childcare onlinguistic and cognitive competence. Bell et al. (1989) discussed the economic impact of illness in childrenunder three years: they found that young children attending childcare centres were 4.5 times more likely tobe hospitalised during the seven-month period of the study (n=843) than those in other care settings. Inaddition, children in the highest-risk settings incurred the most costly medical bills, and parents of childrenin childcare centres had higher rates of absenteeism from work than those who used other forms of full-time care outside the home.
The findings from the international literature highlighted the potential implications for type of care settingson child health, particularly infants. Research from many different studies and across several jurisdictionsunderlined the increased risk of infection associated with centre-based care, with the key differencebetween home and centre care typically being the number of children in the care setting. However, policiesin relation to childcare vary considerably between countries and an analysis of rates and patterns specificallyamong the Irish population is necessary. In time, longitudinal data from Growing Up in Ireland willcontribute to understanding whether early exposure to relatively minor infections played a detrimental orimmune-boosting role in later child health – particularly when the child starts regular schooling and ismixing with many children. For now, however, the focus is on investigating trends in early infections, bydifferent childcare types.
6.2 ASSOCIATION BETWEEN NON-PARENTAL CHILDCARE AND THE INFANT’S CURRENT OVERALL HEALTH
Mothers were asked to rate the infant’s current health (at the nine-month interview) on a four-point scale:‘very healthy, no problems’, ‘healthy, but a few minor problems’, ‘sometimes quite ill’ and ‘almost alwaysunwell’.40 For this analysis, these categories were grouped into ‘very healthy, no problems’ (82.9%) and ‘lesshealthy’ (17.1%). A logistic regression was used to examine the association of non-parental childcare withthe infant’s overall health status.41 This is based on the mother’s assessment of the infant’s current health,rather than the assessment of a health professional. Mothers may over- or underestimate their infant’shealth depending on their perspective.
Chapter 6 • CHILDCARE AND INFANT HEALTH
6940 Mothers were also asked to retrospectively rate the infant’s health at birth, on the same scale.41 The global health rating was not confined to health in relation to acute illness, so it could also reflect a longer-term condition.
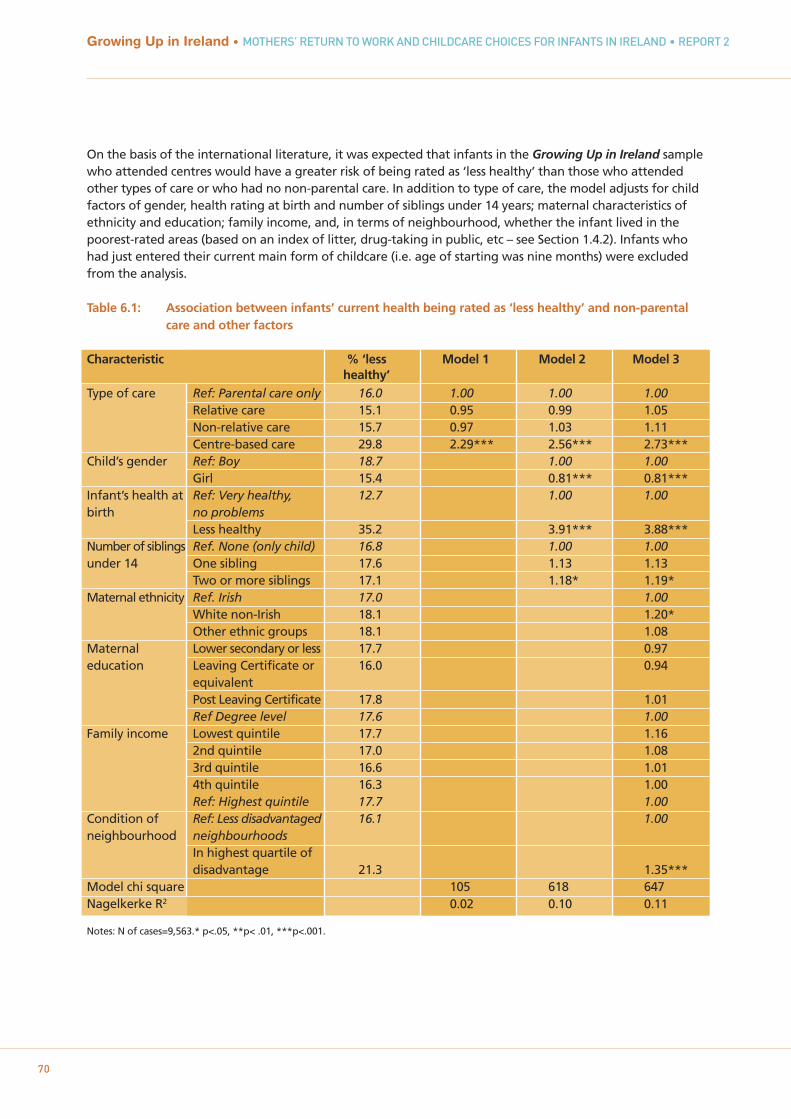
Growing Up in Ireland • MOTHERS’ RETURN TO WORK AND CHILDCARE CHOICES FOR INFANTS IN IRELAND • REPORT 2
70
On the basis of the international literature, it was expected that infants in the Growing Up in Ireland samplewho attended centres would have a greater risk of being rated as ‘less healthy’ than those who attendedother types of care or who had no non-parental care. In addition to type of care, the model adjusts for childfactors of gender, health rating at birth and number of siblings under 14 years; maternal characteristics ofethnicity and education; family income, and, in terms of neighbourhood, whether the infant lived in thepoorest-rated areas (based on an index of litter, drug-taking in public, etc – see Section 1.4.2). Infants whohad just entered their current main form of childcare (i.e. age of starting was nine months) were excludedfrom the analysis.
Table 6.1: Association between infants’ current health being rated as ‘less healthy’ and non-parental care and other factors
Characteristic % ‘less Model 1 Model 2 Model 3healthy’
Type of care Ref: Parental care only 16.0 1.00 1.00 1.00Relative care 15.1 0.95 0.99 1.05Non-relative care 15.7 0.97 1.03 1.11Centre-based care 29.8 2.29*** 2.56*** 2.73***
Child’s gender Ref: Boy 18.7 1.00 1.00Girl 15.4 0.81*** 0.81***
Infant’s health at Ref: Very healthy, 12.7 1.00 1.00birth no problems
Less healthy 35.2 3.91*** 3.88***Number of siblings Ref. None (only child) 16.8 1.00 1.00under 14 One sibling 17.6 1.13 1.13
Two or more siblings 17.1 1.18* 1.19*Maternal ethnicity Ref. Irish 17.0 1.00
White non-Irish 18.1 1.20*Other ethnic groups 18.1 1.08
Maternal Lower secondary or less 17.7 0.97education Leaving Certificate or 16.0 0.94
equivalentPost Leaving Certificate 17.8 1.01Ref Degree level 17.6 1.00
Family income Lowest quintile 17.7 1.162nd quintile 17.0 1.083rd quintile 16.6 1.014th quintile 16.3 1.00Ref: Highest quintile 17.7 1.00
Condition of Ref: Less disadvantaged 16.1 1.00neighbourhood neighbourhoods
In highest quartile of disadvantage 21.3 1.35***
Model chi square 105 618 647Nagelkerke R2 0.02 0.10 0.11
Notes: N of cases=9,563.* p<.05, **p< .01, ***p<.001.
As expected, Table 6.1 shows that infants who attended centres such as crèches have a higher risk of beingrated as ‘less healthy’ than those with parental care only. In Model 3 (column on far right), this representsnearly three times the risk faced by infants not in childcare (OR = 2.73). However, those in home-based care,by either relatives or non-relatives, did not have an increased risk of being less healthy than infants inparental care only. More than a quarter of infants whose main childcare was in a centre (29.8%) had a ‘lesshealthy’ rating compared to rates of between 15% and 16% for those in home-based care settings, or noregular care.
Girls had a lower risk of a ‘less healthy’ rating than boys (OR = 0.81) and those infants living with two ormore siblings had a slightly increased risk of being rated as ‘less healthy’ (OR=1.19). The most significantchild factor was, however, health at birth; those infants rated less healthy at birth were nearly four timesmore likely to be rated ‘less healthy’ at nine months (OR = 3.88). The odds ratio for the risk of poor healthassociated with centre-based care actually increased in Model 2 after controlling for child factors withinfants in centre-based care now 2.56 times more likely to be rated by their mothers as ‘less healthy’ (upfrom 2.29 times in Model 1). It could be that less healthy children were less likely to be placed in childcare inthe first place, so infants in childcare were a selected healthier group to start with.
There was no significant effect of maternal education or income but there was a marginally higher risk forinfants whose mothers were white non-Irish (relative to Irish, OR = 1.20), and infants living in disadvantagedneighbourhoods (OR=1.35). Once again, the gap between centre-based care and parental care rises – fromOR 2.56 to OR 2.73. Chapter 5 found that socio-economically advantaged children were more likely to be incentre-based care. Once these factors were accounted for, the association with centre-based care andmothers’ rating of infant health is stronger. Overall, the model fit statistics indicate that, while some of thevariance in health is explained by these factors, much is still unaccounted for.
6.2.1 ASSOCIATION BETWEEN INCREASED RISK AND LONGER HOURS IN NON-PARENTAL CARE AND/OR ENTRY PRIOR TO 6 MONTHS
To estimate the effect of number of hours in care per week (less than 20 hours/20 or more hours) and earlierentry to current main care (prior to 6 months of age/6, 7, or 8 months), the above analysis was re-run withjust the children in some form of childcare, and these additional variables added as predictors (n=3,482). Thereference group was infants in relative care. In this analysis, infants in centre-based care remained at higherrisk of a ‘less healthy’ rating compared to those looked after by relatives (OR=2.64, p <.001) even whenadjustments were made for hours in care (OR =1.15, n.s.) and later entry to childcare (OR=0.85, n.s.), neitherof which were significant in themselves. The lack of effect of hours and age of entry is somewhat surprisinggiven findings elsewhere, but it may be confounded by the relatively late age of entry to full-time non-parental care seen in this cohort, with more generous maternity-leave provisions delaying the start of non-parental childcare. It could also be that the effect of hours of care was for much higher hours, perhaps 35+hours. Finally, infants looked after by non-relatives did not differ significantly from those cared for byrelatives in their risk of being rated as ‘less healthy’ (OR =1.09, CI=0.86-1.38).
6.3 ASSOCIATION BETWEEN NON-PARENTAL CARE AND INCIDENCE OF CHILDHOOD INFECTIONS AND WHEEZING/ASTHMA
Following on from the finding in Section 6.2 that infants in centre-based childcare were more likely to havea poorer parental rating of current health, the associated risk for these children in relation to some commonchildhood infections – such as the common cold, chest infections, ear infections and gastro-intestinalsymptoms – was explored. Again it was expected that infants in care settings with multiple children wouldbe at greater risk of picking up such infections. As part of the main interview, the mother was presentedwith a list of specific acute illnesses and asked if the infant had been taken to a GP, Health Centre or PublicHealth Nurse, or to Accident and Emergency for any of them. As no information was gathered as to thetiming of these illnesses, it is not possible to say whether they occurred before or after an infant joined their
Chapter 6 • CHILDCARE AND INFANT HEALTH
71
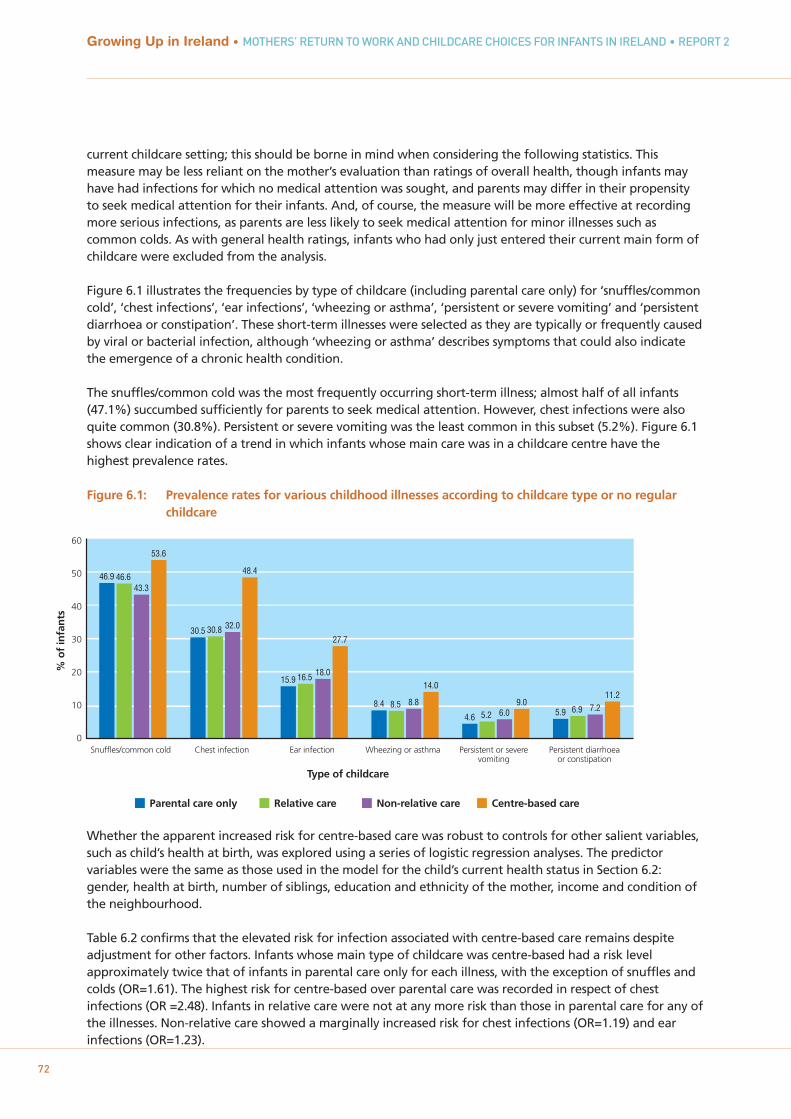
current childcare setting; this should be borne in mind when considering the following statistics. Thismeasure may be less reliant on the mother’s evaluation than ratings of overall health, though infants mayhave had infections for which no medical attention was sought, and parents may differ in their propensityto seek medical attention for their infants. And, of course, the measure will be more effective at recordingmore serious infections, as parents are less likely to seek medical attention for minor illnesses such ascommon colds. As with general health ratings, infants who had only just entered their current main form ofchildcare were excluded from the analysis.
Figure 6.1 illustrates the frequencies by type of childcare (including parental care only) for ‘snuffles/commoncold’, ‘chest infections’, ‘ear infections’, ‘wheezing or asthma’, ‘persistent or severe vomiting’ and ‘persistentdiarrhoea or constipation’. These short-term illnesses were selected as they are typically or frequently causedby viral or bacterial infection, although ‘wheezing or asthma’ describes symptoms that could also indicatethe emergence of a chronic health condition.
The snuffles/common cold was the most frequently occurring short-term illness; almost half of all infants(47.1%) succumbed sufficiently for parents to seek medical attention. However, chest infections were alsoquite common (30.8%). Persistent or severe vomiting was the least common in this subset (5.2%). Figure 6.1shows clear indication of a trend in which infants whose main care was in a childcare centre have thehighest prevalence rates.
Figure 6.1: Prevalence rates for various childhood illnesses according to childcare type or no regular childcare
Whether the apparent increased risk for centre-based care was robust to controls for other salient variables,such as child’s health at birth, was explored using a series of logistic regression analyses. The predictorvariables were the same as those used in the model for the child’s current health status in Section 6.2:gender, health at birth, number of siblings, education and ethnicity of the mother, income and condition ofthe neighbourhood.
Table 6.2 confirms that the elevated risk for infection associated with centre-based care remains despiteadjustment for other factors. Infants whose main type of childcare was centre-based had a risk levelapproximately twice that of infants in parental care only for each illness, with the exception of snuffles andcolds (OR=1.61). The highest risk for centre-based over parental care was recorded in respect of chestinfections (OR =2.48). Infants in relative care were not at any more risk than those in parental care for any ofthe illnesses. Non-relative care showed a marginally increased risk for chest infections (OR=1.19) and earinfections (OR=1.23).
Growing Up in Ireland • MOTHERS’ RETURN TO WORK AND CHILDCARE CHOICES FOR INFANTS IN IRELAND • REPORT 2
72
60
50
40
30
20
10
0
% o
f in
fan
ts
46.9 46.643.3
53.6
Parental care only Relative care Non-relative care Centre-based care
Snuffles/common cold
30.5 30.8 32.0
48.4
Chest infection
15.9 16.5 18.0
27.7
Ear infection
8.4 8.5 8.8
14.0
Wheezing or asthma
4.6 5.2 6.09.0
Persistent or severevomiting
5.9 6.9 7.211.2
Persistent diarrhoeaor constipation
Type of childcare
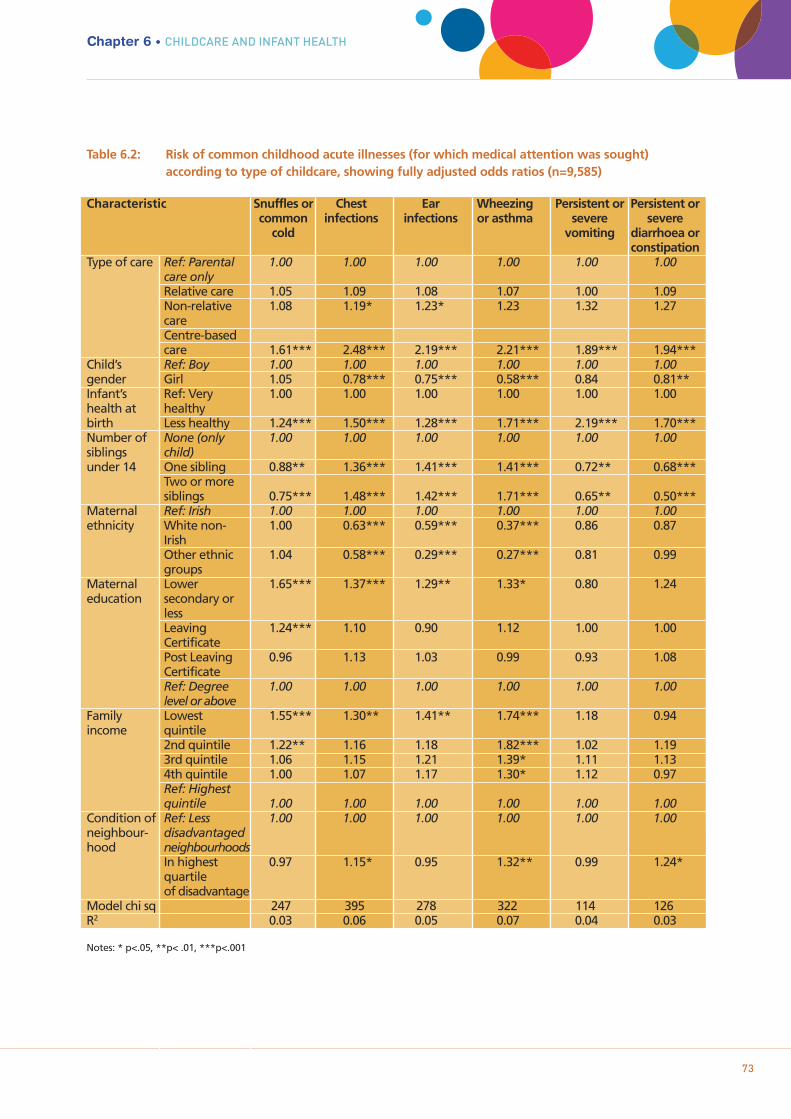
Chapter 6 • CHILDCARE AND INFANT HEALTH
73
Table 6.2: Risk of common childhood acute illnesses (for which medical attention was sought) according to type of childcare, showing fully adjusted odds ratios (n=9,585)
Characteristic Snuffles or Chest Ear Wheezing Persistent or Persistent or common infections infections or asthma severe severe
cold vomiting diarrhoea or constipation
Type of care Ref: Parental 1.00 1.00 1.00 1.00 1.00 1.00care onlyRelative care 1.05 1.09 1.08 1.07 1.00 1.09Non-relative 1.08 1.19* 1.23* 1.23 1.32 1.27careCentre-based care 1.61*** 2.48*** 2.19*** 2.21*** 1.89*** 1.94***
Child’s Ref: Boy 1.00 1.00 1.00 1.00 1.00 1.00gender Girl 1.05 0.78*** 0.75*** 0.58*** 0.84 0.81**Infant’s Ref: Very 1.00 1.00 1.00 1.00 1.00 1.00health at healthybirth Less healthy 1.24*** 1.50*** 1.28*** 1.71*** 2.19*** 1.70***Number of None (only 1.00 1.00 1.00 1.00 1.00 1.00siblings child)under 14 One sibling 0.88** 1.36*** 1.41*** 1.41*** 0.72** 0.68***
Two or more siblings 0.75*** 1.48*** 1.42*** 1.71*** 0.65** 0.50***
Maternal Ref: Irish 1.00 1.00 1.00 1.00 1.00 1.00ethnicity White non- 1.00 0.63*** 0.59*** 0.37*** 0.86 0.87
IrishOther ethnic 1.04 0.58*** 0.29*** 0.27*** 0.81 0.99groups
Maternal Lower 1.65*** 1.37*** 1.29** 1.33* 0.80 1.24education secondary or
lessLeaving 1.24*** 1.10 0.90 1.12 1.00 1.00Certificate Post Leaving 0.96 1.13 1.03 0.99 0.93 1.08CertificateRef: Degree 1.00 1.00 1.00 1.00 1.00 1.00level or above
Family Lowest 1.55*** 1.30** 1.41** 1.74*** 1.18 0.94income quintile
2nd quintile 1.22** 1.16 1.18 1.82*** 1.02 1.193rd quintile 1.06 1.15 1.21 1.39* 1.11 1.134th quintile 1.00 1.07 1.17 1.30* 1.12 0.97Ref: Highest quintile 1.00 1.00 1.00 1.00 1.00 1.00
Condition of Ref: Less 1.00 1.00 1.00 1.00 1.00 1.00neighbour- disadvantagedhood neighbourhoods
In highest 0.97 1.15* 0.95 1.32** 0.99 1.24*quartile of disadvantage
Model chi sq 247 395 278 322 114 126 R2 0.03 0.06 0.05 0.07 0.04 0.03
Notes: * p<.05, **p< .01, ***p<.001
74
Growing Up in Ireland • MOTHERS’ RETURN TO WORK AND CHILDCARE CHOICES FOR INFANTS IN IRELAND • REPORT 2
As observed in relation to the infant’s current overall health rating (Section 6.2), the infant’s health at birthstood out as an important predictor of risk of getting medical attention for infections; those who were lesshealthy at birth were at increased risk of every illness. Table 6.2 also indicates a predictive role for thenumber of siblings an infant has, although the relationship is more complex in this instance and does not goin the same direction for all illness types. Infants living with one sibling had a significantly increased risk ofchest infections (OR = 1.36), ear infections (OR=1.41) and wheezing or asthma (OR=1.41) compared to only-children.
The risk was even greater for infants living with two or more siblings (odds ratios of 1.48, 1.42 and 1.71 forchest infections, ear infections and wheezing or asthma, respectively). These were the particular illnesses forwhich the risk associated with being in centre-based care was also highest. In contrast, however, living withsiblings was associated with a decrease in the risk for requiring medical attention for the snuffles/commoncold, and for the two sets of gastro-intestinal symptoms. While these patterns may reflect some sort ofimmunity function for the presence of siblings (despite the increased risk seen with attendance at childcarecentres), it may also be the case that more experienced parents were more likely to let these illnesses resolvethemselves without medical intervention. The association between incidence of infection and number ofother children under 14 years old in the household was of particular interest, given that the potential forgreater exposure to infection in a childcare centre is generally thought to relate to contact with morechildren.
Gender was also a salient child factor in acute illness. Girls had a lower risk of every illness in this subsetexcept the snuffles/common cold (although the reduced risk of persistent/severe vomiting was at a marginallevel of significance, OR=0.84, p = .053). The difference was particularly notable in relation to wheezing orasthma, with the risk for girls being almost half that of boys (OR=0.58). Infants of mothers whose ethnicitywas other than Irish also had a markedly lower risk of wheezing or asthma: 63% less risk for white non-Irishand 73% less risk for other ethnic groups. These two groups also had a lower risk than infants of Irishparents for chest infections and ear infections.
In relation to the other family and maternal characteristics, Table 6.2 shows that infants in families wherethe mother had no more than lower secondary education or whose income was in the lowest quintile had ahigher risk than the most socio-economically advantaged infants for all the respiratory and ear infections(that were brought to the attention of a medical professional) but not the gastro-intestinal ailments. Livingin a neighbourhood in the poorest condition was associated with a marginal increase in the risk of chestinfection (OR = 1.15) but a more significant increase in the risk of ‘wheezing or asthma’ (OR=1.32) and‘persistent or severe diarrhoea or constipation’ (OR=1.24).
Apart from the cross-sectional nature of the data, there are some other potential limitations to theconclusions that can be drawn from these analyses. The wording of the question in relation to acuteillnesses, particularly the specification that medical attention had been sought for the infant, was initiallyincluded to give some indication of the seriousness of the illness. It does, however, create some possibility ofconfounding with the policies for childcare centres regarding care of sick children. From the sample of carerswho returned self-complete questionnaires (see Chapter 4), it is known that most centres will not look afterchildren who are sick (56.6% said ‘never’ and only 5.8% said ‘frequently’ or ‘always’). This is in contrast tothe home-based carers, of whom 26.6% said they ‘frequently’ looked after the infant when he or she wassick and a further 22.6% ‘always’ did. There may, therefore, be an additional incentive for parents to seekmedical attention for a minor illness if the infant attends a crèche or other centre; however, counter to thishypothesis, infants in centres were nearly three times more likely to be described as less than ‘very healthy,no problems’ overall, and this parental rating was not predicated on seeking medical attention. It is also of
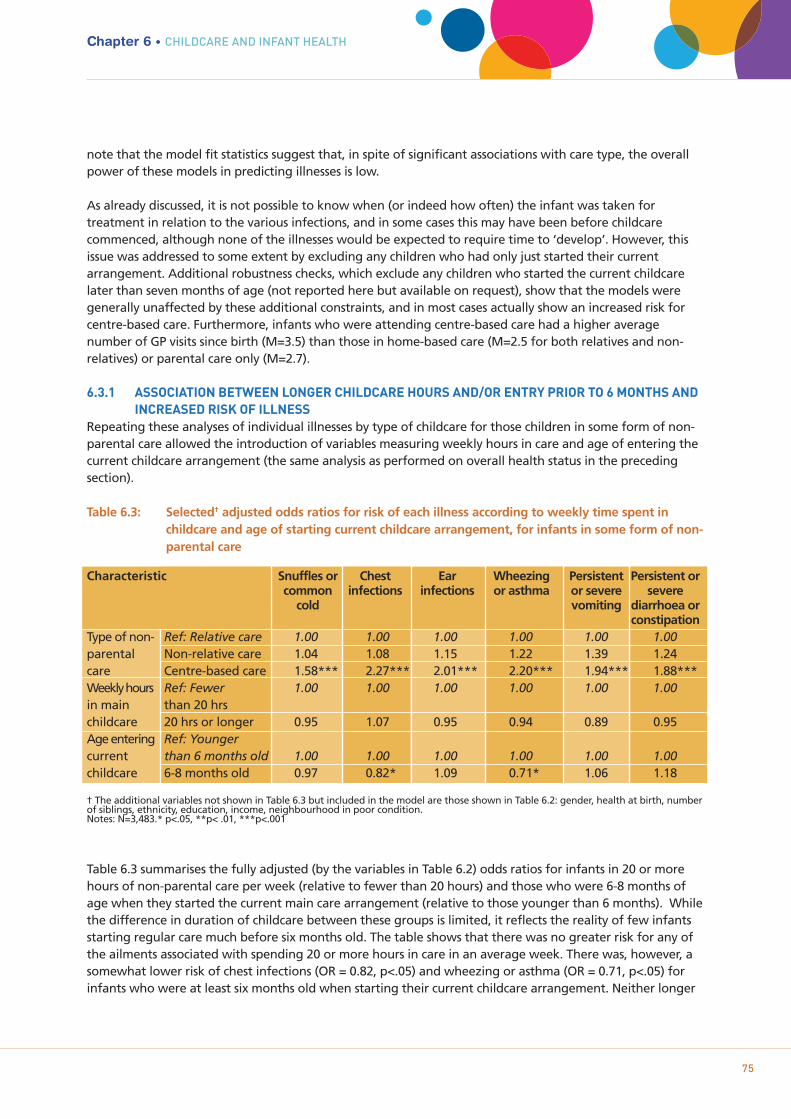
75
note that the model fit statistics suggest that, in spite of significant associations with care type, the overallpower of these models in predicting illnesses is low.
As already discussed, it is not possible to know when (or indeed how often) the infant was taken fortreatment in relation to the various infections, and in some cases this may have been before childcarecommenced, although none of the illnesses would be expected to require time to ‘develop’. However, thisissue was addressed to some extent by excluding any children who had only just started their currentarrangement. Additional robustness checks, which exclude any children who started the current childcarelater than seven months of age (not reported here but available on request), show that the models weregenerally unaffected by these additional constraints, and in most cases actually show an increased risk forcentre-based care. Furthermore, infants who were attending centre-based care had a higher averagenumber of GP visits since birth (M=3.5) than those in home-based care (M=2.5 for both relatives and non-relatives) or parental care only (M=2.7).
6.3.1 ASSOCIATION BETWEEN LONGER CHILDCARE HOURS AND/OR ENTRY PRIOR TO 6 MONTHS AND INCREASED RISK OF ILLNESS
Repeating these analyses of individual illnesses by type of childcare for those children in some form of non-parental care allowed the introduction of variables measuring weekly hours in care and age of entering thecurrent childcare arrangement (the same analysis as performed on overall health status in the precedingsection).
Table 6.3: Selected† adjusted odds ratios for risk of each illness according to weekly time spent in childcare and age of starting current childcare arrangement, for infants in some form of non-parental care
Characteristic Snuffles or Chest Ear Wheezing Persistent Persistent or common infections infections or asthma or severe severe
cold vomiting diarrhoea or constipation
Type of non- Ref: Relative care 1.00 1.00 1.00 1.00 1.00 1.00parental Non-relative care 1.04 1.08 1.15 1.22 1.39 1.24care Centre-based care 1.58*** 2.27*** 2.01*** 2.20*** 1.94*** 1.88***Weekly hours Ref: Fewer 1.00 1.00 1.00 1.00 1.00 1.00in main than 20 hrschildcare 20 hrs or longer 0.95 1.07 0.95 0.94 0.89 0.95Age entering Ref: Younger current than 6 months old 1.00 1.00 1.00 1.00 1.00 1.00childcare 6-8 months old 0.97 0.82* 1.09 0.71* 1.06 1.18
† The additional variables not shown in Table 6.3 but included in the model are those shown in Table 6.2: gender, health at birth, number of siblings, ethnicity, education, income, neighbourhood in poor condition. Notes: N=3,483.* p<.05, **p< .01, ***p<.001
Table 6.3 summarises the fully adjusted (by the variables in Table 6.2) odds ratios for infants in 20 or morehours of non-parental care per week (relative to fewer than 20 hours) and those who were 6-8 months ofage when they started the current main care arrangement (relative to those younger than 6 months). Whilethe difference in duration of childcare between these groups is limited, it reflects the reality of few infantsstarting regular care much before six months old. The table shows that there was no greater risk for any ofthe ailments associated with spending 20 or more hours in care in an average week. There was, however, asomewhat lower risk of chest infections (OR = 0.82, p<.05) and wheezing or asthma (OR = 0.71, p<.05) forinfants who were at least six months old when starting their current childcare arrangement. Neither longer
Chapter 6 • CHILDCARE AND INFANT HEALTH
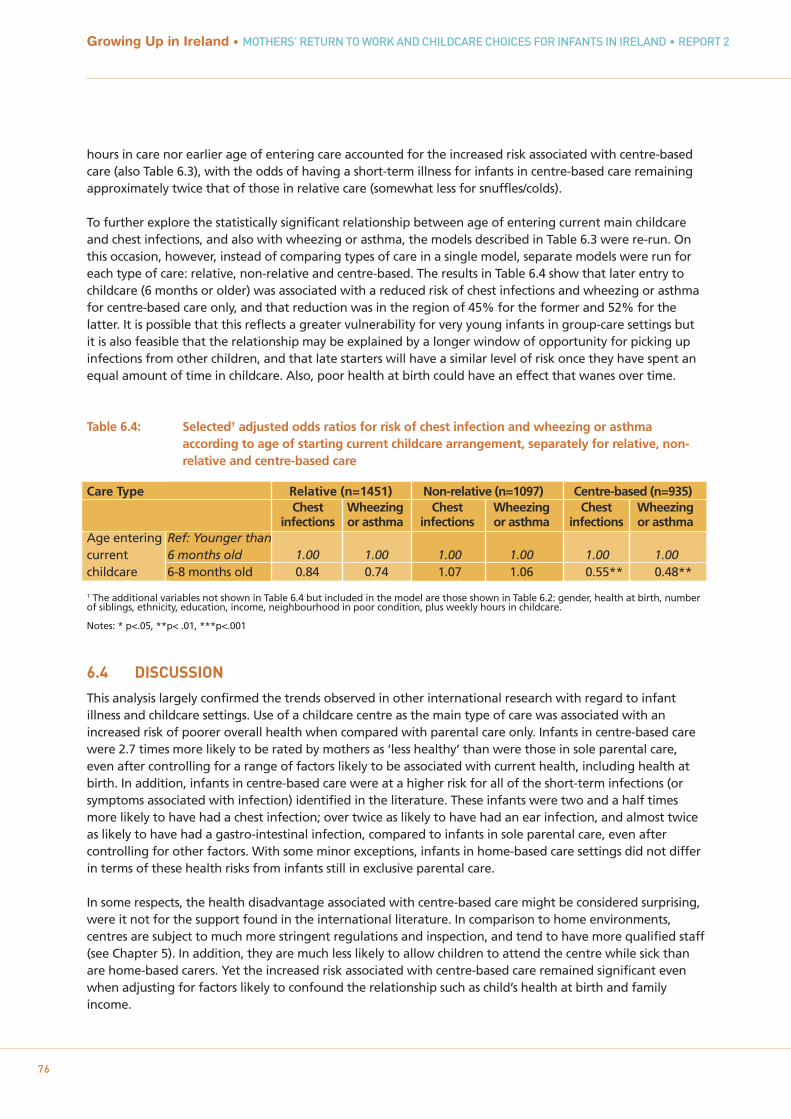
Growing Up in Ireland • MOTHERS’ RETURN TO WORK AND CHILDCARE CHOICES FOR INFANTS IN IRELAND • REPORT 2
76
hours in care nor earlier age of entering care accounted for the increased risk associated with centre-basedcare (also Table 6.3), with the odds of having a short-term illness for infants in centre-based care remaining approximately twice that of those in relative care (somewhat less for snuffles/colds).
To further explore the statistically significant relationship between age of entering current main childcareand chest infections, and also with wheezing or asthma, the models described in Table 6.3 were re-run. Onthis occasion, however, instead of comparing types of care in a single model, separate models were run foreach type of care: relative, non-relative and centre-based. The results in Table 6.4 show that later entry tochildcare (6 months or older) was associated with a reduced risk of chest infections and wheezing or asthmafor centre-based care only, and that reduction was in the region of 45% for the former and 52% for thelatter. It is possible that this reflects a greater vulnerability for very young infants in group-care settings butit is also feasible that the relationship may be explained by a longer window of opportunity for picking upinfections from other children, and that late starters will have a similar level of risk once they have spent anequal amount of time in childcare. Also, poor health at birth could have an effect that wanes over time.
Table 6.4: Selected† adjusted odds ratios for risk of chest infection and wheezing or asthma according to age of starting current childcare arrangement, separately for relative, non-relative and centre-based care
Care Type Relative (n=1451) Non-relative (n=1097) Centre-based (n=935)Chest Wheezing Chest Wheezing Chest Wheezing
infections or asthma infections or asthma infections or asthmaAge entering Ref: Younger than current 6 months old 1.00 1.00 1.00 1.00 1.00 1.00childcare 6-8 months old 0.84 0.74 1.07 1.06 0.55** 0.48**
† The additional variables not shown in Table 6.4 but included in the model are those shown in Table 6.2: gender, health at birth, number of siblings, ethnicity, education, income, neighbourhood in poor condition, plus weekly hours in childcare.
Notes: * p<.05, **p< .01, ***p<.001
6.4 DISCUSSION
This analysis largely confirmed the trends observed in other international research with regard to infantillness and childcare settings. Use of a childcare centre as the main type of care was associated with anincreased risk of poorer overall health when compared with parental care only. Infants in centre-based carewere 2.7 times more likely to be rated by mothers as ‘less healthy’ than were those in sole parental care,even after controlling for a range of factors likely to be associated with current health, including health atbirth. In addition, infants in centre-based care were at a higher risk for all of the short-term infections (orsymptoms associated with infection) identified in the literature. These infants were two and a half timesmore likely to have had a chest infection; over twice as likely to have had an ear infection, and almost twiceas likely to have had a gastro-intestinal infection, compared to infants in sole parental care, even aftercontrolling for other factors. With some minor exceptions, infants in home-based care settings did not differin terms of these health risks from infants still in exclusive parental care.
In some respects, the health disadvantage associated with centre-based care might be considered surprising,were it not for the support found in the international literature. In comparison to home environments,centres are subject to much more stringent regulations and inspection, and tend to have more qualified staff(see Chapter 5). In addition, they are much less likely to allow children to attend the centre while sick thanare home-based carers. Yet the increased risk associated with centre-based care remained significant evenwhen adjusting for factors likely to confound the relationship such as child’s health at birth and familyincome.
The most likely explanation for the increase in risk would appear to be the greater exposure to viruses andbacteria that comes from mixing with more children (and adults) in the group setting. Shope and Aronson(2005) suggested that the increase in infections is a result of the sharing of objects and food betweenchildren as well as the close proximity. It is interesting to note that, in the current analysis, infants who livedwith any siblings were at greater risk of some of the infections (chest, ear and wheezing or asthma) but notothers (colds, gastro-intestinal ailments). Also, infants with two or more siblings were also more likely to berated as less healthy than only-children – possibly as a result of picking up infections in the home.
An important confounding factor in relation to the analyses on acute infections is that parents of infants incentre-based care may be under greater pressure to attend a doctor for minor illnesses so that the infantmay be readmitted to the centre as soon as possible; Chapter 4 shows that non-parental care was muchmore likely to be used by working mothers. A greater inclination to attend for minor illnesses may alsoexplain some of the effect of infant health at birth that was observed, such that, as well as being moreprone to infections, parents of infants who have been sickly from the start may be more motivated to haveminor infections ‘nipped in the bud’ than parents of generally healthy infants.
While the general trend for increased risk among children attending centres was replicated, some otherrelated trends that might have been expected from the international literature did not emerge. Forexample, the Australian study (Harrison et al., 2009) observed a stronger negative effect when weekly carewas longer than 20 hours per week. This was not evident in the current exploration; however, this durationeffect was not always found in similar studies. A study by Hildesheim, Hoffman and Overpeck (1999) foundthat number of children in the centre was associated with an increase in the risk of ear infections forchildren aged 1-2 years but not for children under one year or aged 3-5 years.
An increase in risk for earlier entry to childcare (before 6 months) was observed in the Growing Up in Irelanddata for just chest infections and wheezing or asthma, and then only for centre-based care. However, theseparticular findings were complicated by the relatively low number of infants starting their current main carearrangement before six months old, and by the fact that the particular question refers only to the age ofstarting the current arrangement (and not any childcare arrangement). Implications for earlier entry to non-parental childcare, particularly centre-based care, may be more usefully investigated in subsequent waves ofthis study. It is also worth bearing in mind that type of childcare plays a relatively minor role in explainingchildhood infection; health at birth is a key factor. The relatively low values for model fit suggest many otherunobserved factors play a role too.
Nonetheless, the evidence that can be gleaned from Growing Up in Ireland at this stage supports findingsfrom the international literature, as well as anecdotal evidence from practitioners in the field, that infantswho attend centre-based care are at more risk of various infections than infants in home-based or parental-only care. These findings have implications for not just the child’s current wellbeing, but also patterns ofattending GP services, prescription of antibiotics, and, potentially, parental stress. Arguably, the more salientquestion, which can only be addressed in years to come, is to what extent there will be any effect of centre-based childcare on the child’s future health and other developmental factors, and whether that effect willbe largely positive or negative.
77
Chapter 6 • CHILDCARE AND INFANT HEALTH

78
Growing Up in Ireland • MOTHERS’ RETURN TO WORK AND CHILDCARE CHOICES FOR INFANTS IN IRELAND • REPORT 2

79
CONCLUSION
Chapter 7
80
Growing Up in Ireland • MOTHERS’ RETURN TO WORK AND CHILDCARE CHOICES FOR INFANTS IN IRELAND • REPORT 2
7.1 SUMMARY OF FINDINGS
The primary focus of this report is the care of infants in the first year of their lives. Using a large sample ofmothers with infants from the nine-month Infant Cohort of Growing Up in Ireland, this report investigatedthree broad research questions relating to the care of infants in Ireland: which mothers return to paidemployment before nine months and the timing of this return, as an indicator of the duration of solematernal care; the extent and nature of non-parental childcare for infants, and the association betweenchildcare and infant health at nine months. The fieldwork for the survey was conducted in the periodSeptember 2008 to March 2009.
The conceptual model which underpins this report rests on a bio-ecological model. The selection and timingof childcare is placed in a series of nested contexts, with the infant at the centre and their parents, familyand community context all contributing to decisions about the mother’s return to paid work and childcarechoices. These choices by individuals are embedded in a policy and labour-market context.
The key features of the labour market and policy context in Ireland were outlined. The period preceding thefieldwork saw a rapid economic boom in Ireland, accompanied by a rise in employment opportunities forwomen. The employment rate of women rose from 40% in 1994 to 60% in 2008. There were successiveextensions in maternity leave in the decade prior to the survey, with six months’ paid leave available formothers who qualified at the time of the survey, and up to sixteen weeks’ unpaid leave. There was lesspolicy development for fathers in the period, with low entitlement for them. Childcare is and has been amajor issue for parents and policymakers for many years now. In 2008-2009, state funding for early care andeducation services for pre-school children was limited, and Irish childcare was one of the most expensive inthe OECD. There have been some recent policy developments for children aged three and over, but not forinfants.
Which mothers in Ireland returned to work by nine months of age? Only 8% of mothers in this sample werein paid employment before their infant was six months old. Returns to work before this period were morelikely to be by self-employed mothers, young mothers and lone mothers. However, lone mothers and youngmothers were much less likely to have been at work before birth. Highly educated mothers, who were morelikely to be able to afford to take unpaid leave, were more likely to return in the eight-nine month period.
A very high proportion of mothers who worked prior to birth – 85% – took paid maternity leave, and theydid so for six months. Without a quasi-experiment to compare return to work before and after changes topaid maternity leave, firm conclusions about its impact are not possible, but this evidence suggests that paidmaternity leave may be an effective instrument for influencing the labour-market behaviour of mothers inthe immediate period after childbirth. Unpaid leave also appeared to have been used, primarily for thosewho can afford to take it.
What is the extent and nature of non-parental care used by parents in Ireland? Just under two-in-five infants(39%) were in regular non-parental childcare at nine months of age. Following the pattern of return towork, many children started non-parental childcare at around six months of age, and at nine months, themajority (62% of those in care) were in care for less than 30 hours. As expected, the factor most stronglyassociated with the use of non-parental care, and number of hours care per week, was the work status ofthe mother, with those who worked full-time more likely to use it for more hours per week. Family income,which largely determined the affordability of childcare for parents, was another factor significantlyassociated with use and hours of care, which was not surprising, given the very high costs of paid childcare inIreland. Of the child variables, the most consistently associated factor was the number of siblings under 14years living with the infant. It would appear that, where there were a number of young children requiringcare, it was less likely that non-parental care would be used. This was also likely to be related to cost.
81
Chapter 7 • CONCLUSION
What were the differences related to quality between childcare settings, in terms of use, costs, and otherfeatures? The most popular main form of childcare was that provided by a relative (42%), followed by non-relatives, predominantly childminders (30.7%), with centre-based care such as crèches coming third (27%).Carer surveys, with responses from just under half of all carers, revealed interesting differences in the caresettings, with higher carer-child ratios in centre-based settings and less one-to-one interaction, but moreopportunities for active learning. Many people caring for infants in Ireland do not have any childcare-related qualifications. Over 50% of childminders and over 80% of relatives had no childcare-relatedqualifications. Qualification levels were highest among centre-based carers, but even here they wererelatively low. One in five childcare centre employees had HETAC or third-level qualifications in childcare.
Relatives emerged as a highly important source of childcare for infants in Ireland, although they were lesslikely to care for several children. As well as being the primary non-parental carer for 42% of infants inchildcare, family members living in the area were associated with not just the choice of relative care overother care types but also with whether non-parental care was used at all. In particular, relatives were animportant source of childcare for low-income families and for younger mothers. This childcare was typicallyprovided by grandparents.
What is the relationship between child health and different types of childcare? This analysis largelyconfirmed the trends observed in other international research. Children with low health at birth had ahigher risk for infections. Infants in a childcare centre were 2.7 times more likely to be rated as ‘less healthy’than infants in sole parental care, controlling for other factors. In addition, though the precise timing ofinfections is not known, infants in centre-based care were more likely to have had infections for whichmedical attention was sought. They were 2.5 times more likely to have had a chest infection; over twice aslikely to have had an ear infection and almost twice as likely to have had a gastro-intestinal infectioncompared to infants in sole parental care. With some minor exceptions, infants in home-based care settingsdid not differ in terms of these health risks from infants still in exclusive parental care. The increased riskassociated with centre-based care remains significant even when adjusting for factors likely to confound therelationship, such as child’s health at birth and family income. We cannot rule out differences betweenparents in their propensity to seek medical attention for their infant.
An important constraint on these analyses is that they are based solely on data on nine-month-old infants.Nine months is early for considering the employment outcomes of mothers, as many mothers have not yetreturned to work. The analysis is also a ‘snapshot’: children’s lives, including their needs, childcare settingsand other circumstances, can change very rapidly. Childcare choices may look quite different for three-year-olds; ratios of carers to children already change at the age of one year. The impact of childcare settings onhealth may also be different at three years. The real strength of the Growing Up in Ireland study is that ithas a second wave following the same children to age three years, so the impact of the use and choice ofnon-parental childcare at nine months on outcomes at three years can be investigated. These includecognitive, language, socio-emotional and behavioural outcomes (see Williams et al., forthcoming).
7.2 POLICY IMPLICATIONS
At the time of writing, the State is developing Ireland’s first National Early Years Strategy, for children aged0-6 years. Though there are many aspects of a young child’s life over which the Government has littleinfluence, parents’ leave entitlements and childcare policy are important exceptions. Despite the limitationsof using only the first wave of data, some policy implications can be drawn. While leave entitlements andchildcare policy are discussed separately, these clearly interact: if parental care is extended for mothers andfathers, the length of time parents care for infants before returning to work may change. This will haveimplications for employment as well as for non-parental care patterns.
7.2.1 MATERNITY LEAVE Although causal conclusions cannot be drawn with confidence from these data, the evidence suggests thatpaid maternity leave is an effective policy in influencing the duration of sole maternal care in the first yearof an infant’s life. Many other factors clearly play a role, but with six months’ paid maternity leave at thetime of the survey, few mothers took up paid employment earlier than this point. If the Government’s aimwere to promote/extend the duration of sole parental care in the first year of a child’s life, extending paidleave for parents appears to be the most viable way of doing this.
Whether this leave should be for mothers or fathers or both is another relevant policy decision. There weresuccessive extensions of maternity leave in Ireland in the decade preceding the survey. However, there havenot been similar extensions to leave provisions for fathers. Take-up of the existing entitlement to unpaidparental leave by fathers (as distinct from ‘paternity leave’) is very low. If the Government’s aim were toincrease gender equality in employment as well as leave provision, one way to do this might be to makesome proportion of paid leave for fathers only, or to transfer to fathers unused leave entitlements, whetherpaid or unpaid, from mothers who return to work early (Moss, 2010). This would have two potentialadvantages from a gender equality perspective. First, any disadvantage in the labour market from breaksaround childbirth, now borne by women, would be more equally shared by parents (McGuinness et al.,2009). Secondly, it would be likely to encourage sharing of childcare by parents. Previous research from time-use data in Ireland has shown that there are marked gender inequalities in the care of children in Ireland,with mothers doing the vast majority of caring (McGinnity and Russell, 2008).
7.2.2 NON-PARENTAL CHILDCARE Cost of childcareThe cost of paid childcare for parents of infants is very high in Ireland, compared to many other EUcountries. The fact that it is mainly low-income families who choose relative care suggests that cost plays asignificant role in choosing the type of care for infants. It is likely that if costs were lower through someform of state subsidy, this would facilitate choice for parents.
Poverty among families with young children is high in Ireland, and has increased during the recession(Watson et al., 2012). To the extent that employment protects families from income poverty and deprivation,for both lone parents and low-income couples, high childcare costs are a likely disincentive to take up paidemployment for mothers of pre-school children who do not have the option of relative care, and this hasimplications for income poverty.
To the extent that women are penalised in wage terms for career interruptions around childbirth, providinghigh-quality, affordable childcare would promote women’s continuity in employment, a key factor in thegender wage gap in Ireland (McGuinness et al., 2009). In addition, given that childcare costs represent aparticularly high proportion of costs for low-wage families, providing affordable childcare should reducelabour-market inequality by promoting continuity of employment, particularly for low-qualified mothers. Ofcourse, preferences and career motivation play an important role in employment choices, and some parentswill choose to trade off time with children for current income, but the current system, with very highchildcare costs, restricts choice.
By and large the State pays for children’s education from age 4-5 to 17-18 in Ireland. If they don’t have arelative nearby willing to care for their children, parents pay the price for the care and education of pre-school children.
Quality of care Quality of care has been shown to be a key factor in child developmental outcomes (Melhuish, 2004). Asdiscussed in Chapter 1, research from the US (NICHD, 2003c) suggests that long hours in non-parental carefor infants may be negative, but it also found no harmful effects where quality is high. In particular,disadvantaged children may show cognitive and emotional benefits from high-quality care (Philips and
Growing Up in Ireland • MOTHERS’ RETURN TO WORK AND CHILDCARE CHOICES FOR INFANTS IN IRELAND • REPORT 2
82
Lowenstein, 2011). Thus quality of non-parental care for infants is an extremely important issue becausepositive effects for child development have been found that compensate for disadvantage.
Previous research has also demonstrated a clear link between the quality of staff, in terms of training andqualification, and the quality of service provision, noted in Chapter 2 (e.g. OECD, 2006; EuropeanCommission, 2011). Yet there are indications that the qualifications of those caring for infants are variableand overall not high in Ireland. To advance the quality of care, it would be beneficial to promote trainingand qualification of childcare workers.
The importance of paid childminders for the care of infants in Ireland is not well recognised, as muchliterature on childcare focuses on centre-based care, and some debates on childcare do not recognise thesignificance of the role of childminders. Given the importance of quality of care for child development notedin the international literature, this raises the issue of childcare qualifications for childminders. Currentlychildminders caring for three children or fewer preschool children are exempt from regulation; only thosecaring for four or five preschool children are required to notify the HSE. There is no regulation of afterschoolcare by childminders. Given that the majority of non-relatives care for three children or fewer, considerationshould be given to the regulatory requirements and training supports for childminders.
7.3 AVENUES FOR FUTURE RESEARCH
While this report focused on the care of infants in the first nine months, data from the three-year cohort ofGrowing Up in Ireland will allow researchers to build on this analysis to further our knowledge aboutchildcare for young children in Ireland. Key questions of policy concern relate to developmental outcomesassociated with non-parental childcare. There are several outcome measures for three-year-olds, such asdirect measures of cognitive ability using the British Ability Scales, and the Strengths and DifficultiesQuestionnaire measuring behavioural outcomes (see Williams et al., forthcoming). Is participation in non-parental childcare in Ireland in the first three years of life associated with differential cognitive orbehavioural outcomes at age three? Does this vary by type of care (home-based versus centre-based) andquality of childcare? Are there different associations depending on the hours of non-parental care and theage the child started in a care arrangement? Research could also examine whether these effects vary byfamily socio-economic status and home learning environment, as has been found in other countries (Philipsand Lowenstein, 2011).
Of course, even before considering outcomes for three-year-olds, there are still many interesting questionspertaining to the Infant Cohort. An issue closely related to the rise in maternal employment is work-lifeconflict (McGinnity and Whelan, 2009), which can have a detrimental impact on child outcomes (Gornick andMeyers, 2003). Yet work-life conflict is only observed for mothers who are working, so one could alsoexamine parental stress more generally, and whether there is an association with mothers’ employment andparental stress.
A further possibility would be to examine gender roles in caring at nine months. Secondary caregivers incouples (mostly fathers) were asked who performed various caring duties with the infant, ranging frombasic things such as feeding and bathing to reading to the child. It would be interesting to investigatevariations between couples in caring tasks, and whether having the infant in non-parental childcare has anyeffect on the sharing of caregiving.
It is clear that there is considerable potential in the data from Growing Up in Ireland to enhance ourunderstanding of the use of non-parental childcare and its impact on young children in Ireland. This report isa first step in furthering that knowledge.
Chapter 7 • CONCLUSION
83
84
Growing Up in Ireland • MOTHERS’ RETURN TO WORK AND CHILDCARE CHOICES FOR INFANTS IN IRELAND • REPORT 2
REFERENCES
Bates, J. E., Freeland, C.B., & Lounsbury, M. L. (1979). Measurement of infant difficulties. Child Development,50, 794-803.
Baxter, J. (2008). Is money the main reason mothers return to work after childbearing? Journal of PopulationResearch, 25, 141-160.
Bell, D.M., Gleiber, D.W., Atkins Mercer, A. et al. (1989). Illness associated with child day care: A study ofincidence and cost. American Journal of Public Health, 79, 479-484.
Belsky, J. (1988). The 'effects' of infant day care reconsidered. Early Childhood Research Quarterly, 3, 235-272.
Belsky, J. (2005). Childcare and its impact on young children (0-2). Encyclopedia on Early ChildhoodDevelopment. www.child-encyclopedia.com/pages/PDF/Belsky/ANC-xp_rev-child_care.pdf.
Berger, L., Hill, J. and Waldfogel, J. (2005). Maternity leave, early maternal employment and child health anddevelopment in the US. The Economic Journal, 115, F29–F47.
Berger, L. & Waldfogel, J. (2004). Maternity leave and the employment of new mothers in the United States.Journal of Population Economics, 17, 331-349.
Blossfeld, H.P. & Drobnic, S. (eds) (2001). Careers of couples in contemporary society. Oxford: OxfordUniversity Press.
Bronfenbrenner, U. & Morris, P. (2006). The bioecological model of human development. In R.M.V.Lerner, W. Damon, & R.M.S. Lerner (Eds.), Handbook of Child Psychology, Vol. 1: Theoretical Models ofHuman Development (pp. 793-828). Hoboken, NJ: Wiley.
Callan, T., Nolan, B., Walsh, J., Whelan, C.T, & Maitre, B. (2008). Tackling Low Income and Deprivation:Developing Effective Policies. Dublin: ESRI.
Central Statistics Office (2009). Quarterly National Household Survey: Childcare, Quarter 4, 2007. Dublin:Central Statistics Office.
Central Statistics Office (2011). Survey on Income and Living Conditions (SILC): Preliminary Results, 2010.Dublin: Central Statistics Office.
Clarke-Stewart, K. A. (1987). Predicting child development from child care forms and features: The ChicagoStudy. In D. Phillips (Ed.), Quality in child care: What does the research tell us? (105-120). Washington, DC:National Association for the Education of Young Children.
Cole Johnson, C., Ownby, D. R., Hensley Alford, S., et al. (2005). Antibiotic exposure in early infancy and riskfor childhood atopy. Journal of Allergy and Clinical Immunology, 115, 1218-1244.
Department of Education and Science (2009). Developing the workforce in the early childhood care andeducation sector. Background discussion paper. Dublin: DES.
Department of Health and Children (2006). Child Care (Pre-School Services) Regulations 2006. Dublin: TheStationery Office.
85
REFERENCES
Department of Social and Family Affairs (2006). Government Discussion Paper: Proposal for Supporting LoneParents, http://www.welfare.ie/EN/Policy/PolicyPublications/Families/Documents/prop_lp.pdf
DeRigne, L. & Porterfield, S. (2010). Employment change and the role of the medical home for married andsingle-mother families with children with special health care needs in Social Science & Medicine 70: 631–641
European Commission (2011). CoRe. Competence requirements in Early Childhood Education and Care.http://ec.europa.eu/education/more-information/doc/2011/core_en.pdf
Fahey, T. & Russell, H. (2006). ‘Childcare’ in Morgenroth, E. and Fitz Gerald, J. (eds) ExAnte Evaluation of theInvestment Priorities for the National Development Plan 2007-2013, ESRI Policy research Series No. 59.
Feagans, L. V., Kipp, E., & Blood, I. (1994). The effect of otitis media on the attention skills of day-care settingtoddlers. Developmental Psychology, 30, 701-708.
Gilham, C., Peto, J., Simpson, J. R. E., Eden, T. O. B., Greaves, M. F., & Alexander, F. E. (2005). Day care ininfancy and risk of childhood acute lymphoblastic leukemia: findings from UK case-control study. BritishMedical Journal Online, 330.
Gornick, J.C. & Meyers M.K. (2003). Families That Work - Policies for Reconciling Parenthood andEmployment. New York: Russell Sage Foundation.
Greenberger, E., Goldberg, W.A., Crawford, T.J. & Granger, J. (1988). Beliefs about the consequences ofmaternal employment for children. Psychology of Women Quarterly, 12, 35-59.
Gregg, P. & Waldfogel, J. (eds.) (2005). Parental Leave, Early Maternal Employment and Child Outcomes. TheEconomic Journal, Special Issue. Vol. 115.
Gregg, P., Washbrook, E., Propper, C. and Burgess, S. (2005) The effects of a mother’s return to work decisionon child development in the UK, The Economic Journal, 115, F48–F80.
Gunnar, M. Kryzer, E. Van Ryzin, M. & Philips, D. (2010) The rise in cortisol in family day care: Associationswith aspects of care quality, child behavior, and child sex. Child Development, 81, 3, 851-869
Hakim, C. (2004). Key Issues in Women’s Work: Female Diversity and the Polarisation of Women’sEmployment, 2nd edition, London: Glasshouse Press.
Han, W., Ruhm, C. Waldfogel, J. & Washbrook, E. (2008). The timing of mothers’ employment afterchildbirth. Monthly Labor Review, June 2008.
Hardy, A.M. & Fowler, M.G. (1993). Child care arrangements and repeated ear infections in young children.American Journal of Public Health, 83, 9, 1321-1325.
Harrison, L.J. (2008). Does child care quality matter? Associations between socio-emotional development andnon-parental child care in a representative sample of Australian children. Family Matters, 79, 14-25.
Harrison, L.J., Ungerer, J.A., Smith, G.J. et al. (2009). Child care and early education in Australia: TheLongitudinal Study of Australian Children. Social Policy Research Paper No.40, Australian GovernmentDepartment of Families, Housing, Community Services and Indigenous Affairs.
Hildesheim, M.E., Hoffmann, H.J. & Overpeck, M.D. (1999). Frequent ear infections in association with child-care characteristics, based on the 1988 Child Health Supplement to the National Health Interview Survey.Paediatric and Perinatal Epidemiology, 13, 4, 466-472.
Hong, L., Levy, S. M., Warren, J. J., Dawson, D. V., Bergus, G. R., & Wefel, J. S. (2005). Association ofamoxicillin use during early childhood with developmental tooth enamel defects. Archives of Pediatrics andAdolescent Medicine, 159, 943-948.
Howes, C. (1990). Can the age of entry into child care and the quality of child care predict adjustment tokindergarten? Developmental Psychology, 26, 1-12.
Johansen, A. S., Leibowitz, A., & Waite, L. J. (1996). The importance of child-care characteristics to choice ofcare. Journal of Marriage and the Family, 58, 795–772.
Kaila, B. & Taback, S. P. (2001). The effect of day care exposure on the risk of developing Type 1 diabetes: Ameta-analysis of case-control studies. Diabetes Care, 24, 1353-1358.
Kamper-Jorgensen, M., Geisler Andersen, L., Simonsen, J. & Sorup, S. (2008). Child care is not a substantialrisk factor for gastrointestinal infection hospitalization. Pediatrics, 122, e1168-e1173.
Kamper-Jorgensen, M., Wohlfahrt, J., Simonsen, J., Gronbaek, M. & Stabell Benn, C. (2006). Population-based study of the impact of childcare attendance on hospitalizations for acute respiratory infections.Pediatrics, 118, 1439-1446.
Lamb, M. E. & Ahnert, L. (2006). Nonparental child care: Context, concepts, correlates, and consequences. InK.A. Renninger & I. E. Sigel (Eds.), Handbook of Child Psychology (6th ed., pp. 950-1016). Hoboken, NJ: Wiley.
La Valle, I., Clery, E. & Huerta, M.C. (2008). Maternity Rights and Mothers’ Employment Decisions.Department of Work and Pensions.
Layte, R. and McCrory, C. (forthcoming) Maternal Health Behaviours and Child Growth in Infancy: Analysesof the Infant Cohort of the Growing Up in Ireland Study. Dublin: The Stationery Office.
Lindberg, L. D. (1996). Women's decisions about breastfeeding and maternal employment. Journal ofMarriage and the Family, 58, 1, 239-251
Louhiala, P.J., Jaakola, N., Ruotsalainen, R. & Jaakola, J.J. (1997). Day-care centers and diarrhea: A publichealth perspective. Journal of Pediatrics, 131, 3, 476-479.
Mahony, K. & Hayes, N. (2006). Researching quality in Irish early education In N. Hayes (ed) ContemporaryIssues in Early Childhood Education and Care. Proceedings of OMEP Annual Conference. Cork: OMEP,Ireland.
Marra, F., Lynd, L., Coombes, M., et al (2006). Does antibiotic exposure during infancy lead to developmentof asthma? A systematic review and metaanalysis. Chest, 129, 610-618.
McCulloch, A. & S. Dex (2001). Married women’s employment patterns in Britain. In H.P. Blossfeld & S.Drobnic(Eds.), S. Careers of couples in contemporary society. Oxford: Oxford University Press.
Growing Up in Ireland • MOTHERS’ RETURN TO WORK AND CHILDCARE CHOICES FOR INFANTS IN IRELAND • REPORT 2
86
McGinnity, F. and Russell, H. (2008). Gender Inequalities in Time Use: The Distribution of Caring, Houseworkand Employment Among Women and Men in Ireland. Dublin: Equality Authority/ESRI.
McGinnity, F. and Whelan, C. T. (2009). Reconciling work and family life: Evidence from the European SocialSurvey. Editorial essay in a special issue of Social Indicators Research, 93, 3, 433-445
McGuinness, S., Kelly, E., Callan, T. and O’Connell, P.J. (2009). The Gender Wage Gap in Ireland: Evidencefrom the National Employment Survey 2003. Dublin: The Equality Authority/ESRI.
McRae, S. (1993). Returning to work after childbirth: Opportunities and inequalities. European SociologicalReview, 9, 2, 125-138
Melhuish, E. (2004). A Literature Review of the Impact of Early Years Provision on Young Children. London:National Audit Office.
Melhuish, E. C., Moss, P., Mooney, A., & Martin, S. (1991). How similar are day-care groups before the start ofday care? Journal of Applied Developmental Psychology, 12, 331–346.
Moss, P. (ed) (2010). International Review of Leave Policies and Related Research 2010. Institute of EducationUniversity of London Employment Relations Research Series No. 115. London: Institute of Education.
Moss, P. (ed) (2012). International Review of Leave Policies and Related Research 2012. InternationalNetwork on Leave Policies and Research.
Nafstad, P., Hagen, J.A., Oie, L., Magnus, P. & Jaakola, J.J. (1999). Day care centers and respiratory health.Pediatrics, 103, 753-758.
National Council for Curriculum and Assessment (2009). Aistear, the Framework for Early Learning. Dublin:NCCA.
National Institute of Child Health and Human Development Early Child Care Research Network. (1997). Theeffects of infant child care on infant-mother attachment security: Results of the NICHD Study of Early ChildCare. Child Development, 68, 5, 860-879.
National Institute of Child Health and Human Development Early Child Care Research Network (2001). Childcare and communicable illnesses: Results from NICHD Study of Early Child Care. Archives of Pediatric andAdolescent Medicine, 155, 481-488.
National Institute of Child Health and Human Development Early Child Care Research Network. (2002). ChildCare Structure>Process>Outcome: Direct and indirect effects of caregiving quality on young children'sdevelopment. Psychological Science,13, 199-206.
National Institute of Child Health and Human Development Early Child Care Research Network (2003a). TheNICHD Study of Early Child Care: Contexts of development and developmental outcomes over the first sevenyears of life. In J. Brooks-Gunn, A. S. Fuligni, & L. J. Berlin (Eds.), Early childhood development in the 21stcentury: Profiles of current research initiatives (pp. 182-201). New York: Teachers College Press.
National Institute of Child Health and Human Development Early Child Care Research Network (2003b).Child care and communicable illnesses in children aged 37 to 54 months. Archives of Pediatric andAdolescent Medicine, 157, 196-200.
REFERENCES
87
Growing Up in Ireland • MOTHERS’ RETURN TO WORK AND CHILDCARE CHOICES FOR INFANTS IN IRELAND • REPORT 2
88
National Institute of Child Health and Human Development Early Child Care Research Network (2003c). Doesamount of time spent in child care predict socioemotional adjustment during the transition to kindergarten?Child Development 74, 4, 976-1005
Oberhuemer, P. (2005). Conceptualising the early childhood pedagogue: policy approaches and issues ofprofessionalism. European Early Childhood Education Research Journal. 13, 1, 5-16
Ondrich, J., Spiess, K. and Yang, Q. (1996). Barefoot and in a German kitchen: Federal parental leave andbenefit policy and the return to work after childbirth in Germany. Journal of Population Economics, 9, 3,247-266
Organisation for Economic Cooperation and Development (2006). Starting Strong II Early ChildhoodEducation and Care. Paris: OECD.
Organisation for Economic Cooperation and Development (2007). Babies and Bosses: Reconciling Work andFamily life. A Synthesis of Findings for OECD Countries. Paris: OECD.
Organisation for Economic Cooperation and Development (2009). Doing Better for Children. Paris: OECD.
Pedersen, L., Weise, H., Jacobs, S. & White, M, (2000). Lone Mothers’ Poverty and Employment, Oxford:Oxford University Press.
Philips, D. & Lowenstein, A. (2011). Early Care, Education, and Child Development, Annual Review ofPsychology, 62, 483-500.
Powers, E. (2001). New estimates of the impact of child disability on maternal employment. AmericanEconomic Review, 2001, 91, 2, 135-139
Pungello, E.P. & Kurtz-Costes, B. (1999). Why and how working women choose child-care: A review with afocus on infancy. Developmental Review, 19, 31-96.
Russell, H. & Banks, J. (2011). Pregnancy and Employment: A Literature Review. HSE Crisis PregnancyProgramme and the Equality Authority.
Russell, H., Watson, D. & Banks, J. (2011). Pregnancy at Work: A National Survey. HSE Crisis PregnancyProgramme and the Equality Authority.
Russell, H. & McGinnity, F. (2011). Workplace Equality in the Recession? The Incidence and Impact of EqualityPolicies and Flexible Working. Dublin: Equality Authority/ESRI.
Russell, H., McGinnity, F., Callan, T. & Keane, C. (2009). A Woman’s Place? Female Participation in the PaidLabour Market. Dublin: Equality Authority/ESRI.
Russell, H., Halpin, B., Strandh, M. & Zielfe, A (2006). Comparing the Labour Market Effects of Childbirth inIreland, Sweden, the UK and Germany. ESRI Working Paper No. 170.
Sammons, P., Sylva, K., Melhuish, E. C., Siraj-Blatchford, I., & Elliot, K. (2003). The Effective Provision ofPre-school Education Project, Technical Paper 8b: Measuring the impact on children’s social behaviouraldevelopment over the pre-school years. London: Institute of Education/Department of Education andScience.
Saurel-Cubizolles, M.J., Romito, P., Escriba-Aguir, V., Lelong, N., Mas Pons, R. & Ancel, P.-Y. (1999). Returningto work after childbirth in France, Italy and Spain. European Sociological Review, 15, 179-194.
Shope, T. R. & Aronson, S. (2005). Improving the health and safety of children in nonparental early educationand child care. Pediatrics in Review, 26, 86-95.
Smeaton, D. (2006). Work Return Rates after Childbirth in the UK – Trends, Determinants and Implications: AComparison of Cohorts Born in 1958 and 1970. Work, Employment and Society, Vol. 20, No. 5, pp. 5-25.
Start Strong (2010). Children 2020. Dublin: Start Strong.
Sylva, K., Stein, A., Leach, P., Barnes, J., Malmberg L-E & the FCCC-team (2007). Family and child factorsrelated to the use of non-maternal infant care: An English study. Early Childhood Research Quarterly, 22,118-136.
UNICEF (2008). The Child Care Transition: A League Table of Early Childhood Education and Care inEconomically Advanced Countries. Florence: UNICEF Innocenti Research Centre.
Waldfogel, J., Higuchi, Y. & Abe, M. (1999). Family leave policies and women's retention after childbirth:Evidence from the United States, Britain and Japan. Journal of Population Economics,12, 523-545.
Watson, D., Maitre, B & Whelan, C.T. (2012). Work and Poverty in Ireland: An Analysis of CSO Survey onIncome and Living Conditions 2004-2010. Dublin: ESRI/Department of Social Protection.
Williams, J., Greene, S., McNally, S., Murray, A. & Quail, A. (2010). Growing Up in Ireland – NationalLongitudinal Study of Children: The Infants and Their Families. Report 1. Dublin: The Stationery Office.
Williams, J., Murray, A., McCrory C. & McNally, S. (forthcoming). The Lives of 3-Year-Olds, Growing Up inIreland – National Longitudinal Study of Children. Dublin: The Stationery Office.
REFERENCES
89

Design and production: www.slickfish.ie0713

If you would like further information aboutGrowing Up in Ireland, please visit
www.growingup.ie
e-mail [email protected]
or freephone 1800 200 434
BAILE ÁTHA CLIATH
ARNA FHOILSIÚ AG OIFIG AN tSOLÁTHAIR
Le ceannach díreach ó
FOILSEACHÁIN RIALTAIS,
52 FAICHE STIABHNA, BAILE ÁTHA CLIATH 2
(Teil: 01 – 6476834 nó 1890 213434; Fax 01 – 6476843)
nó trí aon díoltóir leabhar.
DUBLIN
PUBLISHED BY THE STATIONERY OFFICE
To be purchased from
GOVERNMENT PUBLICATIONS,
52 ST. STEPHEN'S GREEN, DUBLIN 2.
(Tel: 01 – 6476834 or 1890 213434; Fax: 01 – 6476843)
or through any bookseller.
REP
OR
T 2IN
FAN
T CO
HO
RT
GR
OW
ING
UP
IN IR
ELAN
DM
OTHER
S’ RETU
RN
TO W
OR
K A
ND
CHILD
CAR
E CHO
ICES FOR
INFA
NTS IN
IRELA
ND
National Longitudinal Study of Children
Growing Up in Ireland
MOTHERS’ RETURN TO WORK AND CHILDCARECHOICES FOR INFANTS IN IRELAND
INFANT COHORT
REPORT 2
Related Documents