GEOTECHNICAL ENGINEERING LAB MANUAL Department of Civil Engineering B.V. Raju Institute of Technology, Narsapur

Welcome message from author
This document is posted to help you gain knowledge. Please leave a comment to let me know what you think about it! Share it to your friends and learn new things together.
Transcript

GEOTECHNICAL ENGINEERING LAB MANUAL
Department of Civil Engineering B.V. Raju Institute of Technology, Narsapur
LIST OF EXPERIMENTS
1. Atterberg’s Limits (LL & PL)
2. Field Density - Core Cutter and Sand Replacement Method
3. Grain size Analysis
4. Permeability of Soil - Constant and Variable Head Test
5. Compaction Test
6. CBR Test
7. Consolidation Test
8. Unconfined Compaction Test
9. Tri-axial Compression Test
10. Direct Shear Test
11. Vane shear test
Note: Any eight experiments may be completed

Department of Civil Engineering, B.V. Raju Institute of Technology (BVRIT)
GEOTECHNICAL ENGINEERING LAB
INDEX
S. No. Experiment Page No. Date Marks Sign.
Atterberg Limits
1 Liquid Limit Test
2 Plastic Limit Test
Field density
3 Core cutter Method
4 Sand Replacement Method
Grain Size Analysis
5 Sieve Analysis
Permeability of Soil
6 Constant Head Test
7 Variable Head Test
Shear Strength of Soil
8 Unconfined compression test
9 Direct shear test
Compaction Tests
10 Compaction test
11 CBR Test
Distribution of Marks:
Lab Record: 15
Internal Exam: 10
Total Marks: 25
Department of Civil Engineering, B.V. Raju Institute of Technology (BVRIT)
Experiment No.: 1 & 2
DETERMINATION OF LIQUID LIMIT AND PLASTIC LIMIT OF SOIL
AIM
To determine liquid limit and plastic limit of the given soil sample and to find the flow index and
toughness index of the soil.
THEORY AND APPLICATION
Liquid limit is the water content expressed in percentage at which the soil passes from zero
strength to an infinitesimal strength, hence the true value of liquid limit cannot be determined. For
determination purpose liquid limit is that water content at which a part of soil, cut by a groove of
standard dimensions, will flow together for a distance of 12.5mm under an impact of 5 blows in a
standard liquid limit apparatus with a height of fall of 1cm.
The moisture content expressed in percentage at which the soil has the smallest plasticity is
called the plastic limit. Just after plastic limit the soil displays the properties of a semi solid
For determination purposes the plastic limit it is defined as the water content at which a soil just
begins to crumble when rolled into a thread of 3mm in diameter.
The values of liquid limit and plastic limit are directly used for classifying the fine grained soils.
Once the soil is classified it helps in understanding the behavior of soils and selecting the suitable
method of design construction and maintenance of the structures made-up or and resting on soils.
APPARATUS
1. Casagrande Liquid limit device 8. Moisture content bins
2. Grooving tool 9. Drying oven
3. Glass plate 10. Sensitive balance
4. 425 micron sieve
5. Spatula
6. Mixing bowl
7. Wash bottle
PROCEDURE
(A) LIQUID LIMIT
1. Adjust the cup of liquid limit apparatus with the help of grooving tool gauge and the
adjustment plate to give a drop of exactly 1cm on the point of contact on the base.
2. Take about 120gm of an air dried soil sample passing 425µ sieve.
3. Mix the soil thoroughly with some distilled water to form a uniform paste.

Department of Civil Engineering, B.V. Raju Institute of Technology (BVRIT)
4. Place a portion of the paste in the cup of the liquid limit device; smooth the surface with
spatula to a maximum depth of 1 cm. Draw the grooving tool through the sample along
the symmetrical axis of the cup, holding the tool perpendicular to the cup.
5. Turn the handle at a rate of 2 revolutions per second and count the blows until the two
parts of the soil sample come in contact with each other, at the bottom of the groove,
along a distance of 10mm.
6. Transfer about 15 gm of the soil sample forming the wedge of the groove that flowed
together to a water content bin, and determine the water content by oven drying.
7. Transfer the remaining soil in the cup to the main soil sample in the bowl and mix
thoroughly after adding a small amount of water.
8. Repeat steps 4 – 7 .Obtain at least five sets of readings in the range of 10 – 40 blows.
9. Record the observations in the Table.
(B) PLASTIC LIMIT
1. Take about 30g of air dried soil sample passing through 425µ sieve.
2. Mix thoroughly with distilled water on the glass plate until it is plastic enough to be shaped
into a small ball.
3. Take about 10g of the plastic soil mass and roll it between the hand and the glass plate to
form the soil mass into a thread of as small diameter as possible. If the diameter of the
thread becomes less than 3 mm without cracks, it indicates that the water added to the
soil is more than its plastic limit, hence the soil is kneaded further and rolled into thread
again.
4. Repeat this rolling and remoulding process until the thread start just crumbling at a
diameter of 3mm.
5. If the soil sample starts crumbling before the diameter of thread reaches 3mm (i.e. when
the diameter is more than 3mm) in step 3, it shows that water added in step 2 is less than
the plastic limit of the soil. Hence, some more water should be added and mixed to a
uniform mass and rolled again, until the thread starts just crumbling at a dia of 3mm.
6. Collect the piece of crumbled soil thread at 3mm diameter in an airtight container and
determine moisture content.
7. Repeat this procedure on the remaining masses of 10g.
8. Record the observations in Table and obtain the average value of plastic limit.
Department of Civil Engineering, B.V. Raju Institute of Technology (BVRIT)
Experiment No.: 3
DETERMINATION OF FIELD DENSITY (UNIT WEIGHT) OF SOIL
BY CORE CUTTER METHOD
AIM
To determine the fields density of soil by core cutter method.
THEORY AND APPLICATIONS
Unit weight is designed as the weight per unit volume. Here the weight and volume of soil
comprise the whole soil mass. The voids in the soil may be filled with both water and air or only
air or only water consequently the soil may be wet, dry or saturated. In soils the weight of air is
considered negligible and therefore the saturated unit weight is maximum, dry unit weight is
minimum and wet unit weight is in between the two. If soils are below water table, submerged unit
weight is also estimated.
Unit weight of soil reflects the strength of soil against compression and shear. Unit weight of soil
is used in calculating the stresses in the soil due to its overburden pressure. It is useful in
estimating the bearing capacity and settlement of foundations. Earth pressure behind the
retaining walls and in cuts is checked with the help of unit weight of the associated soils. It is the
unit weight of the soil which controls the field compaction and it helps in the design of
embankment slopes. Permeability of soil depends on its unit weight .It may be noted here that , in
the field the unit weight refers to dry unit weight only because the wet unit weight of soil at
location varies from season to season and based on the fluctuations of the local water table level
and surface water.
APPARATUS
1. Cylindrical core cutter
2. Steel rammer
3. Steel dolly
4. Balance
5. Moisture content cups

Department of Civil Engineering, B.V. Raju Institute of Technology (BVRIT)
PROCEDURE
1. Measure the height (h) and internal diameter (d) of the core cutter and apply grease to
the inside of the core cutter.
2. Weigh the empty core cutter (W1).
3. Clean and level the place where density is to be determined.
4. Drive the core cutter, with a steel dolly on its top in to the soil to its full depth with the help
of a steel rammer.
5. Excavate the soil around the cutter with a crow bar and gently lift the cutter without
disturbing the soil in it.
6. Trim the top and bottom surfaces of the sample and clean the outside surface of the
cutter.
7. Weigh the core cutter with soil (W2).
8. Remove the soil from the core cutter, using a sample ejector and take a representative
soil sample from it to determine the moisture content (w).
Department of Civil Engineering, B.V. Raju Institute of Technology (BVRIT)
Experiment No.: 4
DETERMINATION OF FIELD DENSITY (UNIT WEIGHT) OF SOIL
BY SAND REPLACEMENT METHOD
AIM
To determine the field density of soil at a given location by sand replacement method
APPARATUS
1. Sand pouring Cylinder
2. Calibrating can
3. Metal tray with a central hole
4. Dry sand (Passing through 600 micron sieve )
5. Balance
6. Metal tray
7. Scraper tool
8. Glass plate
THEORY AND APPLICATIONS
In core cutter method the unit weight of soil obtained from direct measurement of weight and
volume of soil obtained from field. Particularly for sandy soils the core cutter method is not
possible. In such situations the sand replacement method is employed to determine the unit
weight. In sand replacement method a small cylindrical pit is excavated and the weight of the soil
excavated from the pit is measured. Sand, whose density is known, is filled into the pit. By
measuring the weight of sand required to fill the pit and knowing the density of soil, volume of the
pit is calculated .Knowing the weight of soil excavated from the pit and the volume of pit the
density of soil is calculated. Therefore in this experiment there are two stages (1) Calibration of
sand density and (2) Measurement of soil density.
PROCEDURE
CALIBRATION OF SAND DENSITY
1. Measure the internal dimensions diameter (d) and height (h) of the calibrating can and
compute its internal volume V.

Department of Civil Engineering, B.V. Raju Institute of Technology (BVRIT)
2. Fill the sand pouring cylinder (SPC) with sand with 1 cm top clearance to avoid any
spillover during operation and find its weight (W1)
3. Place the SPC on a glass plate, open the slit above the cone by operating the valve and
allow the sand to run down. The sand will freely run down till it fills the conical portion.
When there is no further downward movement of sand in the SPC, close the slit.
4. Find the weight of the SPC along with the sand remaining after filling the cone (W2)
5. Place the SPC concentrically on top of the calibrating can. Open the slit to allow the sand
to rundown until the sand flow stops by itself. This operation will fill the calibrating can and
the conical portion of the SOC. Now close the slit and find the weight of the SPC with the
remaining sand(W3)
MEASUREMENT OF SOIL DENSITY
1. Clean and level the ground surface where the field density is to be determined.
2. Place the tray with a central hole over the portion of the soil to be tested.
3. Excavate a pit into the ground, through the hole in the plate, approximately 12cm deep
(Close the height of the calibrating can) the hole in the tray will guide the diameter of the
pit to be made in the ground.
4. Collect the excavated soil into the tray and weigh the soil (W)
5. Determine the moisture content of the excavated soil.
6. Place the SPC, with sand having the latest weight of W3, over the pit so that the base of
the cylinder covers the pit concentrically.
7. Open the slit of the SPC and allow the sand to run into the pit freely, till there is no
downward movement of sand level in the SPC and then close the slit.
8. Find the weight of the SPC with the remaining sand W4.

Department of Civil Engineering, B.V. Raju Institute of Technology (BVRIT)
Experiment No.: 5
DETERMINATION OF GRAIN SIZE DISTRIBUTION OF SOIL
BY SIEVE ANALYSIS
AIM
To conduct sieve analysis of soil to classify the given coarse grained soil.
THEORY AND APPLICATION
Grain size analysis is used in the engineering classification of soils. Particularly coarse grained
soils. Part of suitability criteria of soils for road, airfield, levee, dam and other embankment
construction is based on the grain size analysis. Information obtained from the grain size analysis
can be used to predict soil water movement. Soils are broadly classified as coarse grained soils
and fine grained soils. Further classification of coarse grained soils depends mainly on grain size
distribution and the fine grained soils are further classified based on their plasticity properties. The
grain size distribution of coarse grained soil is studied by conducting sieve analysis.
APPARATUS
1. A set of Sieves 4.75 mm, 2.36 mm ,1.18 mm ,0.60mm, 0.30 mm 0.15 mm 0.075mm
including lid and pan
2. Tray
3. Weighing Balance
4. Oven
5. Sieve Shaker
6. Brush
PROCEDURE
1. Weigh 500gms of oven dry soil sample, of which grain size distribution has to be studied.
2. Take the soil sample into 75µ sieve.
3. Wash the soil sample keeping it in the sieve. Washing of soil sample means: place the
soil in the sieve and gently pour water over the soil so that it wets the soil and remove the
fine particles in the form of mud, leaving only the sand and gravel size particles in the
sieve.
4. Transfer the soil retained in the sieve after washing into a tray. Invert the sieve into the
tray and pour water gently so that all the soil particles retained in the sieve is transferred it
to the tray.
5. Keep the tray in the oven for 24 hours at 105ºc to dry it completely.
6. Weigh the oven dry soil in the tray (W)
7. The weight of the fine grained soil is equal to 500 – W
8. Clean the sieve set so that no soil particles were struck in them.
Department of Civil Engineering, B.V. Raju Institute of Technology (BVRIT)
9. Arrange the sieves in order such that coarse sieve is kept at the top and the fine sieve is
at the bottom. Place the closed pan below the finest sieve.
10. Take the oven dried soil obtained after washing into the top sieve and keep the lid to
close the top sieve.
11. Position the sieve set in the sieve shaker and sieves the sample for a period of 10
minutes.
12. Separate the sieves and weigh carefully the amount of soil retained on each sieve, This is
usually done by transferring the soil retained on each sieve on a separate sieve of paper
and weighing the soil with the paper.
13. Enter the observations in the Table and calculate the cumulative percentage of soil
retained on each sieve.
14. Draw the grain size distribution curve between grain size on log scale on the abscissa
and the percentage finer on the ordinate.

Department of Civil Engineering, B.V. Raju Institute of Technology (BVRIT)
Experiment No.: 6
DETERMINATION OF PERMEABILITY OF SOIL
BY CONSTANT HEAD METHOD
AIM
To determine the coefficient of permeability of the soil by conducting constant head method.
THEORY AND APPLICATION
The property of the soil which permits water to percolate through its continuously connected voids
is called its permeability .Water flowing through the soil exerts considerable seepage forces which
has direct effect on the safety of hydraulic structures. The quantity of water escaping through and
beneath and earthen dam depends on the permeability of the embankment and the foundation
soil respectively. The rate of settlement of foundation depends on the permeability properties of
the foundation soil.
APPARATUS
1. Permeability apparatus with accessories
2. Stop watch
3. Measuring jar
PROCEDURE
1. Compact the soil into the mould at a given dry density and moisture content by a suitable
device. Place the specimen centrally over the bottom porous disc and filter paper.
2. Place a filter paper, porous stone and washer on top of the soil sample and fix the top
collar.
3. Connect the stand pipe to the inlet of the top plate. Fill the stand pipe with water.
4. Connect the reservoir with water to the outlet at the bottom of the mould and allow the
water to flow through and ensure complete saturation of the sample.
5. Open the air valve at the top and allow the water to flow out so that the air in the cylinder
is removed.
6. When steady flow is reached, collect the water in a measuring flask for a convenient time
intervals by keeping the head constant. The constant head of flow is provided with the
help of constant head reservoir
7. Repeat the for three more different time intervals

Department of Civil Engineering, B.V. Raju Institute of Technology (BVRIT)
OBSERVATIONS AND CALCULATIONS
Calculate the coefficient of permeability of soil using the equation
K = QL / Ath
Where
K = Coefficient of permeability
Q = Quantity of water collected in time t sec (cc)
t = Time required (sec)
A = Cross sectional area of the soil sample (sq.cm)
h = Constant hydraulic head (cm)
L = Length of soil sample (cm)
Department of Civil Engineering, B.V. Raju Institute of Technology (BVRIT)
Experiment No.: 7
DETERMINATION OF PERMEABILITY OF SOIL
BY VARIABLE HEAD METHOD
AIM
To determine the coefficient of permeability of a given soil sample by conducting Variable head
test.
THEORY AND APPLICATION
The property of the soil which permits water to percolate through its continuously connected voids
is called its permeability .Water flowing through the soil exerts considerable seepage forces which
has direct effect on the safety of hydraulic structures. The quantity of water escaping through and
beneath and earthen dam depends on the permeability of the embankment and the foundation
soil respectively. The rate of settlement of foundation depends on the permeability properties of
the foundation soil.
APPARATUS
1. Permeability apparatus with accessories
2. Stop watch
3. Measuring jar
4. Funnel
PROCEDURE
1. Compact the soil into the mould at a given dry density and moisture content by a suitable
device. Place the specimen centrally over the bottom porous disc and filter paper.
2. Place a filter paper, porous stone and washer on top of the soil sample and fix the top
collar.
3. Connect the stand pipe to the inlet of the top plate. Fill the stand pipe with water.
4. Connect the reservoir with water to the outlet at the bottom of the mould and allow the
water to flow through and ensure complete saturation of the sample.
5. Open the air valve at the top and allow the water to flow out so that the air in the cylinder
is removed.
6. Fix the height h1 and h2 on the pipe from the top of water level in the reservoir
7. When all the air has escaped, close the air valve and allow the water from the pipe to flow
through the soil and establish a steady flow.

Department of Civil Engineering, B.V. Raju Institute of Technology (BVRIT)
8. Record the time required for the water head to fall from h1 to h2.
9. Change the height h1 and h2 and record the time required for the fall of head.
OBSERVATIONS AND CALCULATIONS
Calculate the coefficient of permeability of soil using the equation.
K = 2.303 Al / At Log10 (h1/h2)
K = Coefficient of permeability
a = Area of stand pipe (sq.cm)
t = Time required for the head to fall from h1 to h2 (sec)
A = Cross sectional area of the soil sample (sq.cm)
L = Length of soil sample (cm)
h1 = Initial head of water in the stand pipe above the water level in the reservoir (cm)
h2 = final head of water in the stand pipe above the water level in the reservoir (cm)
(i) Diameter of the stand pipe (cm) =
(ii) Cross sectional area of stand pipe (sq.cm) =
(iii) Length of soil sample (cm) =
(iv) Area of soil sample (sq.cm) =
Department of Civil Engineering, B.V. Raju Institute of Technology (BVRIT)
Experiment No.: 8
UNCONFINED COMPRESSION TEST
AIM
To determine shear parameters of cohesive soil
APPARATUS
1. Loading frame of capacity of 2 t, with constant rate of movement. What is the least count of the
dial gauge attached to the proving ring!
2. Proving ring of 0.01 kg sensitivity for soft soils; 0.05 kg for stiff soils.
3. Soil trimmer.
4. Frictionless end plates of 75 mm diameter (Perspex plate with silicon grease coating).
5. Evaporating dish (Aluminum container).
6. Soil sample of 75 mm length.
7. Dial gauge (0.01 mm accuracy).
8. Balance of capacity 200 g and sensitivity to weigh 0.01 g.
9. Oven, thermostatically controlled with interior of non-corroding material to maintain the
temperature at the desired level. What is the range of the temperature used for drying the soil.
10. Sample extractor and split sampler.
11. Dial gauge (sensitivity 0.01mm).
12. Vernier calipers
EXPERIMENTAL PROCEDURE (SPECIMEN)
In this test, a cylinder of soil without lateral support is tested to failure in simple compression, at a
constant rate of strain. The compressive load per unit area required to fail the specimen as called
unconfined compressive strength of the soil.
Preparation of specimen for testing
A. Undisturbed specimen
1. Note down the sample number, bore hole number and the depth at which the sample was
taken.
2. Remove the protective cover (paraffin wax) from the sampling tube.
3. Place the sampling tube extractor and push the plunger till a small length of sample moves out.
4. Trim the projected sample using a wire saw.
5. Again push the plunger of the extractor till a 75 mm long sample comes out.
6. Cutout this sample carefully and hold it on the split sampler so that it does not fall.
7. Take about 10 to 15 g of soil from the tube for water content determination.
8. Note the container number and take the net weight of the sample and the container.
9. Measure the diameter at the top, middle, and the bottom of the sample and find the average
and record the same.
Department of Civil Engineering, B.V. Raju Institute of Technology (BVRIT)
10. Measure the length of the sample and record.
11. Find the weight of the sample and record.
B. Moulded sample
1. For the desired water content and the dry density, calculate the weight of the dry soil Ws
required for preparing a specimen of 3.8 cm diameter and 7.5 cm long.
2. Add required quantity of water Ww to this soil.
Ww = WS * W/100 gm
3. Mix the soil thoroughly with water.
4. Place the wet soil in a tight thick polythene bag in a humidity chamber and place the soil in a
constant volume mould, having an internal height of 7.5 cm and internal diameter of 3.8 cm.
5. After 24 hours take the soil from the humidity chamber and place the soil in a constant volume
mould, having an internal height of 7.5 cm and internal diameter of 3.8 cm.
6. Place the lubricated moulded with plungers in position in the load frame.
7. Apply the compressive load till the specimen is compacted to a height of 7.5 cm.
8. Eject the specimen from the constant volume mould.
9. Record the correct height, weight and diameter of the specimen.
TEST PROCEDURE
1. Take two frictionless bearing plates of 75 mm diameter.
2. Place the specimen on the base plate of the load frame (sandwiched between the end plates).
3. Place a hardened steel ball on the bearing plate.
4. Adjust the center line of the specimen such that the proving ring and the steel ball are in the
same line.
5. Fix a dial gauge to measure the vertical compression of the specimen.
6. Adjust the gear position on the load frame to give suitable vertical displacement.
7. Start applying the load and record the readings of the proving ring dial and compression dial for
every 5 mm compression.
8. Continue loading till failure is complete.
9. Draw the sketch of the failure pattern in the specimen.

Department of Civil Engineering, B.V. Raju Institute of Technology (BVRIT)
Experiment No.: 9
DETERMINATION OF SHEAR PARAMETERS OF SOIL
BY DIRECT SHEAR TEST
AIM
To determine shear strength parameters of the given soil sample at known density by conducting
direct shear test.
THEORY AND APPLICATION
Shear strength of a soil is its maximum resistance to shearing stresses. It is equal to the shear
stress at failure on the failure plane. Shear strength is composed of (i) internal frictions, which is
the resistance due to the friction between the individual particles at their contact points and inter
locking of particles. (ii) Cohesion which is the resistance due to inter particle forces which tend to
hold the particles together in a soil mass. Coulomb has represented the shear strength of the soil
by the equation:
τf = C + σ tan φ
τf = shear strength of the soil
C = Cohesion
σ = normal stress on the failure plane
φ = Angle of internal friction
APPLICATION
Shear parameters are used in the design of earthen dams and embankments. The stability of the
failure wedges depends on the shear resistance of the soil along the failure plane. The strength
parameters C and φ are used in calculating the bearing capacity of soil foundation systems.
Further shear parameters help in estimating the earth pressures behind the retaining walls.
APPARATUS:
1. Direct shear box apparatus
2. Loading frame (motor attached).
3. Dial gauge.
4. Proving ring.
6. Straight edge.
7. Balance to weigh up to 200 mg.
8. Aluminum container.
9. Spatula.

Department of Civil Engineering, B.V. Raju Institute of Technology (BVRIT)
PROCEDURE:
1. Check the inner dimension of the soil container.
2. Put the parts of the soil container together.
3. Calculate the volume of the container. Weigh the container.
4. Place the soil in smooth layers (approximately 10 mm thick). If a dense sample is desired tamp
the soil.
5. Weigh the soil container, the difference of these two is the weight of the soil. Calculate the
density of the soil.
6. Make the surface of the soil plane.
7. Put the upper grating on stone and loading block on top of soil.
8. Measure the thickness of soil specimen.
9. Apply the desired normal load.
10. Remove the shear pin.
11. Attach the dial gauge which measures the change of volume.
12. Record the initial reading of the dial gauge and calibration values.
13. Before proceeding to test check all adjustments to see that there is no connection between
two parts except sand/soil.
14. Start the motor. Take the reading of the shear force and record the reading.
15. Take volume change readings till failure.
16. Add 5 kg normal stress 0.5 kg/cm2 and continue the experiment till failure
17. Record carefully all the readings. Set the dial gauges zero, before starting the experiment

Department of Civil Engineering, B.V. Raju Institute of Technology (BVRIT)
Experiment No.: 10
STANDARD PROCTOR COMPACTION TEST
AIM
To determine Optimum Moisture Content and Maximum dry density for a soil by conducting
standard proctor compaction test.
THEORY
Compaction is the process of densification of soil mass, by reducing air voids under dynamic
loading. On the other hand though consolidation is also a process of densification of soil mass but
it is due to the expulsion of water under the action of continuously acting static load over a long
period.
The degree of compaction of a soil is measured in terms of its dry density. The degree of
compaction mainly depends upon its moisture content during compaction, compaction energy and
the type of soil. For a given compaction energy, every soil attains the maximum dry density at a
particular water content which is known as optimum moisture content (OMC)
APPLICATIONS
Compaction of soil increases its dry density, shear strength and bearing capacity. The compaction
of soil decreases its void ratio permeability and settlements. The results of this test are useful in
studying the stability earthen structures like earthen dams, embankments roads and airfields .In
such constructions the soils are compacted. The moisture content at which the soils are to be
compacted in the field is estimated by the value of optimum moisture content determined by the
Proctor compaction test.
APPARATUS
1. Cylindrical mould of capacity 1000cc ,internal diameter 100mm and height 127.3 mm
2. Rammer
3. Mould accessories
4. Balance
5. Graduated jar
6. Straight edge
7. Spatula
8. Oven
9. Moisture bins
PROCEDURE
1. Take about 3 kg of air dried soil
2. Sieve the soil through 20mm sieve. Take the soil that passes through the sieve for testing

Department of Civil Engineering, B.V. Raju Institute of Technology (BVRIT)
3. Take 2.5 kg of the soil and add water to it to bring its moisture content to about 4% in
coarse grained soils and 8% in case of fine grained soils
4. Clean , dry and grease the mould and base plate .Weigh the mould with base plate. Fit
the collar.
5. Compact the wet soil in three equal layers by the rammer with 25 evenly distributed blows
in each layer.
6. Remove the collar and trim off the soil flush with the top of the mould. In removing the
collar rotate it to break the bond between it and the soil before lifting it off the mould.
7. Clean the outside of the mould and weigh the mould with soil and base plate.
8. Remove the soil from the mould and obtain a representative soil sample from the bottom,
middle and top for water content determination
9. Repeat the above procedure with 8,12,16 and 210 % of water contents for coarse grained
soil and 14,18,22 and 26 % for fine grained soil samples approximately. The above
moisture contents are given only for guidance. However, the moisture contents may be
selected based on experience so that, the dry density of soil shows the increase in
moisture content. Each trial should be performed on a fresh sample.
Department of Civil Engineering, B.V. Raju Institute of Technology (BVRIT)
Experiment No.: 1 & 2
CALIFORNIA BEARING RATIO TEST
AIM
To determine the California bearing ratio by conducting a load penetration test in the laboratory.
APPARATUS:
1. Cylindrical mould with inside dia 150 mm and height 175 mm, provided with a detachable
extension collar 50 mm height and a detachable perforated base plate 10 mm thick.
2. Spacer disc 148 mm in dia and 47.7 mm in height along with handle.
3. Metal rammers. Weight 2.6 kg with a drop of 310 mm (or) weight 4.89 kg a drop 450 mm.
4. Weights. One annular metal weight and several slotted weights weighing 2.5 kg each, 147 mm
in dia, with a central hole 53 mm in diameter.
5. Loading machine. With a capacity of at least 5000 kg and equipped with a movable head or
base that travels at an uniform rate of 1.25 mm/min. Complete with load indicating device.
6. Metal penetration piston 50 mm dia and minimum of 100 mm in length.
7. Two dial gauges reading to 0.01 mm.
8. Sieves. 4.75 mm and 20 mm I.S. Sieves.
9. Miscellaneous apparatus, such as a mixing bowl, straight edge, scales soaking tank or pan,
drying oven, filter paper and containers.
The test may be performed on undisturbed specimens and on remoulded specimens which may
be compacted either statically or dynamically.
PREPARATION OF TEST SPECIMEN
Undisturbed specimen
• Attach the cutting edge to the mould and push it gently into the ground.
• Remove the soil from the outside of the mould which is pushed in .
• When the mould is full of soil, remove it from weighing the soil with the mould or by any
field method near the spot.
Remoulded specimen
• Prepare the remoulded specimen at Proctor’s maximum dry density or any other density
at which C.B.R is required.
• Maintain the specimen at optimum moisture content or the field moisture as required.
• The material used should pass 20 mm I.S. sieve but it should be retained on 4.75 mm I.S.
sieve.
• Prepare the specimen either by dynamic compaction or by static compaction.
Dynamic Compaction
• Take about 4.5 to 5.5 kg of soil and mix thoroughly with the required water.

Department of Civil Engineering, B.V. Raju Institute of Technology (BVRIT)
• Fix the extension collar and the base plate to the mould. Insert the spacer disc over the
base
• Place the filter paper on the top of the spacer disc.
• Compact the mix soil in the mould using either light compaction or heavy compaction. For
light compaction, compact the soil in 3 equal layers, each layer being given 55 blows by
the 2.6 kg rammer. For heavy compaction compact the soil in 5 layers, 56 blows to each
layer by the 4.89 kg rammer.
• Remove the collar and trim off soil.
• Turn the mould upside down and remove the base plate and the displacer disc.
• Weigh the mould with compacted soil and determine the bulk density and dry density.
• Put filter paper on the top of the compacted soil (collar side) and clamp the perforated
base plate on to it.
Static compaction
• Calculate the weight of the wet soil at the required water content to give the desired
density when occupying the standard specimen volume in the mould from the expression.
W =desired dry density * (1+w) V
Where W = Weight of the wet soil
w = desired water content
V = volume of the specimen in the mould = 2250 cm3 (as per the mould available in
laboratory)
• Take the weight W (calculated as above) of the mix soil and place it in the mould.
• Place a filter paper and the displacer disc on the top of soil.
• Keep the mould assembly in static loading frame and compact by pressing the displacer
disc till the level of disc reaches the top of the mould.
• Keep the load for some time and then release the load. Remove the displacer disc.
• The test may be conducted for both soaked as well as unsoaked conditions.
• If the sample is to be soaked, in cases of compaction, put a filter paper on the top of the
soil and place the adjustable stem and perforated plate on the top of filter paper.
• Put annular weights to produce a surcharge equal to weight of base material and
pavement expected in actual construction. Each 2.5 kg weight is equivalent to 7 cm
construction. A minimum of two weights should be put.
• Immerse the mould assembly and weights in a tank of water and soak it for 96 hours.
Remove the mould from tank.
• Note the consolidation of the specimen.
Procedure for Penetration Test
• Place the mould assembly with the surcharge weights on the penetration test machine.
• Seat the penetration piston at the center of the specimen with the smallest possible load,
but in no case in excess of 4 kg so that full contact of the piston on the sample is
established.
Department of Civil Engineering, B.V. Raju Institute of Technology (BVRIT)
• Set the stress and strain dial gauge to read zero. Apply the load on the piston so that the
penetration rate is about 1.25 mm/min.
• Record the load readings at penetrations of 0.5, 1.0, 1.5, 2.0, 2.5, 3.0, 4.0, 5.0, 7.5, 10
and 12.5 mm. Note the maximum load and corresponding penetration if it occurs for a
penetration less than 12.5 mm.
• Detach the mould from the loading equipment. Take about 20 to 50 g of soil from the top
3 cm layer and determine the moisture content.
Department of Civil Engineering,
Liquid Limit Determination
Sample No.
W1 = Weight of empty, clean can + lid (grams)
W2 = Weight of can, lid, and moist soil (grams)
W3 = Weight of can, lid, and dry soil (grams)
Weight of dry sample (grams)
Weight of pore water (grams)
Water content, w% = [(W2 –
No. of drops (N)
Liquid Limit =
Plastic Limit Determination
Sample No.
W1 = Weight of empty, clean can + lid (grams)
W2 = Weight of can, lid, and moist soil (grams)
W3 = Weight of can, lid, and dry soil (grams)
Weight of dry sample (grams)
Weight of pore water (grams)
Water content, w% = [(W2 –
Plastic Limit (PL) = Average w % =
Plasticity Index = Liquid Limit
Department of Civil Engineering, B.V. Raju Institute of Technology (BVRIT)
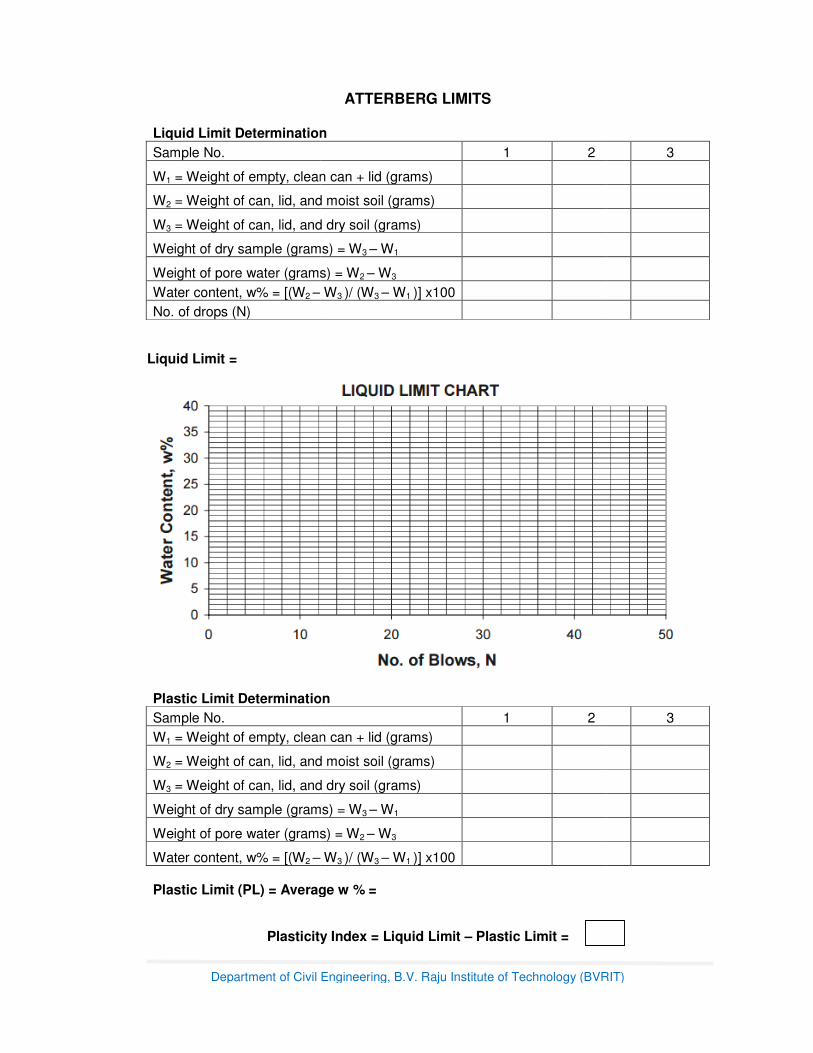
ATTERBERG LIMITS
Liquid Limit Determination
1 2
of empty, clean can + lid (grams)
of can, lid, and moist soil (grams)
can, lid, and dry soil (grams)
(grams) = W3 – W1
of pore water (grams) = W2 – W3
W3 )/ (W3 – W1 )] x100
Determination
1 2
of empty, clean can + lid (grams)
of can, lid, and moist soil (grams)
of can, lid, and dry soil (grams)
(grams) = W3 – W1
pore water (grams) = W2 – W3
W3 )/ (W3 – W1 )] x100
Plastic Limit (PL) = Average w % =
Plasticity Index = Liquid Limit – Plastic Limit =
(BVRIT)
3
3

Department of Civil Engineering, B.V. Raju Institute of Technology (BVRIT)
FIELD DENSITY TEST – CORE CUTTER METHOD
Sample No. 1 2 3
Weight of Core Cutter + Wet Soil (grams)
Weight of Core Cutter (grams)
Weight of Wet Soil (grams)
Volume of Core Cutter (cm3)
γb - Bulk Density of in-situ soil (g/cm3)
Container No.
Weight of Wet Soil + Container (grams)
Weight of Dry Soil + Container (grams)
Weight of Container (grams)
Weight of Dry Soil (grams)
Weight of Water (grams)
Water Content (%)
γd - Dry Density of in-situ soil (g/cm3)
��� ������,��
��
� �����

Department of Civil Engineering, B.V. Raju Institute of Technology (BVRIT)
FIELD DENSITY TEST – SAND REPLACEMENT METHOD
a) Calibration of Apparatus
Sample No. 1 2 3
Weight of Sand Pouring Cylinder + Sand (grams)
Weight of Sand Pouring Cylinder after filling cone (grams)
Weight of Sand Pouring Cylinder after filling cone and Calibrating Container (grams)
Ws - Weight of Sand filling Calibrating Container (grams)
Volume of Calibrating Container (cm3)
γs - Calibrated Bulk Density of Sand (g/cm3)
b) Measurement of in-situ density of Soil
Sample No. 1 2 3
Weight of excavated soil (grams)
Weight of Sand Pouring Cylinder after filling hole and cone (grams)
Wb - Weight of Sand in hole (grams)
Bulk Density of in-situ soil (g/cm3)
γb = (Ws/ Wb) γs
Water content of in-situ soil (grams)
Dry Density of in-situ soil (g/cm3)
��� ������,��
��
� �����

Department of Civil Engineering, B.V. Raju Institute of Technology (BVRIT)
GRAIN SIZE ANALYSIS – SIEVE ANALYSIS
Weight of Container (grams) :
Weight of Container + Soil, (grams) :
Weight of Dry Soil Sample, Wd (grams) :
IS Sieve Empty
Weight of Sieve (g)
Weight of Sieve + Soil Retained (g)
Soil Retained (g)
Percentage Retained (%)
Percentage Passing
(%)
(mm) (1) (2) (3) = (2) – (1) (4) = [(3) / Wd] x 100 100 – (4)
4.75
2
1
0.600
0.425
0.300
0.150
0.075
Total Weight:
From Grain Size Distribution Curve:
% Gravel = D10 = mm
% Sand = D30 = mm
% Fines = D60 = mm
Cu = D60 / D10 =
Cu = (D30)2 / (D60 x D10) =
Unified Classification of Soil:
Department of Civil Engineering, B.V. Raju Institute of Technology (BVRIT)
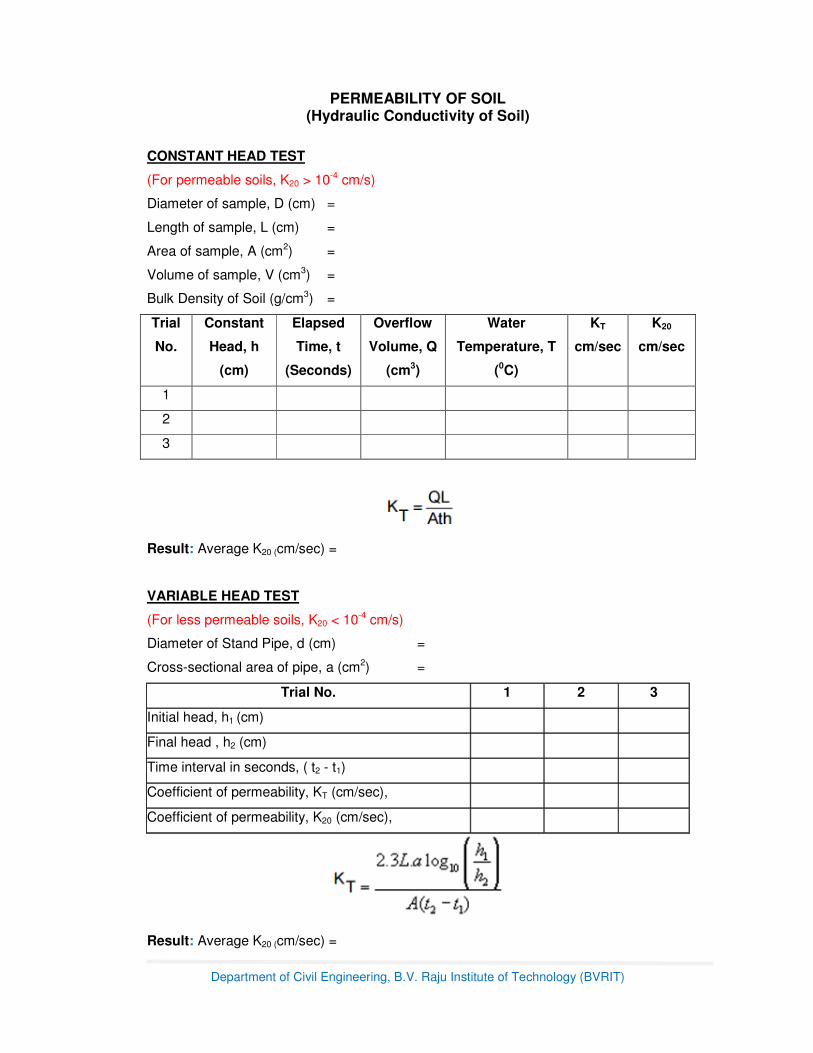
PERMEABILITY OF SOIL (Hydraulic Conductivity of Soil)
CONSTANT HEAD TEST
(For permeable soils, K20 > 10-4 cm/s)
Diameter of sample, D (cm) =
Length of sample, L (cm) =
Area of sample, A (cm2) =
Volume of sample, V (cm3) =
Bulk Density of Soil (g/cm3) =
Trial
No.
Constant
Head, h
(cm)
Elapsed
Time, t
(Seconds)
Overflow
Volume, Q
(cm3)
Water
Temperature, T
(0C)
KT
cm/sec
K20
cm/sec
1
2
3
Result: Average K20 (cm/sec) =
VARIABLE HEAD TEST
(For less permeable soils, K20 < 10-4 cm/s)
Diameter of Stand Pipe, d (cm) =
Cross-sectional area of pipe, a (cm2) =
Trial No. 1 2 3
Initial head, h1 (cm)
Final head , h2 (cm)
Time interval in seconds, ( t2 - t1)
Coefficient of permeability, KT (cm/sec),
Coefficient of permeability, K20 (cm/sec),
Result: Average K20 (cm/sec) =

Department of Civil Engineering, B.V. Raju Institute of Technology (BVRIT)
The viscosity of the water changes with temperature. As temperature increases viscosity
decreases and the permeability increases. The coefficient of permeability is standardized
at 20°C, and the permeability at any temperature T is related to K20 by the following ratio:

Department of Civil Engineering, B.V. Raju Institute of Technology (BVRIT)
UNCONFINED COMPRESSIVE STRENGTH OF SOIL
Type of specimen: Undisturbed / Remoulded
(Undrained Cohesive Soils, Φ =0 )
Initial length of specimen, L0 (mm) =
Initial diameter of specimen, D0 (mm) =
Initial area of specimen, A0 (cm2) =
Least count of deformation dial gauge (mm/div.) =
Proving ring constant (kN/div.) =
Elapsed
time
(min)
Vertical deformation
Vertical
strain
Corrected
area
(cm2)
Compressive
load Compressive
stress
(kg/cm2) (div.) (mm) (div.) (kg)
(1) (2) (3) (4) (5) (6) (7) (8) = (7)/(6)
Computations:
� Plot stress-strain curve, and show unconfined compressive strength qu as the peak
stress or the stress at 20% strain.
� Draw a Mohr circle using qu and determine undrained shear strength c = qu/2

Department of Civil Engineering, B.V. Raju Institute of Technology (BVRIT)
Results
From the stress-strain curve and Mohr’s circle,
Unconfined compressive strength, qu (kg/cm2) =
Undrained shear strength or Cohesion, c (kg/cm2) =
Department of Civil Engineering, B.V. Raju Institute of Technology (BVRIT)
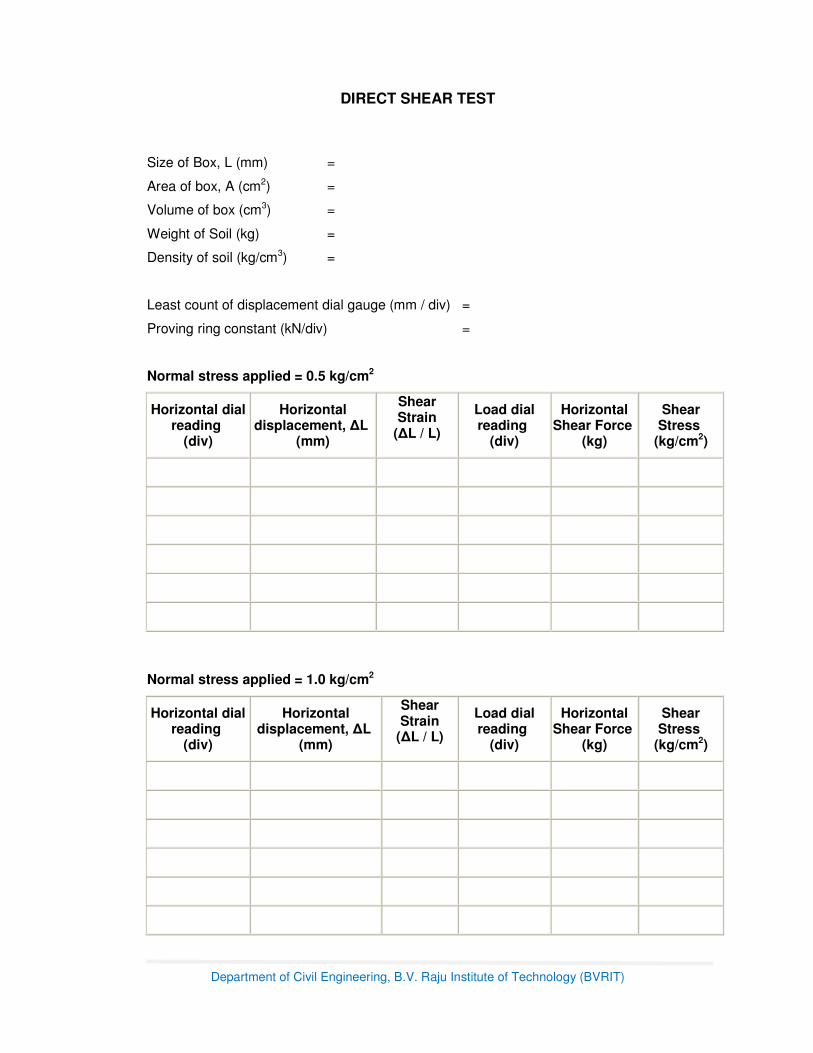
DIRECT SHEAR TEST
Size of Box, L (mm) =
Area of box, A (cm2) =
Volume of box (cm3) =
Weight of Soil (kg) =
Density of soil (kg/cm3) =
Least count of displacement dial gauge (mm / div) =
Proving ring constant (kN/div) =
Normal stress applied = 0.5 kg/cm2
Horizontal dial reading
(div)
Horizontal displacement, ∆L
(mm)
Shear Strain
(∆L / L)
Load dial reading
(div)
Horizontal Shear Force
(kg)
Shear Stress
(kg/cm2)
Normal stress applied = 1.0 kg/cm2
Horizontal dial reading
(div)
Horizontal displacement, ∆L
(mm)
Shear Strain
(∆L / L)
Load dial reading
(div)
Horizontal Shear Force
(kg)
Shear Stress
(kg/cm2)

Department of Civil Engineering, B.V. Raju Institute of Technology (BVRIT)
Normal stress applied = 1.5 kg/cm2
Horizontal dial reading
(div)
Horizontal displacement, ∆L
(mm)
Shear Strain
(∆L / L)
Load dial reading
(div)
Horizontal Shear Force
(kg)
Shear Stress
(kg/cm2)
Computations:
� Plot the shear stress versus horizontal displacement. Read the maximum value of
shear stress if failure has occurred, otherwise read the shear stress at 20% shear
strain.
� Plot the maximum shear stress versus the corresponding normal stress for each test,
draw the Mohr-Coulomb failure envelope, and determine the cohesion and the angle
of shearing resistance of the soil.
Results
Cohesion, c (kg/cm2) =
Angle of shearing resistance, Φ (°) =
Department of Civil Engineering, B.V. Raju Institute of Technology (BVRIT)
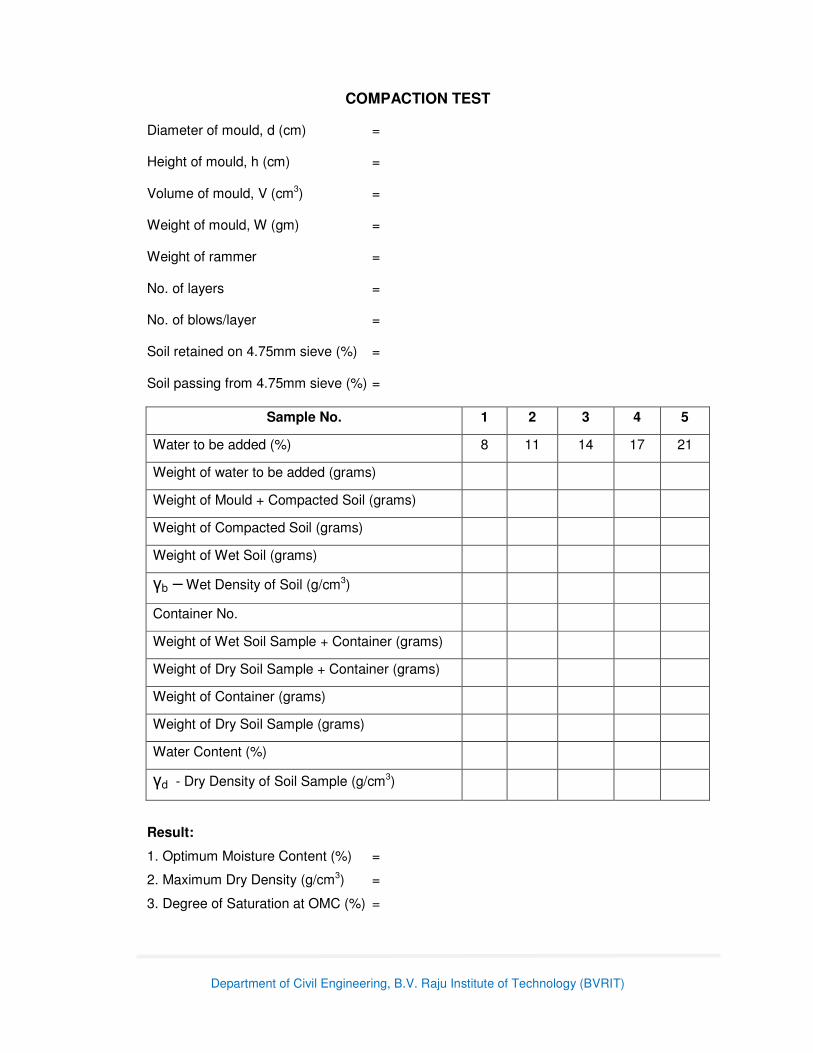
COMPACTION TEST
Diameter of mould, d (cm) =
Height of mould, h (cm) =
Volume of mould, V (cm3) =
Weight of mould, W (gm) =
Weight of rammer =
No. of layers =
No. of blows/layer =
Soil retained on 4.75mm sieve (%) =
Soil passing from 4.75mm sieve (%) =
Sample No. 1 2 3 4 5
Water to be added (%) 8 11 14 17 21
Weight of water to be added (grams)
Weight of Mould + Compacted Soil (grams)
Weight of Compacted Soil (grams)
Weight of Wet Soil (grams)
γb – Wet Density of Soil (g/cm3)
Container No.
Weight of Wet Soil Sample + Container (grams)
Weight of Dry Soil Sample + Container (grams)
Weight of Container (grams)
Weight of Dry Soil Sample (grams)
Water Content (%)
γd - Dry Density of Soil Sample (g/cm3)
Result:
1. Optimum Moisture Content (%) =
2. Maximum Dry Density (g/cm3) =
3. Degree of Saturation at OMC (%) =

Department of Civil Engineering, B.V. Raju Institute of Technology (BVRIT)
CALIFORNIA BEARING RATIO TEST
CBR is the ratio of force per unit area required to penetrate a soil mass with standard
circular piston at the rate of 1.25 mm/min. to that required for the corresponding
penetration of a standard material.
C.B.R. = Test load / Standard load * 100
The following table gives the standard loads adopted for different penetrations for the
standard material with a C.B.R. value of 100%
Penetration of plunger (mm) Standard load (kg)
2.5 1370
5.0 2055
7.5 2630
10.0 3180
12.5 3600
The test may be performed on
� Undisturbed specimens collected using Core Cutter
� Remoulded specimens with light or heavy compaction
o Soaked condition (for 4 days)
o Unsoaked condition
Type of Specimen: Undisturbed / Remoulded Days Soaked =
Least count of displacement dial gauge (mm / div) = (Soaked Specimen)
Proving ring constant (kN/div) =
Wet Density of Soil (Kg/cm3) =
Water Content (%) =
Dry Density of Soil (Kg/cm3) =
Penetration Depth
(mm)
Load Corrected Load
(Kg) CBR
Div Kg
2.5
5.0
7.5
10.0
12.5
Department of Civil Engineering, B.V. Raju Institute of Technology (BVRIT)

Department of Civil Engineering, B.V. Raju Institute of Technology (BVRIT)

Department of Civil Engineering, B.V. Raju Institute of Technology (BVRIT)

Procedure order for classification of soil
Annexure –I
(Page 1 of 5 )
BRIEF DETAILS OF SOIL CLASSIFICATION
(Ref: IS: 1498 - 1970)
Background and Basis of Classification:
The Geotechnical Engineers/Agencies had evolved many soil classification systems, over
the world. The soil classification system developed by Casegrande was subsequently
modified and named as 'Unified Classification’ system. In 1959, Bureau of Indian
Standards adopted, the Unified classification system as a standard, which was revised in
1970. According to BIS classification system, soils are primarily classified based on
dominant particle sizes and its plasticity characteristics. Soil particles mainly consist of
following four size fractions.
Gravel : 80 – 4.75 mm
Sand : 4.75mm – 0.075mm (75 micron)
Silt : 75 – 2 micron
Clay : less than 2 micron
Particle size distribution of a soil is determined by a combination of sieving and
sedimentation analysis as per procedure detailed in IS: 2720 (Part 4) – 1985 and its
plasticity characteristics are determined by Liquid Limit and Plastic Limit as per
procedure detailed in IS:2720 (Part 5) –1985.
Symbols used in Soil Classification:
Symbols and other soil properties used for soil classification are given below. Brief
procedure for Classification of soils has been explained in tabular form and Flow Chart.
Plasticity Chart required for classification of fine grained soils has also been given.
Primary Letter Secondary Letter
G : Gravel W : well-graded
S : Sand P : poorly graded
M : Silt M : with non-plastic fines
C : Clay C : with plastic fines
O : Organic soil L : of low plasticity
P: Peat I : of medium plasticity
H : of high plasticity
Other soil parameters required for soil classification:
Cu : Coefficient of Uniformity = D60 / D10 .
Cc : Coefficient of Curvature = (D30)2
/ (D60 * D10) .
D60, D30 & D10 are particle sizes, below which 60,30 and 10 percent soil particles by
weight are finer than these sizes.
Plasticity Index, PI = Liquid Limit (LL) - Plastic Limit ( PL).
Coarse-grained soils: Soils having fines ( particles of size less than 75 micron) < 50%.
Fine grained soils: Soils having fines more than 50%.

Procedure order for classification of soil
TABLE EXPLAINING BIS SOIL CLASFICATION SYSTEM Annexure -I
(Page 3 of 5)
Laboratory criteria Description Group
Symbol Fines (%) Grading Plasticity
Notes
Well graded gravels, sandy gravels,
with little or no fines GW 0 - 5
Cu > 4
1 < Cc < 3
Poorly graded gravels, sandy gravels,
with little or no fines GP 0 - 5
Not satisfying
GW requirements
Silty gravels, silty sandy gravels
GM > 12
Below A- line or
PI < 4
Gravels
(particles
larger than
4.75mm)
more than
50% of
coarse
fraction
Clayey gravels, clayey sandy gravels
GC > 12
Above A- line and
PI > 7
Well graded sands, sandy soils, with
little or no fines SW 0 - 5
Cu > 6
1 < Cc < 3
Poorly graded sands/,sandy soils, with
little or no fines SP 0 - 5
Not satisfying
SW requirements
Silty sands SM > 12 Below A- line
or PI < 4
Coarse
grained
soils:
Fine
particles
(size smaller
than 75
micron) less
than 50%
Sands
particles
more than
50% of
coarse
fraction (size
above 75
micron) Clayey sands SC > 12 Above A- line and
PI > 7
A dual symbol,
if fines are 5 –
12 %.
Dual symbols, if
above A-line
and 4 < PI < 7
Inorganic silts , silty or clayey fine
sands, with slight plasticity
ML Plasticity Index less than 4
Inorganic clays, silty clays, sandy clays
of low plasticity
CL Plasticity Index more than 7
Silts and
clays (Liquid
Limit <35)
Inorganic silt and clay of low plasticity CL-ML Plasticity Index between 4 and 7
Inorganic silts , clayey silt with
medium plasticity
MI Below A-line of Plasticity Chart Silts and
clays (Liquid
limit 35-50) Inorganic clays, silty clays of medium
plasticity
CI Above A- line of Plasticity Chart
Inorganic silts of high plasticity MH Below A-line of Plasticity Chart
Fine
grained
soils
particles
(size less
than 75
micron)
more than
50%
Silts and
clays (Liquid
limit > 50) Inorganic clays of high plasticity CH Above A- line of Plasticity Chart

Department of Civil Engineering, B.V. Raju Institute of Technology (BVRIT)
GEOTECHNICAL ENGINEERING LAB
Viva Voce
Soil Classification System
1. What is subgrade of Road?
2. What is Subsoil?
3. List out major groups of Soils as per Indian Soil Classification System?
4. As per BIS, what is the particle size of
a) Gravel
b) Sand
c) Silt
d) Clay
5. How do you define Coarse Grained Soils?
6. How do you define Fine Grained Soils?
7. Example of Coarse Grained Soils and Fine Grained Soils?
8. Explain briefly what are Well Graded (GW) soils?
9. How many major groups are there in AASHTO soil classification system?
10. What is the classification of soils in USCS system?
11. What are laboratory tests required to classify the soils?
Atterberg Limits
12. List out Atterberg Limits
13. Aim of Atterberg Limit Test
14. What is Plasticity Index?
15. Liquid Limit and Plastic Limit Tests are conducted on which type of soils
16. Apparatus used for Liquid Limit Test
17. What is size of Sieve used in Atterberg Limit Test
Field Density Tests
18. Core Cutter Test is used for which type of soils
19. Sand Replacement Test used for which type of soils
20. What is the depth of hole made in field in Sand Replacement Test method
21. How do you find dry density of soil
22. How do you find saturated unit weight of soil
23. How to you find submerged unit weight of Soil
24. What is the use of Pycnometer?
25. How do you find Specific Gravity of Soil?

Department of Civil Engineering, B.V. Raju Institute of Technology (BVRIT)
Grain Size Analysis
26. Aim of Grain Size Analysis Test
27. Sieve Analysis is conducted on which type of soils?
28. List of Sieves used in Sieve Analysis?
29. How do you find grain size distribution of fine grained soils?
30. What is the use of Hydrometer?
Permeability of Soil
31. For Laminar flow, what is the Darcy’s equation for velocity of flow in homogeneous soils?
32. What is permeability of soil?
33. Constant Head Method is conducted on which type of soils?
34. Variable Head Method is conducted on which type of soils?
35. What are the standard sizes of pipes used in Variable Head Method?
36. List ‘k’ values for different types of soils
37. What is the expression for ‘k’ by falling head method
38. What is the expression for ‘k’ by constant head method
39. List out tests required for finding Permeability of soil?
Shear Strength of Soil
40. What are Shear Parameters?
41. List out various tests on soils to find Shear Parameters?
42. Unconfined Test is conducted on which type of soil?
43. What are disturbed and un-disturbed soils?
44. Give example to Cohesive and Cohesion-less soil
45. What is the aim of Direct Shear Test?
46. Coulomb equation for Shear Strength of Soil?
47. What is the significance of C and φ
48. What is the standard size of Shear Box
49. Vane Shear Test is used for which type of Soils?
50. What do you find in Tri-axial Shear Test?
Compaction and Consolidation of Soil
51. What is OMC?
52. How do you measure Degree of Compaction?
53. What are the factors affecting Degree of Compaction?
54. Explain the procedure of Proctor Compaction Test?
55. What is size of Rammer used in Standard Proctor Compaction Test?

Department of Civil Engineering, B.V. Raju Institute of Technology (BVRIT)
56. What is size of Rammer used in Modified Proctor Compaction Test?
57. What is the aim of CBR Test?
58. What is CBR?
59. What is the Standard Load for 5mm penetration?
60. Difference between Compaction and Consolidation?
Bearing Capacity of Soil
61. What is SBC of Soil?
62. What are Terzaghi’s Bearing Capacity Factors?
63. What is the Terzaghi’s Bearing Capacity Equation to find Ultimate Bearing Capacity of
Soil for Shallow Foundations?
64. In general, what is the factor of safety used to find SBC?
65. List out various laboratory tests required for finding SBC of soil?
Lateral Earth Pressure
66. What is Active Earth Pressure?
67. What is Passive Earth Pressure?
68. What is Pressure at Rest?
69. What is the equation for Rankine’s Lateral Active Earth Pressure Coefficient?
70. List out tests required for finding Rankine’s Lateral Active Earth Pressure Coefficient?
Related Documents