1 Growth Strategies Synergies Strengthen Fundamentals January 2007

Welcome message from author
This document is posted to help you gain knowledge. Please leave a comment to let me know what you think about it! Share it to your friends and learn new things together.
Transcript

1
Growth StrategiesSynergies Strengthen Fundamentals
January 2007
2
Disclaimer
• Some statements in this presentation are regarded under U.S. Securities law as forward-looking statements, i.e., statements thatare subject to risks and uncertainties. Forward-looking statementsare forecasts which may differ materially from the final figures and which are not under our control. For further information onthe risks and uncertainties as they relate to us, please see our 20-F form for 2005, in particular, item 3 which contains “BasicInformation – Risk Factors.”
All figures are expressed in Brazilian GAAP.

3
Agenda
• Background
• Overview on strategies
• Business outlook
• How we will finance our growth
• Our Strategies are reflected in our results

4
Ownership
The blend of current shareholders provides long term perspective
• Our shareholder diversity provides a worldwide business management vision focused on the sustainability of company activities.
• Listed in major stock exchanges• BOVESPA
• Common shares: cmig3•Daily trading volume: R$ 2 million
• Preferred shares: cmig4•Daily trading volume: R$ 45 million
• NYSE• ADR ( preferred share backed): CIG
•Ratio : 1 ADR=1,000 preferred shares• Daily trading volume: US$ 15 million• Approximately 19 million ADR outstanding
• LATIBEX• Preferred shares : xcmig4
Total shares162,153 million
Common Shares70,874 million
Preferred Shares91,279 million
Shares in Treasury69 million
International investors68%
Local Investors29%
MG and others3%
MG51%
SEB33%
International investors6%
Local investors10%

5
Our focus on electric energy business allows us to spot opportunities in synergic sectors
Central Termelétrica de Cogeração SA
Companhia de Gás de Minas Gerais -
Gasmig
Empresa de Infovias SA
Companhia Transleste de Transmissão
Companhia Transudeste de
Transmissão
Companhia de Transmissão
Centroeste de Minas
Companhia Transirapé de Transmissão
Subsidiárias integrais Participações
Estado de Minas Gerais 22%
Southern Electric Brasil Participações Ltda 14%
Privados Internacionais 42%
Outros 1%
Composição do Capital Social
Privados Nacionais 21%
Rosal Energia SA
Cemig Distribuição SA
Horizontes Energia SA
Cemig Capim Branco Energia SA
Cemig PCH SA
Usina Termelétrica Barreiro SA
Usina Térmica Ipatinga SA
Sá Carvalho SA
Efficientia SA
Cemig Trading SA
Cemig Geração e Transmissão SA
Central Hidrelétrica Pai Joaquim S A
• Our shareholder diversity yields a worldwide business management vision focused on the sustainability of company activities.
• Structure reflects the regulations set by the National Agency for Electric Energy (ANEEL).
Ownership

6
Corporate governance : continualimplementation of best practices
• Highlights:– BoD approves nomination of external
auditors– Executive Board coordinates external
auditor selection process (in compliance with the Brazilian Procurement Legislation for state owned companies)
– 6 BoD members appointed by minority shareholders
– Fiscal Council plays key role on:• Accounting practices• Dividend policy• Prevention of fraud• Financial statements analysis
– SOX compliance• Section 302 Certification• Internal control and procedures on
schedule for certification– BOVESPA level 1– NYSE listed company practices– Code of ethics
Shareholders
Board of Directors14 members Executive Board
Conselho Fiscal( Fiscal Council)
5 members

7
Focus on Sustainability rewarded by the international community
• Social and Environmental Responsibility is a commitment with a long term view which assures not only the preservation of the company’s activities as well as avoids the externalization of undue costs to the society allowing a symbiotic coexistence with the environment.
• Our actions to assure the sustainability were recognized by the international community.
• CEMIG was appointed by the 7th consecutive time as a member of the Dow Jones Sustainability Index and is the only Latin American Utility included in the Index.

8
Service quality to our clientsas a top priority
• State of Minas Gerais Quality Award
– Cemig Distribuição S.A. won the Quality Award-PMQ
• Criteria of Excellence of a National Quality Award
• Recognizes companies that adopt practices of modern and efficient management
• Compares favorably against industry benchmarks.
• ISO Certification
– Cemig Distribuição S.A. expanded the certification of its operating processes to NBR ISO 9001:2000.
• More than 80% of workforce is now operating its activities according to this certification.
• Certifies the uniformity of procedures, continuous improvement, greater visibility within the Company’s operations and proper attention to the needs of clients and all other interested parties.

9
Change over the last three years shows accelerated growth
1.797
2.2662.488
2003 2004 2005
EBITDA (R$ m) 1.198
1.385
2.003
2003 2004 2005
Net Income (R$ m)
4
7
14
2003 2004 2005
Dividend Yield (%)
107
31
66
2003 2004 2005
Total Shareholder's Return (%)
7.4419.951
14.335
2003 2004 2005
Market Capitalization (R$ m)
• Management already has the necessary tools to meet growth demands;
• Our shareholders are aligned with our common value-adding objective;
• Long-term view which allows us to seize asset acquisition opportunities in order to meet the commitments of our Long Term Strategic Plan;
• In maintaining our excellent financial position we show commitment to growth and shareholder returns.
10
Agenda
• Background
• Overview on strategies
• Business outlook
• How we will finance our growth
• Our Strategies are reflected in our results

11
Fundamentals of ourLong Term Strategic Plan
• Focus on electricity business– Expansion opportunities evaluated using strict profitability criteria
• Low risk business portfolio– Adequate structural balance of the electric energy business segments :
generation, transmission, and distribution– Strong presence in all of the segments that create value
• Financial stability– Clear objectives guarantee sustainability for the long-term
• Indebtedness• Cash flow• Credit quality
• Higher standards of Corporate governance and integrity– Incorporation of practices that add value for the shareholder
• Code of ethics

12
Long Term Strategic Plan addresses sustainable growth
• Broadening of CEMIG's area of activity, with focus on the electricity industry– Growth outside of the current geographical area– First steps in investing internationally – Within Brazil, expansion up to regulatory limits with sustainable growth
• Acting prudently• Adding value
• Addressing the long-term interests of shareholders:– New dividend policy with a 50% payout and extraordinary dividends,
every two years, provided there are available cash.– Corporate governance directed at transparency and respect for the interests
of minority shareholders
13
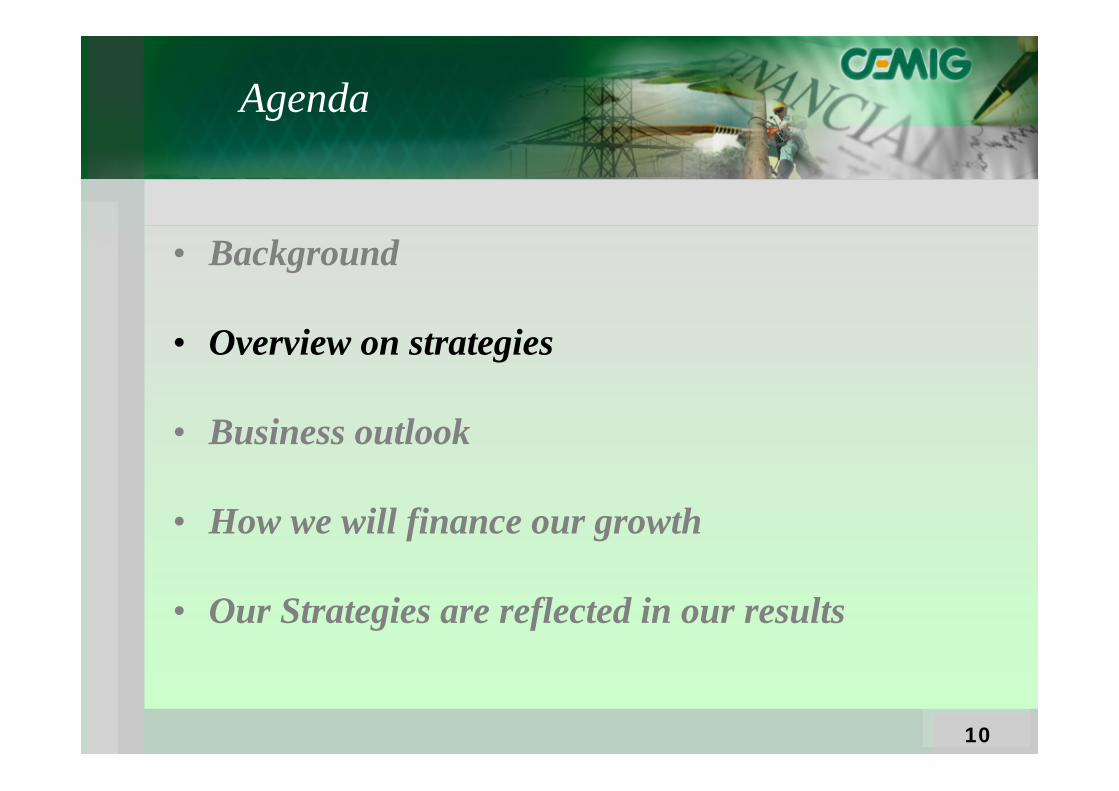
Our Long Term Strategic Plan foresees accelerated growth for the next 30 years
• Incorporation of our goals and commitments to our bylaws in order to give stability to the company's long-term planning
– Capex limited to 40% of EBITDA
• in 2006: 65%
• in 2007: 55%
• After 2008, with acquisitions: 50%
– Investment only in power generation, transmission and distribution projects that offer real internal rates of return where minimum is above the level projected in the Company’s Long Term Strategic Plan, save for legal obligations;
– Maintaining operating revenues and expenses at Cemig Distribuição S.A., and any other subsidiary carrying out electric energy distribution activity, in line with tariff adjustments and rate revisions.
14
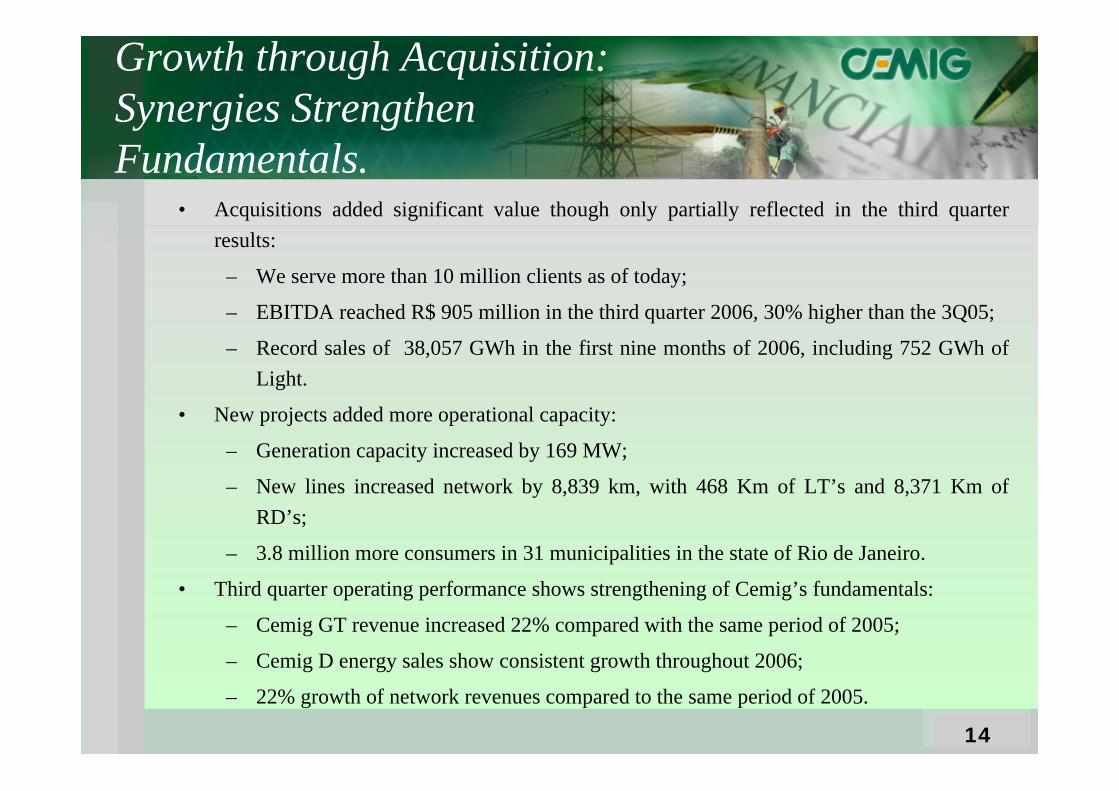
• Acquisitions added significant value though only partially reflected in the third quarterresults:
– We serve more than 10 million clients as of today;
– EBITDA reached R$ 905 million in the third quarter 2006, 30% higher than the 3Q05;
– Record sales of 38,057 GWh in the first nine months of 2006, including 752 GWh of Light.
• New projects added more operational capacity:
– Generation capacity increased by 169 MW;
– New lines increased network by 8,839 km, with 468 Km of LT’s and 8,371 Km of RD’s;
– 3.8 million more consumers in 31 municipalities in the state of Rio de Janeiro.
• Third quarter operating performance shows strengthening of Cemig’s fundamentals:
– Cemig GT revenue increased 22% compared with the same period of 2005;
– Cemig D energy sales show consistent growth throughout 2006;
– 22% growth of network revenues compared to the same period of 2005.
Growth through Acquisition:Synergies Strengthen Fundamentals.

15
606535 563 562
871 814686
117
702
497
905
1T0 4 2 T0 4 3 T0 4 4 T0 4 1T0 5 2 T0 5 3 T0 5 4 T0 5 1T0 6 2 T0 6 3 T0 6
Consolidated EBITDA Margin (%)
29 2730
33
39,7
32,227,1
31,3
23,4
34,840,6
1,8 1,6
2,32,8
3,42,8
3,2
2,1 2,0
2,83,0
Earnings per shareR$ lots of one thousand shares
EBITDA
In 2006 - Q1 to Q3: Acquisitionsaccountable for 2.2% of net incomeand 3.1% of cash generation
Company Net Income EBITDACemig Geração/Transmissâo 487,590 1,010,103 Cemig Distribuição 552,606 926,044 Cemig Holding (55,781) (60,878) Gasmig 28,207 39,909 Infovias 3,469 33,941 Sá Carvalho 16,586 23,110 Efficientia 217 249 Ipatinga 5,127 8,602 Horizontes 8,974 10,173 Pai Joaquim 204 (95) Transleste 2,193 3,205 Cogeração 1,599 1,687 Rosal Energia 15,359 16,549 Capim Branco 13,578 15,378 Cemig PCH 8,597 8,815 UTE Barreiro 81 1,080 RME Light 14,799 46,848 TBE 9,862 17,514 Cemig Consolidated 1,113,267 2,102,234
Consolidated Results(jan-sep/2006 - R$ thousands)
R$ millions

16
Accelerated growth from acquisitions
– We look for partners that add value through:• Reducing the neccessity of using equity• Transparency of the economic-financial evaluation of projects• Access to financing at low costs
– Maximization of cash generation:• Surplus cash generation• Rolling over debt
– Look for the best opportunities for financial funding• Continued improvement in our credit risk rating
17
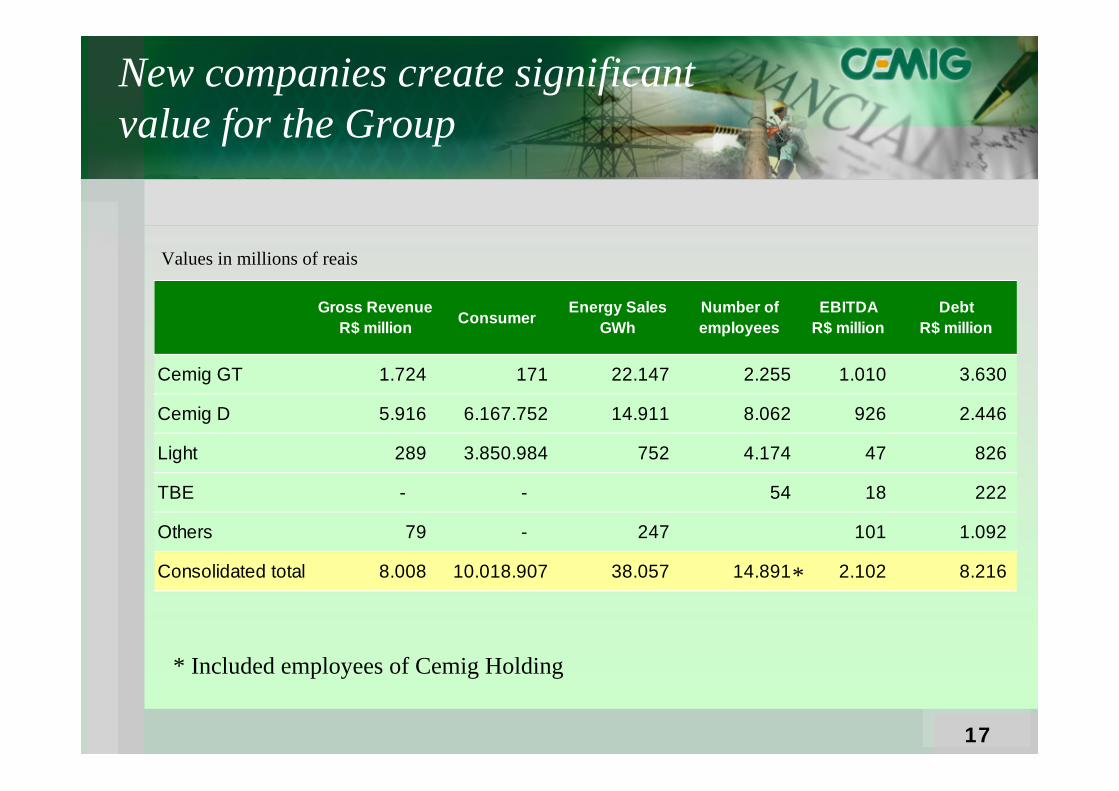
Gross RevenueR$ million Consumer Energy Sales
GWhNumber of employees
EBITDAR$ million
DebtR$ million
Cemig GT 1.724 171 22.147 2.255 1.010 3.630
Cemig D 5.916 6.167.752 14.911 8.062 926 2.446
Light 289 3.850.984 752 4.174 47 826
TBE - - 54 18 222
Others 79 - 247 101 1.092
Consolidated total 8.008 10.018.907 38.057 14.891 2.102 8.216
New companies create significantvalue for the Group
*
* Included employees of Cemig Holding
Values in millions of reais

18
International class company in performance
• Total assets : R$ 24.5 billion• Shareholders’ equity : R$ 8.1 billion• Consolidated gross debt: R$ 8.2 billion• Consolidated earnings through Sep 06 R$ 7.0 billion• Energy sales to the principal states of Brazil• Initiating foreign investments

19
New map of Cemig in the country
Sales to end consumers
12,031 GWh
Rosal Energia SA55 MW
3 Industrial clients156 GWh
5 Industrial clients1,307 GWh
PCHs12 MW
1 Industrial client24 GWh
Supply8,629 GWh
43 Contracts
Generationcapacity
6,456 MW
Generation Capacity of 852 MW and 3.8 millionconsumers

20
Agenda
• Background
• Overview on strategies
• Business outlook
• How we will finance our growth
• Our Strategies are reflected in our results
21
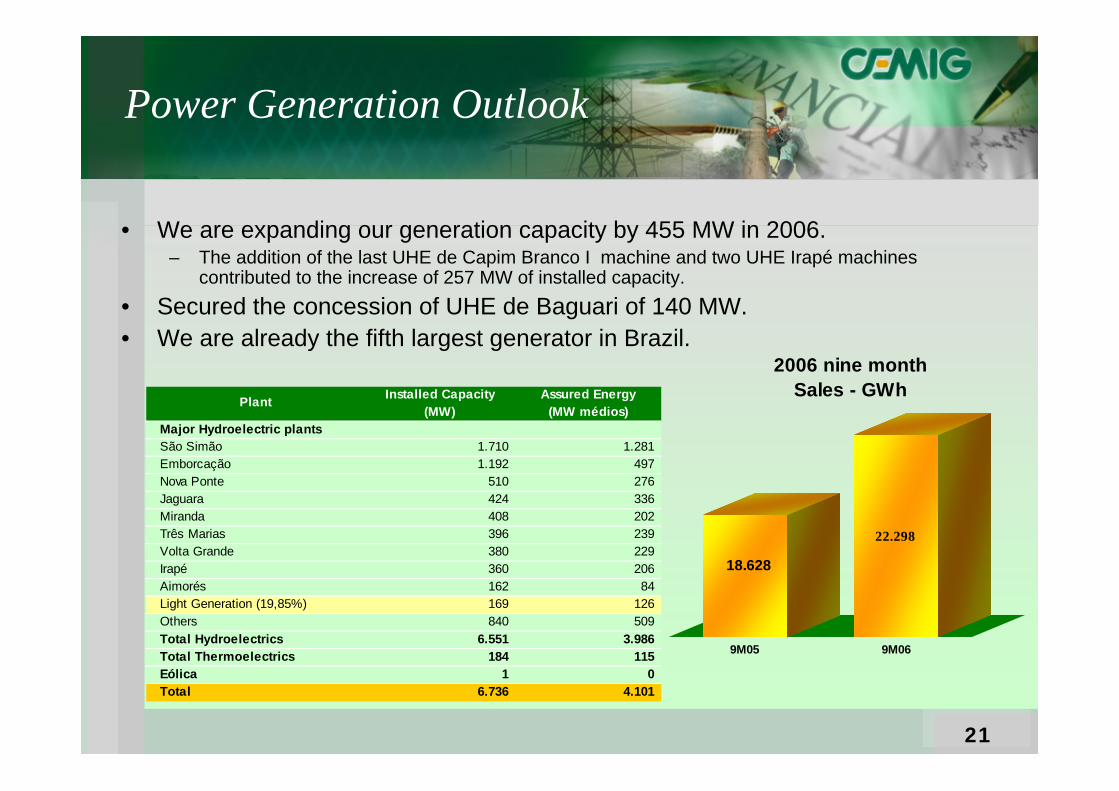
Power Generation Outlook
Installed Capacity Assured Energy(MW) (MW médios)
Major Hydroelectric plantsSão Simão 1.710 1.281 Emborcação 1.192 497 Nova Ponte 510 276 Jaguara 424 336 Miranda 408 202 Três Marias 396 239 Volta Grande 380 229 Irapé 360 206 Aimorés 162 84 Light Generation (19,85%) 169 126 Others 840 509 Total Hydroelectrics 6.551 3.986 Total Thermoelectrics 184 115 Eólica 1 0 Total 6.736 4.101
Plant
• We are expanding our generation capacity by 455 MW in 2006.– The addition of the last UHE de Capim Branco I machine and two UHE Irapé machines
contributed to the increase of 257 MW of installed capacity.• Secured the concession of UHE de Baguari of 140 MW.• We are already the fifth largest generator in Brazil.
18.628
22.298
9M05 9M06
2006 nine month Sales - GWh

22Figures as of September 2006
Cemig’s Power Plants
Baguari
57 Power Plants in operation
Hydroelectric Large Power Plant (19)
Small Power Plant (32)
Thermoelectric (04)
Wind (01)
Under Construction (01)
23
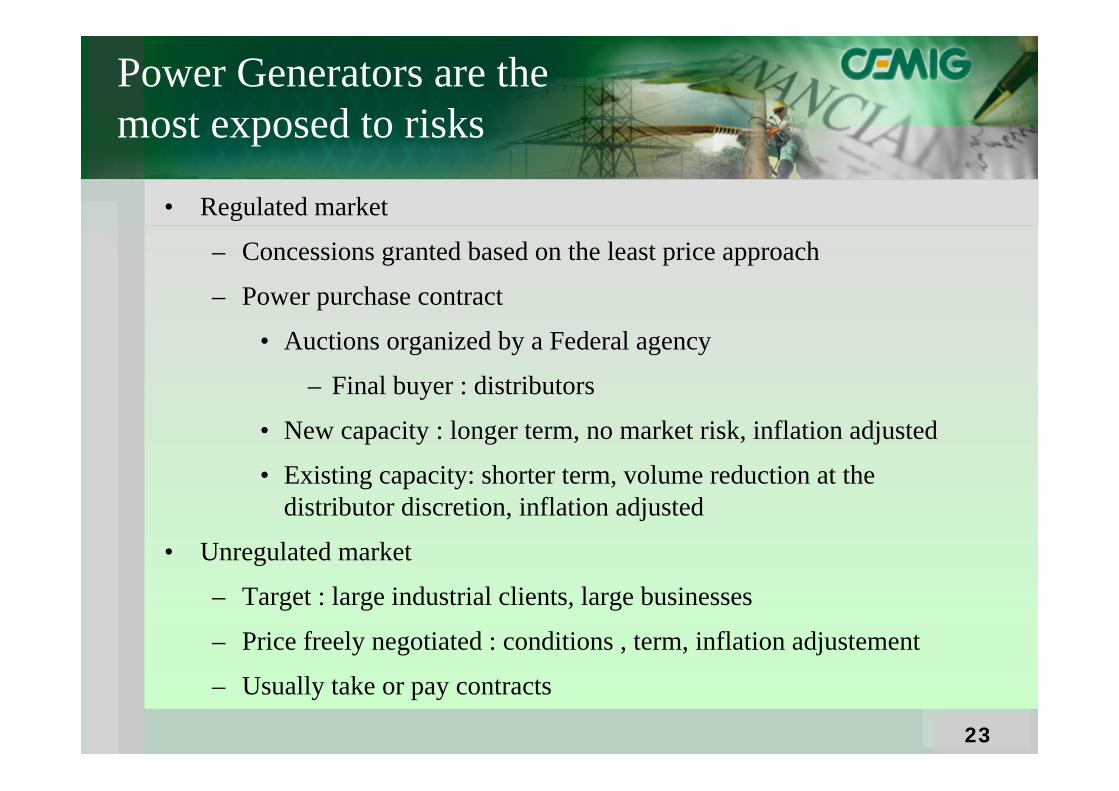
Power Generators are the most exposed to risks
• Regulated market
– Concessions granted based on the least price approach
– Power purchase contract
• Auctions organized by a Federal agency
– Final buyer : distributors
• New capacity : longer term, no market risk, inflation adjusted
• Existing capacity: shorter term, volume reduction at the distributor discretion, inflation adjusted
• Unregulated market
– Target : large industrial clients, large businesses
– Price freely negotiated : conditions , term, inflation adjustement
– Usually take or pay contracts

24
Power Generation Price Trend
• Price will behave differently according to the nature of the contract to be auctioned by the ANEEL– Existing capacity ( so called “old energy”) contracts:
• power to be supplied in one year from now• Term is 8 years• Imply distributor ‘s forecasted demand risk
– Contractual volume can be reduced– New capacity ( so called “new energy”) contracts
• Power to be supplied in three or five years from now• Term is 30 years• No risk on the contractual volume reduction by distributors

25
Price for existing power capacity is getting close to the marginal cost.
• The existing capacity plus new scheduled additions will meet the demand upto 2011. Beyond 2011, new power projects will be needed to cope with thedemand growth.
• Natural gas fired thermal power projects will play important role in the longterm power supply.– Natural gas price will have an impact on the energy price trend
50556065707580859095
R$/Mwh
2006 2007 2008 2009
Contracted Price
50
60
70
80
90
100
110
120
130
140
2008 2009 2010 2011 2012 2013
Expected priceExisting Capacity New capacity
Source: 05,06 ANEEL auctions, EPE’s 10 Y Expansion Plan, PSR Consulting

26
Power Transmission Outlook
• Expansion projects can be carried out in three ways:– New concessions to be granted through auctions
• Projects are selected by the ONS in light of the National Gridneeds
• Auctions are organized by ANEEL• Contracts are standard and term is for 30 years• Bids are for annual revenue.
– Authorization to build, directly requested by the ANEEL• In certain cases, ANEEL may request any utility to build a
transmission line or a substation of regional impact– Acquisition of existing facility

27
Transmission regulation has been the oldest and most successful one
• Competition for concession contract
– Cap price approach
– Allowed revenue: the winner bid is the lowest revenue earned from users
– 30 year long concession
• Stable Cash flow
– Guaranteed contracts signed with users
• Receivables pledged as guarantees
• Annual inflation adjustment
• Revenue secured regardless the use of the asset
• Low operating risk
• Penalties are applied only in the case of bad maintenance or poor performance
• Fixed income alike investment

28
Power Transmission Outlook
• Facilities built before 1995– Concession will expire on July 8, 2015– 20 year extension may be granted at ANEEL discretion– Allowed return to be reviewed in a near future
2003 2004 2005 09/2006Lines of 500 KV 2.163 2.163 2.165 2.581 Lines of 345 KV 1.921 1.942 1.976 1.977 Lines of 230 KV 745 751 751 779 Total 4.829 4.856 4.892 5.337
Extension of Transmission Network - Km
Incorporation of TBE increased installed capacity for transmissionlines for Cemig by 10 % Cemig Corporation is the sixth largest Transmitor of energy in thecountry

29
New challenge: spotting the international market opportunities
• Investment in Chile:• Charrúa transmission line – Nueva Temuco,
220 kV, 190 km• Concession period: 20 years• Partner: Alusa (51%)• Investment: US$ 60 millions• Annual Revenue: US$ 6.5 millions• Financing: 70% the investment• Investment up to date: US$ 6 millions• Start of implantation: June/2005• Environmental lincense: February/2007• Start of work: March/2007• Start of operation: July/2008
• Development of administrative capacity to operate in theregulatory environments in other countries.

30
Distribution business is the most regulated one
• Allowed return on asset approach
– Benchmark WACC: currently 11.26%
• Operating expenses :
– Full passed through mechanism
• Energy purchase expenses under certain circumstances
– Yearly inflation adjusted
– Tracking account for offsetting estimated expenses
• Revenues come from:
– Charges on D grid use by the access free users
– Sales to captive users
• 5 year rate setting review
– Sharing of productivity gains with the users

31
Electricity Distribution Outlook
• Distributors are supposed to buy power to meet 100% of theforecasted demand.– In case a large consumption
client ( eligible as freeconsumer) choses anothersupplier, distributor are allowedto reduce the contractual volume at the same amount
– If the growth is poor, contractualvolume can be reduced by 4% yearly.
• Distributors are supposed to buypower through auctions organized bythe CCEE ( clearing house typeagency). The power purchaseagreements are standard.
24%
34%
19%
10%
13%
Industrial Residential Comercial Rural Others
2006 2005Residential 4,962,046 4,927,351 0.7%Industrial 17,950,748 17,157,542 4.6% captive 3,617,649 4,113,285 -12.0% free 14,333,099 13,044,257 9.9%
Commercial 2,858,594 2,785,455 2.6%Rural 1,461,706 1,412,153 3.5%Others 2,011,402 1,936,501 3.9%Supply 8,060,257 958,353 741.1%TOTAL 37,304,753 29,177,355 27.9%
9 Months (MWh) Var. %
Cemig Figures

32
RMEholding
• Cemig: 25.0%• Andrade Gutierrez: 25.0%• Pactual: 25.0%• LUCE: 25.0%
Stockholdingstructure of
LIGHT
• Minority stockholders: 10.4%• EDF: 10.0%• RME : 79.6%
Acquisition of Light
• Light is the holding company • Light Energia : 852 MW power generation capacity• Light Serviços de Eletricidade SA: electricity distribution company
•3.4 million clients•Sales volume : 18.488 Gwh
33
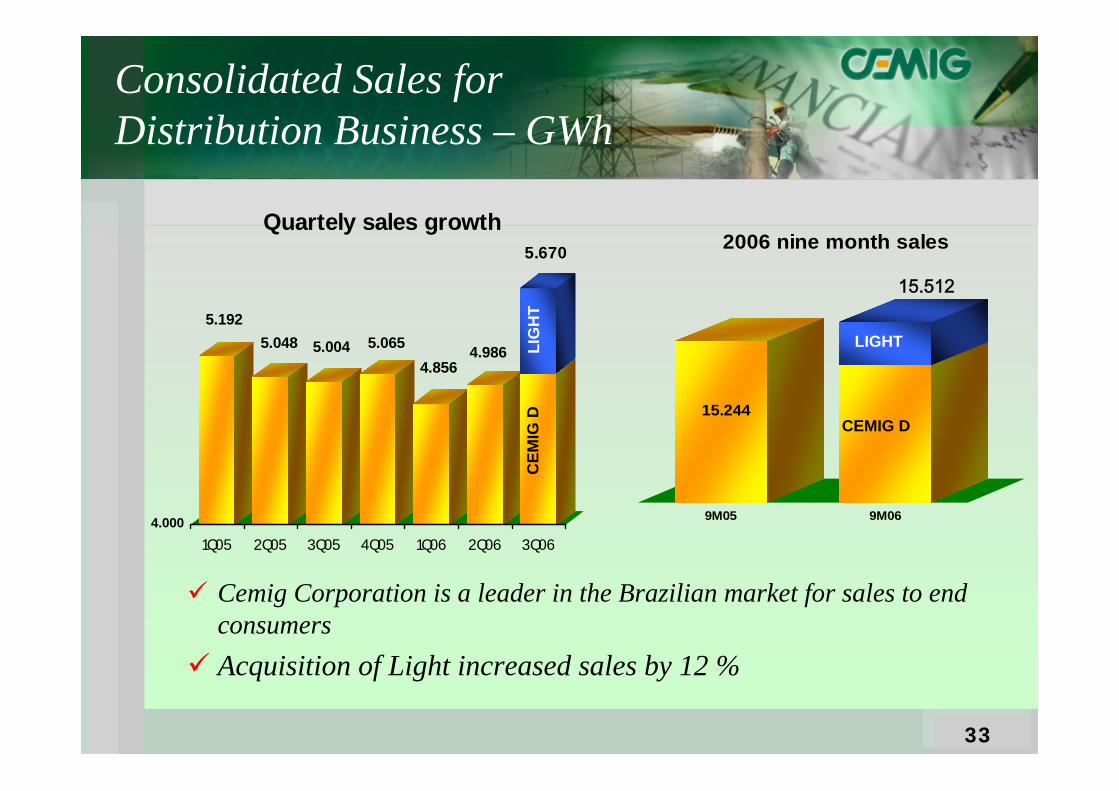
15.244
9M05 9M06
2006 nine month sales
4.000
Cemig Corporation is a leader in the Brazilian market for sales to end consumersAcquisition of Light increased sales by 12 %
Consolidated Sales for Distribution Business – GWh
5.1925.048 5.004 5.065
4.8564.986
5.670
1Q05 2Q05 3Q05 4Q05 1Q06 2Q06 3Q06
Quartely sales growth
LIG
HT
CEM
IG D
LIGHT
CEMIG D
15.512

34
New projects undergo strict evaluation process
Our strategy to expand installed capacity includesgeneration efficiency requirements: – Fair economic-financial balance– Installed capacity expansion on three performance levels to
contribute to efforts to generate economic development– Improve financial capacity to finance own projects– Protect the interests of shareholders, employees, clients and
suppliersThrough
– Through investment selection with returns always above WACC– Technological and operational improvements– Superior management practices

35
New projects add installed capacityin order to meet increasing demandfor electricity
* Investments made in partnerships with diverse investors
Projects 2005 Through Sep/06 2006 Growth ( %)
2006/2005 After 2006
Installed capacityGeneration ( em MW) 6.113 6.736 10% UHE Irapé – 100% 360 360 UHE Capim Branco I* - 21,0526% 50 50 UHE Capim Branco II* - 21,0526% 44 UHE Baguari* - 34% 48 PCH’s * - 49% 23 RME – LIGHT – 19,85% 169 169
Network reach Transmission ( km) 4.892 468 5.360 10% 236 Distribution 379.400 18.569 397.969 5% Sub-transmission (km) 16.040 452 16.492 3%Total 400.332 419.821 5%Consumers 6.009.987 4.008.920 10.018.907 67%
*
36
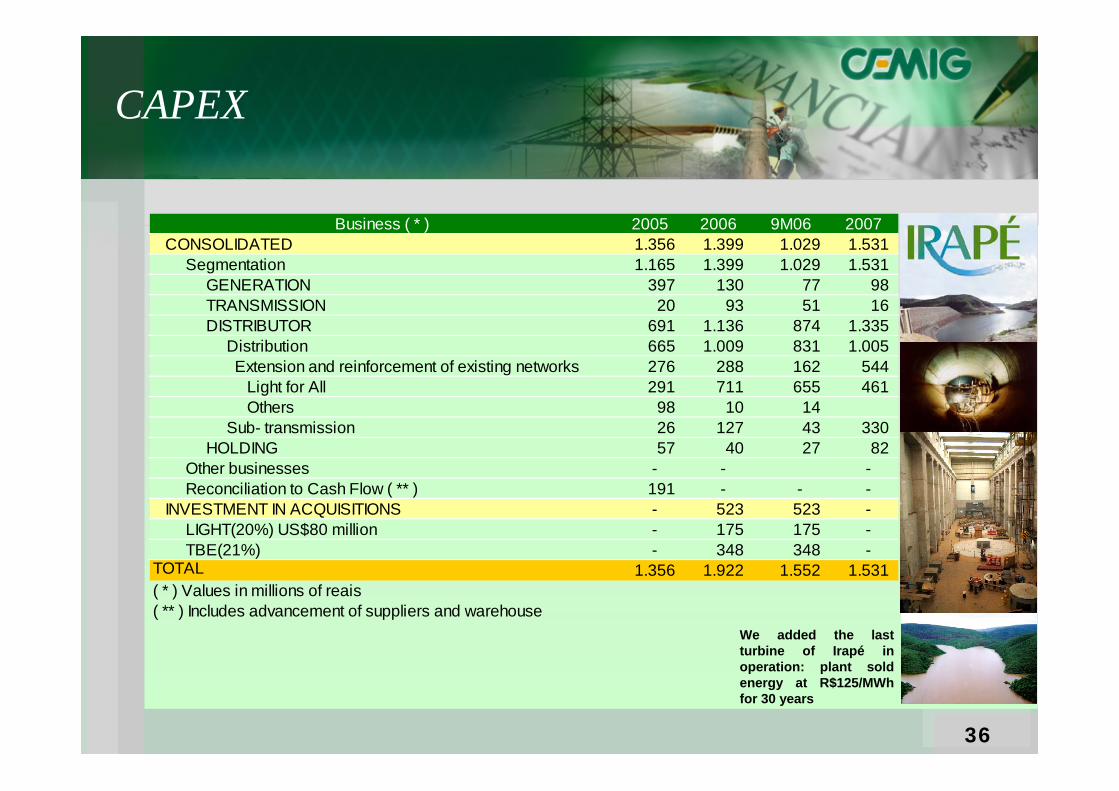
Business ( * ) 2005 2006 9M06 2007CONSOLIDATED 1.356 1.399 1.029 1.531 Segmentation 1.165 1.399 1.029 1.531 GENERATION 397 130 77 98 TRANSMISSION 20 93 51 16 DISTRIBUTOR 691 1.136 874 1.335 Distribution 665 1.009 831 1.005 Extension and reinforcement of existing networks 276 288 162 544 Light for All 291 711 655 461 Others 98 10 14 Sub- transmission 26 127 43 330 HOLDING 57 40 27 82 Other businesses - - - Reconciliation to Cash Flow ( ** ) 191 - - - INVESTMENT IN ACQUISITIONS - 523 523 - LIGHT(20%) US$80 million - 175 175 - TBE(21%) - 348 348 -
TOTAL 1.356 1.922 1.552 1.531 ( * ) Values in millions of reais( ** ) Includes advancement of suppliers and warehouse
CAPEX
We added the lastturbine of Irapé in operation: plant soldenergy at R$125/MWhfor 30 years

37
EBITDA forecast for the coming years
3,9323,7553,6443,7583,3193,035Consolidated
507472485504293280OTHER COMPANIES(*)
1,6051,5661,5291,6841,5751,364D
1,8201,7171,6301,5701,4511,391GT
20102009200820072006 adjusted2006Companies
1. April 2008 rate review
• Capture productivity
2. Interest charge (R$50 million, as of today) – financial compensation on the reimbursement for a lower revenue as of May 2004
(*)Includes HOLDING
COMMENTS ABOUT DISTRIBUTOR EBITDA IN 2008

38
Agenda
• Background
• Overview on strategies
• Business outlook
• How we will finance our growth
• Our Strategies are reflected in our results

39
Financial Management strictly in conformity to the Strategic Plan
• Our Long Term Strategic Plan resulted in a credit risk rating review:– Upgrade of our Fitch rating, from A- to A+ (6/29/06);– Moody’s is preparing to review rating;
• We are rolling over our debts, lengthening the maturity and reducing costs:– Issuance of Commercial Paper by CEMIG D (R$300 MM)
and CEMIG GT (R$ 900 MM), at a cost of 103% of CDI .• On January 27, 2006, CRC credits placed in a Receivables
Fund (FIDC) in the amount of R$ 1,659 million:– R$ 900 million in senior shares– R$ 759 million in subordinate shares

40
How we will finance our growth
• Our strategy encompasses key elements in financing our expansion
– We will seek partners who can add value via:
• reduced need for equity
• transparency of the economic/financial evaluation of projects
• access to low-cost financing
– Maximization of cash management
• Generation of surplus
• Rollover of maturing debt
– Search for the best opportunities to raise funds to finance expansion
– Continual improvement of our credit risk rating
9M06Cash at start of period 1,469 Cash from operations 1,542
Net income 1,113 Depreciation and amortization 479 Suppliers (39) Deferred tariff adjustment - Other adjustments (11) ICMS on TUSD -
Financing Activity 433 Financing obtained 2,204 Payment of loans and financing (216) Others (1,555)
Investment Activity (1,412) Investments outside concession area (507) Investments in concession area (1,060) Special obligations - consumer contributions 159 Others (4)
Cash at end of period 2,032
Statement of Cash Flows (consolidated)Values in millions of reais

41
Lengthened Debt Maturity Profile
• The debt ratios continue improving the credit quality of the Company
IGPM14%
CDI/Selic63%
Dólar11%
RGR/Finel4%
Yen1%Outros
7%
Main Indexes
Average cost of debt is 9.89% p.a., with constant prices (as of September 2006) without considering Light and TBE debts.
2315
642 584
960 863616
222434
717687
-100
400
900
1400
1900
2400
2006 2007 2008 2009 2010 2011 2012 2013 2014 2015 a 2030
Average tenor: 3,8 years
2006 considers R$1,200 million regarded to CommercialPapers from 90 day period raised in July.
R$ million Values as of September 2006

42
876642 584
960 863616
222434
717687
400
400400239
1439
-100
400
900
1400
1900
2400
2006 2007 2008 2009 2010 2011 2012 2013 2014 2015 A 2029
R$ million Values as of September 2006
Average tenor: 5.0 years
Debt matured schedulewith subsequent events
Original Debt
Commercial Paper roll over
Debenture Repricing

43
Opportunities for raising funds to finance expansion due to financial market high liquidity
Bank Loans•Debt rollover
•Assignment of receivables
Local Capital Market• Debentures are the major funding
source (long-term, denominated in Wholesale Prices Index [IGP-M])
• FIDC (receivables fund)
International Capital Market • Eurobonds
• Perpetual bonds
Multilateral Agencies
• IFC, JBIC, CAF • Long Term
• Tax breaks on remittance of interests

44
Agenda
• Background
• Overview on strategies
• Business outlook
• How we will finance our growth
• Our Strategies are reflected in our results

45
9M06 3Q06 9M05 3Q05 FY2005Net Revenue 6.970 2.599 6.148 2.063 8.236 Operating Expenses (5.347) (1.918) (4.198) (1.503) (6.342) EBIT 1.623 681 1.950 560 1.894 EBITDA 2.102 905 2.363 699 2.489 Financial Result (208) (38) (43) 124 (3) Non-operating result (13) 7 (39) (19) (53) Provision for Income taxes, Social Cont. and Deferred income tax (456) (200) (665) (219) (471) Interest on own capital reversal 169 - 283 - 635 Minority shareholders (2) (2) 1 - 1 Net income 1.113 448 1.487 446 2.003
Value in millions of reaisStatement of Results (Consolidated)
Growth of Consolidated Earnings

46
26.190 26.93128.224 29.177
2002 2003 2004 2005 2006
9 Months 2006
38.057
8.6389.064 9.555
10.304
2002 2003 2004 2005 2006
Sales in the Third Quarter
13.725
LIGHT
LIGHT
CEM
IGC
EMIG
LIGHT
Consolidated Sales to end consumers GWh
750 GWh in addition from Light increase 2% of sales in the 3th quarter.
8.72
5
10.1
49
10.3
04
10.4
37 11
.874
12.4
58
1Q05 2Q05 3Q05 4Q05 1Q06 2Q06 3Q06
Quarterly Sales Growth 13.725
CEM
IG
47
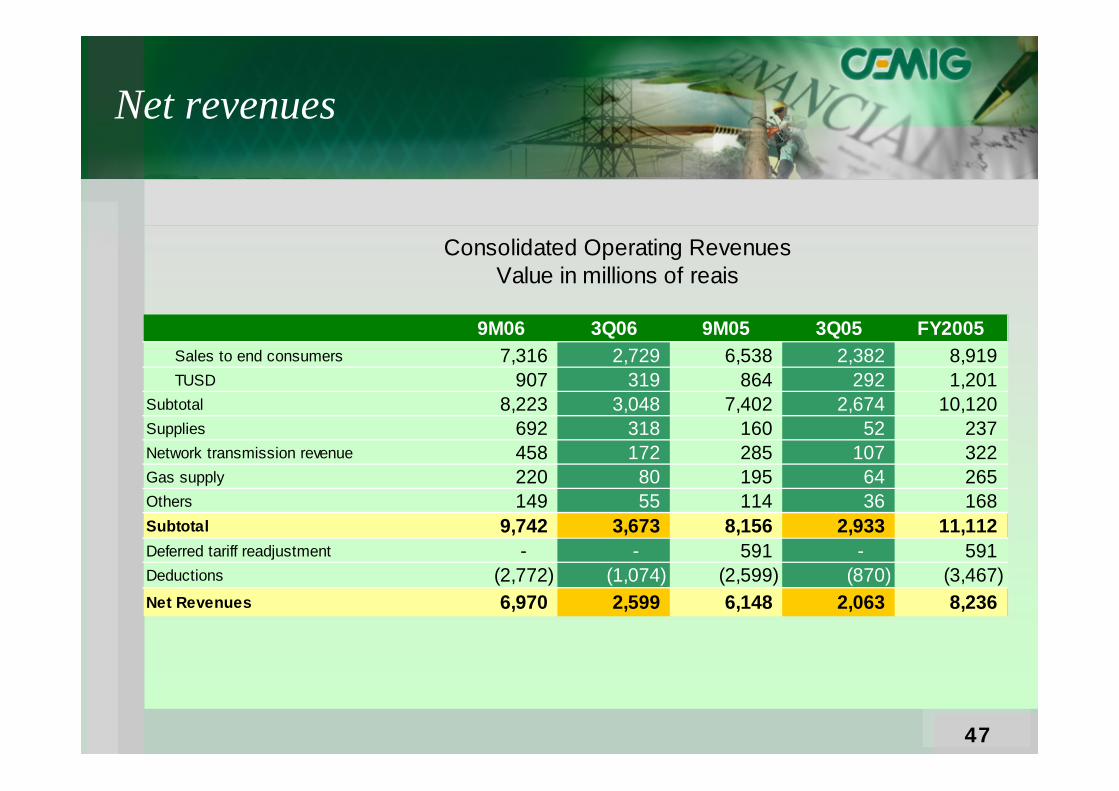
9M06 3Q06 9M05 3Q05 FY2005Sales to end consumers 7,316 2,729 6,538 2,382 8,919 TUSD 907 319 864 292 1,201
Subtotal 8,223 3,048 7,402 2,674 10,120 Supplies 692 318 160 52 237 Network transmission revenue 458 172 285 107 322 Gas supply 220 80 195 64 265 Others 149 55 114 36 168 Subtotal 9,742 3,673 8,156 2,933 11,112 Deferred tariff readjustment - - 591 - 591 Deductions (2,772) (1,074) (2,599) (870) (3,467) Net Revenues 6,970 2,599 6,148 2,063 8,236
Value in millions of reaisConsolidated Operating Revenues
Net revenues

48
9M06 3Q06 9M05 3Q05 FY2005Purchased Energy 1,578 590 1,053 397 1,455
Personnel/Managers/Board/Profit Shares 908 255 694 213 1,106
Depreciation and Amortization 479 176 444 149 595 Fuel Consumption Account - CCC 363 141 305 109 416 Energy Development Account - CDE 244 93 220 74 296 Charges for the use of Basic Transmission Network 621 199 506 149 641 Third Party Services 344 127 290 114 423 Pension Fund (Forluz) 116 41 115 38 153 Materials 59 21 66 24 96 Production Materials 36 36 - - - Royalties 94 39 110 31 145 Purchased Gas for Resale 119 43 116 40 156 Operational Provisions 117 37 116 101 127 PROINFA 31 16 - - - Energy Efficiency and R&D 67 22 17 7 - Other expenses 171 82 146 57 733 Total 5,347 1,918 4,198 1,503 6,342
Consolidated Operating Expenses (Values in millions of reais)
Operating Expenses impacted by non-controllable costs

49
Values in thousands 9M06 9M05Net Income 1,113,267 1,487,200 (a) Deferred Tariff adjustment - (412,597) (b) CVA Recomposition of TUST 61,555 - (c) Annual Salary Increase 117,040 (d) Reversal of Provision for RGR (43,402) (e) Income from overdue bills Inc. cl (31,869) Adjusted net income 1,216,591 1,074,603
EBITDA 2,102,234 2,394,124 (a) Deferred Tariff Adjustment - - (487,576) (b) CVA Recomposition of TUST 93,265 - (c) Annual Salary Increase 177,425 (d) Reversal of Provision for RGR (65,760) Adjusted EBITDA 2,307,164 1,906,548
Non-recurring items:Adjusted results show sustainable growth
50
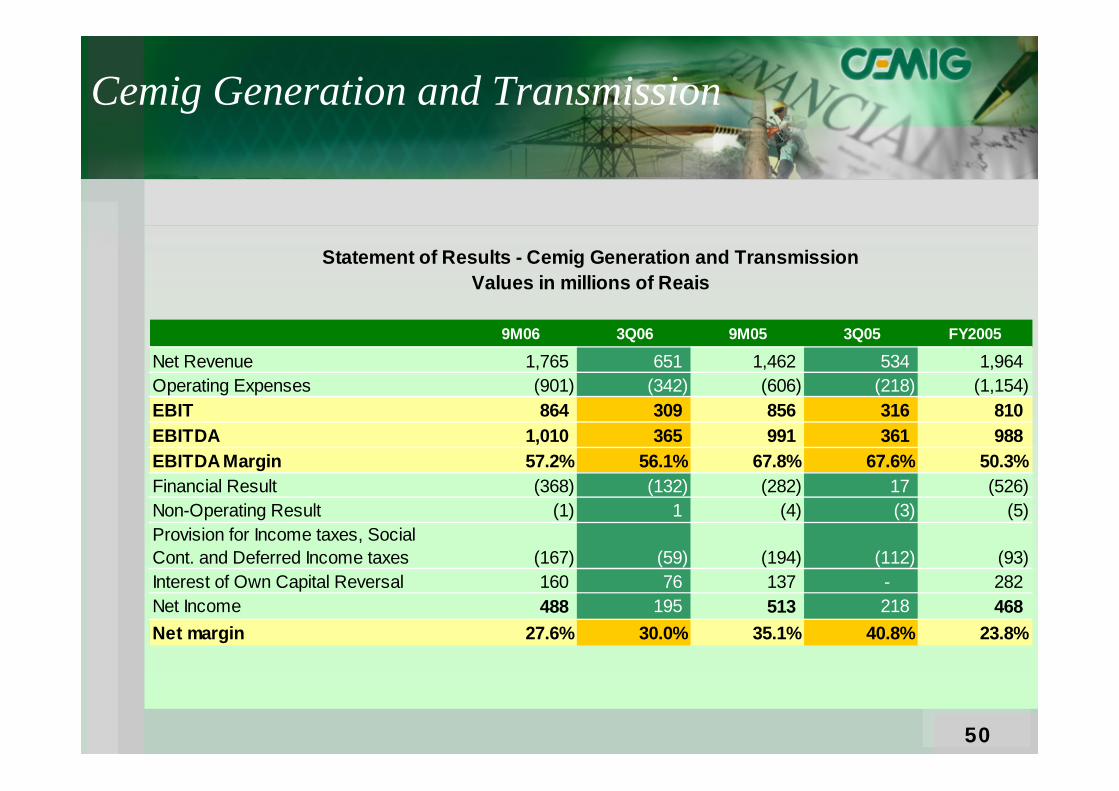
9M06 3Q06 9M05 3Q05 FY2005
Net Revenue 1,765 651 1,462 534 1,964 Operating Expenses (901) (342) (606) (218) (1,154) EBIT 864 309 856 316 810 EBITDA 1,010 365 991 361 988 EBITDA Margin 57.2% 56.1% 67.8% 67.6% 50.3%Financial Result (368) (132) (282) 17 (526) Non-Operating Result (1) 1 (4) (3) (5) Provision for Income taxes, Social Cont. and Deferred Income taxes (167) (59) (194) (112) (93) Interest of Own Capital Reversal 160 76 137 - 282 Net Income 488 195 513 218 468 Net margin 27.6% 30.0% 35.1% 40.8% 23.8%
Statement of Results - Cemig Generation and TransmissionValues in millions of Reais
Cemig Generation and Transmission

51
9M06 3Q06 9M05 3Q05 FY2005
Net Revenue 4.660 1.597 4.755 1.565 6.397 Operating Expenses (4.009) (1.316) (3.672) (1.317) (5.225) EBIT 651 281 1.083 248 1.172 EBITDA 926 370 1.354 339 1.454 EBITDA Margin 19,9% 23,2% 28,5% 21,7% 22,7%Financial Result 19 (56) 161 81 26 Non-Operating Result (21) (7) (23) (10) (31) Provision for Income taxes, Social Cont. and Deferred Income taxes (222) (75) (417) (108) (398) Interest of Own Capital Reversal 126 60 107 - 221 Net Income 553 203 911 211 990 Net Margin 11,9% 12,7% 19,2% 13,5% 15,5%
Statement of Results - Cemig DistributionValues in millions of reais
Cemig Distribution
52
53
Glossary
Average outage frequency (FEC): Average number of outages suffered in a given period per consumer, in a given group of consumers.
Debt coverage index: Ebitda divided by total financial expenses in the year. This gives a figure for the company’s capacity to pay debt servicing.
Deferred Tariff Adjustment (RTD): Every four years Aneel decides on a “periodic” tariff review for each electricity distributor, to adjust the level of annual adjustments to preserve the financial equilibrium of the concession contracts, coverage of efficient operational costs and adequate remuneration of investment. On April 8, 2003, this adjustment for Cemig was set provisionally at 31.53%, but the final adjustment decided was 44.41%, and the percentage difference of 12.88% will be applied to Cemig’stariffs in “deferred” format: i.e., as an addition to each of the annual tariff adjustments decided for the years 2004 through 2007, cumulatively. The difference between the adjustment to which Cemig Distribuição is entitled and the tariff in fact charged to consumers has been recognized in Cemig’s financial reporting as a Regulatory Asset.
Ebitda: Earnings before interest, tax, depreciation and amortization – a measure of a company’s operational cash flow, providing an indicator of the cash flow generated by a company’s principal business.
Ebitda margin: Ebitda/net operating revenue. This provides a view of the company’s cash generation capacity.
Hedge: Financial mechanism for protection against fluctuations in prices – e.g. of commodities -, or variables such as interest rates or exchange rates. Hydroelectric power plant: A generating plant that uses the mechanical energy of falling water to operate electricity generators. Manageable costs: Costs that essentially depend on the efficacy of corporate management, such as personnel expenses, materials, outsourced services, etc. – also referred to as
controllable costs.
Net margin: Net income / Net operating revenue – an indication of a business’s profitability.
Outage time per consumer (DEC): Average service outage time per consumer in a given group of consumers over the specified period.
The Extraordinary Tariff Recomposition (RTE): This was a tariff adjustment granted by the government in December 2001 to the distributors and generators of the regions where rationing was imposed. It was one of the conditions of the General Accord for the Electricity Sector: an increase of 2.9% in the tariff of residential consumers (with the exception of Low-Income Residential Consumers), and an increase of 7.9% for other consumers. Its purpose was to make good the losses suffered by distributors and generators as a result of the reduction of consumption imposed by the government. The duration of the adjustment varies in accordance with the time necessary to recover the loss of each concession holder.
The CCC (Fuel Consumption Account): This account was created to accumulate funds to cover the increase in costs associated with greater use of thermal generation plants in the event of drought – since the marginal operating costs of thermal plants are greater than those of hydroelectric plants. All Brazil’s electricity companies are obliged to make an annual contribution to the CCC, calculated on the basis of estimates of the amount of fuel likely to be required by the thermal plants in the following year.

54
The CDE (Energy Development) Account: This is a source of subsidies to make alternative energy sources such as wind and biomass more competitive, and promote universalization of electricity services. It is funded by annual payments made by the concession holders for the use of public assets, and also from penalty payments imposed by Aneel for infringements.
The CRC (Results Compensation Account): Before 1993, electricity concession holders in Brazil were given a guarantee of a rate of return on their investment in the assets used in the provision of electricity to clients, and the tariffs charged to clients were uniform over the whole country. Profits generated by the more profitable concession holders were reallocated to the less profitable concession holders, in such a way that the rate of return on assets was equal to the national average for all of the companies. Though the results for the majority of Brazil’s electricity concession holders were deficits, these were posted by the federal government as assets in the “CRC account” of each company. When the CRC Account, and the concept of guaranteed return, were abolished, concession holders that had positive balances in their “CRC accounts” were able to offset these balances against any liabilities owed to the federal government.
The CVA – the Offsetting Account for Variations of “Portion A” items: “Portion A” is the list, used in the calculation of the electricity distributors’ annual tariff adjustments, of the utility’s cost items that are not under its own control. The CVA mechanism compensates for changes in the list’s total over the year to the new tariff date. The variation –positive or negative – is passed on in the tariff adjustment .
The Global Reversion Reserve (RGR): This is an annual amount included in the costs of concession holders to generate a fund for expansion and improvement of public electricity services. The amounts are paid monthly to Eletrobrás, which is responsible for the management of the resulting fund, and are to be employed in the Procel mechanism.
Thermal power plant: A generating plant that converts chemical energy contained in fossil fuels into electricity.Total return to stockholders: Sum of the dividend yield and the percentage appreciation in the stock price.
TUSD – Toll for Use of the Distribution System: This is paid by generation companies, and by Free Consumers, for the use of the distribution system belonging to the distribution concession holder to which the generator or Free Consumer is connected, and is revised annually in accordance with inflation and the investments made by the distributor in the previous year for maintenance and expansion of its network. The amount is: the quantity of energy contracted with the distribution concession holder for each link point, in kW, multiplied by a tariff in R$/kW set by Aneel.
Volt: Unit of the electrical potential at which energy is supplied.Voltage: For the purposes of efficient transport of electrical energy over transmission lines from the generating plant to the consumer, there are various levels of transmission
voltage. Similarly, electricity is used by consumers at various different voltage levels.
Watt (W): Unit of power required for a device to operate. 1,000 watts is a kilowatt (kW), 1 million watt is a Megawatt (MW), and 1 billion watts is a Gigawatt (GW).
Watt-hour: Measure of energy (work done by electric power): The kilowatt hour, Megawatt hour, Gigawatt hour and Terawatt hour (KWh, MWh, GWh, TWh) respectively represent 1,000, 1 million, 1 billion and 1 trillion watt-hours.
Glossary
Related Documents