1 Growth Opportunities in Soft Drinks Innovation, new product development and detailed market analysis Reference Code: BI00049-008 Publication Date: December 2011

Welcome message from author
This document is posted to help you gain knowledge. Please leave a comment to let me know what you think about it! Share it to your friends and learn new things together.
Transcript
1
Growth Opportunities in Soft Drinks
Innovation, new product development and detailed market analysis Reference Code: BI00049-008
Publication Date: December 2011
2
John Band John Band is an experienced FMCG analyst, writer and consultant, with a particular focus on the drinks
industry. He has led consulting projects for major clients across the drinks sector, has presented on drinks
topics at key industry forums, and has been quoted on drinks marketing topics by publications including the
BBC, the Economist and the Wall Street Journal.
John holds a BA and MA from the University of Oxford in Philosophy, Politics & Economics, and a Master of
Digital Communications from the University of Sydney.
Disclaimer Copyright © 2011 Business Insights Ltd
This Management Report is published by Business Insights Ltd. All rights reserved. Reproduction or
redistribution of this Management Report in any form for any purpose is expressly prohibited without the prior
consent of Business Insights Ltd.
The views expressed in this Management Report are those of the publisher, not of Business Insights.
Business Insights Ltd accepts no liability for the accuracy or completeness of the information, advice or
comment contained in this Management Report or for any actions taken in reliance thereon.
While information, advice or comment is believed to be correct at the time of publication, no responsibility
can be accepted by Business Insights Ltd for its completeness or accuracy.
3
Table of Contents
John Band 2
Disclaimer 2
Executive summary 12
Growth opportunities in soft drinks 12 Innovation and new product development 13 Consumer trends driving innovation 14 The future of innovations in soft drinks 15
Chapter 1 Introduction 16
Introduction 16 Market definitions 16 What this report is about 17 Scope of report 17
Chapter 2 Growth opportunities in soft drinks 19
Summary 19 Introduction 20 Market overview 20 Soft drinks overview by category 20
Soft drinks overview by region 25
Category breakdown 30 Bottled water 30
Carbonates 32
Concentrates 33
Functional drinks 34
Juices 36
RTD tea & coffee 38
Smoothies 39
Major country profiles 40
4
Brazil 44
China 45
France 47
Germany 49
India 50
Italy 52
Japan 53
Russia 54
United Kingdom 56
United States 57
Chapter 3 Innovation & new product development 60
Summary 60 Introduction 61 Major soft drinks NPD trends 61 Product claim trends 63
Flavor trends 65
Packaging trends 66
Country and regional trends 68
Innovative products 70
Category-level analysis 74 Bottled water 74
Carbonates 79
Concentrates 84
Functional drinks 89
Juices 94
RTD tea & coffee 99
Smoothies 104
Chapter 4 Consumer trends driving innovation 109

5
Summary 109 Introduction 110 Austerity will drive closer connections with consumers 110 Growth of private label and value brands 111
Mass-premium products are still relevant, although constrained 112
Mass customization will become an important marketing strategy 113
Some austerity trends fit better than others with emerging markets 117
Health and wellness will continue to be a major trend 117 Major drinks players are growing the market but cutting prices 118
New types of functionality can attract non-traditional consumers 119
Regulation and consumer skepticism will remain obstacles 121
Health is becoming important in developing markets 121
Consumer interest in sustainable products remains strong 123 Renewable packaging is becoming mainstream 123
Natural ingredients will become more important across all categories 125
New packaging types allow delivery of active ingredients 126
Convenience remains important, despite economic changes 127 Functional convenience is a powerful trend overlap 127
Convenience needs to be balanced against brand image 128
Convenience is spreading to non-traditional categories and occasions 129
Chapter 5 The future of innovations in soft drinks 131
Summary 131 Introduction 132 Future regional trends 133 The stagnation of western markets 133
China’s shift towards consumption and global power 133
India’s slow, painful journey to consumer capitalism 134
Other developing countries continue to develop 134
Future marketing trends 135 The breakdown of big brands 135
6
The blurring of retailer and manufacturer 135
Personalization will become increasingly important 136
Future consumer trends 136 Demographics will favor health drinks in both west and east 136
Demographic positioning is becoming more complex 137
Novel non-fruit flavors will continue to launch, but will remain unloved 138
Future packaging trends 139 Sustainability will become second nature in packaging 139
Health concerns will also spread into packaging 140
New technologies will deliver consumer benefits 140
Appendix 142
Category-level definitions 142 Bottled water 142
Carbonates 142
Concentrates 143
Functional drinks 143
Juices 144
RTD tea & coffee 144
Smoothies 145
Methodology 145

7
Table of figures Figure 1: Global soft drinks value by category ($ bn), 2005-2015 21
Figure 2: Global soft drinks volume by category (liters bn), 2005-2015 22
Figure 3: Global soft drinks value & volume growth by category, 2005-10 23
Figure 4: Global soft drinks value & volume growth forecast by category, 2010-15 24
Figure 5: Global soft drinks price growth by category, 2005-2015 25
Figure 6: Global soft drinks value by region ($ bn), 2005-2015 26
Figure 7: Global soft drinks volume by region (liters bn), 2005-2015 27
Figure 8: Global soft drinks value & volume growth by region, 2005-2010 28
Figure 9: Global soft drinks forecast value & volume growth by region, 2010-2015 29
Figure 10: Global soft drinks price growth by region, 2005-2015 30
Figure 11: Soft drinks value growth by major country, 2005-2015 41
Figure 12: Soft drinks volume growth by major country, 2005-2015 42
Figure 13: Soft drinks price growth by major country, 2005-2015 43
Figure 14: Coca-Cola’s Minute Maid Pulpy was developed in China and rolled out worldwide 47
Figure 15: Soft drinks new product launches by category, 2006-2011 62
Figure 16: Word cloud showing product claims for new soft drinks launches, 2006/2011 65
Figure 17: Within the dominant category of bottles, there is still substantial room for innovation 68
Figure 18: Soft drinks new product launches by region, 2006-2011 69
Figure 19: Innovative new product launches by innovation type, 2006-2011 71
Figure 20: Innovative new product launches by category, 2006-2011 72
Figure 21: Innovative ‘energy shots’ from Red Bull and Monster Hitman were ultimately unsuccessful 73
Figure 22: Word cloud showing product claims for new bottled water launches, 2006/2011 76
Figure 23: Many North American retailers have launched ranges of premium private label flavored bottled waters 77
Figure 24: Bottled water new product launches by region, 2006-2011 79
Figure 25: Word cloud showing product claims for new carbonates launches, 2006/2011 81
Figure 26: Even in mid-income markets dominated by cola, most new launches are fruit-flavored 83
Figure 27: Carbonates new product launches by region, 2006-2011 84
Figure 28: Word cloud showing product claims for new concentrates launches, 2006/2011 86
Figure 29: Concentrates new product launches by region, 2006-2011 88

8
Figure 30: Powder concentrates dominate in Latin America, including premium on-trend variants 89
Figure 31: Word cloud showing product claims for new functional drinks launches, 2006/201191
Figure 32: Lucozade Sports Lite has a superficial sports positioning, but is primarily aimed at lifestyle users 92
Figure 33: Functional drinks new product launches by region, 2006-2011 94
Figure 34: Word cloud showing product claims for new juices launches, 2006/2011 96
Figure 35: Juices new product launches by region, 2006-2011 98
Figure 36: Premium nectars and fruit drinks are popular launches in Latin America 99
Figure 37: Word cloud showing product claims for new RTD tea & coffee launches, 2006/2011 101
Figure 38: RTD tea & coffee new product launches by region, 2006-2011 103
Figure 39: Europe’s adoption of natural RTD teas cuts across countries and positionings 104
Figure 40: Word cloud showing product claims for new smoothies launches, 2006/2011 106
Figure 41: Protein Plus Parfait Smoothie is a novel formulation, but a conventional strawberry flavor 108
Figure 42: Tymark Fruit of the World and Gold Digger tap into the mass-premium trend in very different ways 113
Figure 43: Starbucks’ Frappuccino website allows customers to create their own virtual drink114
Figure 44: VitaSoy launched 70 limited edition packs with greeting messages, and also allowed full customization via its website 115
Figure 45: Coca-Cola has rolled out personalized Coke cans and bottles in Australia 116
Figure 46: The Tropicana Essentials range is PepsiCo’s attempt to enter the functional drinks market 118
Figure 47: Drinkoff Sobering Jam and Mind Essential Confidence Shot both offer unusual functional benefits 119
Figure 48: New types of functional drinks target specific conditions and consumer types 120
Figure 49: Brazilian brand Sunlover is hoping to succeed where Nestle’s Glowelle failed 121
Figure 50: Soft drinks with health claims are becoming increasingly popular in China 122
Figure 51: Key drivers behind consumer interest in sustainable drinks 123
Figure 52: Coca-Cola and Pepsi have both launched sustainably-positioned recyclable bottle types 124
Figure 53: Coca-Cola has used natural sweetener Stevia in mid-sugar products in France and Switzerland 125
Figure 54: Beetroot and olives are examples of non-traditional naturally functional drinks ingredients 126
9
Figure 55: Activate Workout and Boost Kid Essentials are both finally mixed as part of the consumer’s drinking process 127
Figure 56: More functional products are adopting a convenience/on-the-go positioning 128
Figure 57: Pepsi rolled out small-serve diet cans of very different dimensions in the US and UK in 2011 129
Figure 58: Mio is an innovative ‘water enhancer’, redefining the concentrates category 130
Figure 59: Key actionable recommendations for global soft drinks innovation 132
Figure 60: Child-focused Bot Water was relaunched as a drink without a specific demographic positioning 138
Figure 61: It seems unlikely that these salt-based soft drinks will reach the mainstream 139
Figure 62: Energy Balls and King Energy both include novel packaging types 141
10
Table of tables Table 1: Global bottled water market by category, 2005-2015 31
Table 2: Global carbonates market by category, 2005-2015 33
Table 3: Global concentrates market by category, 2005-2015 34
Table 4: Global functional drinks market by category, 2005-2015 35
Table 5: Global juices market by category, 2005-2015 37
Table 6: Global RTD tea & coffee market by category, 2005-2015 39
Table 7: Global smoothies market by category, 2005-2015 40
Table 8: Brazil soft drinks market by category, 2005-2015 45
Table 9: China soft drinks market by category, 2005-2015 46
Table 10: France soft drinks market by category, 2005-2015 48
Table 11: Germany soft drinks market by category, 2005-2015 50
Table 12: India soft drinks market by category, 2005-2015 51
Table 13: Italy soft drinks market by category, 2005-2015 52
Table 14: Japan soft drinks market by category, 2005-2015 54
Table 15: Russia v soft drinks market by category, 2005-2015 55
Table 16: United Kingdom soft drinks market by category, 2005-2015 57
Table 17: United States soft drinks market by category, 2005-2015 59
Table 18: Soft drinks new product launches by product claim, 2006-2011 63
Table 19: Soft drinks new product launches by flavor, 2006-2011 66
Table 20: Soft drinks new product launches by packaging type, 2006-2011 67
Table 21: Soft drinks new product launches by country, 2006-2011 70
Table 22: Bottled water new product launches by product claim, 2006-2011 75
Table 23: Bottled water new product launches by flavor, 2006-2011 78
Table 24: Carbonates new product launches by product claim, 2006-2011 80
Table 25: Carbonates new product launches by flavor, 2006-2011 82
Table 26: Concentrates new product launches by product claim, 2006-2011 85
Table 27: Concentrates new product launches by flavor, 2006-2011 87
Table 28: Functional drinks new product launches by product claim, 2006-2011 90
Table 29: Functional drinks new product launches by flavor, 2006-2011 93
Table 30: Juices new product launches by product claim, 2006-2011 95
Table 31: Juices new product launches by flavor, 2006-2011 97
Table 32: RTD tea & coffee new product launches by product claim, 2006-2011 100
Table 33: RTD tea & coffee new product launches by flavor, 2006-2011 102
11
Table 34: Smoothies new product launches by product claim, 2006-2011 105
Table 35: Smoothies new product launches by flavor, 2006-2011 107
Table 36: Bottled water definitions 142
Table 37: Carbonates definitions 142
Table 38: Concentrates definitions 143
Table 39: Functional drinks definitions 143
Table 40: Juices definitions 144
Table 41: RTD tea & coffee definitions 144
Table 42: Smoothies definitions 145

12
Executive summary
Growth opportunities in soft drinks Total global retail soft drinks sales were $504bn in 2010, having risen from $435bn in 2005 at a
compound annual growth rate (CAGR) of 3.0%. The largest category at $191bn was carbonates, with
bottled water second at $99bn and juices third at $84bn.
The fastest growing category from 2010-2015 will be functional drinks, which will grow at 5.0% per year
to reach $61bn. Bottled water will grow at 4.8% driving the total market to $125bn, while concentrates
will be the third-fastest-growing category at 3.3%.
Europe is the largest soft drinks region worldwide, with sales of $188bn (37% of total) worldwide in
2010, followed by North America with sales of $132bn (26%) and Asia-Pacific with $111bn (22%).
The Asia-Pacific market will overtake North America by 2015, with 5.3% annual growth versus 0.4%
annual growth driving Asia-Pacific to $144bn, while North America reaches $135bn. The fastest-
growing market will be South & Central America, with 5.7% annual growth. Europe will remain the
largest market, growing at 2.4% a year to reach $212bn.
Despite the wide disparities in income between different regions, there is surprisingly little variation in
price across regions. In terms of price growth, Asia-Pacific and Africa & Middle East are expected to
modest average price rises in the 2010-2015 period; in North America, average prices will rise just over
1%, while in South & Central America, prices will rise at 0.8%.
The only category that is predicted to see a significant fall in average price per liter between 2010 and
2015 is RTD tea & coffee, with all other categories either showing a flat price or flat growth, compared
to four categories (RTD tea & coffee, carbonates, concentrates and juices) in which average prices fell
in 2005-2010.

13
Innovation and new product development In order to understand and target the most important innovation niches within the soft drinks category, it
is important to have a detailed comprehension of current key innovations: both in the regions and
markets that you are targeting; and innovations from other areas.
Juices have been by far the most important category for NPD innovations within the soft drinks industry
in recent years, making up 31% of new launches despite accounting for a small proportion of total sales
and not being a particularly high growth category in terms of market value or volume.
Concentrates are now the second most important area for soft drinks development, despite their
relatively unfashionable image and relatively low share in many markets, due not least to the strong
position of powder concentrates in fast-growing emerging markets and associated strong levels of
research investment.
‘Upscale’ has fallen from 7% of soft drink product claims to 1% since 2008, while ‘single-serve’ has
fallen from 10% to 6%; on the other hand, private label applied to 2% of launches in 2006 but now
applies to 11%. This is likely driven by consumer reactions to the financial situation.
Positive health claims on soft drink launches have fallen from 19% in 2006 to 16% in 2011; natural,
fresh & organic have risen from 23% to 26%, and free-from claims have risen from 33% to 38%.
Europe has been the most important region for soft drinks launches throughout the 2006-2011 period,
with its share of launches rising to 42% in 2011. The second-placed region is Asia-Pacific, with 24%
share in 2011, and North America is in third position with 17%.
Most ‘innovative’ products tracked are innovative in formulation, accounting for 68% of innovations in
2006 and 79% in 2011. Packaging and positioning are the two other areas in which significant
quantities of innovative products have been tracked, although innovative packaging fell to just 4% in
2011 from 18% in 2006.
14
Consumer trends driving innovation The recessionary behaviors that consumers exhibited in 2009-10 during what appeared to be a
temporary downturn now appear likely to continue to impact on the drinks industry up to the 2015
horizon of this report. The growth in product launches of private label brands, and the decline in
upscale product positioning, are directly related to the global economic situation.
Mass customization, defined as the supply of custom goods in high volumes and at low cost, is a good
way of enhancing brand-consumer relationships, heading off the private label threat, adding greater
perceived value and allowing drinks companies to engage with their consumers more effectively.
Many of the principles required to prosper in recessionary economies can also be applied to staying
ahead in emerging economies. However, although incomes are low, the trend away from conspicuous
consumption is not something that links recessionary and emerging economies.
Although the boom in dedicated functional drinks that characterized the 2000s is no longer such a
major force in the soft drinks market, with over 65s expected to outnumber five to 14 year olds for the
first time in the US by 2014, aging baby boomers with a continued desire to remain young and active,
will be crucial drivers of preventative medicine including healthy drinks.
Several key consumer trends continue to drive interest in sustainable drinks: the importance of health,
as people seek to consume food that is produced non-intensively; media attention as publicity over
climate change and food sustainability drives awareness; the growth of natural & fresh product claims;
the desire to trade up for small indulgences; consumer ethics; and concerns over carbon footprint.
Convenience remains as important to consumers’ lives as it was before the world environment
changed. People who are employed continue to work long hours with long commutes at the beginning
and end; the pressure on working parents remains as strong as ever; and the need – whether real or
imagined – to fit as many hours as possible into the day remains.

15
The future of innovations in soft drinks Low or no growth in most western economies is a given for the next three years and quite possibly
longer; and even when western markets recover, their growth rates will still look stagnant compared to
the rest of the world.
In the short term, rising Chinese consumer spending creates opportunities in the beverage sector, but
in the long run it is likely to lead to Chinese drinks companies that represent serious competition to
existing market players, not just in China but worldwide.
It has become conventional wisdom that major, mass-market drinks are likely to break down, with
consumers no longer displaying the kind of brand loyalty that they once did. This is particularly often
cited for younger consumers, but does not tell the whole story: rather, consumers dip into a portfolio of
brands based on their specific needs at the time.
In the B2C media industry, personalization and disintermediation have become the most important
trends facing the market. It is likely that a similar approach will ultimately reach the drinks industry, as it
gradually becomes more of a technically feasible achievement rather than a pipedream
Functional drinks will be an important way for aging consumers in west and east alike to consume
medications. As the regulatory regime matures, it will be increasingly common for functional ingredients
to be delivered in drinks format, possibly combined with the personalization trend to the point where
people can consume drinks that are directly personalized to their lifestyle needs.
Within the next 10-20 years, drinks packaging will end up becoming 100% recycled and recyclable, and
that this will be accepted by consumers and by the industry as a matter of course.
Packaging will evolve to incorporate new technologies – most notably nanotechnology, but also
advances in cheap electronics, in ergonomics, and in materials science. The main impact of new
packaging technology will be to add functionality to the consumer’s drinking experience.

16
Chapter 1 Introduction
Introduction The soft drinks industry is a large, fast-growing and yet also rapidly maturing industry. In developed-world
markets, traditional categories such as carbonates are stagnating, while the trend of upselling consumers to
premium categories such as energy drinks and smoothies that thrived during the 2000s has been impacted
by recession and discretionary consumer spending cuts in many developed economies. The provision of
novel, value-added but lower-cost innovations has become a key way to win consumer loyalty in these tough
markets. Meanwhile, as per capita consumption levels in mid-income markets rise to developed-world levels,
it is becoming increasingly important for marketers in these countries to offer innovative new products rather
than relying in growth on overall consumption.
Market definitions Business Insights defines the soft drinks industry on a globally consistent basis across market data and
product innovation data. It consists of the following categories:
Bottled water
Carbonates
Concentrates
Functional drinks
Juices
RTD tea & coffee
Smoothies
Detailed category and segment level definitions are included in the Appendix.

17
Only off-trade (retail) sales of packaged soft drinks are included; juices and smoothies made to order on the
premises are not included, and bottled water excludes containers above five liters in size. All volume data is
listed in liters; all value data is listed in US$ at real (i.e. excluding the impact of inflation) prices and constant
2010 exchange rates. Innovations data is based on the Product Launch Analytics database, which aims to
capture key launches consistently across all countries and categories.
What this report is about The soft drinks industry is a more challenging environment than ever before, with a renewed focus on value
for money coupled with continued desires among consumers for premium products that meet their health,
indulgence and convenience needs. This report highlights best-practice across all global markets in meeting
this challenge, helping soft drinks manufacturers to target new product development (NPD) budget to the
most effective uses. It is targeted at marketing and brand managers, strategic decision makers and senior
executives, consultants and researcher working for soft drinks manufacturers, distributors, importers,
marketers and retailers, and consultancy and research firms covering the soft drinks industry.
The report is designed to help companies target appropriate categories and geographies as part of a
channeled new product strategy. It highlights worldwide product innovations, providing inspiration and
examples of best-practice; allows manufacturers to shape regional and global NPD strategy; provides an
analysis of the relationship between socioeconomic trends, category trends and product innovation; and
projects global soft drinks market and category growth over the next five years.
Scope of report The report summarizes innovative and novel product launches across the global soft drinks industry between
January 2006 and November 2011, as reported by Business Insights’ in-house Product Launch Analytics
database of new product launches across the FMCG industry. It analyzes market value and volume data
across the soft drinks industry by value and volume, segmented by region and category. In addition to
considering the market on a regional basis, this report also looks at 10 major countries on a detailed in-depth

18
basis. While they are not necessarily the largest in value or volume terms, they are the markets which
combine the strongest potential, the fastest current growth, the highest current sales, and the most important
centers of innovation. Based on this data, the report presents an analysis of the most important innovation,
new product development and growth trends, globally and on a region/category basis. The information
presented allows industry players to identify the most important growth opportunities and trends to target
within the soft drinks industry.
19
Chapter 2 Growth opportunities in soft drinks
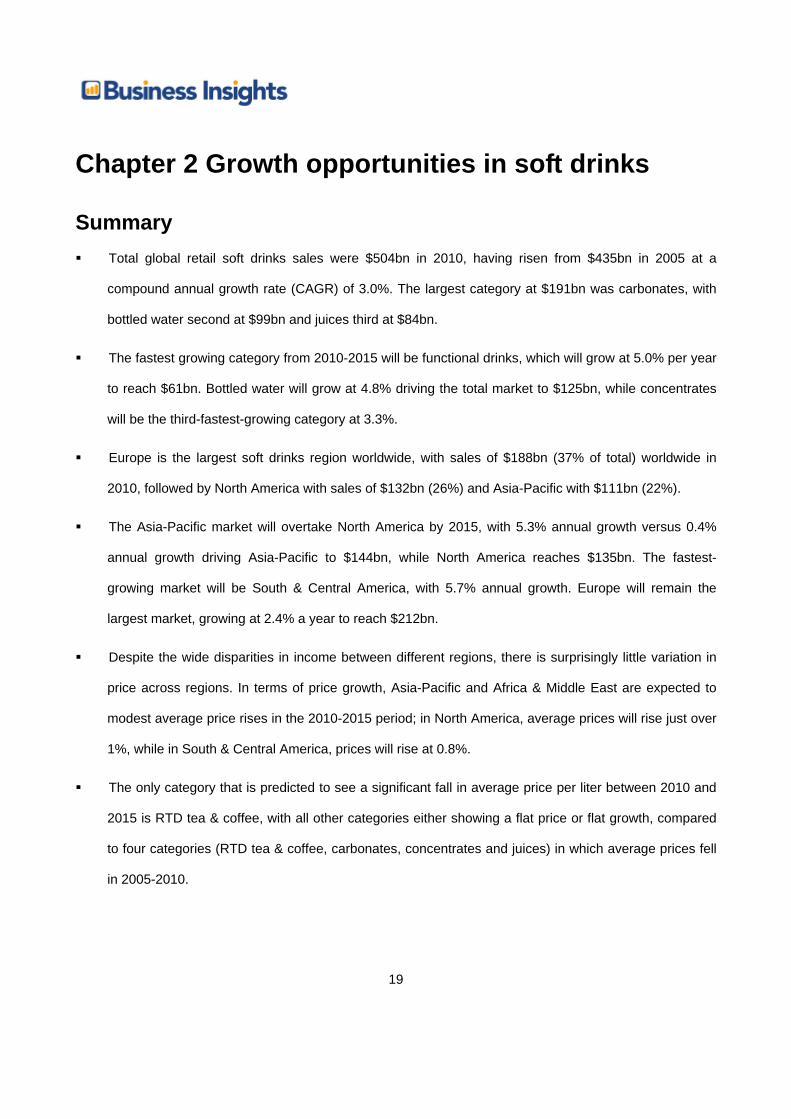
Summary Total global retail soft drinks sales were $504bn in 2010, having risen from $435bn in 2005 at a
compound annual growth rate (CAGR) of 3.0%. The largest category at $191bn was carbonates, with
bottled water second at $99bn and juices third at $84bn.
The fastest growing category from 2010-2015 will be functional drinks, which will grow at 5.0% per year
to reach $61bn. Bottled water will grow at 4.8% driving the total market to $125bn, while concentrates
will be the third-fastest-growing category at 3.3%.
Europe is the largest soft drinks region worldwide, with sales of $188bn (37% of total) worldwide in
2010, followed by North America with sales of $132bn (26%) and Asia-Pacific with $111bn (22%).
The Asia-Pacific market will overtake North America by 2015, with 5.3% annual growth versus 0.4%
annual growth driving Asia-Pacific to $144bn, while North America reaches $135bn. The fastest-
growing market will be South & Central America, with 5.7% annual growth. Europe will remain the
largest market, growing at 2.4% a year to reach $212bn.
Despite the wide disparities in income between different regions, there is surprisingly little variation in
price across regions. In terms of price growth, Asia-Pacific and Africa & Middle East are expected to
modest average price rises in the 2010-2015 period; in North America, average prices will rise just over
1%, while in South & Central America, prices will rise at 0.8%.
The only category that is predicted to see a significant fall in average price per liter between 2010 and
2015 is RTD tea & coffee, with all other categories either showing a flat price or flat growth, compared
to four categories (RTD tea & coffee, carbonates, concentrates and juices) in which average prices fell
in 2005-2010.
20
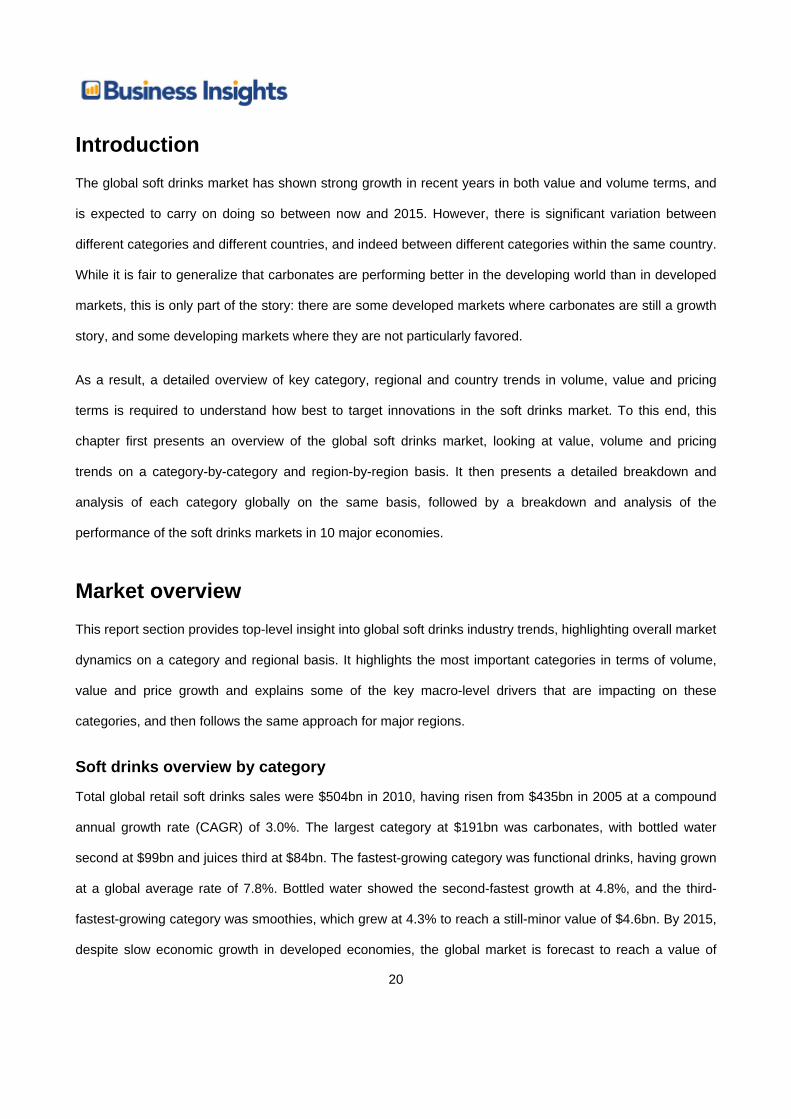
Introduction The global soft drinks market has shown strong growth in recent years in both value and volume terms, and
is expected to carry on doing so between now and 2015. However, there is significant variation between
different categories and different countries, and indeed between different categories within the same country.
While it is fair to generalize that carbonates are performing better in the developing world than in developed
markets, this is only part of the story: there are some developed markets where carbonates are still a growth
story, and some developing markets where they are not particularly favored.
As a result, a detailed overview of key category, regional and country trends in volume, value and pricing
terms is required to understand how best to target innovations in the soft drinks market. To this end, this
chapter first presents an overview of the global soft drinks market, looking at value, volume and pricing
trends on a category-by-category and region-by-region basis. It then presents a detailed breakdown and
analysis of each category globally on the same basis, followed by a breakdown and analysis of the
performance of the soft drinks markets in 10 major economies.
Market overview This report section provides top-level insight into global soft drinks industry trends, highlighting overall market
dynamics on a category and regional basis. It highlights the most important categories in terms of volume,
value and price growth and explains some of the key macro-level drivers that are impacting on these
categories, and then follows the same approach for major regions.
Soft drinks overview by category
Total global retail soft drinks sales were $504bn in 2010, having risen from $435bn in 2005 at a compound
annual growth rate (CAGR) of 3.0%. The largest category at $191bn was carbonates, with bottled water
second at $99bn and juices third at $84bn. The fastest-growing category was functional drinks, having grown
at a global average rate of 7.8%. Bottled water showed the second-fastest growth at 4.8%, and the third-
fastest-growing category was smoothies, which grew at 4.3% to reach a still-minor value of $4.6bn. By 2015,
despite slow economic growth in developed economies, the global market is forecast to reach a value of
21
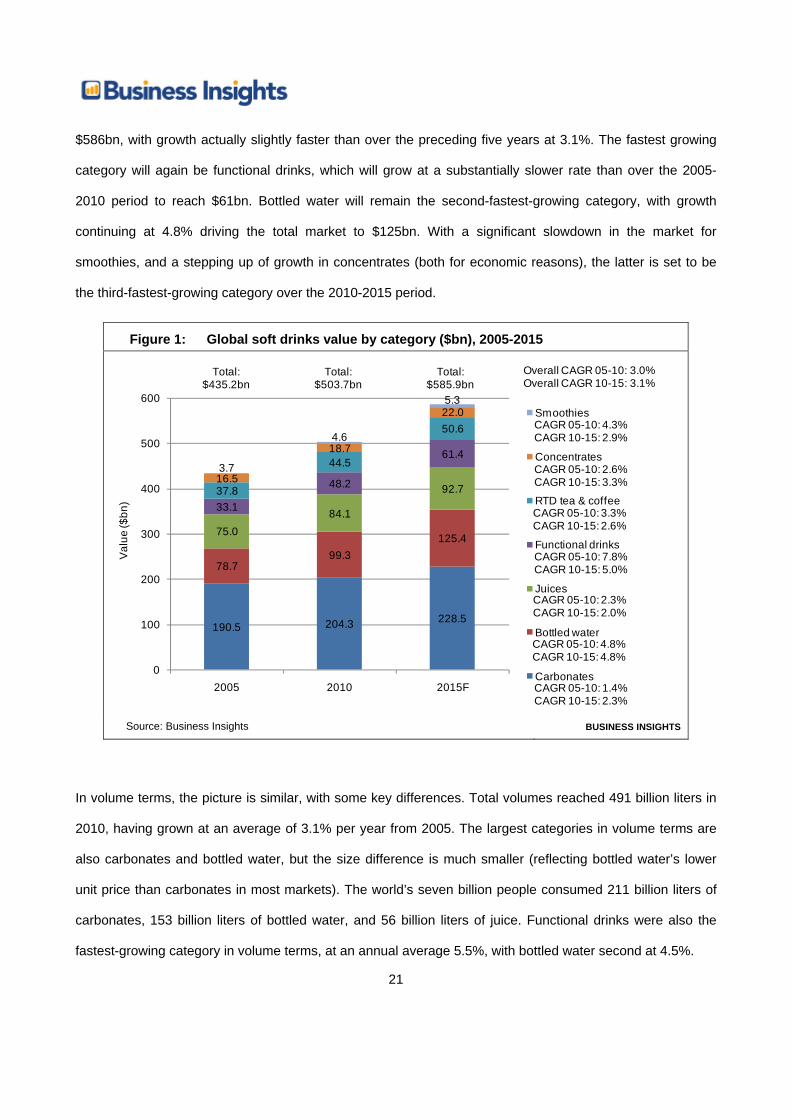
$586bn, with growth actually slightly faster than over the preceding five years at 3.1%. The fastest growing
category will again be functional drinks, which will grow at a substantially slower rate than over the 2005-
2010 period to reach $61bn. Bottled water will remain the second-fastest-growing category, with growth
continuing at 4.8% driving the total market to $125bn. With a significant slowdown in the market for
smoothies, and a stepping up of growth in concentrates (both for economic reasons), the latter is set to be
the third-fastest-growing category over the 2010-2015 period.
Figure 1: Global soft drinks value by category ($bn), 2005-2015
Total: $435.2bn
Total: $503.7bn
Total: $585.9bn
CAGR 05-10: 4.3%CAGR 10-15: 2.9%
CAGR 05-10: 2.6%CAGR 10-15: 3.3%
CAGR 05-10: 3.3%CAGR 10-15: 2.6%
CAGR 05-10: 7.8%CAGR 10-15: 5.0%
CAGR 05-10: 2.3%CAGR 10-15: 2.0%
CAGR 05-10: 4.8%CAGR 10-15: 4.8%
CAGR 05-10: 1.4%CAGR 10-15: 2.3%
Val
ue ($
bn)
Overall CAGR 05-10: 3.0%Overall CAGR 10-15: 3.1%
190.5 204.3 228.5
78.799.3
125.475.084.1
92.733.1
48.2
61.4
37.8
44.5
50.6
16.5
18.7
22.0
3.7
4.6
5.3
0
100
200
300
400
500
600
2005 2010 2015F
Smoothies
Concentrates
RTD tea & coffee
Functional drinks
Juices
Bottled water
Carbonates
Source: Business Insights BUSINESS INSIGHTS
In volume terms, the picture is similar, with some key differences. Total volumes reached 491 billion liters in
2010, having grown at an average of 3.1% per year from 2005. The largest categories in volume terms are
also carbonates and bottled water, but the size difference is much smaller (reflecting bottled water’s lower
unit price than carbonates in most markets). The world’s seven billion people consumed 211 billion liters of
carbonates, 153 billion liters of bottled water, and 56 billion liters of juice. Functional drinks were also the
fastest-growing category in volume terms, at an annual average 5.5%, with bottled water second at 4.5%.
22
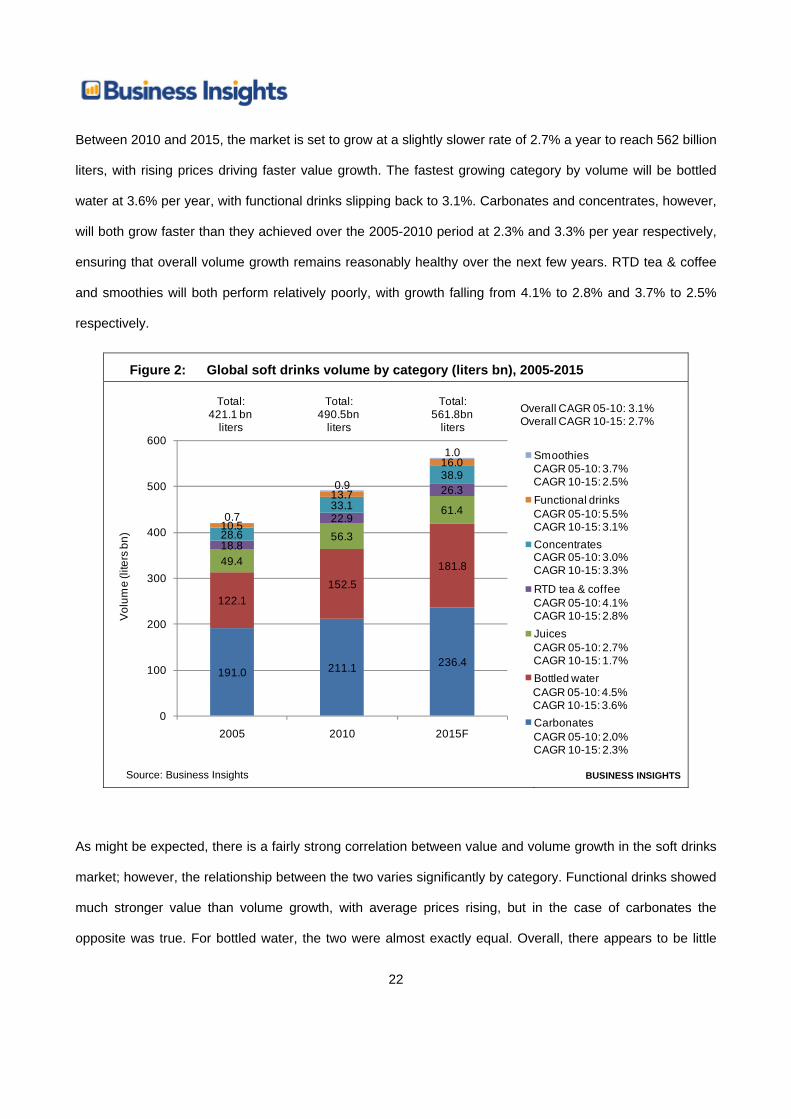
Between 2010 and 2015, the market is set to grow at a slightly slower rate of 2.7% a year to reach 562 billion
liters, with rising prices driving faster value growth. The fastest growing category by volume will be bottled
water at 3.6% per year, with functional drinks slipping back to 3.1%. Carbonates and concentrates, however,
will both grow faster than they achieved over the 2005-2010 period at 2.3% and 3.3% per year respectively,
ensuring that overall volume growth remains reasonably healthy over the next few years. RTD tea & coffee
and smoothies will both perform relatively poorly, with growth falling from 4.1% to 2.8% and 3.7% to 2.5%
respectively.
Figure 2: Global soft drinks volume by category (liters bn), 2005-2015
Total: 421.1 bn
liters
Total: 490.5bn
liters
Total: 561.8bn
liters
CAGR 05-10: 3.7%CAGR 10-15: 2.5%
CAGR 05-10: 5.5%CAGR 10-15: 3.1%
CAGR 05-10: 3.0%CAGR 10-15: 3.3%
CAGR 05-10: 4.1%CAGR 10-15: 2.8%
CAGR 05-10: 2.7%CAGR 10-15: 1.7%
CAGR 05-10: 4.5%CAGR 10-15: 3.6%
CAGR 05-10: 2.0%CAGR 10-15: 2.3%
Volu
me
(lite
rsbn
)
Overall CAGR 05-10: 3.1%Overall CAGR 10-15: 2.7%
191.0 211.1 236.4
122.1152.5
181.849.4
56.3
61.4
18.8
22.9
26.3
28.6
33.1
38.9
10.5
13.7
16.0
0.7
0.9
1.0
0
100
200
300
400
500
600
2005 2010 2015F
Smoothies
Functional drinks
Concentrates
RTD tea & coffee
Juices
Bottled water
Carbonates
Source: Business Insights BUSINESS INSIGHTS
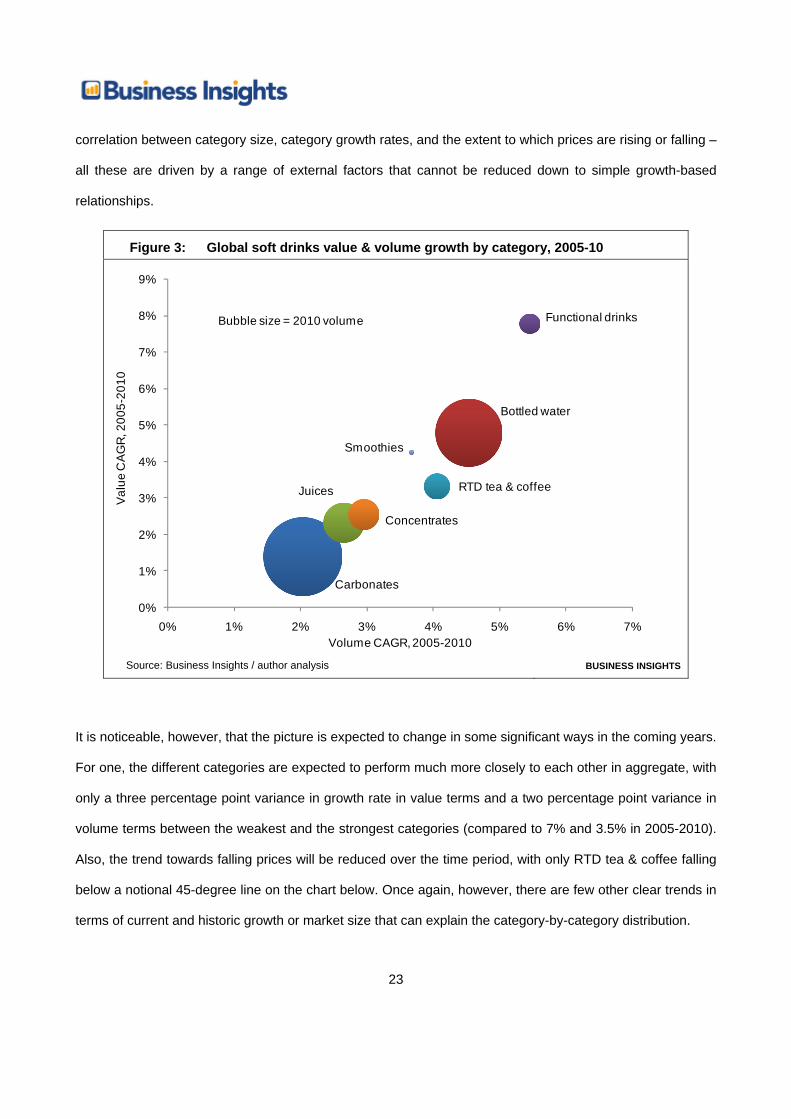
As might be expected, there is a fairly strong correlation between value and volume growth in the soft drinks
market; however, the relationship between the two varies significantly by category. Functional drinks showed
much stronger value than volume growth, with average prices rising, but in the case of carbonates the
opposite was true. For bottled water, the two were almost exactly equal. Overall, there appears to be little
23
correlation between category size, category growth rates, and the extent to which prices are rising or falling –
all these are driven by a range of external factors that cannot be reduced down to simple growth-based
relationships.
Figure 3: Global soft drinks value & volume growth by category, 2005-10
Carbonates
Bottled water
Juices
Functional drinks
RTD tea & coffee
Concentrates
Smoothies
0%
1%
2%
3%
4%
5%
6%
7%
8%
9%
0% 1% 2% 3% 4% 5% 6% 7%
Val
ue C
AG
R, 2
005-
2010
Volume CAGR, 2005-2010
Bubble size = 2010 volume
Source: Business Insights / author analysis BUSINESS INSIGHTS
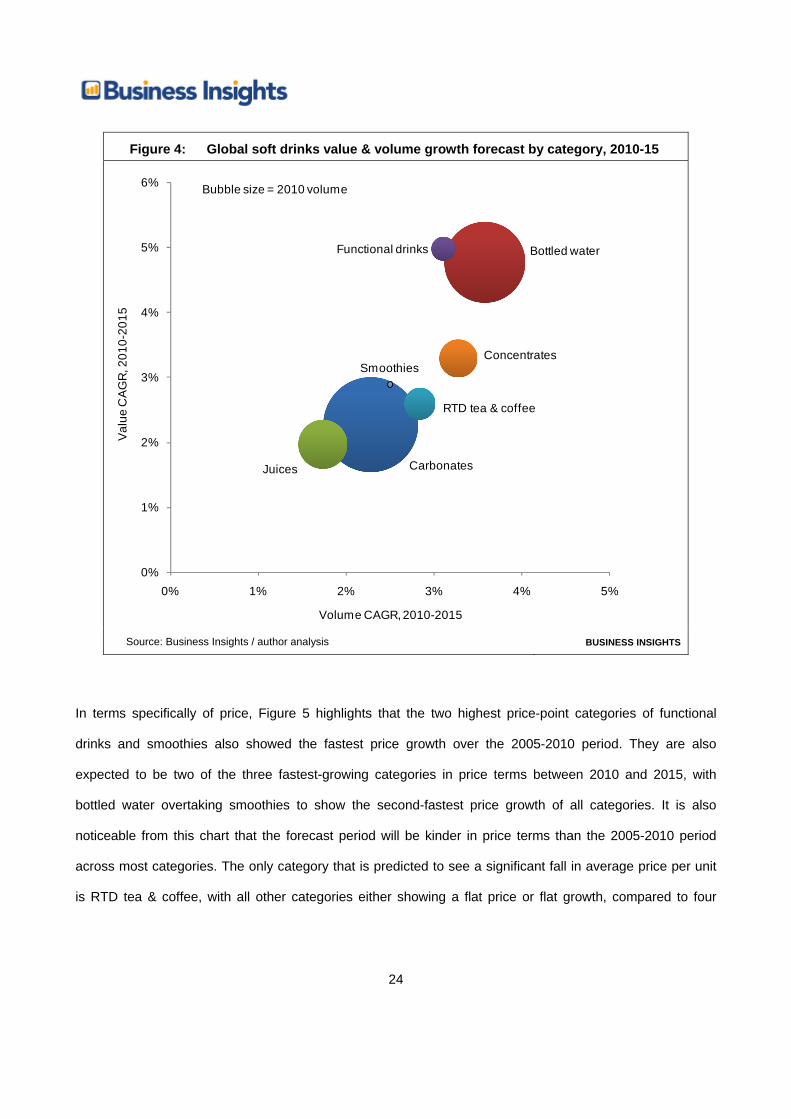
It is noticeable, however, that the picture is expected to change in some significant ways in the coming years.
For one, the different categories are expected to perform much more closely to each other in aggregate, with
only a three percentage point variance in growth rate in value terms and a two percentage point variance in
volume terms between the weakest and the strongest categories (compared to 7% and 3.5% in 2005-2010).
Also, the trend towards falling prices will be reduced over the time period, with only RTD tea & coffee falling
below a notional 45-degree line on the chart below. Once again, however, there are few other clear trends in
terms of current and historic growth or market size that can explain the category-by-category distribution.
24
Figure 4: Global soft drinks value & volume growth forecast by category, 2010-15
Carbonates
Bottled water
Juices
Functional drinks
RTD tea & coffee
ConcentratesSmoothies
0%
1%
2%
3%
4%
5%
6%
0% 1% 2% 3% 4% 5%
Val
ue C
AG
R, 2
010-
2015
Volume CAGR, 2010-2015
Bubble size = 2010 volume
Source: Business Insights / author analysis BUSINESS INSIGHTS
In terms specifically of price, Figure 5 highlights that the two highest price-point categories of functional
drinks and smoothies also showed the fastest price growth over the 2005-2010 period. They are also
expected to be two of the three fastest-growing categories in price terms between 2010 and 2015, with
bottled water overtaking smoothies to show the second-fastest price growth of all categories. It is also
noticeable from this chart that the forecast period will be kinder in price terms than the 2005-2010 period
across most categories. The only category that is predicted to see a significant fall in average price per unit
is RTD tea & coffee, with all other categories either showing a flat price or flat growth, compared to four
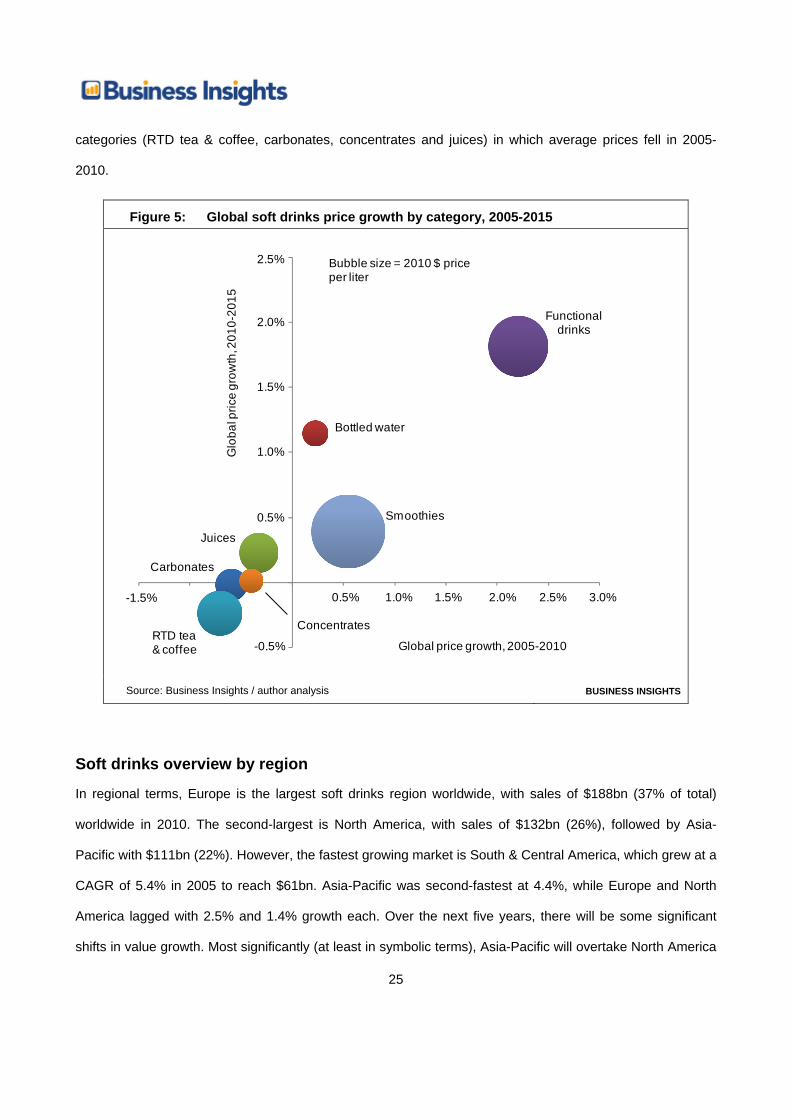
25
categories (RTD tea & coffee, carbonates, concentrates and juices) in which average prices fell in 2005-
2010.
Figure 5: Global soft drinks price growth by category, 2005-2015
Carbonates
Bottled water
Juices
Functional drinks
RTD tea & coffee
Concentrates
Smoothies
Glo
bal p
rice
grow
th, 2
010-
2015
Global price growth, 2005-2010
-1.5% 1.0% 1.5% 2.0% 2.5%0.5% 3.0%
1.0%
1.5%
2.0%
2.5%
0.5%
-0.5%
Bubble size = 2010 $ price per liter
Source: Business Insights / author analysis BUSINESS INSIGHTS
Soft drinks overview by region
In regional terms, Europe is the largest soft drinks region worldwide, with sales of $188bn (37% of total)
worldwide in 2010. The second-largest is North America, with sales of $132bn (26%), followed by Asia-
Pacific with $111bn (22%). However, the fastest growing market is South & Central America, which grew at a
CAGR of 5.4% in 2005 to reach $61bn. Asia-Pacific was second-fastest at 4.4%, while Europe and North
America lagged with 2.5% and 1.4% growth each. Over the next five years, there will be some significant
shifts in value growth. Most significantly (at least in symbolic terms), Asia-Pacific will overtake North America
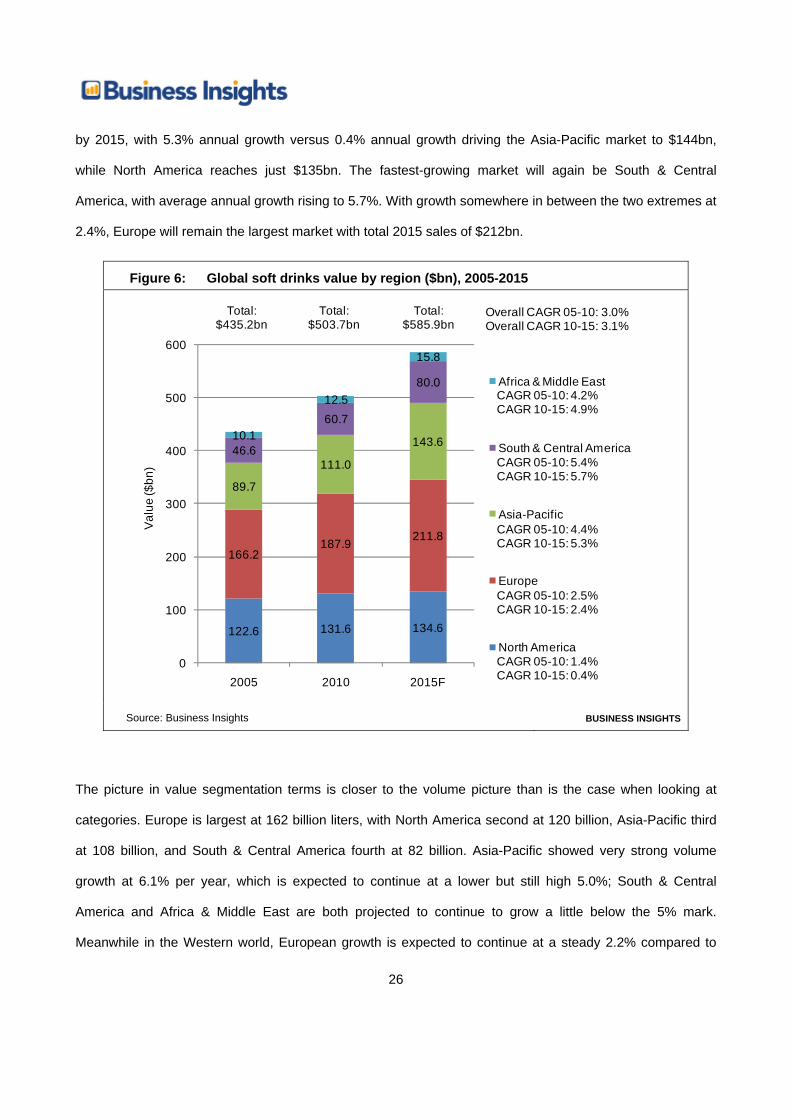
26
by 2015, with 5.3% annual growth versus 0.4% annual growth driving the Asia-Pacific market to $144bn,
while North America reaches just $135bn. The fastest-growing market will again be South & Central
America, with average annual growth rising to 5.7%. With growth somewhere in between the two extremes at
2.4%, Europe will remain the largest market with total 2015 sales of $212bn.
Figure 6: Global soft drinks value by region ($bn), 2005-2015
Total: $435.2bn
Total: $503.7bn
Total: $585.9bn
CAGR 05-10: 4.2%CAGR 10-15: 4.9%
CAGR 05-10: 5.4%CAGR 10-15: 5.7%
CAGR 05-10: 4.4%CAGR 10-15: 5.3%
CAGR 05-10: 2.5%CAGR 10-15: 2.4%
CAGR 05-10: 1.4%CAGR 10-15: 0.4%
Val
ue ($
bn)
Overall CAGR 05-10: 3.0%Overall CAGR 10-15: 3.1%
122.6 131.6 134.6
166.2187.9 211.8
89.7
111.0
143.646.6
60.7
80.0
10.1
12.5
15.8
0
100
200
300
400
500
600
2005 2010 2015F
Africa & Middle East
South & Central America
Asia-Pacific
Europe
North America
Source: Business Insights BUSINESS INSIGHTS
The picture in value segmentation terms is closer to the volume picture than is the case when looking at
categories. Europe is largest at 162 billion liters, with North America second at 120 billion, Asia-Pacific third
at 108 billion, and South & Central America fourth at 82 billion. Asia-Pacific showed very strong volume
growth at 6.1% per year, which is expected to continue at a lower but still high 5.0%; South & Central
America and Africa & Middle East are both projected to continue to grow a little below the 5% mark.
Meanwhile in the Western world, European growth is expected to continue at a steady 2.2% compared to

27
2.4% over the previous period. However, North America is expected to go from slow volume growth of 0.4%
to a 0.6% decline in total sales over the same period. As in values, Asia-Pacific will overtake North America
over the time period – but when considered in volume terms, Latin America is also starting to catch up with
its neighbor.
Figure 7: Global soft drinks volume by region (liters bn), 2005-2015
Total: 421.1 bn
liters
Total: 490.5bn
liters
Total: 561.8bn
liters
Vol
ume
(lite
rsbn
)
Overall CAGR 05-10: 3.1%Overall CAGR 10-15: 2.7%
CAGR 05-10: 4.9%CAGR 10-15: 4.6%
CAGR 05-10: 5.0%CAGR 10-15: 4.8%
CAGR 05-10: 6.1%CAGR 10-15: 5.0%
CAGR 05-10: 2.4%CAGR 10-15: 2.2%
CAGR 05-10: 0.4%CAGR 10-15: -0.6%
118.0 120.1 116.8
144.4 162.4 180.9
80.0107.7
137.664.4
82.1
103.6
14.3
18.2
22.8
0
100
200
300
400
500
600
2005 2010 2015F
Africa & Middle East
South & Central America
Asia-Pacific
Europe
North America
Source: Business Insights BUSINESS INSIGHTS
There is a slightly closer relationship between growth rates and the relationship between value and volume
growth when considering the soft drinks market on a regional basis. The slower-growing markets of Europe
and the US saw prices rise faster than volumes in the 2005-2010 period, while the faster-growing Asia-
Pacific and Africa & Middle East markets saw the opposite. However, this correlation does not apply to the
significant South & Central America market, where value growth outstripped volume growth despite the fact
that both were strong. Overall, while it is feasible to assume that strong volume growth in developing
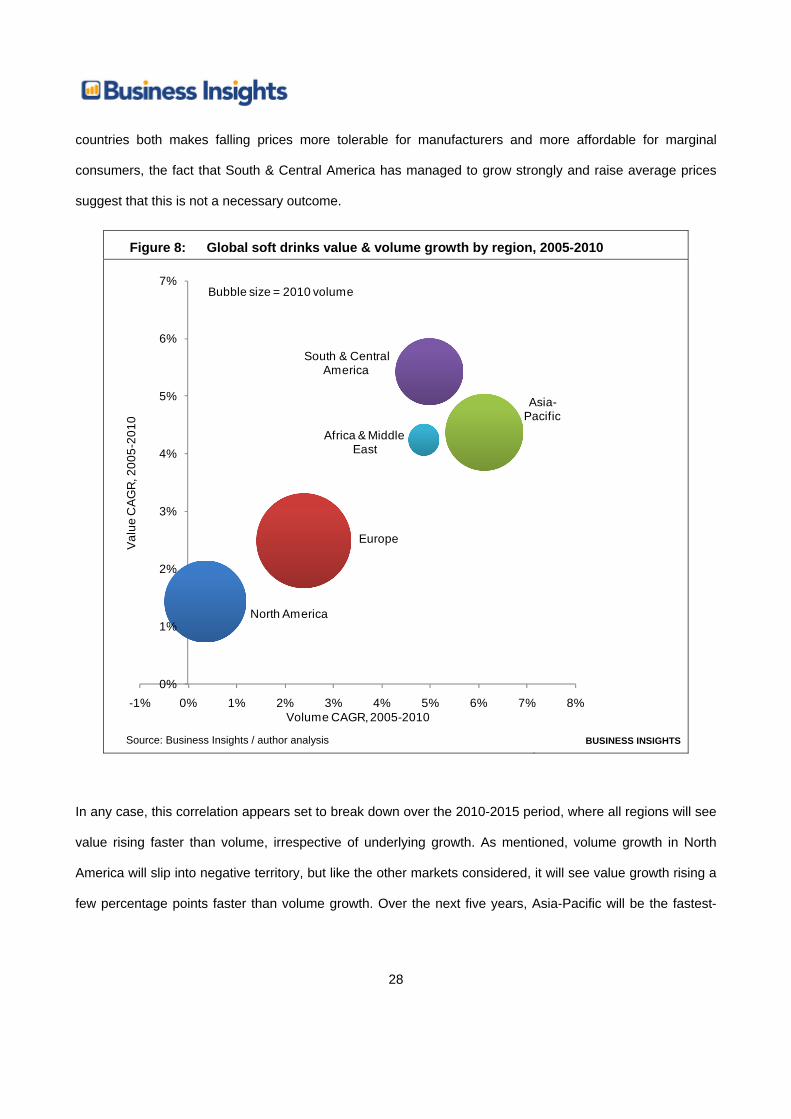
28
countries both makes falling prices more tolerable for manufacturers and more affordable for marginal
consumers, the fact that South & Central America has managed to grow strongly and raise average prices
suggest that this is not a necessary outcome.
Figure 8: Global soft drinks value & volume growth by region, 2005-2010
North America
Europe
Asia-Pacific
South & Central America
Africa & Middle East
0%
1%
2%
3%
4%
5%
6%
7%
-1% 0% 1% 2% 3% 4% 5% 6% 7% 8%
Val
ue C
AG
R, 2
005-
2010
Volume CAGR, 2005-2010
Bubble size = 2010 volume
Source: Business Insights / author analysis BUSINESS INSIGHTS
In any case, this correlation appears set to break down over the 2010-2015 period, where all regions will see
value rising faster than volume, irrespective of underlying growth. As mentioned, volume growth in North
America will slip into negative territory, but like the other markets considered, it will see value growth rising a
few percentage points faster than volume growth. Over the next five years, Asia-Pacific will be the fastest-
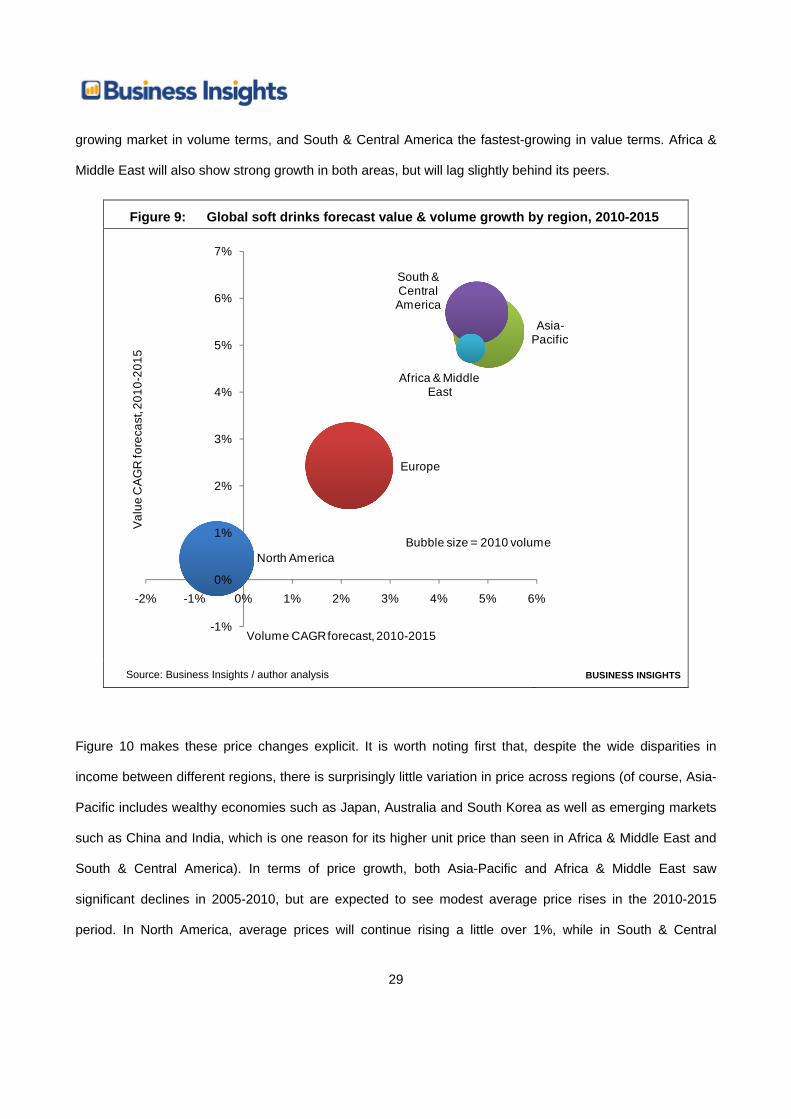
29
growing market in volume terms, and South & Central America the fastest-growing in value terms. Africa &
Middle East will also show strong growth in both areas, but will lag slightly behind its peers.
Figure 9: Global soft drinks forecast value & volume growth by region, 2010-2015
North America
Europe
Asia-Pacific
South & Central America
Africa & Middle East
-1%
0%
1%
2%
3%
4%
5%
6%
7%
-2% -1% 0% 1% 2% 3% 4% 5% 6%
Val
ue C
AG
R fo
reca
st, 2
010-
2015
Volume CAGR forecast, 2010-2015
Bubble size = 2010 volume
Source: Business Insights / author analysis BUSINESS INSIGHTS
Figure 10 makes these price changes explicit. It is worth noting first that, despite the wide disparities in
income between different regions, there is surprisingly little variation in price across regions (of course, Asia-
Pacific includes wealthy economies such as Japan, Australia and South Korea as well as emerging markets
such as China and India, which is one reason for its higher unit price than seen in Africa & Middle East and
South & Central America). In terms of price growth, both Asia-Pacific and Africa & Middle East saw
significant declines in 2005-2010, but are expected to see modest average price rises in the 2010-2015
period. In North America, average prices will continue rising a little over 1%, while in South & Central

30
America, average soft drinks prices are expected to rise at over 0.8% compared with under 0.5% in the
2005-2010 period. In all cases, these price rises will be driven by premiumization and resource scarcity.
Figure 10: Global soft drinks price growth by region, 2005-2015
North America
Europe
Asia-Pacific
South & Central America
Africa & Middle East
0.0%
0.5%
1.0%
1.5%
-2% -1% 0% 1% 2%
Wei
ghte
d gl
obal
pric
e gr
owth
, 201
0-20
15
Weighted global price growth, 2005-2010
Bubble size = 2010 $ price per liter
Source: Business Insights / author analysis BUSINESS INSIGHTS
Category breakdown It is now worth examining the key categories in the soft drinks market on an individual basis, to provide a
more detailed profile, to clarify what is included and key market dynamics.
Bottled water
Bottled water has shown strong value growth worldwide in recent years, with sales rising at an average
annual rate of 4.8% over the 2005-2010 period to reach $99bn worldwide. It is the second-largest soft drinks
category by both value and volume, behind carbonates on both fronts. The largest single category,

31
accounting for two thirds of sales by value and three quarters of sales by volume, is unflavored still water.
Perhaps surprisingly, this has also been the fastest-growing category in value terms: although developed
market consumers are shifting toward flavored varieties to some extent, this trend has been far outweighed
by the shift from unreliable water supplies in the developing world as incomes and health consciousness rise.
Table 1: Global bottled water market by category, 2005-2015
Value ($bn) 2005 2010 2015 CAGR 05-10 CAGR 10-15Still unflavored 50 65 84 5.1% 5.4%Sparkling unflavored 23 28 34 4.4% 3.7%Sparkling flavored 4 4 5 3.0% 3.0%Still flavored 2 2 3 4.4% 4.7%Overall 79 99 125 4.8% 4.8% Volume (liters bn) 2005 2010 2015 CAGR 05-10 CAGR 10-15Still unflavored 90 113 137 4.8% 3.9%Sparkling unflavored 26 32 36 3.7% 2.5%Sparkling flavored 4 4 5 4.1% 3.6%Still flavored 2 3 3 5.2% 3.8%Overall 122 152 182 4.5% 3.6% Price ($/liter) 2005 2010 2015 CAGR 05-10 CAGR 10-15Still unflavored 0.56 0.57 0.61 0.3% 1.4%Sparkling unflavored 0.85 0.88 0.94 0.7% 1.2%Sparkling flavored 1.06 1.01 0.98 -1.1% -0.6%Still flavored 0.84 0.80 0.84 -0.8% 0.9%Average 0.64 0.65 0.69 0.2% 1.1%
Source: Business Insights BUSINESS INSIGHTS
In volume terms, 152 billion liters of bottled water were consumed in 2010. Still flavored water volume growth
has slightly outpaced unflavored water, with both types outpacing sparkling waters. The global average price
of bottled water is 65 cents a liter, with unflavored water by far the cheapest category, at 57 cents. However,
flavored categories have become cheaper over the last five years as their status has become increasingly

32
mainstream. Prices are expected to show stronger growth over the 2010-2015 period than between 2005-
2010, as markets such as Brazil and China mature to the extent that price rises can be implemented.
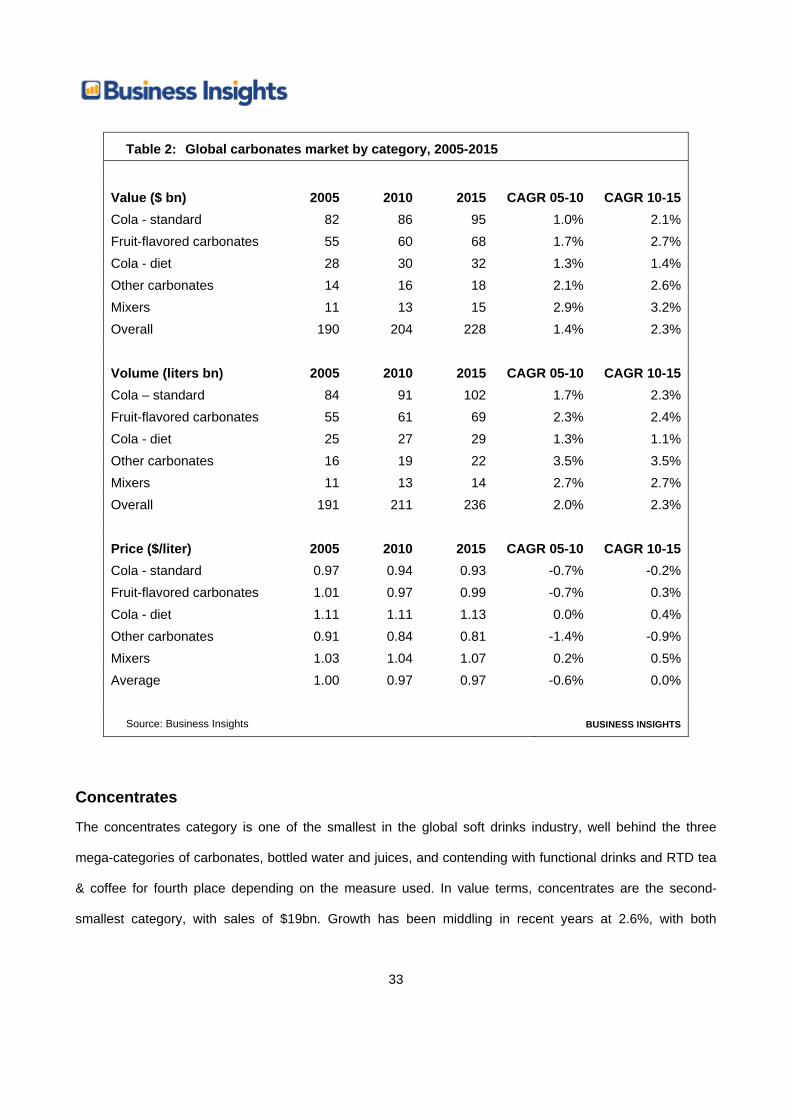
Carbonates
Carbonates is the largest soft drinks category in both value and volume terms, with 211 billion liters
consumed and total sales of $204 billion in 2010. Although growth was relatively slow from 2005-2010, it is
expected to rise to 2.3% in value and volume terms from 2010-2015. Cola drinks account for 57%, with a 74-
26 split between regular and diet colas in value terms, although this gap has been narrowing over time. Most
of the rest of the market is made up of fruit-flavored drinks. In volume terms, the category share picture is
similar, but growth trends are reversed between diet and standard colas, and diet colas have a smaller
share. This reflects the fact that diet colas are primarily consumed in developed markets where consumers
are concerned with health issues and are more calorie-conscious, whereas the major growth markets for
carbonates are emerging markets where consumers are (at least for the time being) still actively seeking
energy. These trends are reflected in pricing data. Across most categories, and on average, prices fell in real
terms from 2005-2010, reflecting the shift in consumption from developed to developing markets. Diet cola is
an exception, with prices remaining static in real terms. The trend of falling prices is expected to reverse to a
small extent over the 2010-2015 period.
33
Table 2: Global carbonates market by category, 2005-2015
Value ($ bn) 2005 2010 2015 CAGR 05-10 CAGR 10-15Cola - standard 82 86 95 1.0% 2.1%Fruit-flavored carbonates 55 60 68 1.7% 2.7%Cola - diet 28 30 32 1.3% 1.4%Other carbonates 14 16 18 2.1% 2.6%Mixers 11 13 15 2.9% 3.2%Overall 190 204 228 1.4% 2.3% Volume (liters bn) 2005 2010 2015 CAGR 05-10 CAGR 10-15Cola – standard 84 91 102 1.7% 2.3%Fruit-flavored carbonates 55 61 69 2.3% 2.4%Cola - diet 25 27 29 1.3% 1.1%Other carbonates 16 19 22 3.5% 3.5%Mixers 11 13 14 2.7% 2.7%Overall 191 211 236 2.0% 2.3% Price ($/liter) 2005 2010 2015 CAGR 05-10 CAGR 10-15Cola - standard 0.97 0.94 0.93 -0.7% -0.2%Fruit-flavored carbonates 1.01 0.97 0.99 -0.7% 0.3%Cola - diet 1.11 1.11 1.13 0.0% 0.4%Other carbonates 0.91 0.84 0.81 -1.4% -0.9%Mixers 1.03 1.04 1.07 0.2% 0.5%Average 1.00 0.97 0.97 -0.6% 0.0%
Source: Business Insights BUSINESS INSIGHTS
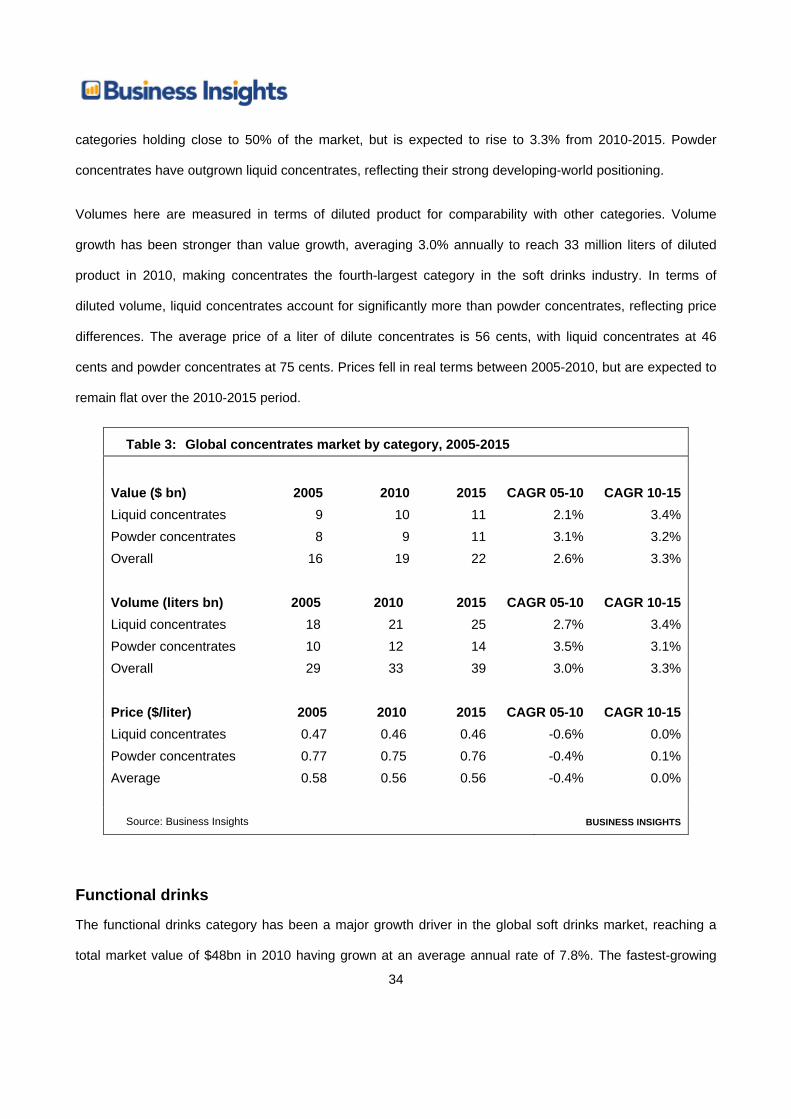
Concentrates
The concentrates category is one of the smallest in the global soft drinks industry, well behind the three
mega-categories of carbonates, bottled water and juices, and contending with functional drinks and RTD tea
& coffee for fourth place depending on the measure used. In value terms, concentrates are the second-
smallest category, with sales of $19bn. Growth has been middling in recent years at 2.6%, with both
34
categories holding close to 50% of the market, but is expected to rise to 3.3% from 2010-2015. Powder
concentrates have outgrown liquid concentrates, reflecting their strong developing-world positioning.
Volumes here are measured in terms of diluted product for comparability with other categories. Volume
growth has been stronger than value growth, averaging 3.0% annually to reach 33 million liters of diluted
product in 2010, making concentrates the fourth-largest category in the soft drinks industry. In terms of
diluted volume, liquid concentrates account for significantly more than powder concentrates, reflecting price
differences. The average price of a liter of dilute concentrates is 56 cents, with liquid concentrates at 46
cents and powder concentrates at 75 cents. Prices fell in real terms between 2005-2010, but are expected to
remain flat over the 2010-2015 period.
Table 3: Global concentrates market by category, 2005-2015
Value ($ bn) 2005 2010 2015 CAGR 05-10 CAGR 10-15Liquid concentrates 9 10 11 2.1% 3.4%Powder concentrates 8 9 11 3.1% 3.2%Overall 16 19 22 2.6% 3.3% Volume (liters bn) 2005 2010 2015 CAGR 05-10 CAGR 10-15Liquid concentrates 18 21 25 2.7% 3.4%Powder concentrates 10 12 14 3.5% 3.1%Overall 29 33 39 3.0% 3.3% Price ($/liter) 2005 2010 2015 CAGR 05-10 CAGR 10-15Liquid concentrates 0.47 0.46 0.46 -0.6% 0.0%Powder concentrates 0.77 0.75 0.76 -0.4% 0.1%Average 0.58 0.56 0.56 -0.4% 0.0%
Source: Business Insights BUSINESS INSIGHTS
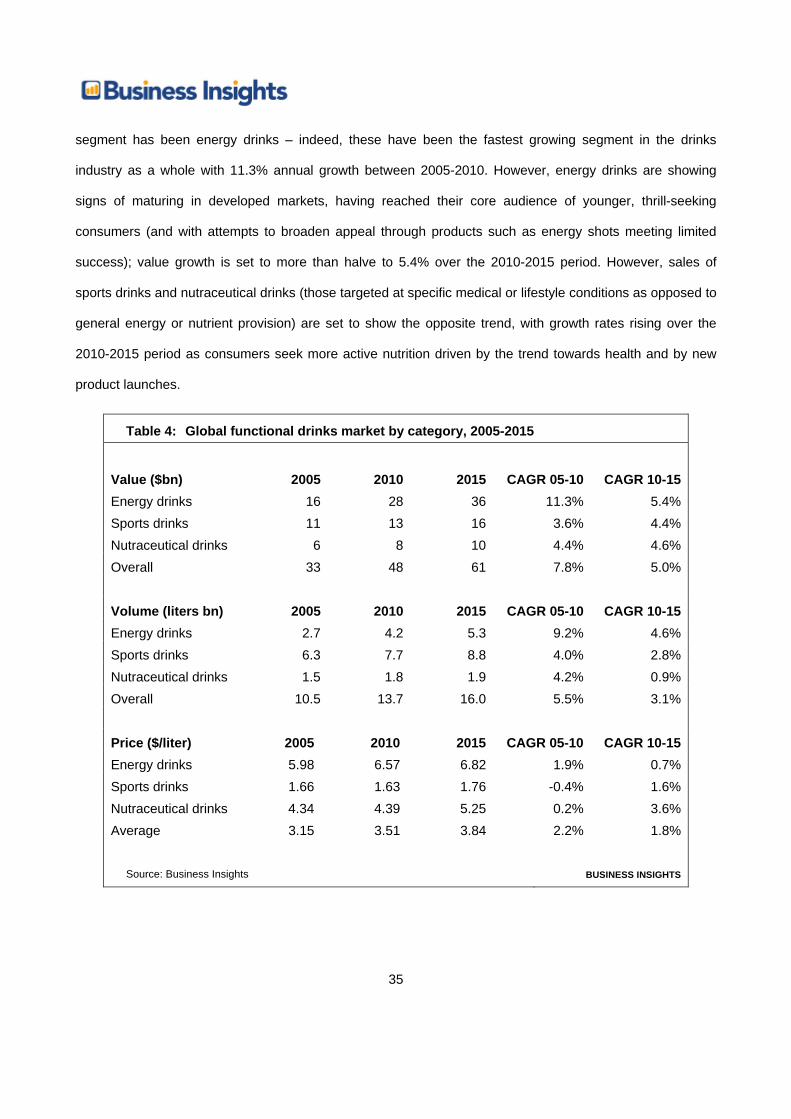
Functional drinks
The functional drinks category has been a major growth driver in the global soft drinks market, reaching a
total market value of $48bn in 2010 having grown at an average annual rate of 7.8%. The fastest-growing
35
segment has been energy drinks – indeed, these have been the fastest growing segment in the drinks
industry as a whole with 11.3% annual growth between 2005-2010. However, energy drinks are showing
signs of maturing in developed markets, having reached their core audience of younger, thrill-seeking
consumers (and with attempts to broaden appeal through products such as energy shots meeting limited
success); value growth is set to more than halve to 5.4% over the 2010-2015 period. However, sales of
sports drinks and nutraceutical drinks (those targeted at specific medical or lifestyle conditions as opposed to
general energy or nutrient provision) are set to show the opposite trend, with growth rates rising over the
2010-2015 period as consumers seek more active nutrition driven by the trend towards health and by new
product launches.
Table 4: Global functional drinks market by category, 2005-2015
Value ($bn) 2005 2010 2015 CAGR 05-10 CAGR 10-15Energy drinks 16 28 36 11.3% 5.4%Sports drinks 11 13 16 3.6% 4.4%Nutraceutical drinks 6 8 10 4.4% 4.6%Overall 33 48 61 7.8% 5.0% Volume (liters bn) 2005 2010 2015 CAGR 05-10 CAGR 10-15Energy drinks 2.7 4.2 5.3 9.2% 4.6%Sports drinks 6.3 7.7 8.8 4.0% 2.8%Nutraceutical drinks 1.5 1.8 1.9 4.2% 0.9%Overall 10.5 13.7 16.0 5.5% 3.1% Price ($/liter) 2005 2010 2015 CAGR 05-10 CAGR 10-15Energy drinks 5.98 6.57 6.82 1.9% 0.7%Sports drinks 1.66 1.63 1.76 -0.4% 1.6%Nutraceutical drinks 4.34 4.39 5.25 0.2% 3.6%Average 3.15 3.51 3.84 2.2% 1.8%
Source: Business Insights BUSINESS INSIGHTS
36
In volume terms, sports drinks are the biggest sellers with just over 50% of the market. This reflects their
position as the most established of the three functional categories, with mainstream sports drinks such as
Gatorade available in most global markets at relatively modest price points. Volume growth in this category is
expected to slow across the board, with all categories seeing substantial falls in volume. The worst-hit
proportionately will be nutraceutical drinks, with growth falling from over 4% to under 1%, reflecting
consumer skepticism over health claims, tighter regulation, and limited scope for these drinks in emerging
markets to date.
The difference between sports drinks and the other two categories is highlighted by their significant price
variance. Sports drinks cost $1.63 a liter on average – still far higher than mainstream soft drinks categories
– compared to $4.39 for nutraceuticals and $6.57 for energy drinks. Energy drinks are expected to show the
slower price growth over the next five years, as manufacturers seek to expand into emerging markets in
central & south America and Asia-Pacific and tap into youth trends; meanwhile, nutraceuticals are expected
to see strong price rises as new formulations are introduced to tackle ever-more-specific conditions at ever-
more-premium price points.
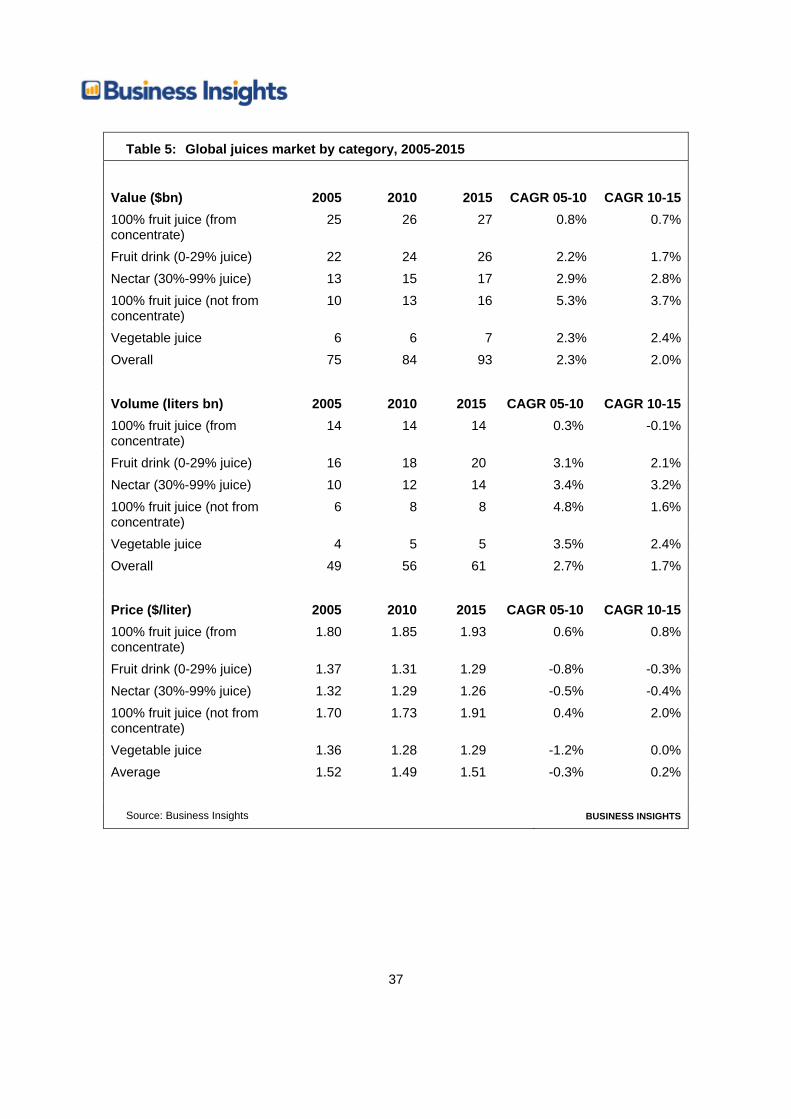
Juices
Juices are the third-largest category in the global soft drinks market in both value and volume terms, with
consumers spending $84bn a year on fruit juices in 2010. 100% juice made from concentrate is the biggest
category in value terms, accounting for $26bn of this spend. In total, 100% juices are worth $41bn, while
part-juice drinks are worth $39m, with vegetable juices accounting for the remainder. From-concentrate juice
has been the slowest-growing category, however, losing developed-world market share to not-from-
concentrate juices such as Tropicana due to their superior perceived taste profile. Meanwhile, sales of fruit
drinks and nectars have grown relatively strongly due to their developing world popularity. These trends are
expected to continue from 2010-2015, although at a slightly slower rate.
37
Table 5: Global juices market by category, 2005-2015
Value ($bn) 2005 2010 2015 CAGR 05-10 CAGR 10-15100% fruit juice (from concentrate)
25 26 27 0.8% 0.7%
Fruit drink (0-29% juice) 22 24 26 2.2% 1.7%Nectar (30%-99% juice) 13 15 17 2.9% 2.8%100% fruit juice (not from concentrate)
10 13 16 5.3% 3.7%
Vegetable juice 6 6 7 2.3% 2.4%Overall 75 84 93 2.3% 2.0% Volume (liters bn) 2005 2010 2015 CAGR 05-10 CAGR 10-15100% fruit juice (from concentrate)
14 14 14 0.3% -0.1%
Fruit drink (0-29% juice) 16 18 20 3.1% 2.1%Nectar (30%-99% juice) 10 12 14 3.4% 3.2%100% fruit juice (not from concentrate)
6 8 8 4.8% 1.6%
Vegetable juice 4 5 5 3.5% 2.4%Overall 49 56 61 2.7% 1.7% Price ($/liter) 2005 2010 2015 CAGR 05-10 CAGR 10-15100% fruit juice (from concentrate)
1.80 1.85 1.93 0.6% 0.8%
Fruit drink (0-29% juice) 1.37 1.31 1.29 -0.8% -0.3%Nectar (30%-99% juice) 1.32 1.29 1.26 -0.5% -0.4%100% fruit juice (not from concentrate)
1.70 1.73 1.91 0.4% 2.0%
Vegetable juice 1.36 1.28 1.29 -1.2% 0.0%Average 1.52 1.49 1.51 -0.3% 0.2%
Source: Business Insights BUSINESS INSIGHTS
38
In volume terms, the picture is rather different. Nectars and fruit drinks account for 30 billion liters of the 56
billion consumed every year, while 100% juices account for 22 billion. Similar growth trends have been
occurring, with from-concentrate juice sales almost flat, while all other categories have posted reasonable
growth. Going forward, sales of nectars and fruit drinks are expected to continue growing strongly, but not-
from-concentrate juices will see a significant fall in growth. While they will continue to win share from 100%
juice, they will struggle to make further inroads into the market. Reflecting their formulation, fruit drinks and
nectars are significantly cheaper than 100% juices, and have been showing falling prices (driven primarily by
geographical mix as developing markets grow) in recent years. This will continue to 2015. The only category
to show significant different pricing trends will be 100% juice: during the 2000s, mass-market products
gained wider distribution and took share away from top-end brands, bringing average prices down, but this
process is now more-or-less complete.
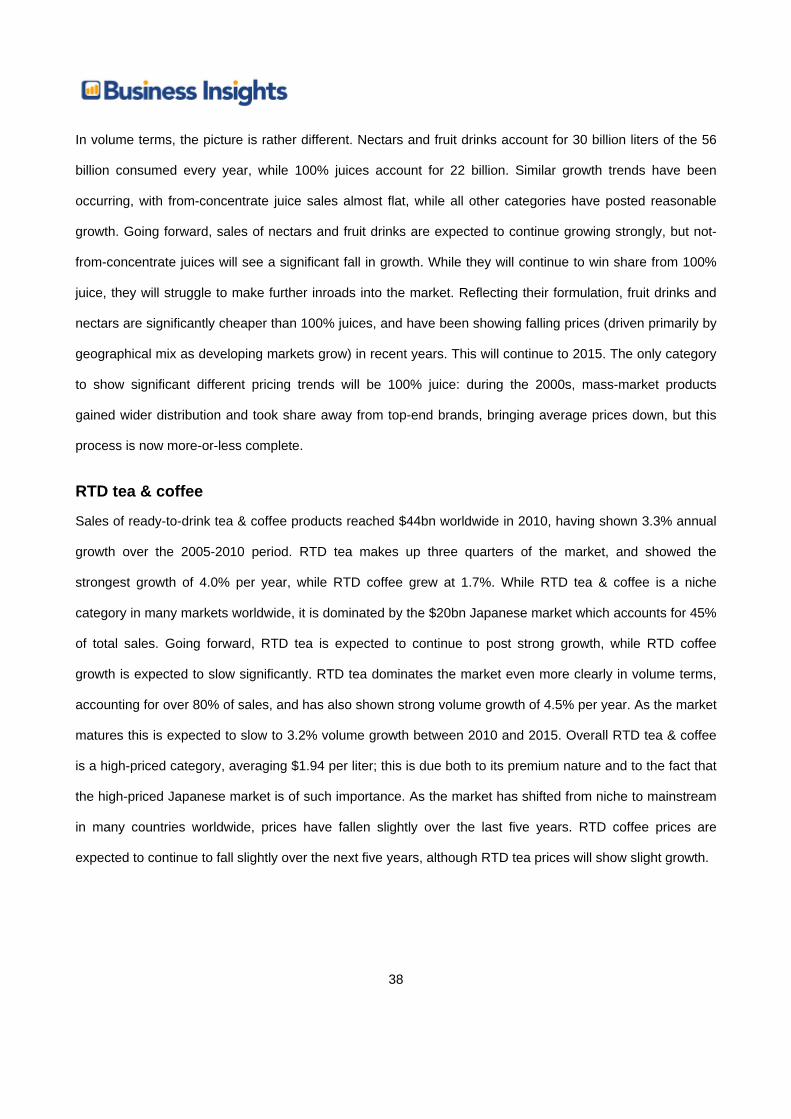
RTD tea & coffee
Sales of ready-to-drink tea & coffee products reached $44bn worldwide in 2010, having shown 3.3% annual
growth over the 2005-2010 period. RTD tea makes up three quarters of the market, and showed the
strongest growth of 4.0% per year, while RTD coffee grew at 1.7%. While RTD tea & coffee is a niche
category in many markets worldwide, it is dominated by the $20bn Japanese market which accounts for 45%
of total sales. Going forward, RTD tea is expected to continue to post strong growth, while RTD coffee
growth is expected to slow significantly. RTD tea dominates the market even more clearly in volume terms,
accounting for over 80% of sales, and has also shown strong volume growth of 4.5% per year. As the market
matures this is expected to slow to 3.2% volume growth between 2010 and 2015. Overall RTD tea & coffee
is a high-priced category, averaging $1.94 per liter; this is due both to its premium nature and to the fact that
the high-priced Japanese market is of such importance. As the market has shifted from niche to mainstream
in many countries worldwide, prices have fallen slightly over the last five years. RTD coffee prices are
expected to continue to fall slightly over the next five years, although RTD tea prices will show slight growth.
39
Table 6: Global RTD tea & coffee market by category, 2005-2015
Value ($bn) 2005 2010 2015 CAGR 05-10 CAGR 10-15RTD tea 26.0 31.7 37.7 4.0% 3.5%RTD coffee 11.7 12.8 12.9 1.7% 0.2%Overall 37.8 44.5 50.6 3.3% 2.6% Volume (liters bn) 2005 2010 2015 CAGR 05-10 CAGR 10-15RTD tea 15.1 18.9 22.1 4.5% 3.2%RTD coffee 3.6 4.0 4.2 2.1% 1.2%Overall 18.8 22.9 26.3 4.1% 2.8% Price ($/liter) 2005 2010 2015 CAGR 05-10 CAGR 10-15RTD tea 1.72 1.68 1.70 -0.5% 0.3%RTD coffee 3.25 3.20 3.05 -0.4% -0.9%Average 2.02 1.94 1.92 -0.7% -0.2%
Source: Business Insights BUSINESS INSIGHTS
Smoothies
The smoothies market is by some way the smallest of the markets considered in this report. It does not
include smoothies made on store premises for takeaway consumption, which account for a significant
proportion of overall smoothie sales in many markets. Total global sales grew from $3.7bn in 2005 to $4.6bn
in 2010, at an average annual rate of 4.3%. This is expected to slow over the 2010-2015 period, reflecting
the fact that smoothies are high-end items primarily sold in developed western markets that are expected to
see economic stagnation over the next five years, as well as their increased levels of penetration. In volume
terms, smoothies are even more niche, accounting for just 0.9 billion liters of the global market following
3.7% growth over the 2005-2010 period. This is also expected to slow slightly, averaging 2.5% between
2010 and 2015. Smoothies are among the most expensive soft drinks, with only energy drinks exceeding
average smoothie prices. This reflects their premium positioning, their use of more expensive natural
ingredients, and the fact that they tend to be sold in smaller pack sizes (partly for on-the-go consumption and

40
partly due to their high prices). Prices have been showing a small upward trend, constrained by the existing
large gap compared to other products and increasingly by the economic situation.
Table 7: Global smoothies market by category, 2005-2015
Value ($bn) 2005 2010 2015 CAGR 05-10 CAGR 10-15Fruit-based 3.4 4.2 4.9 4.3% 2.8%Dairy-based 0.3 0.4 0.5 4.3% 3.4%Overall 3.7 4.6 5.3 4.3% 2.9% Volume (liters bn) 2005 2010 2015 CAGR 05-10 CAGR 10-15Fruit-based 0.7 0.8 0.9 3.7% 2.5%Dairy-based 0.1 0.1 0.1 3.8% 2.8%Overall 0.7 0.9 1.0 3.7% 2.5% Price ($/liter) 2005 2010 2015 CAGR 05-10 CAGR 10-15Fruit-based 5.21 5.35 5.45 0.6% 0.4%Dairy-based 4.58 4.68 4.83 0.4% 0.6%Average 5.15 5.29 5.40 0.6% 0.4%
Source: Business Insights BUSINESS INSIGHTS
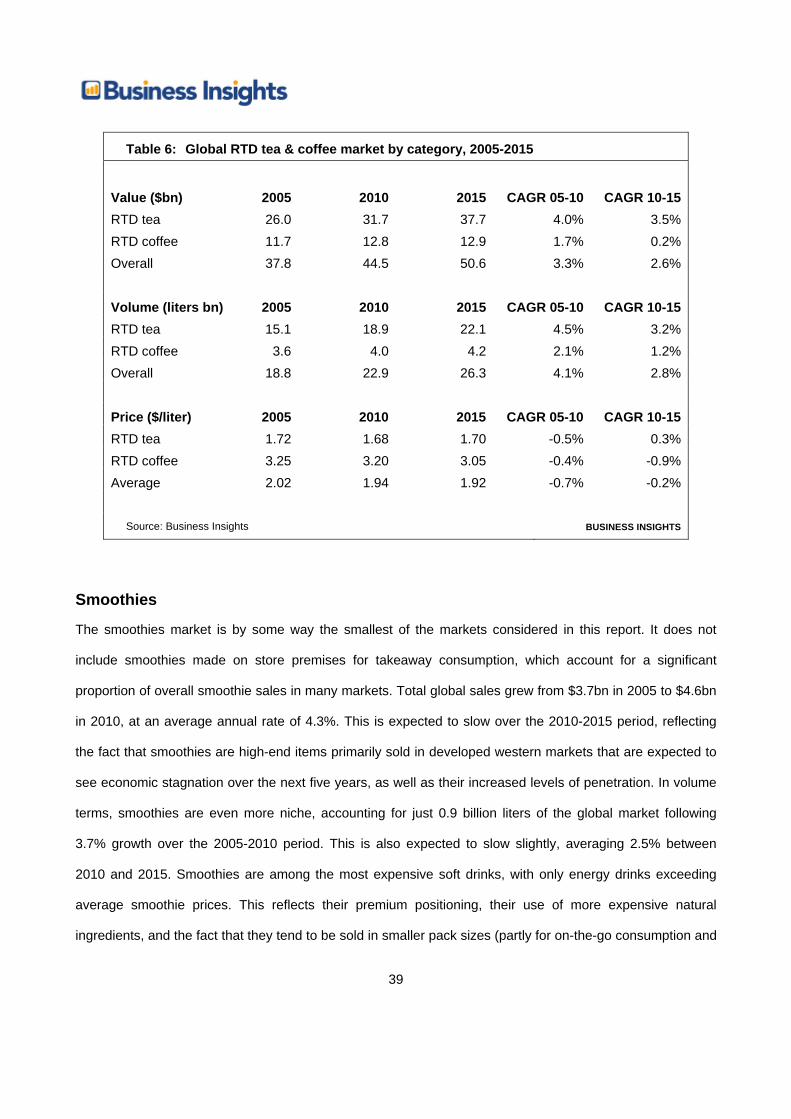
Major country profiles In addition to considering the market on a regional basis, this report also looks at 10 major countries in-
depth. While they are not necessarily the largest in value or volume terms, they are the markets which
combine the strongest potential, the fastest current growth, the highest current sales, and the most important
centers of innovation. In this context, Figure 11 clearly highlights the contrast between the major developed
economies and the BRIC (Brazil, Russia, India and China countries). Although there are significant
differences in market performance between the developed countries in value terms, with the Italian market
growing at three times the speed of the Japanese market from 2005-2010, they are nonetheless dwarfed by
the differences between the BRIC countries and the developed markets. Russia and Brazil, the slowest-
41
growing BRICs, posted 6% value growth from 2005-2010; India and China were both well above 10%, as
might be expected given their lower income base and lower consumer disposable income to start with. In
terms of soft drinks, if not more generally, we predict that Russia will fall out of the BRIC club to an extent
over the 2010-2015 period, with value growth falling to the 2% that will be typical across major European soft
drinks market. This is due to a combination of poor economic conditions (with Russia heavily dependent on
energy exports for income, and with gas prices expected to remain at lower levels throughout the first half of
this decade than in the late 2000s), and volume saturation.
Figure 11: Soft drinks value growth by major country, 2005-2015
United States
Japan Germany
China
Brazil
United Kingdom
ItalyFrance Russia
India
-2%
0%
2%
4%
6%
8%
10%
12%
14%
-3% -1% 1% 3% 5% 7% 9% 11% 13% 15%
Glo
bal v
alue
gro
wth
, 201
0-20
15
Global value growth, 2005-2010
Bubble size = market value 2010
Source: Business Insights / author analysis BUSINESS INSIGHTS

42
Looking at Figure 12's illustration of volume growth, the difference between the BRICs and the developed
economies starts to look more like a continuum. India and China have shown volume growth above 10%,
reflecting their vast populations and very low per capita consumption rates. Meanwhile, with per capita
consumption rates starting to approach those seen in developed markets, volume growth rates in Brazil and
Russia have been respectable rather than exceptional – and Russian volume growth is expected to fall
below 2% in the 2010-2015 period, coming in below Germany, Italy and the UK. The figure also highlights
the contrast between France, Japan and the US, and Germany, Italy and the UK – the former three saw
negligible growth or decline from 2005-2010 and are in the same between 2010 and 2015, whereas the UK,
Italy and Germany are expecting healty volume growth around 2% a year over the next few years.
Figure 12: Soft drinks volume growth by major country, 2005-2015
United States
Japan
Germany
China
Brazil
United Kingdom
ItalyFrance
Russia
India
Glo
bal v
olum
e gr
owth
, 201
0-20
15
Global volume growth, 2005-2010
Bubble size = market volume 201010%
8%
6%
4%
2%
-2%
12%8%6%4% 10%-2%
Source: Business Insights / author analysis BUSINESS INSIGHTS
43
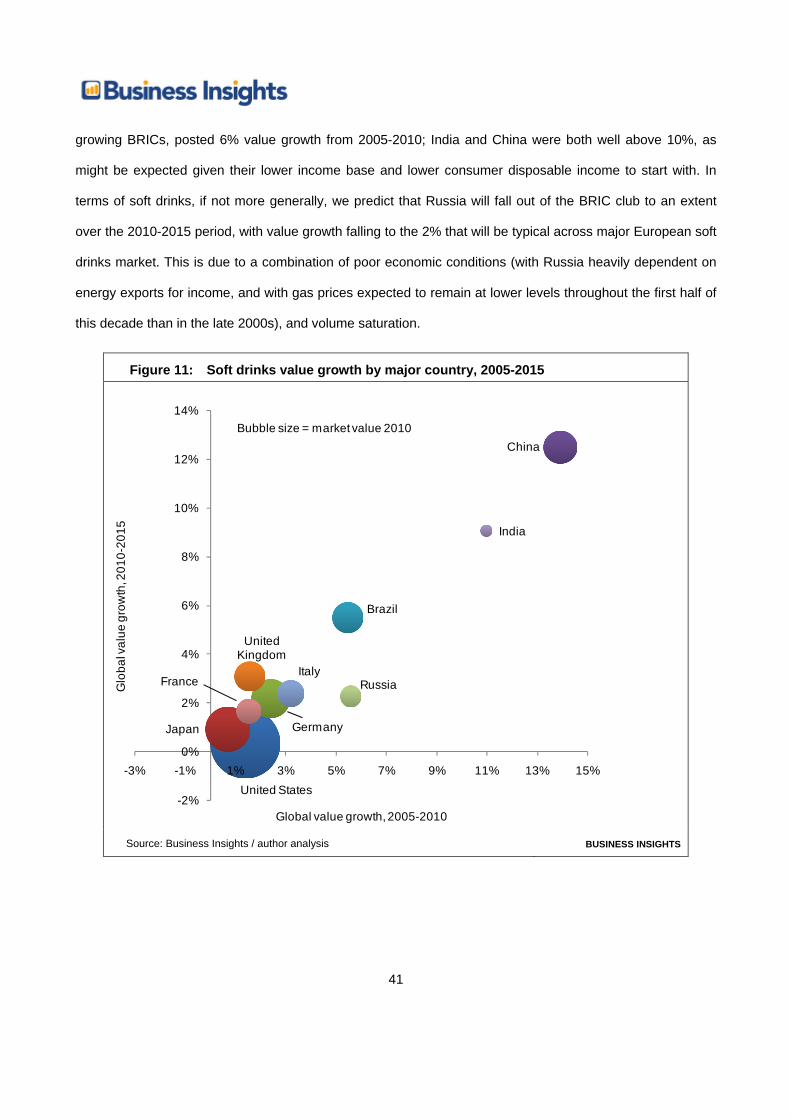
Finally, Figure 13 contextualizes some of the key price issues and differences between the countries. In
terms of absolute price, Japan is by some margin the most expensive market considered; falling below it but
still relatively high in global terms are the UK and Germany. The US, Italy, France and Brazil have similar
overall prices, with Russia slightly cheaper and China and India significantly cheaper, as might be expected.
Figure 13: Soft drinks price growth by major country, 2005-2015
USJapan
Germany
China
Brazil
United Kingdom
Italy
France
Russia
India
Glo
bal p
rice
grow
th, 2
010-
2015
Global price growth, 2005-2010
6%
5%
4%
3%
2%
-1%
1%
0%1% 2% 3% 4%-1%
Bubble size = 2010 $ price per liter
Source: Business Insights / author analysis BUSINESS INSIGHTS
In terms of price growth, the picture is more complex: with the exception of Germany, China and India are
the two countries that are furthest apart, with average prices in China rising by 5% a year while those in India
are set to rise by just 0.4%. This difference is primarily one of changing mix combined with different relative
pricing: in both countries, bottled water is the fastest-growing category, winning share from carbonates – but
in China, the prices of the two categories are relatively similar, whereas in India bottled water is much
44
cheaper than carbonates, driving low average price growth even though Indian bottled water prices are
expected to grow at 2.3% a year. At the same time, though, there is much higher price growth within
categories in China than in India, reflecting a combination of greater premiumization in China and price
controls on the Indian market keeping price rises below inflation.
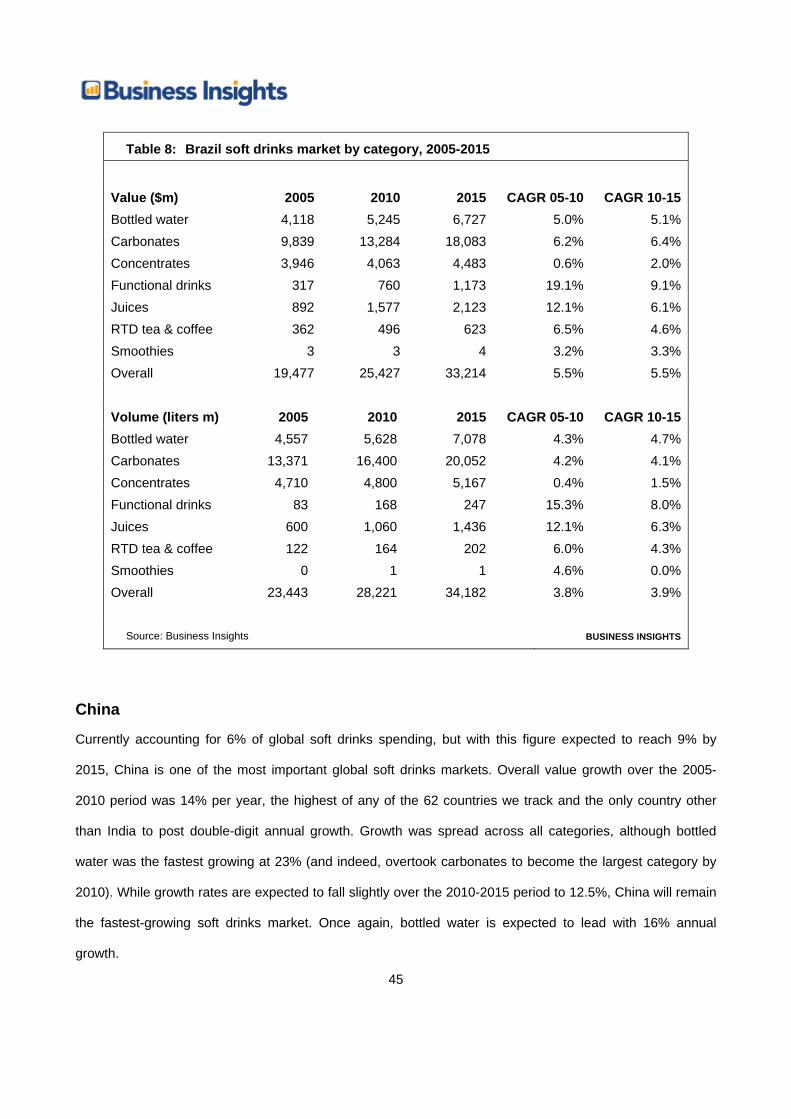
Brazil
With total spending of $25bn per year, Brazil accounts for 5% of the global soft drinks market by value. In
line with Brazil’s generally strong economic growth, which has led it to be considered part of the BRIC
emerging markets bloc and to be increasingly perceived as a mid-income rather than a developing country,
the country’s soft drinks market has also been performing strongly. Functional drinks and juices have grown
at double-digit rates of 19% and 12% respectively, with all other categories other than concentrates posting
strong growth (the slower growth in concentrates reflects consumers shifting to RTD juices in line with
improvements in income). The market is expected to continue posting strong growth over the next five years,
although now that juices and functional drinks have achieved relatively mainstream positions, their growth
will fall to high single-digit levels between 2010-2015. Brazil’s 28.2 billion liters of soft drinks consumption
make up 6% of total global consumption.
Although not as strong as value growth, volume growth has also been strong across all categories other than
concentrates, with functional drinks and juices again posting particularly significant growth of 15% and 12%
respectively. Concentrates are expected to see something of a revival between 2010-2015, with growth
rising from 0.4% to 1.5%. In volume terms, the three largest categories in the Brazilian market all sell for
similar prices: bottled water, concentrates and carbonates are all priced between 80-90 cents per liter,
driving the country’s 90 cent per liter average price. Juices command a slight premium at $1.49, while
functional drinks are extremely expensive products targeting at Brazil’s growing wealthy middle class
population at $4.52 a liter on average. There has been no clear price trend across categories, with water
and functional drinks rising noticeably while most other categories remain flat. This is broadly likely to
continue between 2010-2015.
45
Table 8: Brazil soft drinks market by category, 2005-2015
Value ($m) 2005 2010 2015 CAGR 05-10 CAGR 10-15Bottled water 4,118 5,245 6,727 5.0% 5.1%Carbonates 9,839 13,284 18,083 6.2% 6.4%Concentrates 3,946 4,063 4,483 0.6% 2.0%Functional drinks 317 760 1,173 19.1% 9.1%Juices 892 1,577 2,123 12.1% 6.1%RTD tea & coffee 362 496 623 6.5% 4.6%Smoothies 3 3 4 3.2% 3.3%Overall 19,477 25,427 33,214 5.5% 5.5% Volume (liters m) 2005 2010 2015 CAGR 05-10 CAGR 10-15Bottled water 4,557 5,628 7,078 4.3% 4.7%Carbonates 13,371 16,400 20,052 4.2% 4.1%Concentrates 4,710 4,800 5,167 0.4% 1.5%Functional drinks 83 168 247 15.3% 8.0%Juices 600 1,060 1,436 12.1% 6.3%RTD tea & coffee 122 164 202 6.0% 4.3%Smoothies 0 1 1 4.6% 0.0%Overall 23,443 28,221 34,182 3.8% 3.9%
Source: Business Insights BUSINESS INSIGHTS
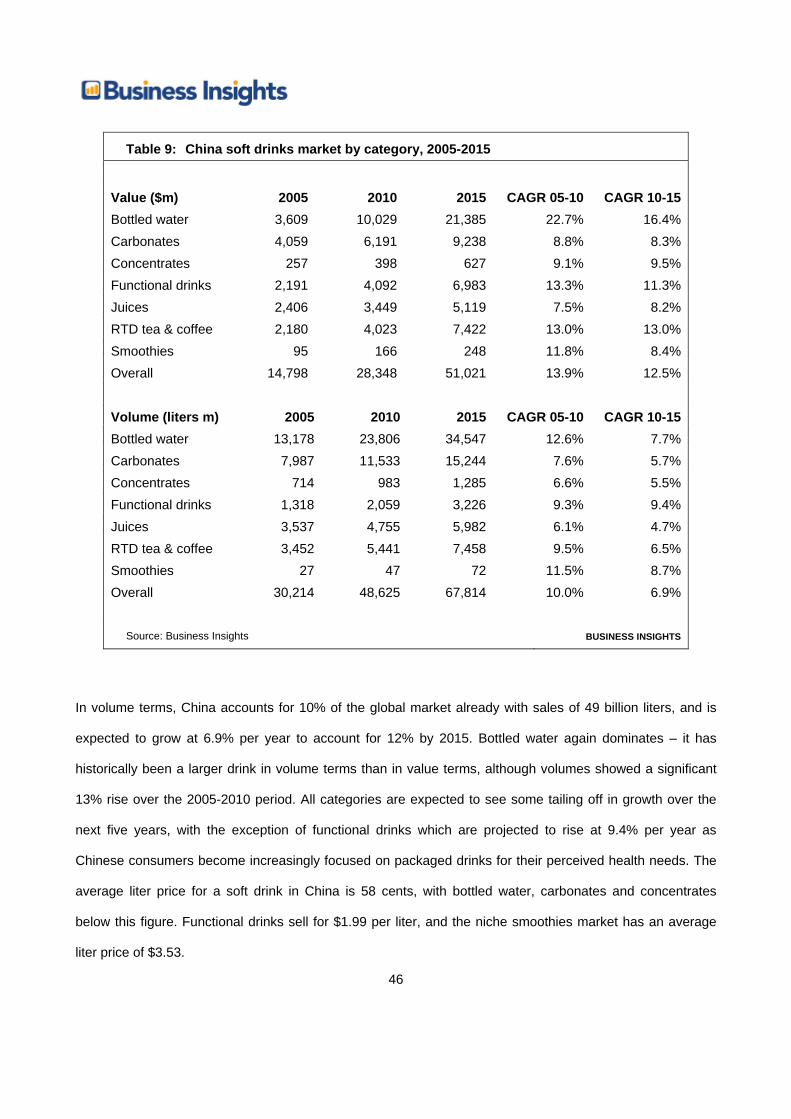
China
Currently accounting for 6% of global soft drinks spending, but with this figure expected to reach 9% by
2015, China is one of the most important global soft drinks markets. Overall value growth over the 2005-
2010 period was 14% per year, the highest of any of the 62 countries we track and the only country other
than India to post double-digit annual growth. Growth was spread across all categories, although bottled
water was the fastest growing at 23% (and indeed, overtook carbonates to become the largest category by
2010). While growth rates are expected to fall slightly over the 2010-2015 period to 12.5%, China will remain
the fastest-growing soft drinks market. Once again, bottled water is expected to lead with 16% annual
growth.
46
Table 9: China soft drinks market by category, 2005-2015
Value ($m) 2005 2010 2015 CAGR 05-10 CAGR 10-15Bottled water 3,609 10,029 21,385 22.7% 16.4%Carbonates 4,059 6,191 9,238 8.8% 8.3%Concentrates 257 398 627 9.1% 9.5%Functional drinks 2,191 4,092 6,983 13.3% 11.3%Juices 2,406 3,449 5,119 7.5% 8.2%RTD tea & coffee 2,180 4,023 7,422 13.0% 13.0%Smoothies 95 166 248 11.8% 8.4%Overall 14,798 28,348 51,021 13.9% 12.5% Volume (liters m) 2005 2010 2015 CAGR 05-10 CAGR 10-15Bottled water 13,178 23,806 34,547 12.6% 7.7%Carbonates 7,987 11,533 15,244 7.6% 5.7%Concentrates 714 983 1,285 6.6% 5.5%Functional drinks 1,318 2,059 3,226 9.3% 9.4%Juices 3,537 4,755 5,982 6.1% 4.7%RTD tea & coffee 3,452 5,441 7,458 9.5% 6.5%Smoothies 27 47 72 11.5% 8.7%Overall 30,214 48,625 67,814 10.0% 6.9%
Source: Business Insights BUSINESS INSIGHTS
In volume terms, China accounts for 10% of the global market already with sales of 49 billion liters, and is
expected to grow at 6.9% per year to account for 12% by 2015. Bottled water again dominates – it has
historically been a larger drink in volume terms than in value terms, although volumes showed a significant
13% rise over the 2005-2010 period. All categories are expected to see some tailing off in growth over the
next five years, with the exception of functional drinks which are projected to rise at 9.4% per year as
Chinese consumers become increasingly focused on packaged drinks for their perceived health needs. The
average liter price for a soft drink in China is 58 cents, with bottled water, carbonates and concentrates
below this figure. Functional drinks sell for $1.99 per liter, and the niche smoothies market has an average
liter price of $3.53.
47
One example highlighting the importance of the Chinese market, and the way in which soft drinks R&D will
increasingly take place in the future, is that of the Minute Maid Pulpy brand. While traditionally Coca-Cola
has carried out R&D either centrally or on a country-specific basis, Minute Made Pulpy was developed at
Coca-Cola’s Shanghai R&D center to target emerging market consumers more generally. The brand
expanded into countries such as Mexico, Singapore and Vietnam – and more recently has been successfully
launched in western European countries. This reversal of traditional multinational corporate models of
innovation, under which products developed in the US or Europe were then rolled out into developing
markets, with local input confined to optimizing the product for national conditions, will be increasingly
prevalent in the soft drinks industry over the next five years.
Figure 14: Coca-Cola’s Minute Maid Pulpy was developed in China and rolled out worldwide
Source: Minute Maid website BUSINESS INSIGHTS
France
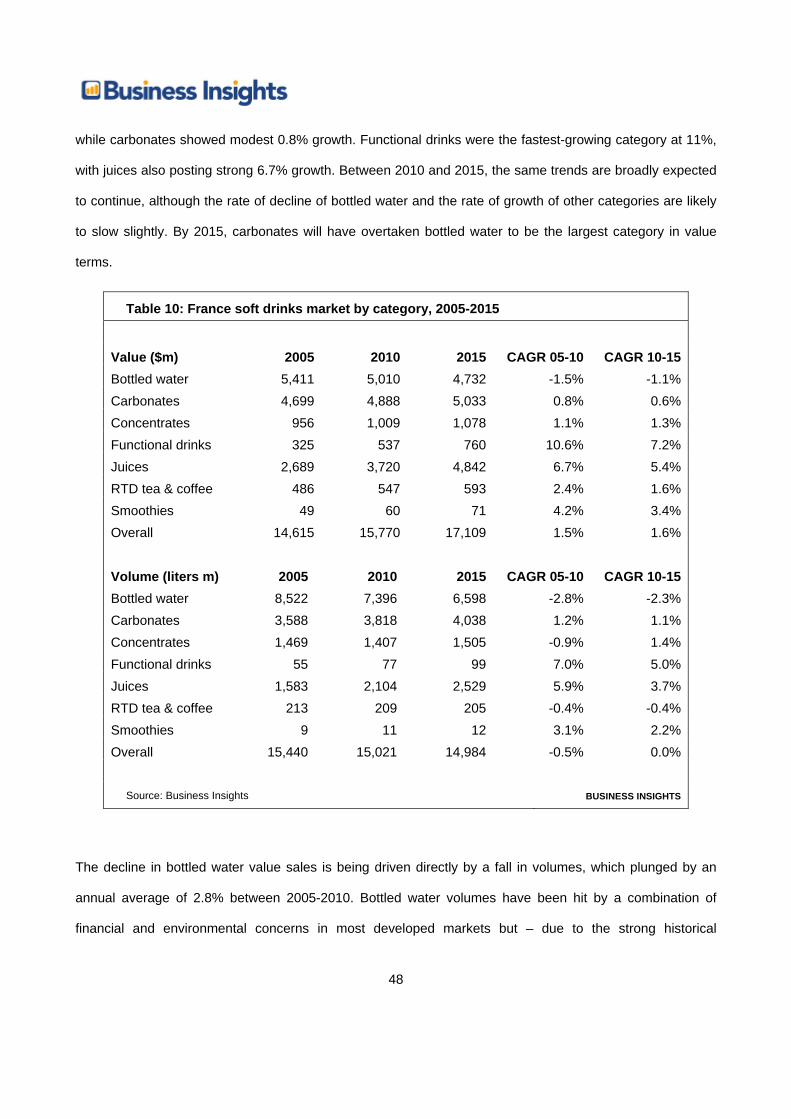
The French soft drinks market was worth $16bn in 2010, having posted relatively weak 1.5% annual growth
between 2005 and 2010. The largest category in value terms was bottled water at $5bn, just in front of
carbonates at $4.9bn. Bottled water posted an average annual decline of 1.5% over the 2005-2010 period,
48
while carbonates showed modest 0.8% growth. Functional drinks were the fastest-growing category at 11%,
with juices also posting strong 6.7% growth. Between 2010 and 2015, the same trends are broadly expected
to continue, although the rate of decline of bottled water and the rate of growth of other categories are likely
to slow slightly. By 2015, carbonates will have overtaken bottled water to be the largest category in value
terms.
Table 10: France soft drinks market by category, 2005-2015
Value ($m) 2005 2010 2015 CAGR 05-10 CAGR 10-15Bottled water 5,411 5,010 4,732 -1.5% -1.1%Carbonates 4,699 4,888 5,033 0.8% 0.6%Concentrates 956 1,009 1,078 1.1% 1.3%Functional drinks 325 537 760 10.6% 7.2%Juices 2,689 3,720 4,842 6.7% 5.4%RTD tea & coffee 486 547 593 2.4% 1.6%Smoothies 49 60 71 4.2% 3.4%Overall 14,615 15,770 17,109 1.5% 1.6% Volume (liters m) 2005 2010 2015 CAGR 05-10 CAGR 10-15Bottled water 8,522 7,396 6,598 -2.8% -2.3%Carbonates 3,588 3,818 4,038 1.2% 1.1%Concentrates 1,469 1,407 1,505 -0.9% 1.4%Functional drinks 55 77 99 7.0% 5.0%Juices 1,583 2,104 2,529 5.9% 3.7%RTD tea & coffee 213 209 205 -0.4% -0.4%Smoothies 9 11 12 3.1% 2.2%Overall 15,440 15,021 14,984 -0.5% 0.0%
Source: Business Insights BUSINESS INSIGHTS
The decline in bottled water value sales is being driven directly by a fall in volumes, which plunged by an
annual average of 2.8% between 2005-2010. Bottled water volumes have been hit by a combination of
financial and environmental concerns in most developed markets but – due to the strong historical

49
penetration of bottled water in France, and combined with aggressive government marketing campaigns for
tap water – the decline seen in the French market has been particularly significant. The decline in bottled
water sales led directly to an overall decline in French soft drink volumes from 15.4 billion liters to 15.0 billion
between 2005-2010. It is expected to continue between 2010 and 2015, leaving overall volumes flat despite
modest growth across most other categories. Because of its ubiquity, bottled water in France is cheap by
developed-world standards, at 68 cents a liter in 2010, far below the average French soft drink price of $1.05
a liter. Average prices rose by 2.1% between 2005-2010, although consumer economizing is likely to cut this
average rise to 1.7% over the 2010-2015 period.
Germany
Germany is Europe’s largest soft drinks market, with annual sales of $38bn making up 8% of global soft
drinks sales by value. Bottled water is the largest category in both value and volume terms, with carbonates
second. Bottled water has shown significant value growth in the German market in recent years, despite
declining in other developed markets, while the fastest-growing category over the 2005-2010 period was
smoothies with an average annual growth rate of 23%. Although functional drinks and RTD tea and coffee
have shown good growth in other markets, value growth in Germany has been relatively slow at under 3% of
both categories. Concentrates and juices both showed overall value declines in the 2005-2010 period. In
volume terms, Germany makes up 6% of the global market, with consumption of 27 billion liters. Carbonates
and bottled water sales are closer in volume than they are in value terms (11.7 billion versus 10.9 billion), but
bottled water volumes are significantly outgrowing carbonates volumes, and this is expected to continue up
to 2015. Juice volumes have fallen at 1% per year and are expected to continue doing so – while the tough
economy is likely to put an end to the smoothie craze, with sales falling 4.4% a year between 2010 and
2015. The average price per liter of soft drink in Germany is $1.39, which is relatively high even by
developed world standards, driven primarily by high bottled water prices ($1.27) and high juices prices
($2.49).
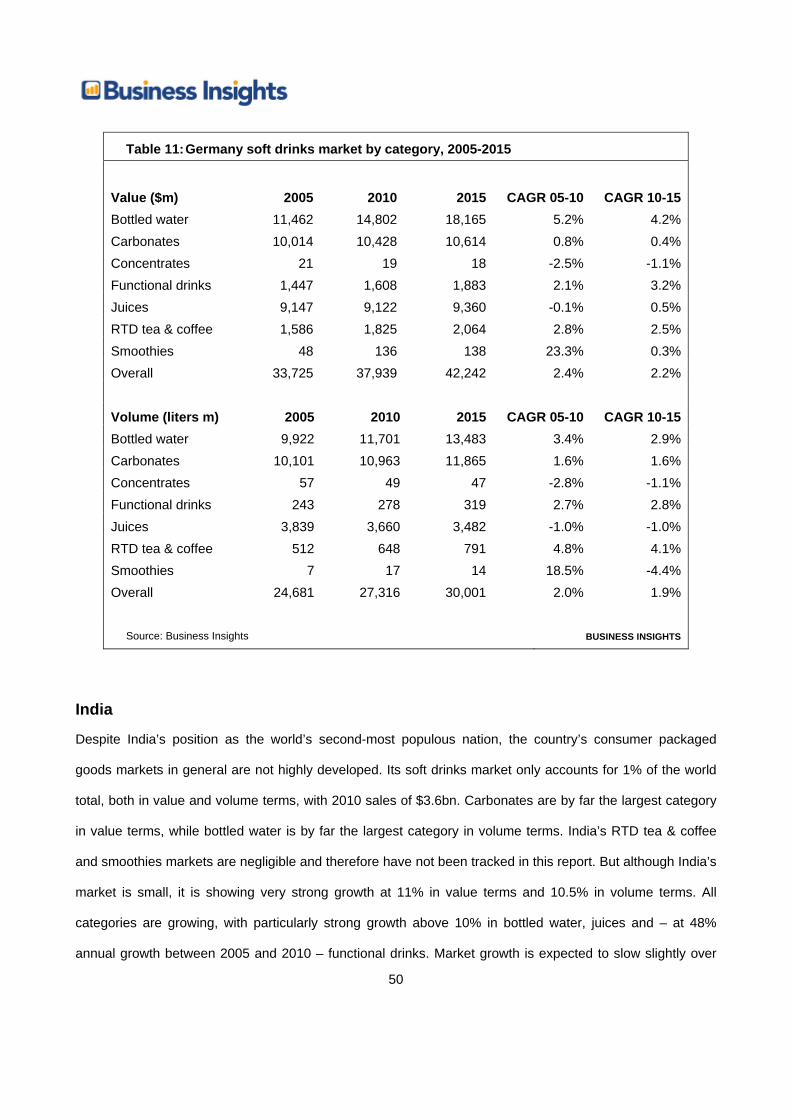
50
Table 11: Germany soft drinks market by category, 2005-2015
Value ($m) 2005 2010 2015 CAGR 05-10 CAGR 10-15Bottled water 11,462 14,802 18,165 5.2% 4.2%Carbonates 10,014 10,428 10,614 0.8% 0.4%Concentrates 21 19 18 -2.5% -1.1%Functional drinks 1,447 1,608 1,883 2.1% 3.2%Juices 9,147 9,122 9,360 -0.1% 0.5%RTD tea & coffee 1,586 1,825 2,064 2.8% 2.5%Smoothies 48 136 138 23.3% 0.3%Overall 33,725 37,939 42,242 2.4% 2.2% Volume (liters m) 2005 2010 2015 CAGR 05-10 CAGR 10-15Bottled water 9,922 11,701 13,483 3.4% 2.9%Carbonates 10,101 10,963 11,865 1.6% 1.6%Concentrates 57 49 47 -2.8% -1.1%Functional drinks 243 278 319 2.7% 2.8%Juices 3,839 3,660 3,482 -1.0% -1.0%RTD tea & coffee 512 648 791 4.8% 4.1%Smoothies 7 17 14 18.5% -4.4%Overall 24,681 27,316 30,001 2.0% 1.9%
Source: Business Insights BUSINESS INSIGHTS
India
Despite India’s position as the world’s second-most populous nation, the country’s consumer packaged
goods markets in general are not highly developed. Its soft drinks market only accounts for 1% of the world
total, both in value and volume terms, with 2010 sales of $3.6bn. Carbonates are by far the largest category
in value terms, while bottled water is by far the largest category in volume terms. India’s RTD tea & coffee
and smoothies markets are negligible and therefore have not been tracked in this report. But although India’s
market is small, it is showing very strong growth at 11% in value terms and 10.5% in volume terms. All
categories are growing, with particularly strong growth above 10% in bottled water, juices and – at 48%
annual growth between 2005 and 2010 – functional drinks. Market growth is expected to slow slightly over
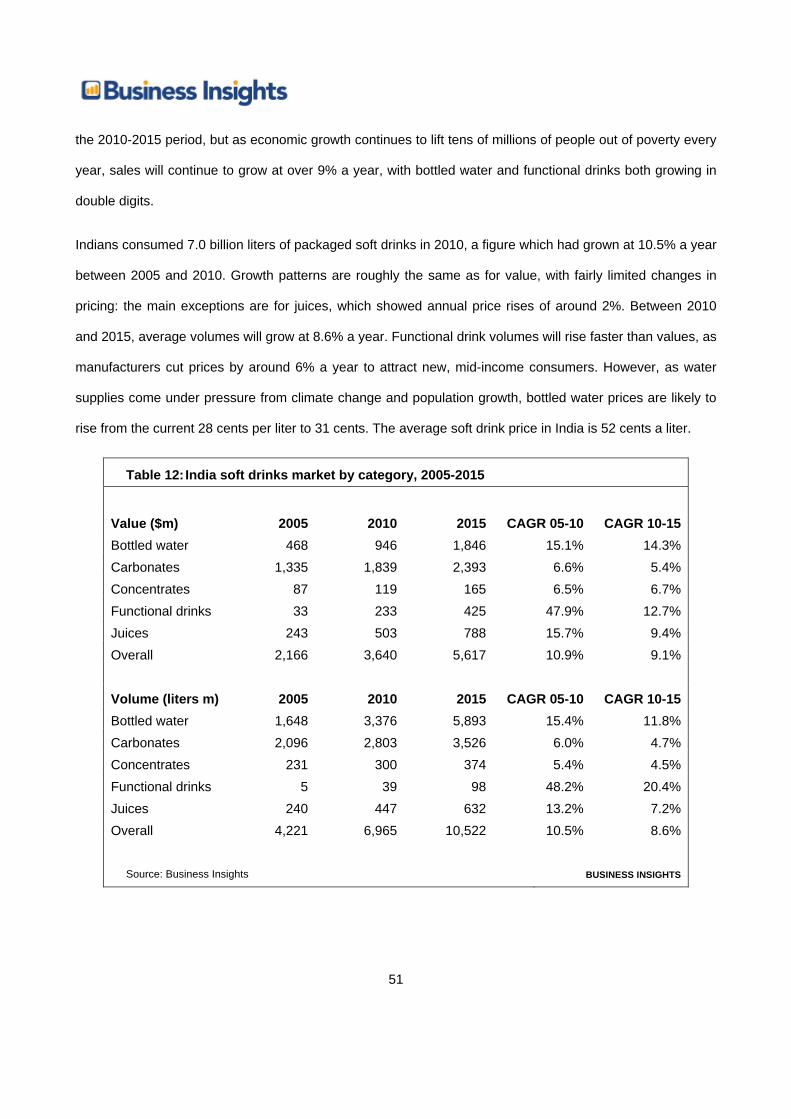
51
the 2010-2015 period, but as economic growth continues to lift tens of millions of people out of poverty every
year, sales will continue to grow at over 9% a year, with bottled water and functional drinks both growing in
double digits.
Indians consumed 7.0 billion liters of packaged soft drinks in 2010, a figure which had grown at 10.5% a year
between 2005 and 2010. Growth patterns are roughly the same as for value, with fairly limited changes in
pricing: the main exceptions are for juices, which showed annual price rises of around 2%. Between 2010
and 2015, average volumes will grow at 8.6% a year. Functional drink volumes will rise faster than values, as
manufacturers cut prices by around 6% a year to attract new, mid-income consumers. However, as water
supplies come under pressure from climate change and population growth, bottled water prices are likely to
rise from the current 28 cents per liter to 31 cents. The average soft drink price in India is 52 cents a liter.
Table 12: India soft drinks market by category, 2005-2015
Value ($m) 2005 2010 2015 CAGR 05-10 CAGR 10-15Bottled water 468 946 1,846 15.1% 14.3%Carbonates 1,335 1,839 2,393 6.6% 5.4%Concentrates 87 119 165 6.5% 6.7%Functional drinks 33 233 425 47.9% 12.7%Juices 243 503 788 15.7% 9.4%Overall 2,166 3,640 5,617 10.9% 9.1% Volume (liters m) 2005 2010 2015 CAGR 05-10 CAGR 10-15Bottled water 1,648 3,376 5,893 15.4% 11.8%Carbonates 2,096 2,803 3,526 6.0% 4.7%Concentrates 231 300 374 5.4% 4.5%Functional drinks 5 39 98 48.2% 20.4%Juices 240 447 632 13.2% 7.2%Overall 4,221 6,965 10,522 10.5% 8.6%
Source: Business Insights BUSINESS INSIGHTS

52
Italy
Italy accounts for 4% of the global soft drinks market by value, rising by 3.2% a year in the 2005-2010 period
to reach $19bn in 2010. Bottled water accounts for more than half the market in value terms, and has
continued to grow at a healthy 4.3% per year. The next-largest category is carbonates, with RTD tea and
coffee and juices making up most of the rest of the market. From 2010 to 2015, despite Italy’s economic
troubles, the market is expected to continue growing at a slightly slower average rate of 2.4%, with bottled
water growth dipping to 3.5%.
Table 13: Italy soft drinks market by category, 2005-2015
Value ($m) 2005 2010 2015 CAGR 05-10 CAGR 10-15Bottled water 7,909 9,771 11,590 4.3% 3.5%Carbonates 4,706 4,939 5,131 1.0% 0.8%Concentrates 119 127 137 1.3% 1.5%Functional drinks 634 792 991 4.6% 4.6%Juices 1,169 1,372 1,378 3.3% 0.1%RTD tea & coffee 1,405 1,657 1,767 3.4% 1.3%Smoothies 13 17 21 5.9% 4.3%Overall 15,954 18,676 21,015 3.2% 2.4% Volume (liters m) 2005 2010 2015 CAGR 05-10 CAGR 10-15Bottled water 10,443 11,546 12,950 2.0% 2.3%Carbonates 3,152 3,202 3,300 0.3% 0.6%Concentrates 177 185 194 0.9% 0.9%Functional drinks 150 177 202 3.4% 2.7%Juices 697 761 772 1.8% 0.3%RTD tea & coffee 783 926 975 3.4% 1.0%Smoothies 1 2 2 6.7% 5.0%Overall 15,403 16,799 18,396 1.8% 1.8%
Source: Business Insights BUSINESS INSIGHTS
53
Italy’s 17 billion liters of soft drinks consumption make up 3% of the global total. The volume data highlights
how important bottled water is to Italy, accounting for more than two thirds of this volume. Volume growth
has lagged behind value growth, largely due to price rises in bottled water and juices; other categories have
seen relatively flat or falling prices. This 1.8% volume growth track is expected to continue to 2015, with the
slowdown in value growth solely due to a slowing of price rises – especially in bottled water, where the
average annual price rise will have fallen from 2.2% to 1.1%. The average soft drink in Italy costs $1.14 per
liter, with bottled water at 85 cents and carbonates at $1.54.
Japan
In value terms, Japan is currently the largest soft drinks market in Asia-Pacific and the second-largest in the
world, with sales of $51bn in 2010. The market has been fairly flat in value terms overall between 2005-2010,
although there has been a fair amount of variance between categories. As in many markets, carbonates
have been losing sales; unlike many markets, categories such as functional drinks, smoothies and RTD tea
and coffee have only posted modest growth, while juices have also posted an absolute sales decline.
Unusually compared to almost all other markets, RTD tea and coffee and functional drinks are the largest
categories in value terms, which is also the key explanation for their relatively poor performance. Volume
trends are largely in line with value trends in Japan. The overall market volume grew at 0.4% a year to reach
19 billion liters in 2010. Functional drinks and RTD tea and coffee also dominate in volume terms, although
their share is not quite as overpowering as it is in value terms. Carbonates, juices, and RTD drinks all
declined over the 2005-2010 period. From 2010-2015, carbonates are expected to recover somewhat, but
functional drinks are likely to join juices and RTD drinks in negative growth as consumers become
increasingly jaded with manufacturers’ health claims. Japan has an extremely high average price for soft
drinks of $2.71 per liter, reflecting the dominance of high-priced categories such as functional drinks ($3.06)
and RTD tea & coffee ($2.78), although the general high-priced nature of Japan’s economy and the
premiumized character of its soft drinks market also plays a role, with even carbonates selling at $1.86 per
liter. Average prices rose by 0.3% a year between 2005-2010, but are expected to show 1.4% growth
between 2010 and 2015.
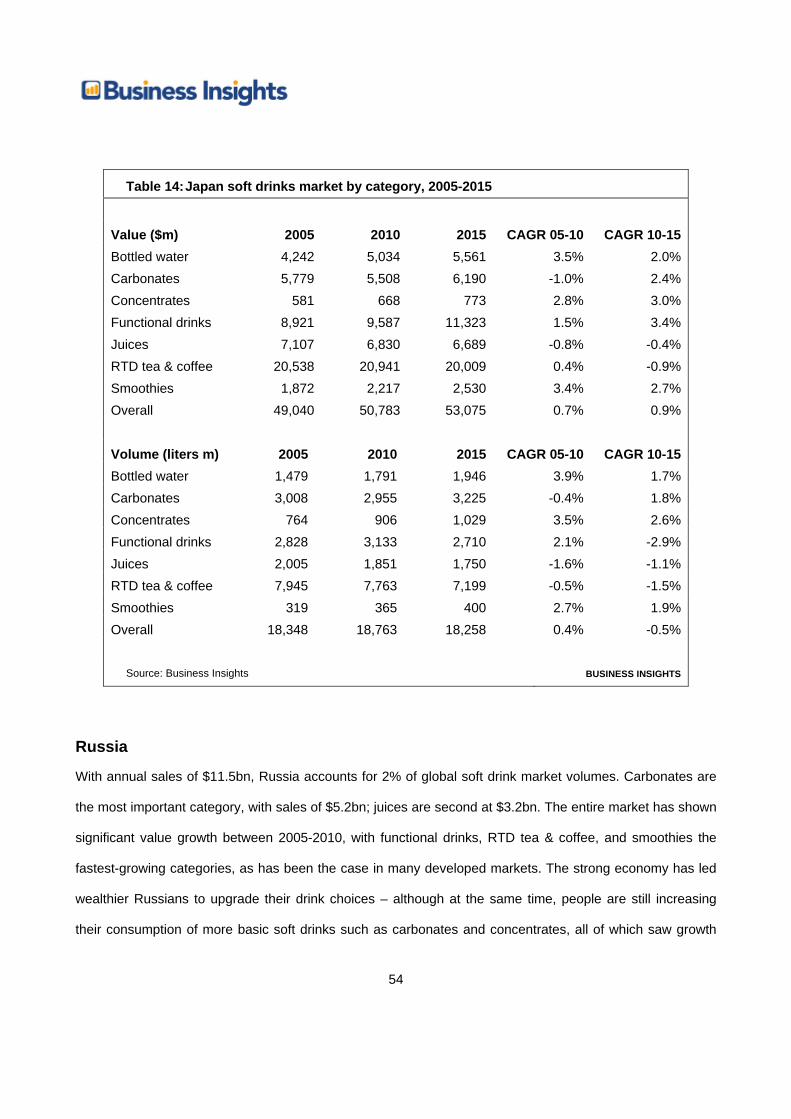
54
Table 14: Japan soft drinks market by category, 2005-2015
Value ($m) 2005 2010 2015 CAGR 05-10 CAGR 10-15Bottled water 4,242 5,034 5,561 3.5% 2.0%Carbonates 5,779 5,508 6,190 -1.0% 2.4%Concentrates 581 668 773 2.8% 3.0%Functional drinks 8,921 9,587 11,323 1.5% 3.4%Juices 7,107 6,830 6,689 -0.8% -0.4%RTD tea & coffee 20,538 20,941 20,009 0.4% -0.9%Smoothies 1,872 2,217 2,530 3.4% 2.7%Overall 49,040 50,783 53,075 0.7% 0.9% Volume (liters m) 2005 2010 2015 CAGR 05-10 CAGR 10-15Bottled water 1,479 1,791 1,946 3.9% 1.7%Carbonates 3,008 2,955 3,225 -0.4% 1.8%Concentrates 764 906 1,029 3.5% 2.6%Functional drinks 2,828 3,133 2,710 2.1% -2.9%Juices 2,005 1,851 1,750 -1.6% -1.1%RTD tea & coffee 7,945 7,763 7,199 -0.5% -1.5%Smoothies 319 365 400 2.7% 1.9%Overall 18,348 18,763 18,258 0.4% -0.5%
Source: Business Insights BUSINESS INSIGHTS
Russia
With annual sales of $11.5bn, Russia accounts for 2% of global soft drink market volumes. Carbonates are
the most important category, with sales of $5.2bn; juices are second at $3.2bn. The entire market has shown
significant value growth between 2005-2010, with functional drinks, RTD tea & coffee, and smoothies the
fastest-growing categories, as has been the case in many developed markets. The strong economy has led
wealthier Russians to upgrade their drink choices – although at the same time, people are still increasing
their consumption of more basic soft drinks such as carbonates and concentrates, all of which saw growth
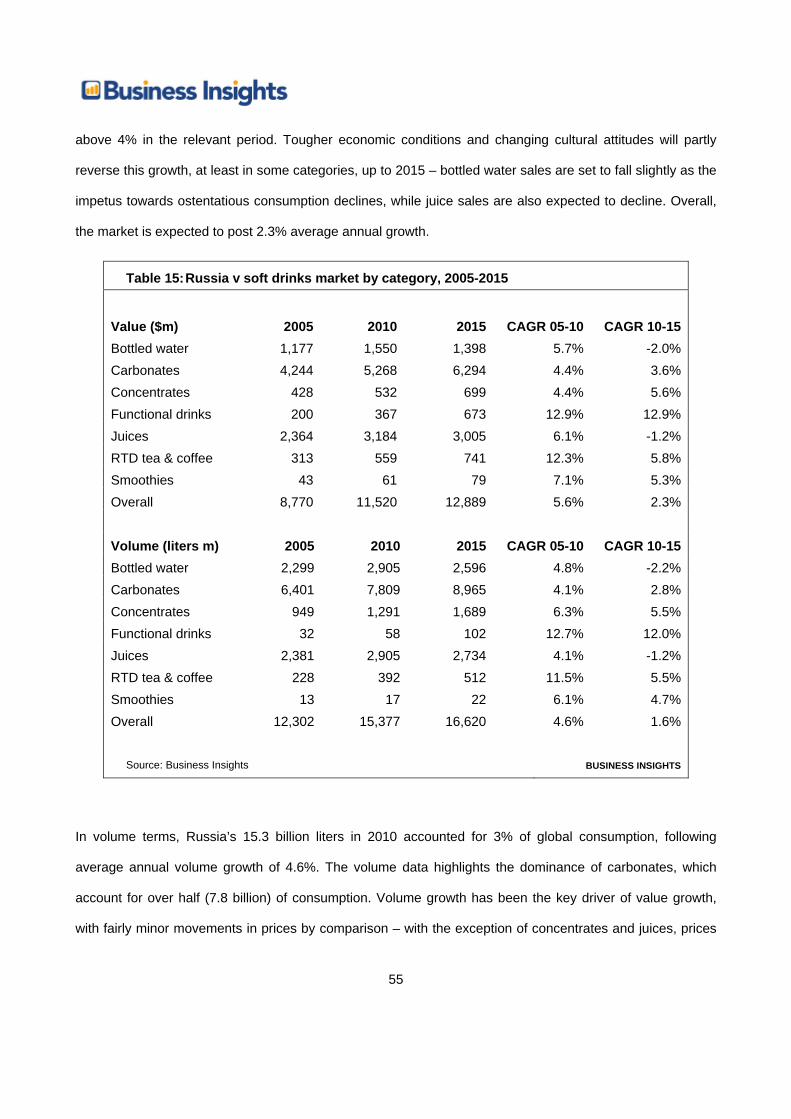
55
above 4% in the relevant period. Tougher economic conditions and changing cultural attitudes will partly
reverse this growth, at least in some categories, up to 2015 – bottled water sales are set to fall slightly as the
impetus towards ostentatious consumption declines, while juice sales are also expected to decline. Overall,
the market is expected to post 2.3% average annual growth.
Table 15: Russia v soft drinks market by category, 2005-2015
Value ($m) 2005 2010 2015 CAGR 05-10 CAGR 10-15Bottled water 1,177 1,550 1,398 5.7% -2.0%Carbonates 4,244 5,268 6,294 4.4% 3.6%Concentrates 428 532 699 4.4% 5.6%Functional drinks 200 367 673 12.9% 12.9%Juices 2,364 3,184 3,005 6.1% -1.2%RTD tea & coffee 313 559 741 12.3% 5.8%Smoothies 43 61 79 7.1% 5.3%Overall 8,770 11,520 12,889 5.6% 2.3% Volume (liters m) 2005 2010 2015 CAGR 05-10 CAGR 10-15Bottled water 2,299 2,905 2,596 4.8% -2.2%Carbonates 6,401 7,809 8,965 4.1% 2.8%Concentrates 949 1,291 1,689 6.3% 5.5%Functional drinks 32 58 102 12.7% 12.0%Juices 2,381 2,905 2,734 4.1% -1.2%RTD tea & coffee 228 392 512 11.5% 5.5%Smoothies 13 17 22 6.1% 4.7%Overall 12,302 15,377 16,620 4.6% 1.6%
Source: Business Insights BUSINESS INSIGHTS
In volume terms, Russia’s 15.3 billion liters in 2010 accounted for 3% of global consumption, following
average annual volume growth of 4.6%. The volume data highlights the dominance of carbonates, which
account for over half (7.8 billion) of consumption. Volume growth has been the key driver of value growth,
with fairly minor movements in prices by comparison – with the exception of concentrates and juices, prices
56
rose by 1% or less over the 2005-2010 period, and all categories are expected to show real price rises under
1% between 2010 and 2015. The average soft drink in Russia costs 75 cents per liter.
United Kingdom
The UK is Europe’s second-largest drinks market in value terms at $24bn, accounting for 5% of global sales.
The leading category, accounting for more than half the market by value, is carbonates. Bottled water is far
less important than in most European markets, with juices and functional drinks both running ahead of the
category. This reflects both cultural reluctance to consume bottled water at home, and a lack of regular
temperature-based need to do so on-the-move. The market posted slow value growth of 1.6% between
2005-2010, largely due to flat sales of carbonates. Smoothies and functional drinks were the main growth
highlights over 2005-2010, although growth in the former is expected to turn strongly negative between
2010-2015, with growth in the latter stagnating somewhat. In both cases, poor economic conditions will be a
major factor, with UK consumers expected to take until 2015 to regain the standard of living they enjoyed in
2006.
The picture in volume terms is generally similar to the value picture, largely reflecting the UK supermarkets’
success in keeping supplier prices down. Carbonates are slightly less dominant in volume terms, reflecting
the important role that concentrates (generally referred to as ‘squash’) play in the UK market at the cheaper
end of the market. As a result, sales of concentrates are expected to rise strongly over the 2010-2015 period,
as people switch away from more expensive juices and smoothies. Concentrates are also expected to be the
only major segment with annual real price rises over 1% in the forecast period, reflecting the fact that
switching consumers will likely adopt higher-end products. The average soft drinks price in the UK is $1.63 a
liter, with carbonates at $1.93 a liter and concentrates at $0.43 (for a liter of made-up product).

57
Table 16: United Kingdom soft drinks market by category, 2005-2015
Value ($m) 2005 2010 2015 CAGR 05-10 CAGR 10-15Bottled water 2,466 2,508 2,807 0.3% 2.3%Carbonates 12,079 12,091 14,278 0.0% 3.4%Concentrates 1,339 1,510 2,091 2.4% 6.7%Functional drinks 2,129 3,231 4,185 8.7% 5.3%Juices 3,852 4,224 4,153 1.9% -0.3%RTD tea & coffee 65 76 85 3.2% 2.2%Smoothies 131 193 143 8.0% -5.9%Overall 22,062 23,833 27,742 1.6% 3.1% Volume (liters m) 2005 2010 2015 CAGR 05-10 CAGR 10-15Carbonates 6,256 6,253 7,041 0.0% 2.4%Bottled water 1,972 1,990 2,199 0.2% 2.0%Concentrates 3,314 3,520 4,052 1.2% 2.9%Functional drinks 383 568 708 8.2% 4.5%Juices 2,095 2,212 2,175 1.1% -0.3%RTD tea & coffee 20 23 24 2.2% 1.4%Smoothies 25 38 26 8.5% -7.4%Overall 14,067 14,603 16,224 0.8% 2.1%
Source: Business Insights BUSINESS INSIGHTS
United States
The US is the world’s leading soft drinks market in value and volume terms, accounting for 25% of sales and
23% of volumes. Sales value rose by an average of 1.4% a year from 2005-2010 to reach $125bn in 2010.
The largest category, accounting for just under half of the market value, is carbonates – however, this
category fell by an annual average of 0.8% between 2005-2010 (in 2005, it accounted for significantly more
than half the market). Juices and functional drinks are the next-most important categories, with bottled water
close behind functional drinks. Functional drinks and concentrates were the fastest-growing categories
between 2005-2010. Between 2010 and 2015, growth is expected to fall significantly to 0.4%, although the
decline in carbonates sales will also slow from 0.8% to 0.3% as the weak economy encourages people to
58
stick to cheaper categories. Juice sales will show a 1.6% decline, while functional drinks growth will fall from
double-digit rates to just 2.8%.
Volumes in the US soft drinks market grew at just 0.2% from 2005-2010 to reach $113bn in 2010. Volume
data highlights the prevalence and low price-point of bottled water in the US, which has almost double the
volume sales of juices – and nearly 10x the volume sales of functional drinks, despite similar value sales. It
also highlights the ongoing structural decline of carbonates sales, driven by health concerns: this was an
ongoing trend before the 2008 recession hit, and appears to be continuing throughout the current global
economic uncertainty. The difference between the 2005-2010 period and the 2010-2015 period is that in the
past, people were switching from carbonates to other soft drinks – generally, ones that were more expensive
and healthier. Over the 2010-2015 period, this will not be the case, with functional drinks and juice sales also
falling. People are no longer trading up from carbonates to healthier alternatives; rather, they are deciding to
actively cut consumption. The average soft drink price in the US was $1.11 per liter in 2010, with carbonates
almost directly in the middle at $1.09 per liter. Bottled water sold for 50 cents per liter on average, while
functional drinks were around $4.80 a liter. Prices are likely to stay fairly flat in most categories going
forward, although functional drinks will show price rises in excess of 3%.

59
Table 17: United States soft drinks market by category, 2005-2015
Value ($m) 2005 2010 2015 CAGR 05-10 CAGR 10-15Bottled water 14,343 16,501 17,627 2.8% 1.3%Carbonates 63,960 61,363 60,513 -0.8% -0.3%Concentrates 914 1,366 1,613 8.4% 3.4%Functional drinks 9,186 16,048 18,414 11.8% 2.8%Juices 20,872 20,344 18,731 -0.5% -1.6%RTD tea & coffee 6,961 8,902 9,848 5.0% 2.0%Smoothies 180 216 261 3.7% 3.8%Overall 116,416 124,740 127,007 1.4% 0.4% Volume (liters m) 2005 2010 2015 CAGR 05-10 CAGR 10-15Bottled water 28,727 32,712 34,301 2.6% 1.0%Carbonates 61,123 56,342 51,997 -1.6% -1.6%Concentrates 1,064 1,426 1,572 6.0% 2.0%Functional drinks 2,558 3,341 3,294 5.5% -0.3%Juices 14,912 14,971 13,390 0.1% -2.2%RTD tea & coffee 3,039 3,765 4,127 4.4% 1.9%Smoothies 29 35 42 3.8% 3.7%Overall 111,450 112,590 108,722 0.2% -0.7%
Source: Business Insights BUSINESS INSIGHTS
60
Chapter 3 Innovation & new product development
Summary In order to understand and target the most important innovation niches within the soft drinks category, it
is important to have a detailed comprehension of current key innovations: both in the regions and
markets that you are targeting; and innovations from other areas.
Juices have been by far the most important category for NPD innovations within the soft drinks industry
in recent years, making up 31% of new launches despite accounting for a small proportion of total sales
and not being a particularly high growth category in terms of market value or volume.
Despite their relatively unfashionable image and relatively low share in many markets, concentrates are
now the second most important area for soft drinks development. Powder concentrates hold a strong
position in fast-growing emerging markets and benefit from considerable research investment.
‘Upscale’ has fallen from 7% of soft drink product claims to 1% since 2008, while ‘single-serve’ has
fallen from 10% to 6%; on the other hand, private label applied to 2% of launches in 2006 but now
applies to 11%. This is likely driven by consumer reactions to the financial situation.
Positive health claims on soft drink launches have fallen from 19% in 2006 to 16% in 2011; natural,
fresh & organic have risen from 23% to 26%, and free-from claims have risen from 33% to 38%.
Europe has been the most important region for soft drinks launches throughout the 2006-2011 period,
with its share of launches rising to 42% in 2011. The second-placed region is Asia-Pacific, with 24%
share in 2011, and North America is in third position with 17%.
Most ‘innovative’ products tracked are innovative in formulation, accounting for 68% of innovations in
2006 and 79% in 2011. Packaging and positioning are the two other areas in which significant
quantities of innovative products have been tracked, although innovative packaging fell to just 4% in
2011 from 18% in 2006.
61
Introduction As growth and premiumization in the global soft drinks industry both become increasingly challenging, it is
important to align new product development (NPD) effort with key trends and best practice in innovation. But
in order to understand and target the most significant innovation niches within the soft drinks category, it is
important to have a detailed comprehension of current key innovations, both in the regions and markets that
you are targeting, and innovations from other areas that can inform your own learning process.
The Product Launch Analytics database tracks detailed information on new product launches worldwide, and
this chapter is based around key soft drinks innovation metrics extracted from that database. It first considers
the most important trends in soft drinks new product development and then proceeds to examine new soft
drinks launches on a category-by category basis.
Major soft drinks NPD trends Juices have been by far the most important category for NPD innovation within the soft drinks industry in
recent years, despite accounting for a small proportion of total sales and not being a particularly high growth
category in terms of market value or volume. In 2011, they made up 31% of new product launches tracked
by Product Launch Analytics, up from 25% in 2006. The second-largest category for most of the period being
tracked was functional drinks, as might have been expected given the category’s novelty and high price point
and growth levels. However, the category’s share has progressively fallen since 2008, including a fall in 2011
to 12% from 16% in 2010. This reflects market data and anecdotal evidence that manufacturers are starting
to lose interest in the market to some extent, following disappointing sales growth in the last few years as the
market becomes saturated and consumer incomes in developed markets come under pressure, as well as
the failure of various line extensions to grab consumer attention in the way that the original products
managed to achieve. Concentrates are now the second most important area for soft drinks development,
despite their relatively unfashionable image and relatively low share in many markets, due not least to the
strong position of powder concentrates in fast-growing emerging markets and associated strong levels of
research investment.

62
Although carbonates and bottled water dominate the industry as a whole, they only account for 21% of new
product launches, down from 32% in 2006. The relatively low investment compared to market share reflects
the maturity of the categories – and, simply put, that the majority of water sales are of bottled plain water,
and that the majority of carbonates sales are of well-known brands which have changed little for decades.
Line extensions such as Vanilla Coke do exist and can drive sales, but they are a small part of either market.
The specific decline from 2006-2011, however, reflects specific poor performance of these categories in their
core regions – for carbonates, the US, and for bottled water both the US and European markets such as
France.
Figure 15: Soft drinks new product launches by category, 2006-2011
25% 26% 22%31% 32% 31%
18% 18% 22%
16% 16%12%
14% 11% 9%9% 9%
9%
11% 12% 13%14% 14%
14%
10% 9% 11%8% 8%
10%
9% 10% 9%10% 10% 11%
7% 6% 8% 5% 6% 7%3% 3% 3% 3% 2% 3%2% 2% 2% 2% 2% 2%
0%
10%
20%
30%
40%
50%
60%
70%
80%
90%
100%
2006 2007 2008 2009 2010 2011
Milk
Smoothies
Coffee
Tea
Carbonates
RTD Tea and Coffee
Concentrates
Bottled Water
Functional Drinks
Juices
Source: Product Launch Analytics BUSINESS INSIGHTS

63
Product claim trends
In terms of product claims across the soft drinks industry, the most important claims have changed
somewhat since 2006. The two most prevalent terms, ‘high vitamins’ and ‘natural’, have remained in place
throughout the 2006-2011 period. However, others have either disappeared or grown significantly.
Table 18: Soft drinks new product launches by product claim, 2006-2011
2006 2007 2008 2009 2010 2011High Vitamins 15% 15% 15% 13% 11% 12%Natural 13% 12% 12% 12% 14% 14%Single Serving 10% 9% 9% 9% 10% 6%No Preservatives 8% 10% 8% 10% 11% 11%Upscale 7% 7% 7% 4% 3% 1%Recyclable 6% 2% 3% 2% 6% 3%Pure 6% 5% 5% 5% 4% 4%Low Calories 6% 6% 6% 7% 6% 5%Low Sugar 6% 6% 5% 5% 2% 1%No Artificial Color 5% 6% 6% 7% 8% 9%No Sugar 5% 6% 6% 6% 5% 6%Organic 4% 5% 5% 6% 5% 7%High Antioxidants 3% 3% 5% 4% 4% 4%No Artificial Flavor 3% 5% 4% 5% 6% 6%Private Label 2% 2% 3% 5% 6% 11%Overall 100% 100% 100% 100% 100% 100%
Note: 'others' are excluded; they represent 45% of total launches over the period.
Source: Product Launch Analytics / author analysis BUSINESS INSIGHTS
Most tellingly, ‘upscale’ and ‘single serving’ have both dramatically diminished in usage. Upscale has fallen
from 7% of claims to 1% since 2008, based simply on the current global financial situation. Not only can
many consumers no longer afford ‘upscale’ drinks, even those who can afford them no longer take the same
pleasure in consumption that was the case during the boom. There is likely a similar story occurring with
single-serve drinks, which have fallen from 10% to 6%: single-serve products are the most expensive way to
consume drinks, with a 250ml bottle having a far higher unit price than a two liter bottle, and so have also

64
come under pressure in the current environment as shoppers seek to economize. The fastest-growing claim
is a mirror to these two: private label applied to 2% of launches in 2006 but now applies to 11%. This reflects
the major growth of sales, quality and levels of innovation among private label producers, as discussed in
more depth in Chapter 4.
It is also worth applying broader themes to these product claims. Most can be classed into one of three
types:
natural, fresh, organic and pure;
positive health (high in ‘good’ ingredients);
free-from (low in ‘bad’ ingredients).
Among the leading soft drinks product claims, positive health claims have fallen from 19% in 2006 to 16% in
2011; natural, fresh, organic & pure have risen from 23% to 26%, and free-from claims have risen from 33%
to 38%. This shift can be observed in all categories, with positive health claims generally declining despite
rising sales of functional drinks. This likely reflects a combination of stricter regulation and lower consumer
tolerance for alleged functional claims when not backed by strong evidence.
The word cloud below is generated with font size based on the frequency of usage of different claim types in
2006 versus the usage in 2011. It highlights the increased importance of natural and organic claims, the
major growth of private label, the increase in free-from claims, and the near disappearance of ‘upscale’, over
the last five years. Word clouds are used throughout this chapter to interpret the dry table data in a more
visually representative way.
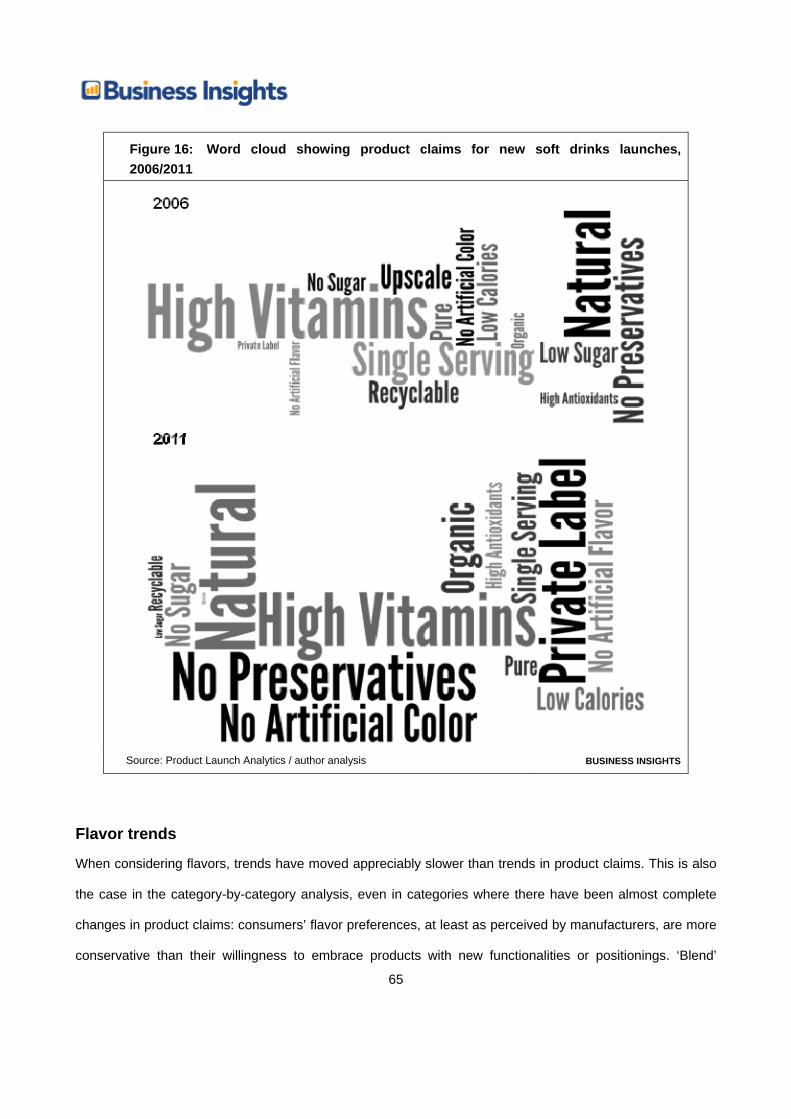
65
Figure 16: Word cloud showing product claims for new soft drinks launches, 2006/2011
Source: Product Launch Analytics / author analysis BUSINESS INSIGHTS
Flavor trends
When considering flavors, trends have moved appreciably slower than trends in product claims. This is also
the case in the category-by-category analysis, even in categories where there have been almost complete
changes in product claims: consumers’ flavor preferences, at least as perceived by manufacturers, are more
conservative than their willingness to embrace products with new functionalities or positionings. ‘Blend’
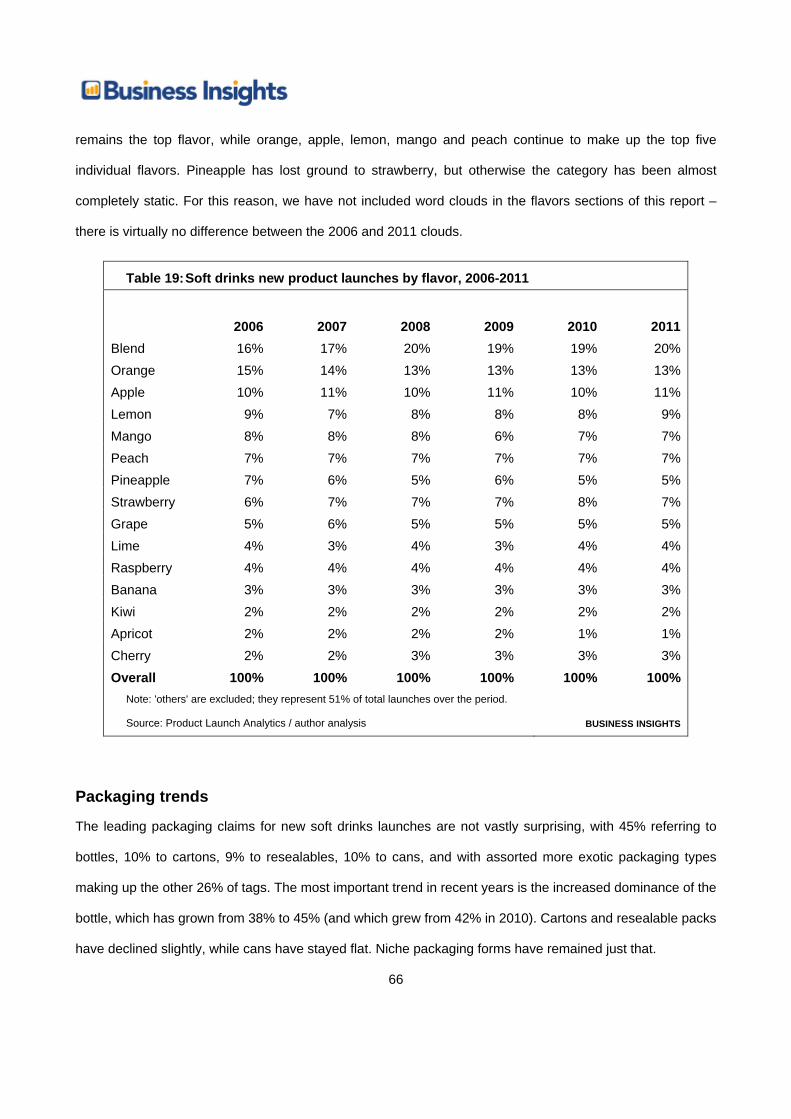
66
remains the top flavor, while orange, apple, lemon, mango and peach continue to make up the top five
individual flavors. Pineapple has lost ground to strawberry, but otherwise the category has been almost
completely static. For this reason, we have not included word clouds in the flavors sections of this report –
there is virtually no difference between the 2006 and 2011 clouds.
Table 19: Soft drinks new product launches by flavor, 2006-2011
2006 2007 2008 2009 2010 2011Blend 16% 17% 20% 19% 19% 20%Orange 15% 14% 13% 13% 13% 13%Apple 10% 11% 10% 11% 10% 11%Lemon 9% 7% 8% 8% 8% 9%Mango 8% 8% 8% 6% 7% 7%Peach 7% 7% 7% 7% 7% 7%Pineapple 7% 6% 5% 6% 5% 5%Strawberry 6% 7% 7% 7% 8% 7%Grape 5% 6% 5% 5% 5% 5%Lime 4% 3% 4% 3% 4% 4%Raspberry 4% 4% 4% 4% 4% 4%Banana 3% 3% 3% 3% 3% 3%Kiwi 2% 2% 2% 2% 2% 2%Apricot 2% 2% 2% 2% 1% 1%Cherry 2% 2% 3% 3% 3% 3%Overall 100% 100% 100% 100% 100% 100%
Note: 'others' are excluded; they represent 51% of total launches over the period.
Source: Product Launch Analytics / author analysis BUSINESS INSIGHTS
Packaging trends
The leading packaging claims for new soft drinks launches are not vastly surprising, with 45% referring to
bottles, 10% to cartons, 9% to resealables, 10% to cans, and with assorted more exotic packaging types
making up the other 26% of tags. The most important trend in recent years is the increased dominance of the
bottle, which has grown from 38% to 45% (and which grew from 42% in 2010). Cartons and resealable packs
have declined slightly, while cans have stayed flat. Niche packaging forms have remained just that.
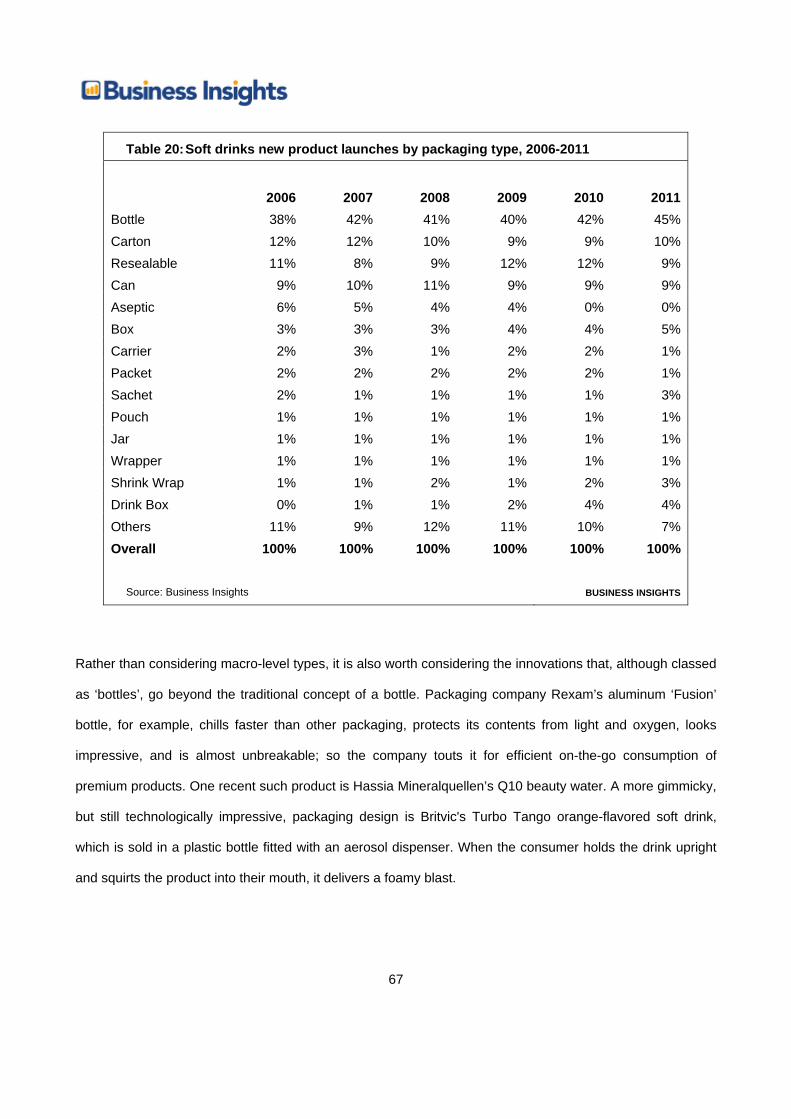
67
Table 20: Soft drinks new product launches by packaging type, 2006-2011
2006 2007 2008 2009 2010 2011
Bottle 38% 42% 41% 40% 42% 45%Carton 12% 12% 10% 9% 9% 10%Resealable 11% 8% 9% 12% 12% 9%Can 9% 10% 11% 9% 9% 9%Aseptic 6% 5% 4% 4% 0% 0%Box 3% 3% 3% 4% 4% 5%Carrier 2% 3% 1% 2% 2% 1%Packet 2% 2% 2% 2% 2% 1%Sachet 2% 1% 1% 1% 1% 3%Pouch 1% 1% 1% 1% 1% 1%Jar 1% 1% 1% 1% 1% 1%Wrapper 1% 1% 1% 1% 1% 1%Shrink Wrap 1% 1% 2% 1% 2% 3%Drink Box 0% 1% 1% 2% 4% 4%Others 11% 9% 12% 11% 10% 7%Overall 100% 100% 100% 100% 100% 100%
Source: Business Insights BUSINESS INSIGHTS
Rather than considering macro-level types, it is also worth considering the innovations that, although classed
as ‘bottles’, go beyond the traditional concept of a bottle. Packaging company Rexam’s aluminum ‘Fusion’
bottle, for example, chills faster than other packaging, protects its contents from light and oxygen, looks
impressive, and is almost unbreakable; so the company touts it for efficient on-the-go consumption of
premium products. One recent such product is Hassia Mineralquellen’s Q10 beauty water. A more gimmicky,
but still technologically impressive, packaging design is Britvic's Turbo Tango orange-flavored soft drink,
which is sold in a plastic bottle fitted with an aerosol dispenser. When the consumer holds the drink upright
and squirts the product into their mouth, it delivers a foamy blast.
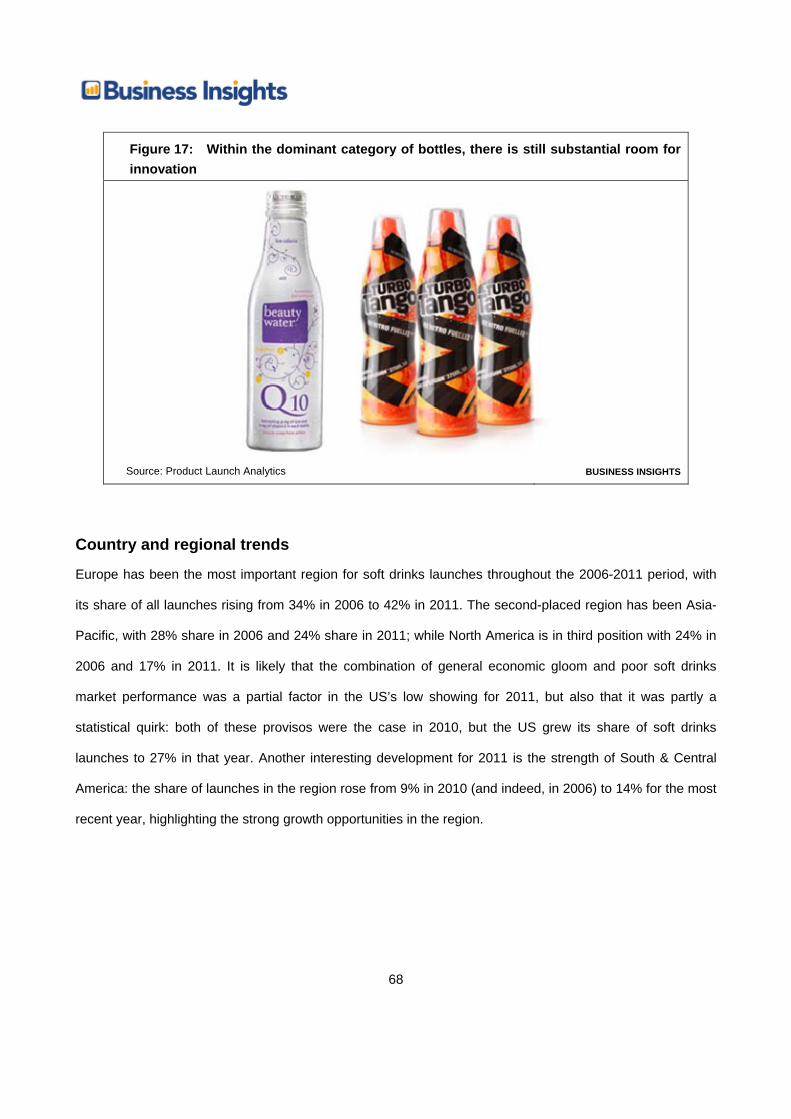
68
Figure 17: Within the dominant category of bottles, there is still substantial room for innovation
Source: Product Launch Analytics BUSINESS INSIGHTS
Country and regional trends
Europe has been the most important region for soft drinks launches throughout the 2006-2011 period, with
its share of all launches rising from 34% in 2006 to 42% in 2011. The second-placed region has been Asia-
Pacific, with 28% share in 2006 and 24% share in 2011; while North America is in third position with 24% in
2006 and 17% in 2011. It is likely that the combination of general economic gloom and poor soft drinks
market performance was a partial factor in the US’s low showing for 2011, but also that it was partly a
statistical quirk: both of these provisos were the case in 2010, but the US grew its share of soft drinks
launches to 27% in that year. Another interesting development for 2011 is the strength of South & Central
America: the share of launches in the region rose from 9% in 2010 (and indeed, in 2006) to 14% for the most
recent year, highlighting the strong growth opportunities in the region.
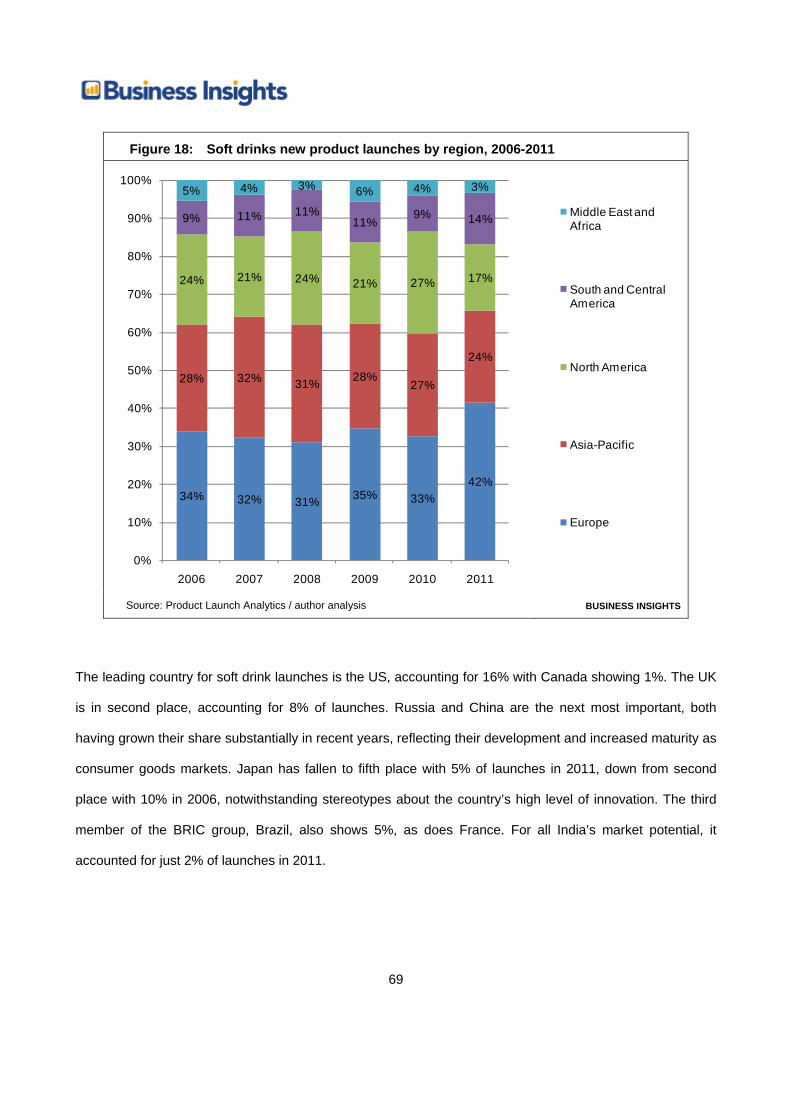
69
Figure 18: Soft drinks new product launches by region, 2006-2011
34% 32% 31% 35% 33%42%
28% 32% 31% 28%27%
24%
24% 21% 24% 21% 27% 17%
9% 11% 11%11%
9% 14%
5% 4% 3% 6% 4% 3%
0%
10%
20%
30%
40%
50%
60%
70%
80%
90%
100%
2006 2007 2008 2009 2010 2011
Middle East and Africa
South and Central America
North America
Asia-Pacific
Europe
Source: Product Launch Analytics / author analysis BUSINESS INSIGHTS
The leading country for soft drink launches is the US, accounting for 16% with Canada showing 1%. The UK
is in second place, accounting for 8% of launches. Russia and China are the next most important, both
having grown their share substantially in recent years, reflecting their development and increased maturity as
consumer goods markets. Japan has fallen to fifth place with 5% of launches in 2011, down from second
place with 10% in 2006, notwithstanding stereotypes about the country’s high level of innovation. The third
member of the BRIC group, Brazil, also shows 5%, as does France. For all India’s market potential, it
accounted for just 2% of launches in 2011.
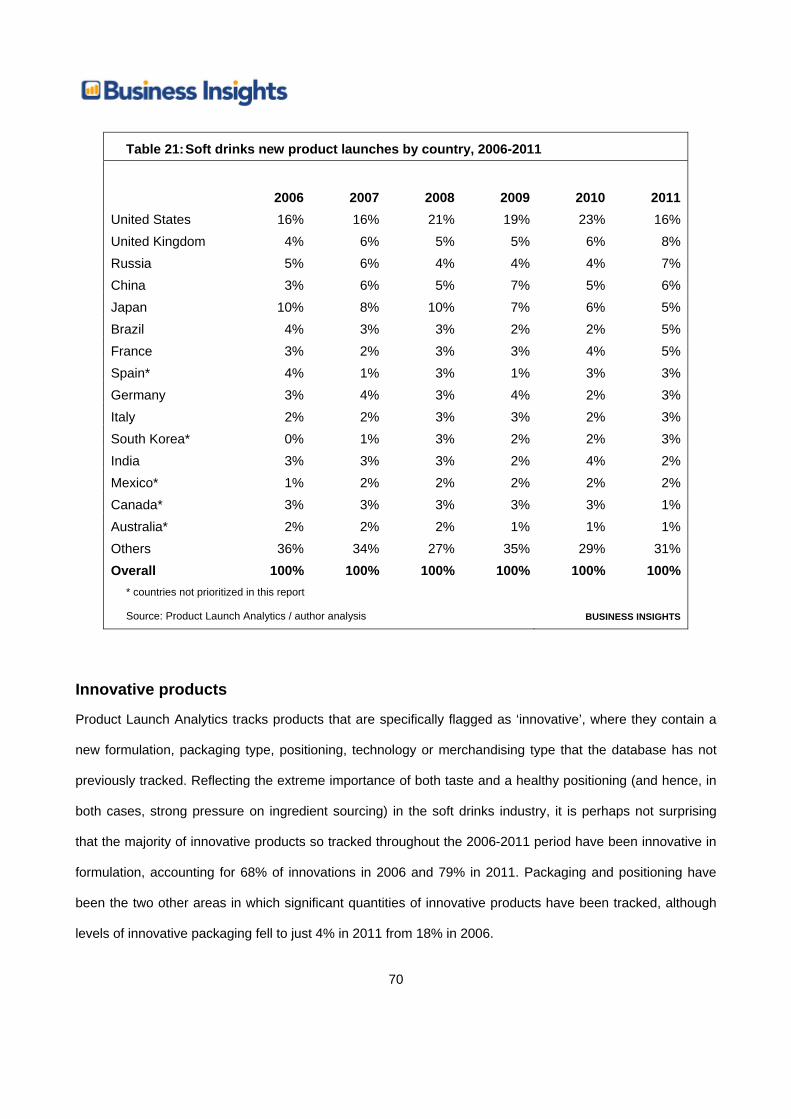
70
Table 21: Soft drinks new product launches by country, 2006-2011
2006 2007 2008 2009 2010 2011
United States 16% 16% 21% 19% 23% 16%United Kingdom 4% 6% 5% 5% 6% 8%Russia 5% 6% 4% 4% 4% 7%China 3% 6% 5% 7% 5% 6%Japan 10% 8% 10% 7% 6% 5%Brazil 4% 3% 3% 2% 2% 5%France 3% 2% 3% 3% 4% 5%Spain* 4% 1% 3% 1% 3% 3%Germany 3% 4% 3% 4% 2% 3%Italy 2% 2% 3% 3% 2% 3%South Korea* 0% 1% 3% 2% 2% 3%India 3% 3% 3% 2% 4% 2%Mexico* 1% 2% 2% 2% 2% 2%Canada* 3% 3% 3% 3% 3% 1%Australia* 2% 2% 2% 1% 1% 1%Others 36% 34% 27% 35% 29% 31%Overall 100% 100% 100% 100% 100% 100%
* countries not prioritized in this report
Source: Product Launch Analytics / author analysis BUSINESS INSIGHTS
Innovative products
Product Launch Analytics tracks products that are specifically flagged as ‘innovative’, where they contain a
new formulation, packaging type, positioning, technology or merchandising type that the database has not
previously tracked. Reflecting the extreme importance of both taste and a healthy positioning (and hence, in
both cases, strong pressure on ingredient sourcing) in the soft drinks industry, it is perhaps not surprising
that the majority of innovative products so tracked throughout the 2006-2011 period have been innovative in
formulation, accounting for 68% of innovations in 2006 and 79% in 2011. Packaging and positioning have
been the two other areas in which significant quantities of innovative products have been tracked, although
levels of innovative packaging fell to just 4% in 2011 from 18% in 2006.

71
Figure 19: Innovative new product launches by innovation type, 2006-2011
68% 70% 69%76%
70%79%
18%6%
13%6% 15%
4%
8%
13%9% 13% 8% 15%
4% 10% 6%4%2% 2%
6%
0%
10%
20%
30%
40%
50%
60%
70%
80%
90%
100%
2006 2007 2008 2009 2010 2011
New Market
Technology
Merchandising
Positioning
Packaging Benefit
Formulation
Source: Product Launch Analytics/author analysis BUSINESS INSIGHTS
Innovation is spread widely across categories, but the cross-category map is noticeably different from the
map of product launches overall. Whereas juices have always been the largest category in terms of total
product launches, they have never been the largest in terms of innovative launches. That title was held by
functional drinks for four of the last six years, but the most innovative category in 2011 was concentrates,
accounting for 31% of innovative products. The share of functional drinks fell from 58% in 2010 to 23% in
2011; while some of this shift is likely due to random variation, it is also clear that the functional drinks market
in many developed countries is running out of steam, and that major innovations in the last few years such
as the launch of energy shots have largely failed to catch on. Juices accounted for 15% of innovative new
products in 2011, with carbonates making up another 11%.
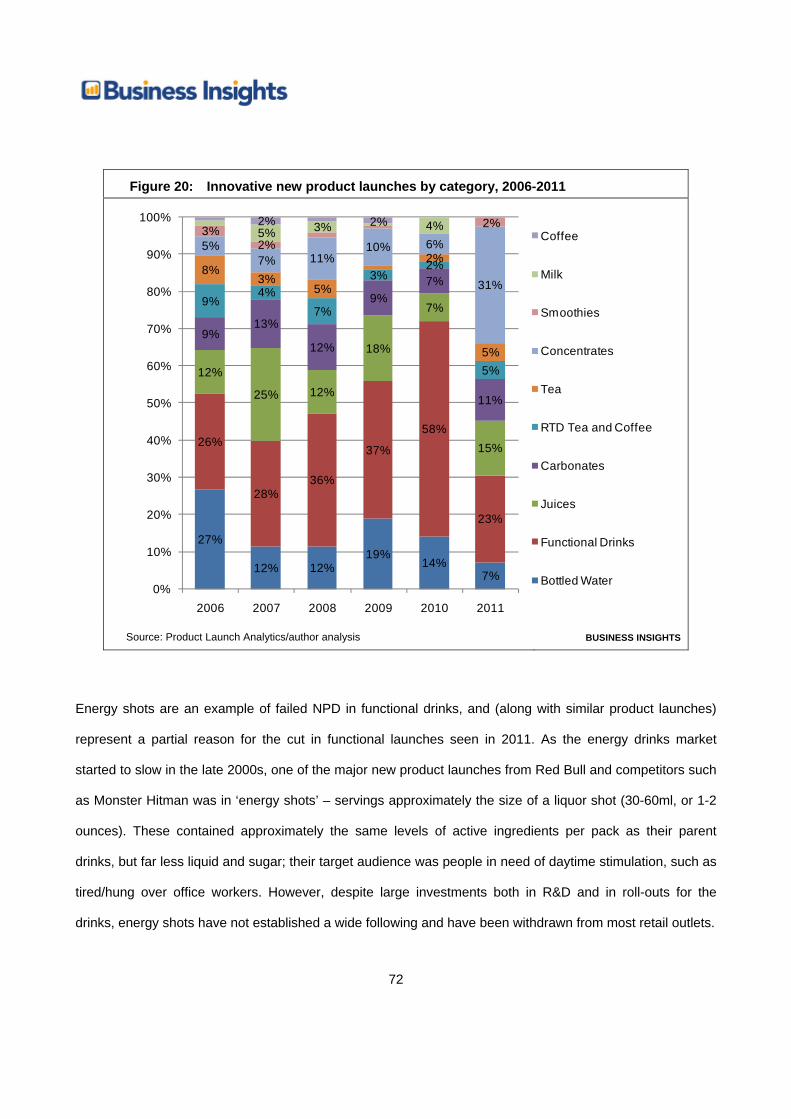
72
Figure 20: Innovative new product launches by category, 2006-2011
27%
12% 12%19%
14%7%
26%
28%36%
37%
58%
23%
12%
25% 12%
18%
7%
15%
9%13%
12%
9%7%
11%
9%4%
7%
3%2%
5%
8%3%
5%
2%
5%
5%7% 11%
10% 6%
31%
3%2%
2%5% 3% 4%2% 2%
0%
10%
20%
30%
40%
50%
60%
70%
80%
90%
100%
2006 2007 2008 2009 2010 2011
Coffee
Milk
Smoothies
Concentrates
Tea
RTD Tea and Coffee
Carbonates
Juices
Functional Drinks
Bottled Water
Source: Product Launch Analytics/author analysis BUSINESS INSIGHTS
Energy shots are an example of failed NPD in functional drinks, and (along with similar product launches)
represent a partial reason for the cut in functional launches seen in 2011. As the energy drinks market
started to slow in the late 2000s, one of the major new product launches from Red Bull and competitors such
as Monster Hitman was in ‘energy shots’ – servings approximately the size of a liquor shot (30-60ml, or 1-2
ounces). These contained approximately the same levels of active ingredients per pack as their parent
drinks, but far less liquid and sugar; their target audience was people in need of daytime stimulation, such as
tired/hung over office workers. However, despite large investments both in R&D and in roll-outs for the
drinks, energy shots have not established a wide following and have been withdrawn from most retail outlets.
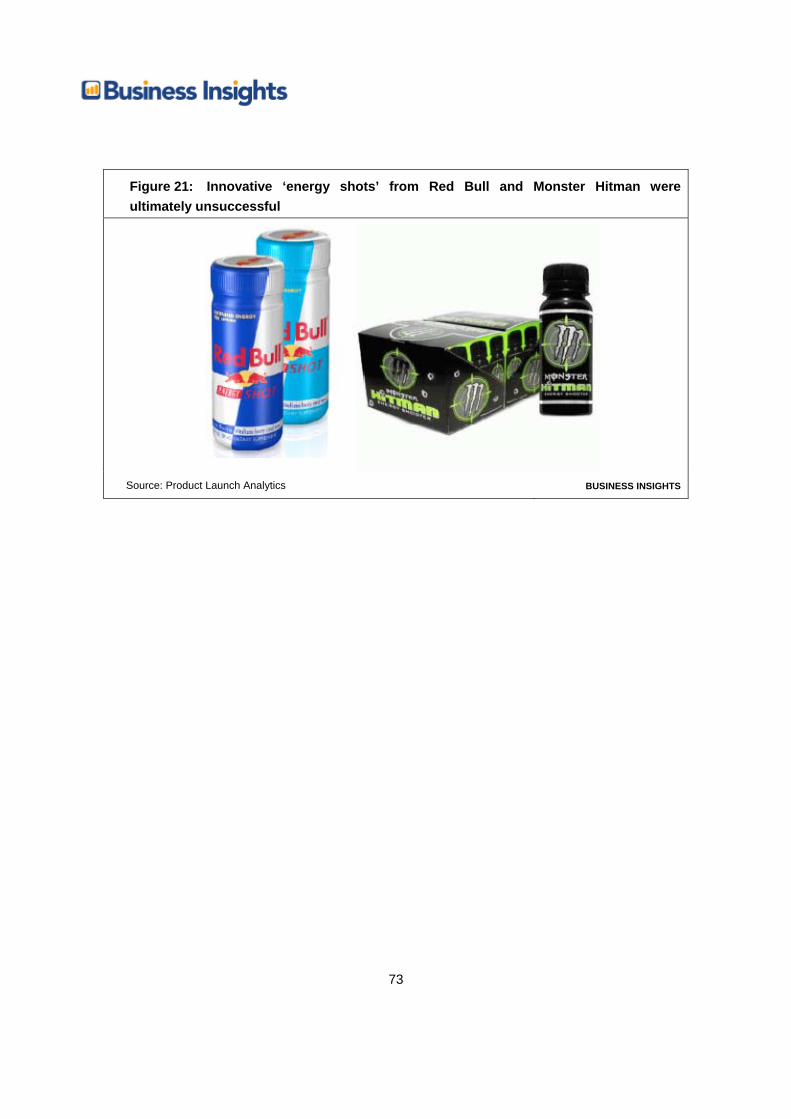
73
Figure 21: Innovative ‘energy shots’ from Red Bull and Monster Hitman were ultimately unsuccessful
Source: Product Launch Analytics BUSINESS INSIGHTS
74
Category-level analysis Many of the themes outlined above are of relevance across all categories – most clearly, the disappearance
of upscale and single-serve, the emergence of private label, and the lack of innovation in flavors. However,
there are other themes that change significantly on a category-by-category basis – in particular, the relative
balance of the major trend groups outlined above, specific niche flavors, and the regional breakdown of
innovation. The rest of this chapter carries out a simplified version of the analysis above for each soft drinks
category.
Bottled water
Within the bottled water sector, the most popular product tag throughout the last five years has been
‘natural’, accounting for 19% of product claims by SKU in 2011. The assorted free-from tags (‘natural’, ‘pure’,
‘no preservatives’, ‘no artificial flavor, ‘no artificial color’, and ‘no artificial sweeteners’) accounted for 41% of
all claims in 2011. This is perhaps unsurprising, given that the product being sold is fundamentally water,
which is directly associated in most consumers’ minds with natural purity. This is most obvious in campaigns
for mineral or spring waters, but bottled table waters are often marketed using similar verbal and visual cues
(although clearly without making specific origin claims). ‘Low calories’, ‘no calories’ and ‘no sugar’ are
another popular claim group, making up 23% of claims in 2011 – again, these are inherent to the product, but
are nonetheless claims that have helped drive bottled water sales as an alternative to carbonated drinks in
many markets over the last five years. This has been particularly important in the flavored waters category,
with carbonated flavored waters being directly interchangeable in taste terms with carbonated soft drinks, but
carrying connotations of nature and health that conventionally branded carbonates do not.
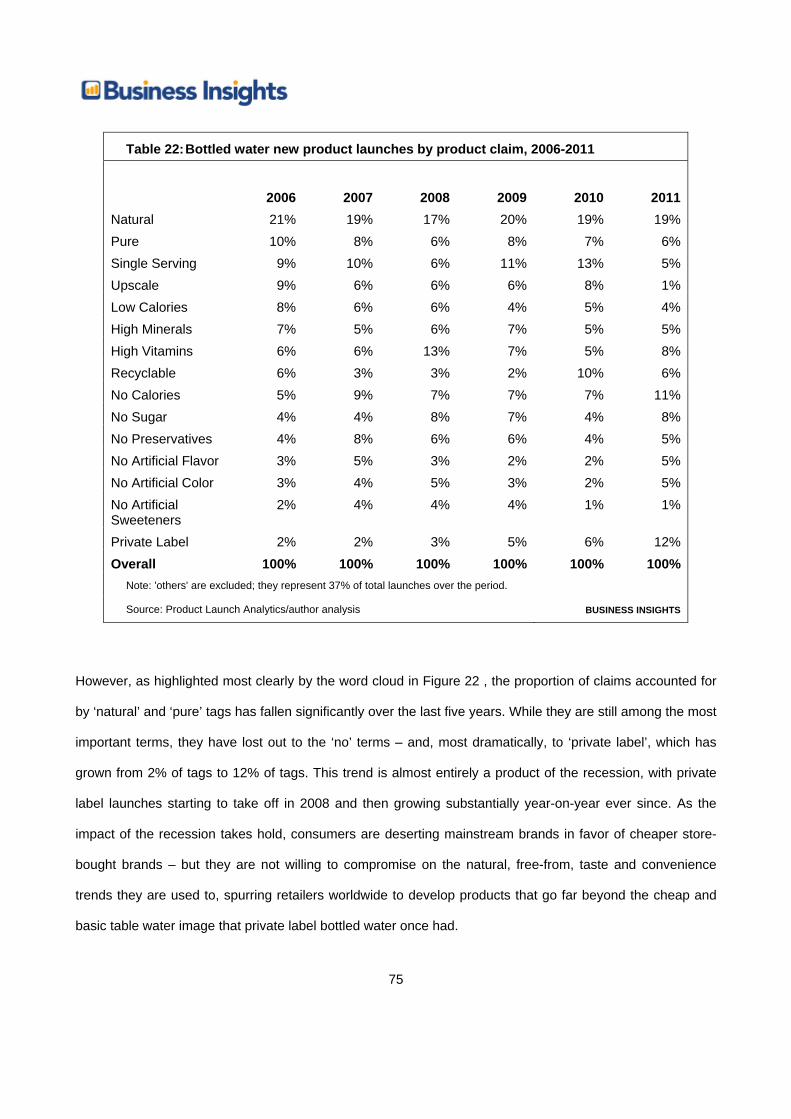
75
Table 22: Bottled water new product launches by product claim, 2006-2011
2006 2007 2008 2009 2010 2011
Natural 21% 19% 17% 20% 19% 19%Pure 10% 8% 6% 8% 7% 6%Single Serving 9% 10% 6% 11% 13% 5%Upscale 9% 6% 6% 6% 8% 1%Low Calories 8% 6% 6% 4% 5% 4%High Minerals 7% 5% 6% 7% 5% 5%High Vitamins 6% 6% 13% 7% 5% 8%Recyclable 6% 3% 3% 2% 10% 6%No Calories 5% 9% 7% 7% 7% 11%No Sugar 4% 4% 8% 7% 4% 8%No Preservatives 4% 8% 6% 6% 4% 5%No Artificial Flavor 3% 5% 3% 2% 2% 5%No Artificial Color 3% 4% 5% 3% 2% 5%No Artificial Sweeteners
2% 4% 4% 4% 1% 1%
Private Label 2% 2% 3% 5% 6% 12%Overall 100% 100% 100% 100% 100% 100%
Note: 'others' are excluded; they represent 37% of total launches over the period.
Source: Product Launch Analytics/author analysis BUSINESS INSIGHTS
However, as highlighted most clearly by the word cloud in Figure 22 , the proportion of claims accounted for
by ‘natural’ and ‘pure’ tags has fallen significantly over the last five years. While they are still among the most
important terms, they have lost out to the ‘no’ terms – and, most dramatically, to ‘private label’, which has
grown from 2% of tags to 12% of tags. This trend is almost entirely a product of the recession, with private
label launches starting to take off in 2008 and then growing substantially year-on-year ever since. As the
impact of the recession takes hold, consumers are deserting mainstream brands in favor of cheaper store-
bought brands – but they are not willing to compromise on the natural, free-from, taste and convenience
trends they are used to, spurring retailers worldwide to develop products that go far beyond the cheap and
basic table water image that private label bottled water once had.
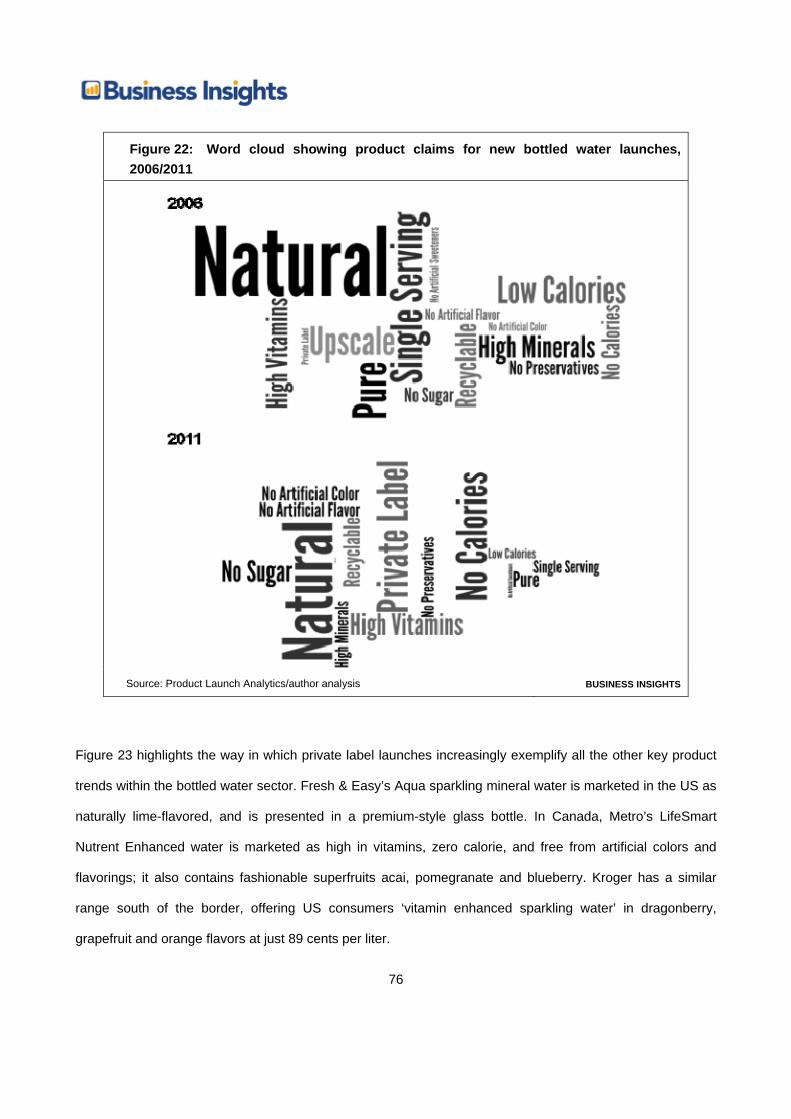
76
Figure 22: Word cloud showing product claims for new bottled water launches, 2006/2011
Source: Product Launch Analytics/author analysis BUSINESS INSIGHTS
Figure 23 highlights the way in which private label launches increasingly exemplify all the other key product
trends within the bottled water sector. Fresh & Easy’s Aqua sparkling mineral water is marketed in the US as
naturally lime-flavored, and is presented in a premium-style glass bottle. In Canada, Metro’s LifeSmart
Nutrent Enhanced water is marketed as high in vitamins, zero calorie, and free from artificial colors and
flavorings; it also contains fashionable superfruits acai, pomegranate and blueberry. Kroger has a similar
range south of the border, offering US consumers ‘vitamin enhanced sparkling water’ in dragonberry,
grapefruit and orange flavors at just 89 cents per liter.

77
Figure 23: Many North American retailers have launched ranges of premium private label flavored bottled waters
Source: Product Launch Analytics BUSINESS INSIGHTS
As in most categories, changes in flavor trends in bottled water have been relatively slow, with the top three
flavors in 2006 (excluding blends) remaining the top three in 2011 and with lemon retaining pole position,
although lime flavor has overtaken orange flavor to the #2 spot. The biggest emerging flavor has been
pomegranate, which has shown significant growth across both functional categories and categories that
market themselves based on health perceptions due to its ‘superfruit’ naturally functional status (although by
no means all pomegranate flavored waters actually contain significant quantities of real pomegranate). Other
superfruit flavors such as dragonberry, acai and blueberry, have not yet gained significant mainstream share
in the bottled water category.
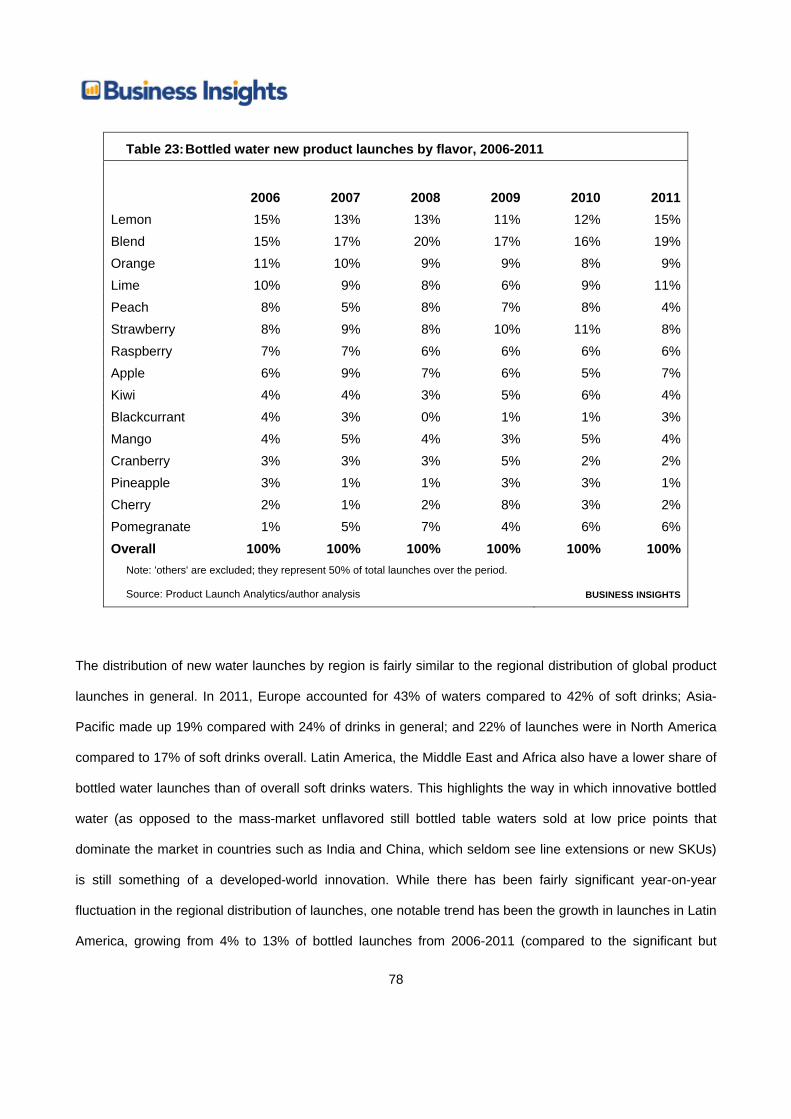
78
Table 23: Bottled water new product launches by flavor, 2006-2011
2006 2007 2008 2009 2010 2011Lemon 15% 13% 13% 11% 12% 15%Blend 15% 17% 20% 17% 16% 19%Orange 11% 10% 9% 9% 8% 9%Lime 10% 9% 8% 6% 9% 11%Peach 8% 5% 8% 7% 8% 4%Strawberry 8% 9% 8% 10% 11% 8%Raspberry 7% 7% 6% 6% 6% 6%Apple 6% 9% 7% 6% 5% 7%Kiwi 4% 4% 3% 5% 6% 4%Blackcurrant 4% 3% 0% 1% 1% 3%Mango 4% 5% 4% 3% 5% 4%Cranberry 3% 3% 3% 5% 2% 2%Pineapple 3% 1% 1% 3% 3% 1%Cherry 2% 1% 2% 8% 3% 2%Pomegranate 1% 5% 7% 4% 6% 6%Overall 100% 100% 100% 100% 100% 100%
Note: 'others' are excluded; they represent 50% of total launches over the period.
Source: Product Launch Analytics/author analysis BUSINESS INSIGHTS
The distribution of new water launches by region is fairly similar to the regional distribution of global product
launches in general. In 2011, Europe accounted for 43% of waters compared to 42% of soft drinks; Asia-
Pacific made up 19% compared with 24% of drinks in general; and 22% of launches were in North America
compared to 17% of soft drinks overall. Latin America, the Middle East and Africa also have a lower share of
bottled water launches than of overall soft drinks waters. This highlights the way in which innovative bottled
water (as opposed to the mass-market unflavored still bottled table waters sold at low price points that
dominate the market in countries such as India and China, which seldom see line extensions or new SKUs)
is still something of a developed-world innovation. While there has been fairly significant year-on-year
fluctuation in the regional distribution of launches, one notable trend has been the growth in launches in Latin
America, growing from 4% to 13% of bottled launches from 2006-2011 (compared to the significant but
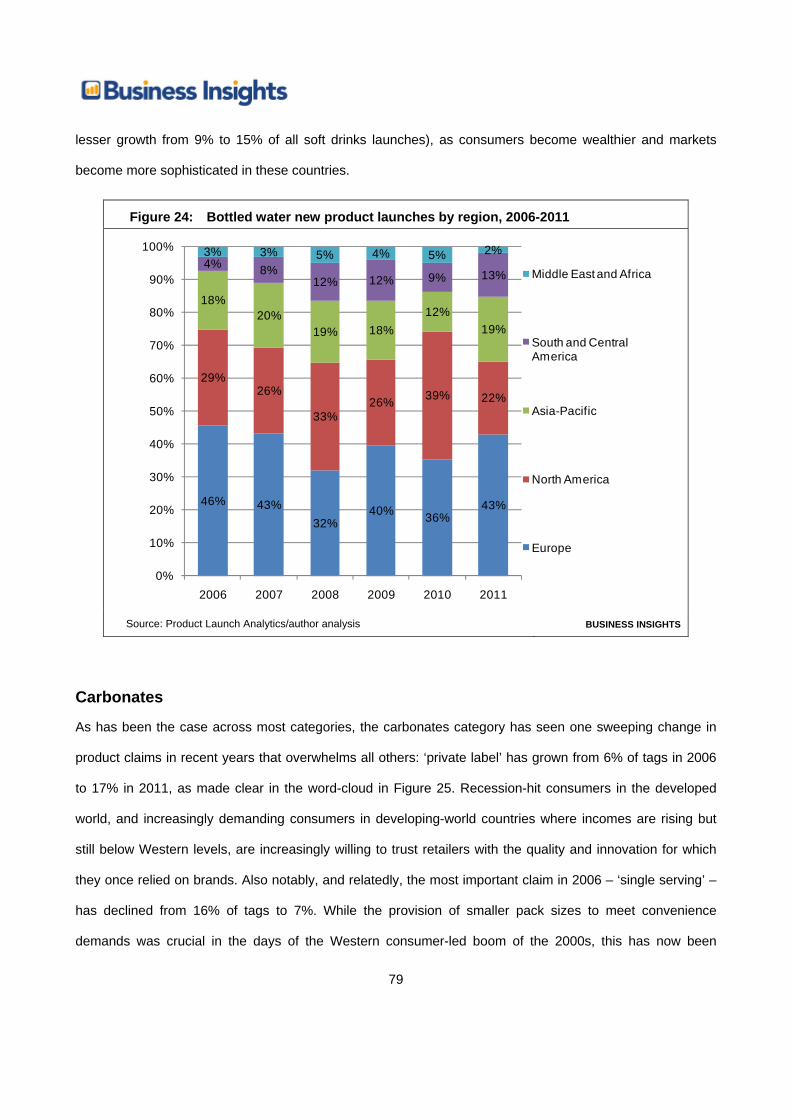
79
lesser growth from 9% to 15% of all soft drinks launches), as consumers become wealthier and markets
become more sophisticated in these countries.
Figure 24: Bottled water new product launches by region, 2006-2011
46% 43%32%
40% 36%43%
29%26%
33%26% 39% 22%
18%20%
19% 18%12%
19%
4% 8%12% 12% 9% 13%
3% 3% 5% 4% 5% 2%
0%
10%
20%
30%
40%
50%
60%
70%
80%
90%
100%
2006 2007 2008 2009 2010 2011
Middle East and Africa
South and Central America
Asia-Pacific
North America
Europe
Source: Product Launch Analytics/author analysis BUSINESS INSIGHTS
Carbonates
As has been the case across most categories, the carbonates category has seen one sweeping change in
product claims in recent years that overwhelms all others: ‘private label’ has grown from 6% of tags in 2006
to 17% in 2011, as made clear in the word-cloud in Figure 25. Recession-hit consumers in the developed
world, and increasingly demanding consumers in developing-world countries where incomes are rising but
still below Western levels, are increasingly willing to trust retailers with the quality and innovation for which
they once relied on brands. Also notably, and relatedly, the most important claim in 2006 – ‘single serving’ –
has declined from 16% of tags to 7%. While the provision of smaller pack sizes to meet convenience
demands was crucial in the days of the Western consumer-led boom of the 2000s, this has now been
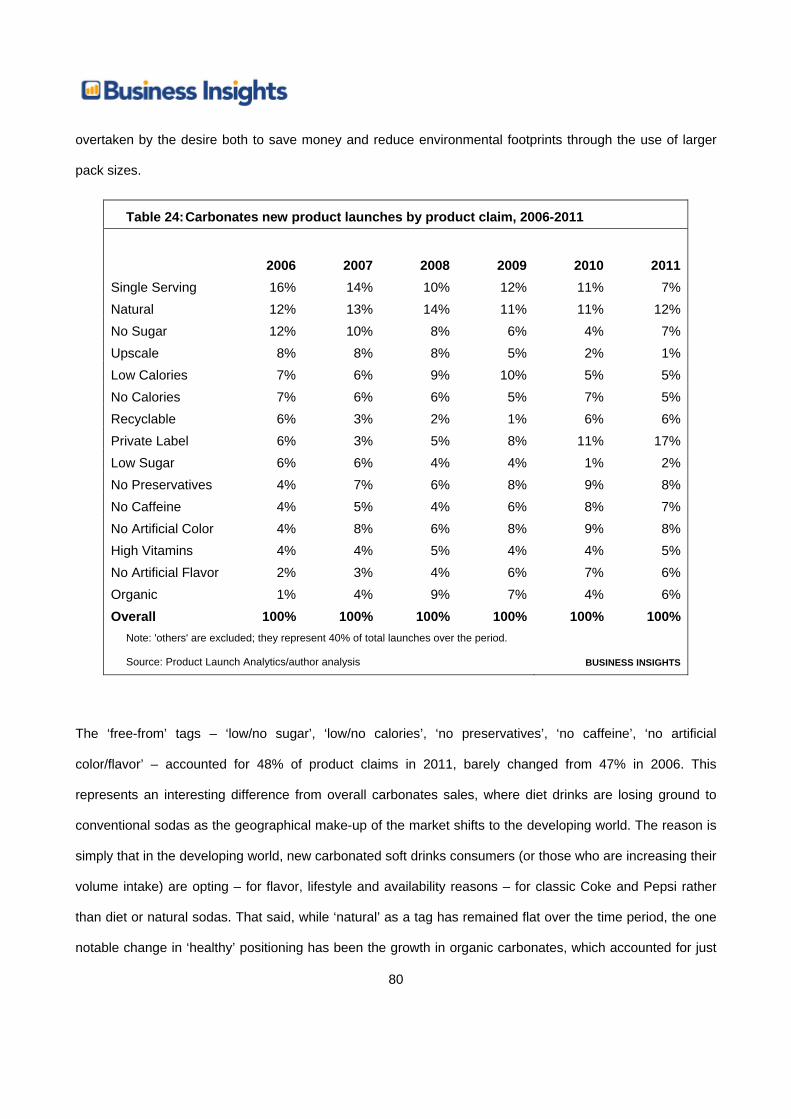
80
overtaken by the desire both to save money and reduce environmental footprints through the use of larger
pack sizes.
Table 24: Carbonates new product launches by product claim, 2006-2011
2006 2007 2008 2009 2010 2011Single Serving 16% 14% 10% 12% 11% 7%Natural 12% 13% 14% 11% 11% 12%No Sugar 12% 10% 8% 6% 4% 7%Upscale 8% 8% 8% 5% 2% 1%Low Calories 7% 6% 9% 10% 5% 5%No Calories 7% 6% 6% 5% 7% 5%Recyclable 6% 3% 2% 1% 6% 6%Private Label 6% 3% 5% 8% 11% 17%Low Sugar 6% 6% 4% 4% 1% 2%No Preservatives 4% 7% 6% 8% 9% 8%No Caffeine 4% 5% 4% 6% 8% 7%No Artificial Color 4% 8% 6% 8% 9% 8%High Vitamins 4% 4% 5% 4% 4% 5%No Artificial Flavor 2% 3% 4% 6% 7% 6%Organic 1% 4% 9% 7% 4% 6%Overall 100% 100% 100% 100% 100% 100%
Note: 'others' are excluded; they represent 40% of total launches over the period.
Source: Product Launch Analytics/author analysis BUSINESS INSIGHTS
The ‘free-from’ tags – ‘low/no sugar’, ‘low/no calories’, ‘no preservatives’, ‘no caffeine’, ‘no artificial
color/flavor’ – accounted for 48% of product claims in 2011, barely changed from 47% in 2006. This
represents an interesting difference from overall carbonates sales, where diet drinks are losing ground to
conventional sodas as the geographical make-up of the market shifts to the developing world. The reason is
simply that in the developing world, new carbonated soft drinks consumers (or those who are increasing their
volume intake) are opting – for flavor, lifestyle and availability reasons – for classic Coke and Pepsi rather
than diet or natural sodas. That said, while ‘natural’ as a tag has remained flat over the time period, the one
notable change in ‘healthy’ positioning has been the growth in organic carbonates, which accounted for just
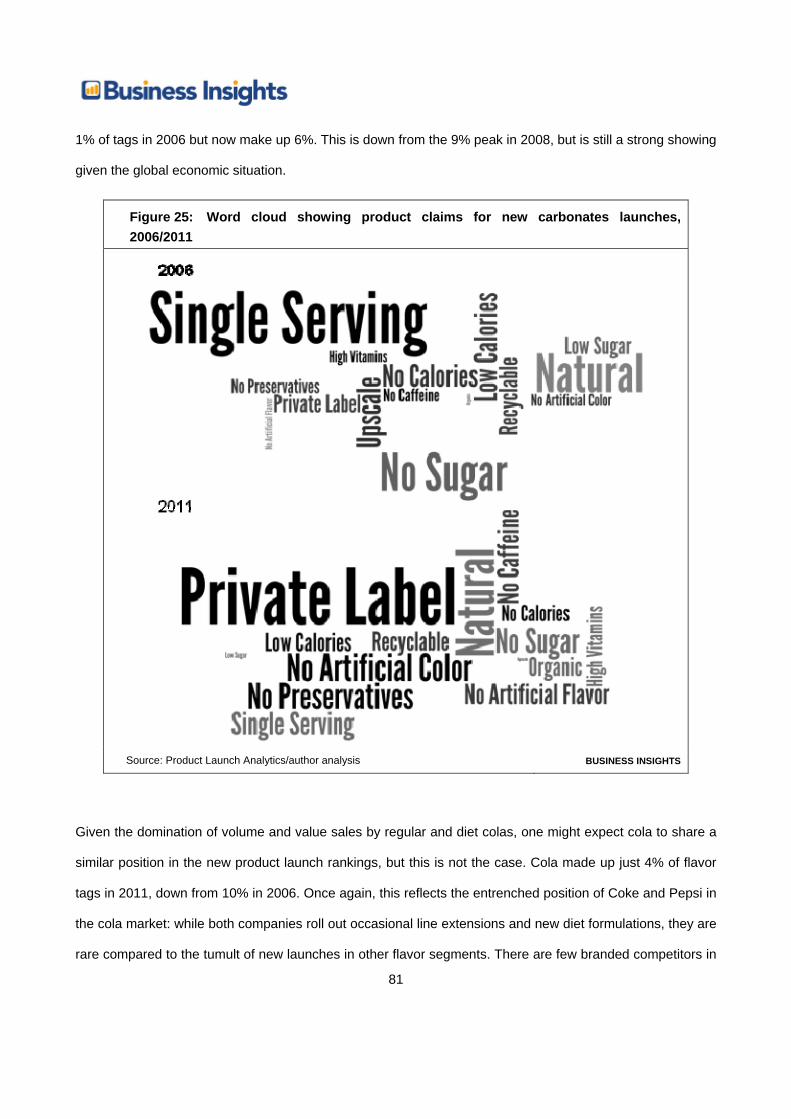
81
1% of tags in 2006 but now make up 6%. This is down from the 9% peak in 2008, but is still a strong showing
given the global economic situation.
Figure 25: Word cloud showing product claims for new carbonates launches, 2006/2011
Source: Product Launch Analytics/author analysis BUSINESS INSIGHTS
Given the domination of volume and value sales by regular and diet colas, one might expect cola to share a
similar position in the new product launch rankings, but this is not the case. Cola made up just 4% of flavor
tags in 2011, down from 10% in 2006. Once again, this reflects the entrenched position of Coke and Pepsi in
the cola market: while both companies roll out occasional line extensions and new diet formulations, they are
rare compared to the tumult of new launches in other flavor segments. There are few branded competitors in

82
the cola market, and private label colas generally live up to private label’s traditional role as a cheaper,
inferior substitute rather than the recent innovation that has been seen in other private label categories.
Instead, the most popular non-blend flavors in 2011 were lemon, orange and apple, with pear having been
the fastest-growing flavor since 2006. Specific fruit flavors accounted for 76% of launches in 2011.
Table 25: Carbonates new product launches by flavor, 2006-2011
2006 2007 2008 2009 2010 2011Blend 19% 16% 22% 19% 14% 17%Lemon 16% 15% 15% 15% 14% 17%Orange 16% 16% 12% 17% 14% 13%Cola 10% 9% 11% 9% 7% 4%Lime 9% 7% 7% 6% 8% 7%Grape 5% 4% 3% 5% 5% 5%Apple 5% 9% 8% 10% 7% 10%Peach 4% 3% 5% 2% 3% 6%Strawberry 4% 6% 3% 3% 5% 5%Grapefruit 3% 4% 5% 4% 4% 3%Cherry 3% 2% 2% 3% 5% 4%Root Beer 2% 2% 1% 2% 4% 1%Black Cherry 2% 2% 2% 1% 2% 1%Cream Soda 2% 2% 1% 1% 2% 2%Pear 1% 2% 4% 2% 4% 6%Overall 100% 100% 100% 100% 100% 100%
Note: 'others' are excluded; they represent 47% of total launches over the period.
Source: Product Launch Analytics/author analysis BUSINESS INSIGHTS
Figure 26 highlights some recent product launches from the emerging markets of Mexico, Russia and Brazil.
PepsiCo’s Squirt Party Mojito mint-and-grapefruit drink in Mexico is one example – unlike most mojito-
branded soft drinks, it is not sold as a mixer kit, but as a drink in its own right with mojito flavor notes.
Meanwhile in Russia, the Eliksa Non-Alcoholic Sparkling Drink is available in almost all the top flavors
tracked by PLA – orange, lime, lemon and cherry. It also claims to be sweetened with honey, which is an
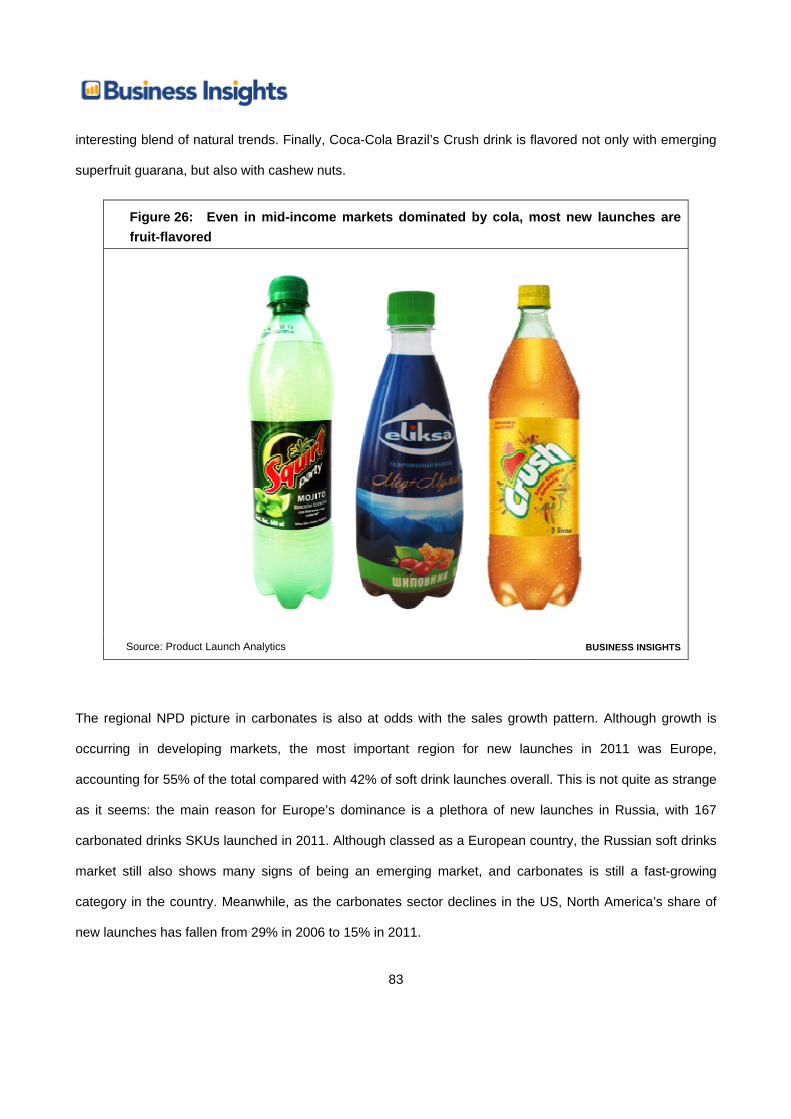
83
interesting blend of natural trends. Finally, Coca-Cola Brazil’s Crush drink is flavored not only with emerging
superfruit guarana, but also with cashew nuts.
Figure 26: Even in mid-income markets dominated by cola, most new launches are fruit-flavored
Source: Product Launch Analytics BUSINESS INSIGHTS
The regional NPD picture in carbonates is also at odds with the sales growth pattern. Although growth is
occurring in developing markets, the most important region for new launches in 2011 was Europe,
accounting for 55% of the total compared with 42% of soft drink launches overall. This is not quite as strange
as it seems: the main reason for Europe’s dominance is a plethora of new launches in Russia, with 167
carbonated drinks SKUs launched in 2011. Although classed as a European country, the Russian soft drinks
market still also shows many signs of being an emerging market, and carbonates is still a fast-growing
category in the country. Meanwhile, as the carbonates sector declines in the US, North America’s share of
new launches has fallen from 29% in 2006 to 15% in 2011.

84
Figure 27: Carbonates new product launches by region, 2006-2011
33% 33%
45%37% 39%
55%
29% 28%
20%
21%22%
15%
28% 27% 23%
25%26%
18%
8% 9% 10%12%
10% 11%
1% 2% 2% 4% 3% 1%
0%
10%
20%
30%
40%
50%
60%
70%
80%
90%
100%
2006 2007 2008 2009 2010 2011
Middle East and Africa
South and Central America
Asia-Pacific
North America
Europe
Source: Product Launch Analytics/author analysis BUSINESS INSIGHTS
Concentrates
Concentrates have historically been perceived as an unloved category, due to their low price point and their
limited ability for formulation-based reasons to participate in convenience and active health trends. However,
with sales picking up in many emerging and developed markets in recent years as people substitute away
from more expensive juices and nectars, their share of soft drinks product launches has risen from 11% to
14%, making them the second-largest category for new launches in 2011. The pattern of product claims
associated with concentrates, as a result, has taken a different trajectory from that seen in many markets:
although the ‘upscale’ positioning has largely died out since 2008, with such explicit claims out of fashion in
the post-financial-crises environment, active health claims such as ‘high vitamins’, ‘high minerals’, ‘high
calcium’ and ‘high antoxidants’ have risen from 24% of tags in 2006 to 28% of launches in 2011. ‘Free-from’
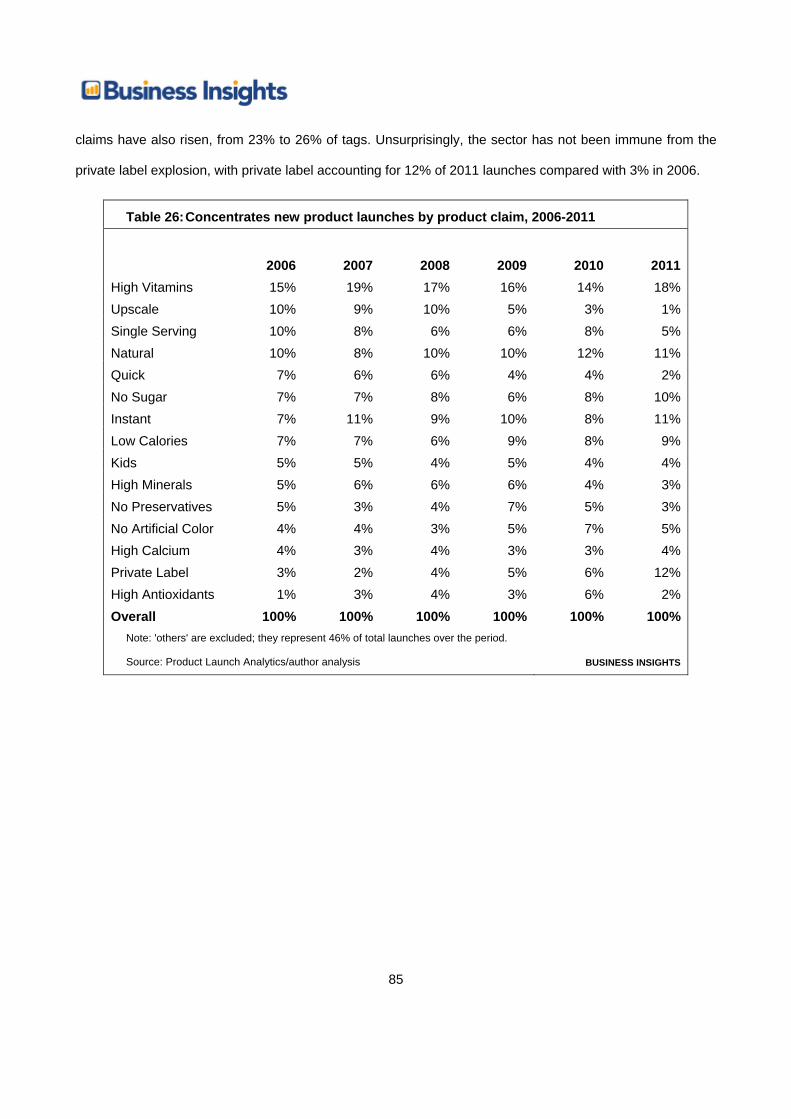
85
claims have also risen, from 23% to 26% of tags. Unsurprisingly, the sector has not been immune from the
private label explosion, with private label accounting for 12% of 2011 launches compared with 3% in 2006.
Table 26: Concentrates new product launches by product claim, 2006-2011
2006 2007 2008 2009 2010 2011High Vitamins 15% 19% 17% 16% 14% 18%Upscale 10% 9% 10% 5% 3% 1%Single Serving 10% 8% 6% 6% 8% 5%Natural 10% 8% 10% 10% 12% 11%Quick 7% 6% 6% 4% 4% 2%No Sugar 7% 7% 8% 6% 8% 10%Instant 7% 11% 9% 10% 8% 11%Low Calories 7% 7% 6% 9% 8% 9%Kids 5% 5% 4% 5% 4% 4%High Minerals 5% 6% 6% 6% 4% 3%No Preservatives 5% 3% 4% 7% 5% 3%No Artificial Color 4% 4% 3% 5% 7% 5%High Calcium 4% 3% 4% 3% 3% 4%Private Label 3% 2% 4% 5% 6% 12%High Antioxidants 1% 3% 4% 3% 6% 2%Overall 100% 100% 100% 100% 100% 100%
Note: 'others' are excluded; they represent 46% of total launches over the period.
Source: Product Launch Analytics/author analysis BUSINESS INSIGHTS
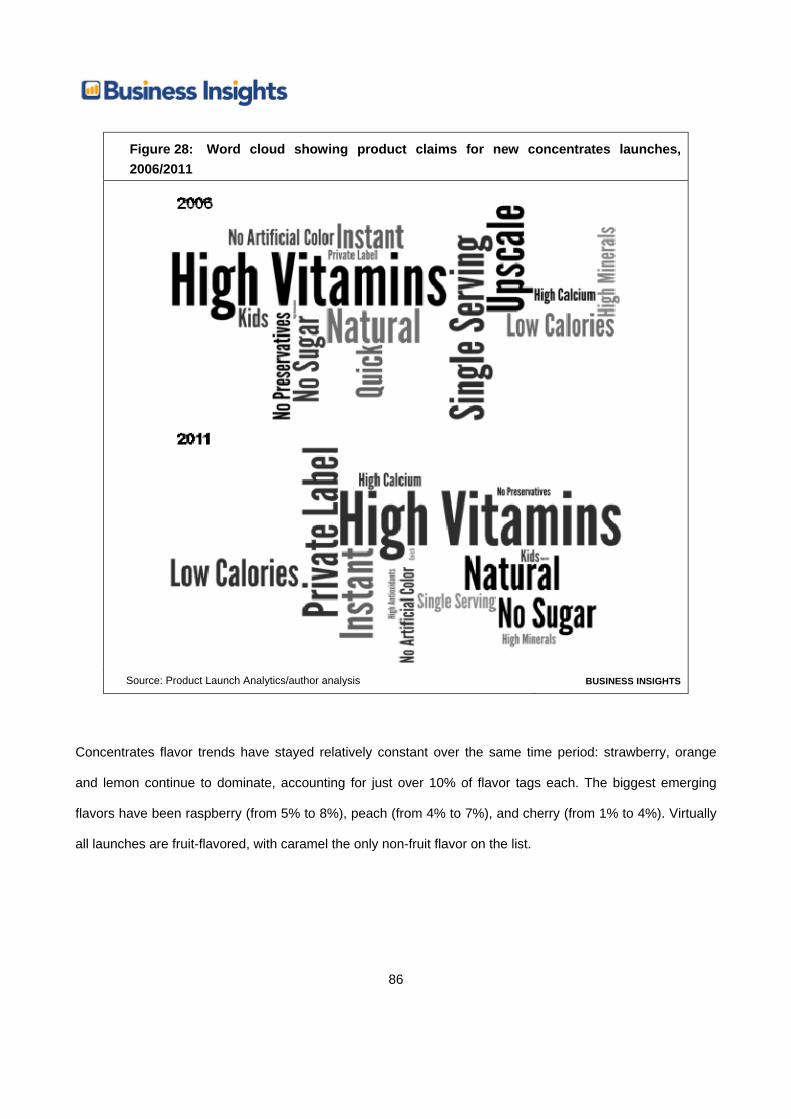
86
Figure 28: Word cloud showing product claims for new concentrates launches, 2006/2011
Source: Product Launch Analytics/author analysis BUSINESS INSIGHTS
Concentrates flavor trends have stayed relatively constant over the same time period: strawberry, orange
and lemon continue to dominate, accounting for just over 10% of flavor tags each. The biggest emerging
flavors have been raspberry (from 5% to 8%), peach (from 4% to 7%), and cherry (from 1% to 4%). Virtually
all launches are fruit-flavored, with caramel the only non-fruit flavor on the list.
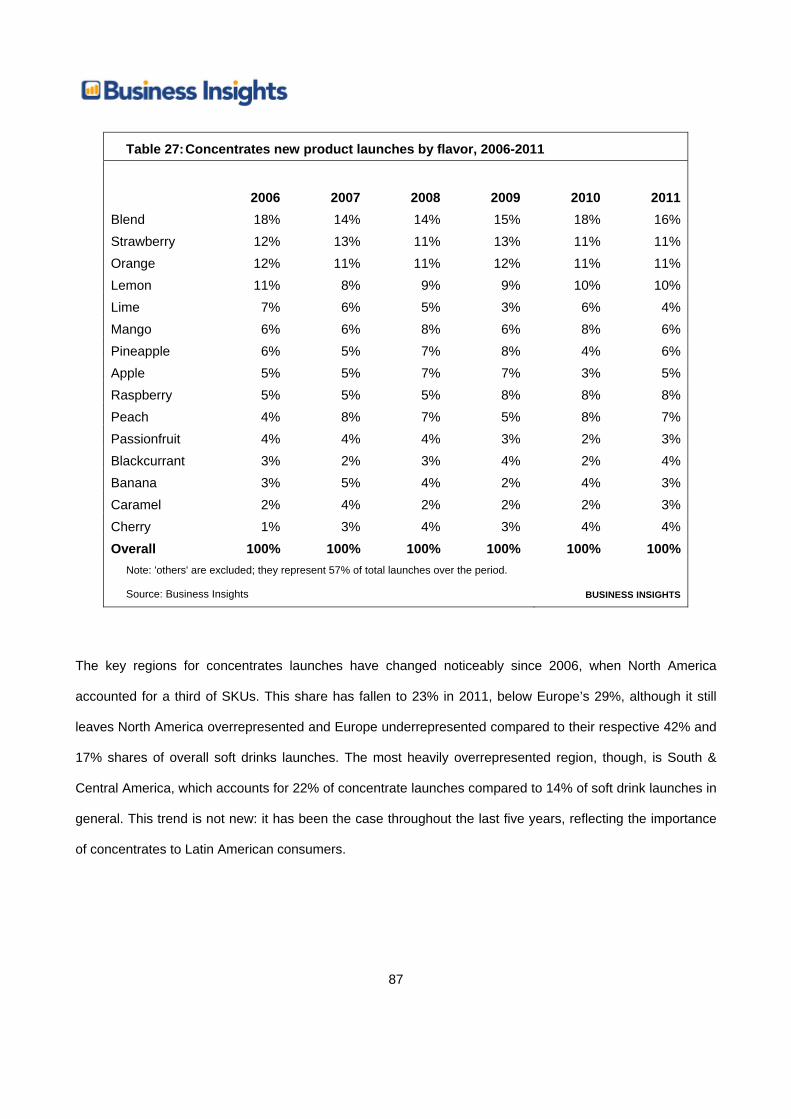
87
Table 27: Concentrates new product launches by flavor, 2006-2011
2006 2007 2008 2009 2010 2011Blend 18% 14% 14% 15% 18% 16%Strawberry 12% 13% 11% 13% 11% 11%Orange 12% 11% 11% 12% 11% 11%Lemon 11% 8% 9% 9% 10% 10%Lime 7% 6% 5% 3% 6% 4%Mango 6% 6% 8% 6% 8% 6%Pineapple 6% 5% 7% 8% 4% 6%Apple 5% 5% 7% 7% 3% 5%Raspberry 5% 5% 5% 8% 8% 8%Peach 4% 8% 7% 5% 8% 7%Passionfruit 4% 4% 4% 3% 2% 3%Blackcurrant 3% 2% 3% 4% 2% 4%Banana 3% 5% 4% 2% 4% 3%Caramel 2% 4% 2% 2% 2% 3%Cherry 1% 3% 4% 3% 4% 4%Overall 100% 100% 100% 100% 100% 100%
Note: 'others' are excluded; they represent 57% of total launches over the period.
Source: Business Insights BUSINESS INSIGHTS
The key regions for concentrates launches have changed noticeably since 2006, when North America
accounted for a third of SKUs. This share has fallen to 23% in 2011, below Europe’s 29%, although it still
leaves North America overrepresented and Europe underrepresented compared to their respective 42% and
17% shares of overall soft drinks launches. The most heavily overrepresented region, though, is South &
Central America, which accounts for 22% of concentrate launches compared to 14% of soft drink launches in
general. This trend is not new: it has been the case throughout the last five years, reflecting the importance
of concentrates to Latin American consumers.
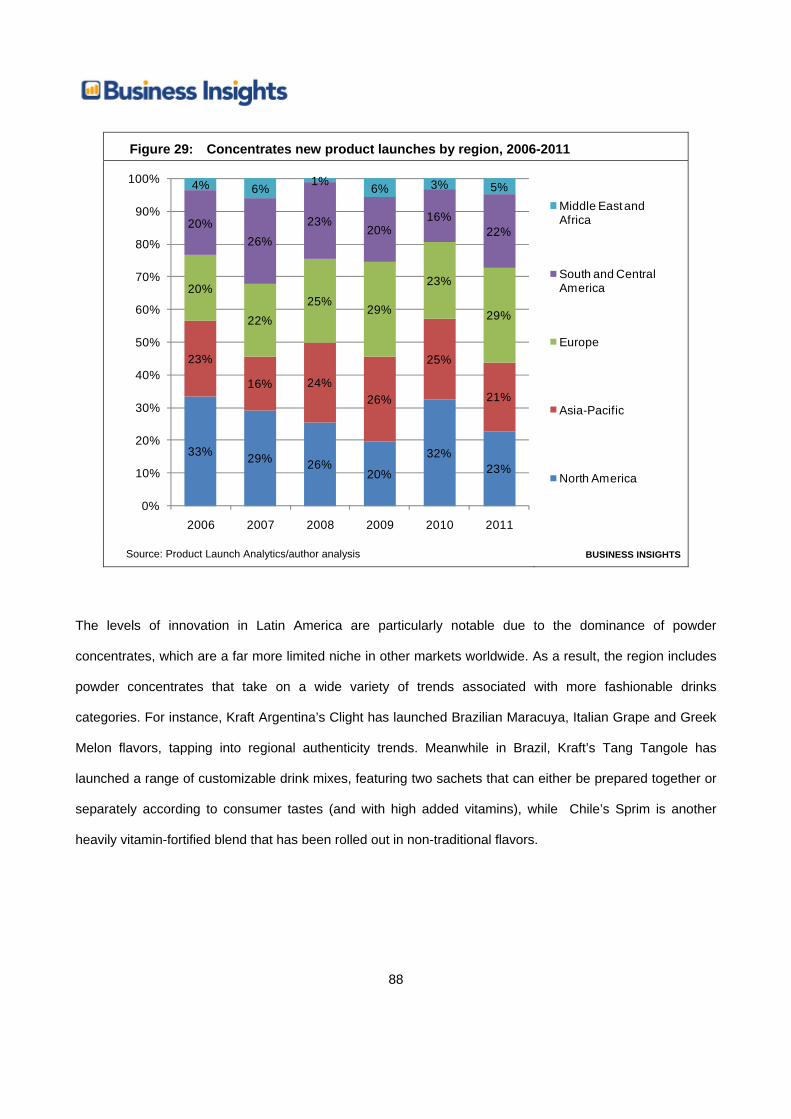
88
Figure 29: Concentrates new product launches by region, 2006-2011
33% 29% 26%20%
32%23%
23%
16% 24%26%
25%
21%
20%
22%25%
29%
23%
29%
20%26%
23%20%
16%22%
4% 6% 1% 6% 3% 5%
0%
10%
20%
30%
40%
50%
60%
70%
80%
90%
100%
2006 2007 2008 2009 2010 2011
Middle East and Africa
South and Central America
Europe
Asia-Pacific
North America
Source: Product Launch Analytics/author analysis BUSINESS INSIGHTS
The levels of innovation in Latin America are particularly notable due to the dominance of powder
concentrates, which are a far more limited niche in other markets worldwide. As a result, the region includes
powder concentrates that take on a wide variety of trends associated with more fashionable drinks
categories. For instance, Kraft Argentina’s Clight has launched Brazilian Maracuya, Italian Grape and Greek
Melon flavors, tapping into regional authenticity trends. Meanwhile in Brazil, Kraft’s Tang Tangole has
launched a range of customizable drink mixes, featuring two sachets that can either be prepared together or
separately according to consumer tastes (and with high added vitamins), while Chile’s Sprim is another
heavily vitamin-fortified blend that has been rolled out in non-traditional flavors.

89
Figure 30: Powder concentrates dominate in Latin America, including premium on-trend variants
Source: Product Launch Analytics BUSINESS INSIGHTS
Functional drinks
Although global volume sales of functional drinks are relatively low, the high price point and fast growth
enjoyed by the category has driven substantial NPD investment, with the category having been the second
largest behind juices for five of the last six years. The category was particularly important over the 2006-
2008 period, with functional drinks accounting for 22% of new soft drinks launches in 2008, although this
tailed off somewhat in 2009-2010 and fell as low as 12% in 2011, behind concentrates. This lack of
manufacturer focus reflects falling margins and slowing growth rates, as functional drinks penetration of key
audiences reaches saturation and attempts to expand into new consumer groups and regions meet with
mixed levels of success. It also reflects economic conditions, with companies less focused on high-priced
products amid slow or falling consumer spending in developed markets, while the hefty price tags of most
functional drinks remain out of mainstream consumers’ reach in emerging markets.
Not surprisingly, the most important group of product claims associated with functional drinks are positive
health claims – ‘high vitamins’, ‘high minerals’, ‘high calcium’, ‘high antioxidants’, ‘high protein’. Perhaps
more surprisingly, these accounted for 46% of claims in 2006 but have fallen to 37% in 2011. This fall has
largely been driven by the growth in free-from claims, which rose from 22% of the total in 2006 to 33% in

90
2011. This reflects the increased mainstream nature of the category. Originally, energy and sports drinks
were aimed at active athletes and people engaged in high-energy activities. However, they are now
increasingly being targeted at mass-market consumers attracted by their halo effect. Reportedly, Red Bull
introduced its diet variant after its founder Dietrich Mateschitz – a keen consumer of his own product –
became concerned about his own sugar intake given his relatively sedentary middle-aged lifestyle. With
conventional energy and sports drinks containing more sugar than standard carbonates, the roll-out of light
variants has been essential in the process of bringing the category into the mainstream. The word cloud in
Figure 31 highlights this process, with positive claims dominating the category in 2006 but with no single
dominant term by 2011.
Table 28: Functional drinks new product launches by product claim, 2006-2011
2006 2007 2008 2009 2010 2011High Vitamins 22% 20% 20% 18% 15% 17%Single Serving 13% 11% 12% 15% 13% 9%Natural 10% 10% 11% 9% 14% 15%High Minerals 8% 6% 6% 5% 7% 5%High Calcium 7% 5% 5% 5% 4% 4%Upscale 7% 6% 8% 4% 2% 0%Low Calories 5% 7% 7% 9% 7% 6%High Antioxidants 5% 5% 5% 6% 5% 6%No Preservatives 4% 5% 4% 4% 6% 9%High Protein 4% 4% 4% 5% 5% 5%No Sugar 4% 5% 8% 7% 5% 4%Low Sugar 4% 3% 2% 4% 2% 2%Organic 3% 5% 3% 3% 5% 6%No Artificial Flavor 2% 3% 2% 3% 4% 5%No Artificial Color 2% 3% 4% 4% 5% 7%Overall 100% 100% 100% 100% 100% 100%
Note: 'others' are excluded; they represent 44% of total launches over the period.
Source: Product Launch Analytics/author analysis BUSINESS INSIGHTS
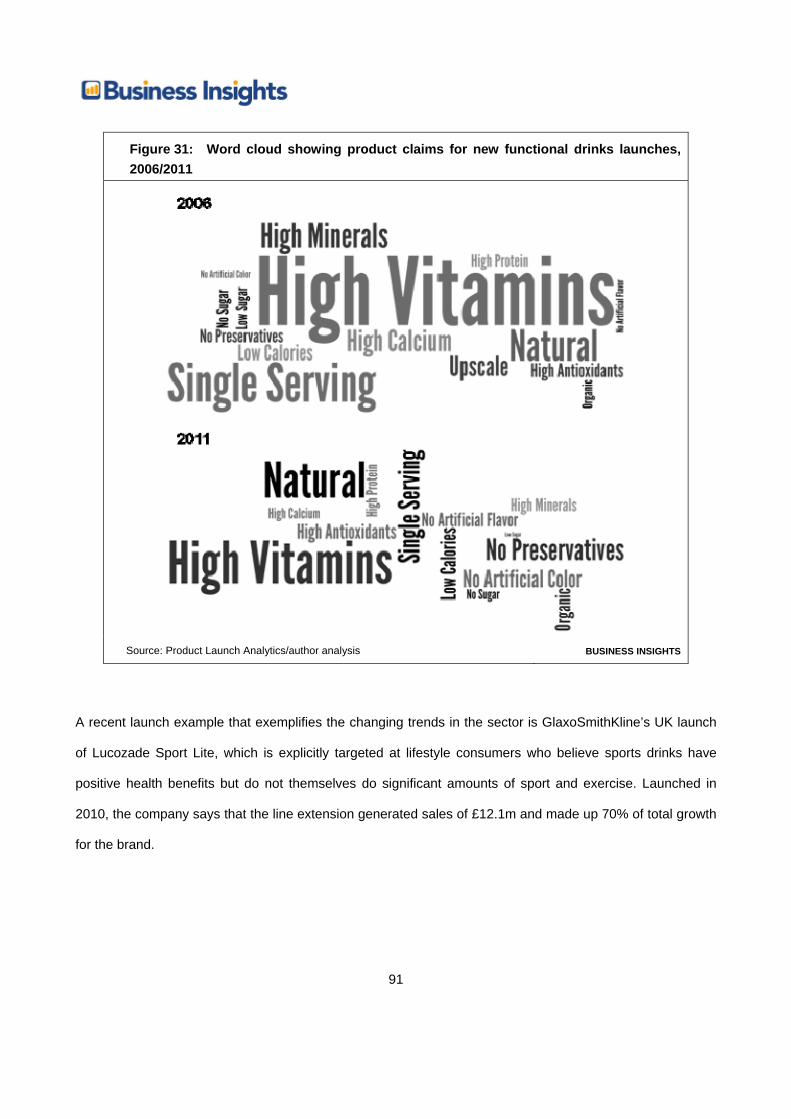
91
Figure 31: Word cloud showing product claims for new functional drinks launches, 2006/2011
Source: Product Launch Analytics/author analysis BUSINESS INSIGHTS
A recent launch example that exemplifies the changing trends in the sector is GlaxoSmithKline’s UK launch
of Lucozade Sport Lite, which is explicitly targeted at lifestyle consumers who believe sports drinks have
positive health benefits but do not themselves do significant amounts of sport and exercise. Launched in
2010, the company says that the line extension generated sales of £12.1m and made up 70% of total growth
for the brand.

92
Figure 32: Lucozade Sports Lite has a superficial sports positioning, but is primarily aimed at lifestyle users
Source: Product Launch Analytics BUSINESS INSIGHTS
The most important flavors for functional drinks have changed little between 2006 and 2011. Blends are
overwhelmingly the most popular, with orange and lemon in second and third place. Generic ‘fruit’ and ‘fruit
punch’ flavors make an appearance here, with 4% share between them, unlike most other categories –
similarly, generic ‘berry’ also has 4%. This reflects the fact that, although ‘natural’ now accounts for 15% of
product tags, this is still a category where most products do not trade on a primarily natural positioning. The
‘superfoods’ trend is changing this to some degree, as documented in Business Insights’ Growth
Opportunites in Sustainable and Positive Health Food and Drinks report, but at present most drinks in the
energy and sports category, and many in the nutraceuticals category, follow the heavily artificial flavor route
that characterizes market leaders such as Red Bull and Lucozade.

93
Table 29: Functional drinks new product launches by flavor, 2006-2011
2006 2007 2008 2009 2010 2011Blend 24% 25% 25% 24% 22% 26%Orange 12% 12% 13% 12% 12% 15%Lemon 12% 10% 11% 8% 12% 11%Apple 8% 6% 6% 6% 4% 6%Strawberry 7% 8% 7% 8% 9% 8%Lime 6% 5% 6% 5% 8% 5%Berry 6% 6% 6% 6% 6% 4%Peach 5% 4% 4% 4% 3% 5%Mango 5% 7% 5% 4% 6% 6%Grape 5% 6% 6% 7% 8% 4%Fruit 3% 2% 2% 3% 2% 3%Banana 3% 3% 2% 3% 2% 2%Fruit Punch 2% 2% 4% 6% 3% 1%Cherry 1% 2% 2% 3% 2% 3%Lemonade 1% 3% 1% 1% 1% 2%Overall 100% 100% 100% 100% 100% 100%
Note: 'others' are excluded; they represent 58% of total launches over the period.
Source: Product Launch Analytics/author analysis BUSINESS INSIGHTS
There has been a significant shift in the launch demographics of functional drinks in the last five years – and
perhaps unusually, the shift has been away from Asia and towards Europe and the US. In 2006, 33% of
launches took place in Asia-Pacific, compared with 21% in 2011. Meanwhile, Europe’s share has grown from
26% to 32%. This reflects Japan’s early lead in the functional drinks market, and its dominance of the
functional drinks space up until the 2000s; the shift away from Japan reflects other developed markets
catching up with Japanese levels of functional drinks innovation. Meanwhile, North America’s share has
fallen slightly from its 2006 level, from 31% to 29% - however, in 2009 and 2010, North America accounted
for more than 40% of launches. The major decline in 2011 has come as slowing growth and falling projected
volumes led US manufacturers to cut back on functional drinks NPD.
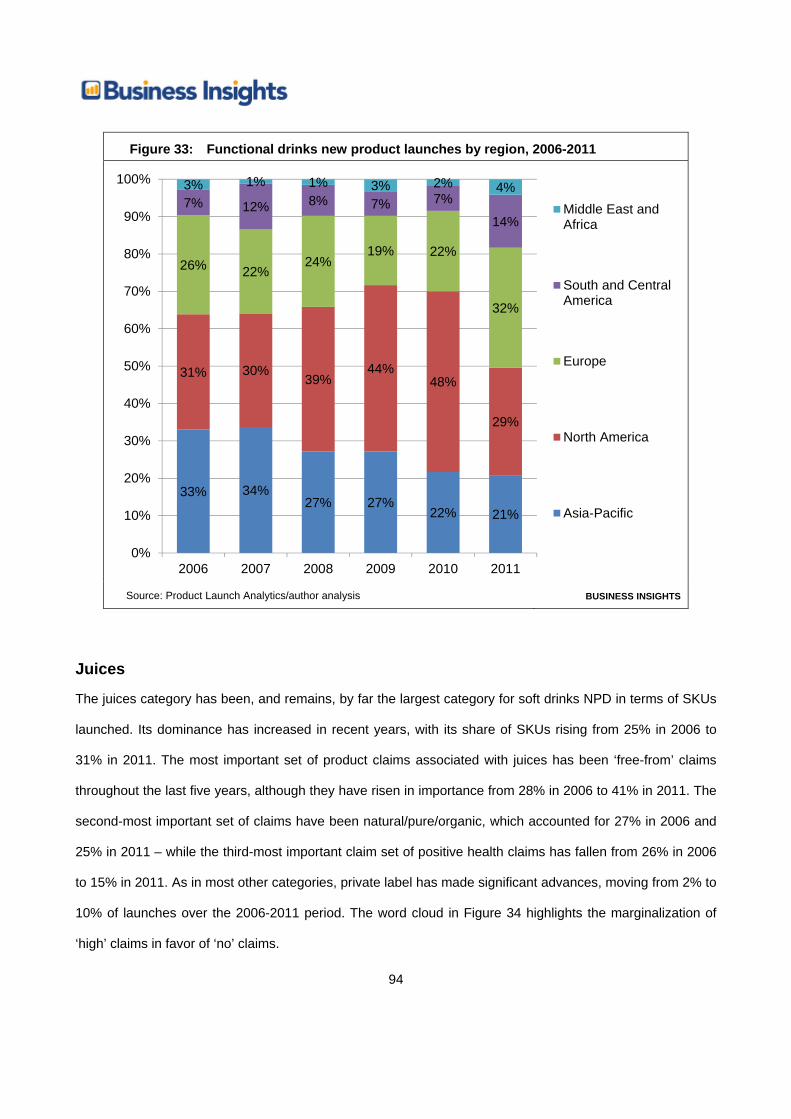
94
Figure 33: Functional drinks new product launches by region, 2006-2011
33% 34% 27% 27%
22% 21%
31% 30% 39%
44% 48%
29%
26% 22% 24%
19% 22%
32%
7% 12% 8% 7% 7%
14%
3% 1% 1% 3% 2% 4%
0%
10%
20%
30%
40%
50%
60%
70%
80%
90%
100%
2006 2007 2008 2009 2010 2011
Middle East andAfrica
South and CentralAmerica
Europe
North America
Asia-Pacific
Source: Product Launch Analytics/author analysis BUSINESS INSIGHTS
Juices
The juices category has been, and remains, by far the largest category for soft drinks NPD in terms of SKUs
launched. Its dominance has increased in recent years, with its share of SKUs rising from 25% in 2006 to
31% in 2011. The most important set of product claims associated with juices has been ‘free-from’ claims
throughout the last five years, although they have risen in importance from 28% in 2006 to 41% in 2011. The
second-most important set of claims have been natural/pure/organic, which accounted for 27% in 2006 and
25% in 2011 – while the third-most important claim set of positive health claims has fallen from 26% in 2006
to 15% in 2011. As in most other categories, private label has made significant advances, moving from 2% to
10% of launches over the 2006-2011 period. The word cloud in Figure 34 highlights the marginalization of
‘high’ claims in favor of ‘no’ claims.
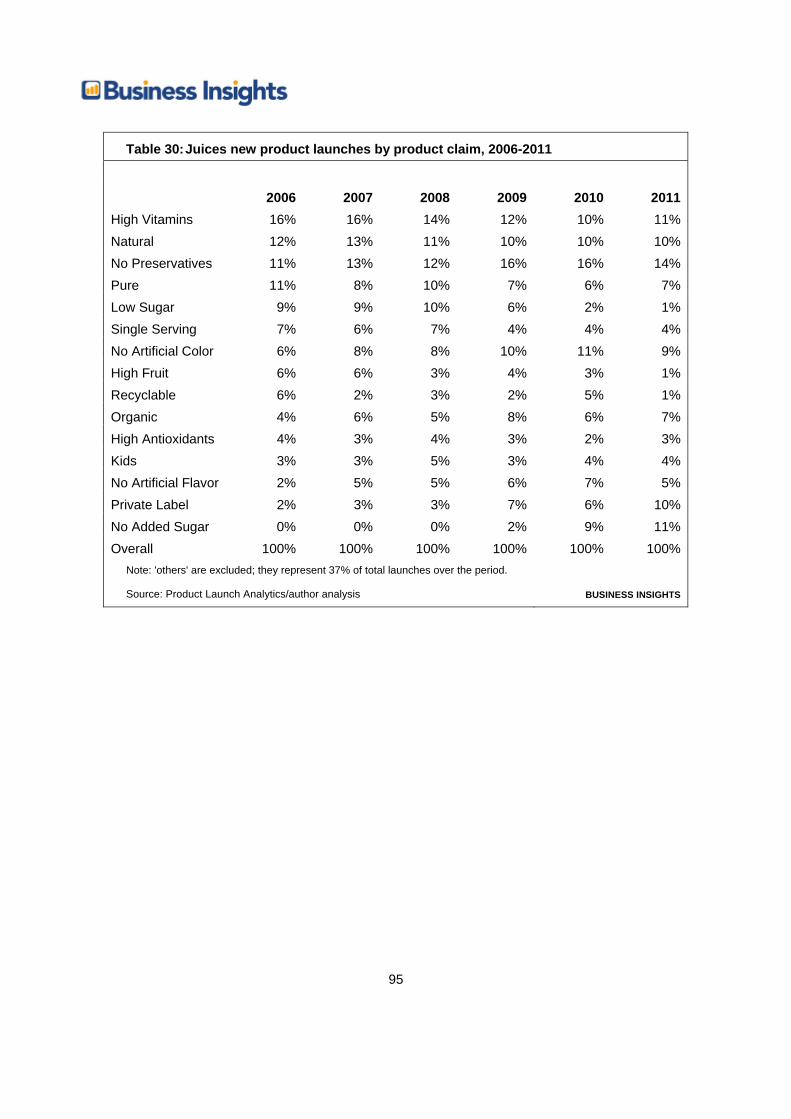
95
Table 30: Juices new product launches by product claim, 2006-2011
2006 2007 2008 2009 2010 2011High Vitamins 16% 16% 14% 12% 10% 11%Natural 12% 13% 11% 10% 10% 10%No Preservatives 11% 13% 12% 16% 16% 14%Pure 11% 8% 10% 7% 6% 7%Low Sugar 9% 9% 10% 6% 2% 1%Single Serving 7% 6% 7% 4% 4% 4%No Artificial Color 6% 8% 8% 10% 11% 9%High Fruit 6% 6% 3% 4% 3% 1%Recyclable 6% 2% 3% 2% 5% 1%Organic 4% 6% 5% 8% 6% 7%High Antioxidants 4% 3% 4% 3% 2% 3%Kids 3% 3% 5% 3% 4% 4%No Artificial Flavor 2% 5% 5% 6% 7% 5%Private Label 2% 3% 3% 7% 6% 10%No Added Sugar 0% 0% 0% 2% 9% 11%Overall 100% 100% 100% 100% 100% 100%
Note: 'others' are excluded; they represent 37% of total launches over the period.
Source: Product Launch Analytics/author analysis BUSINESS INSIGHTS

96
Figure 34: Word cloud showing product claims for new juices launches, 2006/2011
Source: Product Launch Analytics/author analysis BUSINESS INSIGHTS
Unsurprisingly, orange remains the most common single flavor for new fruit juices accounting for 15% of
launches, although it has been overtaken by blends since 2006. Overall, despite significant changes in
product positioning, there has been little change in flavors launched; apple remains in second place with
market share hovering around 15% throughout the period. Among exotic fruits, mango and pomegranate
have seen slight share rises to reach 10% and 5% respectively, but guava has fallen to 3%. Clearly, in the
juices market flavor changes are more significant than in many other soft drinks markets, as flavor is based
solely (for 100% juices) or significantly (for nectars on fruit drinks) on the actual fruit used rather than on the
balance of flavorings and sweeteners as for other categories.

97
Table 31: Juices new product launches by flavor, 2006-2011
2006 2007 2008 2009 2010 2011Orange 15% 14% 15% 15% 16% 15%Blend 14% 15% 17% 15% 16% 17%Apple 13% 14% 15% 16% 16% 15%Pineapple 9% 7% 6% 7% 7% 7%Peach 8% 8% 7% 8% 7% 6%Mango 8% 7% 8% 7% 8% 10%Grape 5% 6% 8% 5% 5% 6%Strawberry 5% 6% 4% 6% 6% 5%Guava 4% 3% 2% 3% 3% 3%Lemon 4% 2% 3% 4% 3% 4%Tomato 4% 3% 2% 2% 1% 2%Banana 4% 3% 4% 3% 3% 3%Carrot 3% 3% 3% 3% 2% 1%Apricot 3% 4% 2% 3% 2% 2%Pomegranate 3% 3% 4% 3% 4% 5%Overall 100% 100% 100% 100% 100% 100%
Note: 'others' are excluded; they represent 42% of total launches over the period.
Source: Product Launch Analytics/author analysis BUSINESS INSIGHTS
Europe has tended to dominate new juice launches, and in 2011 it accounted for 46% of all launches –
higher than its 42% share of soft drinks in general. Asia-Pacific has also been important throughout the time
period; although its share fell back in 2011 to 26% from 31% in 2010, this remains higher than the region’s
24% share of soft drinks in general. The most underrepresented region is North America, which accounted
for 10% of 2011 launches compared to 17% of soft drink launches in general. This is a significant and
sustained decline from the 2006 figure of 23%, reflecting the fact that juice volumes have been flat and
prices falling in the US market over the last five years. Conversely, Latin America’s share has risen from 7%
to 13% over the period, as juice markets (particularly nectar and fruit drinks) have grown in the region.
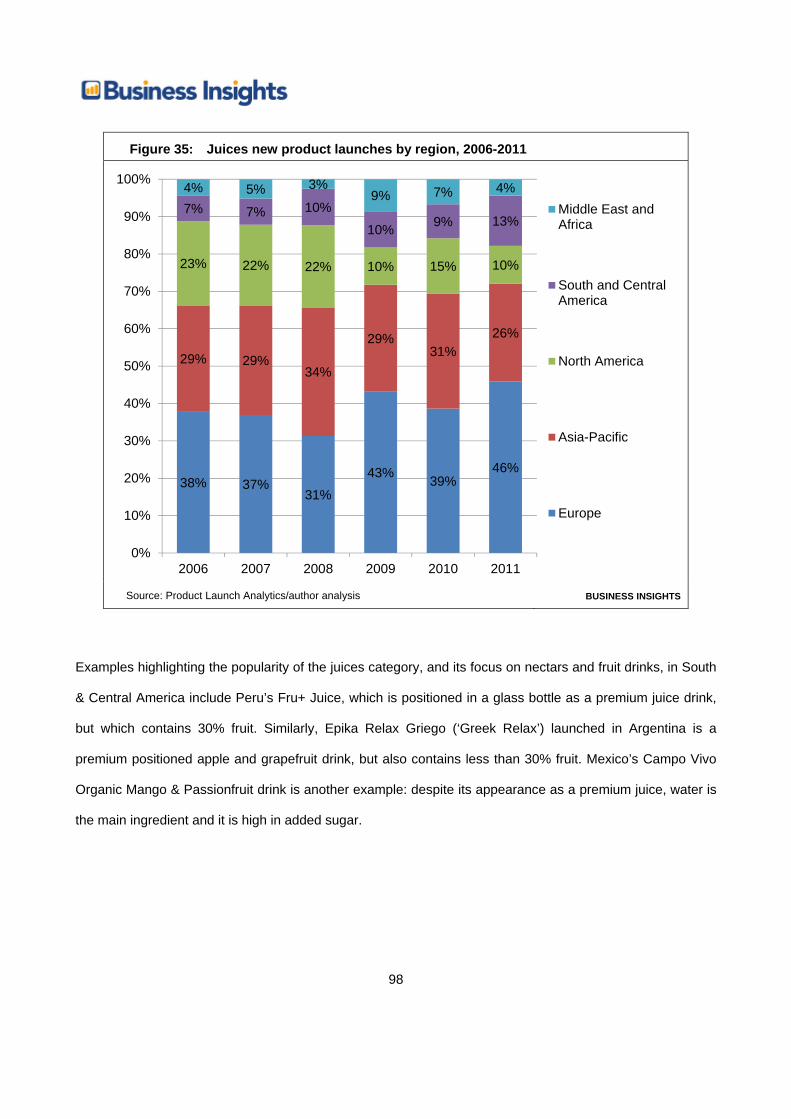
98
Figure 35: Juices new product launches by region, 2006-2011
38% 37% 31%
43% 39% 46%
29% 29% 34%
29% 31%
26%
23% 22% 22% 10% 15% 10%
7% 7% 10%
10% 9% 13%
4% 5% 3% 9% 7% 4%
0%
10%
20%
30%
40%
50%
60%
70%
80%
90%
100%
2006 2007 2008 2009 2010 2011
Middle East andAfrica
South and CentralAmerica
North America
Asia-Pacific
Europe
Source: Product Launch Analytics/author analysis BUSINESS INSIGHTS
Examples highlighting the popularity of the juices category, and its focus on nectars and fruit drinks, in South
& Central America include Peru’s Fru+ Juice, which is positioned in a glass bottle as a premium juice drink,
but which contains 30% fruit. Similarly, Epika Relax Griego (‘Greek Relax’) launched in Argentina is a
premium positioned apple and grapefruit drink, but also contains less than 30% fruit. Mexico’s Campo Vivo
Organic Mango & Passionfruit drink is another example: despite its appearance as a premium juice, water is
the main ingredient and it is high in added sugar.
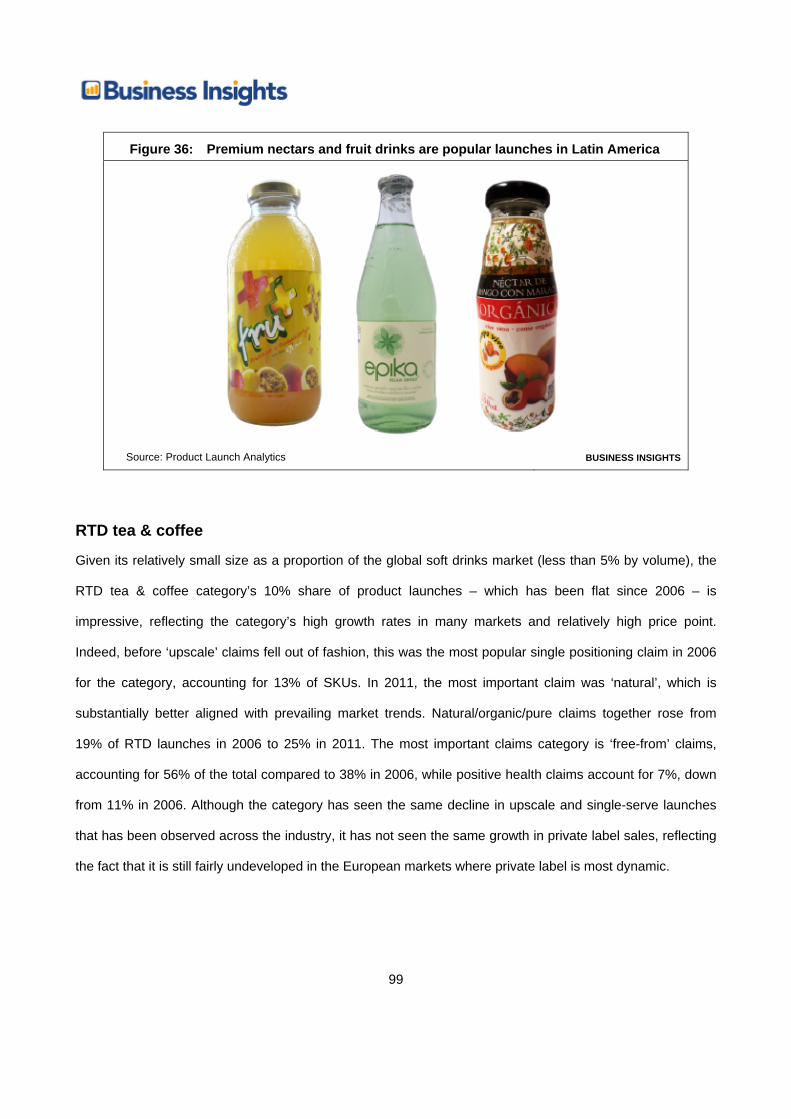
99
Figure 36: Premium nectars and fruit drinks are popular launches in Latin America
Source: Product Launch Analytics BUSINESS INSIGHTS
RTD tea & coffee
Given its relatively small size as a proportion of the global soft drinks market (less than 5% by volume), the
RTD tea & coffee category’s 10% share of product launches – which has been flat since 2006 – is
impressive, reflecting the category’s high growth rates in many markets and relatively high price point.
Indeed, before ‘upscale’ claims fell out of fashion, this was the most popular single positioning claim in 2006
for the category, accounting for 13% of SKUs. In 2011, the most important claim was ‘natural’, which is
substantially better aligned with prevailing market trends. Natural/organic/pure claims together rose from
19% of RTD launches in 2006 to 25% in 2011. The most important claims category is ‘free-from’ claims,
accounting for 56% of the total compared to 38% in 2006, while positive health claims account for 7%, down
from 11% in 2006. Although the category has seen the same decline in upscale and single-serve launches
that has been observed across the industry, it has not seen the same growth in private label sales, reflecting
the fact that it is still fairly undeveloped in the European markets where private label is most dynamic.

100
Table 32: RTD tea & coffee new product launches by product claim, 2006-2011
2006 2007 2008 2009 2010 2011Upscale 13% 8% 9% 6% 4% 1%Single Serving 13% 11% 9% 9% 11% 5%Natural 10% 12% 12% 14% 13% 17%Low Calories 8% 7% 7% 10% 8% 6%Recyclable 7% 3% 4% 2% 5% 6%Low Sugar 6% 6% 4% 6% 4% 3%High Antioxidants 6% 8% 9% 9% 5% 6%Pure 6% 6% 4% 5% 2% 1%No Artificial Color 6% 7% 5% 6% 9% 13%No Sugar 5% 3% 6% 6% 7% 9%High Vitamins 5% 7% 5% 5% 3% 1%No Calories 5% 5% 6% 3% 5% 5%No Preservatives 4% 6% 7% 9% 11% 13%Organic 3% 5% 9% 7% 7% 8%No Artificial Flavor 3% 7% 5% 4% 6% 7%Overall 100% 100% 100% 100% 100% 100%
Note: 'others' are excluded; they represent 41% of total launches over the period.
Source: Product Launch Analytics/author analysis BUSINESS INSIGHTS
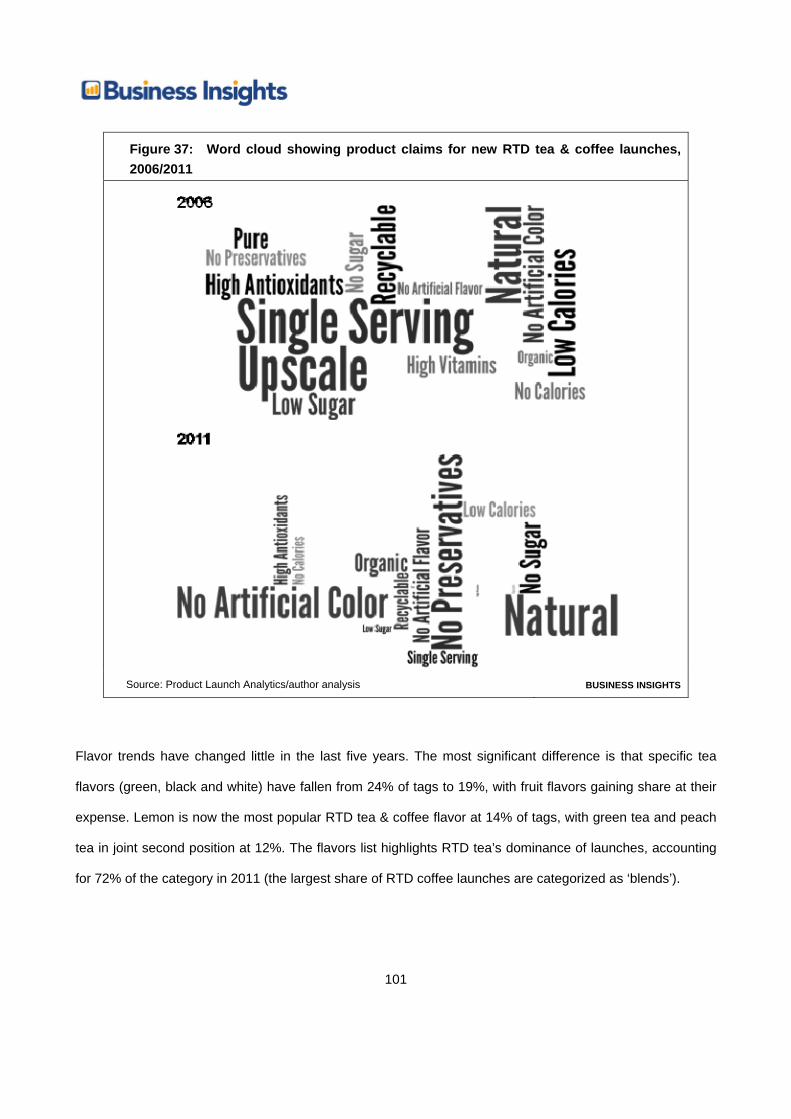
101
Figure 37: Word cloud showing product claims for new RTD tea & coffee launches, 2006/2011
Source: Product Launch Analytics/author analysis BUSINESS INSIGHTS
Flavor trends have changed little in the last five years. The most significant difference is that specific tea
flavors (green, black and white) have fallen from 24% of tags to 19%, with fruit flavors gaining share at their
expense. Lemon is now the most popular RTD tea & coffee flavor at 14% of tags, with green tea and peach
tea in joint second position at 12%. The flavors list highlights RTD tea’s dominance of launches, accounting
for 72% of the category in 2011 (the largest share of RTD coffee launches are categorized as ‘blends’).
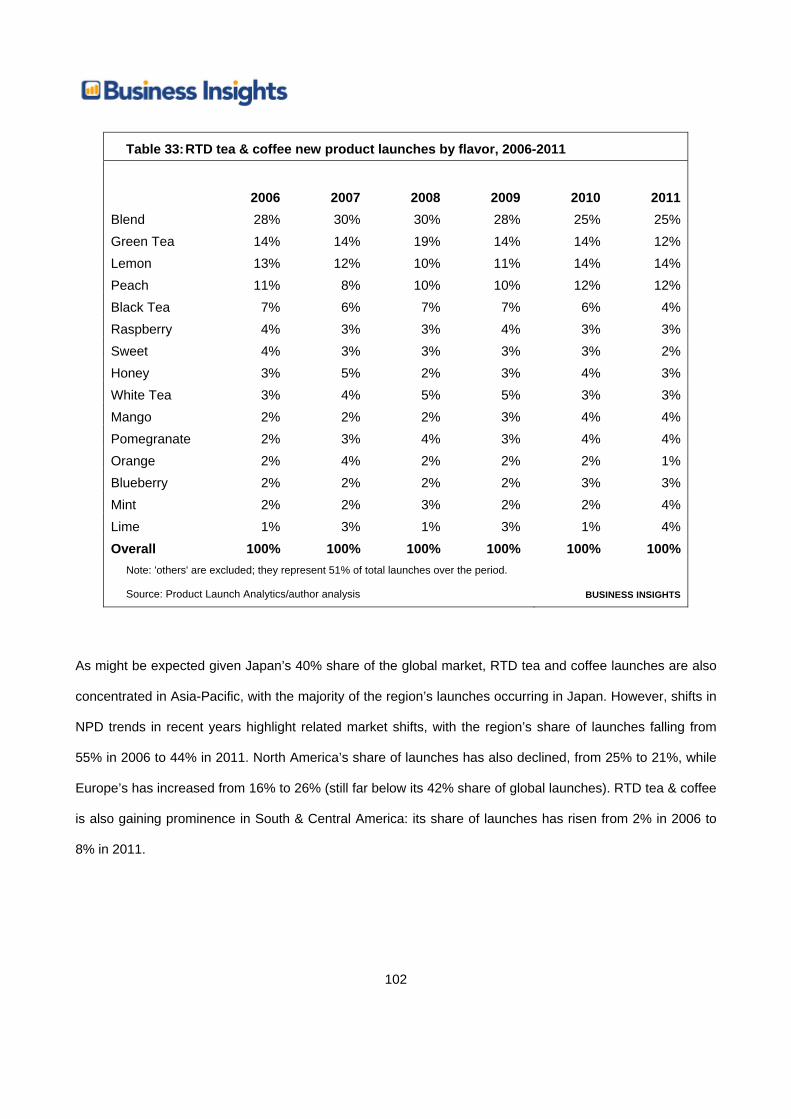
102
Table 33: RTD tea & coffee new product launches by flavor, 2006-2011
2006 2007 2008 2009 2010 2011Blend 28% 30% 30% 28% 25% 25%Green Tea 14% 14% 19% 14% 14% 12%Lemon 13% 12% 10% 11% 14% 14%Peach 11% 8% 10% 10% 12% 12%Black Tea 7% 6% 7% 7% 6% 4%Raspberry 4% 3% 3% 4% 3% 3%Sweet 4% 3% 3% 3% 3% 2%Honey 3% 5% 2% 3% 4% 3%White Tea 3% 4% 5% 5% 3% 3%Mango 2% 2% 2% 3% 4% 4%Pomegranate 2% 3% 4% 3% 4% 4%Orange 2% 4% 2% 2% 2% 1%Blueberry 2% 2% 2% 2% 3% 3%Mint 2% 2% 3% 2% 2% 4%Lime 1% 3% 1% 3% 1% 4%Overall 100% 100% 100% 100% 100% 100%
Note: 'others' are excluded; they represent 51% of total launches over the period.
Source: Product Launch Analytics/author analysis BUSINESS INSIGHTS
As might be expected given Japan’s 40% share of the global market, RTD tea and coffee launches are also
concentrated in Asia-Pacific, with the majority of the region’s launches occurring in Japan. However, shifts in
NPD trends in recent years highlight related market shifts, with the region’s share of launches falling from
55% in 2006 to 44% in 2011. North America’s share of launches has also declined, from 25% to 21%, while
Europe’s has increased from 16% to 26% (still far below its 42% share of global launches). RTD tea & coffee
is also gaining prominence in South & Central America: its share of launches has risen from 2% in 2006 to
8% in 2011.
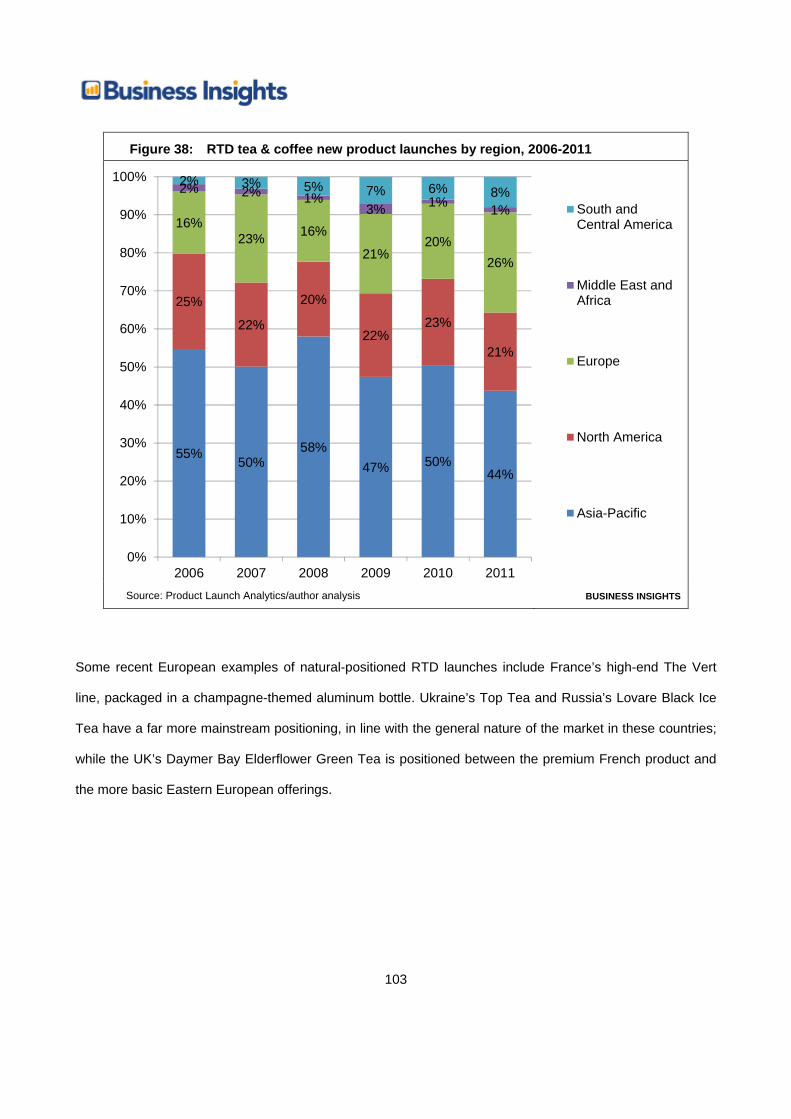
103
Figure 38: RTD tea & coffee new product launches by region, 2006-2011
55% 50% 58%
47% 50% 44%
25%
22%
20%
22% 23%
21%
16% 23% 16%
21% 20%
26%
2% 2% 1% 3% 1% 1%
2% 3% 5% 7% 6% 8%
0%
10%
20%
30%
40%
50%
60%
70%
80%
90%
100%
2006 2007 2008 2009 2010 2011
South andCentral America
Middle East andAfrica
Europe
North America
Asia-Pacific
Source: Product Launch Analytics/author analysis BUSINESS INSIGHTS
Some recent European examples of natural-positioned RTD launches include France’s high-end The Vert
line, packaged in a champagne-themed aluminum bottle. Ukraine’s Top Tea and Russia’s Lovare Black Ice
Tea have a far more mainstream positioning, in line with the general nature of the market in these countries;
while the UK’s Daymer Bay Elderflower Green Tea is positioned between the premium French product and
the more basic Eastern European offerings.
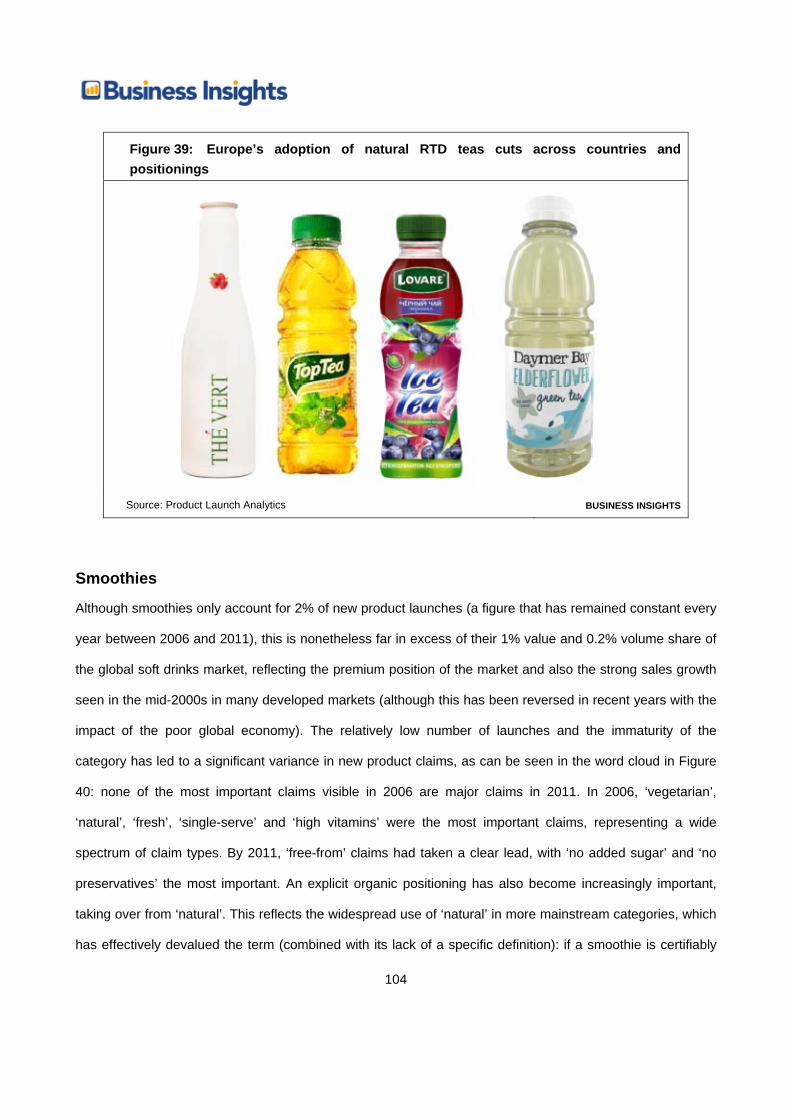
104
Figure 39: Europe’s adoption of natural RTD teas cuts across countries and positionings
Source: Product Launch Analytics BUSINESS INSIGHTS
Smoothies
Although smoothies only account for 2% of new product launches (a figure that has remained constant every
year between 2006 and 2011), this is nonetheless far in excess of their 1% value and 0.2% volume share of
the global soft drinks market, reflecting the premium position of the market and also the strong sales growth
seen in the mid-2000s in many developed markets (although this has been reversed in recent years with the
impact of the poor global economy). The relatively low number of launches and the immaturity of the
category has led to a significant variance in new product claims, as can be seen in the word cloud in Figure
40: none of the most important claims visible in 2006 are major claims in 2011. In 2006, ‘vegetarian’,
‘natural’, ‘fresh’, ‘single-serve’ and ‘high vitamins’ were the most important claims, representing a wide
spectrum of claim types. By 2011, ‘free-from’ claims had taken a clear lead, with ‘no added sugar’ and ‘no
preservatives’ the most important. An explicit organic positioning has also become increasingly important,
taking over from ‘natural’. This reflects the widespread use of ‘natural’ in more mainstream categories, which
has effectively devalued the term (combined with its lack of a specific definition): if a smoothie is certifiably
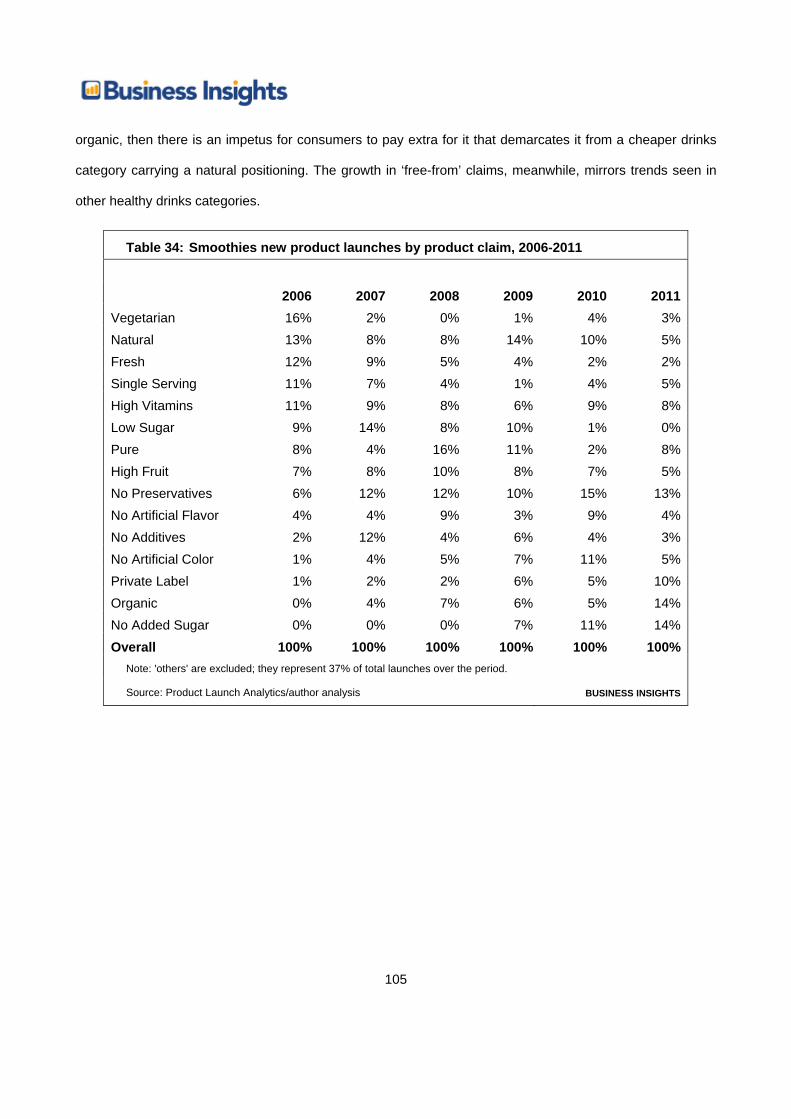
105
organic, then there is an impetus for consumers to pay extra for it that demarcates it from a cheaper drinks
category carrying a natural positioning. The growth in ‘free-from’ claims, meanwhile, mirrors trends seen in
other healthy drinks categories.
Table 34: Smoothies new product launches by product claim, 2006-2011
2006 2007 2008 2009 2010 2011Vegetarian 16% 2% 0% 1% 4% 3%Natural 13% 8% 8% 14% 10% 5%Fresh 12% 9% 5% 4% 2% 2%Single Serving 11% 7% 4% 1% 4% 5%High Vitamins 11% 9% 8% 6% 9% 8%Low Sugar 9% 14% 8% 10% 1% 0%Pure 8% 4% 16% 11% 2% 8%High Fruit 7% 8% 10% 8% 7% 5%No Preservatives 6% 12% 12% 10% 15% 13%No Artificial Flavor 4% 4% 9% 3% 9% 4%No Additives 2% 12% 4% 6% 4% 3%No Artificial Color 1% 4% 5% 7% 11% 5%Private Label 1% 2% 2% 6% 5% 10%Organic 0% 4% 7% 6% 5% 14%No Added Sugar 0% 0% 0% 7% 11% 14%Overall 100% 100% 100% 100% 100% 100%
Note: 'others' are excluded; they represent 37% of total launches over the period.
Source: Product Launch Analytics/author analysis BUSINESS INSIGHTS
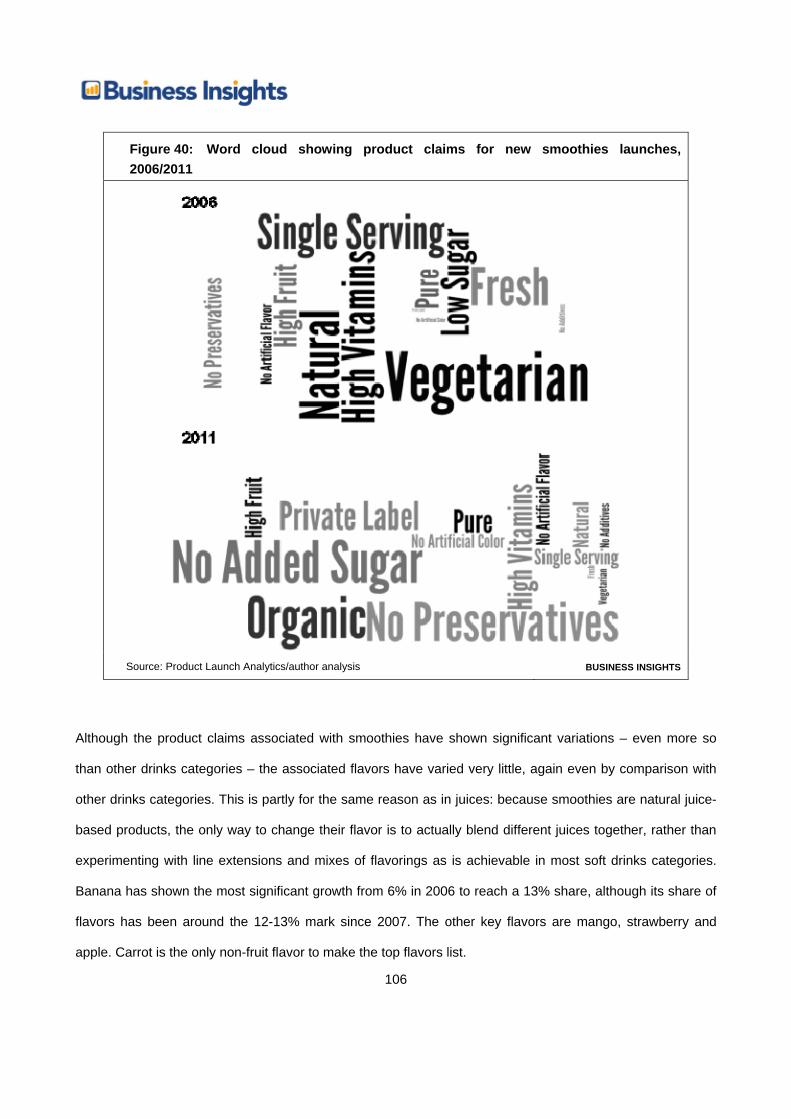
106
Figure 40: Word cloud showing product claims for new smoothies launches, 2006/2011
Source: Product Launch Analytics/author analysis BUSINESS INSIGHTS
Although the product claims associated with smoothies have shown significant variations – even more so
than other drinks categories – the associated flavors have varied very little, again even by comparison with
other drinks categories. This is partly for the same reason as in juices: because smoothies are natural juice-
based products, the only way to change their flavor is to actually blend different juices together, rather than
experimenting with line extensions and mixes of flavorings as is achievable in most soft drinks categories.
Banana has shown the most significant growth from 6% in 2006 to reach a 13% share, although its share of
flavors has been around the 12-13% mark since 2007. The other key flavors are mango, strawberry and
apple. Carrot is the only non-fruit flavor to make the top flavors list.

107
Table 35: Smoothies new product launches by flavor, 2006-2011
2006 2007 2008 2009 2010 2011Blend 19% 14% 18% 16% 20% 19%Mango 13% 14% 13% 13% 13% 12%Pineapple 10% 6% 7% 5% 7% 5%Orange 9% 7% 6% 9% 5% 4%Apple 9% 8% 6% 5% 7% 8%Berry 7% 2% 2% 1% 2% 1%Banana 6% 12% 13% 13% 12% 13%Passionfruit 6% 6% 9% 5% 6% 5%Strawberry 4% 10% 9% 10% 10% 12%Blueberry 4% 5% 4% 4% 4% 5%Carrot 4% 2% 1% 3% 1% 1%Guava 4% 0% 1% 4% 2% 1%Peach 3% 5% 3% 3% 4% 6%Raspberry 2% 9% 8% 6% 6% 6%Apricot 1% 0% 0% 3% 1% 1%Overall 100% 100% 100% 100% 100% 100%
Note: 'others' are excluded; they represent 30% of total launches over the period.
Source: Product Launch Analytics/author analysis BUSINESS INSIGHTS
Strawberry is a popular flavor even for more innovative and mixed products. For example, in the US, the
Bolthouse Farms Protein Plus Parfait Smoothie offers “the fresh taste of strawberries with toasted granola
and creamy yogurt”, made with a whey and soy protein blend to provide protein-enhanced benefits. Even in
a relatively novel category such as smoothies, launching an innovative product with a fairly unusual profile
and protein enhancement, manufacturers seek to appeal to consumer conservatism by sticking to market-
leading flavors.
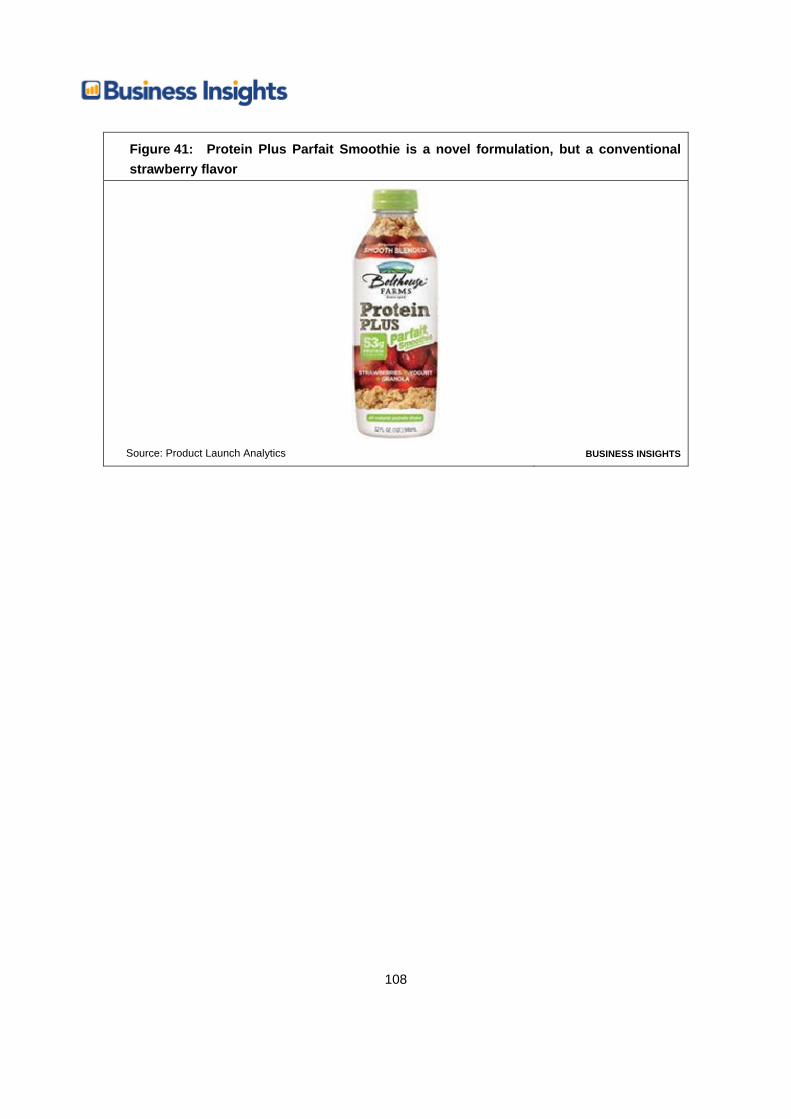
108
Figure 41: Protein Plus Parfait Smoothie is a novel formulation, but a conventional strawberry flavor
Source: Product Launch Analytics BUSINESS INSIGHTS
109
Chapter 4 Consumer trends driving innovation
Summary The recessionary behaviors that consumers exhibited in 2009-10 during what appeared to be a
temporary downturn now appear likely to continue to impact on the drinks industry up to the 2015
horizon of this report. The growth in product launches of private label brands, and the decline in
upscale product positioning, are directly related to the global economic situation.
Mass customization, defined as the supply of custom goods in high volumes and at low cost, is a good
way of enhancing brand-consumer relationships, heading off the private label threat, adding greater
perceived value and allowing drinks companies to engage with their consumers more effectively.
Many of the principles required to prosper in recessionary economies can also be applied to staying
ahead in emerging economies. However, although incomes are low, the trend away from conspicuous
consumption is not something that links recessionary and emerging economies.
Although the boom in dedicated functional drinks that characterized the 2000s is no longer such a
major force in the soft drinks market, with over 65s expected to outnumber five to 14 year olds for the
first time in the US by 2014, aging baby boomers with a continued desire to remain young and active,
will be crucial drivers of preventative medicine including healthy drinks.
Several key consumer trends continue to drive interest in sustainable drinks: the importance of health,
as people seek to consume food that is produced non-intensively; media attention as publicity over
climate change and food sustainability drives awareness; the growth of natural & fresh product claims;
the desire to trade up for small indulgences; consumer ethics; and concerns over carbon footprint.
Convenience remains as important to consumers’ lives as it was before the world environment
changed. People who are employed continue to work long hours with long commutes at the beginning
and end; the pressure on working parents remains as strong as ever; and the need – whether real or
imagined – to fit as many hours as possible into the day remains.
110
Introduction In order to target innovation efforts accurately within the soft drinks market, it is more important than ever to
ensure that, as well as targeting appropriate market and geographical segments for growth, new products
are fully in line with important consumer trends. Based on primary and secondary research, previous
Business Insights publications and our own insight, we have identified key consumer trends within the global
soft drinks markets that it is important for new product launches to target if they are to connect with
consumers and drive successful innovation strategies.
Austerity will drive closer connections with consumers In the aftermath of the 2008 global financial crisis and the resulting impact on credit availability and
employment levels, consumer confidence across nearly all developed markets, irrespective of whether or not
they were directly impacted by recession at that time. The market uncertainty prevalent at the time of writing
this report in late 2011, dubbed ‘GFC II’ by some commentators, is having a similar effect. Many economists
are predicting ‘double-dip’ recessions in the US and the UK, while the situation in mainland Europe regarding
the way of dealing with debt crises in Portugal, Italy, Greece and Spain remains highly unclear, potentially
impacting on the French and German economies to a significant extent.
While it is possible that the worst outcomes currently being predicted may be averted, the plan of
‘expansionary austerity’ adopted by many governments worldwide appears to be – at best – leading to a
slow and painful recovery, with consumer disposable incomes below 2000s levels even in countries that are
showing GDP growth. As a result, the behaviors that consumers exhibited in 2009-10 when these events
were believed to be a temporary recession are, in fact, likely to continue to impact on the drinks industry for
some time – quite possibly up to the 2015 horizon of this report. Rather than returning to mass-market
brands and adopting conspicuous consumption behavior, the recessionary pattern of opting for low-cost
options in cases where there is not significant emotional involvement with either the product or the brand is
likely to continue indefinitely. Manufacturers in the developed world will need to adopt strategies that help
111
them to benefit from these trends. Some of these strategies will also be useful for targeting developing-world
consumers.
Growth of private label and value brands
This report’s Chapter 3 highlights the significant growth that has been seen in product launches across
almost all soft drinks categories of private label brands, and the decline in upscale product positioning. These
trends are directly related, and have been driven more or less directly by the global economic situation. In
some markets such as Germany and Switzerland, private label had been long established as a quality
product at stores such as Aldi and Migros. In others such as the UK it showed significant growth in the
2000s, as leading supermarkets such as Tesco used their close relationship with consumers and their data
to drive innovations that were previous in the domain of major branded manufacturers. But it has only been
in the era after the global financial crisis in which this trend has gone fully global, with private label products
showing substantial growth among recessionary consumers.
The traditional way for manufacturers to rise to this challenge is to offer larger packs, multi-buy offers,
competitions, free gifts and coupons, defending market share from private label rivals. Clearly, however, this
erodes margins and involves fighting private label and value brands on their own low-price territory. Rather,
brands need to use a combination of rational and emotional appeal to attract and retain customers –
promoting practical benefits (health, convenience), while also highlighting intangible status benefits
associated with the brand, the latter of which will chiefly be done through marketing campaigns that build on
and reinforce existing brand loyalty. At the same time, although consumers are keen to save money, there
are ways in which brands can do this that do not solely involve deep discounting, which are generally based
around innovation efforts: increased usage and minimizing wastage (e.g. better optimizing bottle sizes to
preferred consumption, creating products with longer lifespans). In general, finding out exactly what a drinks
brand means to consumers, how that perception can be enhanced, and developing products that will help
maintain the relationship by providing consumers with what they feel they want from the brand is the best
way to use NPD to retain loyalty.
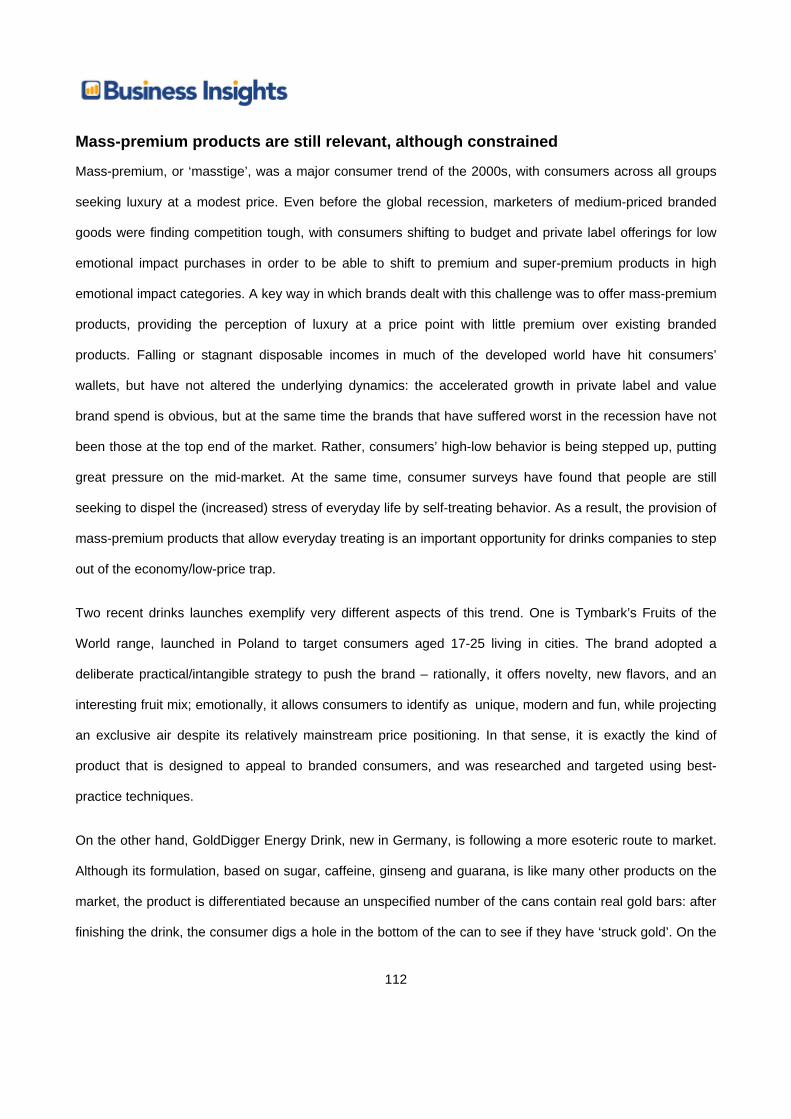
112
Mass-premium products are still relevant, although constrained
Mass-premium, or ‘masstige’, was a major consumer trend of the 2000s, with consumers across all groups
seeking luxury at a modest price. Even before the global recession, marketers of medium-priced branded
goods were finding competition tough, with consumers shifting to budget and private label offerings for low
emotional impact purchases in order to be able to shift to premium and super-premium products in high
emotional impact categories. A key way in which brands dealt with this challenge was to offer mass-premium
products, providing the perception of luxury at a price point with little premium over existing branded
products. Falling or stagnant disposable incomes in much of the developed world have hit consumers’
wallets, but have not altered the underlying dynamics: the accelerated growth in private label and value
brand spend is obvious, but at the same time the brands that have suffered worst in the recession have not
been those at the top end of the market. Rather, consumers’ high-low behavior is being stepped up, putting
great pressure on the mid-market. At the same time, consumer surveys have found that people are still
seeking to dispel the (increased) stress of everyday life by self-treating behavior. As a result, the provision of
mass-premium products that allow everyday treating is an important opportunity for drinks companies to step
out of the economy/low-price trap.
Two recent drinks launches exemplify very different aspects of this trend. One is Tymbark’s Fruits of the
World range, launched in Poland to target consumers aged 17-25 living in cities. The brand adopted a
deliberate practical/intangible strategy to push the brand – rationally, it offers novelty, new flavors, and an
interesting fruit mix; emotionally, it allows consumers to identify as unique, modern and fun, while projecting
an exclusive air despite its relatively mainstream price positioning. In that sense, it is exactly the kind of
product that is designed to appeal to branded consumers, and was researched and targeted using best-
practice techniques.
On the other hand, GoldDigger Energy Drink, new in Germany, is following a more esoteric route to market.
Although its formulation, based on sugar, caffeine, ginseng and guarana, is like many other products on the
market, the product is differentiated because an unspecified number of the cans contain real gold bars: after
finishing the drink, the consumer digs a hole in the bottom of the can to see if they have ‘struck gold’. On the
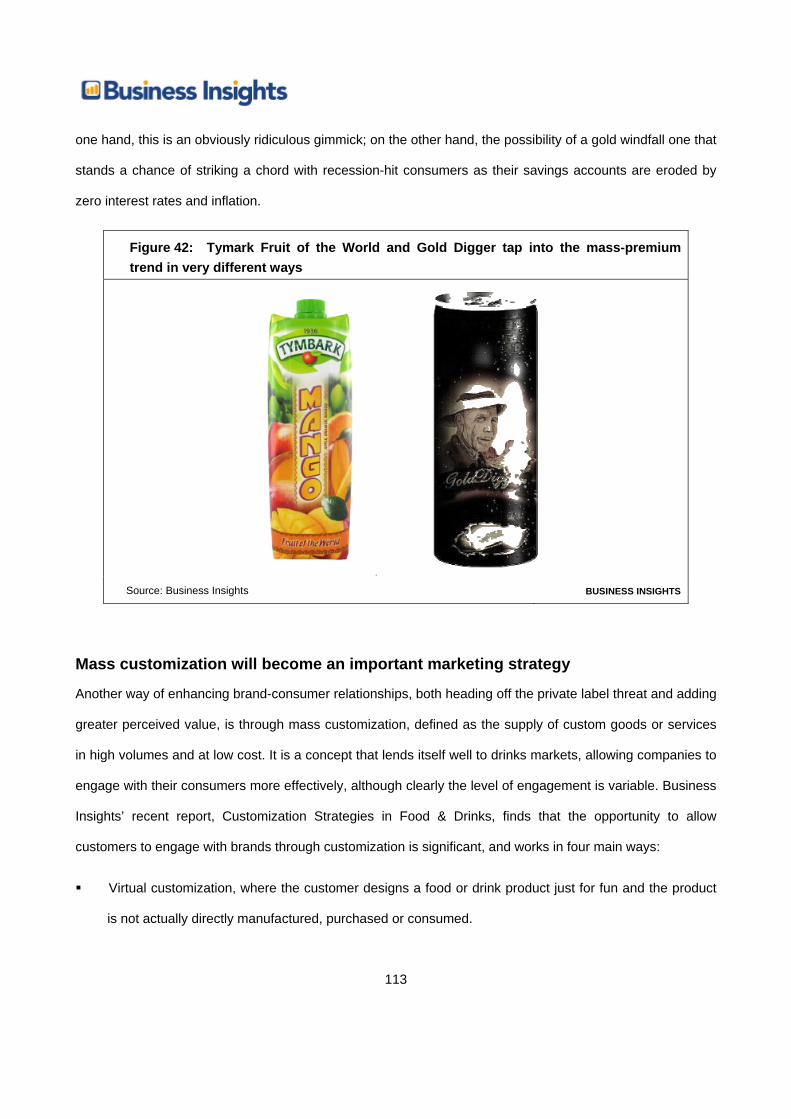
113
one hand, this is an obviously ridiculous gimmick; on the other hand, the possibility of a gold windfall one that
stands a chance of striking a chord with recession-hit consumers as their savings accounts are eroded by
zero interest rates and inflation.
Figure 42: Tymark Fruit of the World and Gold Digger tap into the mass-premium trend in very different ways
Source: Business Insights BUSINESS INSIGHTS
Mass customization will become an important marketing strategy
Another way of enhancing brand-consumer relationships, both heading off the private label threat and adding
greater perceived value, is through mass customization, defined as the supply of custom goods or services
in high volumes and at low cost. It is a concept that lends itself well to drinks markets, allowing companies to
engage with their consumers more effectively, although clearly the level of engagement is variable. Business
Insights’ recent report, Customization Strategies in Food & Drinks, finds that the opportunity to allow
customers to engage with brands through customization is significant, and works in four main ways:
Virtual customization, where the customer designs a food or drink product just for fun and the product
is not actually directly manufactured, purchased or consumed.
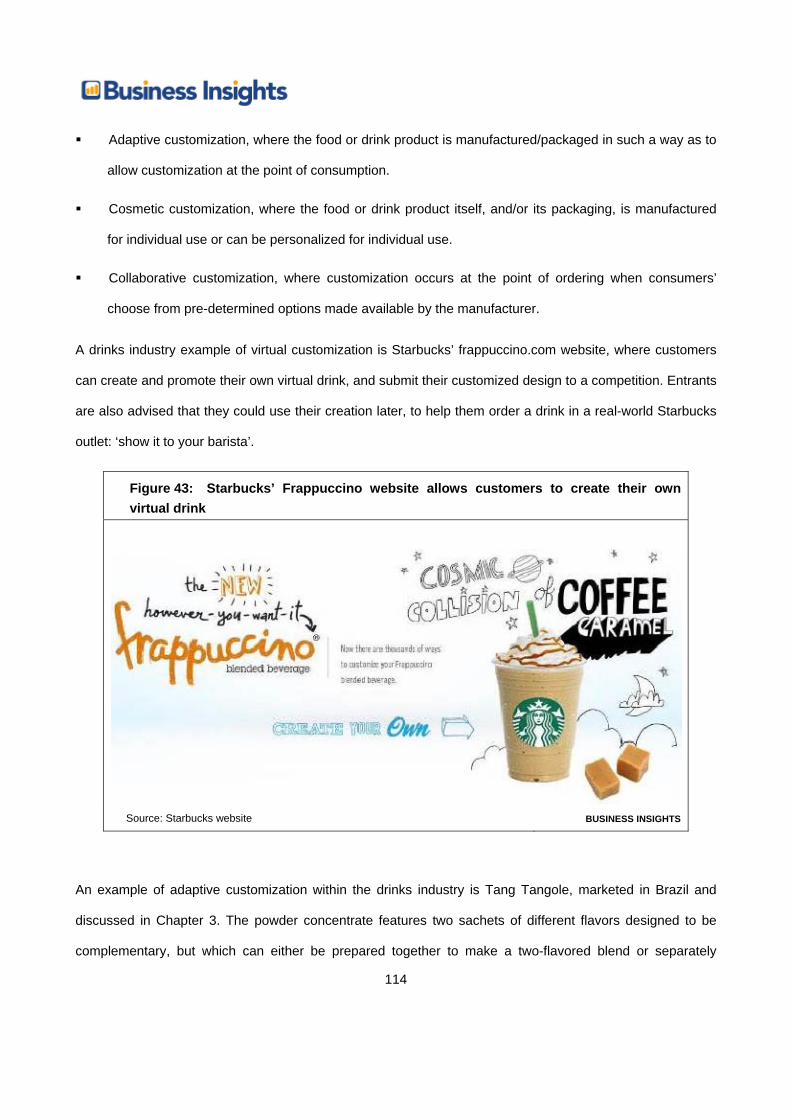
114
Adaptive customization, where the food or drink product is manufactured/packaged in such a way as to
allow customization at the point of consumption.
Cosmetic customization, where the food or drink product itself, and/or its packaging, is manufactured
for individual use or can be personalized for individual use.
Collaborative customization, where customization occurs at the point of ordering when consumers’
choose from pre-determined options made available by the manufacturer.
A drinks industry example of virtual customization is Starbucks’ frappuccino.com website, where customers
can create and promote their own virtual drink, and submit their customized design to a competition. Entrants
are also advised that they could use their creation later, to help them order a drink in a real-world Starbucks
outlet: ‘show it to your barista’.
Figure 43: Starbucks’ Frappuccino website allows customers to create their own virtual drink
Source: Starbucks website BUSINESS INSIGHTS
An example of adaptive customization within the drinks industry is Tang Tangole, marketed in Brazil and
discussed in Chapter 3. The powder concentrate features two sachets of different flavors designed to be
complementary, but which can either be prepared together to make a two-flavored blend or separately
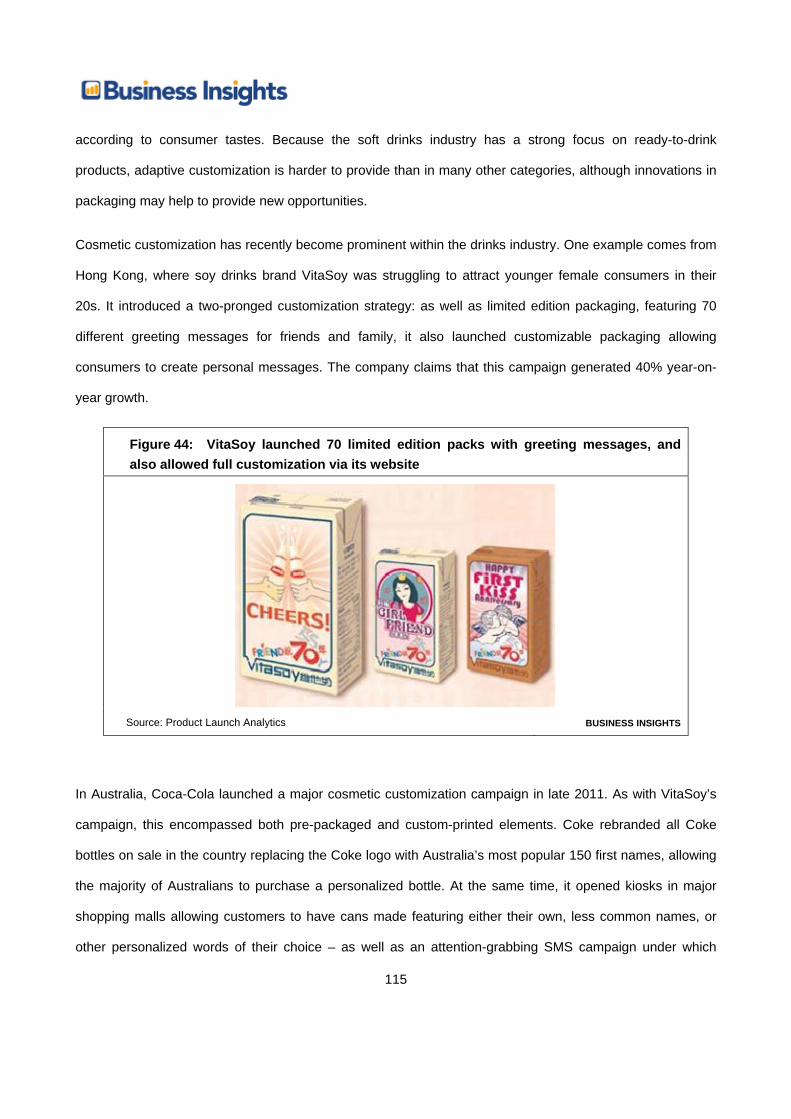
115
according to consumer tastes. Because the soft drinks industry has a strong focus on ready-to-drink
products, adaptive customization is harder to provide than in many other categories, although innovations in
packaging may help to provide new opportunities.
Cosmetic customization has recently become prominent within the drinks industry. One example comes from
Hong Kong, where soy drinks brand VitaSoy was struggling to attract younger female consumers in their
20s. It introduced a two-pronged customization strategy: as well as limited edition packaging, featuring 70
different greeting messages for friends and family, it also launched customizable packaging allowing
consumers to create personal messages. The company claims that this campaign generated 40% year-on-
year growth.
Figure 44: VitaSoy launched 70 limited edition packs with greeting messages, and also allowed full customization via its website
Source: Product Launch Analytics BUSINESS INSIGHTS
In Australia, Coca-Cola launched a major cosmetic customization campaign in late 2011. As with VitaSoy’s
campaign, this encompassed both pre-packaged and custom-printed elements. Coke rebranded all Coke
bottles on sale in the country replacing the Coke logo with Australia’s most popular 150 first names, allowing
the majority of Australians to purchase a personalized bottle. At the same time, it opened kiosks in major
shopping malls allowing customers to have cans made featuring either their own, less common names, or
other personalized words of their choice – as well as an attention-grabbing SMS campaign under which
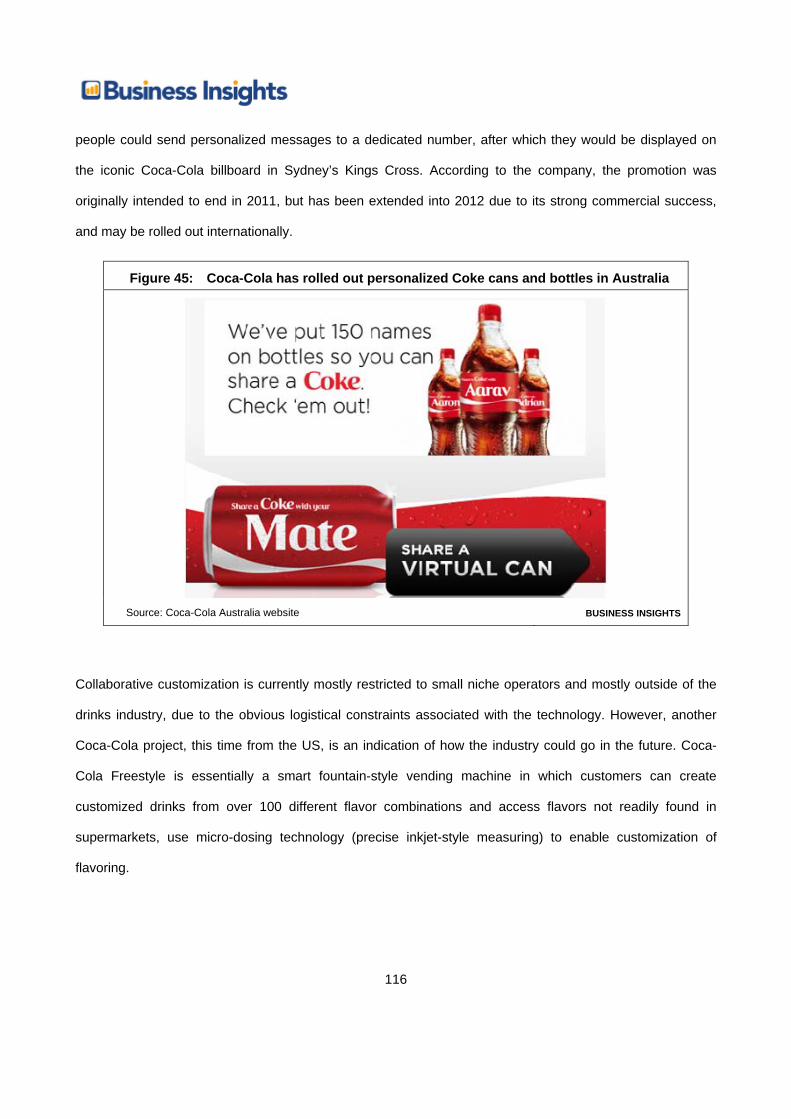
116
people could send personalized messages to a dedicated number, after which they would be displayed on
the iconic Coca-Cola billboard in Sydney’s Kings Cross. According to the company, the promotion was
originally intended to end in 2011, but has been extended into 2012 due to its strong commercial success,
and may be rolled out internationally.
Figure 45: Coca-Cola has rolled out personalized Coke cans and bottles in Australia
Source: Coca-Cola Australia website BUSINESS INSIGHTS
Collaborative customization is currently mostly restricted to small niche operators and mostly outside of the
drinks industry, due to the obvious logistical constraints associated with the technology. However, another
Coca-Cola project, this time from the US, is an indication of how the industry could go in the future. Coca-
Cola Freestyle is essentially a smart fountain-style vending machine in which customers can create
customized drinks from over 100 different flavor combinations and access flavors not readily found in
supermarkets, use micro-dosing technology (precise inkjet-style measuring) to enable customization of
flavoring.

117
Some austerity trends fit better than others with emerging markets
The OECD estimates that there were 1.8 billion people in the global middle class in 2009, defining the global
middle class as households with daily expenditure between $10 and $100 per person in purchasing power
parity terms (which reflects the varying cost of living). 28% of the global middle class currently lives in the
Asia-Pacific region, amounting to 525 million people – or less than a quarter of the region’s total population.
Over the next 10 years, the OECD expects that a net total of 1.2 billion people in the Asia-Pacific region will
be born into or move into the global middle class. This will represent the largest single expansion in
consumer spending power ever recorded, with the number of global middle class consumers increasing by
75% between 2009-2020 due to rising incomes in India, China, Indonesia, and across the region. Meanwhile,
although Africa’s poor economic performance is not expected to change significantly, the number of global
middle class people in the continent is nonetheless forecast to almost double between 2009-2020,
representing further opportunities. As a result, consumers in emerging markets who, although not enjoying
western standards of living, are newly able to afford consumer good represent a crucial market opportunity.
Some of the lessons learned from targeting recessionary western commuters can well be applied to
emerging markets, in terms of ways that value can be added without increasing cost. The use of targeted
products that specifically meet consumer needs, and that can be allied to advertising campaigns based on
the brand’s core values, is of importance to any brand operating in any market. Many of the principles
required to stay ahead of private label can also be applied to staying ahead of local competitors (both
retailers and low-cost manufacturers) in emerging economies. However, it is important to remember that
although incomes are low, the trend away from conspicuous consumption is emphatically not something that
links recessionary and emerging economies.
Health and wellness will continue to be a major trend Previous chapters have highlighted that the boom in dedicated functional drinks that characterized the 2000s
is no longer quite such a major force, as a combination of saturation of key consumers, consumer skepticism
and strained financial situations puts pressure on sales. However, this does not alter the fact that with over
65s expected to outnumber five to 14 year olds for the first time in the US by 2014, aging baby boomers with

118
a continued desire to remain young and active, will be crucial drivers of preventative medicine, and healthy
and/or functional drinks will play an important role in their wellness strategies.
Major drinks players are growing the market but cutting prices
The functional drinks market was initially developed by specialist manufacturers, but mainstream companies
have been increasingly taking advantage of health trends as functional categories have become important.
They have two key advantages: existing brands that they are able to leverage into functional categories; and
deep pockets that allow them to justify health claims using scientific evidence. This allows companies such
as Danone and Nestlé, who were proactive early on in exploiting consumer health trends, to command
premium prices for their products, to defend against competition, and to better meet consumer needs. At the
end of 2010, PepsiCo announced that it would follow suit, creating a global nutrition group that sought to
deliver ‘breakthrough innovation’ in both free-from and positive health food categories. Already, the company
has launched functional extensions for its Tropicana juice range aimed at a wide range of different health
offerings, which are the start of the company’s strategy to treble the size of its nutrition businesses to $30
billion by 2020.
Figure 46: The Tropicana Essentials range is PepsiCo’s attempt to enter the functional drinks market
Source: Product Launch Analytics BUSINESS INSIGHTS
But as the business increasingly becomes the terrain of the leading food companies, it may be harder to
command a premium price: as health benefits become commonplace, it will be hard to justify charging far

119
more than comparable products without health benefits – certainly for products like most of the healthy
launches today, which cannot make and justify specific and noticeable health claims.
New types of functionality can attract non-traditional consumers
One example of a drink that offer functional benefits that are not yet widely duplicated and which, at least if
successful, are immediate is Mertsana’s Drinkoff Anti-hangover and Sobering Jam. Sold in Russia in Energy
(grapefruit), Party (lemon and lime) and Auto (lemon and mint) flavors, the sports-gel-style drink claims that it
will sober up the consumer, prevent hangovers, and provide an energy boost. It is possible that this would
fail to pass US and EU regulators on the use of functional claims, although a scientifically proven version of
the same product would doubtless prove highly popular. Similarly, Maayan’s Mind Essential Confidence
Water Shot, available in the US, claims to be the first non-alcoholic beverage to naturally boost confidence.
Taken daily, Maayan claims that the drink will leave the consumer feeling more confident and in control, and
thus able to lead a happier, healthier, and more productive life.
Figure 47: Drinkoff Sobering Jam and Mind Essential Confidence Shot both offer unusual functional benefits
Source: Product Launch Analytics / Mind Essential website BUSINESS INSIGHTS
A product with different, although also tangible and mental, benefits is the Botanical Drinks Company’s
Lightly Sparkling Fruit & Botanical Drink, which is a relaxing drink that claims to ‘soothe mind and body’.
Even more concrete are the claims made by Healthy Sweet Fruit Punch Splash in the US, which is a fruit
drink that is not only sugar-free, but also claims to be able to kill mouth bacteria and strengthen weakened
tooth structure. While perhaps obvious given the benefits claimed for its sweetener, xylitol, in categories such
as dental gum and mouthwash, this is the first drink to adopt an explicitly dental positioning. Finally, an
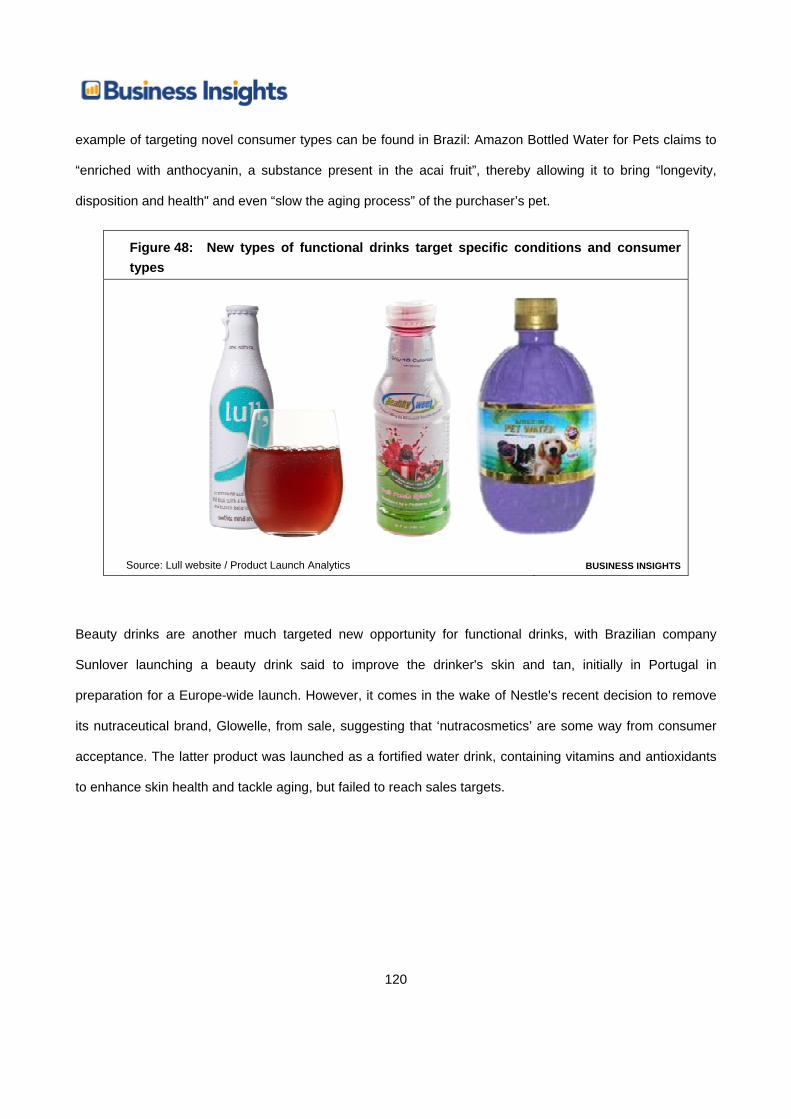
120
example of targeting novel consumer types can be found in Brazil: Amazon Bottled Water for Pets claims to
“enriched with anthocyanin, a substance present in the acai fruit”, thereby allowing it to bring “longevity,
disposition and health" and even “slow the aging process” of the purchaser’s pet.
Figure 48: New types of functional drinks target specific conditions and consumer types
Source: Lull website / Product Launch Analytics BUSINESS INSIGHTS
Beauty drinks are another much targeted new opportunity for functional drinks, with Brazilian company
Sunlover launching a beauty drink said to improve the drinker's skin and tan, initially in Portugal in
preparation for a Europe-wide launch. However, it comes in the wake of Nestle's recent decision to remove
its nutraceutical brand, Glowelle, from sale, suggesting that ‘nutracosmetics’ are some way from consumer
acceptance. The latter product was launched as a fortified water drink, containing vitamins and antioxidants
to enhance skin health and tackle aging, but failed to reach sales targets.

121
Figure 49: Brazilian brand Sunlover is hoping to succeed where Nestle’s Glowelle failed
Source: Product Launch Analytics BUSINESS INSIGHTS
Regulation and consumer skepticism will remain obstacles
While the investment in functional drinks by multinationals underlines the growth potential the sector offers,
functional brands face some significant marketing challenges. Business Insights’ Growth Opportunities in
Sustainable and Positive Health Food and Drinks contains a detailed country-by-country regulatory review,
but in short, particularly in the EU but also in many other developed markets, extremely tight rules now
govern marketers claims regarding positive (and, to a lesser extent, negative) health claims about their
products. Before the rule change, various surveys carried out in the EU, US and Australia by organizations
including the European Commission, Key Note, Just-Food.com and Datamonitor all found significant
consumer skepticism towards food and drinks manufacturers’ health claims, with more than half of
consumers in many countries rejecting them out of hand. In the long term, the new rules may help address
consumer skepticism, but in the short term the damage has been done – and the end result is that it is hard
to get permission to use functional claims, which consumers may end up not believing anyway.
Health is becoming important in developing markets
In most emerging markets, consumer interest in healthier drinks lags behind that of western consumers, and
there is little or no regulatory structure under which credible claims can be made. However, consumers in
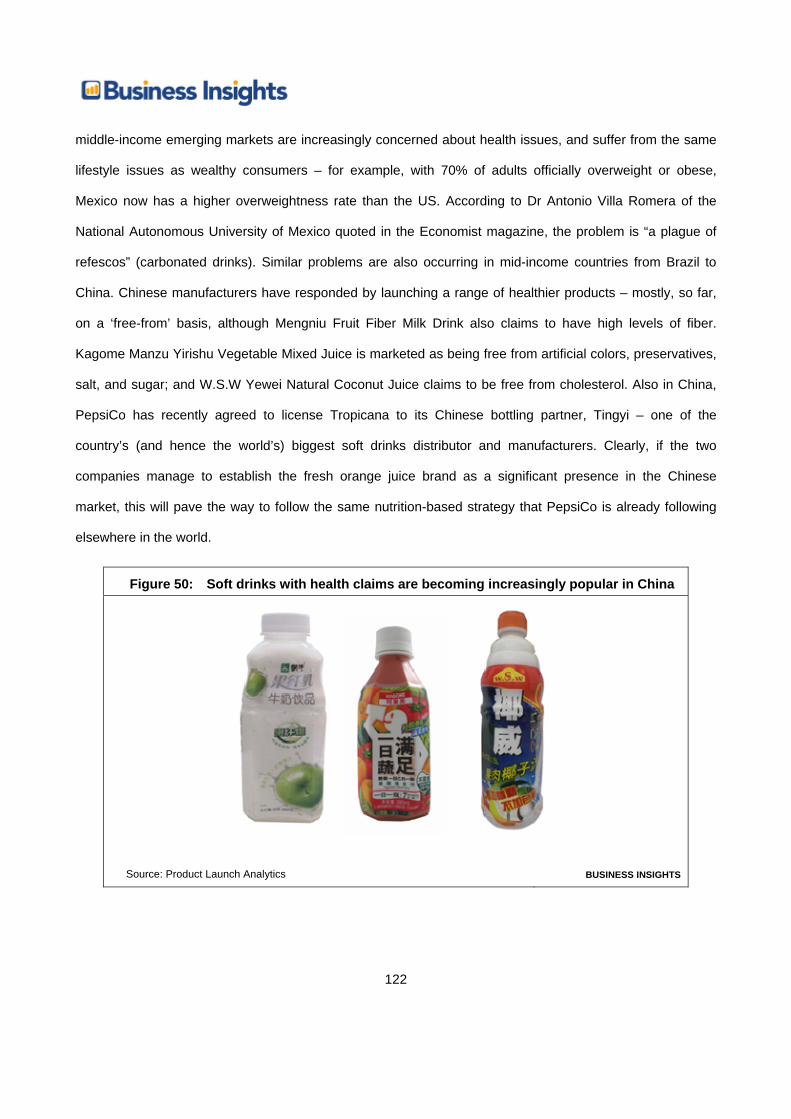
122
middle-income emerging markets are increasingly concerned about health issues, and suffer from the same
lifestyle issues as wealthy consumers – for example, with 70% of adults officially overweight or obese,
Mexico now has a higher overweightness rate than the US. According to Dr Antonio Villa Romera of the
National Autonomous University of Mexico quoted in the Economist magazine, the problem is “a plague of
refescos” (carbonated drinks). Similar problems are also occurring in mid-income countries from Brazil to
China. Chinese manufacturers have responded by launching a range of healthier products – mostly, so far,
on a ‘free-from’ basis, although Mengniu Fruit Fiber Milk Drink also claims to have high levels of fiber.
Kagome Manzu Yirishu Vegetable Mixed Juice is marketed as being free from artificial colors, preservatives,
salt, and sugar; and W.S.W Yewei Natural Coconut Juice claims to be free from cholesterol. Also in China,
PepsiCo has recently agreed to license Tropicana to its Chinese bottling partner, Tingyi – one of the
country’s (and hence the world’s) biggest soft drinks distributor and manufacturers. Clearly, if the two
companies manage to establish the fresh orange juice brand as a significant presence in the Chinese
market, this will pave the way to follow the same nutrition-based strategy that PepsiCo is already following
elsewhere in the world.
Figure 50: Soft drinks with health claims are becoming increasingly popular in China
Source: Product Launch Analytics BUSINESS INSIGHTS
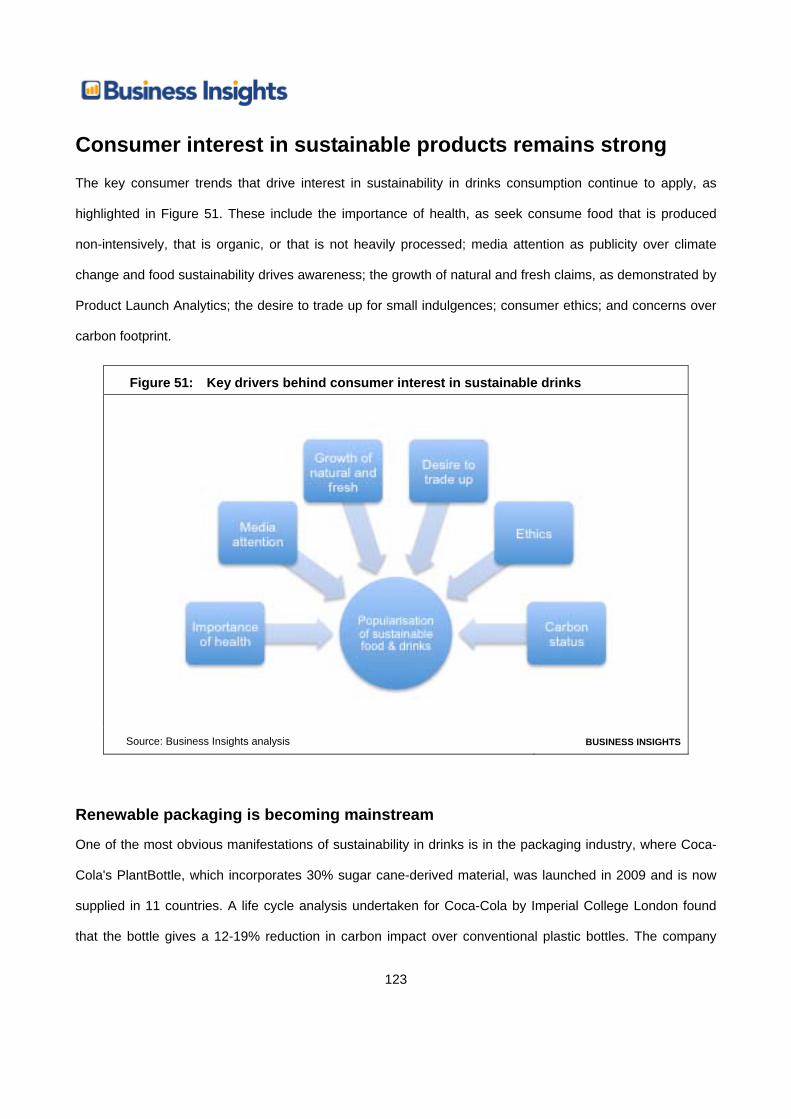
123
Consumer interest in sustainable products remains strong The key consumer trends that drive interest in sustainability in drinks consumption continue to apply, as
highlighted in Figure 51. These include the importance of health, as seek consume food that is produced
non-intensively, that is organic, or that is not heavily processed; media attention as publicity over climate
change and food sustainability drives awareness; the growth of natural and fresh claims, as demonstrated by
Product Launch Analytics; the desire to trade up for small indulgences; consumer ethics; and concerns over
carbon footprint.
Figure 51: Key drivers behind consumer interest in sustainable drinks
Source: Business Insights analysis BUSINESS INSIGHTS
Renewable packaging is becoming mainstream
One of the most obvious manifestations of sustainability in drinks is in the packaging industry, where Coca-
Cola's PlantBottle, which incorporates 30% sugar cane-derived material, was launched in 2009 and is now
supplied in 11 countries. A life cycle analysis undertaken for Coca-Cola by Imperial College London found
that the bottle gives a 12-19% reduction in carbon impact over conventional plastic bottles. The company

124
plans to introduce PlantBottle across its entire global range by 2020. Meanwhile, in 2012, PepsiCo plans to
launch its 100% plant-based EcoGreen bottle, based on switch grass, pine bark, and corn husks. The
company says that it is North America's first soft drink bottle made from 100% recycled polyethylene
terephthalate plastic, and will reduce the amount of virgin plastic used by the company by approximately
3,000 tons per year, without affecting flavor or bottle feel. Both examples highlight that major drinks
companies now feel they need to put environmental sustainability at the center of their businesses.
Figure 52: Coca-Cola and Pepsi have both launched sustainably-positioned recyclable bottle types
Source: Coca-Cola website / Pepsi website BUSINESS INSIGHTS
Meanwhile, the European Container Glass Federation says that glass bottle manufacturers also looking to
cut product weight (and hence both cost and carbon footprint) without damaging consumer perceptions. One
of the most prominent examples has been in the beer sector, where Molson Coors UK recently launched a
lightweight version of its 300ml Grolsch bottle, keeping the same appearance but with an initial 13% (now
down to 23% following additional changes) weight reduction, saving up to 8,000 tons of glass per year. The
same techniques can easily be – and are being – applied to glass soft drinks bottles worldwide.
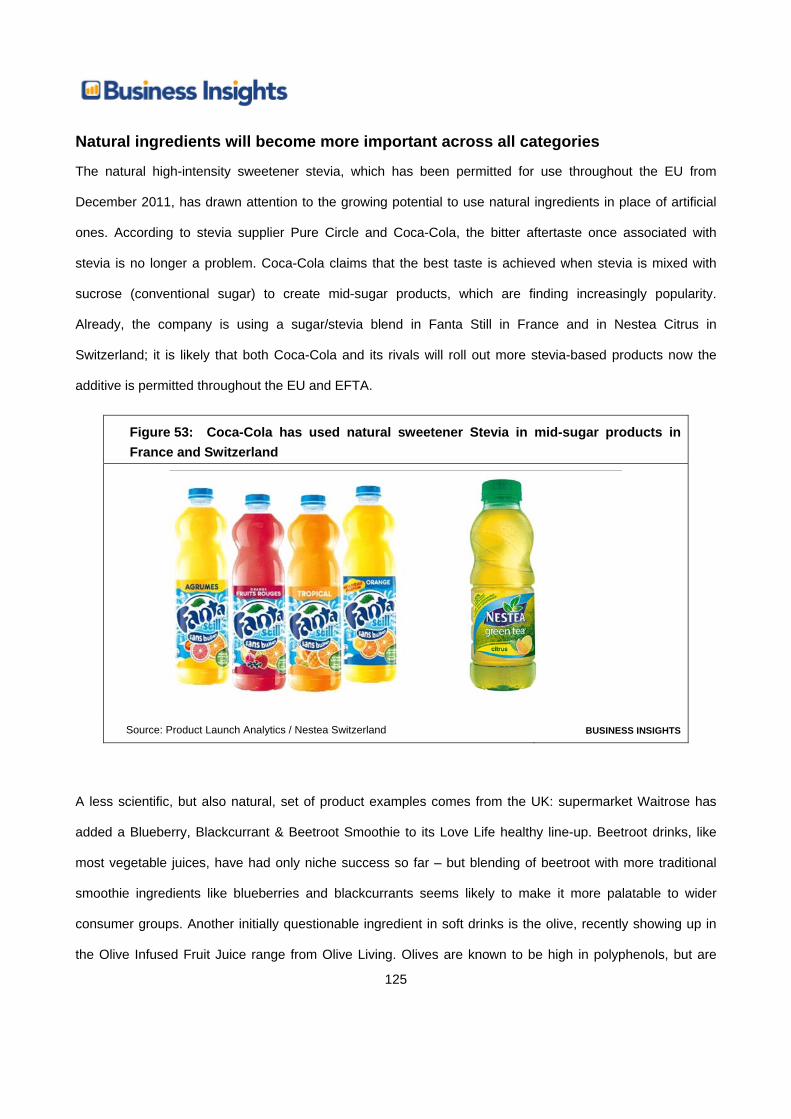
125
Natural ingredients will become more important across all categories
The natural high-intensity sweetener stevia, which has been permitted for use throughout the EU from
December 2011, has drawn attention to the growing potential to use natural ingredients in place of artificial
ones. According to stevia supplier Pure Circle and Coca-Cola, the bitter aftertaste once associated with
stevia is no longer a problem. Coca-Cola claims that the best taste is achieved when stevia is mixed with
sucrose (conventional sugar) to create mid-sugar products, which are finding increasingly popularity.
Already, the company is using a sugar/stevia blend in Fanta Still in France and in Nestea Citrus in
Switzerland; it is likely that both Coca-Cola and its rivals will roll out more stevia-based products now the
additive is permitted throughout the EU and EFTA.
Figure 53: Coca-Cola has used natural sweetener Stevia in mid-sugar products in France and Switzerland
Source: Product Launch Analytics / Nestea Switzerland BUSINESS INSIGHTS
A less scientific, but also natural, set of product examples comes from the UK: supermarket Waitrose has
added a Blueberry, Blackcurrant & Beetroot Smoothie to its Love Life healthy line-up. Beetroot drinks, like
most vegetable juices, have had only niche success so far – but blending of beetroot with more traditional
smoothie ingredients like blueberries and blackcurrants seems likely to make it more palatable to wider
consumer groups. Another initially questionable ingredient in soft drinks is the olive, recently showing up in
the Olive Infused Fruit Juice range from Olive Living. Olives are known to be high in polyphenols, but are

126
more typically used in margarines or oils than in soft drinks. The range – which purports not to taste of olives
– consists of the traditional top juice flavors: apple, smooth orange, orange with bits, orange & mango, and
apple & mango varieties.
Figure 54: Beetroot and olives are examples of non-traditional naturally functional drinks ingredients
Source: Product Launch Analytics BUSINESS INSIGHTS
New packaging types allow delivery of active ingredients
One of the issues holding back functional food and drinks’ growth is that some functional ingredients are not
stable in ready-to-drink formats – or at least, are difficult to transport and cannot be stored at ambient
temperatures. A way round this problem is to create packaging that allows the consumer to mix them at
drinking time. One example of this is Rising Beverage Co’s Activate, a vitamin-enhanced functional drink
where vitamins are stored as a dry powder in a container within the bottle’s lid; the consumer twists the lid to
release the vitamins into the liquid before drinking it. Nestlé is another example: the company wanted to
make a shelf-stable probiotic milk drink with a year’s shelf life, but realized the bacteria in the drink would be
killed by the heat-treating process that allows milk to be kept at ambient temperatures for a year. The
solution, found in Nestlé’s Boost Kid Essentials chocolate milk drink, was to produce a conventional shelf-

127
stable nutritional drink with the probiotic in desiccated form in a special patented straw, instead of in the drink
– it mixes only when the child actually drinks the milk through the straw.
Figure 55: Activate Workout and Boost Kid Essentials are both finally mixed as part of the consumer’s drinking process
Source: Product Launch Analytics BUSINESS INSIGHTS
Convenience remains important, despite economic changes During the hectic 2000s, convenience was viewed as a vitally important consumer trend. Increasingly, it has
been neglected in some analysis in favor of recessionary, health and sustainability trends, but remains just
as important to consumers’ lives as it was before the world environment changed. People who are employed
continue to work long hours with long commutes at the beginning and end; the pressure on working parents
remains as strong as ever; and the need – whether real or imagined – to fit as many hours as possible into
the day remains.
Functional convenience is a powerful trend overlap
Rebootizer’s Detox Shaker Powerful Antioxidant Instant Drink is promoted as an all-in-one detox product,
which rebalances the body's antioxidant levels, reduces stress, and regulates digestive functions, based on a
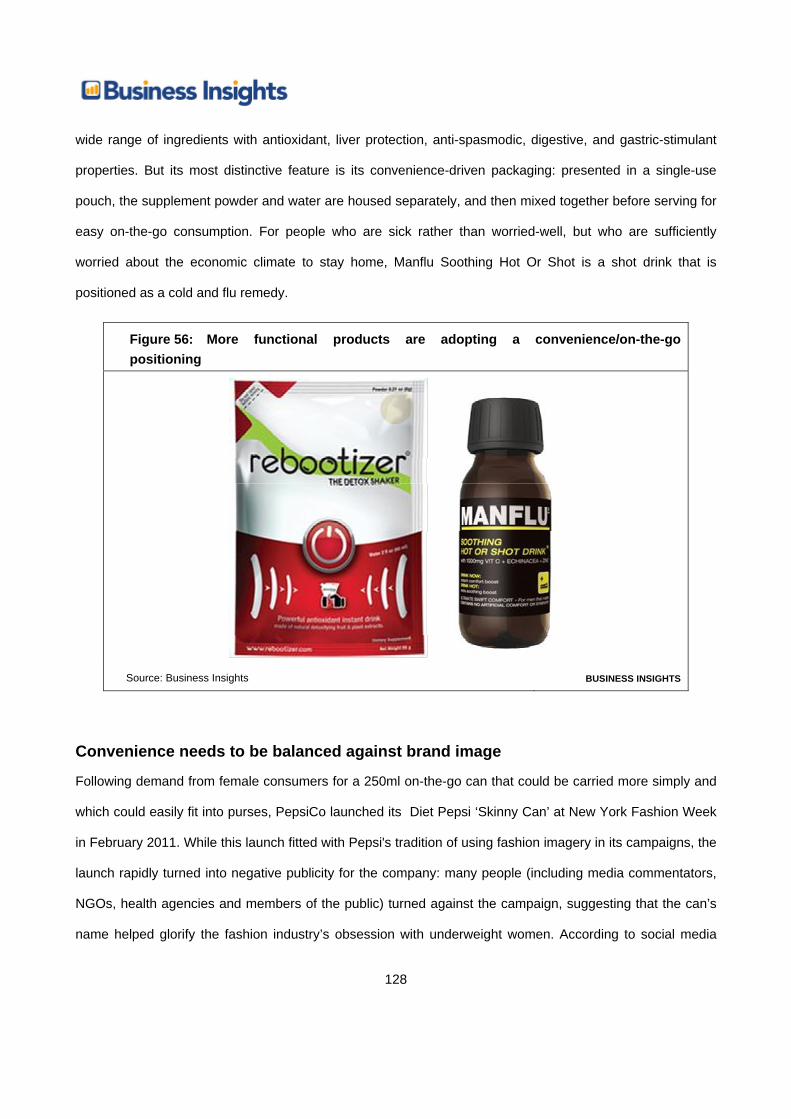
128
wide range of ingredients with antioxidant, liver protection, anti-spasmodic, digestive, and gastric-stimulant
properties. But its most distinctive feature is its convenience-driven packaging: presented in a single-use
pouch, the supplement powder and water are housed separately, and then mixed together before serving for
easy on-the-go consumption. For people who are sick rather than worried-well, but who are sufficiently
worried about the economic climate to stay home, Manflu Soothing Hot Or Shot is a shot drink that is
positioned as a cold and flu remedy.
Figure 56: More functional products are adopting a convenience/on-the-go positioning
Source: Business Insights BUSINESS INSIGHTS
Convenience needs to be balanced against brand image
Following demand from female consumers for a 250ml on-the-go can that could be carried more simply and
which could easily fit into purses, PepsiCo launched its Diet Pepsi ‘Skinny Can’ at New York Fashion Week
in February 2011. While this launch fitted with Pepsi's tradition of using fashion imagery in its campaigns, the
launch rapidly turned into negative publicity for the company: many people (including media commentators,
NGOs, health agencies and members of the public) turned against the campaign, suggesting that the can’s
name helped glorify the fashion industry’s obsession with underweight women. According to social media
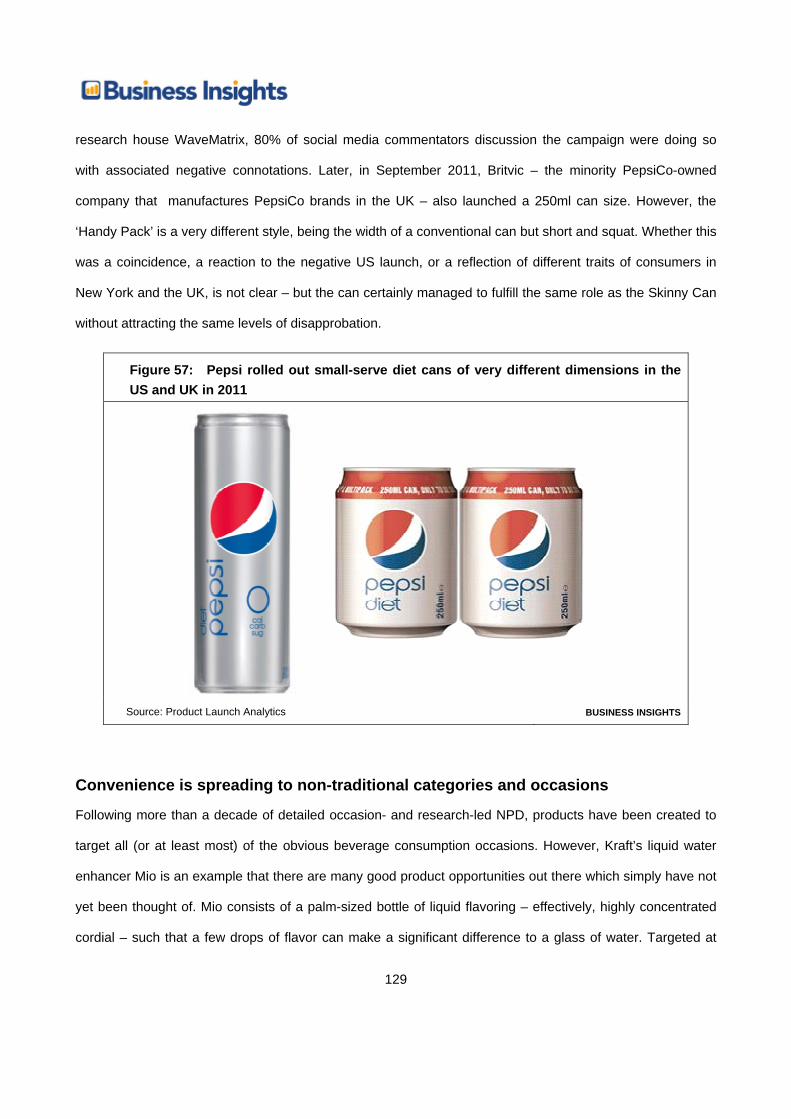
129
research house WaveMatrix, 80% of social media commentators discussion the campaign were doing so
with associated negative connotations. Later, in September 2011, Britvic – the minority PepsiCo-owned
company that manufactures PepsiCo brands in the UK – also launched a 250ml can size. However, the
‘Handy Pack’ is a very different style, being the width of a conventional can but short and squat. Whether this
was a coincidence, a reaction to the negative US launch, or a reflection of different traits of consumers in
New York and the UK, is not clear – but the can certainly managed to fulfill the same role as the Skinny Can
without attracting the same levels of disapprobation.
Figure 57: Pepsi rolled out small-serve diet cans of very different dimensions in the US and UK in 2011
Source: Product Launch Analytics BUSINESS INSIGHTS
Convenience is spreading to non-traditional categories and occasions
Following more than a decade of detailed occasion- and research-led NPD, products have been created to
target all (or at least most) of the obvious beverage consumption occasions. However, Kraft’s liquid water
enhancer Mio is an example that there are many good product opportunities out there which simply have not
yet been thought of. Mio consists of a palm-sized bottle of liquid flavoring – effectively, highly concentrated
cordial – such that a few drops of flavor can make a significant difference to a glass of water. Targeted at
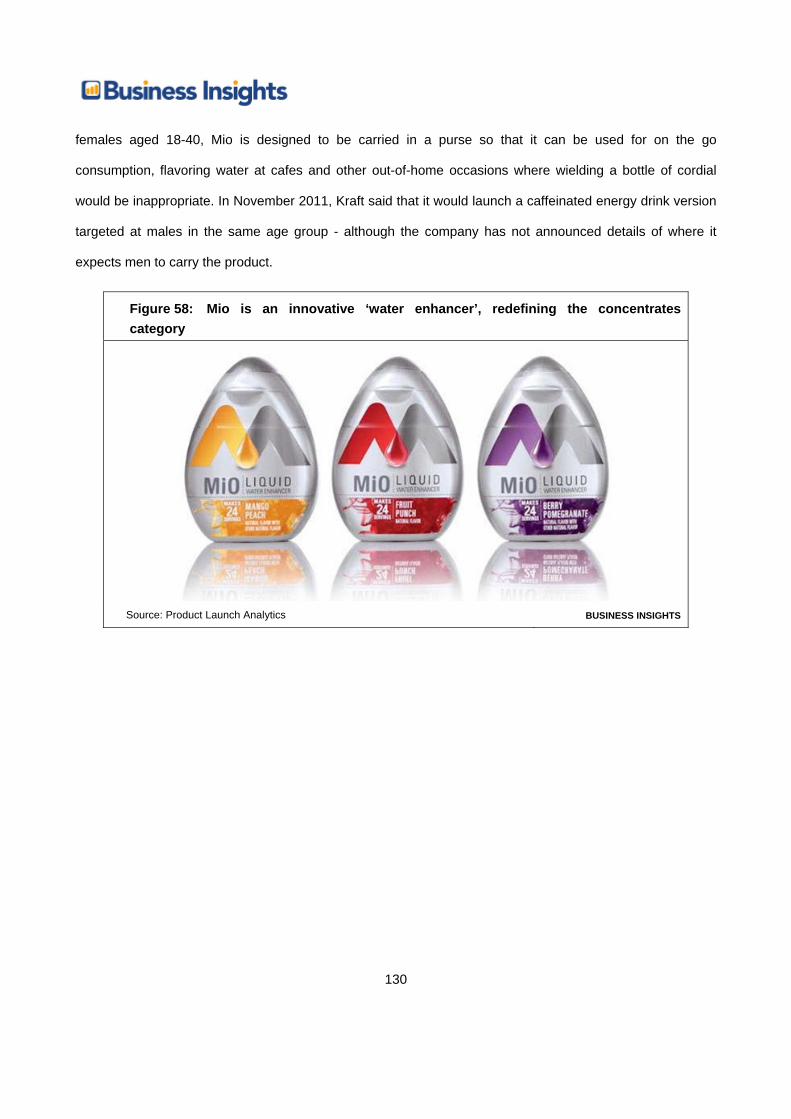
130
females aged 18-40, Mio is designed to be carried in a purse so that it can be used for on the go
consumption, flavoring water at cafes and other out-of-home occasions where wielding a bottle of cordial
would be inappropriate. In November 2011, Kraft said that it would launch a caffeinated energy drink version
targeted at males in the same age group - although the company has not announced details of where it
expects men to carry the product.
Figure 58: Mio is an innovative ‘water enhancer’, redefining the concentrates category
Source: Product Launch Analytics BUSINESS INSIGHTS
131
Chapter 5 The future of innovations in soft drinks
Summary Low or no growth in most western economies is a given for the next three years and quite possibly
longer; and even when western markets recover, their growth rates will still look stagnant compared to
the rest of the world.
In the short term, rising Chinese consumer spending creates opportunities in the beverage sector, but
in the long run it is likely to lead to Chinese drinks companies that represent serious competition to
existing market players, not just in China but worldwide.
It has become conventional wisdom that major, mass-market drinks are likely to break down, with
consumers no longer displaying the kind of brand loyalty that they once did. This is particularly often
cited for younger consumers, but does not tell the whole story: rather, consumers dip into a portfolio of
brands based on their specific needs at the time.
In the B2C media industry, personalization and disintermediation have become the most important
trends facing the market. It is likely that a similar approach will ultimately reach the drinks industry, as it
gradually becomes more of a technically feasible achievement rather than a pipedream
Functional drinks will be an important way for aging consumers in west and east alike to consume
medications. As the regulatory regime matures, it will be increasingly common for functional ingredients
to be delivered in drinks format, possibly combined with the personalization trend to the point where
people can consume drinks that are directly personalized to their lifestyle needs.
Within the next 10-20 years, drinks packaging will end up becoming 100% recycled and recyclable, and
that this will be accepted by consumers and by the industry as a matter of course.
Packaging will evolve to incorporate new technologies – most notably nanotechnology, but also
advances in cheap electronics, in ergonomics, and in materials science. The main impact of new
packaging technology will be to add functionality to the consumer’s drinking experience.
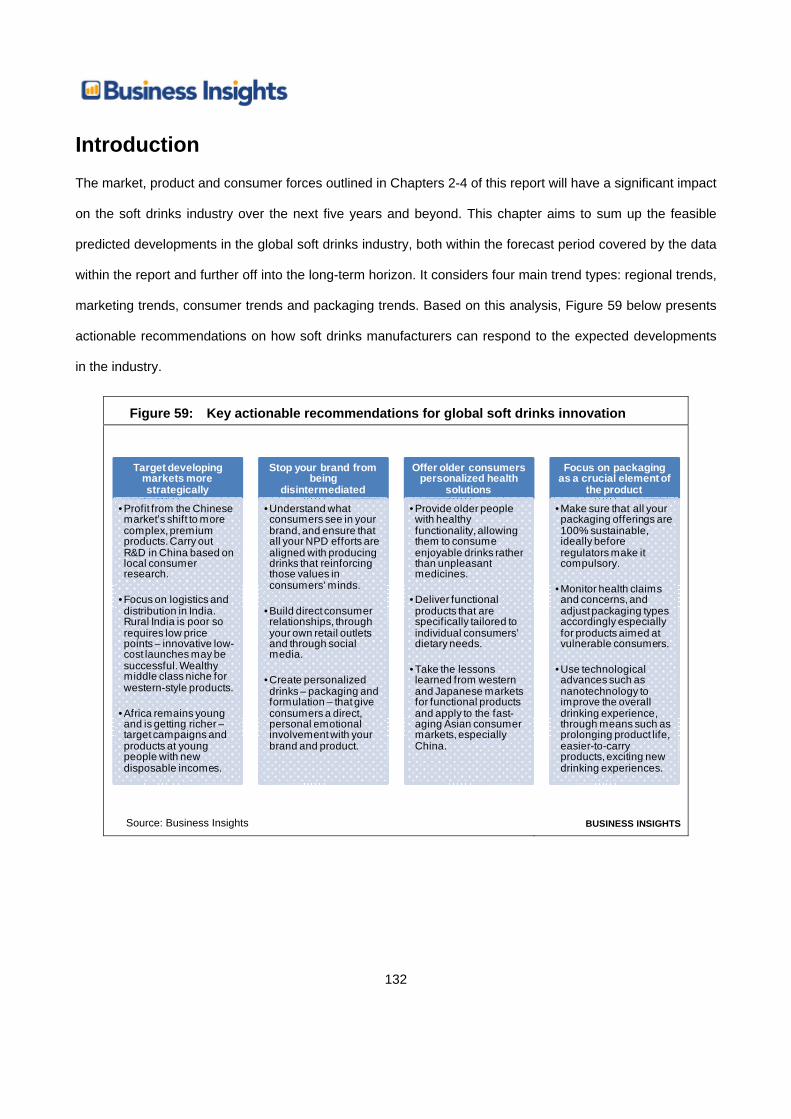
132
Introduction The market, product and consumer forces outlined in Chapters 2-4 of this report will have a significant impact
on the soft drinks industry over the next five years and beyond. This chapter aims to sum up the feasible
predicted developments in the global soft drinks industry, both within the forecast period covered by the data
within the report and further off into the long-term horizon. It considers four main trend types: regional trends,
marketing trends, consumer trends and packaging trends. Based on this analysis, Figure 59 below presents
actionable recommendations on how soft drinks manufacturers can respond to the expected developments
in the industry.
Figure 59: Key actionable recommendations for global soft drinks innovation
Target developing markets more strategically
• Profit from the Chinese market’s shift to more complex, premium products. Carry out R&D in China based on local consumer research.
• Focus on logistics and distribution in India. Rural India is poor so requires low price points – innovative low-cost launches may be successful. Wealthy middle class niche for western-style products.
• Africa remains young and is getting richer –target campaigns and products at young people with new disposable incomes.
Stop your brand from being
disintermediated
• Understand what consumers see in your brand, and ensure that all your NPD efforts are aligned with producing drinks that reinforcing those values in consumers’ minds.
• Build direct consumer relationships, through your own retail outlets and through social media.
• Create personalized drinks – packaging and formulation – that give consumers a direct, personal emotional involvement with your brand and product.
Offer older consumers personalized health
solutions
• Provide older people with healthy functionality, allowing them to consume enjoyable drinks rather than unpleasant medicines.
• Deliver functional products that are specifically tailored to individual consumers’ dietary needs.
• Take the lessons learned from western and Japanese markets for functional products and apply to the fast-aging Asian consumer markets, especially China.
Focus on packaging as a crucial element of
the product
• Make sure that all your packaging offerings are 100% sustainable, ideally before regulators make it compulsory.
• Monitor health claims and concerns, and adjust packaging types accordingly especially for products aimed at vulnerable consumers.
• Use technological advances such as nanotechnology to improve the overall drinking experience, through means such as prolonging product life, easier-to-carry products, exciting new drinking experiences.
Source: Business Insights BUSINESS INSIGHTS
133
Future regional trends
The stagnation of western markets Low or no growth in most western economies is a given for the next three years, and quite possibly
longer, in absolute terms: while GDP is starting to rise in the US, there is still little impact on average
disposable incomes, not least because much pre-global financial crisis spending was based on debt
rather than sustainable saving.
Even when western markets recover, their growth rates will still look stagnant compared to the rest of
the world – simply because economies such as China and Brazil are playing catch-up, which will
always lead to faster growth. Outside of emerging new categories and key on-trend products, the
biggest growth opportunities will increasingly lie elsewhere.
China’s shift towards consumption and global power At the moment, China’s main role for most Western businesses – other than those targeting global
elites – is as a supplier of products. However, this role will change in two major ways, one immediately
and one as a longer-term consequence.
For the last decade, the Chinese economy was based on export growth and high domestic saving, and
therefore a limited proportion of the country’s GDP was channeled into consumer spending. Both to
avoid further financial chaos and to prop up growth as weak demand leads to slowing exports, the
Chinese government has adopted a formal policy of encouraging domestic household consumption.
This shift in policy will significantly increase domestic spending on consumer goods, including soft
drinks, creating opportunities for domestic and foreign firms alike, although those with a strong track
record of operating in China will be best placed to profit from the upswing in consumer spending.
In the longer term still, however, this shift will create a competitive threat for western drinks companies.
Chinese FMCG companies are currently weak competitors on an international basis, due to their limited
domestic market and lack of obvious competitive advantage. When the market reaches the scale that it
is likely to achieve in the next decade, this will no longer be the case, at which point Chinese drinks
manufacturers will provide significant competition.
134
India’s slow, painful journey to consumer capitalism The Indian soft drinks market is currently one of the world’s least developed, despite the enormous
potential that the country has. This is largely due to the backwards state of Indian retailing, with
protectionist measures that favor small shopkeepers meaning. This ensures that India simply does not
have the complex cold supply chains that exist in all developed, and many developing, countries.
Recent attempts by the Indian government to open up the retail market to foreign competition would
have an immense positive impact on sales of branded FMCG. It would be particularly important for
categories distributed cold or with short shelf-lives, including many of the higher-value drinks categories
that are currently absent from the Indian market, but would also spur supermarket visits and hence
grow FMCG sales across the board.
Due to opposition from shopkeepers, nationalist parties and the government’s Communist coalition
partners, the measures that would have allowed the modernization of Indian retail have instead been
put on hold for an indefinite period. It is likely that the measures will pass at some point, which will lead
to significant market growth, but it is far from clear when.
Other developing countries continue to develop The last 20 years is the first period in recent history during which average incomes in Africa have seen
significant rises; although some areas such as Sudan and Somalia remain war-torn, the conflicts that
destroyed much of the continent during the Cold War, and the corrupt dictators who both sides propped
up, have now largely been replaced by more-or-less democratic regimes offering a more-or-less stable
business environment.
The Middle East and Africa region has the youngest population of any of the regions of the world, with
the region’s total population expected to reach over 1.5 billion by 2020, with the strongest growth in the
under-40 bracket.
This presents significant opportunities for FMCG growth, particularly as China matures. Constraints on
retailing are far lower than in India, so there is a significant opportunity for products targeted at the
emerging global middle class in these regions to make significant market progress.
135
Future marketing trends
The breakdown of big brands It has become conventional wisdom that major, mass-market drinks brands – like other consumer
goods brands – are likely to break down, with consumers no longer displaying the kind of brand loyalty
that they once did. This is often cited for younger consumers in particular.
However, consumer surveys into brand affection do not tend to bear out these stereotypes. Although
people are not necessarily displaying absolute loyalty in purchasing terms as they once did, this is more
because they tailor different brands to different specific occasions than because they do not have
positive feelings towards particular brands.
The key challenge for manufacturers, as always, will be to reconcile brand affection with actual
purchases, which can only be done through a detailed understanding of the kind of purchases
consumers make that might be considered relevant to their brands.
The blurring of retailer and manufacturer Private label brands continue to improve, in terms of quality, in terms of branding strategy, and
increasingly in terms of driving innovation rather than merely catching up with major drinks industry
players. This puts the role of the manufacturer as anything other than a contract factory operator under
pressure.
At the same time, several aspects of technology are starting to give manufacturers the chance to take
over the retailer’s role as the only point of contact with the consumer. Nestlé’s Nespresso, sold only in
dedicated Nespresso stores and on a company-owned website is one example, while L’Oreal’s
ownership of the Body Shop premium private-label personal care retail chain is another.
Social media provides further opportunities for drinks manufacturers to build a direct relationship with
and to own the consumer – Business Insights’ recent Social Media Strategies for Food and Drinks
Companies report has more detailed information on ways in which this can be achieved.
136
Personalization will become increasingly important In the B2C media industry, personalization and disintermediation (pulling media information from
multiple sources rather than the corporate bundles that were once necessary) have become the most
important trends facing the market.
It is likely that a similar approach will ultimately reach the drinks industry, as it gradually becomes more
of a technically feasible achievement rather than a pipedream. The 100-flavor Coke Freestyle
dispenser is a signpost toward a future of unlimited customization, which could ultimately encompass
not only flavors but drink type, additives or their absence, and even tailored health benefits.
Future consumer trends
Demographics will favor health drinks in both west and east Over the next 20 years, the number of older people worldwide will grow significantly. They will be
seeking health solutions and healthy functionality in products like drinks that they would prefer to
consume, rather than taking pills or liquid medicines that are unpleasant to consume.
As members of a highly consumerist generation, older consumers will be strongly seeking sensory and
convenience benefits in their drinks, on top of the functionality aspects that will address their specific
lifestyle concerns.
As the regulatory regime matures, it will be increasingly common for functional ingredients to be
delivered in drinks format, possibly combined with the personalization trend to the point where people
can consume drinks that are directly personalized to their lifestyle needs.
Although Middle East & Africa markets still have a large young population, most Asian markets will be
hit by the same demographic time bomb that is starting to have significant impacts in the west – and in
China this will be especially significant because of the massive change in population growth brought
about by the One Child Policy.

137
The last people born before the One Child Policy was introduced will make up the first mass group of
mid-income retirees in China’s history, and they will be one of the most important demographic groups
to target with tailored products anywhere.
Demographic positioning is becoming more complex The model of demographically targeted new product development, under which a product is developed
to appeal to a specific consumer group based on identified market niches and detailed consumer
research, is a powerful one and will remain so.
However, there is an extent to which the distinctions on which the model lies are starting to break down
in western societies, with consumption behavior – and the underlying driver of consumption behavior,
self-identification in lifestage terms – no longer obeying the age classifications in which quantitative
marketing research seeks to place people.
A concrete example of this is Bot Water, launched in 2008 by a privately owned startup as a healthy
children's flavored bottled water. The recession cut parents’ willingness to buy their children expensive
water, putting the brand in question – but the company’s research found that many consumers aged
18-34 also were buying the drink as an alternative to existing flavored waters, and therefore redesigned
the brand identity to reflect this.
Highlighting this issue of demographic complexity, the company’s CEO said, “the beauty is that kids are
aspirational and want to drink what older people drink [so] we’re expanding via the adults but not really
losing the kids’ market with this new strategy”.

138
Figure 60: Child-focused Bot Water was relaunched as a drink without a specific demographic positioning
Source: Company materials BUSINESS INSIGHTS
Novel non-fruit flavors will continue to launch, but will remain unloved Something that is clear from the data in Product Launch Analytics on global soft drink flavor trends is
that – unlike many food categories, where the emergence of new categories and ethnic transfer of
flavors drives significant change – there is very little change in macro-level flavor preference.
While levels of sweetness vary from person to person and from cultural group to cultural group, the
model for a successful soft drink launch – even in highly innovative categories – is a fruit-flavored
beverage that is at least slightly sweet. Even in RTD teas, fruit-flavored teas have taken over from tea-
flavored teas.
In some Asian countries there is a greater willingness to mix sweet and savory or fruit and non-fruit
flavors, but this seems to be reducing rather than growing with time, with the Japanese market primarily
based on similar flavor bases to those seen elsewhere.
Overall, it seems as good a bet as any to assume that in 20 years time, even as the demographic
situation of the median soft drinks consumer shifts vastly, and as the technologies available multiply,
that none of the salt-based beverages in Figure 61 (Le Reve Amoricain Caramel & Salted Butter Cola,

139
Mitsuya Cider Roasted Salt Flavor, and Kirin Sekai No Kitchen Kara Salty Lychee) will go onto
mainstream success.
Figure 61: It seems unlikely that these salt-based soft drinks will reach the mainstream
Source: Business Insights BUSINESS INSIGHTS
Future packaging trends
Sustainability will become second nature in packaging Major soft drinks companies including Coca-Cola and Pepsi are already coming up with packaging
types that are recycled, recyclable, and which have a lower energy footprint than traditional packaging,
as discussed in Chapter 4.
Government-mandated recycling schemes are gradually improving, to the extent that they are able to
incorporate the vast majority of rubbish being thrown out and return it for recycling where this is
designed into products.
140
As both these trends continue, it is likely that within the next 10-20 years, drinks packaging will end up
becoming 100% recycled and recyclable, and that this will be accepted by consumers and by the
industry as a matter of course.
Health concerns will also spread into packaging In 2011, the European Commission recommended that parents moved towards glass bottles for
feeding their infants, while also banning the plastic additive bisphenol-a (BPA) in feeding bottles for
infants.
With BPA remaining an important additive in many plastics including those used in drinks containers,
and with research reported in Chemical & Engineering News suggesting that many BPA-substitutes
also have undesirable estrogen-mimicking effects, it is not clear that any associated health risks can be
avoided while continuing to use plastic containers.
According to Belgian consultancy InSites, many Europeans say they are willing to pay more for glass
containers to eliminate such risks, and in particular for milk, yogurts, juices and wine.
While the levels of harm posed in this particular case are not clear, it is an interesting example of health
concerns that were once primarily focused on the liquid within the packaging shifting to the chemical
composition of the container itself.
New technologies will deliver consumer benefits Packaging will evolve to incorporate new technologies – most notably nanotechnology, as discussed in
more detail in Business Insights’ forthcoming Nanotechnology in Packaging report, but also advances
in cheap electronics, in ergonomics, and in materials science.
The main impact of new packaging technology will be to add functionality to the consumer’s drinking
experience. For example, nanotechnology will allow ‘smart’ packaging to monitor the condition of food
and drinks, simultaneously ensuring the consumer avoids an unpleasant experience and prolonging
product life. More prosaically, improvements in ergonomics will make drinks containers easier to carry.
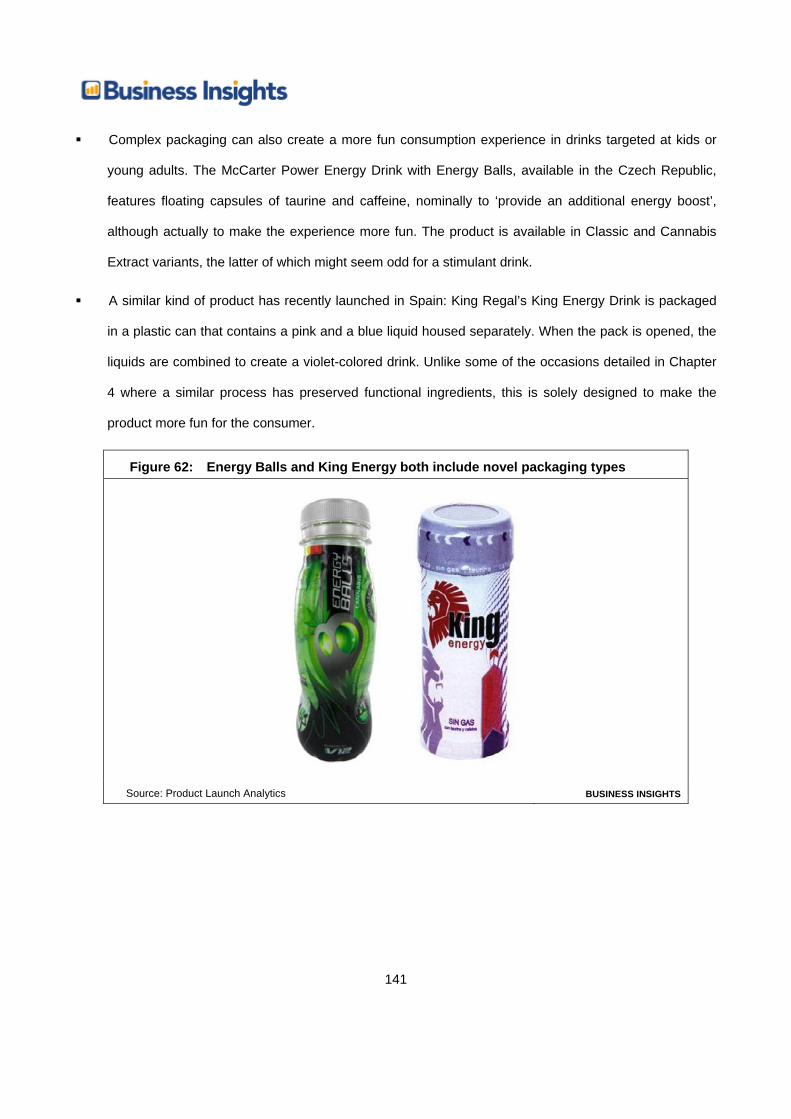
141
Complex packaging can also create a more fun consumption experience in drinks targeted at kids or
young adults. The McCarter Power Energy Drink with Energy Balls, available in the Czech Republic,
features floating capsules of taurine and caffeine, nominally to ‘provide an additional energy boost’,
although actually to make the experience more fun. The product is available in Classic and Cannabis
Extract variants, the latter of which might seem odd for a stimulant drink.
A similar kind of product has recently launched in Spain: King Regal’s King Energy Drink is packaged
in a plastic can that contains a pink and a blue liquid housed separately. When the pack is opened, the
liquids are combined to create a violet-colored drink. Unlike some of the occasions detailed in Chapter
4 where a similar process has preserved functional ingredients, this is solely designed to make the
product more fun for the consumer.
Figure 62: Energy Balls and King Energy both include novel packaging types
Source: Product Launch Analytics BUSINESS INSIGHTS
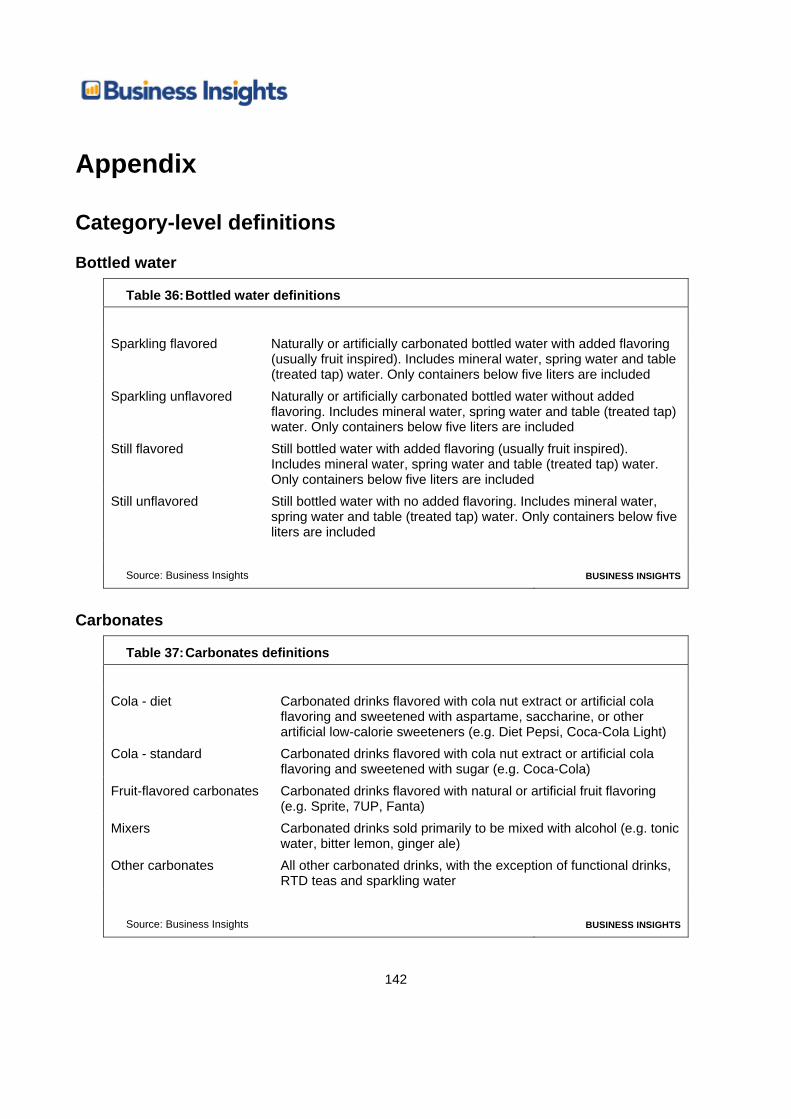
142
Appendix
Category-level definitions
Bottled water
Table 36: Bottled water definitions
Sparkling flavored Naturally or artificially carbonated bottled water with added flavoring
(usually fruit inspired). Includes mineral water, spring water and table (treated tap) water. Only containers below five liters are included
Sparkling unflavored Naturally or artificially carbonated bottled water without added flavoring. Includes mineral water, spring water and table (treated tap) water. Only containers below five liters are included
Still flavored Still bottled water with added flavoring (usually fruit inspired). Includes mineral water, spring water and table (treated tap) water. Only containers below five liters are included
Still unflavored Still bottled water with no added flavoring. Includes mineral water, spring water and table (treated tap) water. Only containers below five liters are included
Source: Business Insights BUSINESS INSIGHTS
Carbonates
Table 37: Carbonates definitions
Cola - diet Carbonated drinks flavored with cola nut extract or artificial cola
flavoring and sweetened with aspartame, saccharine, or other artificial low-calorie sweeteners (e.g. Diet Pepsi, Coca-Cola Light)
Cola - standard Carbonated drinks flavored with cola nut extract or artificial cola flavoring and sweetened with sugar (e.g. Coca-Cola)
Fruit-flavored carbonates Carbonated drinks flavored with natural or artificial fruit flavoring (e.g. Sprite, 7UP, Fanta)
Mixers Carbonated drinks sold primarily to be mixed with alcohol (e.g. tonic water, bitter lemon, ginger ale)
Other carbonates All other carbonated drinks, with the exception of functional drinks, RTD teas and sparkling water
Source: Business Insights BUSINESS INSIGHTS
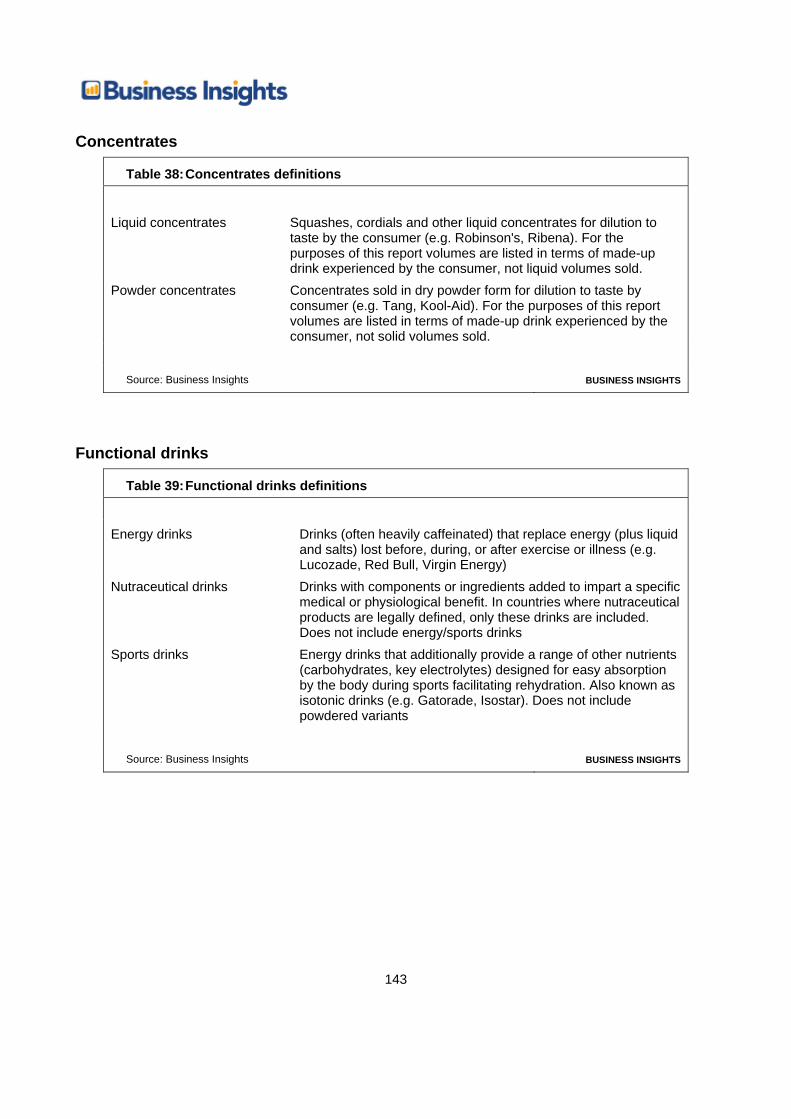
143
Concentrates
Table 38: Concentrates definitions
Liquid concentrates Squashes, cordials and other liquid concentrates for dilution to
taste by the consumer (e.g. Robinson's, Ribena). For the purposes of this report volumes are listed in terms of made-up drink experienced by the consumer, not liquid volumes sold.
Powder concentrates Concentrates sold in dry powder form for dilution to taste by consumer (e.g. Tang, Kool-Aid). For the purposes of this report volumes are listed in terms of made-up drink experienced by the consumer, not solid volumes sold.
Source: Business Insights BUSINESS INSIGHTS
Functional drinks
Table 39: Functional drinks definitions
Energy drinks Drinks (often heavily caffeinated) that replace energy (plus liquid
and salts) lost before, during, or after exercise or illness (e.g. Lucozade, Red Bull, Virgin Energy)
Nutraceutical drinks Drinks with components or ingredients added to impart a specific medical or physiological benefit. In countries where nutraceutical products are legally defined, only these drinks are included. Does not include energy/sports drinks
Sports drinks Energy drinks that additionally provide a range of other nutrients (carbohydrates, key electrolytes) designed for easy absorption by the body during sports facilitating rehydration. Also known as isotonic drinks (e.g. Gatorade, Isostar). Does not include powdered variants
Source: Business Insights BUSINESS INSIGHTS
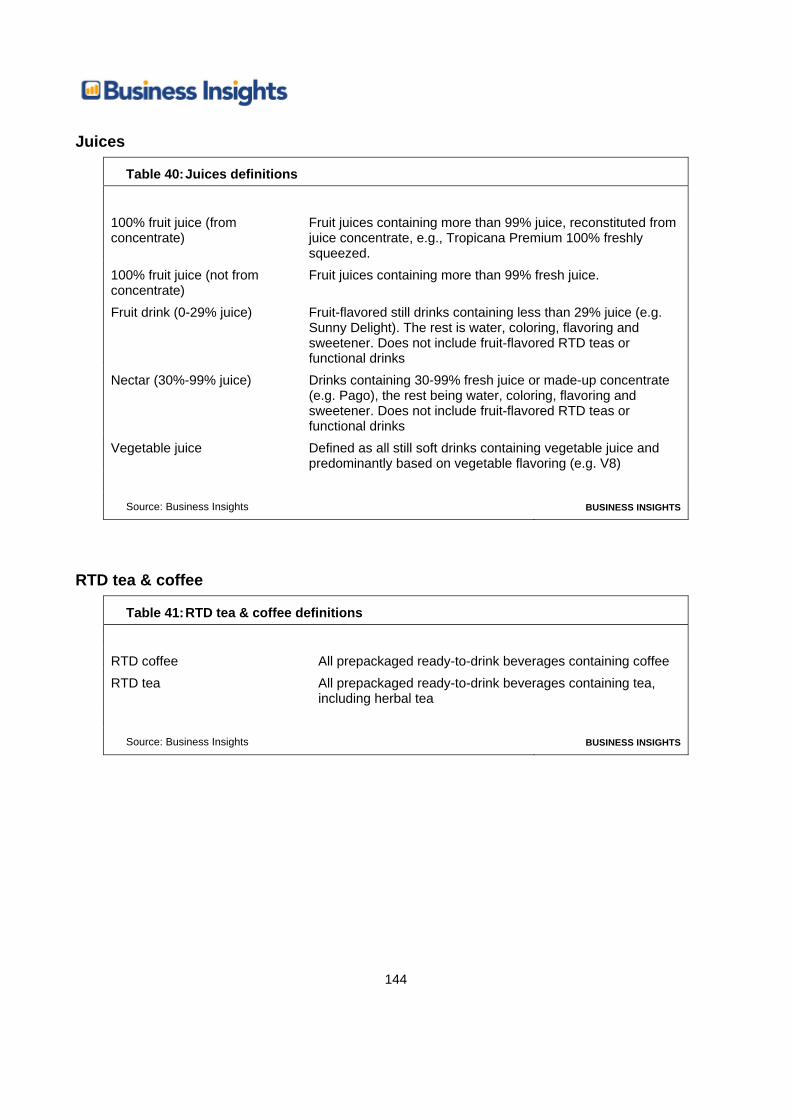
144
Juices
Table 40: Juices definitions
100% fruit juice (from concentrate)
Fruit juices containing more than 99% juice, reconstituted from juice concentrate, e.g., Tropicana Premium 100% freshly squeezed.
100% fruit juice (not from concentrate)
Fruit juices containing more than 99% fresh juice.
Fruit drink (0-29% juice) Fruit-flavored still drinks containing less than 29% juice (e.g. Sunny Delight). The rest is water, coloring, flavoring and sweetener. Does not include fruit-flavored RTD teas or functional drinks
Nectar (30%-99% juice) Drinks containing 30-99% fresh juice or made-up concentrate (e.g. Pago), the rest being water, coloring, flavoring and sweetener. Does not include fruit-flavored RTD teas or functional drinks
Vegetable juice Defined as all still soft drinks containing vegetable juice and predominantly based on vegetable flavoring (e.g. V8)
Source: Business Insights BUSINESS INSIGHTS
RTD tea & coffee
Table 41: RTD tea & coffee definitions
RTD coffee All prepackaged ready-to-drink beverages containing coffee RTD tea All prepackaged ready-to-drink beverages containing tea,
including herbal tea
Source: Business Insights BUSINESS INSIGHTS
145
Smoothies
Table 42: Smoothies definitions
Dairy-based Drinks based on a blend of juices with dairy products (milk or
yogurt) often associated with dieting and exercise regimes. Can be still or carbonated. Excludes nutraceutical drinks. Eg. Yoplait Light Strawberry Banana Smoothie
Fruit-based Drinks based on a blend of whole crushed fruit concentrates and pure juice without any dairy products (milk or yogurt). Can be still or carbonated. Excludes nutraceutical drinks. Eg Innocent Apple and Blackcurrant smoothie
Source: Business Insights BUSINESS INSIGHTS
Methodology Research for this report was based on the following sources:
In-house databases: Business Insights maintains in-house databases covering retail sales of consumer
packaged goods across leading markets globally. These databases were used to source data on
potential market and category sizing.
Product Launch Analytics: PLA is the world's largest online database of consumer products, with over
two decades of global new product information on over 145 categories. PLA was used to derive
company and category launch information by tags and to source product case studies. All 2011 year-to-
date data is current up to November 30, 2011.
Primary & secondary research: The author consulted hundreds of publicly available and proprietary
online and offline sources whilst researching this report, and conducted informal interviews with drinks
industry experts.
Related Documents