53 Chapter – 2 GROWTH OF FINANCIAL DERIVATIVES IN INDIA

Welcome message from author
This document is posted to help you gain knowledge. Please leave a comment to let me know what you think about it! Share it to your friends and learn new things together.
Transcript

53
Chapter – 2
GROWTH OF FINANCIAL
DERIVATIVES IN INDIA
54
Since the introduction of financial derivatives in India in June 2000, there
is a phenomenal growth in Derivatives in terms of both value and volume of
traded contracts and the stock markets are becoming informationally efficient.
This chapter presents the growth and development of Financial Derivatives in
India in terms of turnover and number of contracts traded in the derivatives
segment of the two premier stock exchanges in India NSE and BSE, growth of
turnover between cash and derivatives segments in NSE, growth of turnover and
number of contracts traded in different types of financial derivatives instruments
and growth of different financial derivative instruments in the top five exchanges
in the world. Besides, the chapter presents the regulatory framework for
derivative trading in India, classification of indices and stocks permitted for F&O
segment since the inception of derivatives in India. The data have been drawn
from websites of NSE, BSE, SEBI and World Federation of Exchanges.
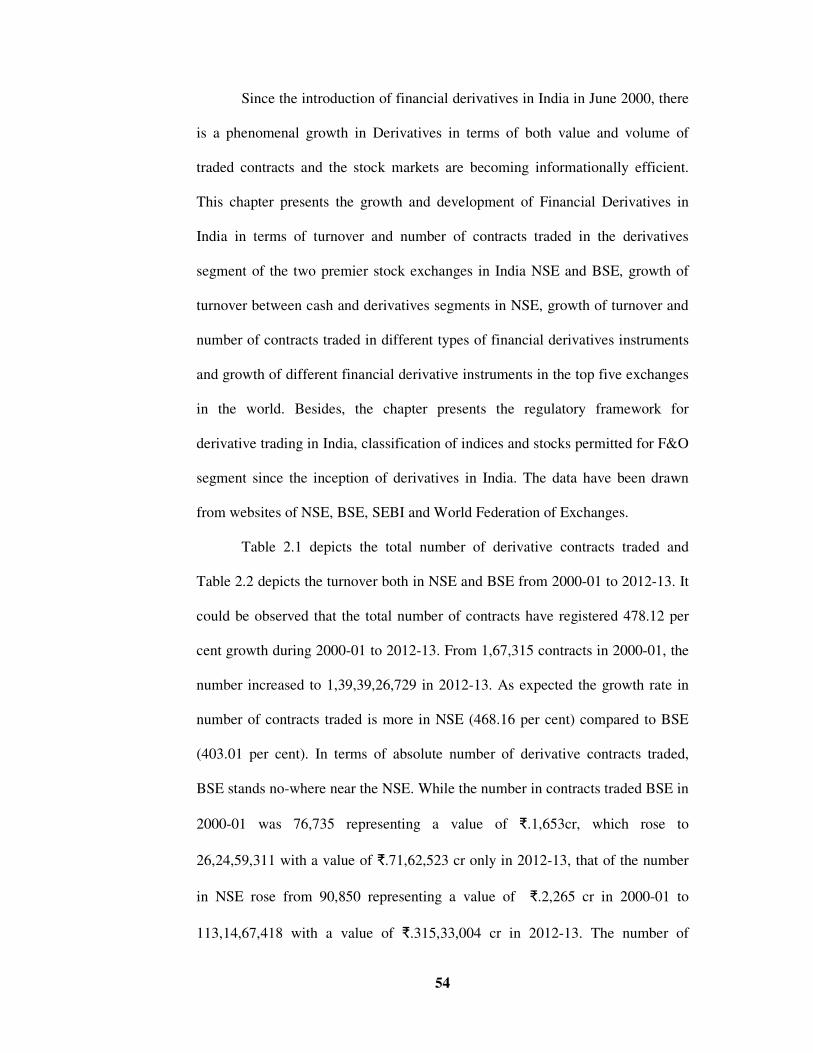
Table 2.1 depicts the total number of derivative contracts traded and
Table 2.2 depicts the turnover both in NSE and BSE from 2000-01 to 2012-13. It
could be observed that the total number of contracts have registered 478.12 per
cent growth during 2000-01 to 2012-13. From 1,67,315 contracts in 2000-01, the
number increased to 1,39,39,26,729 in 2012-13. As expected the growth rate in
number of contracts traded is more in NSE (468.16 per cent) compared to BSE
(403.01 per cent). In terms of absolute number of derivative contracts traded,
BSE stands no-where near the NSE. While the number in contracts traded BSE in
2000-01 was 76,735 representing a value of �.1,653cr, which rose to
26,24,59,311 with a value of �.71,62,523 cr only in 2012-13, that of the number
in NSE rose from 90,850 representing a value of �.2,265 cr in 2000-01 to
113,14,67,418 with a value of �.315,33,004 cr in 2012-13. The number of

55
derivatives contracts in these exchanges reached a milestone of 1,39,39,26,729 in
2013 since the inception of derivatives. These results are presented in Graph 2.1
and Graph 2.2
Table 2.1: Growth of Financial Derivatives in terms of No. of Contracts in
NSE and BSE
Year NSE BSE Total
2000–01 90,580
(54.14)
76,735
(45.86)
1,67,315
(100)
2001-02 41,96,873
(97.55)
1,05,607
(2.45)
43,02,480
(100)
2002-03 1,67,68,909
(99.18)
1,38,037
(0.82)
1,69,06,946
(100)
2003-04 5,68,86,776
(99.33)
3,82,258
(0.67)
5,72,69,034
(100)
2004-05 7,70,17,185
(99.31)
5,31,719
(0.69)
7,75,48,904
(100)
2005-06 15,76,19,271
(99.9999)
203
(0.0001)
15,76,19,474
(100)
2006-07 21,68,83,573
(99.19)
17,81,670
(0.81)
21,86,65,243
(100)
2007-08 42,50,13,200
(98.28)
74,53,371
(1.72)
43,24,66,571
(100)
2008-09 65,73,90,497
(99.92)
4,96,502
(0.08)
65,78,86,999
(100)
2009-10 67,92,93,922
(99.999)
9028
(0.001)
679302950
(100)
2010-11 1,03,42,12,062
(99.999)
5,623
(0.001)
1,03,42,17,685
(100)
2011-12 1,20,50,45,464
(97.40)
3,22,22,825
(2.60)
1,23,72,68,289
(100)
2012-13 1,13,14,67,418
(81.17)
26,24,59,311
(18.83)
1,39,39,26,729
(100)
CAGR 468.16 403.01 478.12
Source: Complied and calculated from the data taken from www.nseindia.com
CAGR: Cumulative Average Growth Rate
Graph 2.1: Percentage of growth in NSE and BSE (No of contracts)
Table 2.2: Growth of Financial Derivatives in terms of Turnover (
Year
2000–01
2001-02
2002-03
2003-04
2004-05
2005-06
2006-07
2007-08
2008-09
2009-10
2010-11
2011-12
2012-13
CAGR
Source: Complied and calculated from the data taken from
CAGR: Cumulative Average Growth Rate
0.00
20.00
40.00
60.00
80.00
100.00
Ra
te o
f G
row
th
Percentage of growth of No of Contract in NSE and BSE
56
Graph 2.1: Percentage of growth in NSE and BSE (No of contracts)
Table 2.2: Growth of Financial Derivatives in terms of Turnover (
NSE and BSE
NSE BSE Total
2,365
(60.36)
1,653
(41.14)
4,018
(100)
1,01,926
(98.15)
1,923
(1.85)
1,03,849
4,39,862
(99.44)
2,479
(0.56)
4,42,341
(100)
21,30,610
(99.46)
11,620
(0.54)
21,42,230
(100)
25,46,982
(99.33)
17,074
(0.67)
25,64,056
(100)
48,24,174
(99.9998)
8.77
(0.0002)
48,24,183
(100)
73,56,242
(99.20)
59,007
(0.80)
74,15,249
(100)
1,30,90,478
(98.18)
2,42,308
(1.82)
1,33,32,786
1,10,10,482
(99.89)
11,775
(0.11)
1,10,22,257
(100)
1,76,63,665
(99.9987)
234.13
(0.0013)
1,76,63,899
(100)
2,92,48,221
(99.9995)
154.00
(0.0005)
2,92,48,375
(100)
3,13,49,732
(97.49)
8,08,477
(2.51)
3,21,58,209
(100)
3,15,33,004
(81.49)
71,62,523
(18.51)
3,86,95,527
(100)
321.59 272.60 328.85
Source: Complied and calculated from the data taken from www.nseindia.com
CAGR: Cumulative Average Growth Rate
Time Period
Percentage of growth of No of Contract in NSE and BSE
Graph 2.1: Percentage of growth in NSE and BSE (No of contracts)
Table 2.2: Growth of Financial Derivatives in terms of Turnover (�. in Cr) in
Total
4,018
(100)
1,03,849
(100)
4,42,341
(100)
21,42,230
(100)
25,64,056
(100)
48,24,183
(100)
74,15,249
(100)
1,33,32,786
(100)
1,10,22,257
(100)
1,76,63,899
(100)
2,92,48,375
(100)
3,21,58,209
(100)
3,86,95,527
(100)
328.85
www.nseindia.com
Percentage of growth of No of Contract in NSE and BSE
NSE
BSE

Graph 2.2: Percentage of growth of turnover
Table 2.3 depicts the explosive growth of Derivative
introduction in Indian Capital Market
share of Derivative segment, which was just 0.18
2000-2001, increased to 92.09
turnover of Cash segment
2001 declined sharply to just 7.91
the total turnover has registered a substantial growth of 31
of 13 years, which could be mainly attributed to the growt
derivatives, which has registered a growth of 120.67
period. From the average daily turnover
shown the table, it is very clear that the daily average
ups and downs in the cash segment. From an average daily turnover of
in 2000-01 it rose to
registered a peak of
consistency in the average daily turnover in the cash segment. On the other
0.0010.0020.0030.0040.0050.0060.0070.0080.0090.00
100.00
Ra
te o
f G
row
th
Percentage of growth of turnover (
57
2.2: Percentage of growth of turnover (�.in Cr) in NSE and BSE
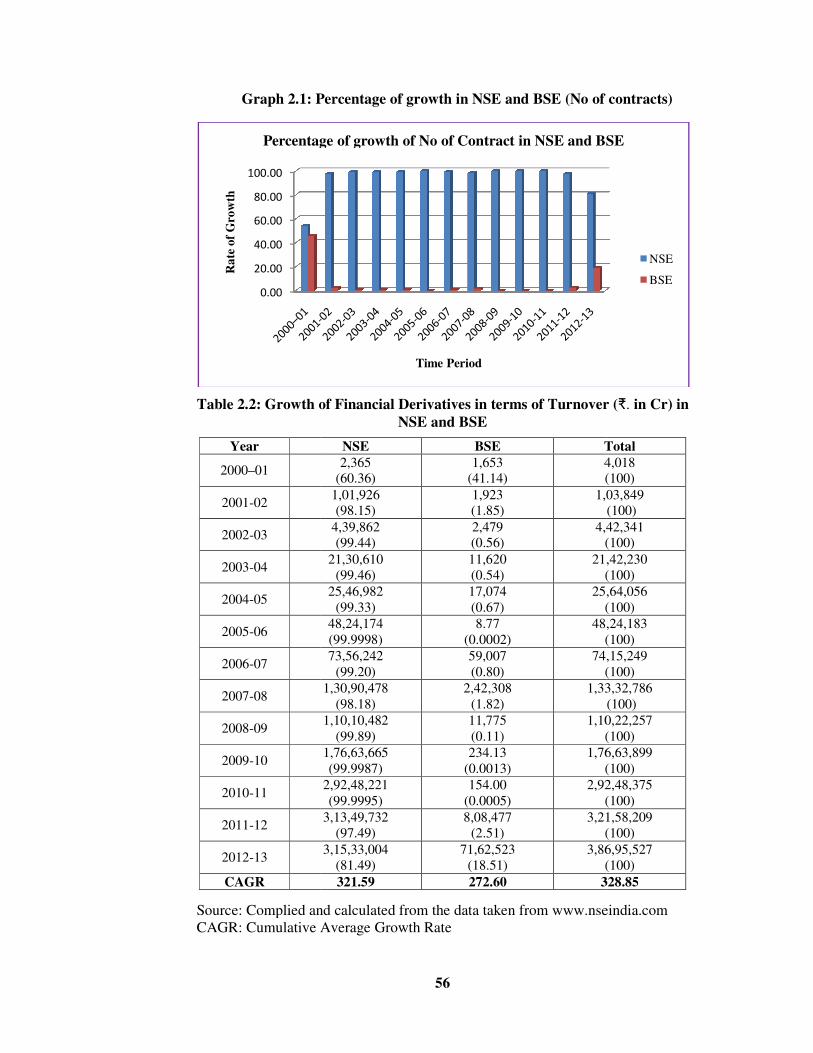
Table 2.3 depicts the explosive growth of Derivative segment
introduction in Indian Capital Market in comparison with Cash segment
share of Derivative segment, which was just 0.18 per cent of total turnover in
2001, increased to 92.09 per cent by 2012-2013. On the other
segment, which was 99.82 per cent in the total turnover in 2000
2001 declined sharply to just 7.91 per cent. An important observation here is that
the total turnover has registered a substantial growth of 31 per cent
of 13 years, which could be mainly attributed to the growth of turnover in
derivatives, which has registered a growth of 120.67 per cent during the same
From the average daily turnover in both cash and derivative
shown the table, it is very clear that the daily average turnover registered many
s and downs in the cash segment. From an average daily turnover of
01 it rose to �.10,833 cr by the end of the year 2012-13. But in between
registered a peak of �.16,959 cr in 2009-10. In other words,
consistency in the average daily turnover in the cash segment. On the other
Time Period
Percentage of growth of turnover (�. in Cr) in NSE and
BSE
in Cr) in NSE and BSE
egment since their
segment. The
of total turnover in
other hand the
in the total turnover in 2000-
. An important observation here is that
over a period
h of turnover in
during the same
in both cash and derivative segments
registered many
s and downs in the cash segment. From an average daily turnover of �.5,337 cr
13. But in between
there is no-
consistency in the average daily turnover in the cash segment. On the other hand,
in Cr) in NSE and
NSE
BSE
58
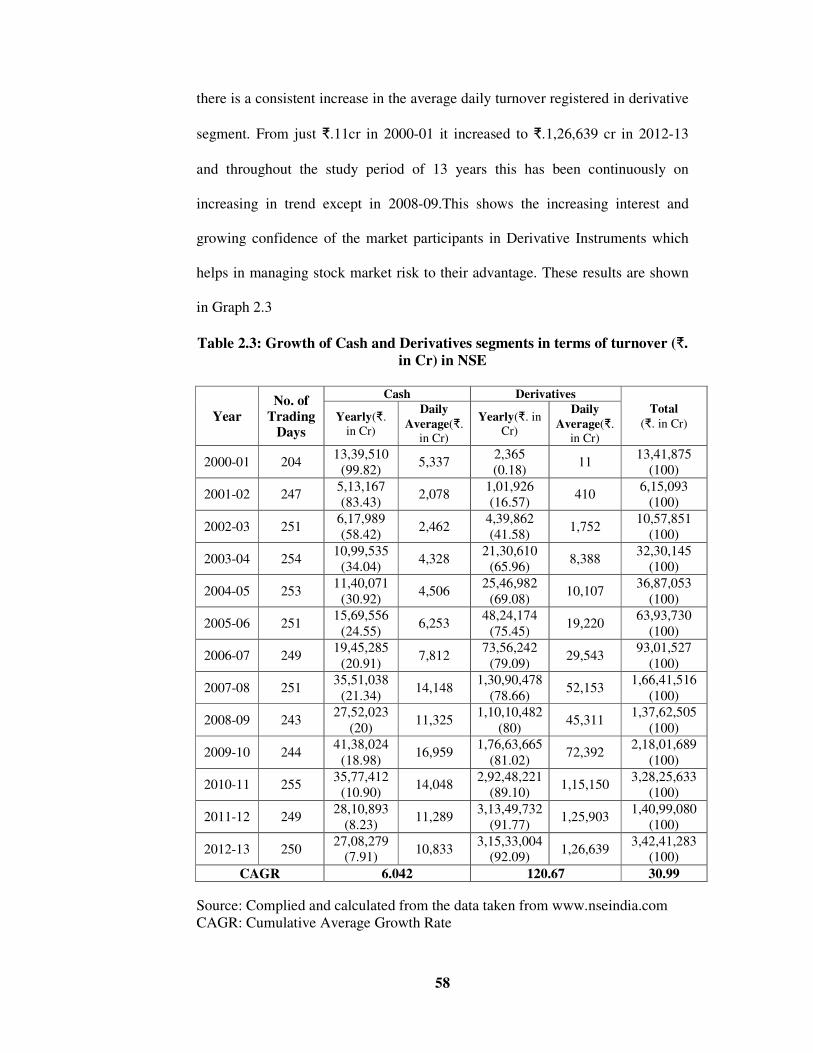
there is a consistent increase in the average daily turnover registered in derivative
segment. From just �.11cr in 2000-01 it increased to �.1,26,639 cr in 2012-13
and throughout the study period of 13 years this has been continuously on
increasing in trend except in 2008-09.This shows the increasing interest and
growing confidence of the market participants in Derivative Instruments which
helps in managing stock market risk to their advantage. These results are shown
in Graph 2.3
Table 2.3: Growth of Cash and Derivatives segments in terms of turnover (�.
in Cr) in NSE
Year
No. of
Trading
Days
Cash Derivatives
Total
(�. in Cr) Yearly(�.
in Cr)
Daily
Average(�.
in Cr)
Yearly(�. in
Cr)
Daily
Average(�.
in Cr)
2000-01 204 13,39,510
(99.82) 5,337
2,365
(0.18) 11
13,41,875
(100)
2001-02 247 5,13,167
(83.43) 2,078
1,01,926
(16.57) 410
6,15,093
(100)
2002-03 251 6,17,989
(58.42) 2,462
4,39,862
(41.58) 1,752
10,57,851
(100)
2003-04 254 10,99,535
(34.04) 4,328
21,30,610
(65.96) 8,388
32,30,145
(100)
2004-05 253 11,40,071
(30.92) 4,506
25,46,982
(69.08) 10,107
36,87,053
(100)
2005-06 251 15,69,556
(24.55) 6,253
48,24,174
(75.45) 19,220
63,93,730
(100)
2006-07 249 19,45,285
(20.91) 7,812
73,56,242
(79.09) 29,543
93,01,527
(100)
2007-08 251 35,51,038
(21.34) 14,148
1,30,90,478
(78.66) 52,153
1,66,41,516
(100)
2008-09 243 27,52,023
(20) 11,325
1,10,10,482
(80) 45,311
1,37,62,505
(100)
2009-10 244 41,38,024
(18.98) 16,959
1,76,63,665
(81.02) 72,392
2,18,01,689
(100)
2010-11 255 35,77,412
(10.90) 14,048
2,92,48,221
(89.10) 1,15,150
3,28,25,633
(100)
2011-12 249 28,10,893
(8.23) 11,289
3,13,49,732
(91.77) 1,25,903
1,40,99,080
(100)
2012-13 250 27,08,279
(7.91) 10,833
3,15,33,004
(92.09) 1,26,639
3,42,41,283
(100)
CAGR 6.042 120.67 30.99
Source: Complied and calculated from the data taken from www.nseindia.com
CAGR: Cumulative Average Growth Rate

59
Graph 2.3: Percentage of growth of turnover in Cash and Derivatives
segments
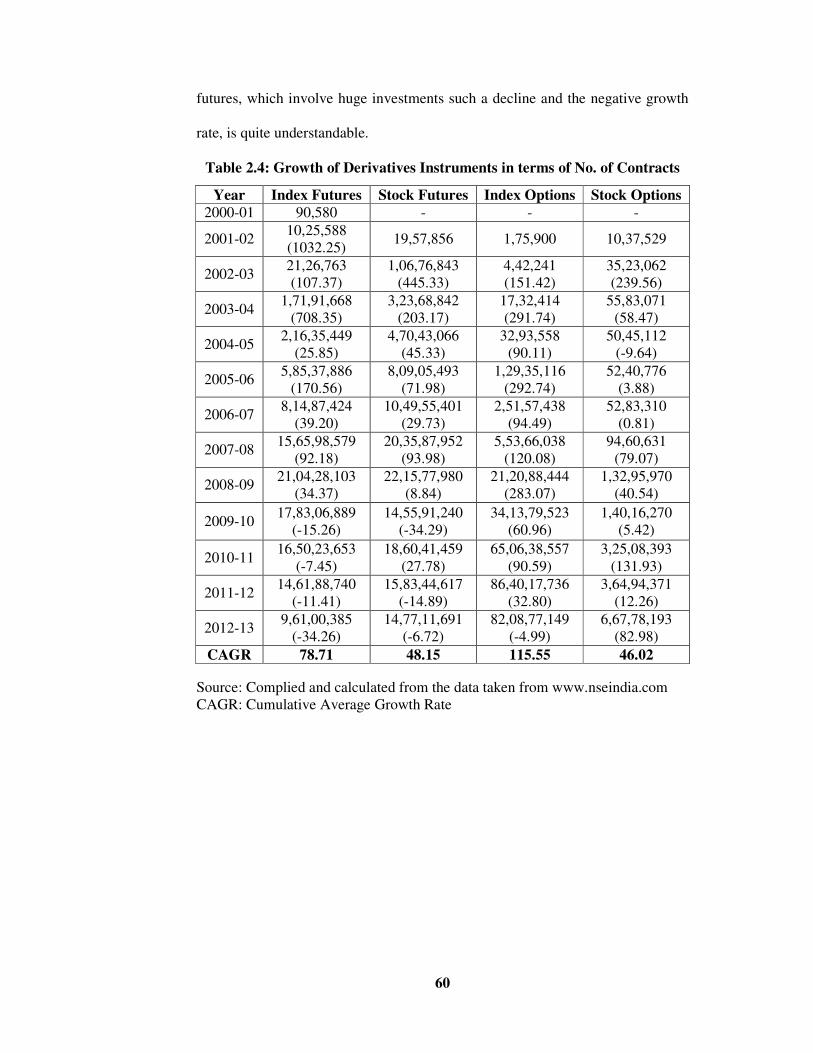
Table 2.4 and 2.5 depicts the growth in number of contracts traded and
turnover for the four major derivative instruments which are also the instruments
covered under the present study – Index Futures, Stock Futures, Index Options
and Stock Options. Instrument-wise, it is observed that stock options have
registered the highest growth rate in 2012-13, in terms of number of contracts and
turnover. The growth rate in this instrument was 82.98 per cent and 104.75 per
cent respectively. The lowest growth rate was registered in Index Futures. In fact,
the growth rate in this instrument started registering negative trend in terms of
number of contracts traded from 2009-10 in which year the growth rate was -
15.26 per cent and by the end of the study period it came down to -34.26 per cent.
In terms of turnover, the negative growth rate registered in this instrument was -
29.37 per cent in 2012-13. Futures being binding contracts and especially Index
0.00
20.00
40.00
60.00
80.00
100.00
120.00R
ate
of
Gro
wth
Time Period
Growth of Cash and Derivatives markets
Cash Market Derivatives Market
60
futures, which involve huge investments such a decline and the negative growth
rate, is quite understandable.
Table 2.4: Growth of Derivatives Instruments in terms of No. of Contracts
Year Index Futures Stock Futures Index Options Stock Options
2000-01 90,580 - - -
2001-02 10,25,588
(1032.25) 19,57,856 1,75,900 10,37,529
2002-03 21,26,763
(107.37)
1,06,76,843
(445.33)
4,42,241
(151.42)
35,23,062
(239.56)
2003-04 1,71,91,668
(708.35)
3,23,68,842
(203.17)
17,32,414
(291.74)
55,83,071
(58.47)
2004-05 2,16,35,449
(25.85)
4,70,43,066
(45.33)
32,93,558
(90.11)
50,45,112
(-9.64)
2005-06 5,85,37,886
(170.56)
8,09,05,493
(71.98)
1,29,35,116
(292.74)
52,40,776
(3.88)
2006-07 8,14,87,424
(39.20)
10,49,55,401
(29.73)
2,51,57,438
(94.49)
52,83,310
(0.81)
2007-08 15,65,98,579
(92.18)
20,35,87,952
(93.98)
5,53,66,038
(120.08)
94,60,631
(79.07)
2008-09 21,04,28,103
(34.37)
22,15,77,980
(8.84)
21,20,88,444
(283.07)
1,32,95,970
(40.54)
2009-10 17,83,06,889
(-15.26)
14,55,91,240
(-34.29)
34,13,79,523
(60.96)
1,40,16,270
(5.42)
2010-11 16,50,23,653
(-7.45)
18,60,41,459
(27.78)
65,06,38,557
(90.59)
3,25,08,393
(131.93)
2011-12 14,61,88,740
(-11.41)
15,83,44,617
(-14.89)
86,40,17,736
(32.80)
3,64,94,371
(12.26)
2012-13 9,61,00,385
(-34.26)
14,77,11,691
(-6.72)
82,08,77,149
(-4.99)
6,67,78,193
(82.98)
CAGR 78.71 48.15 115.55 46.02
Source: Complied and calculated from the data taken from www.nseindia.com
CAGR: Cumulative Average Growth Rate

Graph 2.4: Percentage of Growth of Four Instruments in number of
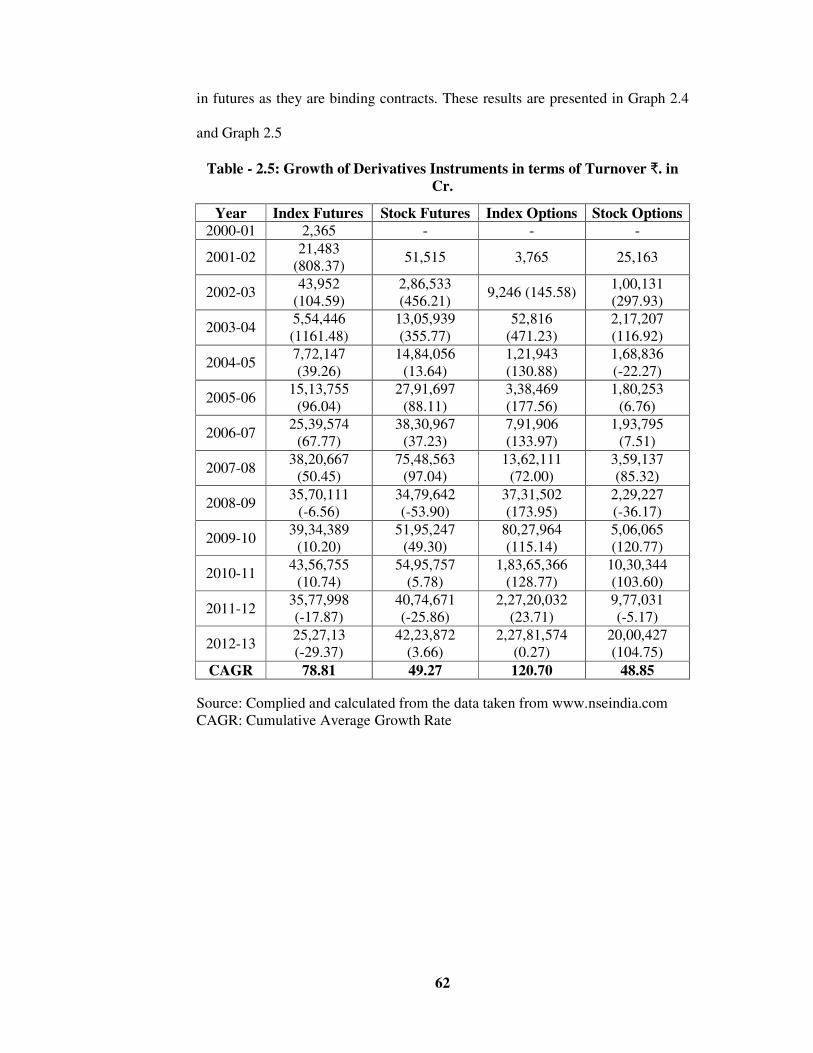
Category-wise, the growth in options was higher than the growth in
Futures. While the growth rate in Index Options and Stock Options was 115.55
and 46.02 and 120.70 and 48.85 in terms of number of contracts traded and
turnover, the growth rate in Index futures and
and 78.81 and 49.27 in terms of number of contracts traded and turnover
respectively. Thus, the trading activity and frequency was found to be more in
options than in futures.
Another important observation is that in opti
have dominated the stock options in both number and value of contracts. But, in
futures, stock futures have dominated the Index futures. This is quite
understandable because by nature options contracts does not involve any
obligation and hence Index options
unexercised when it is not advantageous to the holder. This leverage is not there
-200
0
200
400
600
800
1000
1200
20
00
-01
20
01
-02
Ra
te o
f g
row
th
Percentage of growth of Four Instruments in terms of No of
61
Graph 2.4: Percentage of Growth of Four Instruments in number of
Contracts in NSE
wise, the growth in options was higher than the growth in
Futures. While the growth rate in Index Options and Stock Options was 115.55
and 46.02 and 120.70 and 48.85 in terms of number of contracts traded and
turnover, the growth rate in Index futures and stock futures was 78.71 and 48.15
and 78.81 and 49.27 in terms of number of contracts traded and turnover
respectively. Thus, the trading activity and frequency was found to be more in
futures.
Another important observation is that in options category Index Options
have dominated the stock options in both number and value of contracts. But, in
futures, stock futures have dominated the Index futures. This is quite
understandable because by nature options contracts does not involve any
tion and hence Index options which involve huge investments can be left
unexercised when it is not advantageous to the holder. This leverage is not there
20
02
-03
20
03
-04
20
04
-05
20
05
-06
20
06
-07
20
07
-08
20
08
-09
20
09
-10
20
10
-11
20
11
-12
20
12
-13
Time Period
Percentage of growth of Four Instruments in terms of No of
contracts in NSE
Index Futures
Stock Futures
Index Options
Stock Options
Graph 2.4: Percentage of Growth of Four Instruments in number of
wise, the growth in options was higher than the growth in
Futures. While the growth rate in Index Options and Stock Options was 115.55
and 46.02 and 120.70 and 48.85 in terms of number of contracts traded and
stock futures was 78.71 and 48.15
and 78.81 and 49.27 in terms of number of contracts traded and turnover
respectively. Thus, the trading activity and frequency was found to be more in
ons category Index Options
have dominated the stock options in both number and value of contracts. But, in
futures, stock futures have dominated the Index futures. This is quite
understandable because by nature options contracts does not involve any
which involve huge investments can be left
unexercised when it is not advantageous to the holder. This leverage is not there
Percentage of growth of Four Instruments in terms of No of
Index Futures
Stock Futures
Index Options
Stock Options
62
in futures as they are binding contracts. These results are presented in Graph 2.4
and Graph 2.5
Table - 2.5: Growth of Derivatives Instruments in terms of Turnover �. in
Cr.
Year Index Futures Stock Futures Index Options Stock Options
2000-01 2,365 - - -
2001-02 21,483
(808.37) 51,515 3,765 25,163
2002-03 43,952
(104.59)
2,86,533
(456.21) 9,246 (145.58)
1,00,131
(297.93)
2003-04 5,54,446
(1161.48)
13,05,939
(355.77)
52,816
(471.23)
2,17,207
(116.92)
2004-05 7,72,147
(39.26)
14,84,056
(13.64)
1,21,943
(130.88)
1,68,836
(-22.27)
2005-06 15,13,755
(96.04)
27,91,697
(88.11)
3,38,469
(177.56)
1,80,253
(6.76)
2006-07 25,39,574
(67.77)
38,30,967
(37.23)
7,91,906
(133.97)
1,93,795
(7.51)
2007-08 38,20,667
(50.45)
75,48,563
(97.04)
13,62,111
(72.00)
3,59,137
(85.32)
2008-09 35,70,111
(-6.56)
34,79,642
(-53.90)
37,31,502
(173.95)
2,29,227
(-36.17)
2009-10 39,34,389
(10.20)
51,95,247
(49.30)
80,27,964
(115.14)
5,06,065
(120.77)
2010-11 43,56,755
(10.74)
54,95,757
(5.78)
1,83,65,366
(128.77)
10,30,344
(103.60)
2011-12 35,77,998
(-17.87)
40,74,671
(-25.86)
2,27,20,032
(23.71)
9,77,031
(-5.17)
2012-13 25,27,13
(-29.37)
42,23,872
(3.66)
2,27,81,574
(0.27)
20,00,427
(104.75)
CAGR 78.81 49.27 120.70 48.85
Source: Complied and calculated from the data taken from www.nseindia.com
CAGR: Cumulative Average Growth Rate

Graph2.5: Percentage of Growth of Four Instruments in terms of Turnover
Graph 2.6 shows an overview of the share of four derivative instruments
covered in the present study in terms of Turnover from the year of their inception
till 2012-13. It is clear from the graph that Index option
derivative instrument
Index Futures (18%
derivative instrument
futures from the point of view of the buyer (call or put) as
Hence, they have become
-200
0
200
400
600
800
1000
1200
20
00
-01
20
01
-02
Ra
te o
f g
row
th
Percentage of Growth of Four Instruments in terms of
63
Percentage of Growth of Four Instruments in terms of Turnover
(�. in Cr)
Graph 2.6 shows an overview of the share of four derivative instruments
in the present study in terms of Turnover from the year of their inception
13. It is clear from the graph that Index option is the
derivative instrument with 52 per cent share followed by stock futures (26%),
Index Futures (18%).Stock options with four per cent are the least preferred
derivative instruments. As stated earlier, by nature options have an
futures from the point of view of the buyer (call or put) as they are not obligatory.
have become the popular derivative instruments among the investors.
20
02
-03
20
03
-04
20
04
-05
20
05
-06
20
06
-07
20
07
-08
20
08
-09
20
09
-10
20
10
-11
20
11
-12
20
12
-13
Time Period
Percentage of Growth of Four Instruments in terms of
Turnover in NSE
Index Futures
Stock Futures
Index Options
Stock Options
Percentage of Growth of Four Instruments in terms of Turnover
Graph 2.6 shows an overview of the share of four derivative instruments
in the present study in terms of Turnover from the year of their inception
the dominating
with 52 per cent share followed by stock futures (26%),
per cent are the least preferred
edge over the
are not obligatory.
the popular derivative instruments among the investors.
Percentage of Growth of Four Instruments in terms of
Index Futures
Stock Futures
Index Options
Stock Options

Graph 2.6: Share of Derivatives Instruments in Turnover (
Source:compiledfrom the data taken from
Table 2.6 exhibits the data on the role of National Stock Exchange vis
vis the top five derivative exchanges in the world in terms of contracts traded
(volume of transactions) in options and futures category. In the Index Options
segment, the National Stock Exchange has occupied the second position in the
world with 820 million contracts traded in 2012. Korean exchange was in the first
position with 1575 million contracts. In the stock options segment, NSE is not
figured in the top five e
Stock Exchange occupied fourth and fifth positions in stock and Index futures
respectively. Surprisingly the three instruments in which the NSE figured in the
top five exchanges in the world,
compared to the previous year.
Index Options
52%
Share of Derivatives Instruments in Turnover (
over the years from 2000
64
Share of Derivatives Instruments in Turnover (�. in Cr.) over the
years from 2000-01 to 2012-13
compiledfrom the data taken from www.nseindia.com
Table 2.6 exhibits the data on the role of National Stock Exchange vis
derivative exchanges in the world in terms of contracts traded
(volume of transactions) in options and futures category. In the Index Options
, the National Stock Exchange has occupied the second position in the
world with 820 million contracts traded in 2012. Korean exchange was in the first
position with 1575 million contracts. In the stock options segment, NSE is not
figured in the top five exchanges in the world. In the Futures category, National
Stock Exchange occupied fourth and fifth positions in stock and Index futures
respectively. Surprisingly the three instruments in which the NSE figured in the
top five exchanges in the world, there is decline in number of contracts traded
compared to the previous year.
Index Futures
18%
Stock Futures
26%
Index Options
Stock Options
4%
Share of Derivatives Instruments in Turnover (�. in Cr.)
over the years from 2000-01 to 2012-13
in Cr.) over the
Table 2.6 exhibits the data on the role of National Stock Exchange vis-à-
derivative exchanges in the world in terms of contracts traded
(volume of transactions) in options and futures category. In the Index Options
, the National Stock Exchange has occupied the second position in the
world with 820 million contracts traded in 2012. Korean exchange was in the first
position with 1575 million contracts. In the stock options segment, NSE is not
xchanges in the world. In the Futures category, National
Stock Exchange occupied fourth and fifth positions in stock and Index futures
respectively. Surprisingly the three instruments in which the NSE figured in the
number of contracts traded
Stock Futures
in Cr.)

65
Table 2.6: Status of National Stock Exchange in the top 5 Derivative
Exchanges in the World (Instrument-wise)
Top 5 Exchanges by number of Index option contracts traded in 2012 (in
million)
Rank Exchange 2012
(inmilns)
2012/2011 growth
rate (in %)
1 Korea Exchange 1575 -57.10
2 National Stock Exchange India 820 -5.90
3 EUREX 383 -18.30
4 Chicago Board Options Exchange 304 -5.00
5 Bombay Stock Exchange 235 0.00
Top 5 Exchanges by number of Stock Future contracts traded in 2012
(in millions)
1 NYSE Liffe Europe 247 -1.60
2 MICEX / RTS 241 -33.40
3 EUREX 196 12.60
4 National Stock Exchange India 153 -4.80
5 Korea Exchange 100 67.60
Top 5 Exchanges by number of Index futures contracts traded in 2012
(in millions)
1 CME Group 588 -20.00
2 EUREX 384 -21.10
3 MICEX / RTS 323 -15.40
4 Osaka SE 150 9.30
5 National Stock Exchange India 112 -27.90
Top 5 Exchanges by number of Stock Option contracts traded in 2012
(in millions)
1 BM&FBOVESPA 929 10.90
2 NASDAQ OMX (US) 639 -8.80
3 NYSE Euronext (US) 595 -6.20
4 Chicago Board Options Exchange 494 -4.20
5 International Securities Exchange 457 6.00
Source: WFE Market Highlights 2012 from www.world-exchanges.org
66
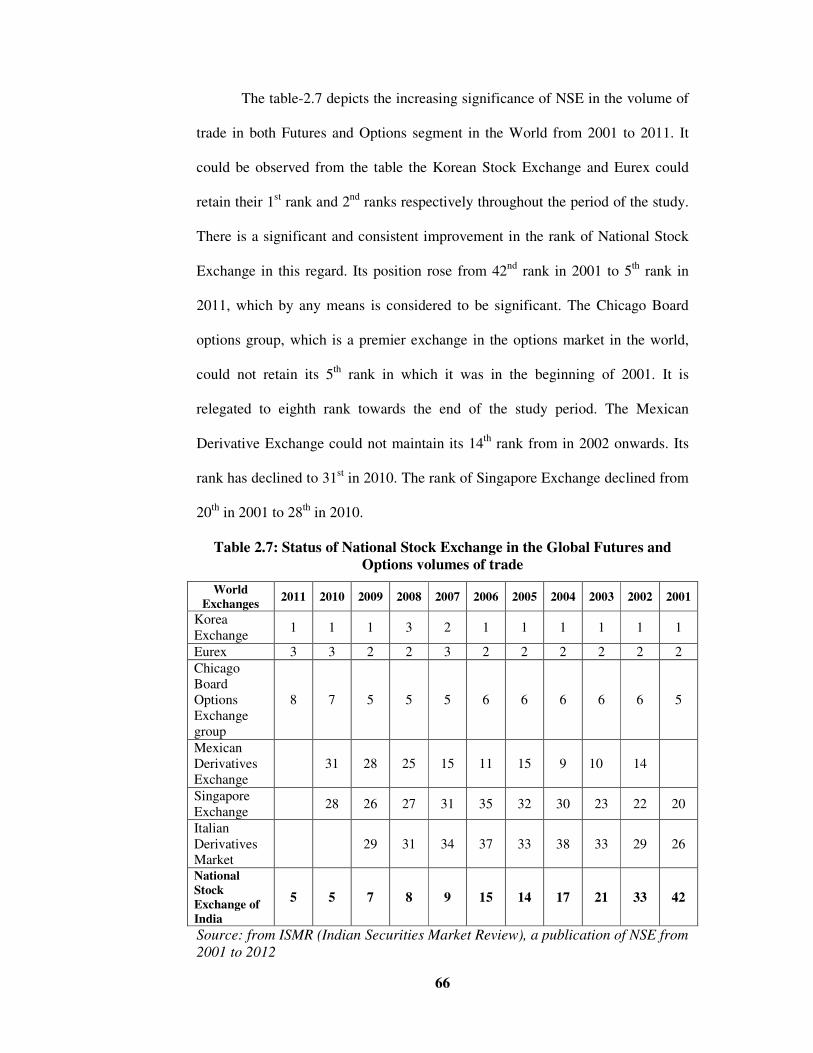
The table-2.7 depicts the increasing significance of NSE in the volume of
trade in both Futures and Options segment in the World from 2001 to 2011. It
could be observed from the table the Korean Stock Exchange and Eurex could
retain their 1st rank and 2
nd ranks respectively throughout the period of the study.
There is a significant and consistent improvement in the rank of National Stock
Exchange in this regard. Its position rose from 42nd
rank in 2001 to 5th
rank in
2011, which by any means is considered to be significant. The Chicago Board
options group, which is a premier exchange in the options market in the world,
could not retain its 5th
rank in which it was in the beginning of 2001. It is
relegated to eighth rank towards the end of the study period. The Mexican
Derivative Exchange could not maintain its 14th
rank from in 2002 onwards. Its
rank has declined to 31st in 2010. The rank of Singapore Exchange declined from
20th
in 2001 to 28th
in 2010.
Table 2.7: Status of National Stock Exchange in the Global Futures and
Options volumes of trade
World
Exchanges 2011 2010 2009 2008 2007 2006 2005 2004 2003 2002 2001
Korea
Exchange 1 1 1 3 2 1 1 1 1 1 1
Eurex 3 3 2 2 3 2 2 2 2 2 2
Chicago
Board
Options
Exchange
group
8 7 5 5 5 6 6 6 6 6 5
Mexican
Derivatives
Exchange
31 28 25 15 11 15 9 10 14
Singapore
Exchange 28 26 27 31 35 32 30 23 22 20
Italian
Derivatives
Market
29 31 34 37 33 38 33 29 26
National
Stock
Exchange of
India
5 5 7 8 9 15 14 17 21 33 42
Source: from ISMR (Indian Securities Market Review), a publication of NSE from
2001 to 2012
67
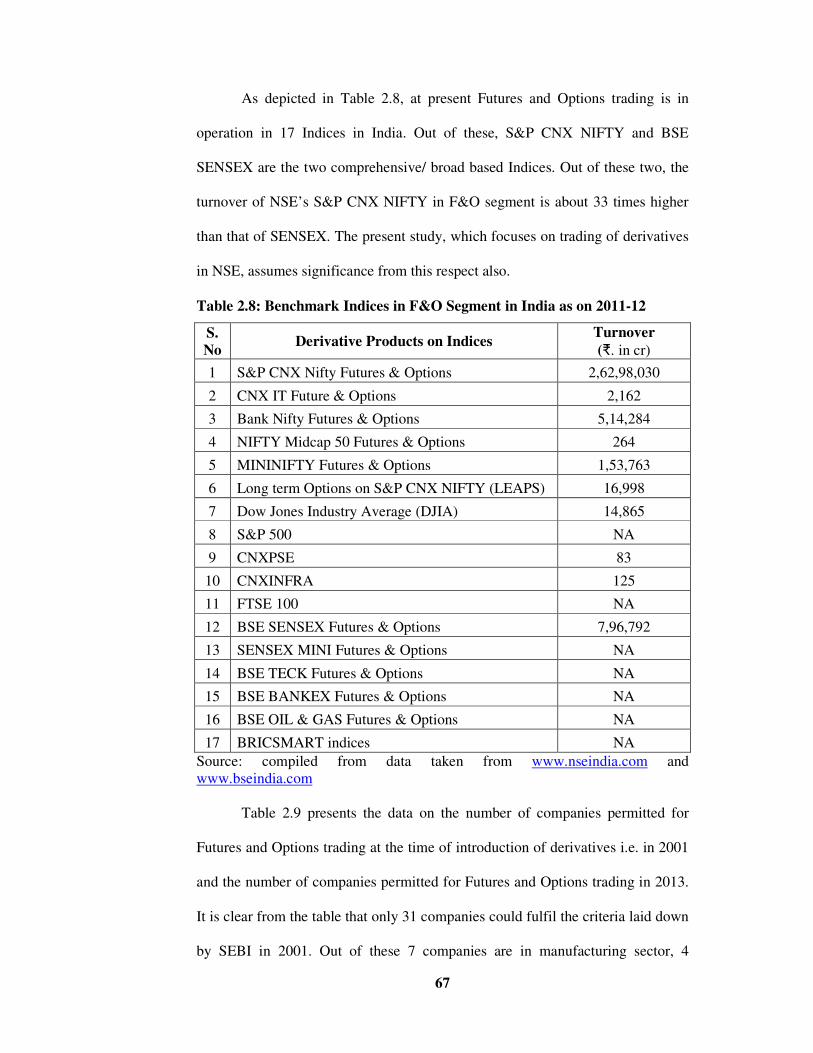
As depicted in Table 2.8, at present Futures and Options trading is in
operation in 17 Indices in India. Out of these, S&P CNX NIFTY and BSE
SENSEX are the two comprehensive/ broad based Indices. Out of these two, the
turnover of NSE’s S&P CNX NIFTY in F&O segment is about 33 times higher
than that of SENSEX. The present study, which focuses on trading of derivatives
in NSE, assumes significance from this respect also.
Table 2.8: Benchmark Indices in F&O Segment in India as on 2011-12
S.
No Derivative Products on Indices
Turnover
(�. in cr)
1 S&P CNX Nifty Futures & Options 2,62,98,030
2 CNX IT Future & Options 2,162
3 Bank Nifty Futures & Options 5,14,284
4 NIFTY Midcap 50 Futures & Options 264
5 MININIFTY Futures & Options 1,53,763
6 Long term Options on S&P CNX NIFTY (LEAPS) 16,998
7 Dow Jones Industry Average (DJIA) 14,865
8 S&P 500 NA
9 CNXPSE 83
10 CNXINFRA 125
11 FTSE 100 NA
12 BSE SENSEX Futures & Options 7,96,792
13 SENSEX MINI Futures & Options NA
14 BSE TECK Futures & Options NA
15 BSE BANKEX Futures & Options NA
16 BSE OIL & GAS Futures & Options NA
17 BRICSMART indices NA
Source: compiled from data taken from www.nseindia.com and
www.bseindia.com
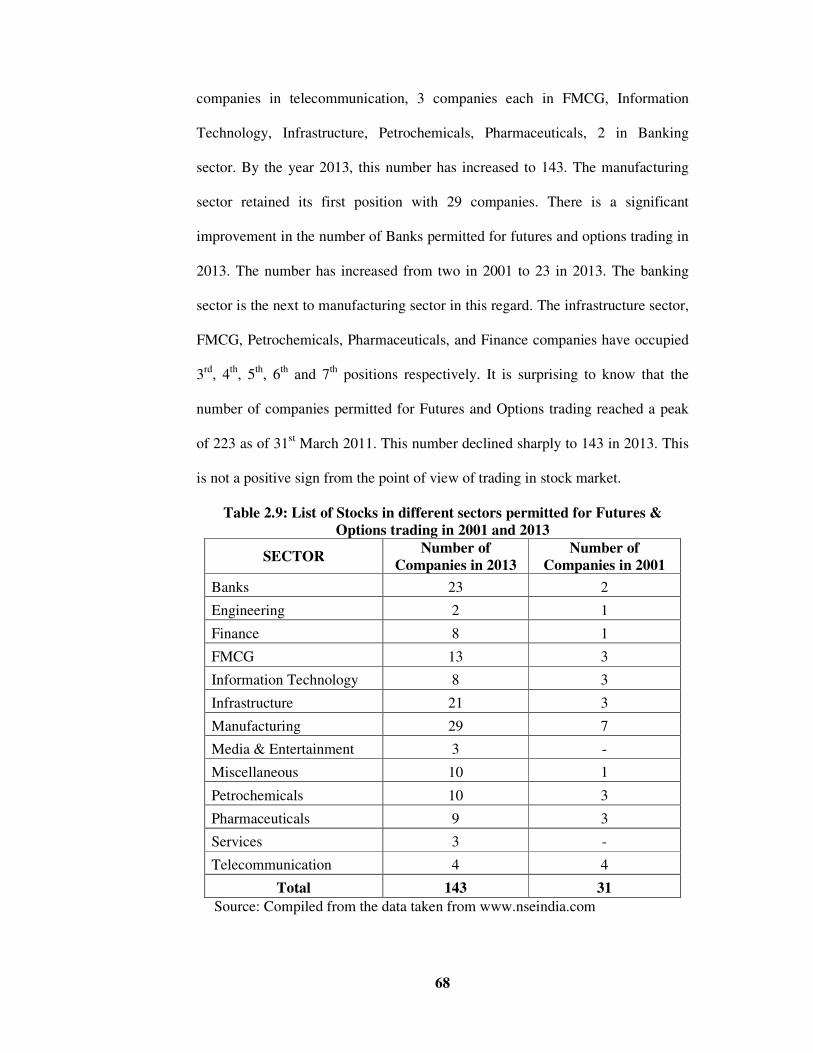
Table 2.9 presents the data on the number of companies permitted for
Futures and Options trading at the time of introduction of derivatives i.e. in 2001
and the number of companies permitted for Futures and Options trading in 2013.
It is clear from the table that only 31 companies could fulfil the criteria laid down
by SEBI in 2001. Out of these 7 companies are in manufacturing sector, 4
68
companies in telecommunication, 3 companies each in FMCG, Information
Technology, Infrastructure, Petrochemicals, Pharmaceuticals, 2 in Banking
sector. By the year 2013, this number has increased to 143. The manufacturing
sector retained its first position with 29 companies. There is a significant
improvement in the number of Banks permitted for futures and options trading in
2013. The number has increased from two in 2001 to 23 in 2013. The banking
sector is the next to manufacturing sector in this regard. The infrastructure sector,
FMCG, Petrochemicals, Pharmaceuticals, and Finance companies have occupied
3rd
, 4th
, 5th
, 6th
and 7th
positions respectively. It is surprising to know that the
number of companies permitted for Futures and Options trading reached a peak
of 223 as of 31st March 2011. This number declined sharply to 143 in 2013. This
is not a positive sign from the point of view of trading in stock market.
Table 2.9: List of Stocks in different sectors permitted for Futures &
Options trading in 2001 and 2013
SECTOR Number of
Companies in 2013
Number of
Companies in 2001
Banks 23 2
Engineering 2 1
Finance 8 1
FMCG 13 3
Information Technology 8 3
Infrastructure 21 3
Manufacturing 29 7
Media & Entertainment 3 -
Miscellaneous 10 1
Petrochemicals 10 3
Pharmaceuticals 9 3
Services 3 -
Telecommunication 4 4
Total 143 31
Source: Compiled from the data taken from www.nseindia.com
69
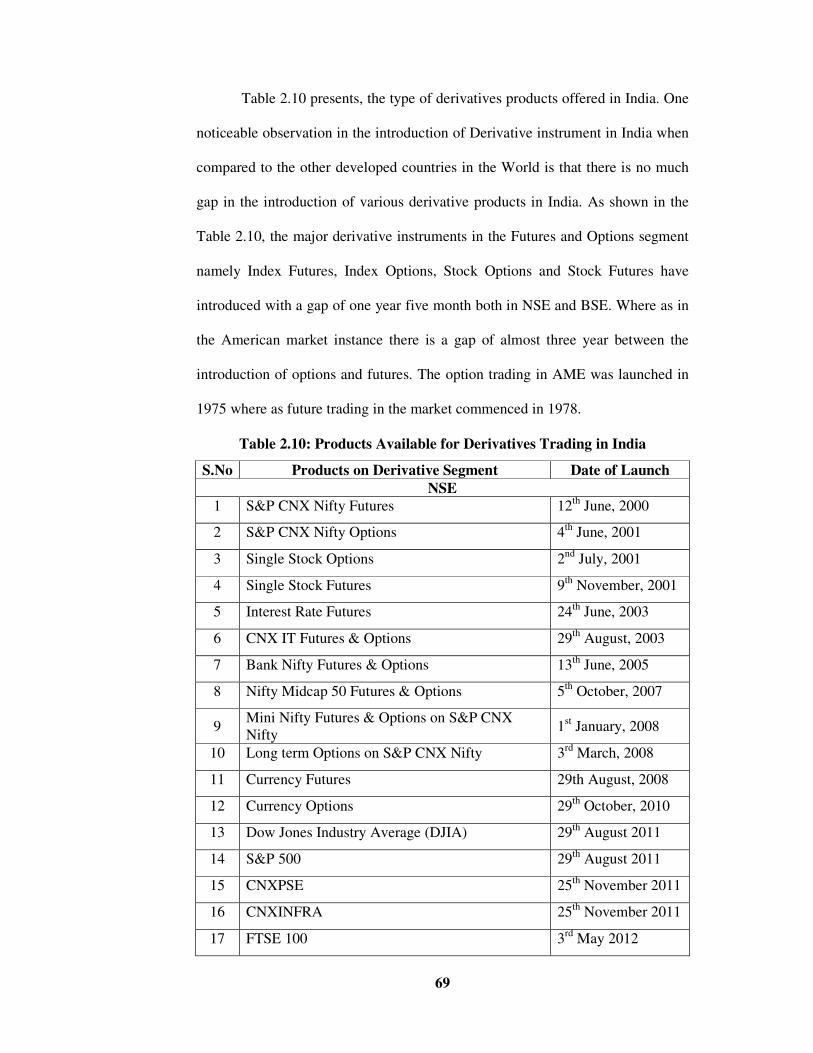
Table 2.10 presents, the type of derivatives products offered in India. One
noticeable observation in the introduction of Derivative instrument in India when
compared to the other developed countries in the World is that there is no much
gap in the introduction of various derivative products in India. As shown in the
Table 2.10, the major derivative instruments in the Futures and Options segment
namely Index Futures, Index Options, Stock Options and Stock Futures have
introduced with a gap of one year five month both in NSE and BSE. Where as in
the American market instance there is a gap of almost three year between the
introduction of options and futures. The option trading in AME was launched in
1975 where as future trading in the market commenced in 1978.
Table 2.10: Products Available for Derivatives Trading in India
S.No Products on Derivative Segment Date of Launch
NSE
1 S&P CNX Nifty Futures 12th
June, 2000
2 S&P CNX Nifty Options 4th
June, 2001
3 Single Stock Options 2nd
July, 2001
4 Single Stock Futures 9th
November, 2001
5 Interest Rate Futures 24th
June, 2003
6 CNX IT Futures & Options 29th
August, 2003
7 Bank Nifty Futures & Options 13th
June, 2005
8 Nifty Midcap 50 Futures & Options 5th
October, 2007
9 Mini Nifty Futures & Options on S&P CNX
Nifty 1
st January, 2008
10 Long term Options on S&P CNX Nifty 3rd
March, 2008
11 Currency Futures 29th August, 2008
12 Currency Options 29th
October, 2010
13 Dow Jones Industry Average (DJIA) 29th
August 2011
14 S&P 500 29th
August 2011
15 CNXPSE 25th
November 2011
16 CNXINFRA 25th
November 2011
17 FTSE 100 3rd
May 2012
70
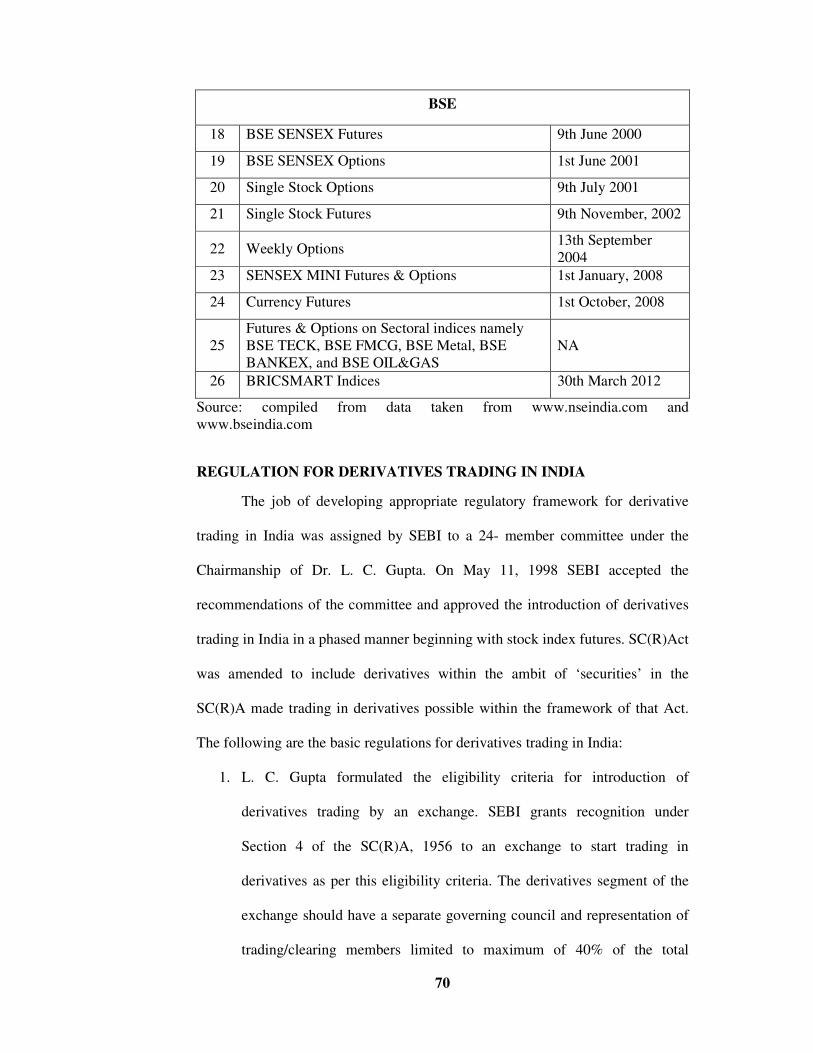
BSE
18 BSE SENSEX Futures 9th June 2000
19 BSE SENSEX Options 1st June 2001
20 Single Stock Options 9th July 2001
21 Single Stock Futures 9th November, 2002
22 Weekly Options 13th September
2004
23 SENSEX MINI Futures & Options 1st January, 2008
24 Currency Futures 1st October, 2008
25
Futures & Options on Sectoral indices namely
BSE TECK, BSE FMCG, BSE Metal, BSE
BANKEX, and BSE OIL&GAS
NA
26 BRICSMART Indices 30th March 2012
Source: compiled from data taken from www.nseindia.com and
www.bseindia.com
REGULATION FOR DERIVATIVES TRADING IN INDIA
The job of developing appropriate regulatory framework for derivative
trading in India was assigned by SEBI to a 24- member committee under the
Chairmanship of Dr. L. C. Gupta. On May 11, 1998 SEBI accepted the
recommendations of the committee and approved the introduction of derivatives
trading in India in a phased manner beginning with stock index futures. SC(R)Act
was amended to include derivatives within the ambit of ‘securities’ in the
SC(R)A made trading in derivatives possible within the framework of that Act.
The following are the basic regulations for derivatives trading in India:
1. L. C. Gupta formulated the eligibility criteria for introduction of
derivatives trading by an exchange. SEBI grants recognition under
Section 4 of the SC(R)A, 1956 to an exchange to start trading in
derivatives as per this eligibility criteria. The derivatives segment of the
exchange should have a separate governing council and representation of
trading/clearing members limited to maximum of 40% of the total

71
members of the governing council. As per the criteria, the exchange
would have to regulate the sales practices of its members and would have
to obtain prior approval of SEBI before start of trading in any derivative
contract.
2. The Exchange should have minimum 50 members.
3. The members of an existing segment (cash segment) of the exchange
would not automatically become the members of derivative segment. The
members of the derivative segment would need to fulfil the eligibility
conditions separately as laid down by the L. C. Gupta committee.
4. The clearing and settlement of derivatives trades would be through a
SEBI approved clearing corporation/house. Clearing corporations/houses
complying with the eligibility conditions as laid down by the committee
have to apply to SEBI for grant of approval.
5. Derivative brokers/dealers and clearing members are required to seek
registration from SEBI. This is in addition to their registration as brokers
of existing stock exchanges. The minimum net worth for clearing
members of the derivatives clearing corporation/house shall be �.300
Lakh. The net worth of the member shall be computed as follows:
6. Capital + Free reserves Less non-allowable assets viz.,
a) Fixed assets
b) Pledged securities
c) Member’s card
d) Non-allowable securities (unlisted securities)
e) Bad deliveries
f) Doubtful debts and advances
g) Prepaid expenses
h) Intangible assets

72
i) 30% marketable securities
7. The minimum contract value shall not be less than �.2 Lakh. Exchanges
have to submit details of the futures contract they propose to introduce.
8. The initial margin requirement, exposure limits linked to capital adequacy
and margin demands related to the risk of loss on the position will be
prescribed by SEBI/Exchange from time to time.
9. The L. C. Gupta committee report requires strict enforcement of “Know
your customer” rule and requires that every client shall be registered with
the derivatives broker. The members of the derivatives segment are also
required to make their clients aware of the risks involved in derivatives
trading by issuing to the client the Risk Disclosure Document and obtain a
copy of the same duly signed by the client. The trading members are
required to have qualified approved user and sales person who have
passed a certification programme approved by SEBI.
ELIGIBILITY CRITERIA FOR SELECTION OF SECURITIES AND
INDICES FOR DERIVATIVES TRADING
The eligibility of a stock / index for trading in Derivatives segment is
based upon the criteria laid down by SEBI through various circulars issued from
time to time. Based on SEBI guidelines and as a surveillance measure, following
criteria has been adopted by the Exchange for selecting stocks and indices on
which Futures & Options contracts would be introduced.
ELIGIBILITY CRITERIA OF STOCKS:
(i) The stock shall be chosen from amongst the top 500 stocks in terms of
average daily market capitalisation and average daily traded value in the
previous six months on a rolling basis.

73
(ii) The stock's median quarter-sigma order size over the last six months
shall be not less than �.10 lakhs. For this purpose, a stock's quarter-
sigma order size shall mean the order size (in value terms) required to
cause a change in the stock price equal to one-quarter of a standard
deviation.
(iii) The market wide position limit in the stock shall not be less than �.300
crores. The market wide position limit (number of shares) shall be
valued taking the closing prices of stocks in the underlying cash market
on the date of expiry of contract in the month. The market wide position
limit of open position (in terms of the number of underlying stock) on
futures and option contracts on a particular underlying stock shall be
20% of the number of shares held by non-promoters in the relevant
underlying security i.e. free-float holding.
Continued Eligibility :
For an existing F&O stock, the continued eligibility criteria is that market
wide position limit in the stock shall not be less than �.200 crores and stock's
median quarter-sigma order size over the last six months shall not be less than �.5
lakhs. Additionally, the stock’s average monthly turnover in derivative segment
over last three months shall not be less than �.100 crores.
(i) If an existing security fails to meet the eligibility criteria for three
months consecutively, then no fresh month contract shall be issued on
that security. However, the existing unexpired contracts may be
permitted to trade till expiry and new strikes may also be introduced
in the existing contract months.

74
(ii) Further, the members may also refer to circular no.
NSCC/F&O/C&S/365 dated August 26, 2004, issued by NSCCL
regarding Market Wide Position Limit, wherein it is clarified that a
stock which has remained subject to a ban on new position for a
significant part of the month consistently for three months, shall be
phased out from trading in the F&O segment.
Further, once the stock is excluded from the F&O list, it shall not be
considered for re-inclusion for a period of one year.
Re-introduction of excluded stocks
A stock which is excluded from derivatives trading may become eligible
once again. In such instances, the stock is required to fulfil the eligibility criteria
for three consecutive months to be re-introduced for derivatives trading.
ELIGIBILITY CRITERIA OF INDICES
i. Futures & Options contracts on an index can be introduced only if
80% of the index constituents are individually eligible for derivatives
trading. However, no single ineligible stock in the index shall have a
weightage of more than 5% in the index. The index on which futures
and options contracts are permitted shall be required to comply with
the eligibility criteria on a continuous basis.
ii. SEBI has subsequently modified the above criteria, vide its
clarification issued to the Exchange "The Exchange may consider
introducing derivative contracts on an index if the stocks contributing
to 80% weightage of the index are individually eligible for derivative
trading. However, no single ineligible stocks in the index shall have a
weightage of more than 5% in the index.

75
iii. The above criteria is applied every month, if the index fails to meet
the eligibility criteria for three months consecutively, then no fresh
month contract shall be issued on that index, However, the existing
unexpired contacts shall be permitted to trade till expiry and new
strikes may also be introduced in the existing contracts.
PROF. J. R. VARMA COMMITTEE
In June 1998, SEBI set up a committee under the chairmanship of Prof
J.R. Varma, to recommend measures for risk containment in derivatives market
in India. This committee submitted its report in October 1998 giving operational
details of margining system, methodology for charging initial margins, broker net
worth, deposit requirement and real-time monitoring requirement.
The following procedure is adopted for calculating the Quarter Sigma Order
Size:
• The applicable VAR (Value at Risk) is calculated for each security
based on the J.R. Varma Committee guidelines. (The formula
suggested by J. R. Varma for computation of VAR for margin
calculation is statistically known as 'Exponentially weighted moving
average (EWMA)' method. In comparison to the traditional method,
EWMA has the advantage of giving more weight to the recent price
movements and less weight to the historical price movements.)
• Such computed VAR is a value (like 0.03), which is also called
standard deviation or Sigma. (The meaning of this figure is that the
security has the probability to move 3% to the lower side or 3% to the
upper side on the next trading day from the current closing price of the
security).

76
• Such arrived at standard deviation (one sigma), is multiplied by 0.25
to arrive at the quarter sigma
• From the order snapshots (taken four times a day from NSE's Capital
Market Segment order book) the average of best buy price and best
sell price is computed which is called the average price.
• The quarter sigma is then multiplied with the average price to arrive at
quarter sigma price.
• Based on the order snapshot, the value of the order (order size in �.),
which will move the price of the security by quarter sigma price in
buy and sell side is computed. The value of such order size is called
Quarter Sigma order size. Such an exercise is carried out for four
order snapshots per day for all stocks for the previous six months
period.
• From the above determined quarter sigma order size (�.) for each
order book snap shot for each security, the median of the order sizes
(�.) for buy side and sell side separately, are computed for all the
order snapshots taken together for the last six months.
• The average of the median order sizes for buy and sell side are taken
as the median quarter sigma order size for the security.
Futures & Options contracts may be introduced on new securities which
meet the above mentioned eligibility criteria, subject to approval by SEBI.
New securities being introduced in the F&O segment are based on the
eligibility criteria which take into consideration average daily market
capitalization, average daily traded value, the market wide position limit in the
security, the quarter sigma values and as approved by SEBI. The average daily
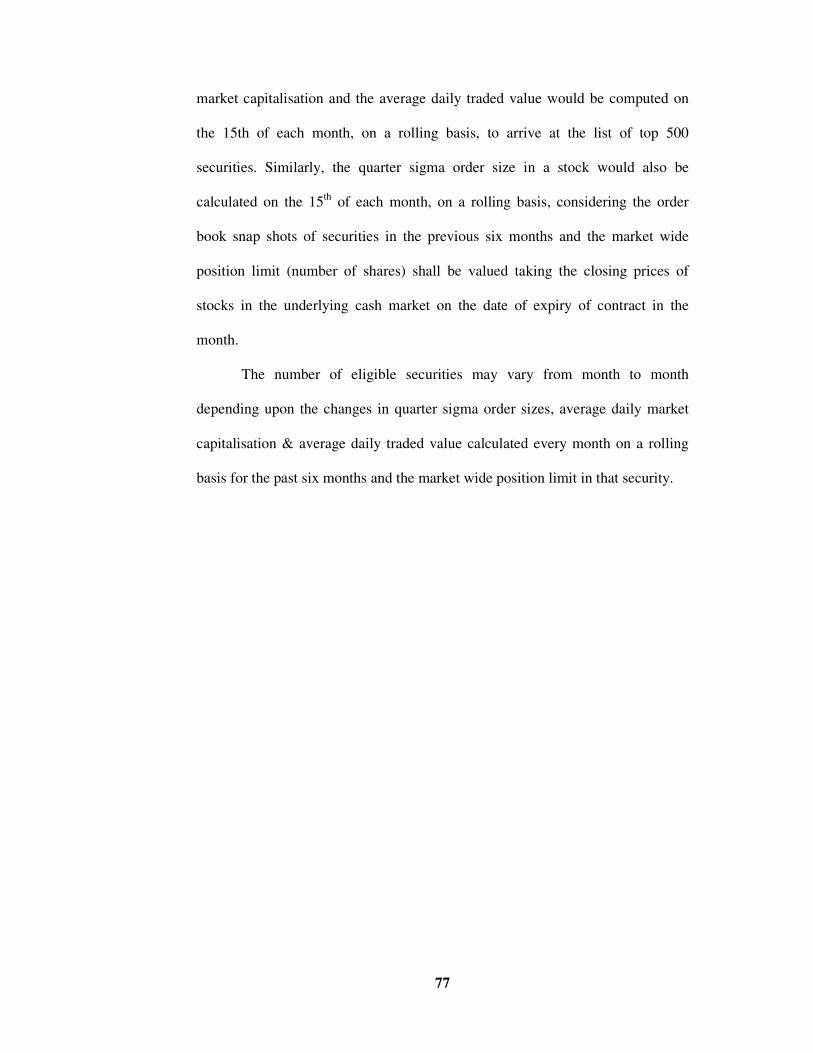
77
market capitalisation and the average daily traded value would be computed on
the 15th of each month, on a rolling basis, to arrive at the list of top 500
securities. Similarly, the quarter sigma order size in a stock would also be
calculated on the 15th
of each month, on a rolling basis, considering the order
book snap shots of securities in the previous six months and the market wide
position limit (number of shares) shall be valued taking the closing prices of
stocks in the underlying cash market on the date of expiry of contract in the
month.
The number of eligible securities may vary from month to month
depending upon the changes in quarter sigma order sizes, average daily market
capitalisation & average daily traded value calculated every month on a rolling
basis for the past six months and the market wide position limit in that security.
Related Documents


![[Derivatives Consulting Group] Introduction to Equity Derivatives](https://static.cupdf.com/doc/110x72/5525eed15503467c6f8b4b12/derivatives-consulting-group-introduction-to-equity-derivatives.jpg)


