Growth in Cecil County •Population •Migration, Commuters, Jobs •Land Use, Planned Growth, & Sprawl •Base Realignment, APG •Prognosis & Priorities

Growth in Cecil County Population Migration, Commuters, Jobs Land Use, Planned Growth, & Sprawl Base Realignment, APG Prognosis & Priorities.
Dec 17, 2015
Welcome message from author
This document is posted to help you gain knowledge. Please leave a comment to let me know what you think about it! Share it to your friends and learn new things together.
Transcript
Growth in Cecil County• Population
• Migration, Commuters, Jobs
• Land Use, Planned Growth, & Sprawl
• Base Realignment, APG
• Prognosis & Priorities

Population & Change
Cecil County

Total Population in Cecil County, Actual and Projected
53,291
85,951
160,000
0
40,000
80,000
120,000
160,000
200,000
1970 1980 1990 2000 2005 2010 2015 2020 2025 2030
Almost doubles

Population Increases, Cecil County, Actual & Projected, by Decade
7,139
10,917
14,604
23,19925,400 25,450
0
5,000
10,000
15,000
20,000
25,000
30,000
1970s 1980s 1990s 2000s 2010s 2020s

Population Change in Cecil County by Major Age Groups, 2000-2010
5,411
14,906
2,889
0
4,000
8,000
12,000
16,000
0-19 20-64 65+
64%23%12%

Population Change in Cecil County by Major Age Groups, 2010-2020
5,720
13,903
5,765
0
4,000
8,000
12,000
16,000
0-19 20-64 65+
54%23% 23%

Population Change in Cecil County by Major Age Groups, 2020-2030
6,811
11,654
6,991
0
4,000
8,000
12,000
16,000
0-19 20-64 65+
45%
27% 27%

Annual Rate of Population Change in Cecil County, Actual & Projected, by Decade
3.12%
2.47% 2.36%2.64%
2.42%
1.85%
0.00%
1.00%
2.00%
3.00%
4.00%
1970s 1980s 1990s 2000s 2010s 2020s

Annual Rate of Total Population Change in Remainder of Maryland, Actual & Projected
2.19%
1.81%
1.24% 1.24%0.89%
0.68%
0.00%
1.00%
2.00%
3.00%
4.00%
1970s 1980s 1990s 2000s 2010s 2020s

Migration, Commuters,
& Jobs
Cecil County

Migration to Cecil County
7,841 7,6197,245
1,790
0
1,000
2,000
3,000
4,000
5,000
6,000
7,000
8,000
9,000
1991-1999 2000-2004, US 2000-2004, MD 2000-2003 FromHarford County
>1/2 Pop’nIncrease, ’90s

Net Commutation for Cecil County(In commuters minus out commuters)
-3,255
-7,354
-12,389
-15,871-17,757
-19,316
-22,029
-25,716
-29,661
-34,851
-40,000
-30,000
-20,000
-10,000
0
1970 1980 1990 2000 2005 2010 2015 2020 2025 2030
Source: U.S. Census, U.S. BEA and the Maryland Department of Planning
Net Out Commutation increases by nearly 19,000
between 2000 and 2030

Annual Rate of Total Job Change in Cecil County, Actual & Projected
-0.91%
3.15%
2.06%
3.36%
1.71%
0.61%
-1.00%
0.00%
1.00%
2.00%
3.00%
4.00%
1970s 1980s 1990s 2000s 2010s 2020s

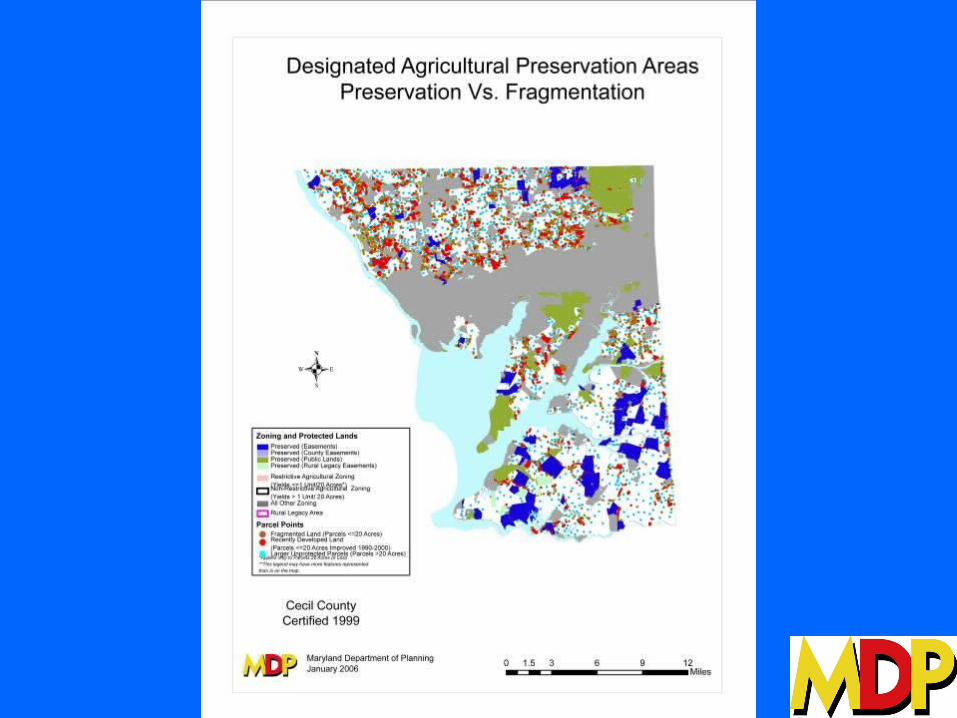
Land Use,Planned Growth, &
Sprawl
Cecil County

Growth in Cecil County
0%
20%
40%
60%
80%
100%
120%
140%
160%
180% Increase1973 to 2002
Population
DevelopmentDevelopment
Population
Est. Increase2002 to 2030
61%
77%
127% 159%


Residential Single Family SalesAbove $300,000 (Median) 2002
By Census Tract

Residential Single Family SalesAbove $300,000 (Median) 2005
By Census Tract

Base Re-alignment: APGGivens• Transferred military jobs: 4,700• Additional contractual jobs: 2 to 3 times• Estimate: total of 10,000 to 12,000Questions• In-commuters?• Workweek residents?• Market preferences: Cecil / PFAs / NAR /
SAR?• Water/sewer, growth plans, ordinances

Prognosis
• Fast growth 2000 – 2030
• Heavy in-migration + aging population
• More out-commuters
• Richer market for development products
• More loss of land than population increase
• Major threat to high quality environment

Priorities• Its all about the market
• Plans/programs for water / sewer, Smart Growth
• Development incentives for diverse, high quality communities in planned areas
• Subdivision and development restrictions & more preservation outside Priority Funding Areas
Related Documents