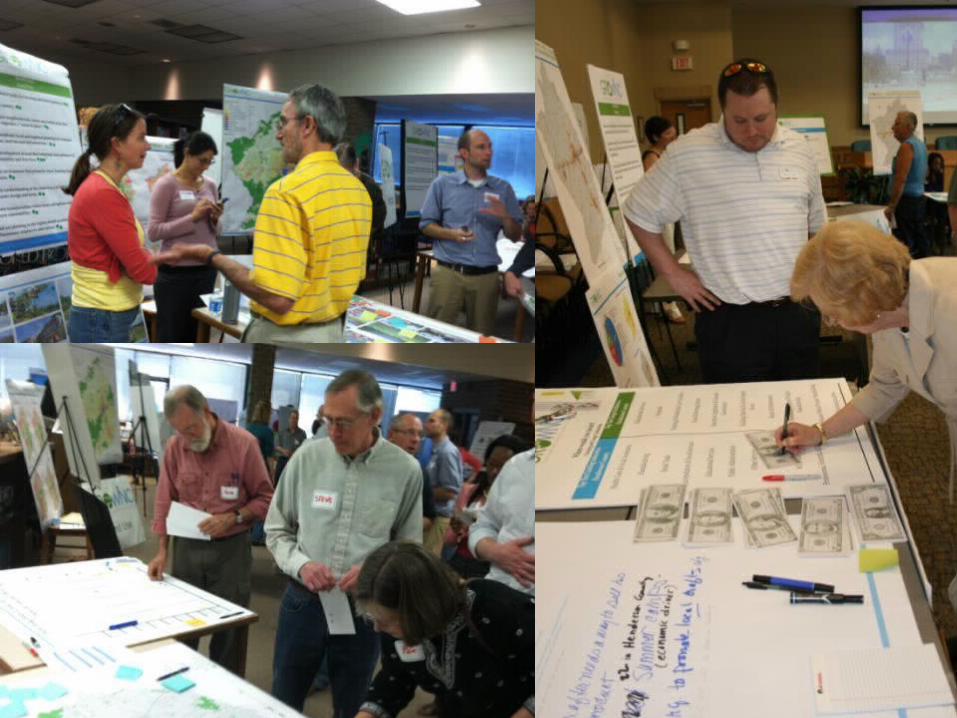
www.gro-wnc.org Workgroup Session #2 Scenario Planning July 30, 2012

Welcome message from author
This document is posted to help you gain knowledge. Please leave a comment to let me know what you think about it! Share it to your friends and learn new things together.
Transcript

www.gro-wnc.org
Workgroup Session #2Scenario Planning
July 30, 2012

Meeting Objectives & Agenda
“The future is not some place we are going to but a place we are creating. The paths to it are not found, they are made.”
– Jane Garvey
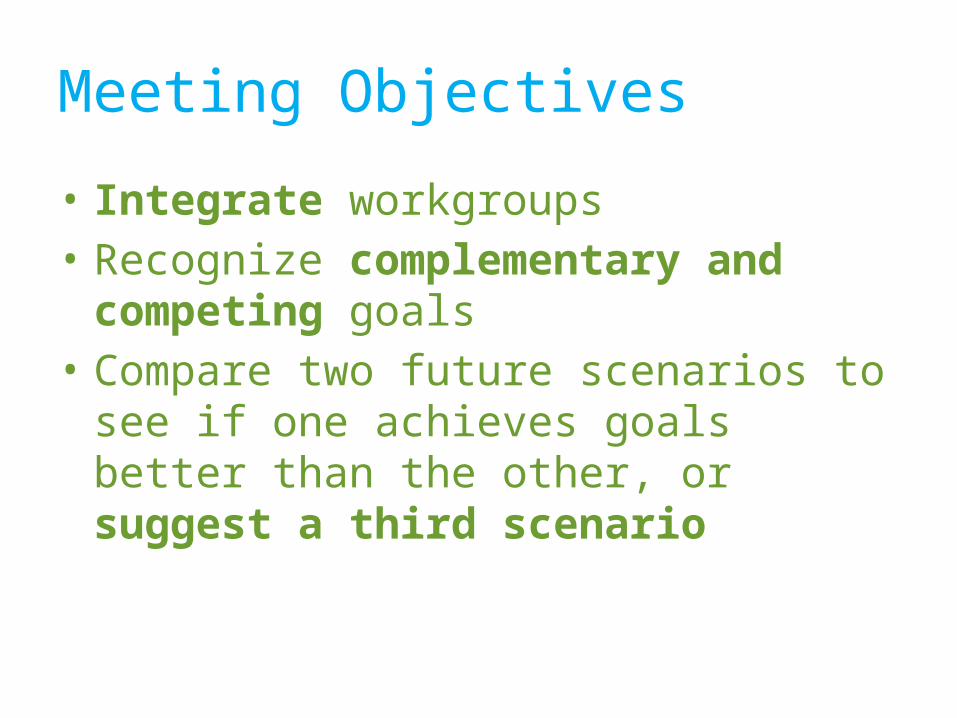
Meeting Objectives
• Integrate workgroups• Recognize complementary and competing
goals• Compare two future scenarios to see if one
achieves goals better than the other, or suggest a third scenario
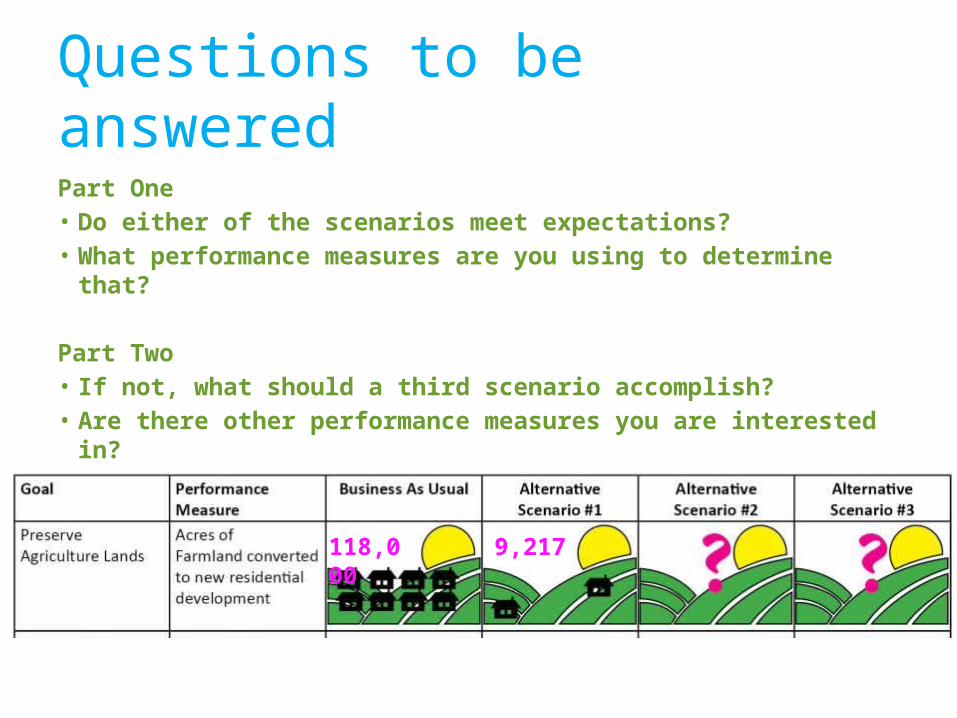
Part One• Do either of the scenarios meet expectations?• What performance measures are you using to determine that?
Part Two• If not, what should a third scenario accomplish?• Are there other performance measures you are interested in?
Questions to be answered
118,000 9,217
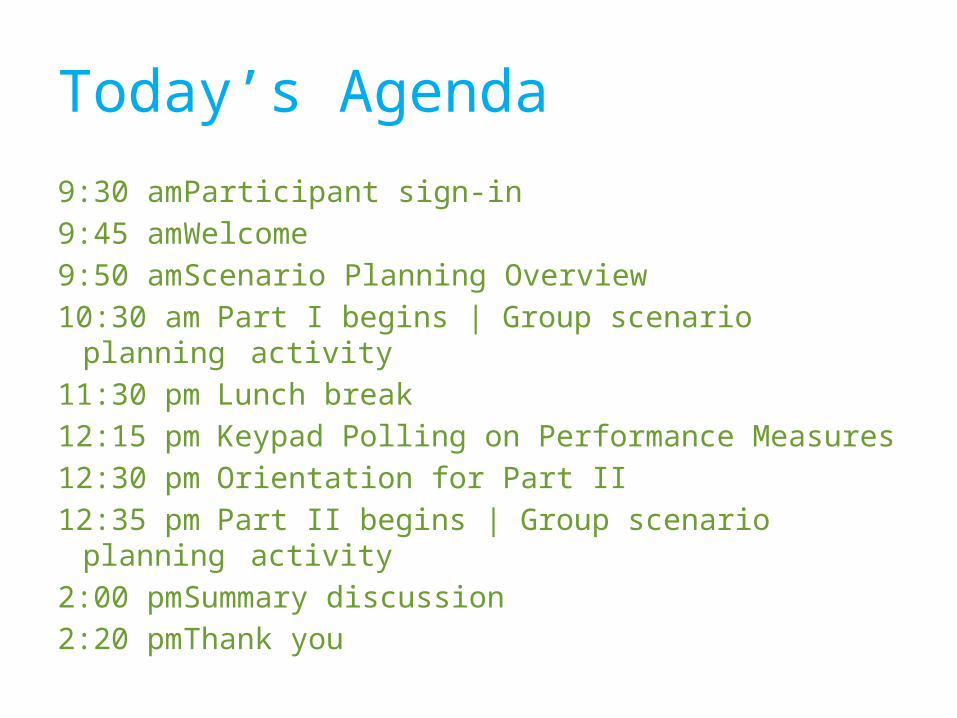
Today’s Agenda
9:30 am Participant sign-in9:45 am Welcome9:50 am Scenario Planning Overview10:30 am Part I begins | Group scenario planning
activity11:30 pm Lunch break12:15 pm Keypad Polling on Performance Measures12:30 pm Orientation for Part II12:35 pm Part II begins | Group scenario planning
activity2:00 pm Summary discussion2:20 pm Thank you

Key Findings from the Community Meetings
http://www.gro-wnc.org/communitymeeting.html

Thank You! County/Jurisdiction Meeting Location Number of
AttendeesMadison Madison High
School Media Center
32
Hendersonville Hendersonville Operations Center
38
Haywood Haywood Community College
13
Buncombe Dr. Wesley Grant Sr. Southside Center
64
Transylvania Transylvania Public Library
64

Thank You! County/Jurisdiction Meeting Location Number of
AttendeesMadison Madison High
School Media Center
32
Hendersonville Hendersonville Operations Center
38
Haywood Haywood Community College
13
Buncombe Dr. Wesley Grant Sr. Southside Center
64
Transylvania Transylvania Public Library
64

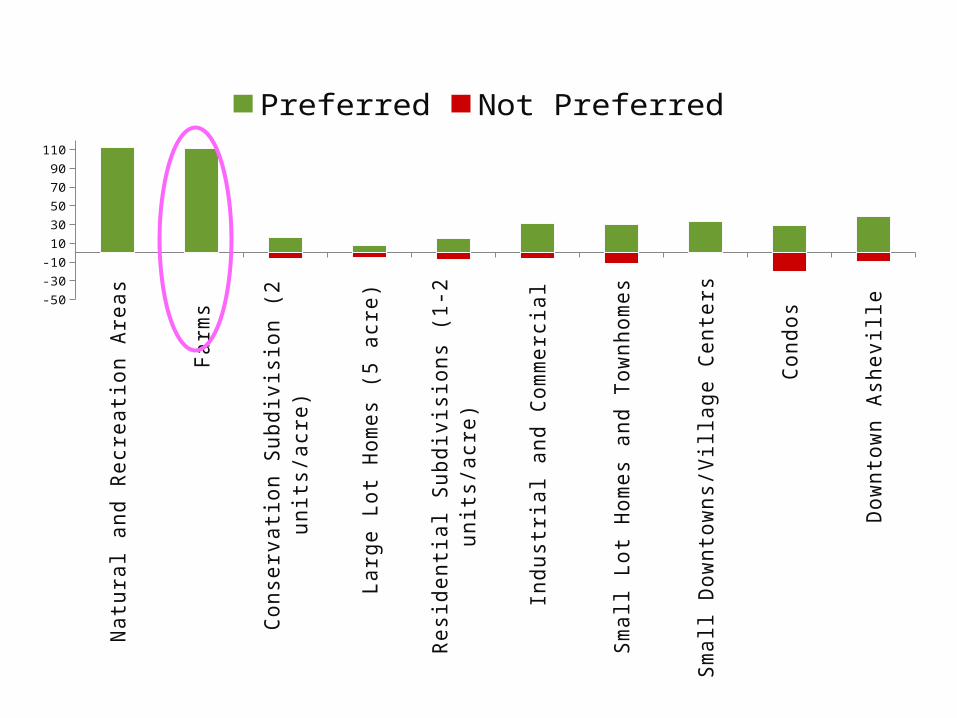
16%Sixteen percent of all land in the GroWNC region is in current agriculture use according to the US Department of Agriculture.Source: USDA Agriculture Census 2007

$135mThe total market value of agriculture production in the GroWNC region was $135million in 2007.Source: USDA Agriculture Census 2007
Nat
ural
and
Rec
reati
on A
reas
Farm
s
Cons
erva
tion
Subd
ivisi
on (2
uni
ts/a
cre)
Larg
e Lo
t Hom
es (5
acr
e)
Resid
entia
l Sub
divi
sions
(1-2
uni
ts/a
cre)
Indu
stria
l and
Com
mer
cial
Smal
l Lot
Hom
es a
nd T
ownh
omes
Smal
l Dow
ntow
ns/V
illag
e Ce
nter
s
Cond
os
Dow
ntow
n As
hevi
lle
-50
-30
-10
10
30
50
70
90
110
Preferred Not Preferred

28%68% of the region lives in a single-family detached house.Source: US Census
68%

Housing Data (US Census)
House on Several Acres32%
House on Large Lot
18%
House on Small Lot22%
Mobile Home
1%
Townhouse6%
Condo; Apartment10%
Urban Loft11%
• 68% of the region lives in a single-family detached house
• 17% of the region lives in a mobile home
• 12% lives in a multi-family structure (includes duplex, triplex, apartments, condos)
• 3% lives in a single-family attached house
Housing Preferences

28%The Arts industries in Buncombe and Transylvania Counties generated $2.6million in total local government revenue in 2010.Source: Arts and Economic Prosperity Study IV
$2.6m


$365mSummer camps in Buncombe, Henderson and Transylvania Counties generated $365 million in total economic impact to the region. Source: NC Camping Association

Introduced preferences
The City of Asheville has 132 linear miles of sidewalks.Source: City of Asheville Sidewalk Inventory
132

Over 90% of WNC imports arrive from southern ports demonstrating a heavy reliance on I-26 and other southeastern routes. Source: NCDOT Traffic Survey Unit
90%


Common Goals and Objectives

Projected Growth

1990 2000 2010 2020 2030 2040 -
100,000
200,000
300,000
400,000
500,000
600,000
700,000
333,519
398,502
457,948
519,674
577,277 634,337
Population

Population
Total 2040 Population = 634,337
Growth of 39%

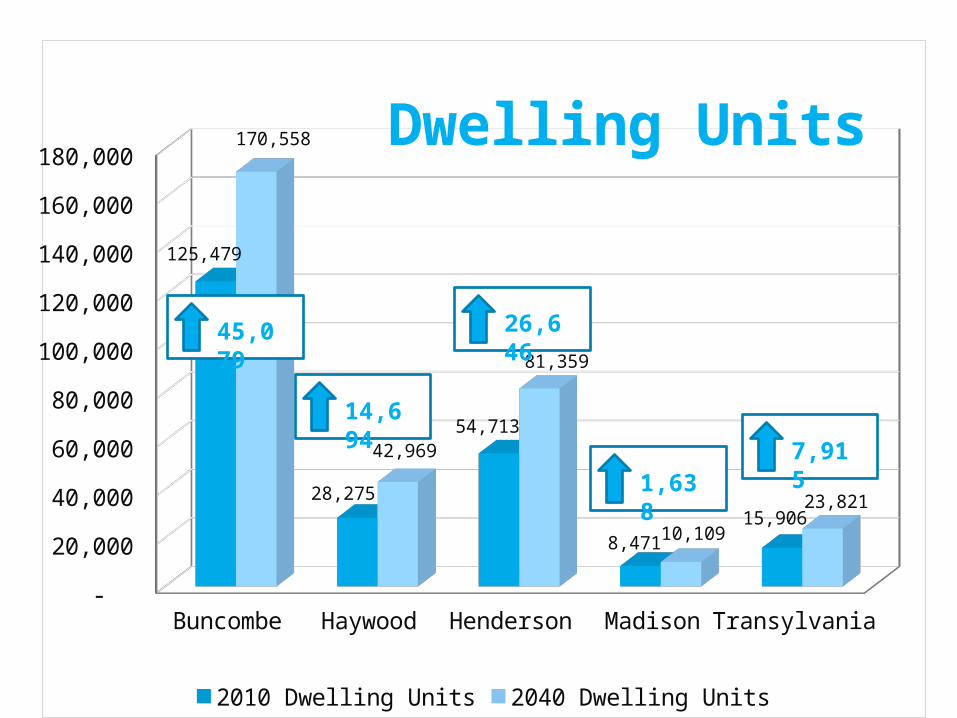
Dwelling Units
Total 2040 Dwelling Units = 328,816
Growth of 41%
Buncombe Haywood Henderson Madison Transylvania -
20,000
40,000
60,000
80,000
100,000
120,000
140,000
160,000
180,000
125,479
28,275
54,713
8,471 15,906
170,558
42,969
81,359
10,109
23,821
Dwelling Units
2010 Dwelling Units 2040 Dwelling Units
45,079
14,694
26,646
1,6387,915
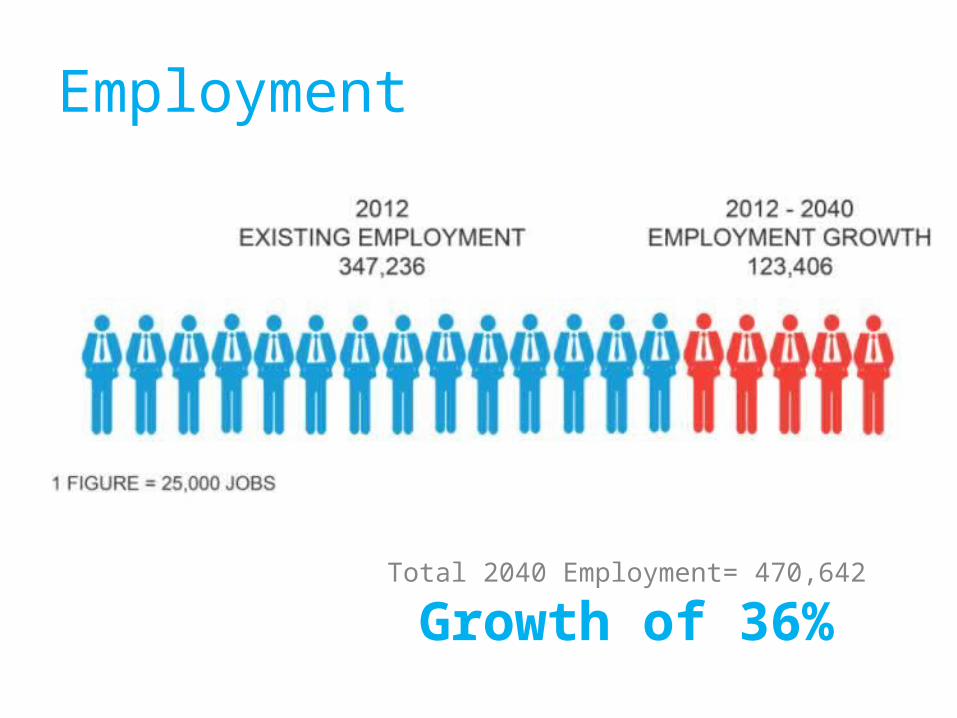
Employment
Total 2040 Employment= 470,642
Growth of 36%
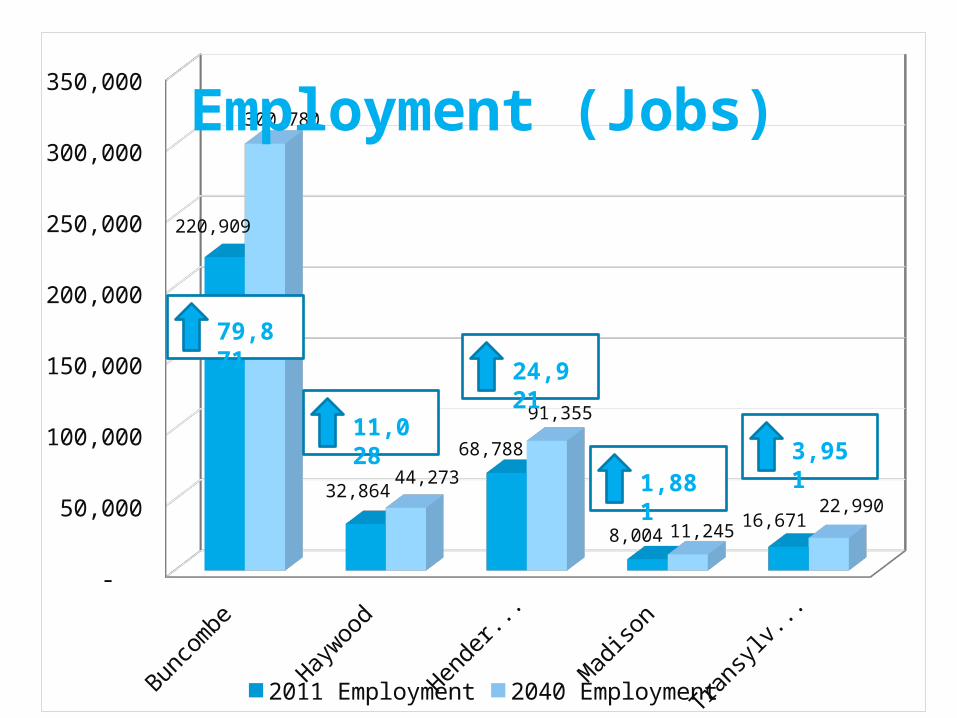
Buncombe Haywood Henderson Madison Transylvania -
50,000
100,000
150,000
200,000
250,000
300,000
350,000
220,909
32,864
68,788
8,004 16,671
300,780
44,273
91,355
11,245 22,990
Employment (Jobs)
2011 Employment 2040 Employment
79,871
11,028
24,921
1,8813,951

Scenario Planning

What does this growth mean for our region in 2040?

Scenario Planning:Introduction
What is Scenario Planning?
• Scenario Planning is a method for learning about the future.– Understand the potential consequences of
present-day choices.– Make wise decisions in the face of uncertainty.

How does Scenario Planning work?
• We start with a base case scenario, one that represents our future if we continue on a “business-as-usual” path, and we evaluate it relative to a subset of goals (development-related goals)
• Then we consider our options… and we create additional (or alternative) scenarios that maximize different options so that we can understand some of the consequences – intended and unintended, good and bad
• We evaluate alternatives relative to “business-as-usual” (BAU) and to each other guided by a subset of goals (development-related goals)

Together, We Create our Future

Scenario Planning:Aided by a Model

Area TypeDevelopment Density Classifications
Intensity Definition Examples in the Study Area
Very Rural Remote mountain ranges and valleys. Primarily used for timber harvesting and some farming.
Newfound Mountains, Spring Creek Mountain, Sandy Bottom (Madison Co.), Cascade Lake Area (Transylvania Co.)
Rural Sparsely settled areas. Largely farms with the
occasional rural subdivision.Large portions of Madison County, Western Henderson County
Low Density Areas where a variety of land uses occur at low densities. Primarily low density residential with occasional strip retail development, isolated industrial.
Dana, Beaumont, Montreat, Riceville
Medium Density
Areas where a variety of land uses occur. Primarily medium density residential with occasional strip retail development, isolated industrial.
Grovemont, Swannanoa Hills, Pisgah Drive in Canton, Millbrook Estates in Brevard, Dellwood in Hendersonville
Moderate Density
Areas where a variety of land uses occur at moderate densities. Some concentration of employment, generally separated and auto-oriented. Includes smaller towns, and villages that serve as nodes of activity in rural areas.
North Brevard, Black Mountain, Weaverville, Mars Hill, Maggie Valley
High DensityAreas where a variety of land uses occur at the highest densities in the region. Generally found in established core areas such as county seats. These are the most pedestrian and transit friendly areas in the region. High concentration of employment.
Asheville, Waynesville, Hendersonville

Source: Duany Plater-Zyberk & Company
Very Rural RuralLow
Density Medium Density
Moderate Density
High Density
Newfound Mountains
Barnardsville and the Ivy Creek
Valley
Montreat, Riceville
Grovemont, Dellwood in
Hendersonville
Downtown Mars Hill
Downtown Asheville

2012
1990 2000 2010 2020 2030 2040 -
100,000
200,000
300,000
400,000
500,000
600,000
700,000
333,519
398,502 457,948
519,674 577,277
634,337
Population
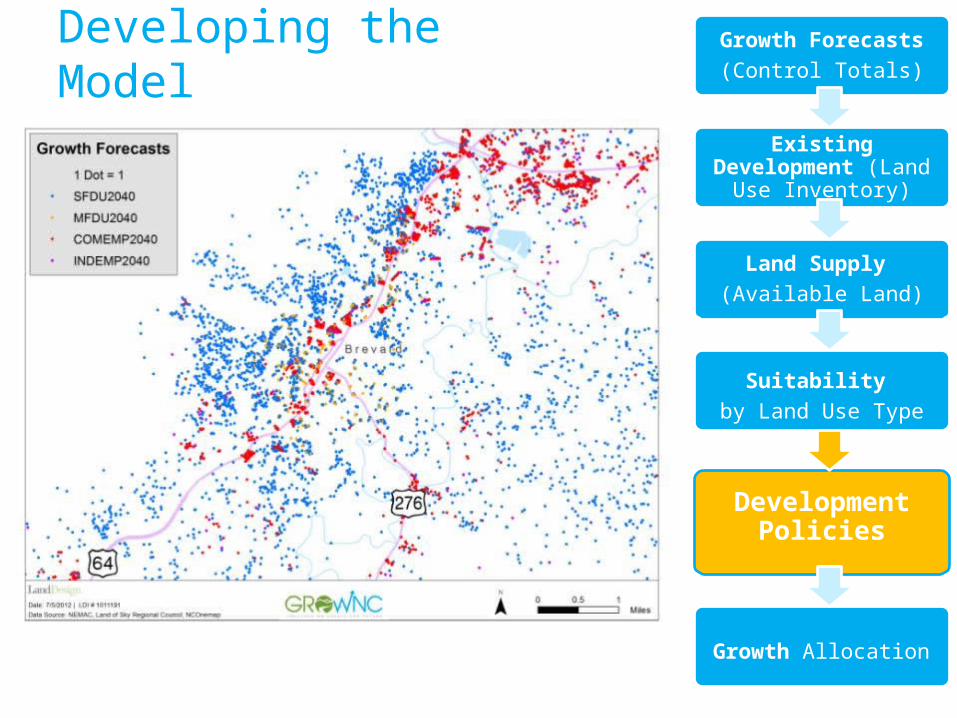
Developing the Model Growth Forecasts(Control Totals)
Existing Development (Land Use Inventory)
Land Supply (Available Land)
Suitability by Land Use Type
Development Policies
Growth Allocation
Scenario Planning:Business-as-Usual (BAU) Scenario
• Honors adopted local plans• Growth follows current trends, occurring
where land is most suitable
Business As Usual Scenario

2012
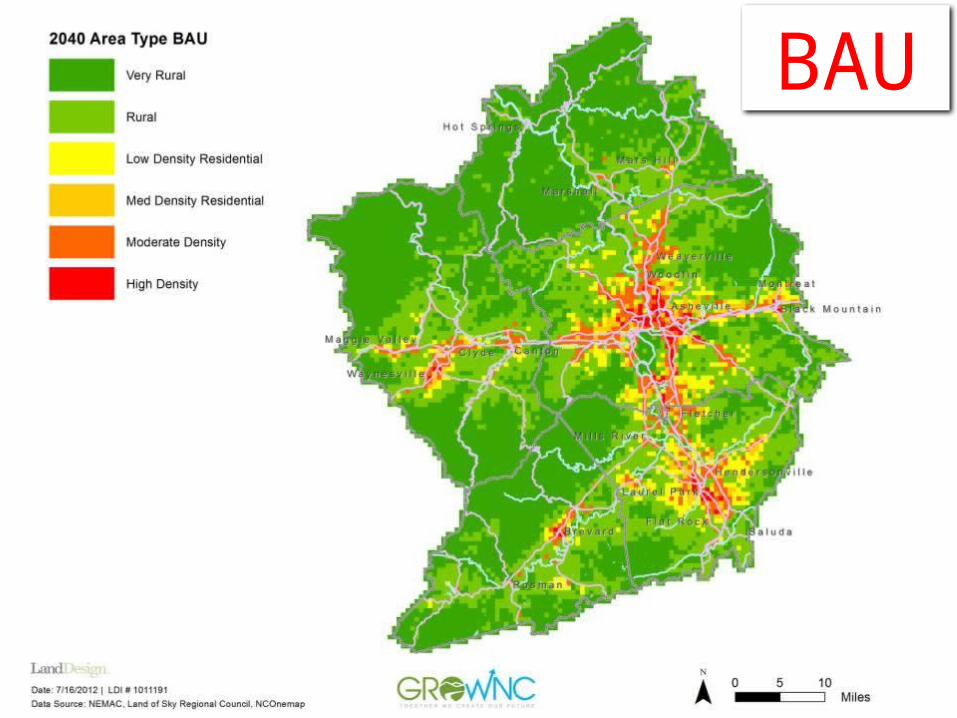
BAU
Scenario Planning:Performance Measures

Common Goals and Objectives

Common Goals and Objectives

Evaluation of BAU
41%

Scenario Planning:Alternative Scenario

Alternatives- A new path forward
Redistribution of growth coming to the region
Guided by your goals and priorities

Energy Natural Resources
Economic Development
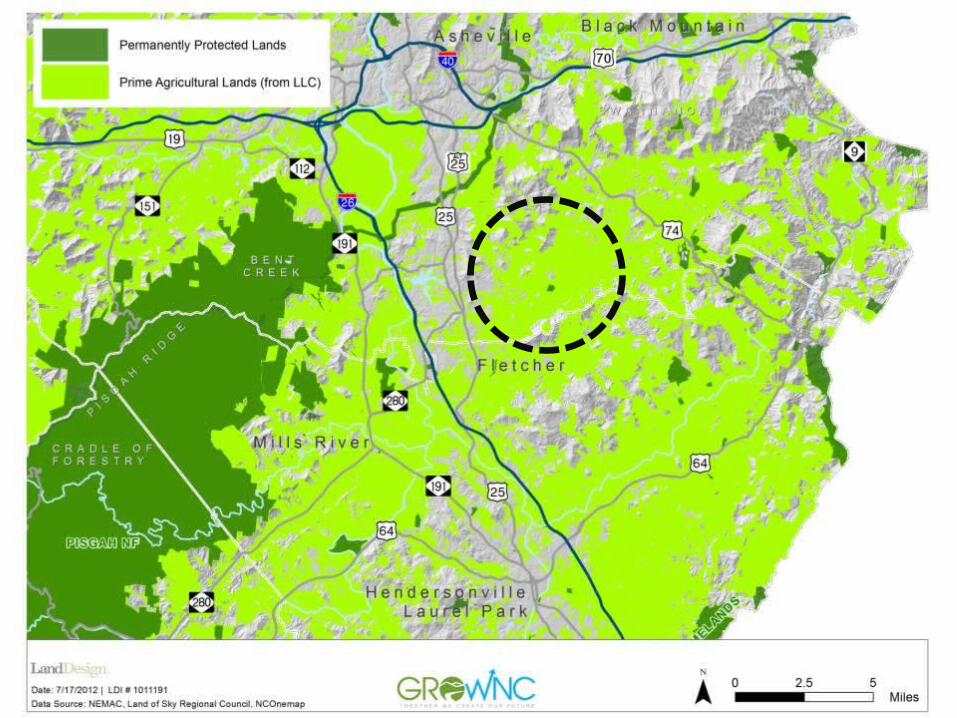
• Assumes a policy of protection for prime industry and agricultural lands
Alternative Scenario #1


ALT 1

BAU

Comparison: BAU vs. Alternative 1
41%

BAU

ALT 1

Today’s Work Session

Objectives
• Integrate workgroups• Recognize complementary and competing
goals• Compare two future scenarios to see if one
achieves goals better than the other, or suggest a third scenario

Explanation of Tools
• Performance Measures (table)– 11x17 (individual worksheet)– 24x36 (group)
• Maps– Current Year– BAU– Alternative 1
• Existing conditions maps • Other resource materials• Markers, stickers, etc.


• Where you live/work• Review Performance Measure Handout• Evaluate the BAU• Evaluate Alternative 1• Questions to Answer:
– Do either of the scenarios meet expectations?– What performance measures are you using to determine that?
Part One

Where you live, where you work.
Where you Live
Where you Work

Review of Performance Measures Handout
Circle which performance
measures best represent your
priorities.

Evaluate the BAU

Evaluate Alternative 1

• Create a new scenario• Questions to Answer:
– What should a third scenario accomplish?– Are there other performance measures you
are interested in?
Part Two
118,000 9,217

Yellow Dot = Housing
Red Dot = Jobs
Dark Green Dot = Protected
Light Green Dot = Rural/Farm
Create a new Scenario.
Distribute Growth & Protect Areas

Where is there room for improvement?
What performance
measures MUST be improved? 50%

Are there other performance measures you are interested in?

Related Documents