National Longitudinal Study of Children Growing Up in Ireland THE INFANTS AND THEIR FAMILIES INFANT COHORT EXECUTIVE SUMMARY

Welcome message from author
This document is posted to help you gain knowledge. Please leave a comment to let me know what you think about it! Share it to your friends and learn new things together.
Transcript
National Longitudinal Study of Children
Growing Up in Ireland
THE INFANTS AND THEIR FAMILIESINFANT COHORT
EXECUTIVE SUMMARY
National Longitudinal Study of Children
Growing Up in Ireland
THE INFANTS AND THEIR FAMILIES
Name Title InstitutionJames Williams Research Professor and Principal Investigator, Growing Up in Ireland ESRISheila Greene AIB Professor of Childhood Research; Director of Children’s Research
Centre and Co-Director, Growing Up in Ireland TCD
Sinéad McNally Research Fellow TCDAisling Murray Research Fellow ESRIAmanda Quail Research Fellow ESRI
Trinity College Dublin
The views expressed in this report are those of the authors and do notnecessarily reflect the views of the funders or of either of the twoinstitutions involved in preparing the report.
James Williams, Sheila Greene, Sinéad McNally, Aisling Murray, Amanda Quail
Growing Up in Ireland • THE INFANTS AND THEIR FAMILIES
2
Copyright © Minister for Health and Children, 2010
Office of the Minister for Children and Youth AffairsDepartment of Health and ChildrenHawkins HouseHawkins StreetDublin 2Tel: +353 (0)1 635 4000Fax: +353 (0)1 674 3223E-mail: [email protected]: www.omc.gov.iePublished by The Stationery Office, Dublin
ISBN 978-1-4064-2315-0
All rights reserved. No part of this publication may be reproduced, storedin a retrieval system, or transmitted, in any form or by any means,electronic, mechanical, photocopying, recording or otherwise, without theprior permission in writing of the copyright holder.
For rights of translation or reproduction, applications should be made tothe Head of Communications, Office of the Minister for Children andYouth Affairs, Hawkins House, Hawkins Street, Dublin 2, Ireland.
ACKNOWLEDGEMENTS
3
ACKNOWLEDGEMENTS
A project of the scale and complexity of Growing Up in Ireland would not be possible without the assistanceand commitment of a large number of people, groups, bodies and organisations, all of whom we wish tothank, on behalf of the Growing Up in Ireland Management Group and Study Team.
First, we wish to acknowledge the funding of the project by the Department of Health and Children,through the Office of the Minister for Children and Youth Affairs, in association with the Department ofSocial Protection and the Central Statistics Office.
Thanks are due to members of the Inter-Departmental Steering Group (formerly chaired by Ms SyldaLangford and currently chaired by Dr Mary Doyle, Director General of the Office of the Minister for Childrenand Youth Affairs {OMCYA}). Thanks are also due to the members of the Inter-Departmental Project Team(chaired by Dr Sinead Hanafin, Head of Research, Department of Health and Children). Ms Anne-MarieBrooks and Mr Tim Heneghan from the OMCYA were also extremely supportive and helpful in the executionof the project.
The innumerable insights and observations of Professor Anne Sanson of the University of Melbourne,Australia and Dr Satya Brink of Human Resources and Social Development, Canada were particularly helpfulat all stages in the project.
We are very grateful to the members of the Scientific and Policy Advisory Committee (SPAC) who providedmany fresh perspectives in numerous areas.
The Research Ethics Committee (REC) has provided rigorous ethical assessment of all aspects of Growing Upin Ireland. This has involved their critical review of often voluminous documentation at each stage of theproject, requiring an extraordinary level of commitment, time and input from its members.
The 84 children who sit on the Children’s Advisory Forum (CAF) have provided very important help indeveloping questionnaires and testing schemes for the Child Cohort.
Staff and colleagues in both the ESRI and Trinity College provided assistance in many ways, as did themembers of the Advisory Panels of Experts who made a particularly important contribution to instrumentdevelopment and project design throughout.
A range of stakeholder groups gave generously of their time, assistance and support, particularly duringplanning and design phases.
The energy and dedication of our staff in implementing Growing Up in Ireland have been tremendous sincethe inception of the project.
The final (and biggest) word of thanks goes, of course, to more than 11,000 families of nine-month-oldinfants who participated in the Infant Cohort of the Study. Growing Up in Ireland would simply not havebeen possible without the time and assistance they so readily and generously provided to us.
James Williams, ESRI Sheila Greene, TCD

Growing Up in Ireland • THE INFANTS AND THEIR FAMILIES
4
MINISTER'S FOREWORD
As Minister for Children and Youth Affairs, it gives me great pleasure to publish ‘The Infants and theirFamilies’. This is the second formal publication from Growing Up in Ireland – the National LongitudinalStudy of Children.
Growing Up in Ireland is one of the largest and most complex studies that has ever been undertaken inIreland. By tracking the development of two cohorts of young children for at least seven years(approximately 11,100 infants and 8,500 nine-year old children), this Study aims to ‘examine the factorswhich contribute to or undermine the wellbeing of children in contemporary Irish families, and, throughthis, contribute to the setting of effective and responsive policies relating to children and to the design ofservices for children and their families’.
Growing Up in Ireland is funded by the Office of the Minister for Children and Youth Affairs in associationwith the Department of Social Protection and the Central Statistics Office. This Study was commissioned aspart of a wider National Children’s Research Programme, which was set up to progress Goal Two of theNational Children’s Strategy (2000):
Children’s lives will be better understood; their lives will benefit from evaluation, research and information on their needs, rights and the effectiveness of services.
Since the inception of the National Children’s Research Programme, a solid evidence base on children’s liveshas been established. I am confident that the findings emerging from this publication will add greatly to thisevidence base and will also prove to be of enormous benefit to both policymakers and practitioners in thevaluable work they undertake to improve the lives of children in Ireland.
I would like to thank Professor James Williams of the Economic and Social Research Institute and ProfessorSheila Greene of the Children’s Research Centre at Trinity College Dublin, their research team and their teamof fieldworkers who are carrying out this Study. Most importantly, I would also like to thank the 11,100families and carers who have generously given up their valuable time to participate.
Barry Andrews, T.D.Minister for Children and Youth Affairs
FOREWORD
5
TABLE OF CONTENTS1. INTRODUCTION 8
2. CONCEPTUAL FRAMEWORK 8
3. DATA AND METHODOLOGY 8
4. CHARACTERISTICS OF INFANTS AND THEIR FAMILIES 84.1 Family Type 84.2 Marital Status 94.3 Economic Status 104.4 Citizenship and Country of Birth 114.5 Living with Grandparents 11
5. PREGNANCY AND BIRTH 125.1 Intention to get Pregnant 125.2 Provision of Antenatal Care 125.3 Complications in Pregnancy 135.4 Smoking and Drinking in Pregnancy 14
5.4.1 Smoking 145.4.2 Drinking Alcohol 15
5.5 Birth and Delivery 165.6 Birth Complications 165.7 Birth Weight 175.8 Breastfeeding 17
6. CHILD’S HEALTH 186.1 Mother’s Perception of Infant’s Health at Birth and at Nine Months 186.2 Infant Illness and Disability 186.3 Immunisation 19
7. INFANTS’ ROUTINES AND DEVELOPMENTAL STATUS 197.1 Sleep 197.2 Solid Food 207.3 Developmental Status 20
8. CHILDCARE 218.1 Parental and Non-Parental Care 218.2 Duration and Cost of Non-parental Childcare 228.3 Impact of Childcare Needs on other Aspects of Mother’s Life 22
9. PARENTING AND SUPPORT 239.1 Introduction 239.2 Parent-Child Attachment 239.3 Parental Stress 239.4 Fathers’ Parenting Role 249.5 Parenting Support and Contact with Grandparents 24
9.5.1 Perceived Support Available in Bringing up a Child 249.5.2 Contact with and Support Received from infant’s grandparents 25
10. MOTHER’S EMPLOYMENT STATUS 2510.1 Employment Status Before the Birth 2510.2 Maternity Leave 2510.3 Employment Status after the Birth and Future Work Intentions 2610.4 Work-life Balance 26
11. NEIGHBOURHOOD 2811.1 Quality of the Neighbourhood Environment 2811.2 Perceived Safety of the Neighbourhood 2911.3 Services in the Community 29
12. SUMMARY 29
Growing Up in Ireland • THE INFANTS AND THEIR FAMILIES
6
LIST OF TABLESTable 1: Country of birth of mothers and fathers of infants 11Table 2: Number of weeks’ pregnancy when mother had her first antenatal appointment
classified by family type 13Table 3: Percentage of mothers smoking at time of interview who also smoked at some
stage of pregnancy and who smoked in all three trimesters classified by maternal education 15
Table 4: Distribution of usual times for infants to get up and go to sleep for the night 19Table 5: Main type of childcare used 21Table 6: Breakdown of main type of childcare provision to the Study Child 21Table 7: Hours, cost and age of baby classified by main type of non-parental childcare used 22Table 8: Percentage of mothers who reported that difficulties in arranging childcare had
affected various aspects of their lives 22Table 9: Father’s report of the most important things for him to do for his (nine-month-old)
child 24Table 10: Mother’s report of support from grandparents 25
LIST OF FIGURESFigure 1: Family type and size of households in which infants lived 9Figure 2: Family type classified by family equivalised income quintile 9Figure 3: Marital status of nine-month-olds’ mothers 10Figure 4: Principal economic status of mothers and fathers 10 Figure 5: Number of hours worked by mothers and fathers in paid employment 11Figure 6: Percentage of infants living with grandparents classified by family type 12Figure 7: Intentions regarding pregnancy with the Study Infant 12Figure 8: Use of private consultant or hospital clinic only for antenatal care classified by income 13Figure 9: Incidence of pregnancy complications 14Figure 10: Smoking (a) at any stage in pregnancy, (b) in all three trimesters, and (c) at time of
interview when infant was aged nine months 14Figure 11: Drinking alcohol (a) at any stage in pregnancy, (b) in all three trimesters, and (c) at
time of interview when infant was aged nine months 15Figure 12: Final delivery method 16Figure 13: Birth complications (as a percentage of all births) 16Figure 14: Ever breastfed classified by mother's education and whether or not she was
born in Ireland 17Figure 15: Mother’s perception of infants’ health at birth and at nine months 18Figure 16: Most common illnesses for infants as reported by mothers 18Figure 17: Percentage of infants who had received their six-month vaccination classified by
family structure, whether or not mother was born in Ireland and family social class 19Figure 18: Percentage of infants failing to meet the target score expected of 10-month
olds for individual developmental areas measured by the ASQ 20Figure 19: Mother’s total parental stress score classified by family type 24Figure 20: Mother’s report of when she stopped working before the infant's birth,
classified by family income quintile 26Figure 21: Mother’s report of having missed out on home or family activities, classified by
family income quintile and mother’s highest level of educational attainment 27Figure 22: Mother’s report of having to turn down work activities or opportunities as a
result of family responsibilities classified by family income quintile 27Figure 23: Percentage of mothers rating a number of physical conditions as ‘very common’
or ‘fairly common’ classified by family income quintile 28Figure 24: Percentage of mothers recording that specified services were available in their
local area 29
CONTENTS
7
1. INTRODUCTION
Growing Up in Ireland tracks the development of two groups of children – an Infant Cohort (at ninemonths) and a Child Cohort (at nine years). The current report presents the first summary of thechartacteristics and circumstances of nine-month-olds in Ireland today.
The principal objective of Growing Up in Ireland is to describe the lives of children and, in particular, toestablish what is typical and normal as well as what is atypical and problematic. The Study focuses on abroad range of child outcomes. In so doing, it will facilitate comparison with findings from similar studies ofchildren elsewhere, as well as establishing norms for Ireland. Being longitudinal in nature, the Study will alsoaddress developmental trajectories over time and explore the factors that most affect those trajectories andthe life chances of children as they grow from nine months to early childhood (in the case of the InfantCohort).
2. CONCEPTUAL FRAMEWORK
The conceptual framework adopted by Growing Up in Ireland emphasises children’s connectedness to theworld within which they live. It sees the child’s world as being made up of a multilayered set ofinterconnecting environmental systems, all of which influence the developing child to greater or lesserdegrees. Parents (and family members such as siblings and grandparents, if they are present) are the mostinfluential part of the ecology in early child development as are, for example, childcare and pre-schoolarrangements. Outside the immediate family surroundings the child is influenced by (and influences) otherimportant relationships, such as those in the community/neighbourhood and, later in the child’s life, school.The reciprocal relationships between home, wider family, community/neighbourhood and school have abearing on the child’s development, as do the institutional structures of government policy in areas such aseducation, health and social welfare, as well as the less formal social norms within the child’s localneighbourhood or community.
3. DATA AND METHODOLOGY
The Infant Cohort of Growing Up in Ireland is based on a nationally representative sample of 11,100 familiesand their nine-month-old child. The sample was randomly selected from the Child Benefit Register which ismaintained by the Department of Social Protection. The response rate for the survey was 65% of all familiesselected or 69% of those who were successfully contacted by an interviewer.
The Child Benefit Register contained a total of 73,662 infants who were nine months of age, 51.8% ofwhom were boys. All children included in the Study were born between December 2007 and May 2008.
4. CHARACTERISTICS OF INFANTS AND THEIR FAMILIES
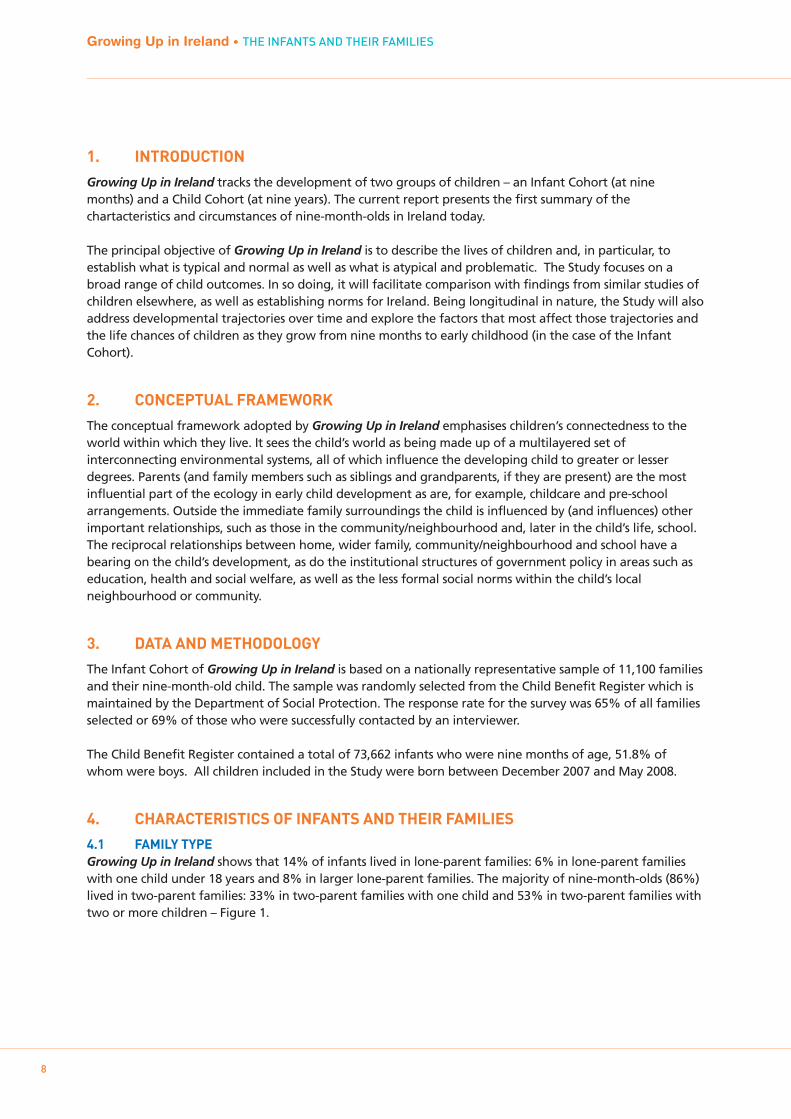
4.1 FAMILY TYPEGrowing Up in Ireland shows that 14% of infants lived in lone-parent families: 6% in lone-parent familieswith one child under 18 years and 8% in larger lone-parent families. The majority of nine-month-olds (86%)lived in two-parent families: 33% in two-parent families with one child and 53% in two-parent families withtwo or more children – Figure 1.
Growing Up in Ireland • THE INFANTS AND THEIR FAMILIES
8
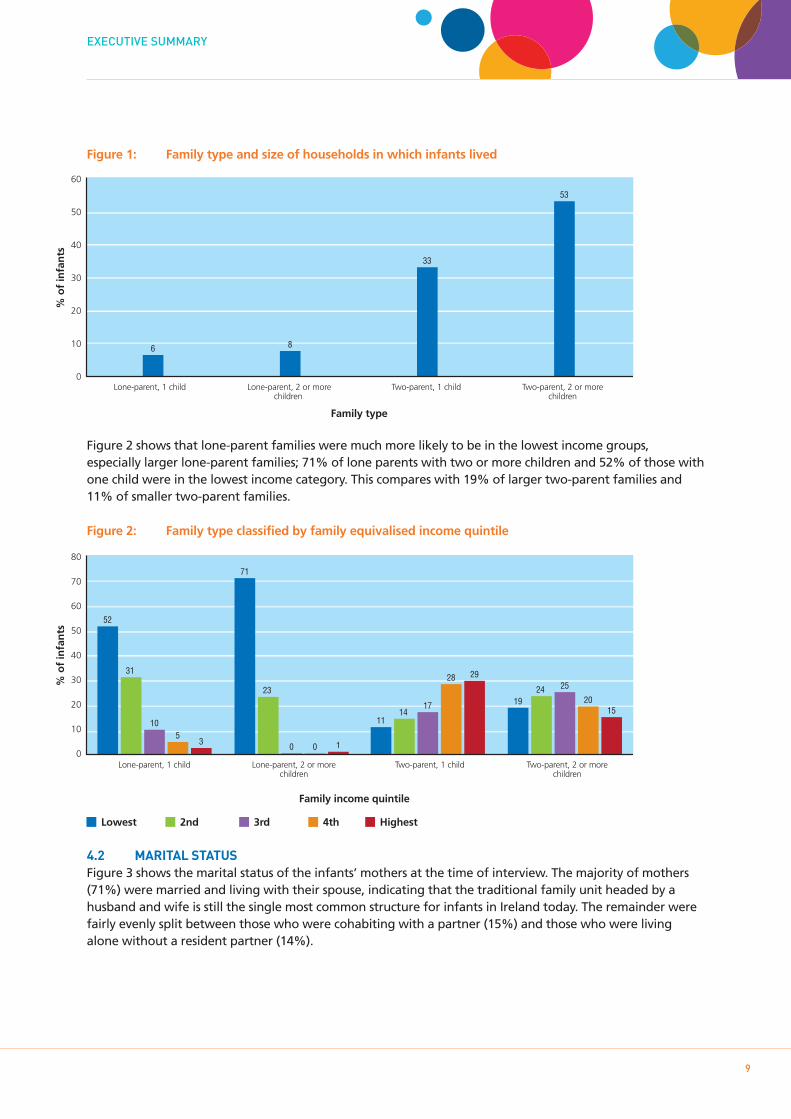
Figure 1: Family type and size of households in which infants lived
Figure 2 shows that lone-parent families were much more likely to be in the lowest income groups,especially larger lone-parent families; 71% of lone parents with two or more children and 52% of those withone child were in the lowest income category. This compares with 19% of larger two-parent families and11% of smaller two-parent families.
Figure 2: Family type classified by family equivalised income quintile
4.2 MARITAL STATUSFigure 3 shows the marital status of the infants’ mothers at the time of interview. The majority of mothers(71%) were married and living with their spouse, indicating that the traditional family unit headed by ahusband and wife is still the single most common structure for infants in Ireland today. The remainder werefairly evenly split between those who were cohabiting with a partner (15%) and those who were livingalone without a resident partner (14%).
EXECUTIVE SUMMARY
9
Lone-parent, 1 child Lone-parent, 2 or morechildren
Two-parent, 1 child Two-parent, 2 or morechildren
% o
f in
fan
ts
60
50
40
30
20
10
0
6 8
33
53
Family type
Lone-parent, 1 child Lone-parent, 2 or morechildren
Two-parent, 1 child Two-parent, 2 or morechildren
80
70
60
50
40
30
20
10
0
% o
f in
fan
ts
52
31
105
3
71
23
0 0 1
1114
17
28 29
1924 25
2015
Family income quintile
Lowest 2nd 3rd 4th Highest
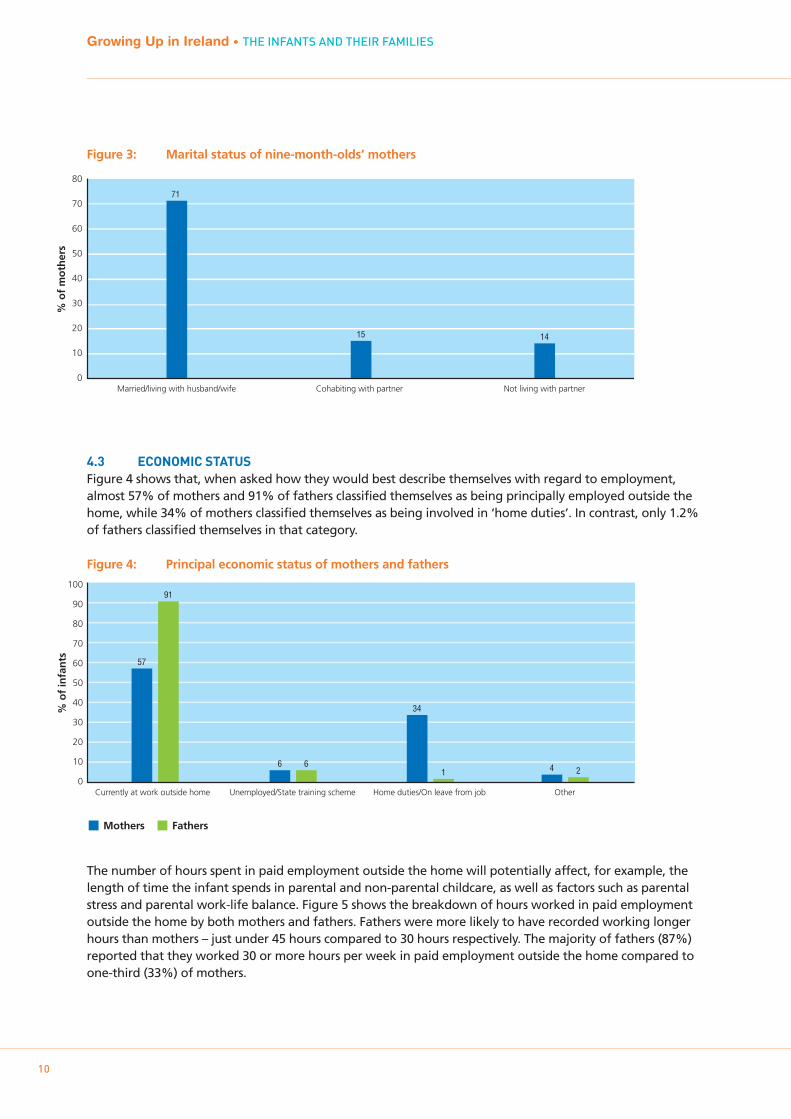
Figure 3: Marital status of nine-month-olds’ mothers
4.3 ECONOMIC STATUSFigure 4 shows that, when asked how they would best describe themselves with regard to employment,almost 57% of mothers and 91% of fathers classified themselves as being principally employed outside thehome, while 34% of mothers classified themselves as being involved in ‘home duties’. In contrast, only 1.2%of fathers classified themselves in that category.
Figure 4: Principal economic status of mothers and fathers
The number of hours spent in paid employment outside the home will potentially affect, for example, thelength of time the infant spends in parental and non-parental childcare, as well as factors such as parentalstress and parental work-life balance. Figure 5 shows the breakdown of hours worked in paid employmentoutside the home by both mothers and fathers. Fathers were more likely to have recorded working longerhours than mothers – just under 45 hours compared to 30 hours respectively. The majority of fathers (87%)reported that they worked 30 or more hours per week in paid employment outside the home compared toone-third (33%) of mothers.
Growing Up in Ireland • THE INFANTS AND THEIR FAMILIES
10
% o
f m
oth
ers
80
70
60
50
40
30
20
10
0Married/living with husband/wife Cohabiting with partner Not living with partner
71
15 14
Currently at work outside home
Mothers
% o
f in
fan
ts
100
90
80
70
60
50
40
30
20
10
0
57
91
Unemployed/State training scheme
6 6
Home duties/On leave from job
34
1
Other
4 2
Fathers
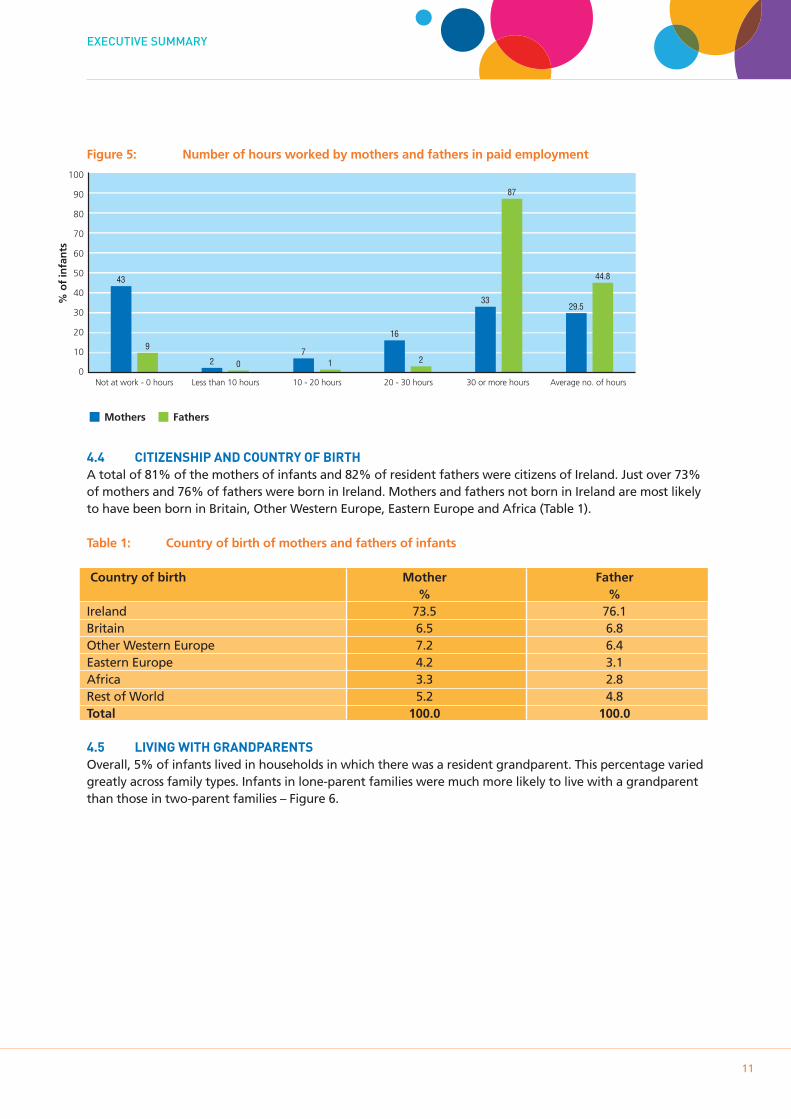
Figure 5: Number of hours worked by mothers and fathers in paid employment
4.4 CITIZENSHIP AND COUNTRY OF BIRTHA total of 81% of the mothers of infants and 82% of resident fathers were citizens of Ireland. Just over 73%of mothers and 76% of fathers were born in Ireland. Mothers and fathers not born in Ireland are most likelyto have been born in Britain, Other Western Europe, Eastern Europe and Africa (Table 1).
Table 1: Country of birth of mothers and fathers of infants
Country of birth Mother Father% %
Ireland 73.5 76.1Britain 6.5 6.8Other Western Europe 7.2 6.4Eastern Europe 4.2 3.1Africa 3.3 2.8Rest of World 5.2 4.8Total 100.0 100.0
4.5 LIVING WITH GRANDPARENTSOverall, 5% of infants lived in households in which there was a resident grandparent. This percentage variedgreatly across family types. Infants in lone-parent families were much more likely to live with a grandparentthan those in two-parent families – Figure 6.
EXECUTIVE SUMMARY
11
100
90
80
70
60
50
40
30
20
10
0
% o
f in
fan
ts
43
9
2 0 1
16
2
33
7
87
29.5
44.8
Mothers Fathers
Not at work - 0 hours Less than 10 hours 10 - 20 hours 20 - 30 hours 30 or more hours Average no. of hours
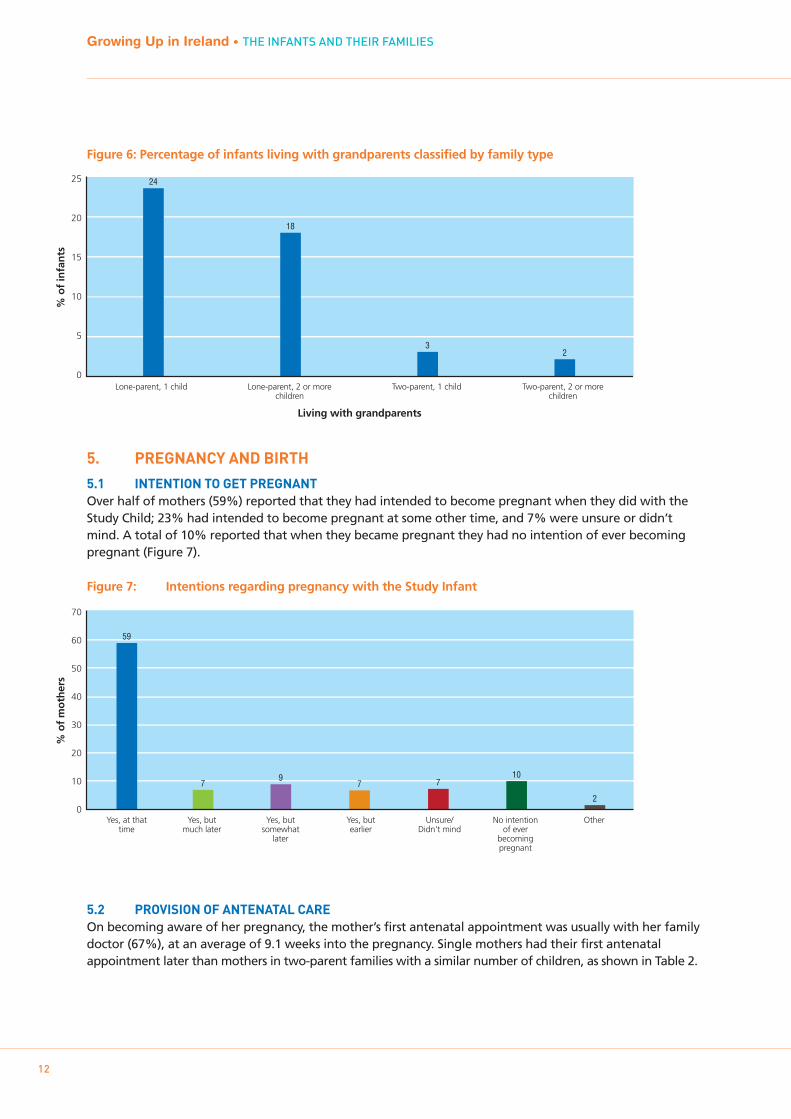
Figure 6: Percentage of infants living with grandparents classified by family type
5. PREGNANCY AND BIRTH
5.1 INTENTION TO GET PREGNANTOver half of mothers (59%) reported that they had intended to become pregnant when they did with theStudy Child; 23% had intended to become pregnant at some other time, and 7% were unsure or didn’tmind. A total of 10% reported that when they became pregnant they had no intention of ever becomingpregnant (Figure 7).
Figure 7: Intentions regarding pregnancy with the Study Infant
5.2 PROVISION OF ANTENATAL CAREOn becoming aware of her pregnancy, the mother’s first antenatal appointment was usually with her familydoctor (67%), at an average of 9.1 weeks into the pregnancy. Single mothers had their first antenatalappointment later than mothers in two-parent families with a similar number of children, as shown in Table 2.
Growing Up in Ireland • THE INFANTS AND THEIR FAMILIES
12
Lone-parent, 1 child Lone-parent, 2 or morechildren
Two-parent, 1 child Two-parent, 2 or morechildren
% o
f in
fan
ts
25
20
15
10
5
0
24
18
32
Living with grandparents
70
60
50
40
30
20
10
0
% o
f m
oth
ers
Yes, at thattime
Yes, butmuch later
Yes, butsomewhat
later
Yes, butearlier
Unsure/Didn't mind
No intentionof ever
becomingpregnant
Other
59
79
7 710
2
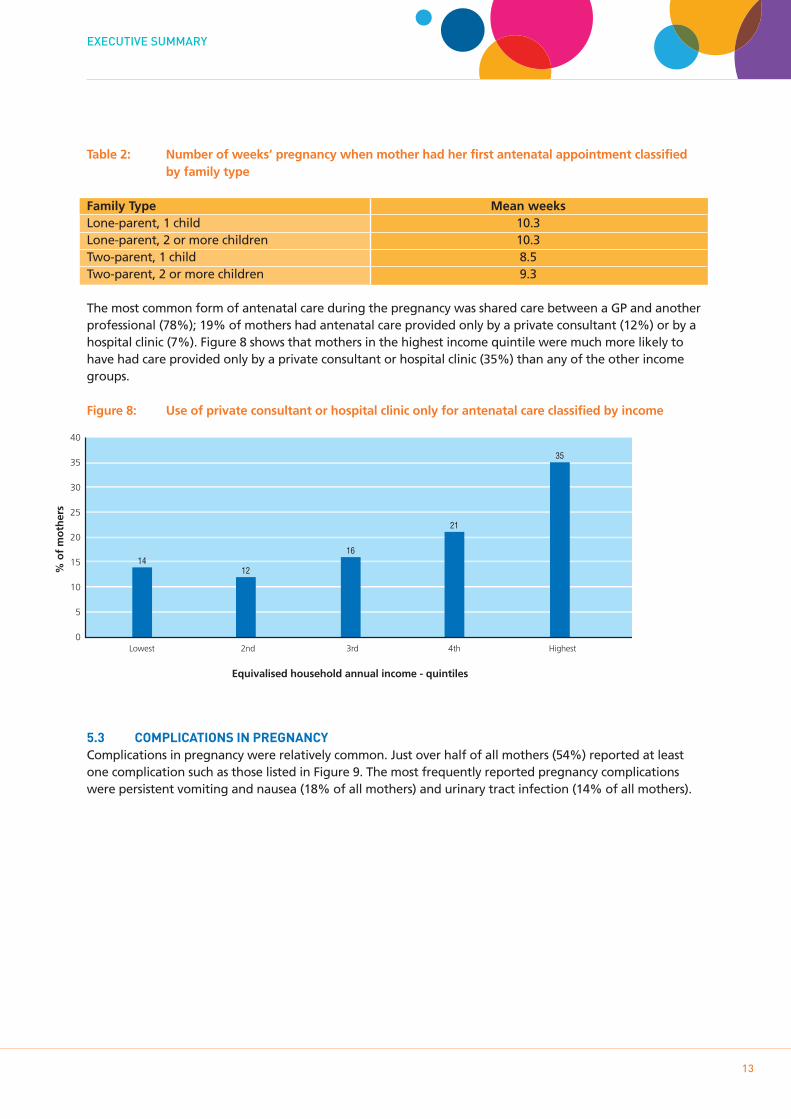
Table 2: Number of weeks’ pregnancy when mother had her first antenatal appointment classifiedby family type
Family Type Mean weeksLone-parent, 1 child 10.3Lone-parent, 2 or more children 10.3Two-parent, 1 child 8.5Two-parent, 2 or more children 9.3
The most common form of antenatal care during the pregnancy was shared care between a GP and anotherprofessional (78%); 19% of mothers had antenatal care provided only by a private consultant (12%) or by ahospital clinic (7%). Figure 8 shows that mothers in the highest income quintile were much more likely tohave had care provided only by a private consultant or hospital clinic (35%) than any of the other incomegroups.
Figure 8: Use of private consultant or hospital clinic only for antenatal care classified by income
5.3 COMPLICATIONS IN PREGNANCYComplications in pregnancy were relatively common. Just over half of all mothers (54%) reported at leastone complication such as those listed in Figure 9. The most frequently reported pregnancy complicationswere persistent vomiting and nausea (18% of all mothers) and urinary tract infection (14% of all mothers).
EXECUTIVE SUMMARY
13
% o
f m
oth
ers
40
35
30
25
20
15
10
5
0
1412
16
21
35
Equivalised household annual income - quintiles
Lowest 2nd 3rd 4th Highest
Small baby on scan (Intrauterine Growth Restriction)
Gestational diabetes (diet-treated)
Placenta praevia
Vaginal infection
Influenza
Rhesus incompatibility
Bleeding during second half of pregnancy
Pre-eclampsia
Raised blood pressure
Urinary tract infection
Persistent vomiting or nausea
Percentage of mothers
2
2
3
4
4
4
6
7
11
14
18
0 2 4 6 8 10 12 14 16 18 20
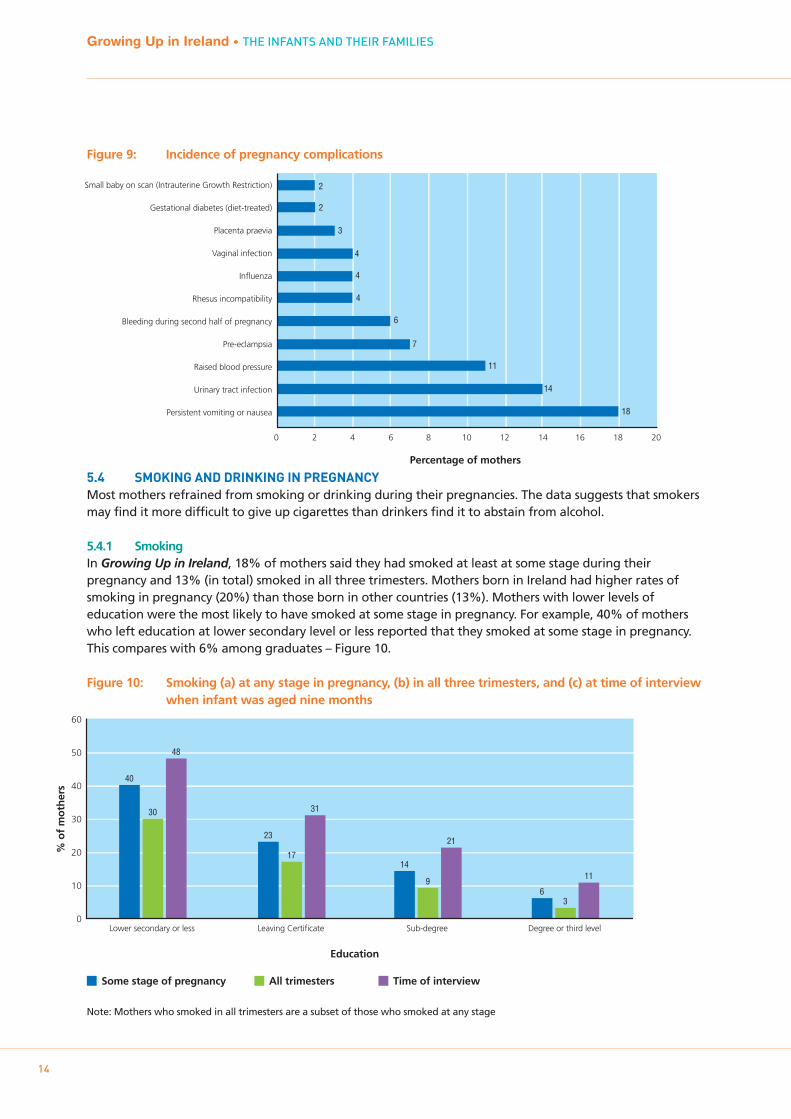
Figure 9: Incidence of pregnancy complications
5.4 SMOKING AND DRINKING IN PREGNANCYMost mothers refrained from smoking or drinking during their pregnancies. The data suggests that smokersmay find it more difficult to give up cigarettes than drinkers find it to abstain from alcohol.
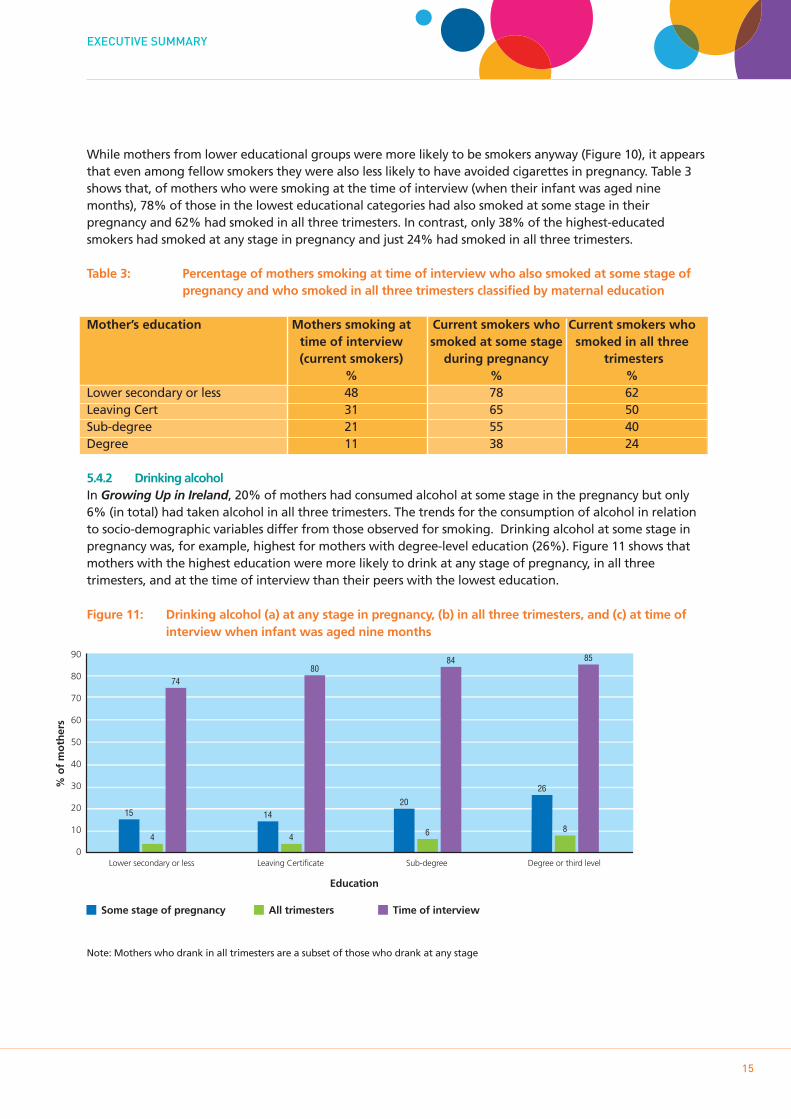
5.4.1 SmokingIn Growing Up in Ireland, 18% of mothers said they had smoked at least at some stage during theirpregnancy and 13% (in total) smoked in all three trimesters. Mothers born in Ireland had higher rates ofsmoking in pregnancy (20%) than those born in other countries (13%). Mothers with lower levels ofeducation were the most likely to have smoked at some stage in pregnancy. For example, 40% of motherswho left education at lower secondary level or less reported that they smoked at some stage in pregnancy.This compares with 6% among graduates – Figure 10.
Figure 10: Smoking (a) at any stage in pregnancy, (b) in all three trimesters, and (c) at time of interview when infant was aged nine months
Note: Mothers who smoked in all trimesters are a subset of those who smoked at any stage
Growing Up in Ireland • THE INFANTS AND THEIR FAMILIES
14
60
50
40
30
20
10
0Lower secondary or less
% o
f m
oth
ers
40
30
48
Leaving Certificate
23
17
31
Sub-degree
14
9
21
Degree or third level
63
11
Education
Some stage of pregnancy All trimesters Time of interview
90
80
70
60
50
40
30
20
10
0Lower secondary or less
% o
f m
oth
ers
15
4
74
Leaving Certificate
14
4
80
Sub-degree
20
6
84
Degree or third level
26
8
85
Education
Some stage of pregnancy All trimesters Time of interview
While mothers from lower educational groups were more likely to be smokers anyway (Figure 10), it appearsthat even among fellow smokers they were also less likely to have avoided cigarettes in pregnancy. Table 3shows that, of mothers who were smoking at the time of interview (when their infant was aged ninemonths), 78% of those in the lowest educational categories had also smoked at some stage in theirpregnancy and 62% had smoked in all three trimesters. In contrast, only 38% of the highest-educatedsmokers had smoked at any stage in pregnancy and just 24% had smoked in all three trimesters.
Table 3: Percentage of mothers smoking at time of interview who also smoked at some stage of pregnancy and who smoked in all three trimesters classified by maternal education
Mother’s education Mothers smoking at Current smokers who Current smokers whotime of interview smoked at some stage smoked in all three(current smokers) during pregnancy trimesters
% % %Lower secondary or less 48 78 62Leaving Cert 31 65 50Sub-degree 21 55 40Degree 11 38 24
5.4.2 Drinking alcoholIn Growing Up in Ireland, 20% of mothers had consumed alcohol at some stage in the pregnancy but only6% (in total) had taken alcohol in all three trimesters. The trends for the consumption of alcohol in relationto socio-demographic variables differ from those observed for smoking. Drinking alcohol at some stage inpregnancy was, for example, highest for mothers with degree-level education (26%). Figure 11 shows thatmothers with the highest education were more likely to drink at any stage of pregnancy, in all threetrimesters, and at the time of interview than their peers with the lowest education.
Figure 11: Drinking alcohol (a) at any stage in pregnancy, (b) in all three trimesters, and (c) at time of interview when infant was aged nine months
Note: Mothers who drank in all trimesters are a subset of those who drank at any stage
EXECUTIVE SUMMARY
15
16
Growing Up in Ireland • THE INFANTS AND THEIR FAMILIES
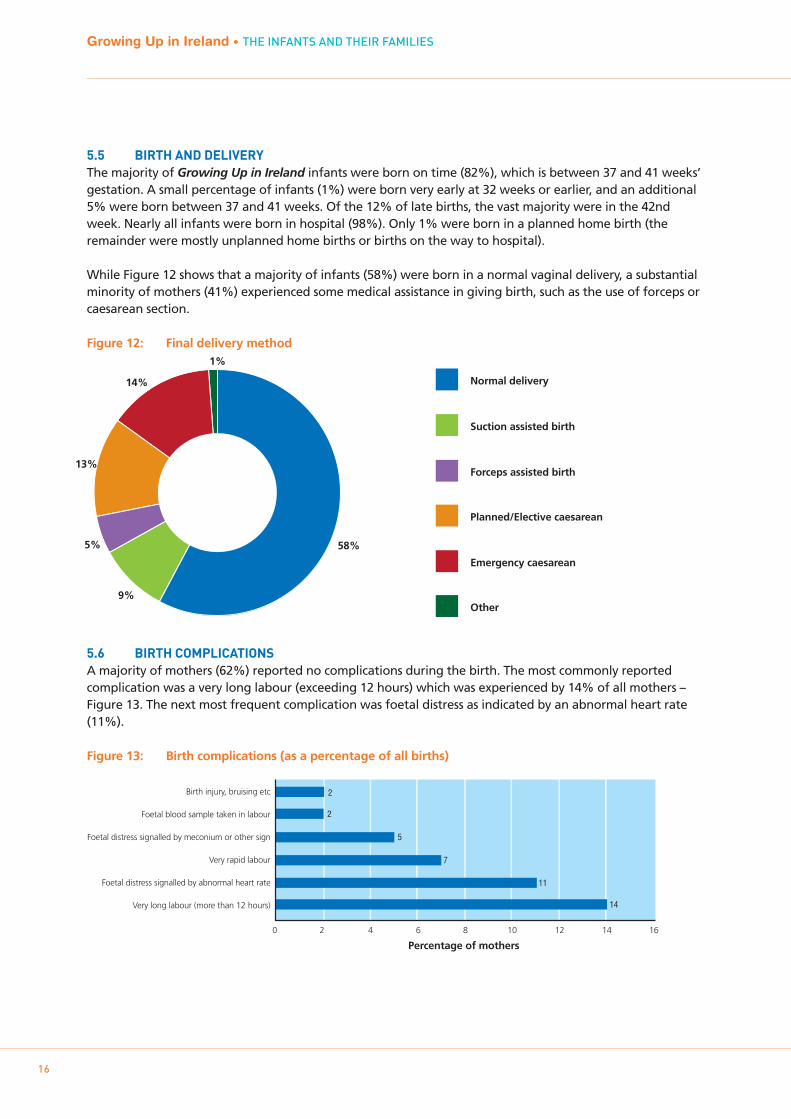
5.5 BIRTH AND DELIVERYThe majority of Growing Up in Ireland infants were born on time (82%), which is between 37 and 41 weeks’gestation. A small percentage of infants (1%) were born very early at 32 weeks or earlier, and an additional5% were born between 37 and 41 weeks. Of the 12% of late births, the vast majority were in the 42ndweek. Nearly all infants were born in hospital (98%). Only 1% were born in a planned home birth (theremainder were mostly unplanned home births or births on the way to hospital).
While Figure 12 shows that a majority of infants (58%) were born in a normal vaginal delivery, a substantialminority of mothers (41%) experienced some medical assistance in giving birth, such as the use of forceps orcaesarean section.
Figure 12: Final delivery method
5.6 BIRTH COMPLICATIONSA majority of mothers (62%) reported no complications during the birth. The most commonly reportedcomplication was a very long labour (exceeding 12 hours) which was experienced by 14% of all mothers –Figure 13. The next most frequent complication was foetal distress as indicated by an abnormal heart rate(11%).
Figure 13: Birth complications (as a percentage of all births)
58%
9%
5%
13%
14%
1%
Other
Emergency caesarean
Planned/Elective caesarean
Forceps assisted birth
Suction assisted birth
Normal delivery
Birth injury, bruising etc
Foetal blood sample taken in labour
Foetal distress signalled by meconium or other sign
Very rapid labour
Foetal distress signalled by abnormal heart rate
Very long labour (more than 12 hours)
Percentage of mothers
2
2
5
7
11
14
0 2 4 6 8 10 12 14 16
17
EXECUTIVE SUMMARY
5.7 BIRTH WEIGHTThe average infant weighed 3.47 kgs at birth according to mother’s report. Boys weighed slightly more atbirth than girls (mean of 3.53 kgs versus 3.40 kgs). Mothers with the least education gave birth to infantsthat were lighter (3.37 kgs) than infants born to more highly educated mothers (for example, 3.52 kgs forgraduate mothers).
Just over 5% of Growing Up in Ireland infants were classified as low birth weight (defined as less than 2.5kgs).
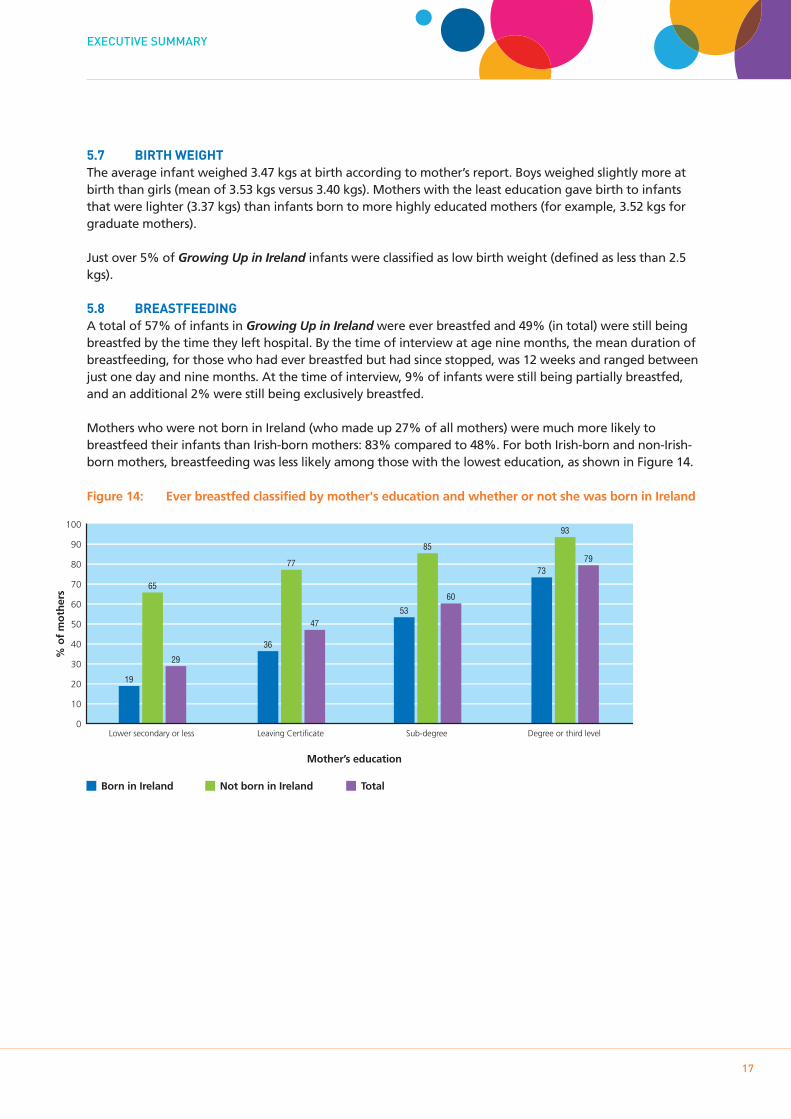
5.8 BREASTFEEDINGA total of 57% of infants in Growing Up in Ireland were ever breastfed and 49% (in total) were still beingbreastfed by the time they left hospital. By the time of interview at age nine months, the mean duration ofbreastfeeding, for those who had ever breastfed but had since stopped, was 12 weeks and ranged betweenjust one day and nine months. At the time of interview, 9% of infants were still being partially breastfed,and an additional 2% were still being exclusively breastfed.
Mothers who were not born in Ireland (who made up 27% of all mothers) were much more likely tobreastfeed their infants than Irish-born mothers: 83% compared to 48%. For both Irish-born and non-Irish-born mothers, breastfeeding was less likely among those with the lowest education, as shown in Figure 14.
Figure 14: Ever breastfed classified by mother's education and whether or not she was born in Ireland
100
90
80
70
60
50
40
30
20
10
0Lower secondary or less
% o
f m
oth
ers
19
65
29
Leaving Certificate
36
77
47
Sub-degree
53
85
60
Degree or third level
73
93
79
Mother’s education
Born in Ireland Not born in Ireland Total
6. CHILD’S HEALTH
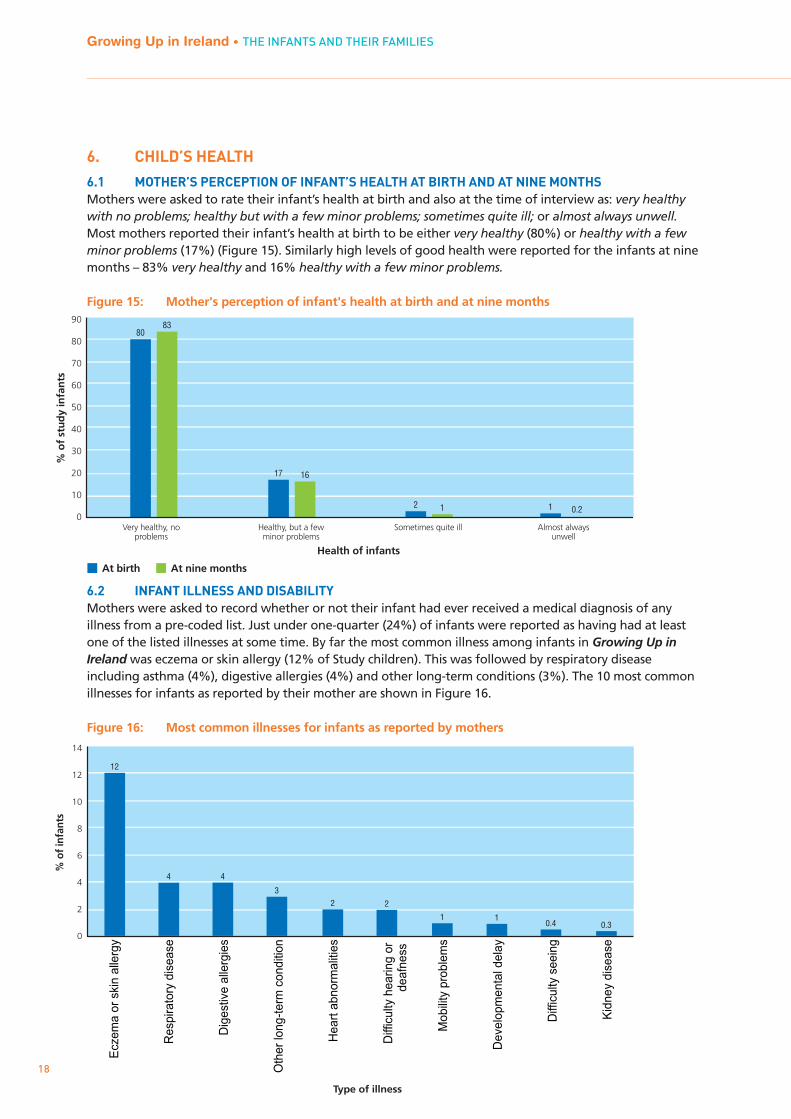
6.1 MOTHER’S PERCEPTION OF INFANT’S HEALTH AT BIRTH AND AT NINE MONTHSMothers were asked to rate their infant’s health at birth and also at the time of interview as: very healthywith no problems; healthy but with a few minor problems; sometimes quite ill; or almost always unwell.Most mothers reported their infant’s health at birth to be either very healthy (80%) or healthy with a fewminor problems (17%) (Figure 15). Similarly high levels of good health were reported for the infants at ninemonths – 83% very healthy and 16% healthy with a few minor problems.
Figure 15: Mother's perception of infant's health at birth and at nine months
6.2 INFANT ILLNESS AND DISABILITYMothers were asked to record whether or not their infant had ever received a medical diagnosis of anyillness from a pre-coded list. Just under one-quarter (24%) of infants were reported as having had at leastone of the listed illnesses at some time. By far the most common illness among infants in Growing Up inIreland was eczema or skin allergy (12% of Study children). This was followed by respiratory diseaseincluding asthma (4%), digestive allergies (4%) and other long-term conditions (3%). The 10 most commonillnesses for infants as reported by their mother are shown in Figure 16.
Figure 16: Most common illnesses for infants as reported by mothers
Growing Up in Ireland • THE INFANTS AND THEIR FAMILIES
18
Very healthy, noproblems
At birth
% o
f st
ud
y in
fan
ts
90
80
70
60
50
40
30
20
10
0
8083
Healthy, but a fewminor problems
17 16
Sometimes quite ill
2 1
Almost alwaysunwell
1 0.2
At nine months
Health of infants
Type of illness
Ecz
ema
or s
kin
alle
rgy
Res
pira
tory
dis
ease
Dig
estiv
e al
lerg
ies
Oth
er lo
ng-t
erm
con
ditio
n
Hea
rt a
bnor
mal
ities
Diff
icul
ty h
earin
g or
Mob
ility
pro
blem
s
Dev
elop
men
tal d
elay
Diff
icul
ty s
eein
g
Kid
ney
dise
ase
14
12
10
8
6
4
2
0
% o
f in
fant
s
12
4 4
32 2
1 10.4 0.3
deaf
ness
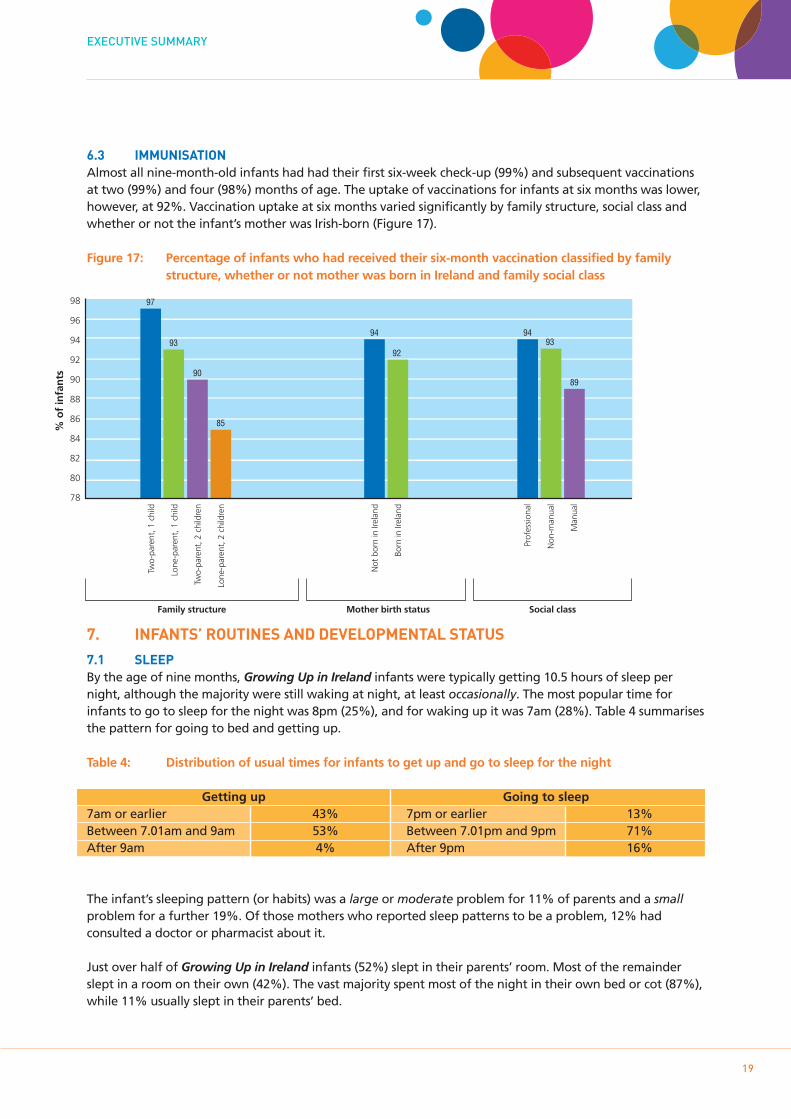
6.3 IMMUNISATIONAlmost all nine-month-old infants had had their first six-week check-up (99%) and subsequent vaccinationsat two (99%) and four (98%) months of age. The uptake of vaccinations for infants at six months was lower,however, at 92%. Vaccination uptake at six months varied significantly by family structure, social class andwhether or not the infant’s mother was Irish-born (Figure 17).
Figure 17: Percentage of infants who had received their six-month vaccination classified by family structure, whether or not mother was born in Ireland and family social class
7. INFANTS’ ROUTINES AND DEVELOPMENTAL STATUS
7.1 SLEEPBy the age of nine months, Growing Up in Ireland infants were typically getting 10.5 hours of sleep pernight, although the majority were still waking at night, at least occasionally. The most popular time forinfants to go to sleep for the night was 8pm (25%), and for waking up it was 7am (28%). Table 4 summarisesthe pattern for going to bed and getting up.
Table 4: Distribution of usual times for infants to get up and go to sleep for the night
Getting up Going to sleep7am or earlier 43% 7pm or earlier 13%Between 7.01am and 9am 53% Between 7.01pm and 9pm 71%After 9am 4% After 9pm 16%
The infant’s sleeping pattern (or habits) was a large or moderate problem for 11% of parents and a smallproblem for a further 19%. Of those mothers who reported sleep patterns to be a problem, 12% hadconsulted a doctor or pharmacist about it.
Just over half of Growing Up in Ireland infants (52%) slept in their parents’ room. Most of the remainderslept in a room on their own (42%). The vast majority spent most of the night in their own bed or cot (87%),while 11% usually slept in their parents’ bed.
EXECUTIVE SUMMARY
19
Two-
pare
nt, 1
chi
ld
Lone
-par
ent,
1 c
hild
Two-
pare
nt, 2
chi
ldre
n
Lone
-par
ent,
2 c
hild
ren
Prof
essi
onal
Non
-man
ual
Man
ual
Not
bor
n in
Irel
and
Born
in Ir
elan
d
98
96
94
92
90
88
86
84
82
80
78
% o
f in
fan
ts
97
90
93
85
94
92
9493
89
Family structure Mother birth status Social class
% n
ot
reac
hin
g t
he
exp
ecte
d s
core
20
18
16
14
12
10
8
6
4
2
0
6
15
8
14
18
Communication Gross motor Fine motor Problem solving Personal social
Current advice to parents is to put infants to sleep on their backs (supine position), as this position isassociated with a lower risk of Sudden Infant Death Syndrome. A majority of mothers in Growing Up inIreland (76%) normally put their baby down to sleep on his/her back. More Irish-born mothers used thesupine position (81%) than mothers born in other countries (61%).
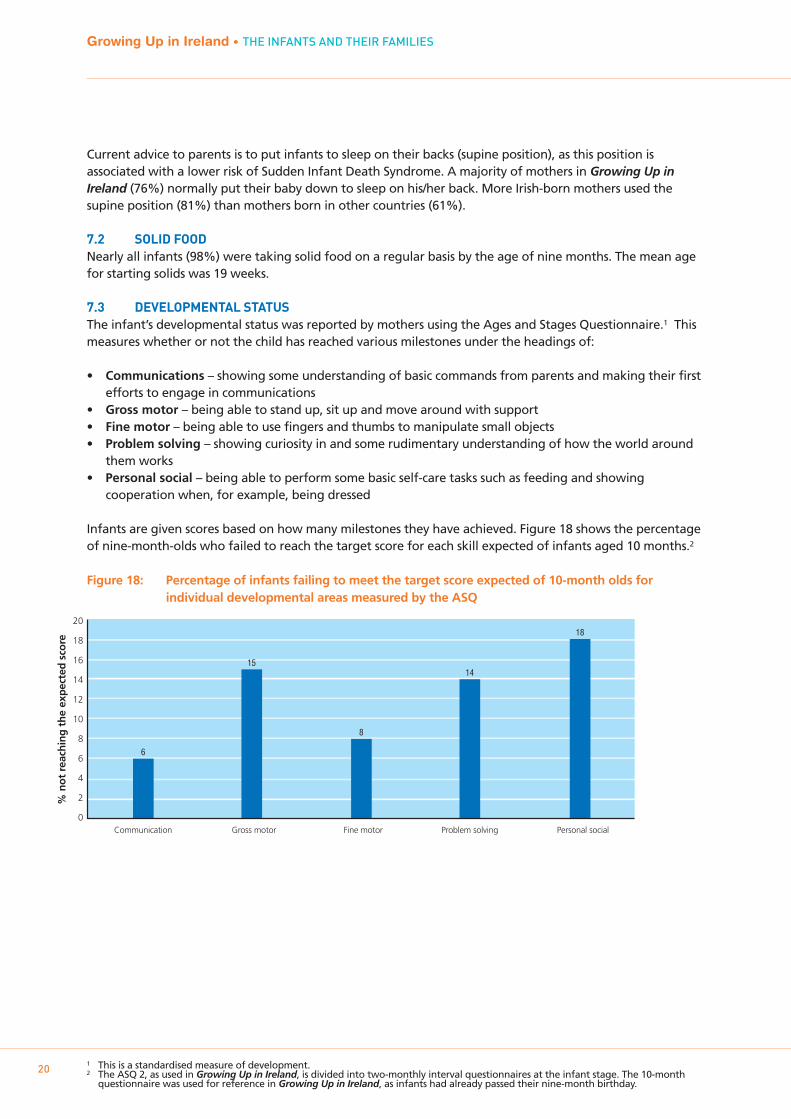
7.2 SOLID FOODNearly all infants (98%) were taking solid food on a regular basis by the age of nine months. The mean agefor starting solids was 19 weeks.
7.3 DEVELOPMENTAL STATUSThe infant’s developmental status was reported by mothers using the Ages and Stages Questionnaire.1 Thismeasures whether or not the child has reached various milestones under the headings of:
• Communications – showing some understanding of basic commands from parents and making their firstefforts to engage in communications
• Gross motor – being able to stand up, sit up and move around with support• Fine motor – being able to use fingers and thumbs to manipulate small objects• Problem solving – showing curiosity in and some rudimentary understanding of how the world around
them works• Personal social – being able to perform some basic self-care tasks such as feeding and showing
cooperation when, for example, being dressed
Infants are given scores based on how many milestones they have achieved. Figure 18 shows the percentageof nine-month-olds who failed to reach the target score for each skill expected of infants aged 10 months.2
Figure 18: Percentage of infants failing to meet the target score expected of 10-month olds for individual developmental areas measured by the ASQ
Growing Up in Ireland • THE INFANTS AND THEIR FAMILIES
201 This is a standardised measure of development.2 The ASQ 2, as used in Growing Up in Ireland, is divided into two-monthly interval questionnaires at the infant stage. The 10-month
questionnaire was used for reference in Growing Up in Ireland, as infants had already passed their nine-month birthday.
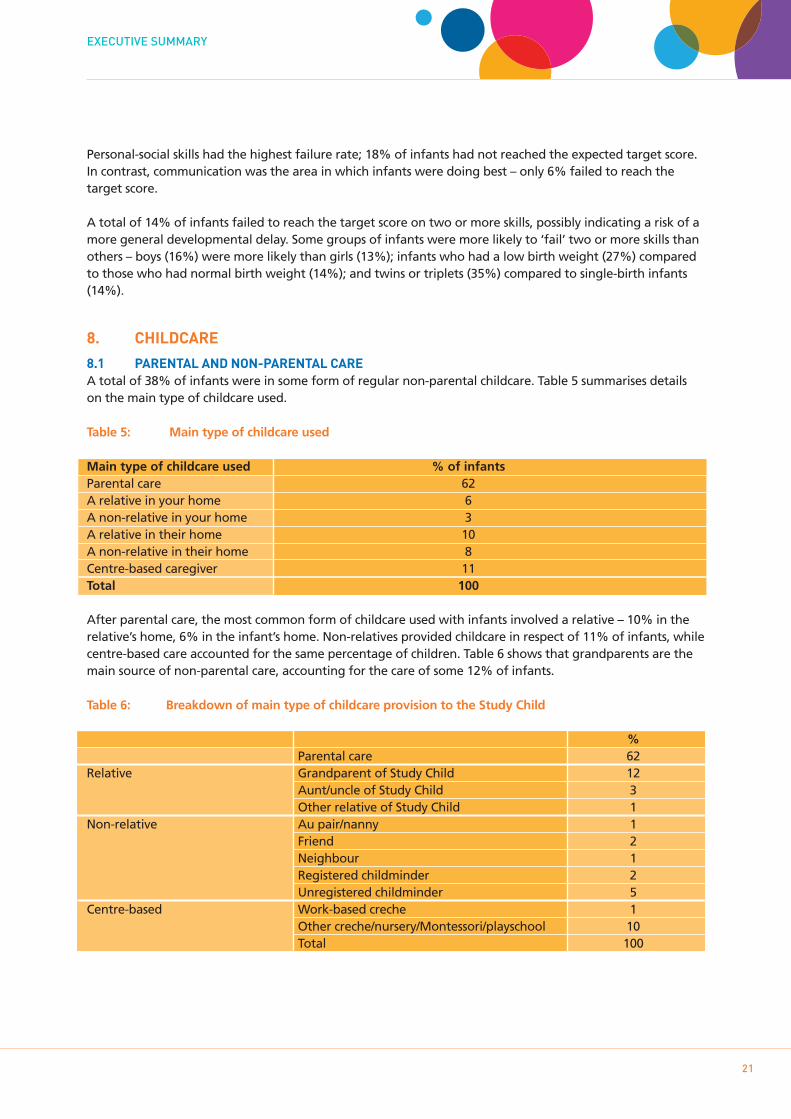
Personal-social skills had the highest failure rate; 18% of infants had not reached the expected target score.In contrast, communication was the area in which infants were doing best – only 6% failed to reach thetarget score.
A total of 14% of infants failed to reach the target score on two or more skills, possibly indicating a risk of amore general developmental delay. Some groups of infants were more likely to ‘fail’ two or more skills thanothers – boys (16%) were more likely than girls (13%); infants who had a low birth weight (27%) comparedto those who had normal birth weight (14%); and twins or triplets (35%) compared to single-birth infants(14%).
8. CHILDCARE
8.1 PARENTAL AND NON-PARENTAL CAREA total of 38% of infants were in some form of regular non-parental childcare. Table 5 summarises detailson the main type of childcare used.
Table 5: Main type of childcare used
Main type of childcare used % of infants Parental care 62A relative in your home 6A non-relative in your home 3A relative in their home 10A non-relative in their home 8Centre-based caregiver 11Total 100
After parental care, the most common form of childcare used with infants involved a relative – 10% in therelative’s home, 6% in the infant’s home. Non-relatives provided childcare in respect of 11% of infants, whilecentre-based care accounted for the same percentage of children. Table 6 shows that grandparents are themain source of non-parental care, accounting for the care of some 12% of infants.
Table 6: Breakdown of main type of childcare provision to the Study Child
%Parental care 62
Relative Grandparent of Study Child 12Aunt/uncle of Study Child 3Other relative of Study Child 1
Non-relative Au pair/nanny 1Friend 2Neighbour 1Registered childminder 2Unregistered childminder 5
Centre-based Work-based creche 1Other creche/nursery/Montessori/playschool 10Total 100
EXECUTIVE SUMMARY
21
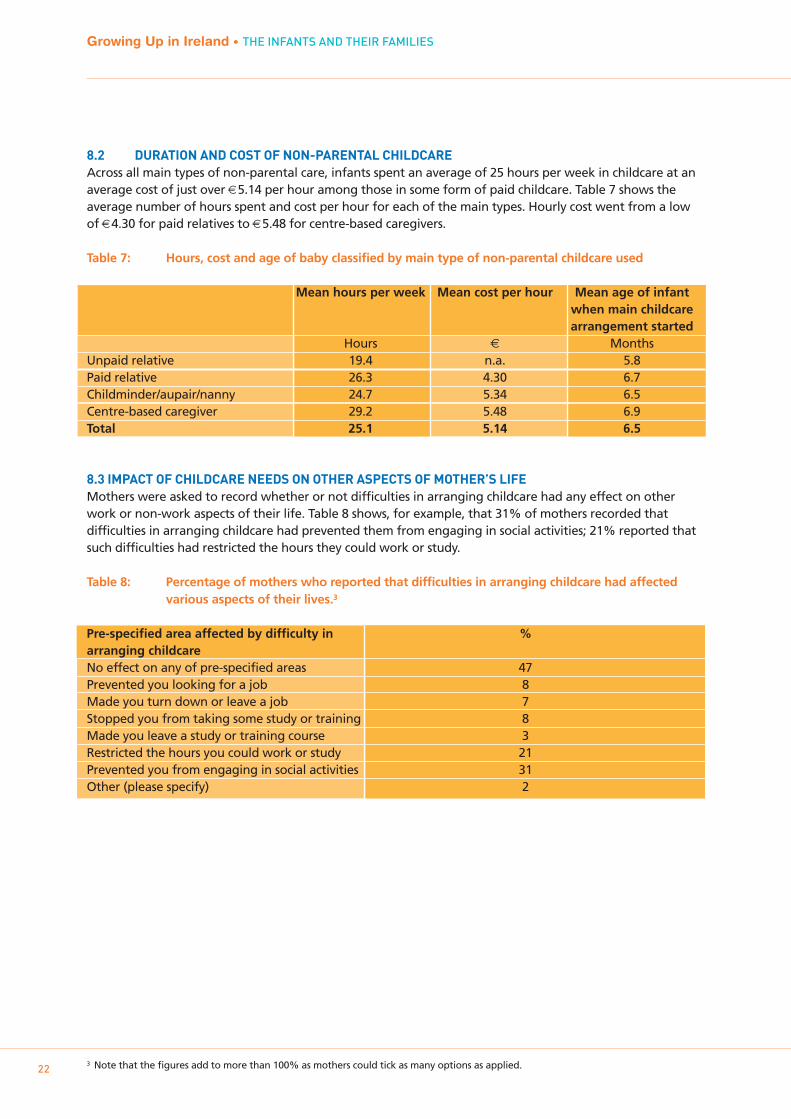
8.2 DURATION AND COST OF NON-PARENTAL CHILDCARE Across all main types of non-parental care, infants spent an average of 25 hours per week in childcare at anaverage cost of just over €5.14 per hour among those in some form of paid childcare. Table 7 shows theaverage number of hours spent and cost per hour for each of the main types. Hourly cost went from a lowof €4.30 for paid relatives to €5.48 for centre-based caregivers.
Table 7: Hours, cost and age of baby classified by main type of non-parental childcare used
Mean hours per week Mean cost per hour Mean age of infant when main childcarearrangement started
Hours € MonthsUnpaid relative 19.4 n.a. 5.8Paid relative 26.3 4.30 6.7Childminder/aupair/nanny 24.7 5.34 6.5Centre-based caregiver 29.2 5.48 6.9Total 25.1 5.14 6.5
8.3 IMPACT OF CHILDCARE NEEDS ON OTHER ASPECTS OF MOTHER’S LIFEMothers were asked to record whether or not difficulties in arranging childcare had any effect on otherwork or non-work aspects of their life. Table 8 shows, for example, that 31% of mothers recorded thatdifficulties in arranging childcare had prevented them from engaging in social activities; 21% reported thatsuch difficulties had restricted the hours they could work or study.
Table 8: Percentage of mothers who reported that difficulties in arranging childcare had affected various aspects of their lives.3
Pre-specified area affected by difficulty in %arranging childcareNo effect on any of pre-specified areas 47Prevented you looking for a job 8Made you turn down or leave a job 7Stopped you from taking some study or training 8Made you leave a study or training course 3Restricted the hours you could work or study 21Prevented you from engaging in social activities 31Other (please specify) 2
Growing Up in Ireland • THE INFANTS AND THEIR FAMILIES
223 Note that the figures add to more than 100% as mothers could tick as many options as applied.
9. PARENTING AND SUPPORT
9.1 INTRODUCTIONThe family is often regarded as being the primary and most fundamental social system influencing a child’sdevelopment and learning. Within the family, parents typically have a central role in influencing the natureand the quality of their children’s lives.
9.2 PARENT-CHILD ATTACHMENTAttachment represents the deep and enduring bond between children and their parents. It provides theearly foundation for a child’s sense of security and is seen as a key contributor to socio-emotional growthand development in the infant to toddler period.
The Quality of Attachment subscale from the Maternal Postnatal Attachment Scale was administered tomothers to assess their emotional attachment to the child.4 It includes questions about how mothers feel intheir interactions with the infant in a parenting role (competent, tense, patient) as well as their feelingstowards the infant (pride, affection, enjoyment). These items were used to calculate a total Quality ofAttachment score.
Mothers tended to rate all items very positively, although it may be of interest to note that 24% felt“slightly guilty that I am not more involved” and a further 7% felt moderately or very guilty about theirlevel of involvement. While 78% “almost never” felt tense and anxious when with the Study Infant, 21%reported feeling this way “occasionally”. Overall, however, very high levels of attachment were reported.The mean score was 42.5 out of a possible 45.
Fathers were asked to complete a shorter set of questions about their attachment to the infant.5 Again,overall attachment levels were very high, with a mean score of 24.1 out of a possible 25. Littledifferentiation was evident across the socio-demographic groupings.
9.3 PARENTAL STRESSParental stress was measured using the Parental Stress Scale (Berry and Jones, 1995).6 Parents were asked torecord their level of disagreement or otherwise with each of 18 questions which make up the scale.
In general, both parents reported reasonably low levels of stress on the total stress score: mothers scored amean of 32.2 and fathers a mean of 30.8 (out of a maximum of 90). Stress levels of both parents wererelated to income and other measures of advantage/disadvantage, being higher for more disadvantagedgroups. In addition, stress among mothers was related to family type, being higher in single- than two-parent families.
Further, mothers with two or more children (in both single-parent and two-parent families) had higherlevels of stress than those with one child. Mothers in two-parent families with one child had a mean totalstress score of 31.1 and those with two or more children had a score of 32.2. This score rose to 34.1 for loneparents with one child and rose again to 35.4 for those with two or more children (Figure 19).
EXECUTIVE SUMMARY
23
4 The nine-item Quality of Attachment subscale from the Maternal Postnatal Attachment Scale (Condon & Corkindale, 1998).Condon, J.T. and Corkindale, C.J. (1998). The assessment of parent-to-infant attachment: Development of a self-report questionnaireinstrument. Journal of Reproductive & Infant Psychology, 16, 1, 57-76.
5 The five-item Quality of Attachment subscale from the Paternal Postnatal Attachment Scale (Condon & Corkindale, 2008).Condon, J.T., Corkindale, C.J., & Boyce, P. (2008). Assessment of postnatal paternal-infant attachment: Development of a questionnaireinstrument. Journal of Reproductive and Infant Psychology, 26, 3, 195-210.
6 Berry, J.O. & Jones, W.N. (1995). The Parental Stress Scale: Initial Psychometric Evidence. Journal of Social and Personal Relationships,Vol 12, No. 3, 463-472
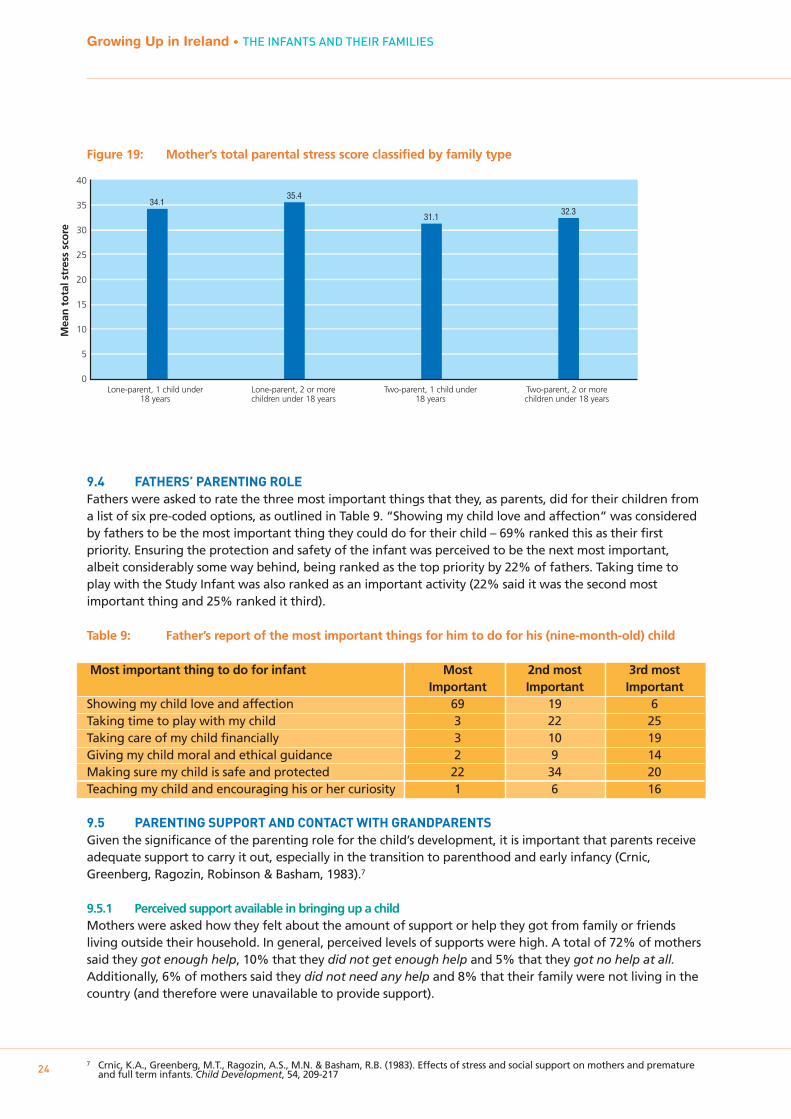
Figure 19: Mother’s total parental stress score classified by family type
9.4 FATHERS’ PARENTING ROLEFathers were asked to rate the three most important things that they, as parents, did for their children froma list of six pre-coded options, as outlined in Table 9. “Showing my child love and affection” was consideredby fathers to be the most important thing they could do for their child – 69% ranked this as their firstpriority. Ensuring the protection and safety of the infant was perceived to be the next most important,albeit considerably some way behind, being ranked as the top priority by 22% of fathers. Taking time toplay with the Study Infant was also ranked as an important activity (22% said it was the second mostimportant thing and 25% ranked it third).
Table 9: Father’s report of the most important things for him to do for his (nine-month-old) child
Most important thing to do for infant Most 2nd most 3rd most Important Important Important
Showing my child love and affection 69 19 6Taking time to play with my child 3 22 25Taking care of my child financially 3 10 19Giving my child moral and ethical guidance 2 9 14Making sure my child is safe and protected 22 34 20Teaching my child and encouraging his or her curiosity 1 6 16
9.5 PARENTING SUPPORT AND CONTACT WITH GRANDPARENTSGiven the significance of the parenting role for the child’s development, it is important that parents receiveadequate support to carry it out, especially in the transition to parenthood and early infancy (Crnic,Greenberg, Ragozin, Robinson & Basham, 1983).7
9.5.1 Perceived support available in bringing up a childMothers were asked how they felt about the amount of support or help they got from family or friendsliving outside their household. In general, perceived levels of supports were high. A total of 72% of motherssaid they got enough help, 10% that they did not get enough help and 5% that they got no help at all.Additionally, 6% of mothers said they did not need any help and 8% that their family were not living in thecountry (and therefore were unavailable to provide support).
Growing Up in Ireland • THE INFANTS AND THEIR FAMILIES
247 Crnic, K.A., Greenberg, M.T., Ragozin, A.S., M.N. & Basham, R.B. (1983). Effects of stress and social support on mothers and premature
and full term infants. Child Development, 54, 209-217
40
35
30
25
20
15
10
5
0Lone-parent, 1 child under
18 yearsLone-parent, 2 or morechildren under 18 years
Two-parent, 1 child under18 years
Two-parent, 2 or morechildren under 18 years
Mea
n t
ota
l str
ess
sco
re
34.135.4
31.132.3
9.5.2 Contact with and support received from infant’s grandparentsGrandparents play an important role in children’s lives, often providing informal childcare and babysittingwhile parents return to work outside the home (Hayes & Bradley, 2007).8 High levels of contact withgrandparents were reported in the Growing Up in Ireland study: 89% of mothers reported being in regularcontact with the Study Infant’s grandparents. Only 2% were not in regular contact and 1% reported that allgrandparents were deceased. A further 8% reported that all the infant’s grandparents lived abroad.
Grandparents can potentially offer a range of different types of support. Table 10 indicates thatgrandparents were most likely to babysit (33% said weekly or more often ), take the infant out (24%) andhelp around the house (18%). Grandparents were least likely to help out financially (72% never did) andhave the infant to stay overnight (62% never did). Lone-parent families typically reported much higher levelsof support from grandparents, especially in terms of “having the baby to stay overnight” and “helping outfinancially”.
Table 10: Mother’s report of support from grandparents
How often do infant’s grandparents … ? Never Sometimes Weekly or moreBabysit 19 48 33Have infant to stay overnight 62 32 6Take infant out 46 30 24Buy toys or clothes for infant 4 81 15Help you around the house 56 26 18Help you out financially 71 26 3
10. MOTHER’S EMPLOYMENT STATUS
The employment status of both mothers and fathers has a major impact on family life, including influencingattachment, time spent with the child, non-parental childcare, and so on.
10.1 EMPLOYMENT STATUS BEFORE THE BIRTHOver three-quarters (76%) of mothers of infants had been working before they became pregnant – 53%full-time and 23% part-time, although this varied substantially with the birth order of children. Mothers of afirst-born child were much more likely to have worked outside the home before the birth (75% full-time and11% part-time) than, for example, those with their fourth-born child (19% full-time and 35% part-time).
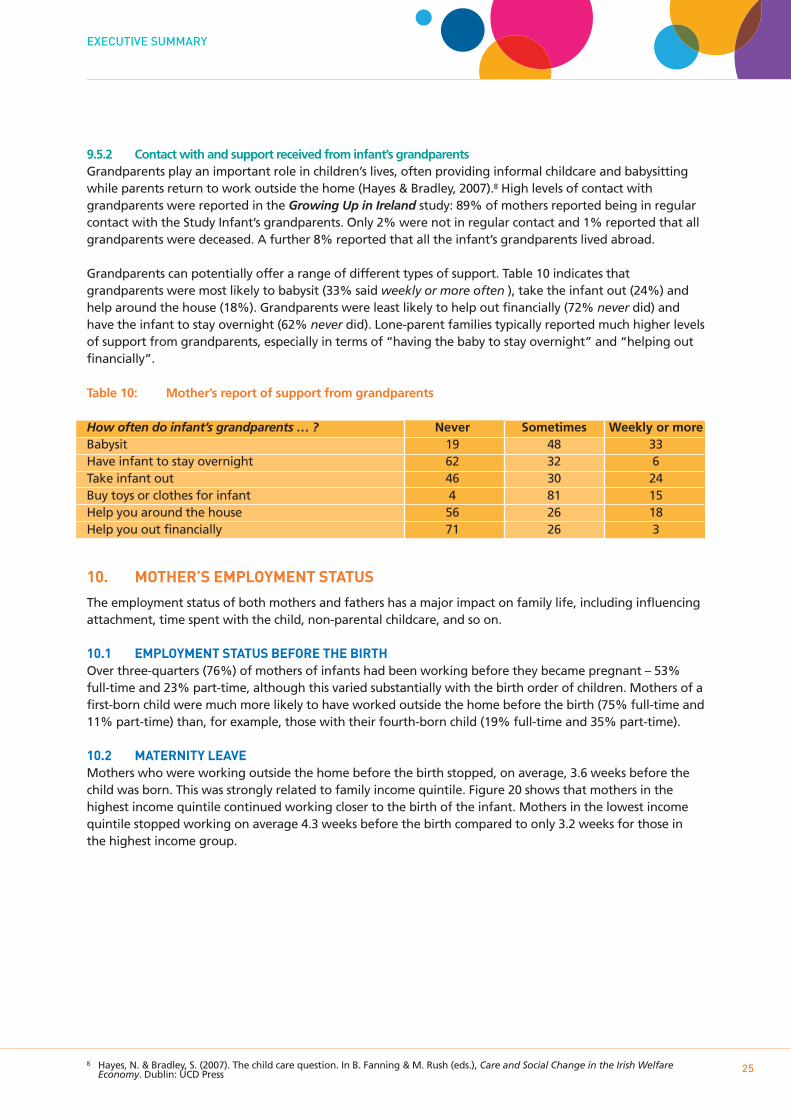
10.2 MATERNITY LEAVEMothers who were working outside the home before the birth stopped, on average, 3.6 weeks before thechild was born. This was strongly related to family income quintile. Figure 20 shows that mothers in thehighest income quintile continued working closer to the birth of the infant. Mothers in the lowest incomequintile stopped working on average 4.3 weeks before the birth compared to only 3.2 weeks for those inthe highest income group.
EXECUTIVE SUMMARY
258 Hayes, N. & Bradley, S. (2007). The child care question. In B. Fanning & M. Rush (eds.), Care and Social Change in the Irish Welfare
Economy. Dublin: UCD Press
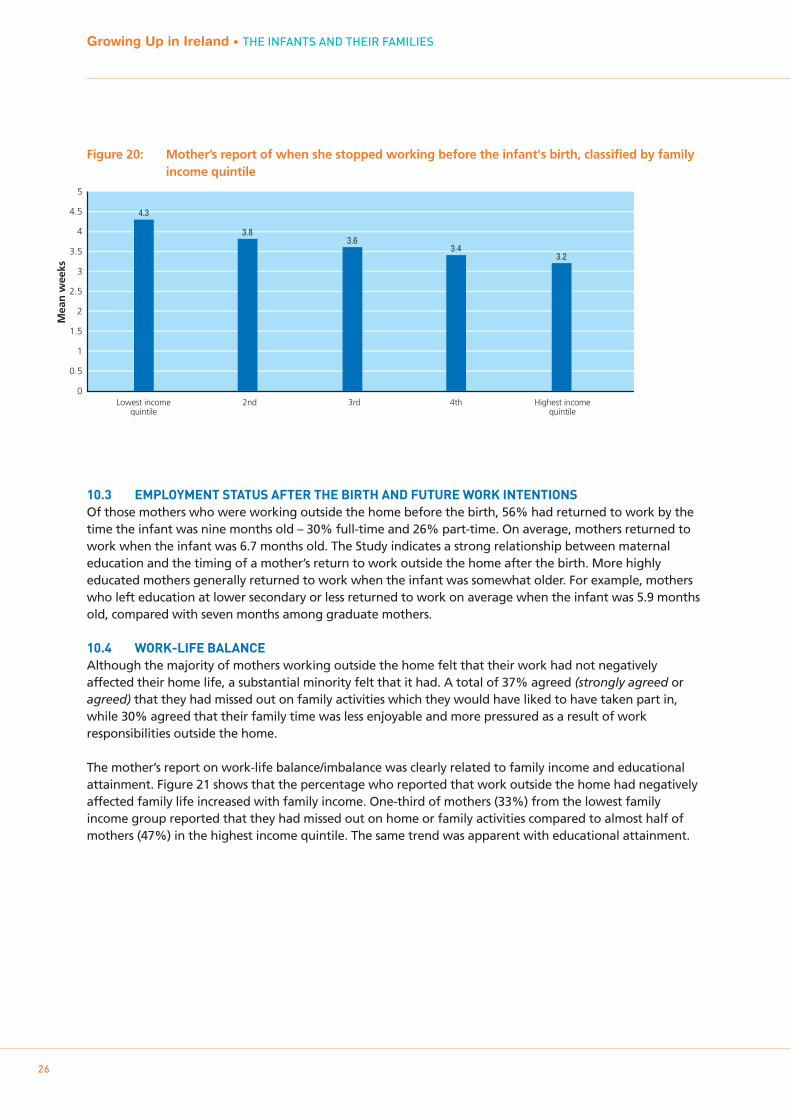
Figure 20: Mother’s report of when she stopped working before the infant's birth, classified by family income quintile
10.3 EMPLOYMENT STATUS AFTER THE BIRTH AND FUTURE WORK INTENTIONSOf those mothers who were working outside the home before the birth, 56% had returned to work by thetime the infant was nine months old – 30% full-time and 26% part-time. On average, mothers returned towork when the infant was 6.7 months old. The Study indicates a strong relationship between maternaleducation and the timing of a mother’s return to work outside the home after the birth. More highlyeducated mothers generally returned to work when the infant was somewhat older. For example, motherswho left education at lower secondary or less returned to work on average when the infant was 5.9 monthsold, compared with seven months among graduate mothers.
10.4 WORK-LIFE BALANCEAlthough the majority of mothers working outside the home felt that their work had not negativelyaffected their home life, a substantial minority felt that it had. A total of 37% agreed (strongly agreed oragreed) that they had missed out on family activities which they would have liked to have taken part in,while 30% agreed that their family time was less enjoyable and more pressured as a result of workresponsibilities outside the home.
The mother’s report on work-life balance/imbalance was clearly related to family income and educationalattainment. Figure 21 shows that the percentage who reported that work outside the home had negativelyaffected family life increased with family income. One-third of mothers (33%) from the lowest familyincome group reported that they had missed out on home or family activities compared to almost half ofmothers (47%) in the highest income quintile. The same trend was apparent with educational attainment.
Growing Up in Ireland • THE INFANTS AND THEIR FAMILIES
26
Mea
n w
eeks
5
4.5
4
3.5
3
2.5
2
1.5
1
0.5
0
4.3
3.83.6
3.43.2
Lowest incomequintile
2nd 3rd 4th Highest incomequintile
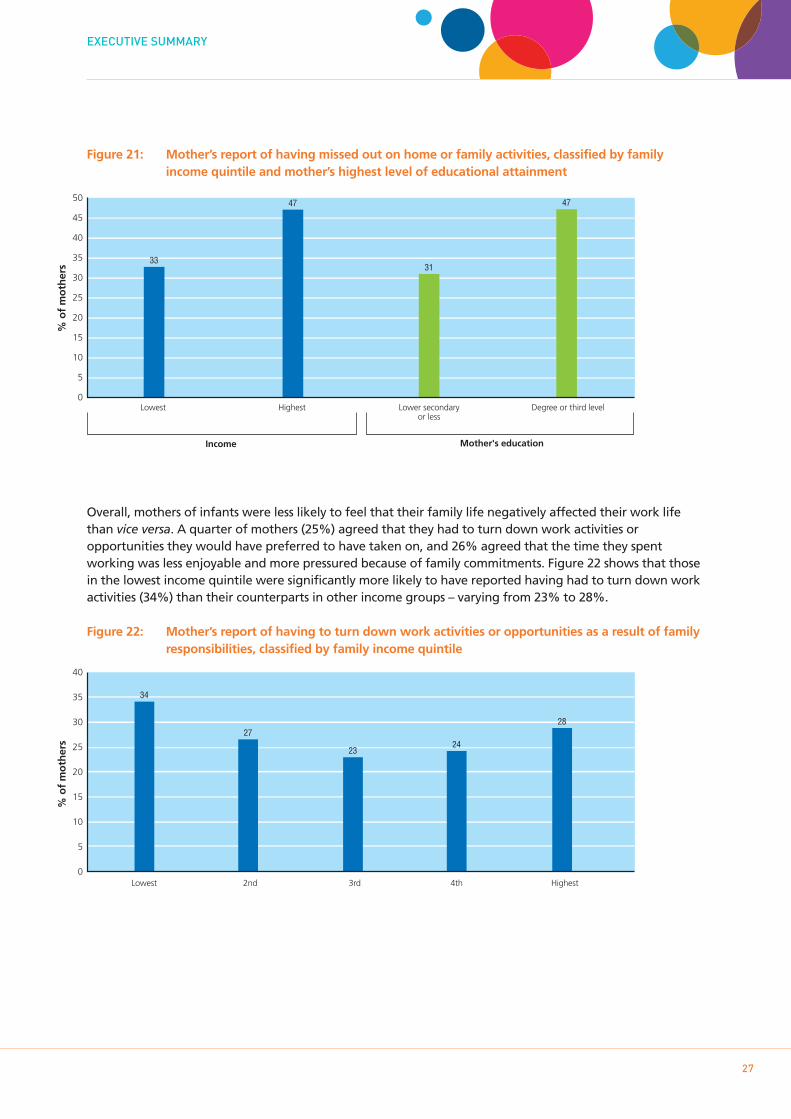
Figure 21: Mother’s report of having missed out on home or family activities, classified by family income quintile and mother’s highest level of educational attainment
Overall, mothers of infants were less likely to feel that their family life negatively affected their work lifethan vice versa. A quarter of mothers (25%) agreed that they had to turn down work activities oropportunities they would have preferred to have taken on, and 26% agreed that the time they spentworking was less enjoyable and more pressured because of family commitments. Figure 22 shows that thosein the lowest income quintile were significantly more likely to have reported having had to turn down workactivities (34%) than their counterparts in other income groups – varying from 23% to 28%.
Figure 22: Mother’s report of having to turn down work activities or opportunities as a result of family responsibilities, classified by family income quintile
EXECUTIVE SUMMARY
27
50
45
40
35
30
25
20
15
10
5
0Lowest
% o
f m
oth
ers 33
Highest Lower secondaryor less
Degree or third level
47
31
47
Income Mother's education
% o
f m
oth
ers
40
35
30
25
20
15
10
5
0
34
27
2324
28
Lowest 2nd 3rd 4th Highest
11 NEIGHBOURHOOD
Neighbourhood and community will directly affect the child through their physical conditions, perceivedsafety and availability of services. Indirect outcomes for the child may result from the impact of the localcommunity on family functioning and parental style. For example, living in a neighbourhood which isperceived by parents to be dangerous may result in changes in parenting style as they attempt to keep theirchildren from falling under undesirable influences.
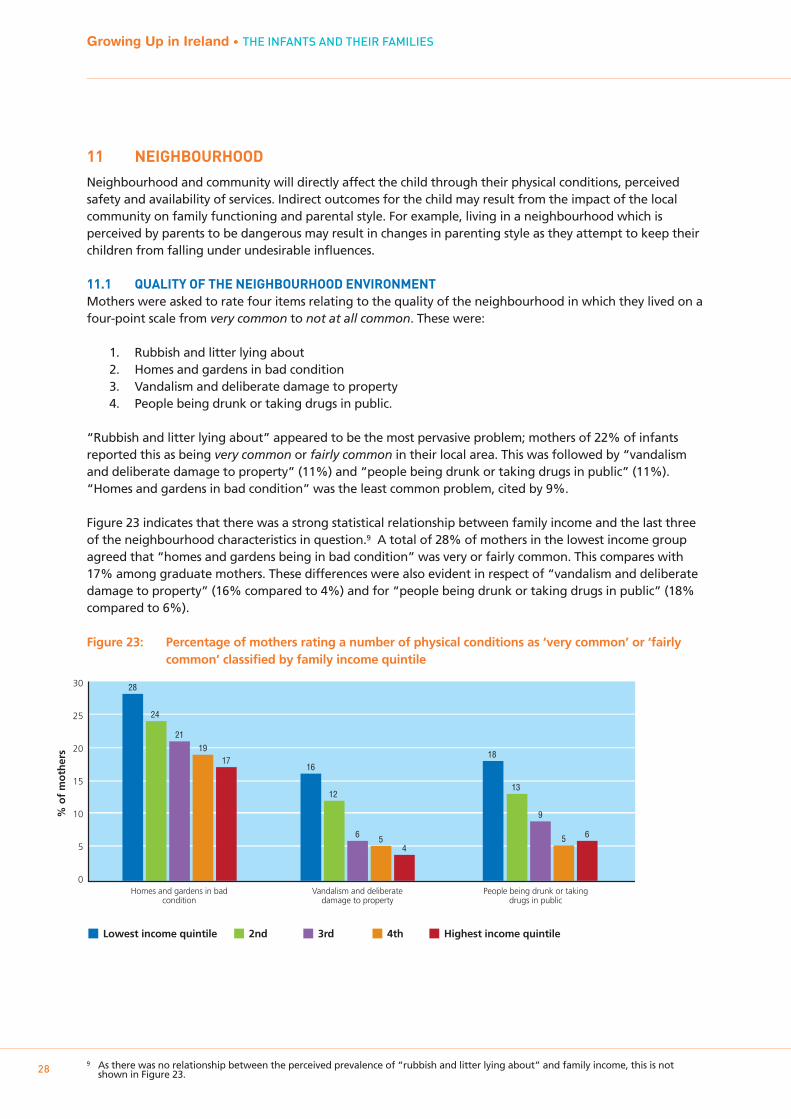
11.1 QUALITY OF THE NEIGHBOURHOOD ENVIRONMENTMothers were asked to rate four items relating to the quality of the neighbourhood in which they lived on afour-point scale from very common to not at all common. These were:
1. Rubbish and litter lying about2. Homes and gardens in bad condition3. Vandalism and deliberate damage to property4. People being drunk or taking drugs in public.
“Rubbish and litter lying about” appeared to be the most pervasive problem; mothers of 22% of infantsreported this as being very common or fairly common in their local area. This was followed by “vandalismand deliberate damage to property” (11%) and “people being drunk or taking drugs in public” (11%).“Homes and gardens in bad condition” was the least common problem, cited by 9%.
Figure 23 indicates that there was a strong statistical relationship between family income and the last threeof the neighbourhood characteristics in question.9 A total of 28% of mothers in the lowest income groupagreed that “homes and gardens being in bad condition” was very or fairly common. This compares with17% among graduate mothers. These differences were also evident in respect of “vandalism and deliberatedamage to property” (16% compared to 4%) and for “people being drunk or taking drugs in public” (18%compared to 6%).
Figure 23: Percentage of mothers rating a number of physical conditions as ‘very common’ or ‘fairly common’ classified by family income quintile
Growing Up in Ireland • THE INFANTS AND THEIR FAMILIES
289 As there was no relationship between the perceived prevalence of “rubbish and litter lying about” and family income, this is not
shown in Figure 23.
30
25
20
15
10
5
0Homes and gardens in bad
conditionVandalism and deliberate
damage to propertyPeople being drunk or taking
drugs in public
% o
f m
oth
ers
28
24
2119
1716
12
6 54
13
18
9
5 6
Lowest income quintile 2nd 3rd 4th Highest income quintile
11.2 PERCEIVED SAFETY OF THE NEIGHBOURHOODMothers were asked three questions in relation to their perception of the safety of their local area using afour-point scale from strongly agree to strongly disagree. The items were:
1. It is safe to walk alone in this area after dark2. It is safe for children to play outside during the day in this area3. There are safe parks, playgrounds and play spaces in this area.
Most agreed that it was safe for children to play outside during the day (86%). Three-quarters (75%) agreedthat it was safe to walk alone after dark and 66% agreed that there were safe parks, playgrounds and playspaces in their local area.
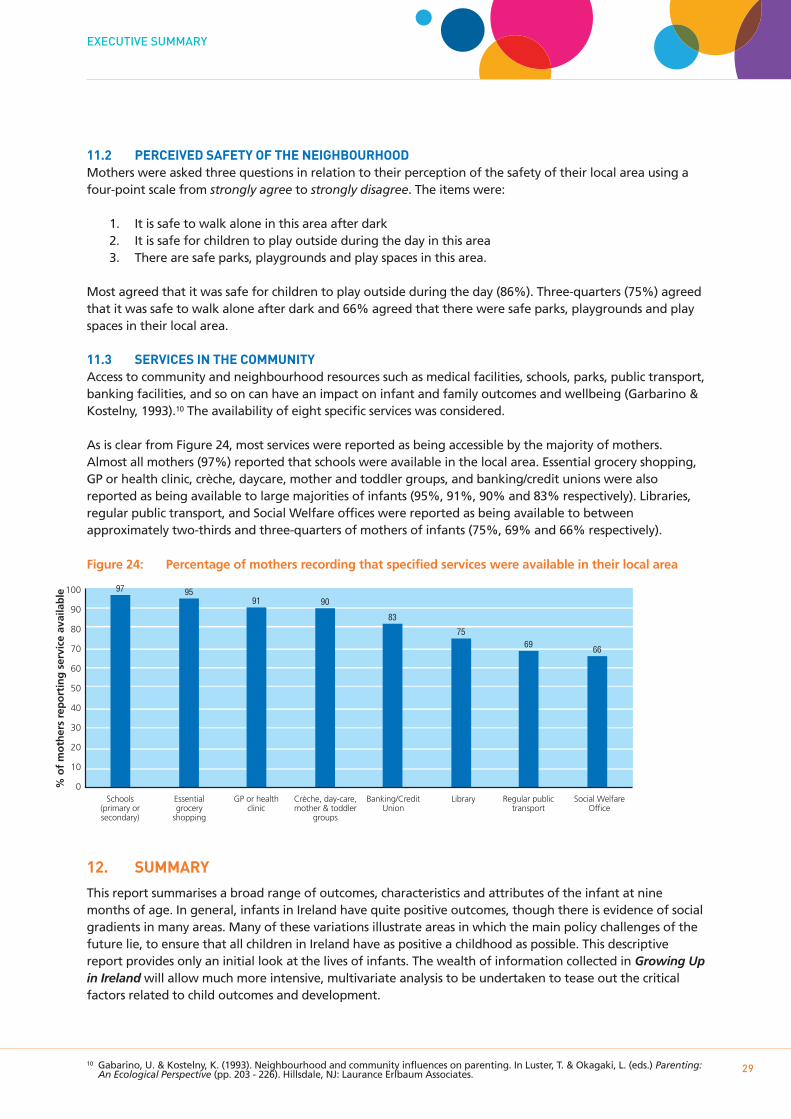
11.3 SERVICES IN THE COMMUNITYAccess to community and neighbourhood resources such as medical facilities, schools, parks, public transport,banking facilities, and so on can have an impact on infant and family outcomes and wellbeing (Garbarino &Kostelny, 1993).10 The availability of eight specific services was considered.
As is clear from Figure 24, most services were reported as being accessible by the majority of mothers.Almost all mothers (97%) reported that schools were available in the local area. Essential grocery shopping,GP or health clinic, crèche, daycare, mother and toddler groups, and banking/credit unions were alsoreported as being available to large majorities of infants (95%, 91%, 90% and 83% respectively). Libraries,regular public transport, and Social Welfare offices were reported as being available to betweenapproximately two-thirds and three-quarters of mothers of infants (75%, 69% and 66% respectively).
Figure 24: Percentage of mothers recording that specified services were available in their local area
12. SUMMARY
This report summarises a broad range of outcomes, characteristics and attributes of the infant at ninemonths of age. In general, infants in Ireland have quite positive outcomes, though there is evidence of socialgradients in many areas. Many of these variations illustrate areas in which the main policy challenges of thefuture lie, to ensure that all children in Ireland have as positive a childhood as possible. This descriptivereport provides only an initial look at the lives of infants. The wealth of information collected in Growing Upin Ireland will allow much more intensive, multivariate analysis to be undertaken to tease out the criticalfactors related to child outcomes and development.
EXECUTIVE SUMMARY
2910 Gabarino, U. & Kostelny, K. (1993). Neighbourhood and community influences on parenting. In Luster, T. & Okagaki, L. (eds.) Parenting:
An Ecological Perspective (pp. 203 - 226). Hillsdale, NJ: Laurance Erlbaum Associates.
100
90
80
70
60
50
40
30
20
10
0% o
f m
oth
ers
rep
ort
ing
ser
vice
ava
ilab
le 97 95
Schools(primary orsecondary)
Essentialgrocery
shopping
91 90
GP or healthclinic
Crèche, day-care,mother & toddler
groups
83
75
Banking/CreditUnion
Library
69 66
Regular publictransport
Social WelfareOffice
If you would like further information aboutGrowing Up in Ireland, please visit
www.growingup.ie
e-mail [email protected]
or freephone 1800 200 434Trinity College Dublin
PUBLISHED BY THE STATIONERY OFFICE DUBLIN
To be purchased from theGOVERNMENT PUBLICATIONS SALES OFFICE,
SUN ALLIANCE HOUSE,MOLESWORTH STREET, DUBLIN 2
or by mail order fromGOVERNMENT PUBLICATIONS,
POSTAL TRADE SECTION,51 ST. STEPHEN’S GREEN, DUBLIN 2
[Tel: 01 647 6834; Fax: 01 647 6843]or through any bookseller
Prn A10/1524
ISBN 978-1-4064-2315-0
Related Documents