University of Nebraska - Lincoln University of Nebraska - Lincoln DigitalCommons@University of Nebraska - Lincoln DigitalCommons@University of Nebraska - Lincoln Publications from USDA-ARS / UNL Faculty U.S. Department of Agriculture: Agricultural Research Service, Lincoln, Nebraska 2002 GROWING RICE GRAIN WITH CONTROLLED CADMIUM GROWING RICE GRAIN WITH CONTROLLED CADMIUM CONCENTRATIONS CONCENTRATIONS Urszula Kukier USDA-ARS, [email protected] Rufus L. Chaney USDA-ARS Follow this and additional works at: https://digitalcommons.unl.edu/usdaarsfacpub Part of the Agricultural Science Commons Kukier, Urszula and Chaney, Rufus L., "GROWING RICE GRAIN WITH CONTROLLED CADMIUM CONCENTRATIONS" (2002). Publications from USDA-ARS / UNL Faculty. 565. https://digitalcommons.unl.edu/usdaarsfacpub/565 This Article is brought to you for free and open access by the U.S. Department of Agriculture: Agricultural Research Service, Lincoln, Nebraska at DigitalCommons@University of Nebraska - Lincoln. It has been accepted for inclusion in Publications from USDA-ARS / UNL Faculty by an authorized administrator of DigitalCommons@University of Nebraska - Lincoln.

Welcome message from author
This document is posted to help you gain knowledge. Please leave a comment to let me know what you think about it! Share it to your friends and learn new things together.
Transcript
University of Nebraska - Lincoln University of Nebraska - Lincoln
DigitalCommons@University of Nebraska - Lincoln DigitalCommons@University of Nebraska - Lincoln
Publications from USDA-ARS / UNL Faculty U.S. Department of Agriculture: Agricultural Research Service, Lincoln, Nebraska
2002
GROWING RICE GRAIN WITH CONTROLLED CADMIUM GROWING RICE GRAIN WITH CONTROLLED CADMIUM
CONCENTRATIONS CONCENTRATIONS
Urszula Kukier USDA-ARS, [email protected]
Rufus L. Chaney USDA-ARS
Follow this and additional works at: https://digitalcommons.unl.edu/usdaarsfacpub
Part of the Agricultural Science Commons
Kukier, Urszula and Chaney, Rufus L., "GROWING RICE GRAIN WITH CONTROLLED CADMIUM CONCENTRATIONS" (2002). Publications from USDA-ARS / UNL Faculty. 565. https://digitalcommons.unl.edu/usdaarsfacpub/565
This Article is brought to you for free and open access by the U.S. Department of Agriculture: Agricultural Research Service, Lincoln, Nebraska at DigitalCommons@University of Nebraska - Lincoln. It has been accepted for inclusion in Publications from USDA-ARS / UNL Faculty by an authorized administrator of DigitalCommons@University of Nebraska - Lincoln.
GROWING RICE GRAIN WITHCONTROLLED CADMIUM
CONCENTRATIONS
Urszula Kukier* and Rufus L. Chaney
USDA-ARS, Animal and Natural Resources Institute,
Bldg. 007, BARC-West, Beltsville, MD 20705-2350
ABSTRACT
Two solution studies were conducted a) to investigate the uptake
of zinc (Zn) and cadmium (Cd) by rice plants (Oryza sativa L.)
and interaction between these elements, and b) to determine
experimental conditions for growing rice grain with desired Cd
concentration for an animal feeding study. In both studies, free
metal activities of cadmium and cationic microelements were
buffered by an excess of chelating agents. The first study was a
factorial design with two Zn levels (1.0 and 3.89 mM) and four
Cd levels (0.81, 1.44, 2.56 and 4.55 mM) in the solution. In the
second study, rice was grown in two solutions of different micro-
and macro-element compositions and three Cd levels (0.0, 0.5,
and 2.0 mM). In the first study, solution Zn concentration of
3.89 mM and corresponding free metal activity (pZn2þ ) of 6.00
was toxic to young rice plants. With time, Zn concentrations in
rice plants decreased while Cd concentrations increased. Toxic
concentration of Cd in roots (about 100 mg kg�1) associated with
1793
JOURNAL OF PLANT NUTRITION, 25(8), 1793–1820 (2002)
Copyright # 2002 by Marcel Dekker, Inc. www.dekker.com
*Corresponding author. E-mail: [email protected]
©2002 Marcel Dekker, Inc. All rights reserved. This material may not be used or reproduced in any form without the express written permission of Marcel Dekker, Inc.
MARCEL DEKKER, INC. • 270 MADISON AVENUE • NEW YORK, NY 10016
a 20% reduction in the root dry matter occurred at the free Cd2þ
activities in the solution (pCd2þ ) in the range of 10.25–9.75. Suf-
ficient Zn level in plants slightly stimulated Cd transfer from
roots to shoots as opposed to barely sufficient or slightly deficient
Zn concentration in shoots. However, the better Zn status in
plants clearly diminished severity of Cd toxicity symptoms in
shoots. The use of nutrient solutions adapted for rice growth
allowed the rice grown in the second experiment to produce grain
under controlled conditions. Cadmium in the brown rice grain
was 0.1 to 0.8 mg kg�1, covering the range needed for feeding
experiments relevant to rice Cd risk to humans. Composition of
the nutrient solutions, in addition to solution Cd level, had a sig-
nificant effect on Cd concentration in grain. Correlation of grain
Cd concentration with solution Cd2þ activity was much stronger
than with total solution Cd. Results of both experiments sup-
ported hypothesis that Cd uptake and transport within rice plants
is an active process.
INTRODUCTION
Contamination of rice grain with Cd was found to cause adverse health
effects in subsistence rice consumers,[1] which stimulated extensive research
on Cd uptake by rice plants conducted mostly by Japanese scientists. Because
increased levels of Zn in plant derived food inhibits absorption of Cd by
animal consumers,[2,3] special attention has been paid to Zn–Cd interactions in
rice. Both field and nutrient solution studies were conducted. It has been
established that although translocation of Cd from roots to shoots in rice is
small, the level of 2–6 mg Cd kg�1 soil caused grain Cd to exceed 1 mg kg�1,
which subsequently caused Cd disease in rice consumers.[4] Other studies
demonstrated that consumption of food derived from crops, other than rice,
grown in soils containing 50–150 mg Cd kg�1 did not cause any adverse
health effects despite considerable chronic Cd intake.[5] Rice grain is quite low
in iron (Fe), Zn, and Ca as compared to soybean and wheat,[6] and much of
grain Zn, Fe, and Ca are removed in polishing of brown rice.[7] Low levels of
these elements in food, or marginal nutritional status of the consumer’s usual
diet, causes increased intestinal absorption and accumulation of Cd.[8–10]
Phytate, fiber and other components of a diet can also affect Cd bioavailability
and risk. Factors regulating Cd bioavailability in food are discussed in detail
by Fox[11] and Chaney et al.,[12] who also postulated that dietary Cd risk
assessment based on subsistence rice consumers overestimated potential for
1794 KUKIER AND CHANEY
©2002 Marcel Dekker, Inc. All rights reserved. This material may not be used or reproduced in any form without the express written permission of Marcel Dekker, Inc.
MARCEL DEKKER, INC. • 270 MADISON AVENUE • NEW YORK, NY 10016
adverse effects of food Cd in societies whose diet is based on other staple
foods.
Animal feeding studies comparing Cd bioavailability from various staple
foods, including rice, have been proposed to elucidate this issue. Such a study
should utilize grain with intrinsic labeled Cd rather than labeled Cd added as a
salt to animal diet, as it was shown that bioavailability of metals added to a
diet as salts differs from that of intrinsic forms.[3,9,13] Therefore, the first
objective of our study was to test conditions for growing rice grain of desired
Cd concentration, between 0.5 and 1.0 mg kg�1. Hydroponic culture was the
method of choice because, for equal Cd uptake by rice, much lower
concentrations of labeled Cd would be required in solution than in soil, and
by that, the amount of radioactive waste would be minimized. This study would
calibrate plant response to solution Cd and Zn levels so that labeled grain could
be produced in subsequent experiments; non-radioactive Cd was used to test the
method. In addition to the primary goal, growing rice grain for a feeding trial,
the hydroponic experiment was utilized to study various aspects of Cd uptake by
rice plants.
Most nutrient solution studies on Cd and other trace metal uptake by rice
were conducted in 1970–1980 decade in Japan and yielded in a detailed
knowledge of these phenomena.[14,15] Trace metals in these solutions were
introduced in the form of inorganic salts. Free metal activities in these solutions
were highly dependent on solution pH, which will be continuously changed by
the action of plant roots. Recently developed chelator-buffered nutrient solution
techniques utilize a variety of chelating agents which allow independent
variation of the activity of each cationic micronutrient and buffer it at the target
level across a broad range of pH.[16] This has a special advantage when the
effect of Cd on the uptake of other trace metals is of interest. The excess of
chelator buffers a constant free metal activity in the solution despite metal
uptake by roots.
Two experiments were conducted. In the first experiment, an attempt was
made to grow rice grain with various levels of intrinsic Cd and Zn, as Zn was
proven, although not unequivocally, to have pronounced effect on Cd uptake by
plants and intestinal absorption of Cd by animals. This experiment failed to
produce grain. The second experiment, which utilized two growth solutions
already tested by other scientists (M. Chino and M. Grusak, personal
communication) for their suitability for the rice grain production, was successful.
In both experiments, Cd and essential microelements in the growth solutions were
buffered by the excess of chelators, which was a novel approach in comparison to
other hydroponic studies with rice. The specific questions addressed in this paper
are 1) the effect of Zn on Cd uptake and toxicity in rice plants, 2) transfer of Cd
and essential trace metals from roots to shoots, 3) transfer of Cd, Zn and other
nutrients to rice grain.
RICE GRAIN AND Cd CONCENTRATIONS 1795
©2002 Marcel Dekker, Inc. All rights reserved. This material may not be used or reproduced in any form without the express written permission of Marcel Dekker, Inc.
MARCEL DEKKER, INC. • 270 MADISON AVENUE • NEW YORK, NY 10016
MATERIALS AND METHODS
Solution Composition and Plant Growth Conditions:
Experiment I
The experiment was arranged as a factorial design with two levels of Zn in
the nutrient solution and four levels of Cd. Zinc was added as ZnSO4 at
concentrations of 1.0 and 3.89 mM and corresponding activities (pZn2þ ) 6.58 and
6.00. CdSO4 was added to achieve concentrations of 0.81, 1.44, 2.56 and
4.55 mM of total Cd in the nutrient solution and the following corresponding free
metal activities (pCd2þ ) 10.25, 10.00, 9.75, and 9.50. Each Cd-Zn treatment had
three replicates randomly distributed within three blocks. Free metal activities and
solution speciation were calculated using GEOCHEM-PC Version 2.[17] The 0.5
strength Hoagland solution with concentration of P lowered in comparison to the
original Hoagland solution was employed as a basal solution in the study.
Micronutrient concentrations in the solution are provided in Table 1. The EGTA
([ethylenebis(oxyethylenenitrilo)]tetraacetic acid) was added to supply 50 mM in
excess of the sum of manganese (Mn), copper (Cu), nickel (Ni), cobalt (Co), Cd
and Zn concentrations to buffer microelement cation activities. Ferrous iron was
supplied as a ferrozine (FZ) (3-(2-pyridyl)-5,6-diphenyl-1,2,4-triazine-40400-
disulfonic acid) complex, which buffered the free Fe2þ activity (pFe2þ ) at 8.5.
Corresponding concentration of Fe in the nutrient solution was 16.1 mM while
that of FZ was 80 mM, which provided 30 mM excess to buffer free Fe2þ activity.
Solution pH was buffered at 6.2 by 2.0 mM MES (2-(4-morpholino)-
ethanesulfonic acid). Depending on plant age, 100 or 200 mM NH4NO3 along
with 10 or 20 mM KH2PO4 was added to the solution on a daily basis.
Rice seeds (cultivar Jefferson) were germinated in standard germination
paper saturated with 0.5 strength Hoagland solution. Five days after starting
germination, seedlings were transferred to 8 L polyethylene buckets, each holding
20 plants grouped in five bundles of four seedlings supported by polyurethane
foam. Plants were grown in a growth chamber with temperature maintained at
25=20EC day=night, relative humidity 70=90% day=night, and 16=8 h light=dark.
A photosynthetically active radiation of 300 mmol m�2s�1 was provided by mixed
fluorescent and incandescent lamps. Solution pH was monitored on a daily basis.
If solution pH was shifted by the root action to 0.5 unit above or below the target
value, 100 mM daily additions of (NH4)2SO4 or Ca(NO3)2 were employed instead
of NH4NO3 addition in order to lower or raise the pH of solution. Continuous
aeration of the solutions was provided and deionized water was added to maintain
a constant volume of the solution in each bucket. Solutions were completely
replaced every two weeks. One bundle was harvested after 26 days (harvest I),
and the another bundle was harvested after 67 days (harvest II) of growth in
the nutrient solution. Rice plants grown in this study never produced grain.
1796 KUKIER AND CHANEY
©2002 Marcel Dekker, Inc. All rights reserved. This material may not be used or reproduced in any form without the express written permission of Marcel Dekker, Inc.
MARCEL DEKKER, INC. • 270 MADISON AVENUE • NEW YORK, NY 10016
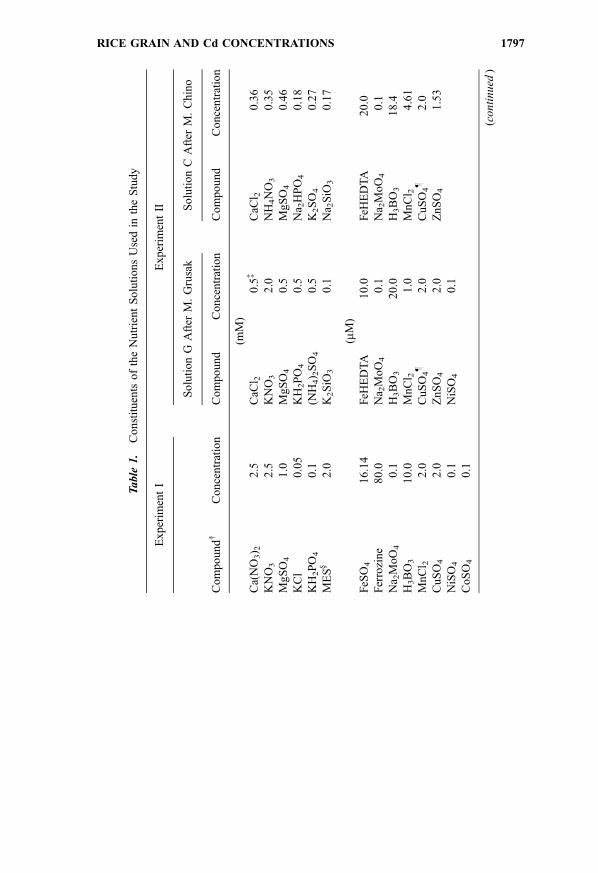
Table
1.
Co
nst
itu
ents
of
the
Nu
trie
nt
So
luti
on
sU
sed
inth
eS
tud
y
Ex
per
imen
tI
Ex
per
imen
tII
So
luti
on
GA
fter
M.
Gru
sak
So
luti
on
CA
fter
M.
Ch
ino
Co
mp
ou
nd{
Co
nce
ntr
atio
nC
om
po
un
dC
on
cen
trat
ion
Co
mp
ou
nd
Co
nce
ntr
atio
n
(mM
)
Ca(
NO
3) 2
2.5
CaC
l 20
.5{
CaC
l 20
.36
KN
O3
2.5
KN
O3
2.0
NH
4N
O3
0.3
5
Mg
SO
41
.0M
gS
O4
0.5
Mg
SO
40
.46
KC
l0
.05
KH
2P
O4
0.5
Na 2
HP
O4
0.1
8
KH
2P
O4
0.1
(NH
4) 2
SO
40
.5K
2S
O4
0.2
7
ME
Sx
2.0
K2S
iO3
0.1
Na 2
SiO
30
.17
(mM
)
FeS
O4
16
.14
FeH
ED
TA
10
.0F
eHE
DT
A2
0.0
Fer
rozi
ne
80
.0N
a 2M
oO
40
.1N
a 2M
oO
40
.1
Na 2
Mo
O4
0.1
H3B
O3
20
.0H
3B
O3
18
.4
H3B
O3
10
.0M
nC
l 21
.0M
nC
l 24
.61
Mn
Cl 2
2.0
Cu
SO
4}
2.0
Cu
SO
4}
2.0
Cu
SO
42
.0Z
nS
O4
2.0
Zn
SO
41
.53
NiS
O4
0.1
NiS
O4
0.1
Co
SO
40
.1
(co
nti
nu
ed)
RICE GRAIN AND Cd CONCENTRATIONS 1797
©2002 Marcel Dekker, Inc. All rights reserved. This material may not be used or reproduced in any form without the express written permission of Marcel Dekker, Inc.
MARCEL DEKKER, INC. • 270 MADISON AVENUE • NEW YORK, NY 10016
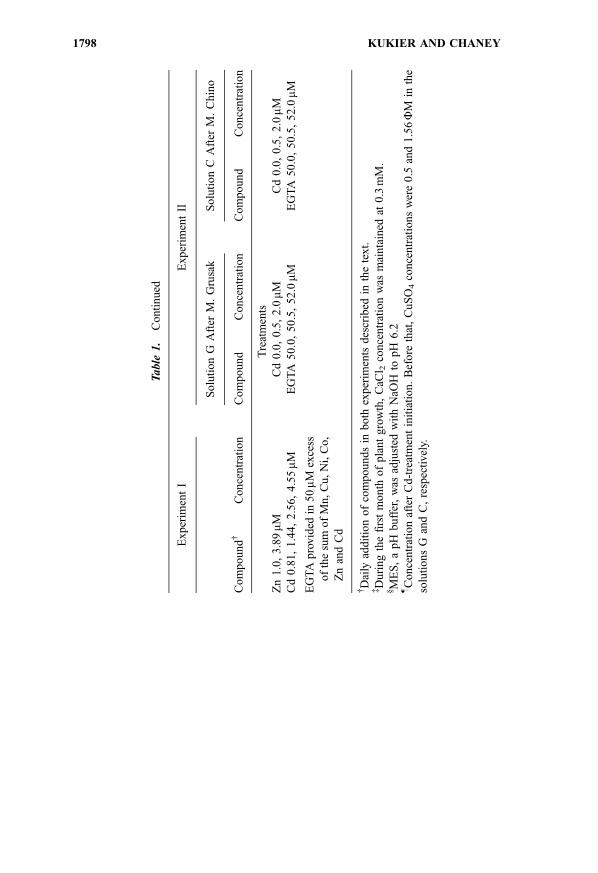
Table
1.
Co
nti
nu
ed
Ex
per
imen
tI
Ex
per
imen
tII
So
luti
on
GA
fter
M.
Gru
sak
So
luti
on
CA
fter
M.
Ch
ino
Co
mp
ou
nd{
Co
nce
ntr
atio
nC
om
po
un
dC
on
cen
trat
ion
Co
mp
ou
nd
Co
nce
ntr
atio
n
Tre
atm
ents
Zn
1.0
,3
.89mM
Cd
0.0
,0
.5,
2.0mM
Cd
0.0
,0
.5,
2.0mM
Cd
0.8
1,
1.4
4,
2.5
6,
4.5
5mM
EG
TA
50
.0,
50
.5,
52
.0mM
EG
TA
50
.0,
50
.5,
52
.0mM
EG
TA
pro
vid
edin
50mM
exce
ss
of
the
sum
of
Mn
,C
u,
Ni,
Co
,
Zn
and
Cd
{ Dai
lyad
dit
ion
of
com
pounds
inboth
exper
imen
tsdes
crib
edin
the
text.
{ Du
rin
gth
efi
rst
mo
nth
of
pla
nt
gro
wth
,C
aCl 2
con
cen
trat
ion
was
mai
nta
ined
at0
.3m
M.
xM
ES
,a
pH
bu
ffer
,w
asad
just
edw
ith
NaO
Hto
pH
6.2
}C
on
cen
trat
ion
afte
rC
d-t
reat
men
tin
itia
tio
n.
Bef
ore
that
,C
uS
O4
con
cen
trat
ion
sw
ere
0.5
and
1.5
6F
Min
the
solu
tio
ns
Gan
dC
,re
spec
tivel
y.
1798 KUKIER AND CHANEY
©2002 Marcel Dekker, Inc. All rights reserved. This material may not be used or reproduced in any form without the express written permission of Marcel Dekker, Inc.
MARCEL DEKKER, INC. • 270 MADISON AVENUE • NEW YORK, NY 10016
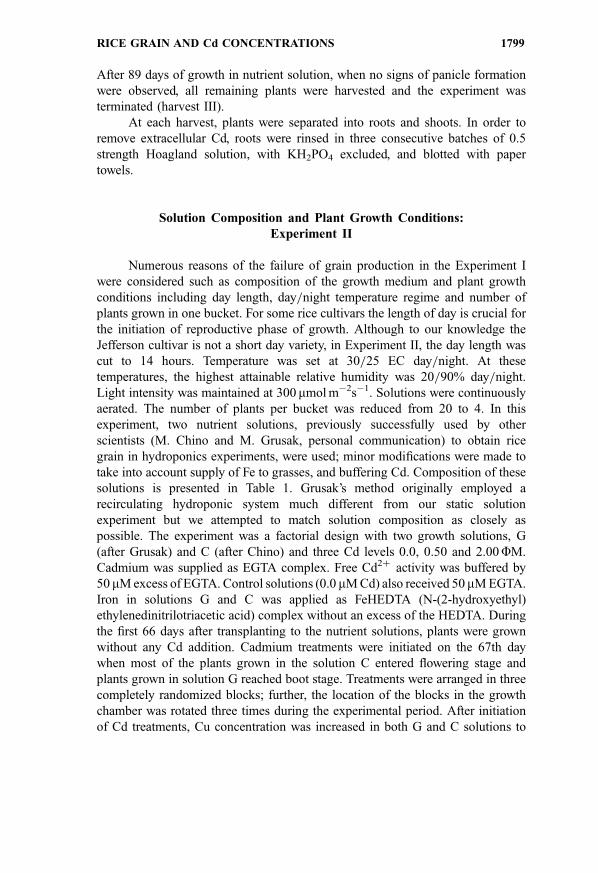
After 89 days of growth in nutrient solution, when no signs of panicle formation
were observed, all remaining plants were harvested and the experiment was
terminated (harvest III).
At each harvest, plants were separated into roots and shoots. In order to
remove extracellular Cd, roots were rinsed in three consecutive batches of 0.5
strength Hoagland solution, with KH2PO4 excluded, and blotted with paper
towels.
Solution Composition and Plant Growth Conditions:
Experiment II
Numerous reasons of the failure of grain production in the Experiment I
were considered such as composition of the growth medium and plant growth
conditions including day length, day=night temperature regime and number of
plants grown in one bucket. For some rice cultivars the length of day is crucial for
the initiation of reproductive phase of growth. Although to our knowledge the
Jefferson cultivar is not a short day variety, in Experiment II, the day length was
cut to 14 hours. Temperature was set at 30=25 EC day=night. At these
temperatures, the highest attainable relative humidity was 20=90% day=night.
Light intensity was maintained at 300 mmol m�2s�1. Solutions were continuously
aerated. The number of plants per bucket was reduced from 20 to 4. In this
experiment, two nutrient solutions, previously successfully used by other
scientists (M. Chino and M. Grusak, personal communication) to obtain rice
grain in hydroponics experiments, were used; minor modifications were made to
take into account supply of Fe to grasses, and buffering Cd. Composition of these
solutions is presented in Table 1. Grusak’s method originally employed a
recirculating hydroponic system much different from our static solution
experiment but we attempted to match solution composition as closely as
possible. The experiment was a factorial design with two growth solutions, G
(after Grusak) and C (after Chino) and three Cd levels 0.0, 0.50 and 2.00FM.
Cadmium was supplied as EGTA complex. Free Cd2þ activity was buffered by
50 mM excess of EGTA. Control solutions (0.0 mM Cd) also received 50 mM EGTA.
Iron in solutions G and C was applied as FeHEDTA (N-(2-hydroxyethyl)
ethylenedinitrilotriacetic acid) complex without an excess of the HEDTA. During
the first 66 days after transplanting to the nutrient solutions, plants were grown
without any Cd addition. Cadmium treatments were initiated on the 67th day
when most of the plants grown in the solution C entered flowering stage and
plants grown in solution G reached boot stage. Treatments were arranged in three
completely randomized blocks; further, the location of the blocks in the growth
chamber was rotated three times during the experimental period. After initiation
of Cd treatments, Cu concentration was increased in both G and C solutions to
RICE GRAIN AND Cd CONCENTRATIONS 1799
©2002 Marcel Dekker, Inc. All rights reserved. This material may not be used or reproduced in any form without the express written permission of Marcel Dekker, Inc.
MARCEL DEKKER, INC. • 270 MADISON AVENUE • NEW YORK, NY 10016
2 mM to compensate for Cu binding by EGTA. MES was not used as a pH buffer,
instead, pH was measured twice a day and adjusted by the addition of appropriate
volume of 0.1 M NaOH or HCl solution. Before the initiation of Cd treatments,
pH’s of the solutions G and C were maintained at 6.0 (þ0.2, �0.7) and 5.5
(þ0.2; �0.7), respectively, as recommended. Starting with the Cd treatments, pH
of both solutions was maintained at 6.0 (þ0.2; �0.7). On several occasions, a
few hours after changing solutions, pH dropped by more than one unit due to
rapid uptake of NH4þ ion by plants with concomitant release of Hþ by roots.
Calculation of solution speciation using Geochem-PC revealed a possibility of the
precipitation of ferric phosphate in the solution G, at pH higher than 6.0.
Acidification of the solution caused by a root action would cause a dissolution of
this precipitate. Postharvest analysis of the roots confirmed that precipitation of a
ferric phosphate in the solution G was a marginal problem, if any, because total Fe
in the roots of plants G was lower than in the roots of plants C, and computed
speciation of the solution C did not predict any precipitation within a pH range
maintained in the course of experiment. As in Experiment I, 100FM NH4NO3
and 20FM KH2PO4 rates were supplied as a daily addition. The rates were
doubled during the period of the most intense plant growth. During the boot stage
and during flowering and grain formation, supplemental Cd and nutrients equal to
10% of each Cd treatment as well as 10% of the macro and microelement rates
were added to each bucket between solution changes to compensate for plant
uptake. During the first 42 days of growth, nutrient solutions were changed every
7–9 days. Then, frequency of solution changes was increased to every 4–5 days,
and at the end of experiment, decreased again to every 6–7 days. Plants C were
harvested after 108 days of growth in the nutrient solution. Plants grown in
solution G were harvested 8 days later because they entered their reproductive
phase later than plants grown in solution C. At harvest, the number of tillers
produced by each plant was counted and the length of the longest tiller and the
longest root in each plant measured. Plants were separated into roots, leaves, flag
leaves, stems and ears. Ears were further separated to brown rice grain, rachi
branches and seed covers. At harvest, roots were rinsed in three consecutive
batches of 0.25 mM Ca(NO3)2 and KNO3 solution followed by immersing in
deionized water for a few seconds, and blotted in paper towels.
Plant Tissue Analysis
Plants were oven-dried at 65�C to constant weight and dry weights were
recorded. Plant materials were ground in a stainless steel Wiley mill, weighed into
glass beakers and ashed in a muffle furnace at 450EC for 16 hr. Blanks were
included every 10 samples. Ashed plant samples were digested in 2 mL of
concentrated HNO3 on a hot plate and then refluxed for 2 hr with 10 mL of 3 M
1800 KUKIER AND CHANEY
©2002 Marcel Dekker, Inc. All rights reserved. This material may not be used or reproduced in any form without the express written permission of Marcel Dekker, Inc.
MARCEL DEKKER, INC. • 270 MADISON AVENUE • NEW YORK, NY 10016
HCl. Digested samples were filtered through Whatman 40 filter paper and diluted
with 0.1 M HCl to a volume of 25 mL. Molybdenum (Mo), Zn, Cd, phosphorus
(P), copper (Cu), Mn, Fe, magnesium (Mg), calcium (Ca), and potassium (K)
were determined by inductively coupled plasma spectrometry (ICP) using Co as
an internal standard added to each sample and standard solutions at 40 mg L�1.
Cd was also determined using AAS with deuterium background correction. The
NBS standard reference material 1573a tomato leaves was digested every 20
samples for quality control.
Statistical Analysis
In Experiment I, repeated measures analysis of variance[18] was employed
to test significance of the Zn and Cd treatments in relation to time of harvest. For
means separation, either Duncan’s multiple range test or the paired t-test were
performed within the subsets of data from each harvest.
Statistical analysis of the results obtained in the Experiment II was
performed using analysis of variance and t-test as well as regression analysis.[18]
RESULTS OF EXPERIMENT I
Plant Yield and Cadmium and Zinc Concentrations
Several levels of Cd in the growth medium combined with two Zn levels
and three harvest dates provided data on the dynamics of uptake of Cd and other
elements.Concentrations of Zn in vegetative rice tissues were dependent on the
Zn level in the growth medium (P< 0.001) and harvest date (P< 0.001) (Fig. 1).
Cadmium treatments did not have any statistically significant effect on Zn
concentration in plant tissues. The highest concentrations of Zn in roots and
shoots occurred at the early harvest. At pZn2þ activity of 6.00, concentrations of
Zn in shoots, at harvest I, slightly exceeded 100 mg kg�1, which is the toxicity
threshold for rice plants.[19] The higher level of Zn in the nutrient solution
inhibited growth of roots and shoots at the early stage of growth (Table 2) As Zn
concentration in shoots decreased in the course of experiment, the inhibitory
effect of the higher Zn treatment on plant growth disappeared. At pZn2þ activity
of 6.58, the Zn concentrations in shoots were significantly lower than at pZn2þ of
6.00. At the lower Zn treatment, shoot Zn level that was well within the
sufficiency range at harvest I, dropped to about 15 mg kg�1 which is the
sufficiency threshold[20] at harvests II and III. Zinc translocation from roots to
shoots was inhibited at the higher Zn treatment. The stronger inhibition was
recorded at the first harvest but the effect was still statistically significant at the
RICE GRAIN AND Cd CONCENTRATIONS 1801
©2002 Marcel Dekker, Inc. All rights reserved. This material may not be used or reproduced in any form without the express written permission of Marcel Dekker, Inc.
MARCEL DEKKER, INC. • 270 MADISON AVENUE • NEW YORK, NY 10016
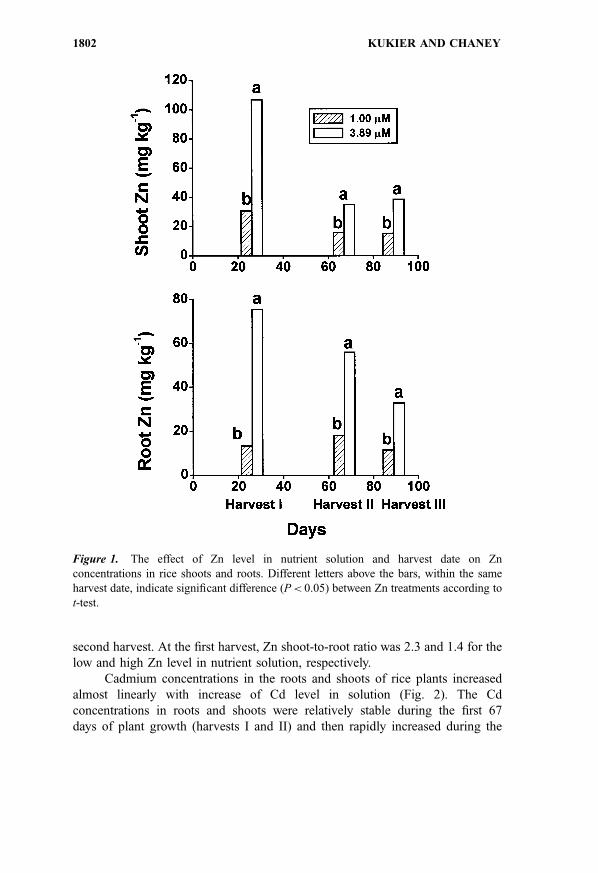
second harvest. At the first harvest, Zn shoot-to-root ratio was 2.3 and 1.4 for the
low and high Zn level in nutrient solution, respectively.
Cadmium concentrations in the roots and shoots of rice plants increased
almost linearly with increase of Cd level in solution (Fig. 2). The Cd
concentrations in roots and shoots were relatively stable during the first 67
days of plant growth (harvests I and II) and then rapidly increased during the
Figure 1. The effect of Zn level in nutrient solution and harvest date on Zn
concentrations in rice shoots and roots. Different letters above the bars, within the same
harvest date, indicate significant difference (P< 0.05) between Zn treatments according to
t-test.
1802 KUKIER AND CHANEY
©2002 Marcel Dekker, Inc. All rights reserved. This material may not be used or reproduced in any form without the express written permission of Marcel Dekker, Inc.
MARCEL DEKKER, INC. • 270 MADISON AVENUE • NEW YORK, NY 10016
further 21 days (harvest III). The effect of time was highly significant (P< 0.001).
At harvest I, Cd level in roots approached or exceeded the toxicity threshold of
100 mg kg�1 [19] at the two highest Cd levels in solution (pCd2þ¼ 9.75 and 9.50).
At harvest II (67 days), the inhibitory effect of Cd treatment on the root growth
was apparent while the shoot biomass remained unaffected (Table 2). At the
higher Zn concentration in the solution, a linear relationship between the root dry
matter and root Cd concentrations was observed: root yield¼�0.0048(root
Cd)þ 2.34.
Cadmium concentration in roots corresponding with 20% reduction of the
root dry matter calculated from this equation was 117 mg kg�1 which fairly well
agrees with the value of 100 mg kg�1 reported by Chino.[19] At the lower Zn level
in the solution, an abrupt drop of root dry matter was recorded already at
60.1 mg kg�1 of Cd in roots. Cd concentrations in root tissue were more than
doubled during the last 22 days of experiment. At harvest III, Cd concentration of
100 mg kg�1 in roots of plants grown at the lower Zn treatment, was exceeded
already at pCd2þ of 10.00. Based on outcomes of this study, the toxic
concentration of Cd in roots is estimated to be between 60 and 120 mg kg�1 and
the corresponding free Cd activity (pCd2þ ) associated with a toxicity effect is
within a range of 10.25–9.75 depending on Zn level in the solution and the time
period that plant roots were exposed to these concentrations. At harvests II and
III, Cd toxicity threshold in shoots (5 mg kg�1,[19]) was reached at the highest Cd
level in the solution regardless of Zn treatment. Zn level in the nutrient solution
did not affect Cd concentrations in rice shoots at the first two sampling dates but
at the end of experiment (harvest III), Zn statistically significantly (P< 0.05)
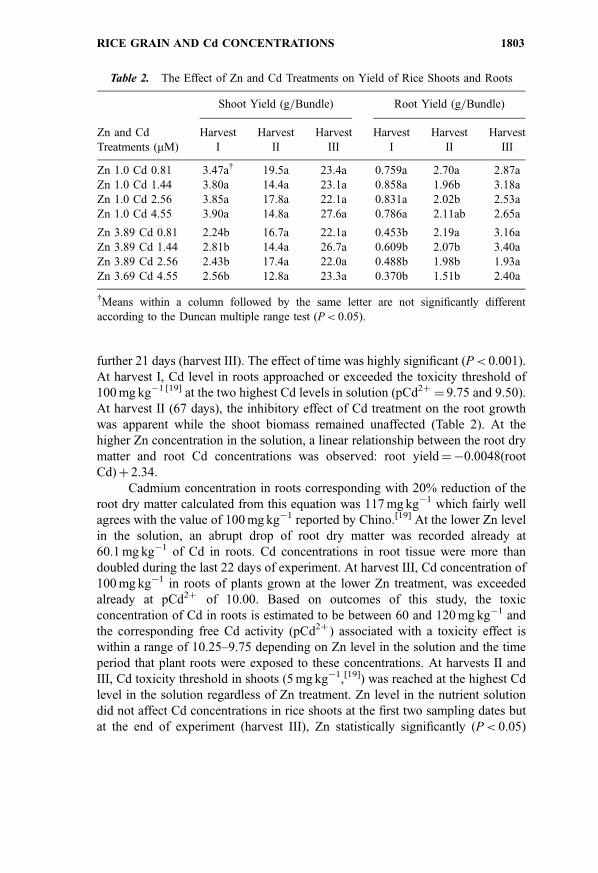
Table 2. The Effect of Zn and Cd Treatments on Yield of Rice Shoots and Roots
Shoot Yield (g=Bundle) Root Yield (g=Bundle)
Zn and Cd
Treatments (mM)
Harvest
I
Harvest
II
Harvest
III
Harvest
I
Harvest
II
Harvest
III
Zn 1.0 Cd 0.81 3.47a{ 19.5a 23.4a 0.759a 2.70a 2.87a
Zn 1.0 Cd 1.44 3.80a 14.4a 23.1a 0.858a 1.96b 3.18a
Zn 1.0 Cd 2.56 3.85a 17.8a 22.1a 0.831a 2.02b 2.53a
Zn 1.0 Cd 4.55 3.90a 14.8a 27.6a 0.786a 2.11ab 2.65a
Zn 3.89 Cd 0.81 2.24b 16.7a 22.1a 0.453b 2.19a 3.16a
Zn 3.89 Cd 1.44 2.81b 14.4a 26.7a 0.609b 2.07b 3.40a
Zn 3.89 Cd 2.56 2.43b 17.4a 22.0a 0.488b 1.98b 1.93a
Zn 3.69 Cd 4.55 2.56b 12.8a 23.3a 0.370b 1.51b 2.40a
{Means within a column followed by the same letter are not significantly different
according to the Duncan multiple range test (P< 0.05).
RICE GRAIN AND Cd CONCENTRATIONS 1803
©2002 Marcel Dekker, Inc. All rights reserved. This material may not be used or reproduced in any form without the express written permission of Marcel Dekker, Inc.
MARCEL DEKKER, INC. • 270 MADISON AVENUE • NEW YORK, NY 10016
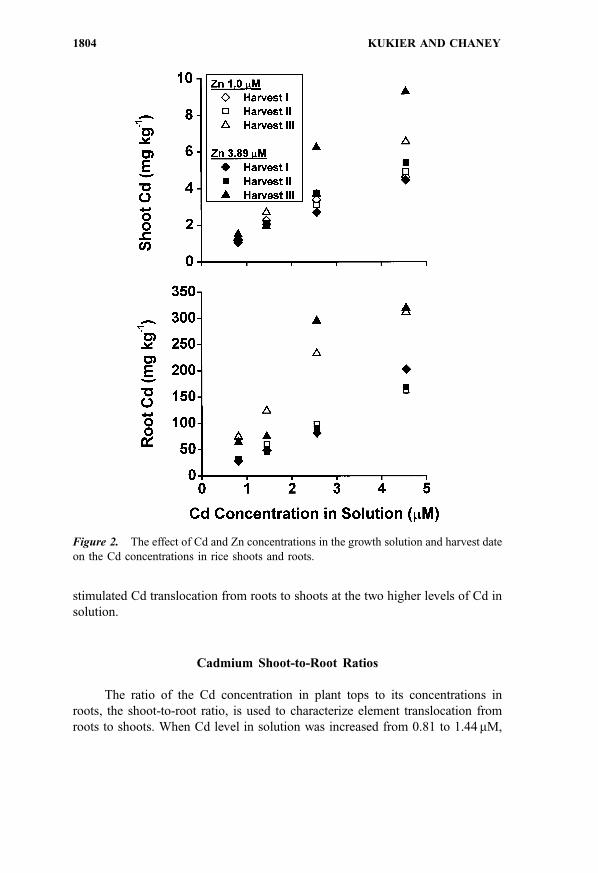
stimulated Cd translocation from roots to shoots at the two higher levels of Cd in
solution.
Cadmium Shoot-to-Root Ratios
The ratio of the Cd concentration in plant tops to its concentrations in
roots, the shoot-to-root ratio, is used to characterize element translocation from
roots to shoots. When Cd level in solution was increased from 0.81 to 1.44mM,
Figure 2. The effect of Cd and Zn concentrations in the growth solution and harvest date
on the Cd concentrations in rice shoots and roots.
1804 KUKIER AND CHANEY
©2002 Marcel Dekker, Inc. All rights reserved. This material may not be used or reproduced in any form without the express written permission of Marcel Dekker, Inc.
MARCEL DEKKER, INC. • 270 MADISON AVENUE • NEW YORK, NY 10016
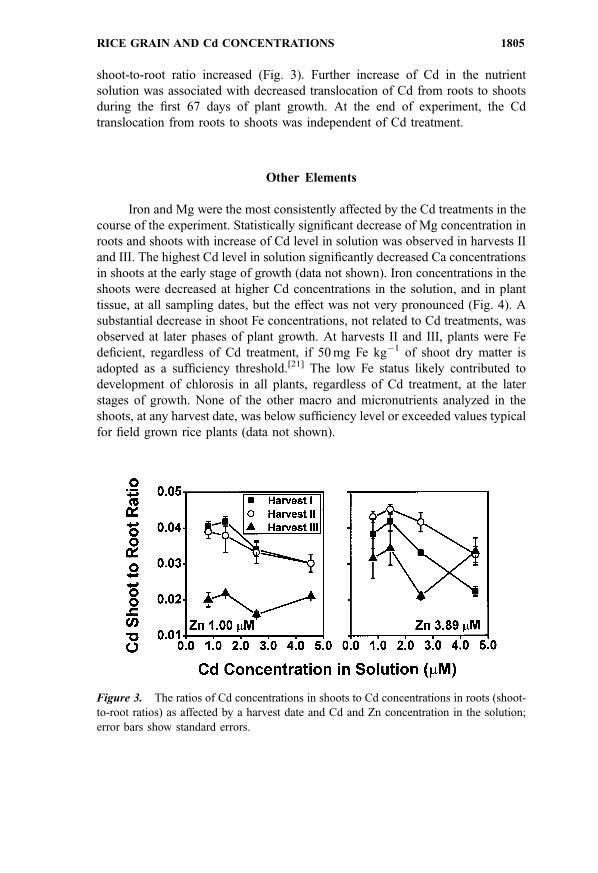
shoot-to-root ratio increased (Fig. 3). Further increase of Cd in the nutrient
solution was associated with decreased translocation of Cd from roots to shoots
during the first 67 days of plant growth. At the end of experiment, the Cd
translocation from roots to shoots was independent of Cd treatment.
Other Elements
Iron and Mg were the most consistently affected by the Cd treatments in the
course of the experiment. Statistically significant decrease of Mg concentration in
roots and shoots with increase of Cd level in solution was observed in harvests II
and III. The highest Cd level in solution significantly decreased Ca concentrations
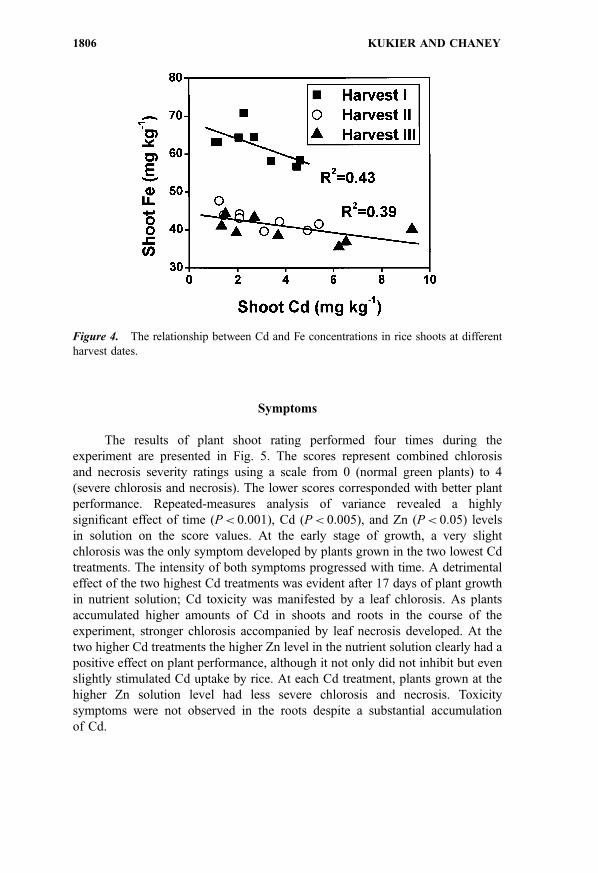
in shoots at the early stage of growth (data not shown). Iron concentrations in the
shoots were decreased at higher Cd concentrations in the solution, and in plant
tissue, at all sampling dates, but the effect was not very pronounced (Fig. 4). A
substantial decrease in shoot Fe concentrations, not related to Cd treatments, was
observed at later phases of plant growth. At harvests II and III, plants were Fe
deficient, regardless of Cd treatment, if 50 mg Fe kg�1 of shoot dry matter is
adopted as a sufficiency threshold.[21] The low Fe status likely contributed to
development of chlorosis in all plants, regardless of Cd treatment, at the later
stages of growth. None of the other macro and micronutrients analyzed in the
shoots, at any harvest date, was below sufficiency level or exceeded values typical
for field grown rice plants (data not shown).
Figure 3. The ratios of Cd concentrations in shoots to Cd concentrations in roots (shoot-
to-root ratios) as affected by a harvest date and Cd and Zn concentration in the solution;
error bars show standard errors.
RICE GRAIN AND Cd CONCENTRATIONS 1805
©2002 Marcel Dekker, Inc. All rights reserved. This material may not be used or reproduced in any form without the express written permission of Marcel Dekker, Inc.
MARCEL DEKKER, INC. • 270 MADISON AVENUE • NEW YORK, NY 10016
Symptoms
The results of plant shoot rating performed four times during the
experiment are presented in Fig. 5. The scores represent combined chlorosis
and necrosis severity ratings using a scale from 0 (normal green plants) to 4
(severe chlorosis and necrosis). The lower scores corresponded with better plant
performance. Repeated-measures analysis of variance revealed a highly
significant effect of time (P< 0.001), Cd (P< 0.005), and Zn (P< 0.05) levels
in solution on the score values. At the early stage of growth, a very slight
chlorosis was the only symptom developed by plants grown in the two lowest Cd
treatments. The intensity of both symptoms progressed with time. A detrimental
effect of the two highest Cd treatments was evident after 17 days of plant growth
in nutrient solution; Cd toxicity was manifested by a leaf chlorosis. As plants
accumulated higher amounts of Cd in shoots and roots in the course of the
experiment, stronger chlorosis accompanied by leaf necrosis developed. At the
two higher Cd treatments the higher Zn level in the nutrient solution clearly had a
positive effect on plant performance, although it not only did not inhibit but even
slightly stimulated Cd uptake by rice. At each Cd treatment, plants grown at the
higher Zn solution level had less severe chlorosis and necrosis. Toxicity
symptoms were not observed in the roots despite a substantial accumulation
of Cd.
Figure 4. The relationship between Cd and Fe concentrations in rice shoots at different
harvest dates.
1806 KUKIER AND CHANEY
©2002 Marcel Dekker, Inc. All rights reserved. This material may not be used or reproduced in any form without the express written permission of Marcel Dekker, Inc.
MARCEL DEKKER, INC. • 270 MADISON AVENUE • NEW YORK, NY 10016
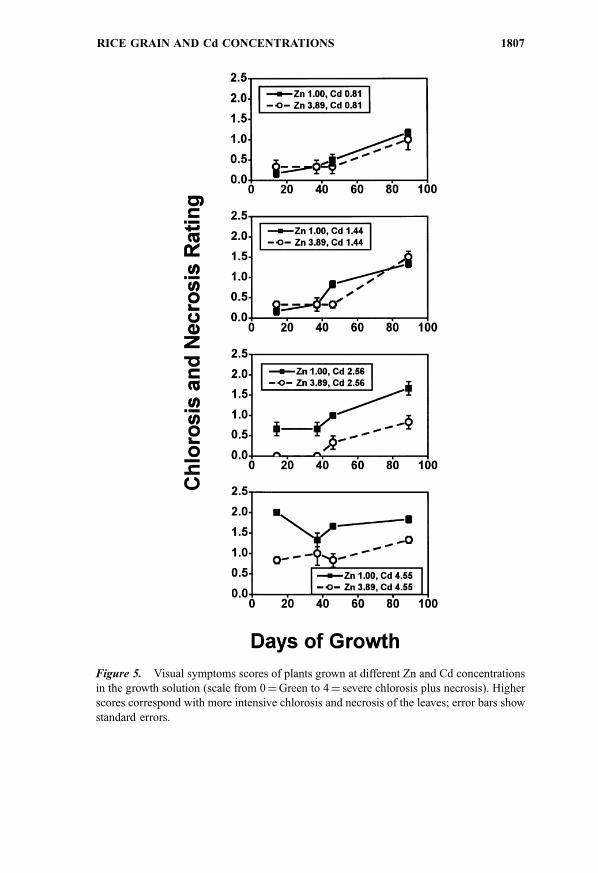
Figure 5. Visual symptoms scores of plants grown at different Zn and Cd concentrations
in the growth solution (scale from 0¼Green to 4¼ severe chlorosis plus necrosis). Higher
scores correspond with more intensive chlorosis and necrosis of the leaves; error bars show
standard errors.
RICE GRAIN AND Cd CONCENTRATIONS 1807
©2002 Marcel Dekker, Inc. All rights reserved. This material may not be used or reproduced in any form without the express written permission of Marcel Dekker, Inc.
MARCEL DEKKER, INC. • 270 MADISON AVENUE • NEW YORK, NY 10016
RESULTS OF EXPERIMENT II
Plant Growth and Grain Yield
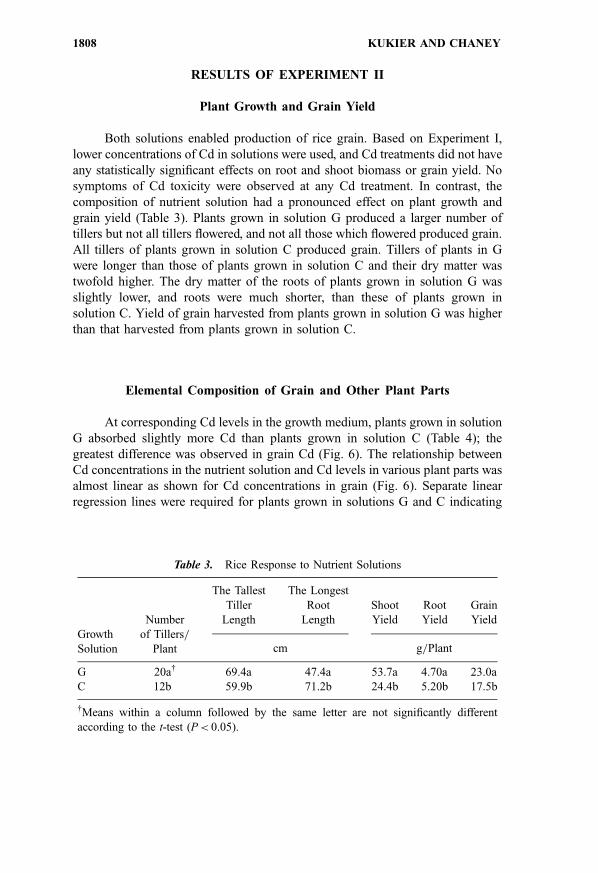
Both solutions enabled production of rice grain. Based on Experiment I,
lower concentrations of Cd in solutions were used, and Cd treatments did not have
any statistically significant effects on root and shoot biomass or grain yield. No
symptoms of Cd toxicity were observed at any Cd treatment. In contrast, the
composition of nutrient solution had a pronounced effect on plant growth and
grain yield (Table 3). Plants grown in solution G produced a larger number of
tillers but not all tillers flowered, and not all those which flowered produced grain.
All tillers of plants grown in solution C produced grain. Tillers of plants in G
were longer than those of plants grown in solution C and their dry matter was
twofold higher. The dry matter of the roots of plants grown in solution G was
slightly lower, and roots were much shorter, than these of plants grown in
solution C. Yield of grain harvested from plants grown in solution G was higher
than that harvested from plants grown in solution C.
Elemental Composition of Grain and Other Plant Parts
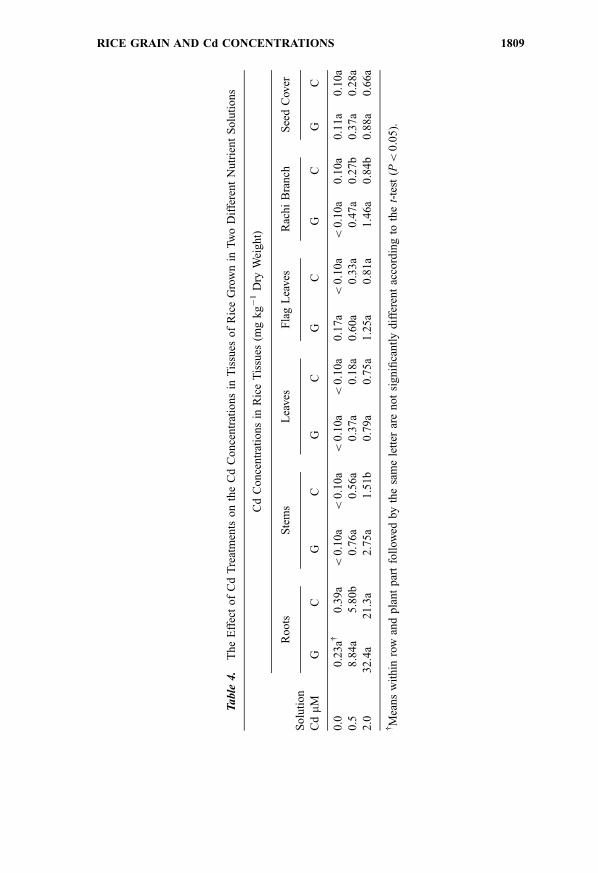
At corresponding Cd levels in the growth medium, plants grown in solution
G absorbed slightly more Cd than plants grown in solution C (Table 4); the
greatest difference was observed in grain Cd (Fig. 6). The relationship between
Cd concentrations in the nutrient solution and Cd levels in various plant parts was
almost linear as shown for Cd concentrations in grain (Fig. 6). Separate linear
regression lines were required for plants grown in solutions G and C indicating
Table 3. Rice Response to Nutrient Solutions
Number
The Tallest
Tiller
Length
The Longest
Root
Length
Shoot
Yield
Root
Yield
Grain
Yield
Growth
Solution
of Tillers=Plant cm g=Plant
G 20a{ 69.4a 47.4a 53.7a 4.70a 23.0a
C 12b 59.9b 71.2b 24.4b 5.20b 17.5b
{Means within a column followed by the same letter are not significantly different
according to the t-test (P< 0.05).
1808 KUKIER AND CHANEY
©2002 Marcel Dekker, Inc. All rights reserved. This material may not be used or reproduced in any form without the express written permission of Marcel Dekker, Inc.
MARCEL DEKKER, INC. • 270 MADISON AVENUE • NEW YORK, NY 10016
Table
4.
Th
eE
ffec
to
fC
dT
reat
men
tso
nth
eC
dC
on
cen
trat
ion
sin
Tis
sues
of
Ric
eG
row
nin
Tw
oD
iffe
ren
tN
utr
ien
tS
olu
tio
ns
Cd
Co
nce
ntr
atio
ns
inR
ice
Tis
sues
(mg
kg�
1D
ryW
eig
ht)
So
luti
on
Ro
ots
Ste
ms
Lea
ves
Fla
gL
eaves
Rac
hi
Bra
nch
See
dC
over
CdmM
GC
GC
GC
GC
GC
GC
0.0
0.2
3a{
0.3
9a
<0
.10
a<
0.1
0a
<0
.10
a<
0.1
0a
0.1
7a
<0
.10
a<
0.1
0a
0.1
0a
0.1
1a
0.1
0a
0.5
8.8
4a
5.8
0b
0.7
6a
0.5
6a
0.3
7a
0.1
8a
0.6
0a
0.3
3a
0.4
7a
0.2
7b
0.3
7a
0.2
8a
2.0
32
.4a
21
.3a
2.7
5a
1.5
1b
0.7
9a
0.7
5a
1.2
5a
0.8
1a
1.4
6a
0.8
4b
0.8
8a
0.6
6a
{ Mea
ns
wit
hin
row
and
pla
nt
par
tfo
llow
edby
the
sam
ele
tter
are
no
tsi
gn
ifica
ntl
yd
iffe
ren
tac
cord
ing
toth
et-
test
(P<
0.0
5).
RICE GRAIN AND Cd CONCENTRATIONS 1809
©2002 Marcel Dekker, Inc. All rights reserved. This material may not be used or reproduced in any form without the express written permission of Marcel Dekker, Inc.
MARCEL DEKKER, INC. • 270 MADISON AVENUE • NEW YORK, NY 10016
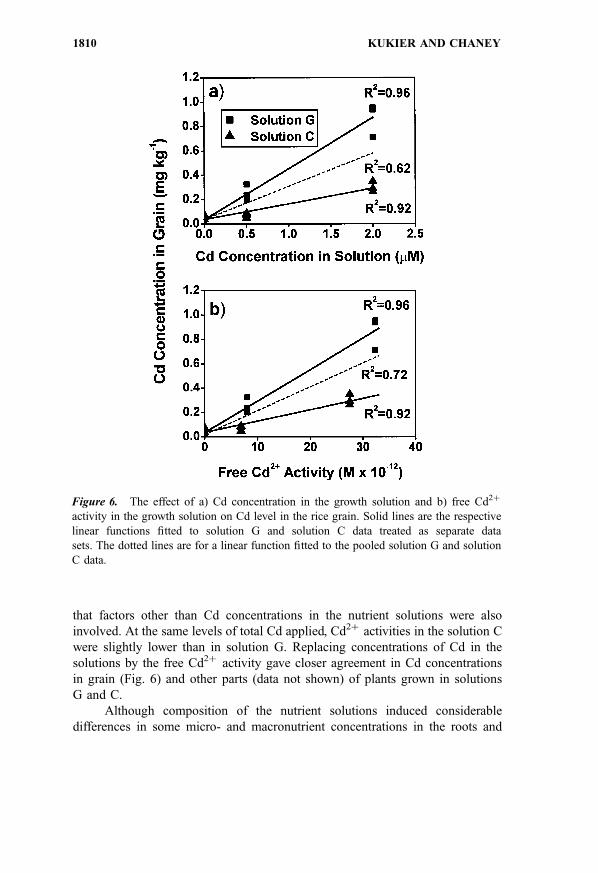
that factors other than Cd concentrations in the nutrient solutions were also
involved. At the same levels of total Cd applied, Cd2þ activities in the solution C
were slightly lower than in solution G. Replacing concentrations of Cd in the
solutions by the free Cd2þ activity gave closer agreement in Cd concentrations
in grain (Fig. 6) and other parts (data not shown) of plants grown in solutions
G and C.
Although composition of the nutrient solutions induced considerable
differences in some micro- and macronutrient concentrations in the roots and
Figure 6. The effect of a) Cd concentration in the growth solution and b) free Cd2þ
activity in the growth solution on Cd level in the rice grain. Solid lines are the respective
linear functions fitted to solution G and solution C data treated as separate data
sets. The dotted lines are for a linear function fitted to the pooled solution G and solution
C data.
1810 KUKIER AND CHANEY
©2002 Marcel Dekker, Inc. All rights reserved. This material may not be used or reproduced in any form without the express written permission of Marcel Dekker, Inc.
MARCEL DEKKER, INC. • 270 MADISON AVENUE • NEW YORK, NY 10016
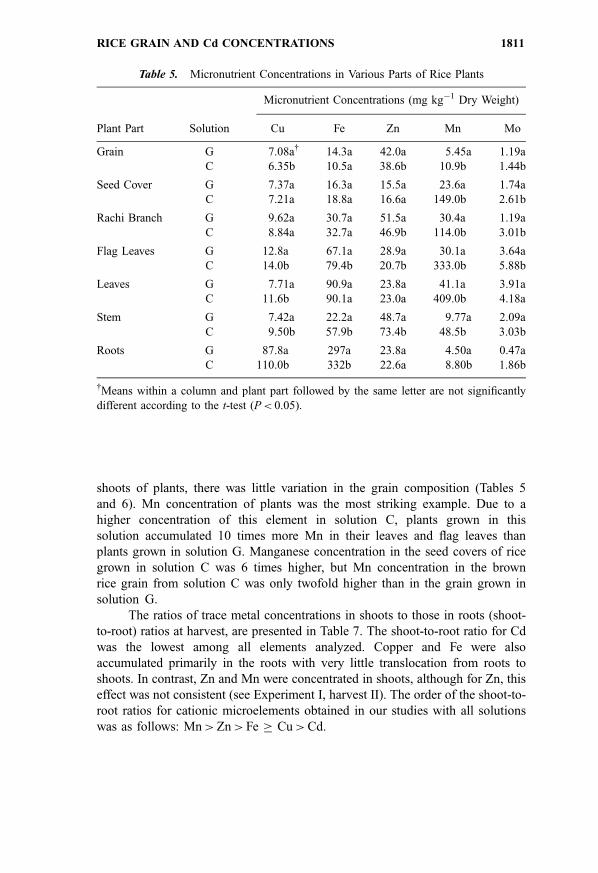
shoots of plants, there was little variation in the grain composition (Tables 5
and 6). Mn concentration of plants was the most striking example. Due to a
higher concentration of this element in solution C, plants grown in this
solution accumulated 10 times more Mn in their leaves and flag leaves than
plants grown in solution G. Manganese concentration in the seed covers of rice
grown in solution C was 6 times higher, but Mn concentration in the brown
rice grain from solution C was only twofold higher than in the grain grown in
solution G.
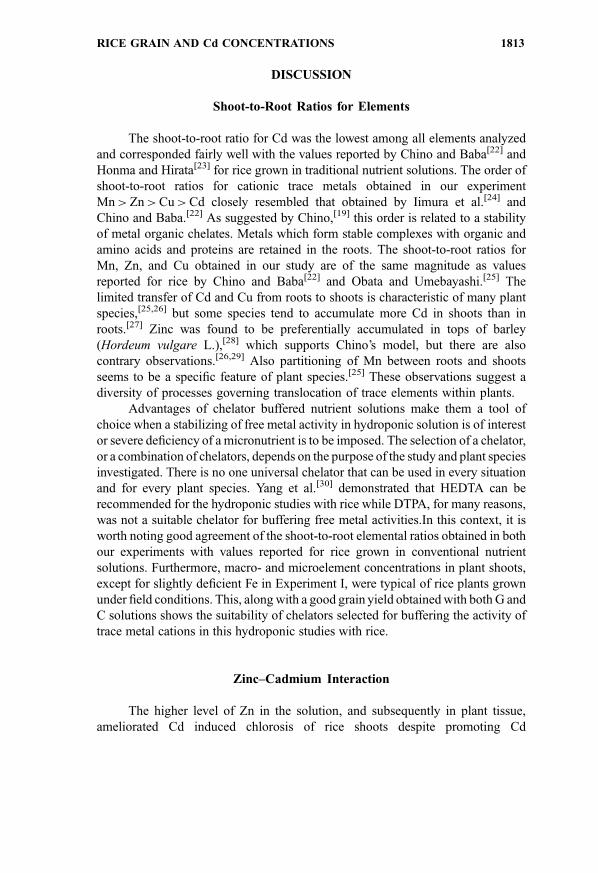
The ratios of trace metal concentrations in shoots to those in roots (shoot-
to-root) ratios at harvest, are presented in Table 7. The shoot-to-root ratio for Cd
was the lowest among all elements analyzed. Copper and Fe were also
accumulated primarily in the roots with very little translocation from roots to
shoots. In contrast, Zn and Mn were concentrated in shoots, although for Zn, this
effect was not consistent (see Experiment I, harvest II). The order of the shoot-to-
root ratios for cationic microelements obtained in our studies with all solutions
was as follows: Mn>Zn> Fe � Cu>Cd.
Table 5. Micronutrient Concentrations in Various Parts of Rice Plants
Micronutrient Concentrations (mg kg�1 Dry Weight)
Plant Part Solution Cu Fe Zn Mn Mo
Grain G 7.08a{ 14.3a 42.0a 5.45a 1.19a
C 6.35b 10.5a 38.6b 10.9b 1.44b
Seed Cover G 7.37a 16.3a 15.5a 23.6a 1.74a
C 7.21a 18.8a 16.6a 149.0b 2.61b
Rachi Branch G 9.62a 30.7a 51.5a 30.4a 1.19a
C 8.84a 32.7a 46.9b 114.0b 3.01b
Flag Leaves G 12.8a 67.1a 28.9a 30.1a 3.64a
C 14.0b 79.4b 20.7b 333.0b 5.88b
Leaves G 7.71a 90.9a 23.8a 41.1a 3.91a
C 11.6b 90.1a 23.0a 409.0b 4.18a
Stem G 7.42a 22.2a 48.7a 9.77a 2.09a
C 9.50b 57.9b 73.4b 48.5b 3.03b
Roots G 87.8a 297a 23.8a 4.50a 0.47a
C 110.0b 332b 22.6a 8.80b 1.86b
{Means within a column and plant part followed by the same letter are not significantly
different according to the t-test (P< 0.05).
RICE GRAIN AND Cd CONCENTRATIONS 1811
©2002 Marcel Dekker, Inc. All rights reserved. This material may not be used or reproduced in any form without the express written permission of Marcel Dekker, Inc.
MARCEL DEKKER, INC. • 270 MADISON AVENUE • NEW YORK, NY 10016
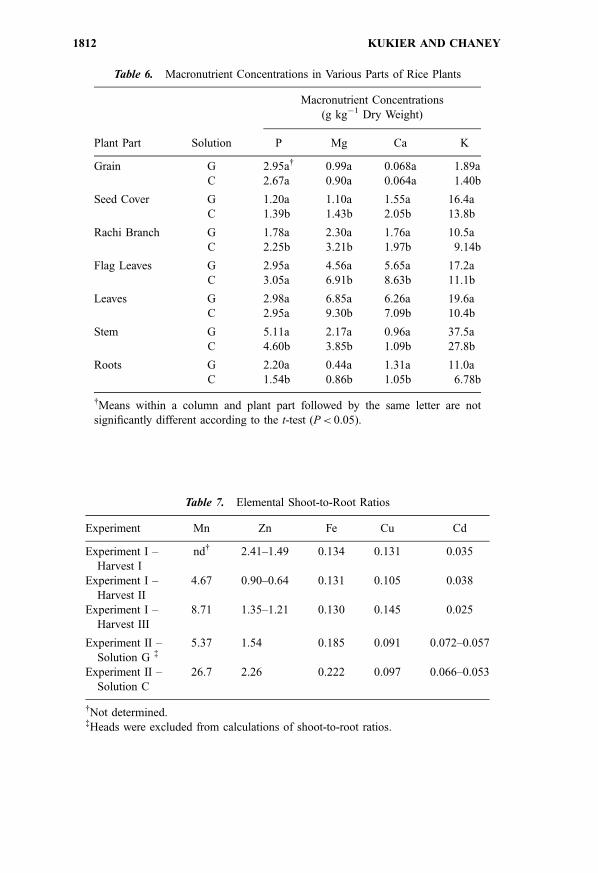
Table 7. Elemental Shoot-to-Root Ratios
Experiment Mn Zn Fe Cu Cd
Experiment I –
Harvest I
nd{ 2.41–1.49 0.134 0.131 0.035
Experiment I –
Harvest II
4.67 0.90–0.64 0.131 0.105 0.038
Experiment I –
Harvest III
8.71 1.35–1.21 0.130 0.145 0.025
Experiment II –
Solution G {5.37 1.54 0.185 0.091 0.072–0.057
Experiment II –
Solution C
26.7 2.26 0.222 0.097 0.066–0.053
{Not determined.{Heads were excluded from calculations of shoot-to-root ratios.
Table 6. Macronutrient Concentrations in Various Parts of Rice Plants
Macronutrient Concentrations
(g kg�1 Dry Weight)
Plant Part Solution P Mg Ca K
Grain G 2.95a{ 0.99a 0.068a 1.89a
C 2.67a 0.90a 0.064a 1.40b
Seed Cover G 1.20a 1.10a 1.55a 16.4a
C 1.39b 1.43b 2.05b 13.8b
Rachi Branch G 1.78a 2.30a 1.76a 10.5a
C 2.25b 3.21b 1.97b 9.14b
Flag Leaves G 2.95a 4.56a 5.65a 17.2a
C 3.05a 6.91b 8.63b 11.1b
Leaves G 2.98a 6.85a 6.26a 19.6a
C 2.95a 9.30b 7.09b 10.4b
Stem G 5.11a 2.17a 0.96a 37.5a
C 4.60b 3.85b 1.09b 27.8b
Roots G 2.20a 0.44a 1.31a 11.0a
C 1.54b 0.86b 1.05b 6.78b
{Means within a column and plant part followed by the same letter are not
significantly different according to the t-test (P< 0.05).
1812 KUKIER AND CHANEY
©2002 Marcel Dekker, Inc. All rights reserved. This material may not be used or reproduced in any form without the express written permission of Marcel Dekker, Inc.
MARCEL DEKKER, INC. • 270 MADISON AVENUE • NEW YORK, NY 10016
DISCUSSION
Shoot-to-Root Ratios for Elements
The shoot-to-root ratio for Cd was the lowest among all elements analyzed
and corresponded fairly well with the values reported by Chino and Baba[22] and
Honma and Hirata[23] for rice grown in traditional nutrient solutions. The order of
shoot-to-root ratios for cationic trace metals obtained in our experiment
Mn>Zn>Cu>Cd closely resembled that obtained by Iimura et al.[24] and
Chino and Baba.[22] As suggested by Chino,[19] this order is related to a stability
of metal organic chelates. Metals which form stable complexes with organic and
amino acids and proteins are retained in the roots. The shoot-to-root ratios for
Mn, Zn, and Cu obtained in our study are of the same magnitude as values
reported for rice by Chino and Baba[22] and Obata and Umebayashi.[25] The
limited transfer of Cd and Cu from roots to shoots is characteristic of many plant
species,[25,26] but some species tend to accumulate more Cd in shoots than in
roots.[27] Zinc was found to be preferentially accumulated in tops of barley
(Hordeum vulgare L.),[28] which supports Chino’s model, but there are also
contrary observations.[26,29] Also partitioning of Mn between roots and shoots
seems to be a specific feature of plant species.[25] These observations suggest a
diversity of processes governing translocation of trace elements within plants.
Advantages of chelator buffered nutrient solutions make them a tool of
choice when a stabilizing of free metal activity in hydroponic solution is of interest
or severe deficiency of a micronutrient is to be imposed. The selection of a chelator,
or a combination of chelators, depends on the purpose of the study and plant species
investigated. There is no one universal chelator that can be used in every situation
and for every plant species. Yang et al.[30] demonstrated that HEDTA can be
recommended for the hydroponic studies with rice while DTPA, for many reasons,
was not a suitable chelator for buffering free metal activities.In this context, it is
worth noting good agreement of the shoot-to-root elemental ratios obtained in both
our experiments with values reported for rice grown in conventional nutrient
solutions. Furthermore, macro- and microelement concentrations in plant shoots,
except for slightly deficient Fe in Experiment I, were typical of rice plants grown
under field conditions. This, along with a good grain yield obtained with both G and
C solutions shows the suitability of chelators selected for buffering the activity of
trace metal cations in this hydroponic studies with rice.
Zinc–Cadmium Interaction
The higher level of Zn in the solution, and subsequently in plant tissue,
ameliorated Cd induced chlorosis of rice shoots despite promoting Cd
RICE GRAIN AND Cd CONCENTRATIONS 1813
©2002 Marcel Dekker, Inc. All rights reserved. This material may not be used or reproduced in any form without the express written permission of Marcel Dekker, Inc.
MARCEL DEKKER, INC. • 270 MADISON AVENUE • NEW YORK, NY 10016
translocation from roots to shoots in the later phase of growth. The most
commonly observed effect is an antagonistic interaction between Cd and
Zn.[31–33] Increased supply of Zn in soil and hydroponic cultures has been
reported to decrease Cd uptake by a variety of plant species including rice.[34]
The effect is especially pronounced when Zn is raised from a deficiency to
sufficiency level (rice,[23] lettuce[32]). Other studies demonstrated that the nature
of the interaction between these two elements is more complex. Application of
Zn to a soil of a low adsorptive capacity, in some cases, promoted Cd uptake by
rice because Cd was replaced by Zn in the soil adsorptive complex and Cd
concentration in soil solution increased.[35] Growing plants in nutrient solutions
allows for elimination of complications associated with soil solid phases, but
hydroponic studies have also yielded conflicting results regarding interactions of
Zn with Cd. Both antagonistic and synergistic interactions between Zn and Cd
were observed by McKenna et al.[29] in their hydroponic experiment with lettuce
and spinach. The mode of interaction was dependent on the relative concentration
of elements in nutrient solution and did not exhibit any definite trends. Girling
and Peterson[34] noticed that at equimolar concentrations of Zn and Cd in a
nutrient solution Zn stimulated uptake of Cd by corn but when Zn : Cd ratio in
solution was increased, the antagonistic effect of Zn on Cd uptake became
evident. Honma and Hirata[23] and Green et al.[36] observed similar effects in
hydroponically grown rice plants and concluded that the synergistic or
antagonistic effect between Zn and Cd depended on the Cd : Zn ratio and the
absolute level of Cd in nutrient solution.
Zinc Uptake
In Experiment I, Zn concentrations in roots and shoots, at harvest I, were
fairly close to values recorded by Green et al.[36] in rice plants of similar age, at
pZn2þ activities 6.6 and 6.1, similar to these used in our study. The pZn2þ
causing 20% decrease of the roots and shoot yield estimated from their study was
5.9. In our experiment, a depression of shoot and root yield by 33 and 41%,
respectively, occurred at pZn2þ 6.0. It appears that the free Zn2þ activity toxic to
young rice plants grown in the EGTA buffered nutrient solution is about
pZn2þ¼ 6.0.
The decrease of root and shoot Zn concentrations observed in our study at
harvest II could be to some extent attributed to a depletion of the solution Zn
caused by a vigorous growth of plants. This explanation is probably sufficient for
plants grown at 1.0 mM Zn in the solution. A mass balance for 3.89 mM Zn
solution indicated that the depletion of Zn in the growth medium probably was
not large enough to cause a drop of shoot Zn concentration from about
100 mg kg�1, at harvest I, to about 30–35 mg kg�1 at harvests II and III. It seems
1814 KUKIER AND CHANEY
©2002 Marcel Dekker, Inc. All rights reserved. This material may not be used or reproduced in any form without the express written permission of Marcel Dekker, Inc.
MARCEL DEKKER, INC. • 270 MADISON AVENUE • NEW YORK, NY 10016
possible that critical concentrations, or activities, of Zn in the solution may vary
depending on the age of plants. Testing this hypothesis would require a thorough
study with a frequent changes of the growth solution to minimize depletion of Zn
in the growth medium.
Cadmium Uptake
The introduction of chemical equilibrium computer models enabled
calculation of metal speciation in hydroponic growth media and soil solution.
Since then, increasing evidence has indicated that plant uptake of many metallic
cations is related to free cation concentration or activity rather than a total metal
concentration in growth media.[16] There are also contrary observations
indicating that total metal concentration in a growing medium can not be
ignored.[28] Substituting Cd concentrations in the growth solutions
(Experiment II) by free Cd2þ activities noticeably reduced variation of Cd in
grain (Fig. 6) and, to a lesser extent, in roots and other plant parts, which may be
seen as supporting the concept that Cd uptake and transport within rice plant is an
active process. Fujimoto and Uchida[37] reached the same conclusion by
comparing the increase in Cd concentration of the whole rice plants grown in a
hydroponic culture with an expected Cd concentration based on the water
transpiration coefficient. The decrease of shoot-to-root ratios with increasing Cd
concentrations in the solution (Experiment I, harvests I and II), observed also by
Chino and Baba,[22] also supports the thesis that Cd transport from roots to shoots
is actively regulated by the rice plants. At the end of Experiment I, when Cd level
in roots approached a toxicity threshold even at the lowest Cd treatment, the Cd
shoot-to-root ratio became independent of the Cd level in the growth medium
which suggests that Cd translocation from roots to shoots is dependent on Cd
concentration in the roots rather than metal concentration in the solution. There
are evidences that Cd is transported to the rice shoots in form of organic
complexes when it is present at low concentrations in the root zone, but at higher
concentrations metal is retained in the roots as inorganic compounds.[22] A
presence of electron-dense Cd deposits in the roots of corn (Zea mays L.) and
Agrostis giganta[38] showed that most species accumulate toxic metals in their
roots.
Composition of Rice Grain
The difference between Cd concentrations in the grain and other parts of
plants grown in solutions G and C at the same Cd concentration, or the same free
Cd2þ activity, indicated that some other factor(s) modified Cd translocation to the
RICE GRAIN AND Cd CONCENTRATIONS 1815
©2002 Marcel Dekker, Inc. All rights reserved. This material may not be used or reproduced in any form without the express written permission of Marcel Dekker, Inc.
MARCEL DEKKER, INC. • 270 MADISON AVENUE • NEW YORK, NY 10016
shoots and grain. Composition of the growth medium likely was the key factor
modifying Cd uptake and translocation to the grain. Because solutions G and C
differed in the concentrations of all cations and anions, this effect can not be
attributed to any specific component. Cd treatment was initiated, at the same date
for both solutions, after 76 days of plant growth. At this time, most plants in
solution C had entered the flowering phase while plants in solution G had only
begun to form flag leaves. Initiation of the Cd treatments at slightly different
stages of the plant growth could have also affected Cd translocation to the
grain.[39] The duration of Cd treatments was longer for plants grown in solution G
because grain was ripe in solution C 8 days earlier. This factor was probably of
minor importance because Cd translocation to grain is very limited in the late
phase of grain ripening.[39]
There is a considerable disagreement on what elemental concentrations are
typical for brown rice. According to Japanese studies,[24] 30–50 mg Zn kg�1 is
considered a normal concentration for brown rice. Later studies[40] revealed that
Zn level of 28.5–38.5 mg kg�1 represents a maximum concentrations found in the
brown rice from China, Indonesia, and Japan while average values for these
countries were within the range of 21.5–23.4 mg kg�1. About 20 mg Zn kg�1 was
a maximum level for brown rice grown in the U.S.[41] while 13.5 mg kg�1 was the
mean value for U.S. brown rice, which agrees well with the mean value of
16.4 mg kg�1 obtained by Masironi et al.[42] who analyzed samples of unpolished
rice grain from various countries of the world. Therefore, Zn concentrations in the
grain obtained in our study should be considered somewhat high. Copper and Fe
levels in the grain obtained in our experiment were comparable to the maximum
values reported for the brown rice from various countries.[41–43] Manganese level
in the grain grown in solution G was close to the minimum while that of grain
grown in solution C was close to the mean value reported for U.S. brown rice.[41]
Concentrations of the major elements Ca, Mg, K, and P in grains grown in both
solutions were close to values reported by Zhang et al.[7] for a single case study in
Japan. When compared with U.S. grown brown rice, they are close to maximum
values.[41]
A number of studies demonstrated that Cd retention in animals was
greatly increased when animal diets were deficient in Zn, Fe, and=or Ca,[2,10]
and opposite, diets enriched in Zn significantly reduced Cd accumulation in
animals.[9] Genetic engineering offers a promising tool for increasing Fe
bioavailability of rice grain.[44] Higher concentrations of Zn, Fe, and Ca in
comparison to most commercially available brown rice grain is of special
importance for a feeding study because it could confound the bioavailability
of the rice Cd. Solution to this problem would be a modification of the
growth solution composition and the repetition of the experiment until the
grain with a desired concentration of not only Cd, but also Zn, Ca, and Fe is
obtained.
1816 KUKIER AND CHANEY
©2002 Marcel Dekker, Inc. All rights reserved. This material may not be used or reproduced in any form without the express written permission of Marcel Dekker, Inc.
MARCEL DEKKER, INC. • 270 MADISON AVENUE • NEW YORK, NY 10016
ACKNOWLEDGMENTS
We gratefully acknowledge the advice offered by Drs. Mitsuo Chino and
Michael Grusak regarding their individual successful culture of growing rice to
mature grain in growth chambers, and the preliminary results of the initial studies
on growing rice using chelator-buffered nutrient solutions by Dr. Carrie E. Green;
Dr. Green also kindly maintained all instruments and growth chambers needed for
these studies; Dr. Tony Marchetti, USDA-ARS, Beaumont, TX, for providing
certified seed of ‘Jefferson’ rice for these experiments. During this project,
Dr. U. Kukier was a visiting scientist from the Institute of Soil Science and Plant
Cultivation, Pulawy, Poland, supported by a grant from USDA-Foreign
Agricultural Service to Dr. Tomasz I. Stuczynski in cooperative studies of soil
Cd, Zn, and Pb remediation. Dr. Kukier is presently Research Scientist with the
Department of Crop and Soil Environmental Sciences, Virginia Polytechnic
Institute and State University, Blacksburg, VA.
REFERENCES
1. Tsuchiya, K. (Ed.) Cadmium Studies in Japan: A Review; Elsevier=North-
Holland Biomedical Press: New York, 1978; 376 pp.
2. Fox, M.R.S.; Tao, S.-H.; Stone, C.L.; Fry, B.E., Jr. Effects of Zinc, Iron, and
Copper Deficiencies on Cadmium in Tissues of Japanese Quail. Environ.
Health Perspect. 1984, 54, 57–65.
3. McKenna, I.M.; Chaney, R.L.; Tao, S.; Leach, R.M., Jr.; Williams, F.M.
Interactions of Plant Zinc and Plant Species on the Bioavailability of Plant
Cadmium to Japanese Quail Fed Lettuce and Spinach. Environ. Res. 1992,
57, 73–87.
4. Sakurai, H. Epidemiological Studies. In Cadmium Studies in Japan: A
Review; Tsuchiya, K., Ed.; Elsevier=North-Holland Biomedical Press:
Amsterdam, The Netherlands, 1978; 133–267.
5. Strehlow, C.D.; Barltrop, D. The Shipham Report: An Investigation into
Cadmium Concentration and Its Implications for Human Health. 6. Health
Studies. Sci. Total Environ. 1988, 75, 101–133.
6. Wolnik, K.A.; Fricke, F.L.; Capar, S.G.; Braude, G.L.; Meyer, M.W.;
Satzger, R.D.; Kuennen, R.W. Elements in Major Raw Agricultural Crops in
the United States. 2. Other Elements in Lettuce, Peanuts, Potatoes,
Soybeans, Sweet Corn, and Wheat. J. Agric. Food Chem. 1983, 31,
1244–1249.
7. Zhang, Z.W.; Moon, C.S.; Watanabe, T.; Shimbo, S.; Ikeda, M. Contents of
Pollutant and Nutrient Elements in Rice and Wheat Grown on the
Neighboring Fields. Biol. Trace Element Res. 1997, 57, 39–50.
RICE GRAIN AND Cd CONCENTRATIONS 1817
©2002 Marcel Dekker, Inc. All rights reserved. This material may not be used or reproduced in any form without the express written permission of Marcel Dekker, Inc.
MARCEL DEKKER, INC. • 270 MADISON AVENUE • NEW YORK, NY 10016
8. Berglund, M.; Akesson, A.; Nermell, B.; Vahter, M. Intestinal Absorption
of Dietary Cadmium in Women Depends on Body Iron Stores and Fiber
Intake. Environ. Health Perspect. 1994, 102, 1058–1066.
9. Stuczynski, T.; Pistelok, F.; Siebielec, G.; Kukla, H.; Daniels, W.; Chaney, R.;
Pantuck, K. Biological Aspects of Metal Waste Reclamation with Sewage
Sludge in Poland. In Mining, Forest and Land Restoration: The Successful
Use of Residuals=Biosolids=Organic Matter for Reclamation Activities,
Proceedings of Symposium, Denver, CO, July 17–20, 2000; Rocky Mountain
Water Environment Association: Denver, CO, 2000; Chap. 5, 12 pp.
10. Reeves, P.G.; Chaney, R.L. Mineral Status of Female Rats Affects the
Absorption and Organ Distribution of Dietary Cadmium Derived from
Edible Sunflower Kernels (Helianthus annuus L.). Environ. Res., Section A,
2001, 85, 215–225.
11. Fox, M.R.S. Nutritional Factors that May Influence Bioavailability of
Cadmium. J. Environ. Qual. 1988, 17, 175–180.
12. Chaney, R.L.; Ryan, J.A.; Li, Y.M.; Brown, S.L. Soil Cadmium as a Threat
to Human Health. In Cadmium in Soils and Plants; McLaughlin, M.J.,
Singh, B.R., Eds.; Kluwer Academic Publishers: Dordrecht, Netherlands,
1999; 219–256.
13. Welch, R.M.; House, W.A.; Van Campen, D.R. Availability of Cadmium
from Lettuce Leaves and Cadmium Sulfate to Rats. Nutr. Rept. Intern.
1978, 17, 35–42.
14. Chino, M. Uptake-Transport of Toxic Metals in Rice Plants. In Heavy
Metals Pollution in Soils of Japan; Kitagishi, K., Yamane, I., Eds.; Japan
Scientific Societies Press: Tokyo, 1981; 81–94.
15. Kitagishi, K.; Obata, H. Accumulation of Heavy Metals in Rice Grains. In
Heavy Metal Pollution in Soils of Japan; Kitagishi, K., Yamane, E., Eds.;
Japan Scientific Societies Press: Tokyo, 1981; 95–104.
16. Parker, D.R.; Chaney, R.L.; Norvell, W.A. Chemical Equilibrium Models:
Application to Plant Nutrition Research. In Chemical Equilibrium and
Reaction Models; Loeppert, R.H., Schwab, A.P., Goldberg, S., Eds.; SSSA
and ASA: Madison, WI, 1995; SSSA Spec. Publ. 42, 163–200.
17. Parker, D.R.; Norwell, W.A.; Chaney, R.L. GEOCHEM-PC: A Chemical
Speciation Program for IBM and Compatible Personal Computers. In
Chemical Equilibrium and Reaction Models; Loeppert, R.H., Schwab, A.P.,
Goldberg, S., Eds.; SSSA and ASA: Madison, WI, 1995; SSSA Spec. Publ.
42, 253–269.
18. SAS Institute. SAS=STATTM User’s Guide, Release 6.03 Ed.; SAS Institute,
Inc.: Cary, NC, 1988.
19. Chino, M. Metal Stress in Rice Plants. In Heavy Metals Pollution in Soils of
Japan; Kitagishi, K., Yamane, I., Eds.; Japan Scientific Societies Press:
Tokyo, 1981; 65–80.
1818 KUKIER AND CHANEY
©2002 Marcel Dekker, Inc. All rights reserved. This material may not be used or reproduced in any form without the express written permission of Marcel Dekker, Inc.
MARCEL DEKKER, INC. • 270 MADISON AVENUE • NEW YORK, NY 10016
20. Jones, U.S.; Katyal, J.C.; Mamaril, C.P.; Park, C.S. Wetland Rice-Nutrient
Deficiencies Other than Nitrogen. In Rice Research Strategies for the
Future; IRRI: Los Banos, Philippines, 1982; 327–378.
21. Tanaka, A.; Yoshida, S. Nutritional Disorders of the Rice Plant in Asia;
IRRI: Manila, Philippines, 1970; Tech. Bull. 10, 51 pp.
22. Chino, M.; Baba, A. The Effects of Some Environmental Factors on the
Partitioning of Zinc and Cadmium Between Roots and Tops of Rice Plants.
J. Plant Nutr. 1981, 3, 203–214.
23. Honma, Y.; Hirata, H. Noticeable Increase in Cadmium Absorption by Zinc
Deficient Rice Plants. Soil Sci. Plant Nutr. 1978, 24, 295–297.
24. Iimura, K.; Ito, H.; Chino, M.; Morishita, T.; Hirata, H. Behavior of
Contaminant Heavy Metals in Soil-Plant System. In Proceedings of the
International Seminar Soil Environment and Fertility Management in
Intensive Agriculture; The Society of the Science of Soil and Manure:
Japan, 1977; 357–368.
25. Obata, H.; Umebayashi, M. Effects of Cadmium on Mineral Nutrient
Concentrations in Plants Differing in Tolerance for Cadmium. J. Plant Nutr.
1997, 20, 97–105.
26. Brown, S.L.; Chaney, R.L.; Angle, J.S.; Baker, A.J.M. Zinc and Cadmium
Uptake by Hyperaccumulator Thlaspi caerulescens Grown in Nutrient
Solution. Soil Sci. Soc. Am. J. 1995, 59, 125–133.
27. Sela, M.; Tel-Or, E.; Fritz, E.; Huttermann, A. Localization and Toxic
Effects of Cadmium, Copper, and Uranium in Azolla. Plant Physiol. 1988,
88, 30–36.
28. Bell, P.F.; Chaney, R.L.; Angle, J.S. Free Metal Activity and Total Metal
Concentrations as Indices of Micronutrient Availability to Barley [Hordeum
vulgare (L.) ‘Klages’]. Plant Soil 1991, 130, 51–62.
29. McKenna, I.M.; Chaney, R.L.; Williams, F.M. The Effects of Cadmium
and Zinc Interactions on the Accumulation and Tissue Distribution of
Zinc and Cadmium in Lettuce and Spinach. Environ. Pollut. 1993, 79,
113–120.
30. Yang, X.; Romheld, V.; Marschner, H.; Chaney, R.L. Application of
Chelator-buffered Nutrient Solution Technique in Studies on Zinc Nutrition
in Rice Plant (Oryza sativa L.). Plant Soil 1994, 163, 85–94.
31. Smilde, K.W.; Van Luit, B.; Van Driel, W. The Extraction by Soil and
Absorption by Plants of Applied Zinc and Cadmium. Plant Soil 1992, 143,
233–238.
32. Chaney, R.L.; Green, C.E.; Filcheva, E.; Brown, S.L. Effect of Iron,
Manganese, and Zinc Enriched Biosolids Compost on Uptake of Cadmium
by Lettuce from Cadmium Contaminated Soils. In Sewage Sludge: Land
Utilization and the Environment; Clapp, C.E., Larson, W.E., Dowdy, R.H.,
Eds.; ASA, CSSA, SSSA: Madison, WI, 1993; 205–207.
RICE GRAIN AND Cd CONCENTRATIONS 1819
©2002 Marcel Dekker, Inc. All rights reserved. This material may not be used or reproduced in any form without the express written permission of Marcel Dekker, Inc.
MARCEL DEKKER, INC. • 270 MADISON AVENUE • NEW YORK, NY 10016
33. Choudhary, M.; Bailey, L.D.; Grant, C.A.; Leisle, D. Effect of Zn on the
Concentrations of Cd and Zn in Plant Tissue of Two Durum Wheat Lines.
Can. J. Plant Sci. 1995, 75, 445–448.
34. Girling, C.A.; Peterson, P.J. The Significance of the Cadmium Species in
Uptake and Metabolism of Cadmium in Crop Plants. J. Plant Nutr. 1981, 3,
707–720.
35. Asami, T. Pollution of Soils by Cadmium. In Changing Metal Cycles and
Hman Health; Nriagu, J.O., Ed.; Springer-Verlag: Berlin, 1984; 95–111.
36. Green, C.E.; Chaney, R.L.; Bouwkamp, J. Interactions Between Cadmium
Uptake and Phytotoxic Zinc Levels in Rice (Oryza sativa L.) Using
Chelator-Buffered Nutrient Solution. Plant Soil 2001, under review.
37. Fujimoto, T.; Uchida, Y. Cadmium Absorption by Rice Plants. I. Mode of
Absorption. Soil Sci. Plant Nutr. 1979, 25, 407–415.
38. Rauser, W.E.; Ackerley, C.A. Localization of Cadmium in Granules Within
Differentiating and Mature Root Cells. Can. J. Bot. 1987, 65, 643–646.
39. Chino, M. The Distribution of Heavy Metals in Rice Plants Influenced by
the Path of Supply. J. Sci. Soil Manure 1973, 44, 204–210.
40. Herawati, N.; Rivai, I.F.; Koyama, H.; Suzuki, S. Zinc Levels in Rice and
Soil According to the Soil Types of Japan, Indonesia, and China. Bull.
Environ. Contam. Toxicol. 1998, 60, 402–408.
41. Wolnik, K.A.; Fricke, F.L.; Capar, S.G.; Meyer, M.W.; Satzger, R.D.;
Bonnin, E.; Gaston, C.M. Elements in Major Raw Agricultural Crops in the
United States. 3. Cadmium, Lead, and Eleven Other Elements in Carrots,
Field Corn, Onions, Rice, Spinach, and Tomatoes. J. Agric. Food Chem.
1985, 33, 807–811.
42. Masironi, R.; Koirtyohann, S.R.; Pierce, J.O. Zinc, Copper, Cadmium and
Chromium in Polished and Unpolished Rice. Sci. Total Environ. 1977, 7,
27–43.
43. Herawati, N.; Rivai, I.F.; Koyama, H.; Suzuki, S.; Lee, Y. Copper in Rice
and Soils According to Soil Type in Japan, Indonesia, and China: A
Baseline Study. Bull. Environ. Contam. Toxicol. 1998, 60, 266–272.
44. Lucca, P.; Wunn, J.; Hurrell, R.F.; Potrykus, L. Development of Iron-Rich
Rice and Improvement of Its Absorption in Humans by Genetic
Engineering. J. Plant Nutr. 2000, 23, 1983–1988.
1820 KUKIER AND CHANEY
©2002 Marcel Dekker, Inc. All rights reserved. This material may not be used or reproduced in any form without the express written permission of Marcel Dekker, Inc.
MARCEL DEKKER, INC. • 270 MADISON AVENUE • NEW YORK, NY 10016
Related Documents


