Growing Pains: The Effect of Hospital Market Consolidation on Health Care Quality and Wages Citation Varshney, Varun. 2019. Growing Pains: The Effect of Hospital Market Consolidation on Health Care Quality and Wages. Bachelor's thesis, Harvard College. Permanent link https://nrs.harvard.edu/URN-3:HUL.INSTREPOS:37364641 Terms of Use This article was downloaded from Harvard University’s DASH repository, and is made available under the terms and conditions applicable to Other Posted Material, as set forth at http:// nrs.harvard.edu/urn-3:HUL.InstRepos:dash.current.terms-of-use#LAA Share Your Story The Harvard community has made this article openly available. Please share how this access benefits you. Submit a story . Accessibility

Welcome message from author
This document is posted to help you gain knowledge. Please leave a comment to let me know what you think about it! Share it to your friends and learn new things together.
Transcript

Growing Pains: The Effect of Hospital Market Consolidation on Health Care Quality and Wages
CitationVarshney, Varun. 2019. Growing Pains: The Effect of Hospital Market Consolidation on Health Care Quality and Wages. Bachelor's thesis, Harvard College.
Permanent linkhttps://nrs.harvard.edu/URN-3:HUL.INSTREPOS:37364641
Terms of UseThis article was downloaded from Harvard University’s DASH repository, and is made available under the terms and conditions applicable to Other Posted Material, as set forth at http://nrs.harvard.edu/urn-3:HUL.InstRepos:dash.current.terms-of-use#LAA
Share Your StoryThe Harvard community has made this article openly available.Please share how this access benefits you. Submit a story .
Accessibility

GROWING PAINS
THE EFFECT OF HOSPITAL MARKET CONSOLIDATION ON
HEALTH CARE QUALITY AND WAGES
A THESIS
SUBMITTED TO THE DEPARTMENT OF APPLIED MATHEMATICS
OF HARVARD UNIVERSITY
IN PARTIAL FULFILLMENT OF THE REQUIREMENTS
FOR THE DEGREE OF
BACHELORS OF ARTS
Varun Varshney
March 2019

c© Copyright by Varun Varshney 2019
All Rights Reserved
ii

Abstract
In this thesis, I analyze the impact of hospital consolidation on two key metrics: the quality
of health care and the wages of the workers that provide it. I use a difference-in-differences
model to estimate the causal effect of significant changes in hospital market concentration
on quality metrics and the wages of health care professionals. Using data on 4,793 hospitals
from 2014 to 2016, I measure changes in hospital consolidation by calculating the Herfindahl-
Hirschman Index (HHI) of the health care markets in question. The ‘treatment’ to a hospital
in the difference-in-differences model is being located in a market that experienced significant
consolidation from 2014 to 2015. I find no causal link between hospital consolidation and
quality of care; mortality and readmission rates for acute myocardial infarction, heart failure
and pneunomia did not increase after a significant consolidation event in a market. The
wages of most studied health care professionals increased by less in areas that had significant
consolidation, with the exception of registered nurses, who may have the benefit of strong
unionization. The 10th percentile of health care practitioner wages increased in areas with
significant system expansion, likely due to the consolidation of lower skill jobs across the
system leading to higher wages for retained employees. My work calls into question the
claims that hospital mergers lead to better health outcomes and suggests that mergers can
slow wage growth of health care practitioners. This could have implications for anti-trust
policy and enforcement for future hospital merger and acquisition activity.
iii

Acknowledgments
I would like to thank my advisor, Professor Robin Lee, and seminar leader, Dr. Kiran
Gajwani, for their guidance and support in this endeavor. I could not have completed this
work without their immense help and patience.
I would like to thank the Harvard Economics Department for graciously allowing me to use
their resources in preparing this thesis. Similarly, I would like to thank the Applied
Mathematics Department for their support over the past four years.
I would like to thank the incredible professors that have given me the interest, knowledge
and motivation to study this topic. I would like to thank Professors Garber, Newhouse,
Cutler, and Jena, who particularly informed this thesis.
I would like to thank my friends for their support and motivation. My peers inspired me to
rise to the occasion of the senior thesis, and I am grateful for them.
Finally, I would like to thank my mother, father and sister. Thanks to their countless
sacrifices and tireless effort, I am where I am today. I dedicate this work and the four years
of study it represents to them. Without them, I would have nothing.
iv

Contents
Abstract iii
Acknowledgments iv
1 Introduction 1
2 Data and Methodology 6
3 Results 24
4 Discussion 31
5 Conclusions 35
A Additional Tables 37
References 42
v

List of Tables
2.1 Summary Statistics of Studied Variables . . . . . . . . . . . . . . . . . . . . 15
2.2 Average Value and Change of HHI in Control and Treatment Groups, Defined
by Hospital-based HHIH and Static Threshold . . . . . . . . . . . . . . . . . 19
3.1 Quality Metrics Regression Results, Hospital-based HHIH with Static Thresh-
old Treatment . . . . . . . . . . . . . . . . . . . . . . . . . . . . . . . . . . . 25
3.2 Quality Metrics Regression Results, System-based HHIS with Static Thresh-
old Treatment . . . . . . . . . . . . . . . . . . . . . . . . . . . . . . . . . . . 26
3.3 29-0000, 29-1141, and 29-1069 Annual Wage Regression Results, Hospital-
based HHIH with Static Threshold Treatment . . . . . . . . . . . . . . . . . 28
3.4 29-0000, 29-1141, and 29-1069 Annual Wage Regression Results, System-based
HHIS with Static Threshold Treatment . . . . . . . . . . . . . . . . . . . . . 30
A.1 Quality Metrics Regression Results, Hospital-based HHIH with Quartile Treat-
ment . . . . . . . . . . . . . . . . . . . . . . . . . . . . . . . . . . . . . . . . 38
A.2 Quality Metrics Regression Results, System-based HHIS with Quartile Treat-
ment . . . . . . . . . . . . . . . . . . . . . . . . . . . . . . . . . . . . . . . . 39
A.3 29-0000, 29-1141, and 29-1069 Annual Wage Regression Results, Hospital-
based HHIH with Quartile Treatment . . . . . . . . . . . . . . . . . . . . . . 40
A.4 29-0000, 29-1141, and 29-1069 Annual Wage Regression Results, System-based
HHIS with Quartile Treatment . . . . . . . . . . . . . . . . . . . . . . . . . . 41
vi

List of Figures
1.1 Hospital and Health System Merger and Acquisition Activity, 2000-2017 (Kauf-
man Hall, 2018) . . . . . . . . . . . . . . . . . . . . . . . . . . . . . . . . . . 2
2.1 Map of Hospital Service Areas (HSAs), provided by Dartmouth Institute for
Health Policy and Clinical Practice . . . . . . . . . . . . . . . . . . . . . . . 8
2.2 AMI 30-Day Mortality Rate vs. HHIH by HSA . . . . . . . . . . . . . . . . . 11
2.3 AMI 30-Day Readmission Rate vs. HHIH by HSA . . . . . . . . . . . . . . . 11
2.4 Average Annual Wage of Health Care Practioners and Technical Occupations
(29-0000) vs. HHIH calculated by HSA . . . . . . . . . . . . . . . . . . . . . 13
2.5 Average AMI 30-Day Mortality from 2009 to 2016 in Treatment and Control
Groups, Hospital-based HHIH with Static Threshold Treatment . . . . . . . 21
2.6 Average AMI 30-Day Readmissions from 2009 to 2016 in Treatment and Con-
trol Groups, Hospital-based HHIH with Static Threshold Treatment . . . . . 21
2.7 Average Annual Wage of Health Care Practitioners and Technical Occupations
(29-0000) from 2011 to 2016 in Treatment and Control Groups, Hospital-based
HHIH with Static Threshold Treatment . . . . . . . . . . . . . . . . . . . . 22
vii
Chapter 1
Introduction
If you go to a hospital in Lee County, Florida, it will likely be owned and operated by
Lee Health. Over the past 25 years, the health care conglomerate has been able to acquire
every major hospital in the county while simultaneously building and purchasing other re-
lated facilities. For the county’s 750,000 residents, Lee Health is synonymous with hospital
care. This story of market consolidation is not entirely unique to Southwest Florida, how-
ever. Across the country, we have seen intense merger and acquisition activity within health
markets. A recent trade publication shows that 115 transactions were announced among
hospitals in 2017, the highest number in recent history (Kaufman Hall, 2018). While pro-
ponents of this consolidation argue that it allows larger health systems to provide low cost,
high quality care (Perry & Cunningham, 2012), there is significant debate in the academic
community on whether or not this is actually the case. As health care spending in the United
States continues to grow and consolidation becomes an increasingly important part of health
market behavior, it is imperative for us to critically examine consolidation’s impact on the
efficiencies of health care delivery.
1

CHAPTER 1. INTRODUCTION 2
Figure 1.1: Hospital and Health System Merger and Acquisition Activity, 2000-2017 (Kauf-man Hall, 2018)
To understand why hospital consolidation is valuable to study, we must first think about
the importance of health care as a whole in today’s economy. Health care expenditure now
accounts for nearly one-fifth of the US economy, and this proportion is only growing. In
2016, total health care expenditures reached $3.3 trillion, a 4.3% jump over the previous
year (Hartman, et al., 2018). Aside from the economic resources devoted to health care, it is
also incredibly important to study given its impact on society —high quality, low cost health
care allows us to live longer, more enjoyable lives. Given the size and growth of expenditure,
it is reasonable to look at consolidation, a market trend that has persisted over the past
several decades, and its relation to these expenditures.
Widespread consolidation began in the 1990s, when a merger wave swept across the
industry. Hospital systems, or organizations that consist of multiple hospitals, have been an
incredibly important factor in the health care landscape since then (Gaynor, et al., 2014).
The formation of these systems via mergers and acquisitions has persisted over the past two
decades (see Figure 1.1). Furthermore, as systems grow, the number of hospitals involved in
such transactions has increased over time (American Hospital Association, 2018b). While all

CHAPTER 1. INTRODUCTION 3
mergers and hospital systems do not lead to reduced competition, many do, and this causes
us to question what impact this reduced competition has on different factors.
In this thesis, I analyze the impact of hospital consolidation on two key metrics: the
quality of health care and the wages of the workers that provide it. I use a difference-
in-differences model to estimate the causal effect of significant changes in hospital market
concentration on quality metrics and the wages of health care professionals. I measure
market concentration by calculating the Herfindahl-Hirschman Index (HHI) of all health
care markets in the United States. I include all hospitals registered with Medicare in the
analysis and study changes in their quality and wages from 2014 to 2016. The analysis
ultimately shows that hospital consolidation causes no significant change in the quality of
care and is negative for the wage growth of most health care professionals, with the exception
of registered nurses and professionals at the lower end of the wage distribution.
The chosen variables, quality and wage, reflect the most relevant effects and pertinent
questions surrounding hospital consolidation unanswered in the current literature. They
would both in theory be impacted by consolidation, and are relevant concerns when dis-
cussing the issue from an antitrust perspective. Furthermore, they appear frequently in
public and political discourse, in which many parties are concerned about rising costs, ques-
tionable quality and overall wage growth.
While I do not focus on the price of health care as a variable in this thesis, its role in
the discussion of hospital consolidation cannot be neglected. There is a large and growing
literature suggesting that hospital consolidation increases the price of health care services,
and this literature powers my motivation and approach to the study of quality and wages.
Increases in price have regularly exceeded the rate of inflation, contributing to the health
care expenditure growth rate consistently outpacing domestic GDP growth (Sheiner, 2014).
This has troubled consumers for decades, evidenced recently by a NBC/Wall Street Journal
poll that reported health care costs as voters’ top issue (NBC News/Wall Street Journal,
2018). While the American Hospital Association claims that the creation of larger hospital

CHAPTER 1. INTRODUCTION 4
systems lowers costs and some research suggests that this is passed on to consumers (Amer-
ican Hospital Association, 2018a), a growing literature calls this conventional wisdom into
question, concluding that the increase in efficiencies is not sufficient to offset the increase in
market power (Gaynor & Town, 2012). A survey of hospital price concentration literature
published from 2000 to 2011 showed that seven of eight relevant papers found a positive
relationship between hospital concentration and price (Gaynor et al., 2014). In this thesis, I
use the general consensus of the literature on price effects to provide context for my findings
on quality and wages.
The quality of health care is incredibly important to overall societal welfare; it ties
directly to patient outcomes. When defending proposed mergers against anti-trust scrutiny,
hospitals often cite future quality improvement as a key point in their defense, though even
legal analysts acknowledge that there is sparse literature supporting the fact that mergers
lead to higher quality of care (Perry & Cunningham, 2012). There is far less literature on
the impacts of consolidation on quality compared to price, and there have been calls for
additional studies due to inconsistent results in the current literature (Mutter, Romano, &
Wong, 2011). Theory suggests that quality may be either positively or negatively associated
with competition when firms are setting quantity and price. This is because unlike other firm
decisions, hospitals cannot directly select a level of quality to maximize profits. Instead, they
set an overall level of effort which leads to effects on quality among other variables (Gaynor
& Town, 2012). It is therefore imperative for more empirical research to be done in the field
to come to better conclusions in this key area.
Wages are important to consider on two fronts. First of all, given that a hospital system
could be the sole or largely dominant employer of health care workers in a given region, it
immediately raises the question of monopsony power. Theory suggests that larger hospital
systems may utilize their labor market power to obtain more favorable salaries and contracts
with health care professionals, leading to relatively lower wages. Secondly, labor services and
wages are interesting factors to consider given that they represent one of the largest inputs

CHAPTER 1. INTRODUCTION 5
into the production of health care (Sheiner, 2014). Again, compared to price, little work has
been done to connect consolidation and wages. A recent study found that post-consolidation
employment levels of registered nurses decreased with no impact on wages, suggesting that
the employment changes were derived from efficiencies rather than monopsony power (De-
Pasquale, 2014). There is not, however, a large body of research to corroborate this claim,
and the scope of this review was prior to the most recent wave of consolidation in the past
decade.
This thesis adds to the existing literature in three key ways. First, it complements the
existing literature on the impact of hospital consolidation on price. While price is certainly
an important metric for economists and consumers alike, the additional analyses of hospital
consolidation’s impact on other variables provides a more holistic assessment. Next, it
provides further clarity on the theory behind the possible effect of hospital consolidation
on quality. Given that the work in the quality realm is relatively sparse, this work adds to
establishing a consensus on consolidation’s effect on quality as has been done with price.
Lastly, it establishes a baseline for further analysis on the question of hospital concentration
and its relation to health care wages, a metric far less studied than quality or price. By
pursuing a national analysis across different types of health care workers, this wage analysis
provides a broader conclusion on wage effects than previous work. All in all, this work more
fully outlines the tradeoffs when hospital markets consolidate. While the price tradeoff has
been well defined, quality and wage tradeoffs have not. Enumerating these tradeoffs will
allow us to consider them individually and holistically to inform future policy decisions on
hospital merger and acquisition activity.

Chapter 2
Data and Methodology
Data
This thesis explores how hospital consolidation affects the quality of health care and the
wages of the workers that provide it. The data used to answer this question fall into three
categories: general data about hospitals, markets and concentration, data on hospital quality,
and data describing health care workers’ wages from 2014 to 2016.
The hospitals studied in this thesis are those registered with Medicare, which is overseen
by the Centers for Medicare and Medicaid Services (CMS). CMS has a total of 4, 793 hospitals
registered as of 2017, which is a vast majority of the 5, 534 hospitals registered with the
American Hospital Association (AHA) in 2018.1 The 398 hospitals under the Veterans
Health Administration of the Department of Veteran Affairs (VA) are excluded from the
analysis due to their unique nature. Two key data sources provide general information about
the hospitals in question. The first is from the “Hospital Compare” program administered
by CMS. This is a publicly available database compiled annually that includes information
about the hospitals registered with Medicare. As I discuss later, this database also serves as
the source for the quality metrics analyzed in this thesis. The other data source is the AHA
1This number includes all member and non-member hospitals that meet the American Hospital Associa-tion’s classification requirements for a hospital, and therefore is taken as the true number of hospitals in theUnited States.
6

CHAPTER 2. DATA AND METHODOLOGY 7
Annual Survey, which is sent to all members and has a response rate greater than 75%. This
data set was matched with the Hospital Compare data set to provide granular information
about the hospitals in question. The Annual Survey supplies the number and type of beds in
each hospital, which serves the backbone for calculation of market concentration. I assembled
and compiled both of these annually-collected data sets for the years 2014 - 2016.
Competitive markets for each hospital were derived from the hospital service areas (HSAs)
defined by the Dartmouth Atlas of Health Care, a project of the Dartmouth Institute for
Health Policy and Clinical Practice. These markets were also constructed using historical
Medicare data, making them appropriate for use in my analysis of Medicare hospitals. HSAs
are local health care markets for hospital care and are comprised of a collection of ZIP
codes. Residents of an HSA receive most of their hospitalizations from the hospitals in
that area, i.e. it is the area in which the greatest proportion of its Medicare residents were
hospitalized.2 Each hospital belongs to at most one HSA, but an HSA can have zero, one or
multiple hospitals. An HSA can have no hospitals due to the fact that since their creation
in the early 1990s, HSAs have had hospital closures within them but were not redefined for
continuity. There are 3,436 hospital service areas. A map of the HSAs is provided in Figure
2.1.
2Since HSAs were designed to be mutually exclusive and collectively exhaustive of the United States,minor adjustments were made by its creators to ensure geographic contiguity.

CHAPTER 2. DATA AND METHODOLOGY 8
Figure 2.1: Map of Hospital Service Areas (HSAs), provided by Dartmouth Institute forHealth Policy and Clinical Practice
I measure hospital market concentration by calculating the Herfindahl-Hirschman Index
(HHI) of the health care markets in question, the HSAs. As discussed in the most recent
issue of the Horizontal Merger Guidelines by the U.S. Department of Justice (DoJ) and
Federal Trade Commission (FTC) —henceforth, the Agencies —the HHI is often used to
calculate market concentration. It is calculated by summing the squares of n individuals
firms’ market shares, giving proportionately greater weight to the larger market shares:
HHI = s21 + s22 + s23 + ...+ s2n (2.1)
where si is the market share of the ith hospital in the HSA expressed as a number between 0
and 100. I calculate individual hospitals’ market shares as their bed share using AHA Annual
Survey data, in line with previous literature (Ghiasi et al. 2018). A hospital’s bed share is
equal to its number of beds divided by the total number of beds in the market. A potential
shortcoming in this definition of the HHI is that it does not take into account the formation
of hospital systems, for it calculates market share based only on the number of beds in

CHAPTER 2. DATA AND METHODOLOGY 9
individual hospitals.3 To account for this, I also conduct a system-level analysis, where si is
the market share of the ith hospital system in the HSA. It is analogously calculated as the
bed share of the system, i.e. the sum of all beds in the system’s hospitals divided by the total
number of beds in the market. For clarity, I denote HHI calculated with individual hospital
market shares as HHIH and hospital system market shares as HHIS. I further discuss the
use of both concentration measures in the Methodology section.
Generally, mergers with an increase of HHI of more than 200 points, particularly those
that result in highly concentrated markets, raise concerns for the Agencies (U.S. Depart-
ment of Justice & Federal Trade Commission, 2010). Passage of this threshold does not
automatically lead to further investigation, but it does inform the Agencies’ decision to look
further into competitive concerns. More specifically, the Agencies classify markets by HHI
as follows:
• Unconcentrated: HHI < 1500
• Moderately Concentrated: 1500 < HHI < 2500
• Highly Concentrated: HHI > 2500
Data on hospital quality comes from the CMS “Hospital Compare” program, which has
a robust set of quality metrics at the hospital level, with measurements taken from 2014 to
2016. The data includes both mortality rates and readmission rates. The mortality rates
assess death from any cause within 30 days of an admission (regardless of whether the patient
dies before or after discharge from the hospital). The readmission rates assess unscheduled
readmission to any registered health facility for any reason within 30 days of discharge from a
hospital stay. Given that these metrics have been designed to accurately compare hospitals,
they have already been risk-adjusted by CMS for individual patient characteristics based on
3A hospital system is defined as two or more hospitals owned, sponsored or contract managed by thesame central organization. Though the hospitals operate as separate entities, they are controlled by a sharedorganization.

CHAPTER 2. DATA AND METHODOLOGY 10
claims data from 12 months prior to the date of hospital admission. The reported mortality
measures are calculated by CMS as the ratio of the number of “actual adjusted” deaths to
the number of “expected” deaths at a given hospital, multiplied by the national observed
mortality rate. The measure thus compares a hospital’s performance given its case mix4 to
the average hospital’s performance with the same case mix. A lower ratio indicates lower-
than-expected mortality or better quality. An analogous approach is used for the readmission
rates (Yale New Haven Health Services Corporation/Center for Outcomes Research and
Evaluation, 2013). In this thesis, I analyze the 30-day mortality and readmission rates for
acute myocardial infarction (AMI)5, heart failure (HF) and pneumonia (PN).
Figure 2.2 provides simple scatter plots of AMI 30-Day Mortality vs. HHIH calculated by
HSA in 2016. Each individual point represents the reported AMI 30-Day Mortality Rate for
a hospital. The plot in panel (a) includes all hospitals, while the plot in panel (b) excludes
hospitals in an HSA with an HHIH of 10,000 (i.e., they are the only studied hospital operating
in the HSA).
We can see that the raw data shows no appreciable correlation between higher HHIH
(more concentrated markets) and higher-than-expected mortality for AMI (signaling lower
quality). Figure 2.3 shows similar plots for AMI 30-Day Readmission vs. HHIH calculated
by HSA in 2016. The conclusion is analogous to that of AMI 30-Day Mortality. Plots with
HHIS also reveal no appreciable correlation.
4Case mix refers to the types of patients that a hospital treats. This varies depending on numerous factorsoften out of the hospital’s control.
5AMI is the medical term for a heart attack.

CHAPTER 2. DATA AND METHODOLOGY 11
(a) All Hospitals (b) Excluding HHI by HSA = 10,000
Figure 2.2: AMI 30-Day Mortality Rate vs. HHIH by HSA
(a) All Hospitals (b) Excluding HHIH by HSA = 10,000
Figure 2.3: AMI 30-Day Readmission Rate vs. HHIH by HSA
Given the nature of this data, it only captures the information that is properly recorded
and given to CMS. There are reporting gaps for particular hospitals and measures. Reporting
varies slightly for each metric, but measures exist for 70-80% of hospitals studied in the thesis.
Hospitals with missing measures are omitted from the respective regressions. Furthermore,
metrics at different hospitals are not entirely standardized —some have different collection
time horizons within the same year. Given that the metrics are all rates computed over time,
this does not serve as a significant issue for the analysis. Another potential shortcoming is

CHAPTER 2. DATA AND METHODOLOGY 12
the sample population of patients —Medicare beneficiaries. It is improbable, however, that
hospitals set different levels of quality for Medicare beneficiaries versus the rest of the patient
population, so the conclusions drawn from this sample can likely speak to overall quality of
care. Even if we are to limit the generalizability of the results to the Medicare population,
it is still significant given the number of patients and public expenditure in Medicare.
Finally, wage data for health care workers was obtained from the Bureau of Labor Statis-
tics (BLS), in particular the Occupational Employment Statistics (OES). This data provides
nationwide wage and employment information for occupation groups defined by the Standard
Occupational Classification System (SOC).6 It is derived from the surveys of approximately
1.2 million establishments taken in May of 2014, 2015 and 2016. The survey covers all full-
time and part-time wage and salary workers in nonfarm industries, is updated annually, and
is reported by metropolitan and non-metropolitan statistical areas (MSA) defined by the
OES. Wages are reported by North American Industry Classification System (NAICS) codes
within each MSA. SOC defines 23 major occupation groups, each containing more granular
minor occupation groups. I focus on the major occupation group of “Healthcare Practi-
tioners and Technical Occupations” (corresponding to NAICS code 29-0000). This group
includes all health diagnosing and treating practitioners, technologists and technicians. To
see differential effects within the major group, I look at the minor occupation groups for
registered nurses (29-1141) and a set of physicians and surgeons (29-1069).7
Figure 2.4 shows simple scatter plots of the average annual wage of all health care prac-
titioners and technical occupations (29-0000) vs. HHIH calculated by HSA. Each individual
point represents the prevailing average annual wage in the MSA that a hospital is located
in. The plot in panel (b), once again, has excluded HSAs with HHIH = 10, 000.
6SOC was recently updated in 2018. This thesis uses the previous version, 2010 SOC, as all data used isreported using this system.
7This category groups several types of doctors, but most importantly includes hospitalists, whose wagesare most directly tied to hospital policy. It also includes allergists, immunologists, dermatologists, neurolo-gists, pathologists, radiologists, urologists and physicians of sports, physical and nuclear medicine. Unmen-tioned doctors are included in other minor occupation groups.

CHAPTER 2. DATA AND METHODOLOGY 13
(a) All Hospitals (b) Excluding HHIH by HSA = 10,000
Figure 2.4: Average Annual Wage of Health Care Practioners and Technical Occupations(29-0000) vs. HHIH calculated by HSA
We can see that the raw data shows no appreciable correlation between higher HHIH
(more concentrated markets) and the average wage of health care workers. Analogous results
were found for HHIS.
These data come with some limitations. One shortcoming is the lack of a strong cross-
walk between hospitals and their MSA. Due to this, six states —Connecticut, Maine, Mas-
sachusetts, New Hampshire, Rhode Island and Vermont —are excluded from the wage anal-
ysis.8 The OES only provides a crosswalk between MSA code and Federal Information Pro-
cessing Standard Publication 6-4 (FIPS 6-4) codes plus a unique OES tract code. The FIPS
code is broken down into three components —state, county and township. The OES cross-
walk and definition of MSA codes in the aforementioned six states are specified and unique
at the township level. The MSA information from the AHA Hospital Survey, however, only
has the state and county component. Therefore, I cannot accurately match hospitals in these
six states to their MSA. Since there is no one-to-one correspondence between ZIP code and
FIPS code, i.e. one FIPS code can extend beyond one ZIP code and vice versa, this also
cannot be used to connect hospitals to MSAs in these states. This leads to the exclusion
8These states are included in the quality analysis.

CHAPTER 2. DATA AND METHODOLOGY 14
of 252 hospitals from the analysis. Given this relatively small loss of hospitals and the im-
probability that market dynamics in these six states vary significantly from the rest of the
nation, I do not believe this appreciably affects the conclusions of my work.
Another limitation is that the OES statistics have reporting gaps for wages greater than
$100.00 per hour or $208, 000 per year. Once wage reaches this threshold in certain MSAs,
data is redacted for privacy purposes. Some health care practitioners can earn more than
these thresholds and are therefore not appropriately reflected in parts of the data set. When
averaged out across the entire occupation groups, however, wages and data values are gen-
erally below this threshold and therefore reported, making the data still useful for analysis.
Less than 2% of wage statistics for the major occupation group (29-0000) and mean annual
wages for registered nurses (29-1141) are redacted. Less than 5% of physician (29-1069)
mean annual wages are redacted. Lastly, there is not a complete correspondence between
the hospitals in the study and MSAs. There are hospitals that are not in one of the MSAs
reported by the OES; there are MSAs with no relevant hospitals in them. With these facts
and the exclusion of hospitals in the aforementioned six states, the wage analysis studies the
labor markets of 3,328 hospitals.
Summary statistics for all studied variables are provided in Table 2.1.

CHAPTER 2. DATA AND METHODOLOGY 15
Table 2.1: Summary Statistics of Studied Variables
(1) (2) (3) (4)
VARIABLES Mean Std. Dev. Min Max
AMI 30-Day Mortality 14.36 1.33 9.40 20.60
AMI 30-Day Readmission 17.27 1.13 13.10 21.70
HF 30-Day Mortality 11.94 1.48 6.00 18.50
HF 30-Day Readmission 22.25 1.62 15.80 31.70
PN 30-Day Mortality 13.31 2.86 6.40 26.80
PN 30-Day Readmission 17.15 1.30 12.90 24.70
29-0000 Average Annual Wage 74,243 10,974 29,070 113,510
29-0000 10th %ile Annual Wage 31,726 4,753 16,520 50,080
29-0000 90th %ile Annual Wage 127,277 20,812 38,560 197,760
29-1069 Average Annual Wage 214,747 36,656 77,410 287,860
29-1141 Average Annual Wage 69,196 14,188 27,930 136,610
HHIH 5,121 2,071 225.00 10,000
HHIS 9,009 1,997 564.80 10,000
Notes: Mortality and readmission rates are reported and calculated by CMS as the number of “actual
adjusted” deaths to the number of “expected” deaths at a given hospital, multiplied by the national observed
mortality rate. Wage statistics are from the BLS and reported by SOC-defined occupation groups. 29-0000
refers to the major occupation group of “Healthcare Practitioners and Technical Occupations”. 29-1141
and 29-1069 are the minor occupation groups of registered nurses and a set of physicians and surgeons,
respectively. HHIH is the Herfindahl-Hirschman Index calculated with hospital market shares, while HHIS
is calculated with hospital system market shares.
Methodology
The general methodology of the thesis is to use a difference-in-differences regression to es-
timate the casual effect of significant changes in hospital market concentration (HHI) on
CHAPTER 2. DATA AND METHODOLOGY 16
quality metrics and the wages of health care workers. This approach is inspired by previous
literature comparing market concentration and patient-level quality outcomes (Kessler and
McClellan, 2000). Under certain conditions and assumptions, the difference-in-differences
model allows us to estimate a causal effect when lacking a randomized experiment, which is
clearly the case here. We cannot randomly assign hospital markets to consolidate and see the
outcome, so we look retrospectively and assign hospitals to treatment and control groups.
The ‘treatment’ to a hospital is being located in a market that experienced significant con-
solidation in 2015. We then use the difference-in-differences regression to estimate the causal
effect of this treatment on various quality and wage metrics, comparing the outcomes of the
control group (i.e. those without significant consolidation events) to the treatment. This
analysis removes biases that result from permanent differences between the groups, as well as
other biases due to trends over time in both groups. It does not account for trends affecting
quality or wage that differ between the groups, so I account for these with a parallel trends
analysis.
When dealing with the HHI to measure concentration, issues of endogeneity are partic-
ularly concerning. Any measure of market structure is generally regarded as endogenous
in the literature (Gaynor et al. 2014). Unmeasured variation in cost and demand factors
can theoretically affect market structure, quality and wages. For example, a firm with very
low costs is likely to choose higher effort, offer higher quality, pay higher wages and gain a
high market share (increasing its market’s HHI). The difference-in-differences strategy helps
to mitigate this endogeneity concern. We group hospitals by change in HHI rather than
HHI itself, and compare all hospitals that experienced a change in a market concentration
to those that did not. The nature of this defined treatment allows it to capture a diverse
set of hospitals and markets whose characteristics average and balance in the control and
treatment groups. This mitigates some of the endogeneity concerns discussed and lessens
the need for significant additional controls.
A hospital is included in the treatment group if it is located in a market that “significantly

CHAPTER 2. DATA AND METHODOLOGY 17
consolidates”. For robustness, I use multiple definitions of “significant consolidation”. First,
I consider two definitions of consolidation, i.e. an increase in market concentration. As
previously mentioned, we can conceptualize concentration in two different fashions —at the
hospital (HHIH) and system (HHIS) levels. When calculating HHIH , each summed term
represents a hospital’s bed share in the market. This implicitly treats each hospital as an
autonomous firm that competes with the other hospitals in their HSA. Hospitals that are
in the same system, however, are not completely autonomous. Their shared ownership can
allow us to view them as one competitive entity since decisions made at the system level
would lead all member hospitals to act in unison.
To take this into account, I also consider HHIS. Each individual term in the HHIS cal-
culation represents a system’s bed share in the market. Hospitals that are not members of a
larger system are treated as a one-hospital system. It is important to note that some systems
extend beyond a single HSA. Since the calculation is done at the HSA level, determination of
the HHI is dependent only on the system’s bed share in each HSA. If system A has hospitals
in HSAs 1 and 2, its term in the HHI calculation for HSA 1 includes only its beds located
in that HSA, not those in HSA 2. This is a necessary condition, as we aim to assess the
concentration in each HSA independent of one another. This is also sound intuitively —a
system’s competitive power in a market should only be determined by its hospitals actually
located in that market.
These two conceptualizations of concentration allow us to better consider the impact
of system formation. Work with hospital-level HHIH focuses on cases when consolidation
occurs thanks to changes in individual hospital composition, e.g. a hospital’s addition of a
new wing or the closing of a hospital. The system-level HHIS captures this as well as changes
in system composition, such as a system purchasing a competitor in the same market, and
therefore captures consolidation thanks to system formation or growth. Combining both
approaches is valuable given that decisions influencing quality and wages are made at both
the system and hospital levels. Individual hospitals in the same system have some level of

CHAPTER 2. DATA AND METHODOLOGY 18
autonomy, yet are also beholden to a governing owner. Using both strategies and considering
their results together gives a more complete view of market dynamics.
Next, I use two definitions of “significant consolidation”. I first use the aforementioned
DoJ and FTC threshold of an increase in HHI of 200 to mark a significant change in market
concentration. I define the treatment group as hospitals where,
HHIi,2015 −HHIi,2014 > 200 (2.2)
where HHIi,2014 is the prevailing market HHI experienced by hospital i in 2014 and so on.
This treatment group is therefore defined as the hospitals located in markets that had an
increase in HHI greater than the static threshold of 200 in 2015.
Since an HHI change of 200 could affect a highly concentrated market differently than
a less concentrated one, I also use a quartile-based definition of “significant consolidation”.
For example, if HSA 1 moved from quartile 1 of HHI in 2014 to quartile 2 in 2015, they are
in the treatment group. All positive quartile changes are treated equally. HSAs with no or
negative quartile change are in the control. When calculating quartiles, I exclude all HSAs
with an HHI of 10,000 in 2014.9 This treatment group is therefore comprised of all hospitals
located in markets that moved to a higher quartile of the HHI distribution in 2015.
In summary, I explore four definitions of the treatment group. They consist of the
hospitals located in markets that experienced a 2015 change in:
1. Hospital-based HHIH greater than 200
2. System-based HHIS greater than 200
3. Hospital-based HHIH large enough to move to a higher quartile
4. System-based HHIS large enough to move to a higher quartile.
9This resulted in 805 HSAs divided into quartiles when using HHIH and 692 HSAs for HHIS . As it ismore likely for only one system to operate in an HSA than only one hospital, we expect to exclude moreHSAs when using HHIS .

CHAPTER 2. DATA AND METHODOLOGY 19
Using HHIH as our measure of concentration and the static threshold to determine sig-
nificance, we identify 661 HSAs and the 2,361 hospitals within them as members of the
treatment group. The remaining hospitals are in the control group. For illustration, the av-
erage HHI of each group and the average change of HHI from 2014 to 2015 is given in Table
2.3. In it, we see that the control group is generally more concentrated than the treatment
group, and that the average size of consolidation in the treatment group is considerable.
This fits with the narrative surrounding hospital concentration, given that we would expect
large market consolidation events to occur in less concentrated markets.
Group Average HHI Average Change in HHI
Control 8813.842 -22.36683
Treatment 6471.175 1244.769
Table 2.2: Average Value and Change of HHI in Control and Treatment Groups, Defined byHospital-based HHIH and Static Threshold
The system-based, static threshold treatment group consists of 82 HSAs containing 502
hospitals. The remaining HSAs and their hospitals are in the control group. We expect
intuitively for this treatment group to be smaller than the previous treatment group, for the
number of HSAs with high HHI increases as the effective number of ‘firms’ decreases.
The hospital-based, quartile change treatment group consists of 265 hospitals located in
36 HSAs. The system-based, quartile change treatment group consists of 519 hospitals in 24
HSAs. We can see that the system-based group consists of HSAs with more firms than those
of the hospital-based group. This approach is meant to supplement and verify the results
from the static threshold.
With these treatment and control groups, I perform the difference-in-differences regres-
sion. To use the difference-in-differences model for causal estimation, we must see if a set
of assumptions are upheld. First, we must confirm that the application of the treatment
is unrelated to the outcomes studied. While the prevailing quality and wages of hospitals

CHAPTER 2. DATA AND METHODOLOGY 20
in a market are not entirely exogenous to the consolidation events that may occur, it is
unlikely that the studied metrics significantly dictate whether or not a merger occurs. Due
to the bevy of other more relevant factors that go into such a decision, it is fair to assume
that the studied quality and wage metrics are independent of treatment assignment. Next,
we must confirm that factors besides consolidation that affect quality and wages are not
changing differently over time between the treatment and control groups. To help do this,
we verify that parallel trends exist between the control and treatment groups prior to as-
signment of the treatment. We must confirm that before the year 2015, the year that the
treatment is assigned, the treatment and control groups have parallel trends in the metrics
in question. This is foundational to the difference-in-differences model, for if they do not,
we cannot be certain that any difference-in-difference found is due to the treatment rather
than other factors changing differently in the treatment and control groups. If we find that
there are parallel trends until 2015 and divergent trends after, we are more confident that
the divergence is caused by the treatment.
Historical data was obtained and tested to confirm the parallel trends condition. Graphs
for mean AMI 30-day mortality, 30-day readmission and annual wages are presented below
in Figures 2.5-2.7, respectively. From these figures, we see that the control and treatment
groups when using HHIH and static threshold treatment experienced roughly parallel trends
in the studied metrics prior to application of the treatment. The same process was completed
for all defined treatment and control groups with all included metrics. With this condition
graphically satisfied, we are prepared to move forward with the regression strategy. More
empirical methods could not be used to confirm parallel trends due to a lack of historical
HHI data.

CHAPTER 2. DATA AND METHODOLOGY 21
Figure 2.5: Average AMI 30-Day Mortality from 2009 to 2016 in Treatment and ControlGroups, Hospital-based HHIH with Static Threshold Treatment
Figure 2.6: Average AMI 30-Day Readmissions from 2009 to 2016 in Treatment and ControlGroups, Hospital-based HHIH with Static Threshold Treatment

CHAPTER 2. DATA AND METHODOLOGY 22
Figure 2.7: Average Annual Wage of Health Care Practitioners and Technical Occupations(29-0000) from 2011 to 2016 in Treatment and Control Groups, Hospital-based HHIH withStatic Threshold Treatment
To perform the regression using the first set of treatment and control groups, we define
the following variables:
Treatmenti = I(HHIHi,2015 −HHIHi,2014 > 200) (2.3)
Posti = I(Y ear = 2016) (2.4)
where I(·) is an indicator variable. The regression equation is then given as,
yit = β0 + β1Treatmenti + β2Postt + β3Treatmenti · Postt + τt + γlt + εit (2.5)
where yit is the variable of interest at hospital i in year t. For the quality analysis, this is
the value of the outcome measure at hospital i. For the wage analysis, this is value of the
income measure in hospital i’s MSA. τt gives a time fixed effect. The “location” l for the
fixed effect γlt coefficient differs for the quality and wage analyses; I use the HSA for quality
and the MSA for wage. HSA is appropriate for quality as hospitals compete on quality in

CHAPTER 2. DATA AND METHODOLOGY 23
their market. MSA is more appropriate than HSA for wage as the data report wage by MSA,
and there can be multiple HSAs within an MSA. For both the quality and wage analyses,
the same regression strategy is used for all definitions of treatment with their corresponding
indicator variables.10
10For the system-based, static threshold treatment, we have I(HHISi,2015 − HHISi,2014 > 200). For thequartile change treatments, we have I(Qi,2015−Qi,2014 > 0), where Q gives the quartile of hospital i’s marketHHI.

Chapter 3
Results
I begin by stating the results found on regressing the quality metrics, which include 30-day
mortality and readmission rates for acute myocardial infarction, heart failure and pneumonia.
I then move on to discuss the wage metrics, which include the mean, 10th percentile and 90th
percentile wages for all health care practitioners and technical professionals as well as the
average wage for registered nurses and select physician types. I also discuss the relationships
between the results of the different regression strategies. Note that variable “DID” is the
difference-in-differences estimate and corresponds to β̂3 from Eq. 2.5. This is the coefficient
of interest in all regressions.
Across all regression strategies on all quality metrics, the DID coefficient is not statisti-
cally significant at a 90% confidence level. This supports the conclusion that hospital market
consolidation has no discernable causal effect on the chosen quality metrics. Table 3.1 shows
the regression results for all six quality measures where the treatment group includes hospi-
tals that experienced an increase of hospital-based HHIH greater than 200 in 2015. Table 3.2
shows the same results using the system-based HHIS. For both measures of concentration,
the quartile change treatment also supports no causal effect of consolidation on quality; the
regression tables are in the Appendix.
24

CHAPTER 3. RESULTS 25
Table 3.1: Quality Metrics Regression Results, Hospital-based HHIH with Static Threshold Treat-ment
(1) (2) (3) (4) (5) (6)
VARIABLES AMI Mort. AMI Readm. HF Mort. HF Readm. PN Mort. PN Readm.
Treatment -2.206*** 1.419*** 1.585*** 0.190 -0.240 -0.529
(0.827) (0.299) (0.479) (0.345) (0.744) (0.349)
Post (2016) -0.760*** -0.955*** 0.151*** -0.749*** 4.360*** -0.216***
(0.0312) (0.0245) (0.0244) (0.0268) (0.0316) (0.0224)
DID -0.0106 0.0441 0.0440 0.0314 0.220 -0.114
(0.127) (0.0919) (0.124) (0.157) (0.175) (0.124)
Constant 15.91*** 17.20*** 12.11*** 22.11*** 13.01*** 18.33***
(0.122) (0.198) (0.431) (0.309) (0.241) (0.279)
Observations 7,182 6,548 10,786 10,990 12,023 12,057
R-squared 0.584 0.641 0.688 0.671 0.848 0.626
Time FEs Yes Yes Yes Yes Yes Yes
HSA FEs Yes Yes Yes Yes Yes Yes
Robust standard errors in parentheses
*** p<0.01, ** p<0.05, * p<0.1
Notes: Table gives difference-in-differences regression results for all quality metrics tested with time and location
(HSA) fixed effects. Because there are only three years in this analysis (2014, 2015, 2016) and Post = 2016, the
time FEs only include 2015, with the omitted year being 2014. Coefficient of interest is DID. Hospital-based HHIH
is calculated with hospital market shares. Treatment group includes hospitals located in HSAs with change in
HHIH greater than 200 between 2014 and 2015.

CHAPTER 3. RESULTS 26
Table 3.2: Quality Metrics Regression Results, System-based HHIS with Static Threshold Treat-ment
(1) (2) (3) (4) (5) (6)
VARIABLES AMI Mort. AMI Readm. HF Mort. HF Readm. PN Mort. PN Readm.
Treatment -2.195*** 1.427*** 1.628*** 0.160 -0.160 -0.563
(0.838) (0.199) (0.483) (0.347) (0.688) (0.365)
Post (2016) -0.757*** -0.955*** 0.158*** -0.757*** 4.368*** -0.219***
(0.0314) (0.0249) (0.0243) (0.0267) (0.0316) (0.0224)
DID -0.0210 0.0191 -0.0846 0.120 -0.0195 -0.0101
(0.103) (0.0722) (0.101) (0.117) (0.139) (0.0953)
Constant 15.91*** 17.20*** 12.10*** 22.12*** 13.01*** 18.33***
(0.123) (0.198) (0.430) (0.309) (0.239) (0.279)
Observations 7,182 6,548 10,786 10,990 12,023 12,057
R-squared 0.585 0.641 0.688 0.671 0.848 0.626
Time FEs Yes Yes Yes Yes Yes Yes
HSA FEs Yes Yes Yes Yes Yes Yes
Robust standard errors in parentheses
*** p<0.01, ** p<0.05, * p<0.1
Notes: Table gives difference-in-differences regression results for all quality metrics tested with time and location
(HSA) fixed effects. Because there are only three years in this analysis (2014, 2015, 2016) and Post = 2016, the
time FEs only include 2015, with the omitted year being 2014. Coefficient of interest is DID. System-based HHIS
is calculated with hospital system market shares. Treatment group includes hospitals located in HSAs with change
in HHIS greater than 200 between 2014 and 2015.
Regression on wage metrics yields statistically significant results, supporting that hospital
market consolidation does have a causal effect on the wages of health care professionals. The

CHAPTER 3. RESULTS 27
direction and magnitude of this causal effect is dependent on the definition of the HHI.
Hospital-based HHIH
Table 3.3 shows the regression results for annual wage statistics using HHIH and the
static threshold treatment. “Group” refers to the major occupation group of all health care
practitioners and technical occupations (29-0000), while “Nurse” and “Physician” refer to the
aforementioned minor groups 29-1069 and 29-1141, respectively. The mean, 10th percentile
and 90th percentile of annual wages for all practitioners increased by less in the treatment
group than the control. This means that a significant consolidation event in an HSA led to
slower wage growth for health care practitioners, on average. For physicians included in 29-
1069, mean wage increased by $4,529 less in the treatment group. Registered nurses, on the
other hand, had higher average wages in the treatment group than the control. The results
using HHIH and the quartile change treatment agree in direction and rough magnitude with
the results for 29-0000, but show no causal effect on nurse wages and a wage increase for
physicians in 29-1069. The quartile change regression results can be found in the Appendix.

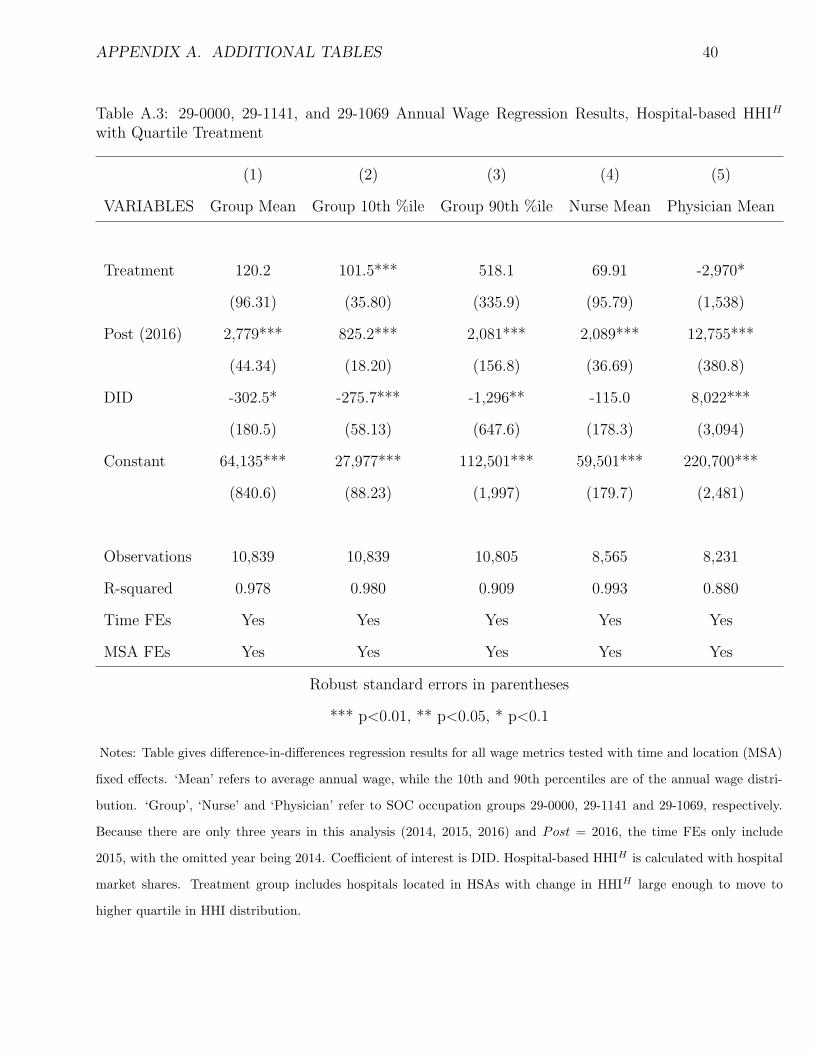
CHAPTER 3. RESULTS 28
Table 3.3: 29-0000, 29-1141, and 29-1069 Annual Wage Regression Results, Hospital-based HHIH withStatic Threshold Treatment
(1) (2) (3) (4) (5)
VARIABLES Group Mean Group 10th %ile Group 90th %ile Nurse Mean Physician Mean
Treatment 120.2 101.5*** 518.1 -96.40 1,682***
(96.31) (35.80) (335.9) (83.18) (604.5)
Post (2016) 2,779*** 825.2*** 3,380*** 2,089*** 13,860***
(44.34) (18.20) (156.8) (34.11) (352.7)
DID -302.5* -275.7*** -1,296** 304.1** -4,529***
(180.5) (58.13) (647.6) (133.4) (812.9)
Constant 64,135*** 27,977*** 112,501*** 59,485*** 220,398***
(840.6) (88.23) (1,997) (158.7) (2,102)
Observations 10,839 10,839 10,805 10,874 10,501
R-squared 0.978 0.980 0.909 0.992 0.879
Time FEs Yes Yes Yes Yes Yes
MSA FEs Yes Yes Yes Yes Yes
Robust standard errors in parentheses
*** p<0.01, ** p<0.05, * p<0.1
Notes: Table gives difference-in-differences regression results for all wage metrics tested with time and location (MSA)
fixed effects. ‘Mean’ refers to average annual wage, while the 10th and 90th percentiles are of the annual wage distri-
bution. ‘Group’, ‘Nurse’ and ‘Physician’ refer to SOC occupation groups 29-0000, 29-1141 and 29-1069, respectively.
Because there are only three years in this analysis (2014, 2015, 2016) and Post = 2016, the time FEs only include
2015, with the omitted year being 2014. Coefficient of interest is DID. Hospital-based HHIH is calculated with hospital
market shares. Treatment group includes hospitals located in HSAs with change in HHIH greater than 200 between
2014 and 2015.

CHAPTER 3. RESULTS 29
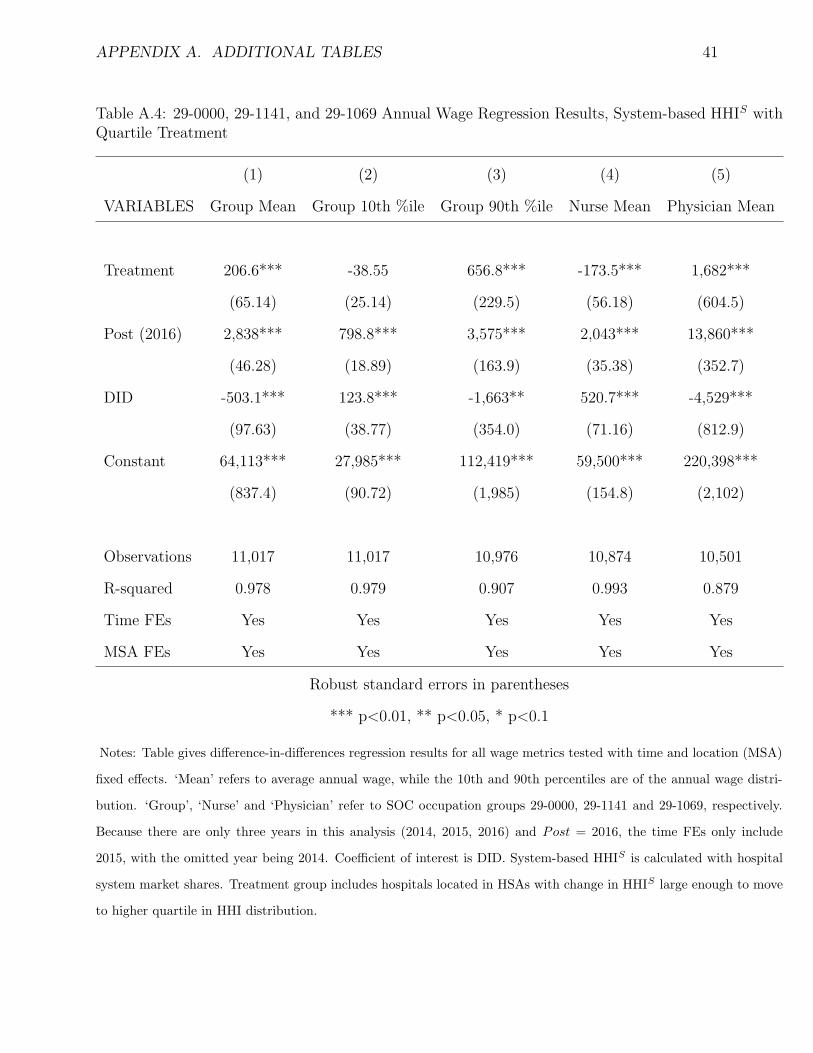
Table 3.4 shows the regression results for annual wage statistics using HHIS and the static
threshold treatment. I find that a significant system consolidation event in an HSA led to
slower average and 90th percentile wage growth for health care practitioners. 10th percentile
wage growth was higher in the treatment than the control, in contrast to the results using
HHIH . The results for physicians in 29-1069 and registered nurses mirror those of HHIH .
The quartile change treatment agreed in direction and rough magnitude with findings of the
static threshold; the regression table can be found in the Appendix.

CHAPTER 3. RESULTS 30
Table 3.4: 29-0000, 29-1141, and 29-1069 Annual Wage Regression Results, System-based HHIS withStatic Threshold Treatment
(1) (2) (3) (4) (5)
VARIABLES Group Mean Group 10th %ile Group 90th %ile Nurse Mean Physician Mean
Treatment 206.6*** -38.55 656.8*** -173.5*** 1,682***
(65.14) (25.14) (229.5) (56.18) (604.5)
Post (2016) 2,838*** 798.8*** 3,575*** 2,043*** 13,860***
(46.28) (18.89) (163.9) (35.38) (352.7)
DID -503.1*** 123.8*** -1,663** 520.7*** -4,529***
(97.63) (38.77) (354.0) (71.16) (812.9)
Constant 64,113*** 27,985*** 112,419*** 59,500*** 220,398***
(837.4) (90.72) (1,985) (154.8) (2,102)
Observations 11,017 11,017 10,976 10,874 10,501
R-squared 0.978 0.979 0.907 0.993 0.879
Time FEs Yes Yes Yes Yes Yes
MSA FEs Yes Yes Yes Yes Yes
Robust standard errors in parentheses
*** p<0.01, ** p<0.05, * p<0.1
Notes: Table gives difference-in-differences regression results for all wage metrics tested with time and location (MSA)
fixed effects. ‘Mean’ refers to average annual wage, while the 10th and 90th percentiles are of the annual wage distri-
bution. ‘Group’, ‘Nurse’ and ‘Physician’ refer to SOC occupation groups 29-0000, 29-1141 and 29-1069, respectively.
Because there are only three years in this analysis (2014, 2015, 2016) and Post = 2016, the time FEs only include 2015,
with the omitted year being 2014. Coefficient of interest is DID. System-based HHIS is calculated with hospital system
market shares. Treatment group includes hospitals located in HSAs with change in HHIS greater than 200 between
2014 and 2015.

Chapter 4
Discussion
Mirroring the presentation of the results, I begin with the quality analysis and move to wage.
The results of the quality regressions support that there is no causal link between hospital
market consolidation and the quality of health care. This suggests that the expansion of an
individual hospital or hospital system in a market causes no statistically significant change
in the quality of health care provided in that market.
This finding challenges proponents of hospital consolidation who argue that scale, whether
at the hospital or system level, allows providers to provide higher quality care. In FTC
antitrust cases against hospital mergers, defendants “almost always” claim that the merger
would improve quality at one (or both) of the involved hospitals (Perry & Cunningham,
2013). My work calls into question the claims that proposed mergers will lead to better
health outcomes. If we consider these findings with the existing literature on consolidation
and price, they suggest that hospital consolidation may lead to patients paying more for the
same quality of care. My work supports the theory that higher prices post-consolidation
arise from increased market power rather than the delivery of a superior product, for I find
no increase in post-consolidation quality.
However, due to limitations of my data and model, there are important caveats. While
the outcome measures I study are incredibly relevant to patients, there are other process and
31

CHAPTER 4. DISCUSSION 32
structural measures that describe important aspects of the quality of health care. Future
work should focus on expanding analysis to more measures of quality of care. A more robust
and consistent data set of a larger patient population would also increase the generalizability
of future findings. My model could also be improved; my difference-in-differences approach
likely did not account for all possible confounding variables. Finally, improvements in quality
may not occur in the year after consolidation events; it may take several years for synergies
to actualize and increase quality.
The results show differential effects of hospital consolidation on annual wages depending
on the type of profession within health care. I find that the mean annual wage for all health
care practitioners and technical occupations increases by less in markets with significant
consolidation. This is consistent across all regressions. The magnitude of this effect is not
staggering but still significant; consolidation caused mean annual wages to be on average
0.5-1%1 lower in treatment areas. We see an analogous effect and magnitude for the 90th
percentile of annual wages in the major occupation group. This suggests that for a majority
of health care professionals, hospital consolidation can lead to relatively lower wages.
At the 10th percentile of major group annual wages, however, the effect of consolidation
depends on the type of concentration metric used. Using HHIH , I find that 10th percentile
wages increase by less, consistent with other results. Using HHIS, I find that the 10th
percentile of wages increase by more in the treatment than the control. To understand these
seemingly contradicting findings, consider the types of consolidation that each version of HHI
represents. The 10th percentile of wages in the major occupation group generally reflects
technicians and other relatively low skilled workers, such as medical records specialists. When
a system expands, captured by HHIS, we can imagine that due to organizational synergies,
lower skill jobs are consolidated across the system. This reduction in labor force could lead to
relatively higher wages for these workers in areas that experienced system-level consolidation.
However, for those that experienced hospital-level consolidation, the 10th percentile wages
1This depended on the measure of HHI and treatment definition used.

CHAPTER 4. DISCUSSION 33
follow the same trend as the mean and 90th percentile.
Mean physician2 annual wages were on average approximately 2% lower in treatment
areas for three of the four definitions of treatment. For HHIH and the quartile change
treatment, I find a statistically significant increase in wages. As all other strategies show
the same direction and magnitude of effect, I conclude that consolidation causes physician
wages to be relatively lower, but this could be an area for future analysis.
Finally, for registered nurses (RN), I find that wages increase by more in areas that con-
solidated. This divergence from the major occupation group could be explained by the high
union membership of RNs, which is nearly triple that of other private industries (Higgins,
2016). Unions may be using consolidation events as negotiation points for higher wages,
countering the trend seen across other members of the occupation group. Moreover, nurses
are typically salaried employees of hospitals while most physicians are contracted. This could
also explain the divergence in effect. Lastly, a study of insurer consolidation found that in-
creased insurer market power led to the substitution of nurses for physicians and higher
relative nurse wages (Dafny et al., 2012). A similar mechanism could be at play here.
These findings in sum suggest that hospital consolidation does, in fact, lead to relatively
lower wages for most health care professionals. As the trend of hospital consolidation con-
tinues, this is important to keep in mind for regulators, system administrators and health
care employees alike. The results also suggest that the increase in prices observed post-
consolidation is likely not due to higher provider wages, again pointing to increased market
power as the true driver. The analysis does come with its limitations. As discussed in the
Data & Methodology section, six states had to be omitted from the analysis due to issues in
the data. Furthermore, the MSAs reported by the OES do not capture all of the hospitals
in the country. Future work could be done to find a more complete set of wages. Addition-
ally, only two minor occupation groups of the major occupation group were studied, and no
2By ‘physician’, I am referring to the physicians in NAICS group 29-1141, which is the select group ofphysicians already explained in this thesis. For simplicity, I refer to them here as simply ‘physicians.’

CHAPTER 4. DISCUSSION 34
members of the other major health care occupation group “Healthcare Support Operations
(31-0000)” were studied. Further analysis could explore these occupations. Moreover, the
wage metrics I use are taken at a relatively high level: the MSA. Hospital-level salary data
would have a stronger link to consolidation. Finally, the analysis could use a longer time
period to capture possible time delays in wage effects. I do believe, however, the data and
methods I use still yield significant and actionable results.

Chapter 5
Conclusions
With a growing literature suggesting that hospital consolidation leads to higher prices for
health care, it is imperative to study consolidation’s effect on other variables. My thesis
finds that hospital consolidation causes no significant change in quality of care and is largely
negative for the wages of health care professionals. Quality of care in hospitals, measured
by the mortality and readmission rates for acute myocardial infarction, heart failure and
pneunomia, did not increase after a significant consolidation event in a market. This counters
claims by proponents of consolidation, who claim that larger hospitals and hospital systems
lead to higher quality care. The wages of most studied professionals increased by less in
areas that had significant consolidation, with the exception of registered nurses, who may
have the benefit of strong unionization. The 10th percentile of health care practitioner wages
increased in areas with significant system expansion, likely due to the consolidation of lower
skill jobs across the system leading to higher wages for retained employees.
Much of the previous work on hospital consolidation has focused on its impact on the price
of health care; it has found that consolidation generally increases prices. My thesis coupled
with existing literature shows that hospital consolidation may hurt patients by causing them
to pay more for the same quality of care. Many employees providing this care may similarly
be hurt through lower wage growth. My findings also suggest that the observed increases
35

CHAPTER 5. CONCLUSIONS 36
in prices post-consolidation are likely not due to higher provider wages nor higher quality,
supporting increased market power as the true driver. As the trend of hospital consolidation
shows no signs of slowing down on its own, the Federal Trade Commission must be more
critical of proposed mergers and ensure that they truly benefit society. Are hospital systems
growing to help patients or themselves? I believe it is unfortunately the latter.

Appendix A
Additional Tables
This Appendix includes regression results for all quality and wage metrics using the quartile
change definition of treatment. They serve to supplement the results from the static threshold
definition of treatment.
37

APPENDIX A. ADDITIONAL TABLES 38
Table A.1: Quality Metrics Regression Results, Hospital-based HHIH with Quartile Treatment
(1) (2) (3) (4) (5) (6)
VARIABLES AMI Mort. AMI Readm. HF Mort. HF Readm. PN Mort. PN Readm.
Treatment 0.611 -1.446*** 0.288 0.160 -0.160 -0.757***
(0.847) (0.213) (0.463) (0.347) (0.688) (0.286)
Post (2016) -0.732*** -0.959*** 0.0957*** -0.757*** 4.368*** -0.201***
(0.0420) (0.0318) (0.0380) (0.0267) (0.0316) (0.0373)
DID -0.0342 0.138 -0.0631 0.120 0.220 -0.0297
(0.208) (0.141) (0.161) (0.117) (0.139) (0.180)
Constant 13.69*** 18.64*** 13.72*** 22.74*** 13.01*** 17.77***
(0.783) (0.0249) (0.207) (0.309) (0.239) (0.231)
Observations 4,534 4,363 5,308 10,990 12,023 5,625
R-squared 0.465 0.562 0.578 0.671 0.848 0.485
Time FEs Yes Yes Yes Yes Yes Yes
HSA FEs Yes Yes Yes Yes Yes Yes
Robust standard errors in parentheses
*** p<0.01, ** p<0.05, * p<0.1
Notes: Table gives difference-in-differences regression results for all quality metrics tested with time and location
(HSA) fixed effects. Because there are only three years in this analysis (2014, 2015, 2016) and Post = 2016, the
time FEs only include 2015, with the omitted year being 2014. Coefficient of interest is DID. Hospital-based HHIH
is calculated with hospital market shares. Treatment group includes hospitals located in HSAs with change in
HHIH large enough to move to higher quartile in HHI distribution.

APPENDIX A. ADDITIONAL TABLES 39
Table A.2: Quality Metrics Regression Results, System-based HHIS with Quartile Treatment
(1) (2) (3) (4) (5) (6)
VARIABLES AMI Mort. AMI Readm. HF Mort. HF Readm. PN Mort. PN Readm.
Treatment -2.195*** 1.427*** -0.160 0.160 -0.160 -0.563
(0.838) (0.199) (0.688) (0.347) (0.688) (0.365)
Post (2016) -0.757*** -0.955*** 4.368*** -0.757*** 4.368*** -0.219***
(0.0314) (0.0249) (0.0316) (0.0267) (0.0316) (0.0224)
DID -0.0210 0.0191 -0.0195 0.120 -0.0195 -0.0101
(0.103) (0.0722) (0.139) (0.117) (0.139) (0.0953)
Constant 15.91*** 17.20*** 13.01*** 22.12*** 13.01*** 18.33***
(0.123) (0.198) (0.239) (0.309) (0.239) (0.279)
Observations 7,182 6,548 12,023 10,990 12,023 12,057
R-squared 0.585 0.641 0.848 0.671 0.848 0.626
Time FEs Yes Yes Yes Yes Yes Yes
HSA FEs Yes Yes Yes Yes Yes Yes
Robust standard errors in parentheses
*** p<0.01, ** p<0.05, * p<0.1
Notes: Table gives difference-in-differences regression results for all quality metrics tested with time and location
(HSA) fixed effects. Because there are only three years in this analysis (2014, 2015, 2016) and Post = 2016, the
time FEs only include 2015, with the omitted year being 2014. Coefficient of interest is DID. System-based HHIS
is calculated with hospital system market shares. Treatment group includes hospitals located in HSAs with change
in HHIS large enough to move to higher quartile in HHI distribution.
APPENDIX A. ADDITIONAL TABLES 40
Table A.3: 29-0000, 29-1141, and 29-1069 Annual Wage Regression Results, Hospital-based HHIH
with Quartile Treatment
(1) (2) (3) (4) (5)
VARIABLES Group Mean Group 10th %ile Group 90th %ile Nurse Mean Physician Mean
Treatment 120.2 101.5*** 518.1 69.91 -2,970*
(96.31) (35.80) (335.9) (95.79) (1,538)
Post (2016) 2,779*** 825.2*** 2,081*** 2,089*** 12,755***
(44.34) (18.20) (156.8) (36.69) (380.8)
DID -302.5* -275.7*** -1,296** -115.0 8,022***
(180.5) (58.13) (647.6) (178.3) (3,094)
Constant 64,135*** 27,977*** 112,501*** 59,501*** 220,700***
(840.6) (88.23) (1,997) (179.7) (2,481)
Observations 10,839 10,839 10,805 8,565 8,231
R-squared 0.978 0.980 0.909 0.993 0.880
Time FEs Yes Yes Yes Yes Yes
MSA FEs Yes Yes Yes Yes Yes
Robust standard errors in parentheses
*** p<0.01, ** p<0.05, * p<0.1
Notes: Table gives difference-in-differences regression results for all wage metrics tested with time and location (MSA)
fixed effects. ‘Mean’ refers to average annual wage, while the 10th and 90th percentiles are of the annual wage distri-
bution. ‘Group’, ‘Nurse’ and ‘Physician’ refer to SOC occupation groups 29-0000, 29-1141 and 29-1069, respectively.
Because there are only three years in this analysis (2014, 2015, 2016) and Post = 2016, the time FEs only include
2015, with the omitted year being 2014. Coefficient of interest is DID. Hospital-based HHIH is calculated with hospital
market shares. Treatment group includes hospitals located in HSAs with change in HHIH large enough to move to
higher quartile in HHI distribution.
APPENDIX A. ADDITIONAL TABLES 41
Table A.4: 29-0000, 29-1141, and 29-1069 Annual Wage Regression Results, System-based HHIS withQuartile Treatment
(1) (2) (3) (4) (5)
VARIABLES Group Mean Group 10th %ile Group 90th %ile Nurse Mean Physician Mean
Treatment 206.6*** -38.55 656.8*** -173.5*** 1,682***
(65.14) (25.14) (229.5) (56.18) (604.5)
Post (2016) 2,838*** 798.8*** 3,575*** 2,043*** 13,860***
(46.28) (18.89) (163.9) (35.38) (352.7)
DID -503.1*** 123.8*** -1,663** 520.7*** -4,529***
(97.63) (38.77) (354.0) (71.16) (812.9)
Constant 64,113*** 27,985*** 112,419*** 59,500*** 220,398***
(837.4) (90.72) (1,985) (154.8) (2,102)
Observations 11,017 11,017 10,976 10,874 10,501
R-squared 0.978 0.979 0.907 0.993 0.879
Time FEs Yes Yes Yes Yes Yes
MSA FEs Yes Yes Yes Yes Yes
Robust standard errors in parentheses
*** p<0.01, ** p<0.05, * p<0.1
Notes: Table gives difference-in-differences regression results for all wage metrics tested with time and location (MSA)
fixed effects. ‘Mean’ refers to average annual wage, while the 10th and 90th percentiles are of the annual wage distri-
bution. ‘Group’, ‘Nurse’ and ‘Physician’ refer to SOC occupation groups 29-0000, 29-1141 and 29-1069, respectively.
Because there are only three years in this analysis (2014, 2015, 2016) and Post = 2016, the time FEs only include
2015, with the omitted year being 2014. Coefficient of interest is DID. System-based HHIS is calculated with hospital
system market shares. Treatment group includes hospitals located in HSAs with change in HHIS large enough to move
to higher quartile in HHI distribution.

References
[1] Reed Abelson. “When Hospitals Merge to Save Money, Patients Often Pay More”. In:
The New York Times (Nov. 15, 2018). issn: 0362-4331. url: https://www.nytimes.
com/2018/11/14/health/hospital-mergers-health-care-spending.html (visited
on 11/15/2018).
[2] American Hospital Association. Hospital Merger Benefits: Views from Hospital Leaders
and Econometric Analysis — AHA. American Hospital Association. 2018. url: https:
//www.aha.org/guidesreports/2017-01-24-hospital-merger-benefits-views-
hospital-leaders-and-econometric-analysis (visited on 10/08/2018).
[3] American Hospital Association. Trendwatch Chartbook 2018. American Hospital Asso-
ciation, 2018, pp. 20–26. url: https://www.aha.org/system/files/2018-05/2018-
AHA-Chartbook_0.pdf (visited on 03/14/2019).
[4] Kristy Bronner. Research Methods.
[5] Bureau of Labor Statistics. Occupational Employment Statistics Overview. Bureau of
Labor Statistics. Aug. 8, 2018. url: https://www.bls.gov/oes/oes_emp.htm
(visited on 11/05/2018).
[6] Centers for Medicare and Medicaid Services. Outcome Measures. Oct. 13, 2017. url:
https://www.cms.gov/Medicare/Quality-Initiatives-Patient-Assessment-
Instruments/HospitalQualityInits/OutcomeMeasures.html (visited on 03/15/2019).
42

REFERENCES 43
[7] Leemore Dafny, Mark Duggan, and Subramaniam Ramanarayanan. “Paying a Pre-
mium on Your Premium? Consolidation in the US Health Insurance Industry”. In:
American Economic Review 102.2 (Apr. 2012), pp. 1161–1185. issn: 0002-8282. doi:
10.1257/aer.102.2.1161. url: http://pubs.aeaweb.org/doi/10.1257/aer.102.
2.1161 (visited on 03/29/2019).
[8] Leemore Dafny, Mark Duggan, and Subramaniam Ramanarayanan. “Paying a Pre-
mium on Your Premium? Consolidation in the US Health Insurance Industry”. In:
American Economic Review 102.2 (Apr. 2012), pp. 1161–1185. issn: 0002-8282. doi:
10.1257/aer.102.2.1161. url: http://pubs.aeaweb.org/doi/10.1257/aer.102.
2.1161 (visited on 03/29/2019).
[9] Leemore Dafny, Kate Ho, and Robin S. Lee. “The Price Effects of Cross-Market Hos-
pital Mergers”. In: NBER Working Paper Series w22106 (2016). issn: 0898-2937. url:
https://search-proquest-com.ezp-prod1.hul.harvard.edu/econlit/docview/
1792759258/81AFDCBB76584851PQ/16 (visited on 10/08/2018).
[10] Christina DePasquale. “The Effects of Hospital Consolidation on Labor Market Out-
comes”. In: Department of Economics, Emory University (Atlanta), Emory Economics,
2014 (2014). url: https://search-proquest-com.ezp-prod1.hul.harvard.edu/
econlit/docview/1566814418/8B842667FF344B5PQ/3 (visited on 10/08/2018).
[11] Martin Gaynor, Kate Ho, and Robert Town. The Industrial Organization of Health
Care Markets. Working Paper 19800. National Bureau of Economic Research, Jan.
2014. doi: 10.3386/w19800. url: http://www.nber.org/papers/w19800 (visited on
10/08/2018).
[12] Martin Gaynor and Robert J. Town. Competition in Health Care Markets. 12/282.
Department of Economics, University of Bristol, UK, Jan. 2012. url: https://ideas.
repec.org/p/bri/cmpowp/12-282.html (visited on 10/08/2018).

REFERENCES 44
[13] Akbar Ghiasi et al. “The Impact of Hospital Competition on Strategies and Outcomes
of Hospitals: A Systematic Review of the U.S. Hospitals 1996-2016”. In: (2017), p. 36.
[14] Tal Gross and Miriam J. Laugesen. “The Price of Health Care: Why Is the United
States an Outlier?” In: Journal of Health Politics, Policy and Law 43.5 (Oct. 1, 2018),
pp. 771–791. issn: 0361-6878, 1527-1927. doi: 10.1215/03616878- 6951127. url:
https://read.dukeupress.edu/jhppl/article/43/5/771/134936/The-Price-
of-Health-Care-Why-Is-the-United-States (visited on 12/06/2018).
[15] Micah Hartman et al. “National Health Care Spending In 2016: Spending And En-
rollment Growth Slow After Initial Coverage Expansions”. In: Health Affairs (Project
Hope) 37.1 (2018), pp. 150–160. issn: 1544-5208. doi: 10.1377/hlthaff.2017.1299.
[16] Christina Higgins. “Nursing Education: Unions and their Place in the Curriculum”.
PhD thesis. St. Catherine University, 2016.
[17] Kaufman Hall. 2017 in Review: The Year M&A Shook the Healthcare Landscape. 2018,
p. 13. url: https://www.kaufmanhall.com/sites/default/files/2017- in-
Review_The-Year-that-Shook-Healthcare.pdf.
[18] Daniel P Kessler and Mark B McClellan. Is Hospital Competition Socially Wasteful?
Working Paper 7266. National Bureau of Economic Research, July 1999. doi: 10.
3386/w7266. url: http://www.nber.org/papers/w7266 (visited on 11/01/2018).
[19] Ryan L. Mutter, Patrick S. Romano, and Herbert S. Wong. “The Effects of US Hospi-
tal Consolidations on Hospital Quality”. In: International Journal of the Economics of
Business 18.1 (2011), pp. 109–126. issn: 1357-1516. url: https://search-proquest-
com.ezp-prod1.hul.harvard.edu/econlit/docview/864387216/8B842667FF344B5PQ/
1 (visited on 10/08/2018).

REFERENCES 45
[20] NBC News/Wall Street Journal. Study #18416. Poll. Hart Research Associates / Pub-
lic Opinion Strategies, June 2018. url: http://media1.s-nbcnews.com/i/today/z_
creative/18416NBCWSJJunePoll6718Release.pdf (visited on 03/27/2019).
[21] Jeffrey H. Perry and Richard H. Cunningham. “Effective Defenses of Hospital Mergers
in Concentrated Markets”. In: Antitrust 27 (2012), p. 43.
[22] Christopher M Pope. “How the Affordable Care Act Fuels Health Care Market Con-
solidation”. In: 2928 (Aug. 1, 2014), p. 18.
[23] Sandhya Radhakrishnan. “Measuring Efficiencies in U.S. Hospital Mergers”. PhD the-
sis. Northern Illinois University, 2014. url: https://search-proquest-com.ezp-
prod1.hul.harvard.edu/econlit/docview/1751984867/81AFDCBB76584851PQ/2
(visited on 10/08/2018).
[24] Louise Sheiner. “Perspectives on Health Care Spending Growth”. In: Future of US
Health Care Spending Conf. 2014.
[25] U.S. Department of Justice and Federal Trade Commission. Horizontal Merger Guide-
lines. 2010. url: https://www.justice.gov/sites/default/files/atr/legacy/
2010/08/19/hmg-2010.pdf.
[26] Yale New Haven Health Services Corporation/Center for Outcomes Research and Eval-
uation. 2013 Measures Updates and Specifications: Acute Myocardial Infarction, Heart
Failure, and Pneumonia 30-Day Risk-Standardized Mortality Measure (Version 7.0).
Centers for Medicare and Medicaid Services, 2013, p. 55.
Related Documents