AD-A256 220 TECHNIAL REPORT St- 92-2 ( GROUT FOR CLOSURE OF THE DEMONSTRATION VAULT AT THE US DOE HANFORD FACILITY by L-Hi :-,w . Vvakeiley. Jines J. Ernen Strurtires L-horatory P E P t'AT.'EN 'N Tt A E MY ..- " W :.,•tt~W rw,• y s E .•'perE•:•..- t 3tatv,:n. C rorps D ,- LflE'. n;e~er DTIC S ELECTE OCT 7 1992 9,2-26551 A' Y-'~ IC

Welcome message from author
This document is posted to help you gain knowledge. Please leave a comment to let me know what you think about it! Share it to your friends and learn new things together.
Transcript

AD-A256 220 TECHNIAL REPORT St- 92-2 (GROUT FOR CLOSURE
OF THE DEMONSTRATION VAULTAT THE US DOE HANFORD FACILITY
by
L-Hi :-,w . Vvakeiley. Jines J. Ernen
Strurtires L-horatory
P E P t'AT.'EN 'N Tt A E MY..- " W :.,•tt~W rw,• y s E .•'perE•:•..- t 3tatv,:n. C rorps D ,- LflE'. n;e~er
DTICS ELECTE
OCT 7 1992
9,2-26551
A' Y-'~
IC
IIAD-A256 TECHNICAL REPORT SL-1-21
GROUT FOR CLOSUREOF THE DEMONSTRATION VAULT
AT THE US DOE HANFORD FACILITY
by
Lillian D. Wakeley, James J. Ernzen
Structures Laboratory
DEPARTMENT OF THE ARMYAl. Waterway:; Experiment 3'lation, Corps of Engineers
3909 Halls Ferry Road, Vicksburg, MississipDi 39180-6199
V . DTICELECTE
• OCT? 7 1992
•++ C
BESTAugust 1992 VIBECPFinal Report
Approved ~For Public Rotoaso; Distribution Is Unlimited
+ 92-26.5.51
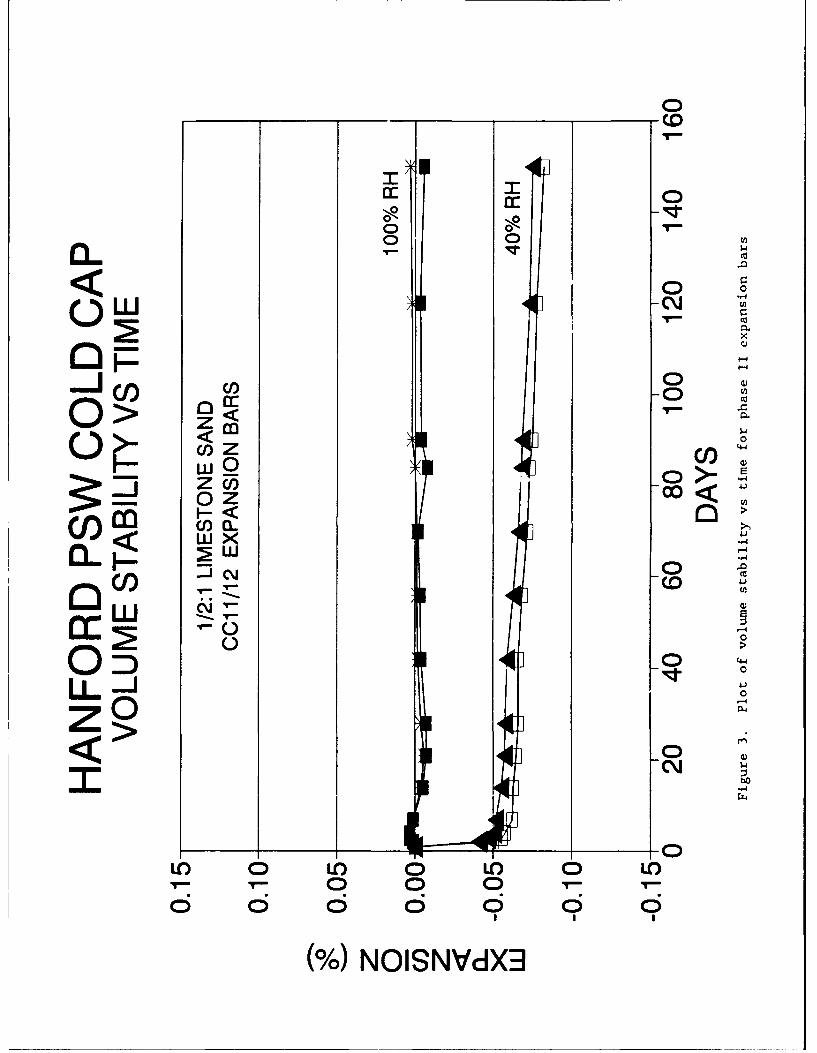
jhý Prepared for US DEPARTMENT OF ENERGYOak Ridge Operat-ons, PO Box 2001
LBRTORY. Oak lidqe., Tenneisee 37831-8614

When this report is no longer needed return it tothe originator.
The findings in this report are not to be construed as anofficial Department of the Army position unless so
designated by other authorized documents.
The contents of this report are not to be used foradvertising, publication, or promotional purposes.Citation of trade names does not constitute anofficial endorsement or approval of the use of such
commercial products.

Form Approved
REPORT DOCUMENTATION PAGE Form Apro 18ed
Pubic revortng burden for this collec-,on of nformation is estimated to averaqe 1 hour per response. including the time for reviewng instructions, searching existing data sources.gathering andn mantaining the data needed, and compoleting and revie •ng the collection of information Send comments regarding this burden estimate or arn other aspect of thiscollection of informatIon. nclutling suggestions for reducing this burden to Washington Headquarters Servii.es. Directorate for information Operations and Reports. 1215 letfersonDavis Highw ay. Suite 1204 Arlington, VA 22202-4302. and to the Offire of Management and Budget. Paperwork Reduction Project (0104.0188), Washington, DC 20503
1. AGENCY USE ONLY (Leave blank) 2. REPORT DATE 3. REPORT TYPE AND DATES COVERED
August 1992 Final report4. TITLE AND SUBTITLE 5. FUNDING NUMBERS
Grout for Closure of the Demonstration Vault at theUS DOE Hanford Facility6. AUTHOR(S)
Lillian D. WakeleyJames J. Ernzen
7. PERFORMING ORGANIZATION NAME(S) AND ADDRESS(ES) 8. PERFORMING ORGANIZATION
U.S. Army Engineer Waterways Experiment Station REPORTNUMBER
Structures Laboratory Technical Report3909 Halls Ferry Road SL-92-21Vicksburg, MS 39180-6199
9. SPONSORING/ MONITORING AGENCY NAME(S) AND ADDRESS(ES) 10. SPONSORING/ MONITORINGAGENCY REPORT NUMBER
U.S. Department of EnergyOak Ridge OperationsP.O. Box 2001Oak Ridge, TN 37831-8614
11. SUPPLEMENTARY NOTES
Available from National Technical Information Service, 5285 Port Royal Road,Springfield, VA 22161
12a. DISTRIBUTION /AVAILABILITY STATEMENT 12b. DISTRIBUTION CODE
Approved for public release; distribution is unlimited.
13. ABSTRACT (Maximum 200 words)
The Waterways Experiment Station (WES) developed a grout to be used as acold- (nonradioactive) cap or void-fill grout between the solidified low-levelwaste and the cover blocks of a demonstration vault for disposal of phosphate-sulfate waste (PSW) at the U.S. Department of Energy (DOE) Hanford Facility.The project consisted of formulation and evaluation of candidate grouts andselection of the best candidate grout, followed by a physical scale-model testto verify grout performance under project-specific conditions. Further, theproject provided data to verify numerical models (accomplished elsewhere) ofstresses and isotherms inside the Hanford demonstration vault. Evaluation ofunhardened grout included obtaining data on segregation, bleeding, flow, andworking time. For hardened grout, strength, volume stability, temperature rise,and chemical compatibility with surrogate wasteform grout were examined.
(Continued)
14. SUBJECT TERMS 15. NUMBER OF PAGES
Grout Waste disposal 156Hanford 16. PRICE CODE
17. SECURITY CLASSIFICATION 18. SECURITY CLASSIFICATION 19. SECURITY CLASSIFICATION 20. LIMITATION OF ABSTRACTOF REPORT OF THIS PAGE OF ABSTRACT
UNCLASSIFIED UNCLASSIFIED I I _I
NSN 7540-01-280-5500 Standard Form 298 (Rev 2-89)Prescribed by ANSI Sld 139-18298-102

13. ABSTRACT (Continued).
The grout was formulated to accommodate unique environmental boundaryconditions (vault temperature - 45 °C) and exacting regulatory requirements(mandating less than 0.1 percent shrinkage with no expansion and no bleeding);
and to remain pumpable for a minimum of 2 hr. A grout consisting of API Class Hoil-well cement, an ASTM C 618 Class F fly ash, sodium bentonite clay, and anatural sand from the Hanford area met performance requirements in laboratorystudies. It is recommended for use in the DOE Hanford demonstration PSW vault.

PREFACE
The work described in this report is part of an ongoing research effort
accomplished in the Concrete Technology Division (CTD), Structures
Laboratory (SL), U.S. Army Engineer Waterways Experiment Station (WES), under
an Interagency Agreement with the U.S. Department of Energy, Oak Ridge Office
via Oak Ridge National Laboratory (ORNL), Oak Ridge, TN, for support to the
DOE Hanford, WA, Facility. Mr. Earl W. McDaniel, ORNL, was the technical
monitor for this research.
Drs. Lillian D. Wakeley and James J. Ernzen directed the laboratory
studies in CTD and prepared this report under the general supervision of
Mr. Bryant Mather, Director, SL, and Mr. Kenneth L. Saucier, Chief, CTD. The
authors acknowledge Messrs. Billy Neeley, L. W. Mason, Charles White,
Dennis Bean, Mike Hammons, Anthony Bombich, Dan Wilson, Cliff Gill,
Brent Lamb, Michel Alexander, Mike Lloyd, and Percy Collins and Mses. Linda
Mayfield and Judy Tom for their assistance during this investigation. The
authors also acknowledge the support of Drs. Toy Poole and Charles Weiss, Jr.,
and Messrs. J. Pete Burkes, John Boa, Jr., Hugh Wilson, Ken Loyd, Don Walley,
Melvin Sykes, and John Cook and Ms. Estelle Stegall.
Westinghouse Hanford Corporation (WHC) is responsible for the Hanford
Grout Vault Program. Messrs. Jeff Voogd and Kenneth Bledsoe, WHC, reviewed
and commented on this document during its preparation.
At the time of publication of this report, Director of WES was
Dr. Robert W. Whalin. Commander and Deputy Director was COL Leonard G.
Hassell, EN.
r J
'~--.,.: t~y Codesanrj/or
r, I Special

CONTENTS
Page
PREFACE ........................ .............................. 1
CONVERSION FACTORS, NON-SI TO SI (METRIC)UNITS OF MEASUREMENT ............... ......................... 3
PART I: INTRODUCTION ...................... ....................... 4
Executive Summary ...................... ....................... 4
The Grout Vault Program ................... .................... 8Performance Requirements for Cold-Cap Grout ......... .......... 8
PART II: MATERIALS SELECTION AND CHARACTERIZATION ........... .. 10
Criteria ..................... ........................... 10Cement and Fly Ash ............... ...................... 10Aggregates ................... .......................... 10Other Components ............... ....................... .. 11
PART III: EXPERIMENTAL PROCEDURES ........... ................. 12
Mixture Proportioning and Unhardened Properties Testing . . .. 12
Hardened Properties Testing .......... .................. .. 13
Interface with Wasteform Grout ......... ................ 15Analyses of Small Interface Samples ...... .............. .. 15
PART IV: PHYSICAL MODEL TEST ............ .................... .. 17
Mixing and Placement ............. ..................... .. 17
Strain and Temperature Measurements ...... .............. .. 18Volume Stability Measurements .......... ................. .. 21Analyses of the Interface in the Physical Model .......... .. 21
Implications for Chemical Interaction .... ............. .. 21
PART V: SUMMARY ................... .......................... 23
Recommendations ................ ........................ .. 23
REFERENCES ....................... ............................. 24
Tables 1-7
Figures 1-55
APPENDIX A: PROPORTIONS OF EXPERIMENTAL GROUT MIXTURES TESTEDDURING GROUT DEVELOPMENT ............... ................ Al
APPENDIX B: REPORTS FROM EXAMINATION OF CEMENT, AGGREGATES,AND INTERFACE BETWEEN COLD-CAP GROUT ANDSIMULATED WASTE ............. .................... Bl
APPENDIX C: PLOTS OF THE DATA FROM INDIVIDUAL STRAIN METERS . . . . Cl
2

CONVERSION FACTORS, NON-SI TO SI (METRIC)UNITS OF MEASUREMENT
Non-SI units of measurement used in this report can be converted to SI
(metric) units as follows:
Multiply By To Obtain
Btu (International Table) 4,186.800 joules per kilogram kelvinper pound (mass)
degree Fahrenheit
Fahrenheit degrees 5/9 Celsius degrees or kelvins*
feet 0.3048000 metres
fluid ounces 29.5625 millilitres
inches 25.40000 millimetres
pounds (force) per 0.006894757 megapascalssquare inch
pounds (mass) 0.4535924 kilograms
pounds (mass) per cubic 16.01846 kilograms per cubic metrefoot
pounds (mass) per cubic 1.6875 kilograms per cubic metreyard
* To obtain Celsius (C) temperature readings from Fahrenheit (F) readings,
use the following formula: C - (5/9)(F - 32). To obtain Kelvin (K)readings, use: K - (5/9)(F - 32) + 273.15.
3

GROUT FOR CLOSURE OF THE DEMONSTRATION VAULT
AT THE US DOE HANFORD FACILITY
PART I: INTRODUCTION
Executive Summary
I. The US Army Engineer Waterways Experiment Station (WES) recommends
the following formulation for the cold-cap grout to serve as a void-fill
material between the waste-form grout and the cover blocks in the phosphate-
sulfate waste (PSW) demonstration vault at Hanford, WA. This grout mixture
was designated CC-20 in our experiments.
Material Lb Per Cubic Yard*
API Class H Cement 300
ASTM Class F Fly Ash 1,112
Natural Fine Aggregate 1,314(all passing the 2.36-mm
[No. 81 sieve)
Sodium Bentonite Clay 38
Water 564
High-Range Water-Reducing 4.5Admixture
Set-Retarding Admixture 4.56 fluid oz
2. Materials selection and experimental design focused on meeting the
grout requirements provided by Westinghouse Hanford Corporation (WHC), dated
October 25, 1990, which had been revised following our written comments of
October 17, 1990. These requirements are summarized here. The grout was
required to have a compressive strength of 400 psi or greater at 28 days of
age. Shrinkage was to be no more than 0.1 percent in the lower lifts and not
more than 0.01 percent in the top lift, and the grout was to be nonexpansive.
It was to be chemically stable in contact with the wasteform grout at
* A table of factors for converting non-SI units of measurement to SI
(metric) units is presented on page 3.
4
temperature up to 70 'C and should not bleed. The grout must generate as
little heat as possible. It must be pumpable and be capable of flowing
approximately 14 ft horizontally without segregating after a placement drop of
4 ft. Although not stated originally, subsequent conversations revealed that
the grout probably would be mixed offsite by a supplier of ready-mixed
concrete. This would require approximately an hour of transport time, in
addition to anticipated mixing and pumping time.
3. Materials were selected and proportioned based on those
requirements. API Class H oil-well cement was chosen because of its coarse
particle size and resulting slow heat evolution. Class F fly ash was chosen
over Class C because of its demonstrated ability to reduce permeability over
time and because mixtures containing Class F fly ash commonly generate less
heat and are less subject to sulfate attack. An appropriate Class F fly ash
was available near the Hanford site. Two fine aggregates with differing
thermal expansion characteristics were tested: a crushed limestone sand
available at WES and a natural sand from a supplier close to Hanford. The
latter was selected for this grout. Sodium bentonite was chosen for its
ability to hold water, aid in pumpability, and reduce bleeding. The high-
range water-reducing and set-retarding admixtures were chosen because of their
demonstrated performance in WES experience with mixtures containing similar
materials.
4. In proportioning this mixture, we used a low cement content to
minimize the heat rise and still meet the specified unhardened and hardened
properties. The ratio of cement to fly ash (c/fa) was held between 1:2 and
1:3 to obtain a low cement content. The ratio of cement + fly ash to fine
aggregate was initially varied between 1:1 and 2:1 to investigate how the
aggregate content would affect the volume stability of the grout at the
elevated temperatures in the vault. The ratio of water to cement + fly ash
(w/c+fa) was held low at 0.4 by mass to obtain a high quality microstructure
and still deliver pumpable grout of the required properties during the transit
times expected. The dosages of high-range water reducer and set retarder were
adjusted to aid in maintaining these properties until the grout was in place.
5. Over 20 different mixtures were proportioned, cast, and tested in
the early phase of the research effort. Proportions for these mixtures are
presented in Appendix A. These mixtures were prepared in Hobart mixers
5

(described in ASTM 305) as 0.1-cu-ft batches, mixed for 2 hr, and tested for
flow, segregation, bleeding, and compressive strength. Grout flow was
measured according to ASTM C 939, bleeding according to ASTM C 940, and
strength according to ASTM C 109. Occurrence or nonoccurrence of mixture
segregation was determined by visual inspection. Four of the mixtures, after
passing these requirements, were then cast in larger batches and tested
additionally for time of setting (ASTM C 191), chemical interaction with
simulated PSW waste grout (by phase composition using X-ray diffraction [XRD]
and chemical composition by energy dispersive X-ray analysis [EDX]),
semiadiabatic heat rise (using a CIMS HayBox Calorimeter), and volume
stability.
6. The volume-stability measurements involved measuring the length
changes of 1- by 1- by 11-in, prisms that were cured and stored at 45 °C and
100 percent relative humidity. The temperature of 45 °C was provided to the
WES from WHC Process Engineering Office as the current vault temperature as of
1991. Relative humidity of 100 percent was chosen as a reasonable
approximation of probable vault conditions. Molds and comparator were as
described in ASTM C 157, as was the method of calculating length change.
Measurements of heat rise were obtained by measuring the thermal loss from a
6- by 12-in. grout cylinder, in a calibrated environment (inside the CIMS
calorimeter), and then calculating the adiabatic heat rise this mixture would
exhibit inside the vault (assuming the vault will remain at a temperature of
45 'C).
7. Test results showed that all mixtures, when prepared as described,
met the specifications with regard to strength and flow, and with adjustments
to the admixtures or the clay content or both, could meet the segregation and
bleeding requirements. The deciding factors on choice of materials and
proportions hinged upon the issues of volume stability and heat rise. The
mixtures with higher sand contents clearly showed lower temperatures than
identical mixtures with less sand and more fly ash in them. This factor
eliminated the low-sand mixtures.
8. At 60 days, expansion prisms of the grout made with 480 lb of cement
and natural sand showed an average positive expansion of 0.003 percent. Data
from tests at 120 days age show that the prisms of the grout made with natural
sand have an average expansion of +0.002 percent. These values represent
6

extremely small changes (they are close to the limit of measuring error) and
excellent volume stability. The small positive expansions observed are not a
serious concern and are probably beneficial. With time the vault will begin
to cool, and some thermal contraction will result. The natural sand was
selected for the final phase of testing, the proximity of its source to
Hanford being an important factor.
9. A mixture with natural sand and 480 lb of cement was chosen for
full-scale adiabatic tests. For these tests, batches of 0.5 cu yd were mixed
for 2 hr in a revolving drum mixer. The cesults of the initial large-scale
adiabatic test showed this mixture to be much hotter (temperature rise >57 °C
in 4 days) than was estimated from the smaller CIMS calorimeter tests. It was
unclear whether this mixture would overheat inside the vault environment.
10. For this reason, a new mixture containing 300 lb of cement was
proportioned and tested by the previously described regimen. This mixture,
CC-20, is the one recommended by WES, and meets all the specifications for the
grout in the unhardened and hardened state except for shrinkage where its
volume change is -0.02 percent. This value easily meets the requirement for
the lower lifts but misses the specification for less than 0.01 percent
shrinkage in the top lift. As we stated in letters exchanged before the
research effort began at WES, we have come as close as we could to the
specifications in the time and with the resources given. This is an extremely
small volume change. It seems unlikely that shrinkage between 0.02 and
0.05 percent in the top lift will compromise the integrity of the cover blocks
above it.
11. The final phase of the research was to cast large-scale batches,
1.5 cu yd in size, and place them in a fully instrumented, full-depth physical
model. This model is a cube, 5 ft on each side, heated to 45 °C to simulate
the vault environment and the thickness between the PSW waste grout and the
cover blocks. Materials were batched and mixed in a computer-controlled
automated batch plant using a pug-mill mixer and a mixing time of 2 hr. Three
16-in. lifts were placed on top of a 6-in. layer of simulated waste grout.
12. The highest temperature attained in the WES physical model was
approximately 60 'C, and no significant problems were encountered. The final
lift was instrumented with six dial gages to measure the movement of the grout
relative to the bottom of the cover blocks. Analyses of interfaces between
7

simulated wasteform grout and WES cold-cap grout indicated virtually no
bonding and minimal potential for chemical interaction.
The Grout Vault Program
13. The Hanford Grout Vault Program was developed to reduce the need
for temporary storage capacity for soluble radioactive waste and provide
permanent disposal of defense low-level wastes at the Department of Energy
facility at Hanford, WA. These wastes include chemically toxic and
radioactive salts created during more than 40 years of processing nuclear
weapons materials. The wastes have been dewatered to varying extents and
stored in "temporary" underground steel tanks. For permanent disposal, the
waste is removed from its temporary tank, mixed with the dry-blended
components of the wasteform grout, and then pumped into underground concrete
vaults. Being solidified in wasteform grout makes the radioactive waste
components less soluble and less likely to be leached or otherwise transported
into the biosphere (Hanford Support Team, 1990). The PSW grout campaign,
during which the demonstration vault was filled with its wasteform grout, is
described elsewhere (Cline et al., 1990).
14. For the demonstration vault, the cold--ap grout will be placed on
top of the wasteform grout in at least three layers, filli-ig the vault to the
underside of its cover blocks to form a load-bearing barrier between the
covering layers and the hazardous materials contained below them. The vault
measures 15.2 m by 38.1 m by 10.4 m and is filled to a height of 9.2 m with
wasteform grout and later covered wi:h 1.2 m of cold-cap grout (Cline et al.,
1990). Figure I shows a section view of the first concrete vault at Hanford
which is filled with wasteform grout. WES developed the cold-cap grout for
this vault.
P rformance Requirements for Cold-Cap Grout
15. There are three categories of performance requirements:
(1) pumping and placement properties, (2) properties of unhardened grout after
placement, and (3) roperties of hardened grout.
8

Pumping and placement
16. The location of existing ports in the cover blocks dictates that
the grout will drop 4 ft vertically when pumped into the vault and must flow
at least 14 ft horizontally from each entry point to cover the wasteform and
fill the void space. For this the grout must be self-levelling and non-
segregating. From WES grouting experience, we determined that a flow time of
15 to 18 sec (ASTM C 939) was an appropriate fRrasure of this property.
Batching may be accomplished at a concrete plant, requiring a minimum 1 hr
travel time; the grout will need to be pumpable for 2 hr after mixing begins.
Unhardened grout
17. Avoiding evolution of free liquid, or bleeding, is the most
critical property after placement and before final set. We anticipated that
free liquid on the upper surface of the wasteform might have left a layer of
soft and possibly soluble radioactive mineral matter. Avoiding free liquid
from the cold cap will reduce the likelihood of (1) chemical interaction
between the two grouts, (2) physical disturbance and remobilization of
radioactive or hazardous components to contaminate the cold cap and violate
the multiple-barrier system.
Hardened grout
18. The grout was required to attain an unconfined compressive strength
of 400 psi (3.0 MPa) at 28 days. Volume stability is critical for maintaining
the integrity of the cap, so shrinkage is limited to 0.1 percent in the lower
lifts and 0.01 percent in the top lift, and no expansion is permitted. The
grout must be geochemically stable in contact with the wasteform grout at
temperatures estimated to reach 70 'C or more and contribute as little heat as
possible to the vault itself. The current demonstration vault temperature is
45 °C; a maximum temperature rise of 50 °C was chosen as a requirement to
avoid overheating.
9

PART II: MATERIALS SELECTION AND CHARACTERIZATION
Criteria
19. Three groups of criteria were considered in selection of component
materials for the grout. The first group was the performance demands of
chemical and mechanical stability, heat generation, durability, and
placability. The second group was economic, including availability of
materials near the site locations, likelihood of continued availability, and
shipping costs. The third group of selection criteria included WES experience
with comparable materials and an acceptable performance record in comparable
grout operations.
Cement and Fly Ash
20. The two main considerations in cement choice were low heat
generation and resistance to sulfate attack. API Class H oil-well cement was
chosen because of its coarse particle size and resultant reduced rate of heat
evolution, expected to reduce cracking due to thermal strains. The low
alumina content of the cement was also expected to provide excellent
resistance to sulfates (Mindess and Young, 1981) which are known to be present
in the liquid waste. The chemical and physical properties of the cement
selected are shown in Table 1.
21. A low-calcium ASTM Class F fly ash was chosen over a Class C ash
because of the demonstrated ability of the former to provide added resistance
to sulfate attack and lower early-age heat generation (Barrow et al., 1988,
1989). This fly ash also had a positive effect on workability and was
expected to contribute to the cementitious microstructure with time to enhance
chemical stability and leach resistance. The chemical and physical
characteristics of the fly ash are shown in Table 2.
Aggregates
22. Two different fine aggregates were tested during the project. The
first was a natural, well-rounded sand from a source near the Hanford site,
10

and the second was a crushed limestone sand available at WES. The two
aggregates were chosen specifically for their different physical and
mineralogical makeup and differing linear coefficients of thermal expansion
(CTE). Since aggregate makes up a significant proportion of the grout volume,
the volume stability of the grout at elevated temperature is heavily dependent
upon the coefficient of thermal expansion of the aggregate which is
counteracting drying shrinkage of the paste. For this reason, the limestone
aggregate with a CTE of 3.3 microstrains/°F was compared with the silica-rich
Hanford sand which has a CTE of 4.4 microstrains/°F. This allowed us to
measure the effect of the CTE of the aggregate on the volume stability of the
grout. The characterization tests performed on the fine aggregates included
grading, bulk specific gravity, absorption, and mineralogical analysis by XRD.
Data from the natural aggregate used in CC-20 are presented in Appendix A.
The grading was determined according to ASTM C 136, while the specific gravity
and absorption were determined in accordance with ASTM C 127 and ASTM C 128,
respectively. These results are shown in Table 3. The fractions larger than
the 2.36-mm (No. 8) sieve size were sieved out to reduce segregation in the
mixcure and improve flow properties of the grout.
Other Components
23. Approximately 22.5 kg of sodium bentonite were used per cubic yard
of grout to aid in pumpability, reduce segregation, and eliminate bleeding. A
commercial brand of clay familiar to WES researchers and used extensively in
the grouting industry was chosen and tested for mineralogical composition by
XRD and for pozzolanic activity according to ASTM C 618. The results are
shown in Table 4.
24. To produce as durable a product as possible, the ratio of water to
cementitious materials was held at 0.40 by mass. This necessitated the use of
a high-range water-reducing admixture (HRWRA) and a set retarder to obtain the
required flow properties for the 2-hr time period needed between mixing and
pumping. The HRWRA used was DAXAD19®, a naphthalene-based product marketed by
W. R. Grace. The set-retarding admixture was a salt of hydroxylated
carboxylic acid marketed by Sika Corporation as Plastiment®.
11
PART III: EXPERIMENTAL PROCEDURES
25. The experimental testing program was accomplished in three phases:
(a) mixture proportioning and unhardened properties testing, (b) hardened
properties testing, and (c) full-depth physical model.
Mixture Proportioning and Unhardened Properties Testing
26. The cold-cap grout will be pumped into an opening that is the upper
1.2-m depth of the entire vault, above the wasteform grout. WHC has monitored
the temperature of the demonstration vault since placement of the wasteform
grout. The working temperature they provided to WES for our testing and
physical modelling was 45 *C. It was desirable to proportion the mixture with
a minimum cement content and still meet the unhardened and hardened grout
properties specified. For this reason, fly ash amounts of 67 to 80 percent of
the cementitious medium were used. The ratio of cementitious materials to
sand ,C+FA/S) was varied between 1:1 and 2:1 initially, when we had not yet
determined how the aggregate content would affect the volume stability of the
grout at the elevated vault temperature. Initial mixtures were proportioned
in 0.003-m3 batches in a laboratory bench-top mixer meeting the requirements
of ASTM C 305 and were tested for flow, segregation, bleeding, shrinkage, and
compressive strength. Quantities of all component materials were measured on
mass balances certified as accurate within 0.1 percent. Balance verification
records are on file at the WES.
27. Grout flow was tested using the flow cone procedure in ASTM C 939
at intervals of 15, 30, 60, 90, and 120 minutes after starting mixing. From
WES experience with grouting operations, we judged that a grout with a flow
time of 15 to 18 sec would meet the flow requirements. Bleeding and shrinkage
were estimated by measuring the space left at the top of the cylinder after
final set. Compressive strength was measured using 3- by 6-in. (76- by
152-mm) cylinders at 7 days, according to ASTM C 39. Mixture segregation was
checked by physical inspection prior to each flow test. A total of
20 mixtures was proportioned from the materials listed and tested in the
laboratory during this phase of the research. At the completion of Phase I,
the four best candidate mixtures (CC-IO, CC-lI, CC-13, CC-16) were selected to
12

continue to Phase II. Table 5 shows the mixture proportions for these
mixtures which were chosen to proceed with hardened properties testing.
Table 5 also shows proportions for mixture CC-20, the recommended candidate
mixture, which was developed as a result of Phase II testing.
Hardened Properties Testing
28. The five mixtures shown in Table 5 were proportioned in 0.008-m3
batches and tested for flow, segregation, bleeding, and time of setting. Also
from these batches, specimens were cast for measurements of volume stability,
chemical interaction with simulated wasteform grout, compressive strength, and
semiadiabatic temperature rise. Duplicate batches were cast of each of these
mixtures to attain statistically credible values and to minimize possible
proportioning errors. Bleeding was measured, after 2 hr of mixing time, at
appropriate intervals for 3 hr after casting in a 500-mL graduated cylinder,
as described in ASTM C 940. The time of setting was measured using a Vicat
apparatus according to ASTM C 953. Compressive strength was obtained by
testing 2-in. (50.8-mm) cubes according to ASTM C 109 at 7, 14, and 28 days.
Strength after aging at elevated temperature also was measured on companion
cubes cast in each batch and cured at 38 °C and 40 percent RH. The results of
the strength tests are summarized in Table 6.
29. The volume stability measurements were made on 1- by 1- by
ll-I/ 4 -in. (25.4- by 25.4- by 287-mm) prisms which were cured and stored in
environmental conditions of 45 °C and 100 percent relative humidity to
simulate conditions inside the vault. Since the exact relative humidity
inside the vault was not known, companion prisms from each mixture were cast
and stored at 38 °C and 40 percent relative humidity to bracket plausible
conditions. All batches were mixed at 23 °C for 2 hr, after which the molds
were filled and immediately placed in the elevated temperature chamber. The
specimens were removed at 24 hr, demolded, and returned to the chamber.
Measurements were taken daily through 7 days, weekly through 28 days, then
monthly to 150 days. Figures 2 through 6 plot the volume stability versus
time for the five mixtures at each temperature and relative humidity through
150 days of age.
13

30. As we anticipated, the specimens stored in the higher humidity
environment exhibited much better volume stability than their companion prisms
in the lower humidity. Table 7 summarizes prism expansion measured at
150 days. In each case involving both aggregates the mixture with moist
curing exhibited shrinkage of 0.03 percent or less, while those mixtures
subjected to lower humidity showed shrinkage values consistently near
0.1 percent with one as high as 0.23 percent. It is clear from these data
that, at constant cement levels, varying the fine aggregate type or content
did not have a large effect on the volume stability of the grout. It is also
clear that lowering the cement content of the mixture caused a slight increase
in the amount of shrinkage measured. Since the fine aggregate type had
minimal effect on volume stability, mixtures made with limestone fine
aggregate were deleted from the test matrix, and the remainder of the
investigation centered on mixtures containing the natural sand fine aggregate
local to the Hanford area.
31. At this point in the investigation, we decided to continue thermal
investigative work with mixtures CC-10, CC-16, and CC-20. Initial thermal
screening of each candidate mixture was performed using CIMS, which measures
the heat signature from a 152- by 305-mm cylinder specimen in a calibrated
calorimeter. The CIMS coupled this heat signature with heat capacity
information entered for the individual materials and calculated an adiabatic
temperature rise for the mixture. This test assumed the vault would respond
like an adiabatic environment at 45 'C. This test was used to screen the
three remaining candidate mixtures to select the best mixture for full-scale
adiabatic testing. Figure 7 shows the adiabatic temperature rise calculated
by the CIMS system for these three mixtures.
32. Since the grout would be placed into an environment at 45 °C, an
adiabatic temperature rise limit of 50 °C was placed on the cold-cap mixture
to ensure it did not overheat in the vault. The data shown in Figure 7
indicate that mixtures CC-10 and CC-16 exhibited peak temperature rise values
greater than 50 °C with mixture CC-16 with its higher sand content being
slightly cooler. Mixture CC-20, with its lower cement content, recorded a
calculated adiabatic heat rise of 41 'C. For this reason, mixtures CC-16 and
CC 20 were chosen to perform full adiabatic temperature rise tests.
14

33. Adiabatic temperature rise of candidate grout was determined by the
method given in CRD-C 38 (Corps of Engineers, 1949). For this test, a 0.40-m3
sample was mixed in a rotary drum mixer for 2 hr and placed in an
environmentally controlled room where the temperature of the room was matched
to the heat generation of the sample. Figure 8 shows the adiabatic
temperature rise measured on mixtures CC-16 and CC-20. Mixture CC-16 exceeded
the 50 °C limit almost immediately, and the test was terminated after 2 days.
The temperature of mixture CC-20 rose more slowly and stayed below the 50 'C
limit. Based upon these data and data generated from the volume stability
measurements of prisms, we decided to use mixture CC-20 in the full-depth
physical model phase of the test program. The mixture proportions for CC-20
are shown in Table 5.
Interface With Wasteform Grout
34. As part of the laboratory experiments that led to mixture
selection, we prepared 2- by 2-in. (50.8- by 50.8-mm) cylinders of simulated
wasteform grout (based on different cement and fly ash, and two clays;
formulation given in Lokken et al., 1988) in plastic molds 4 in. high. We
then cast candidate cold-cap grouts (CC-9 through CC-16, Table 5) in the upper
half of each mold when the simulated wasteform in the bottom half was 2 to
3 weeks old. The interfaces were studied at ages between 4 and 9 weeks, by
visual and petrographic observations, XRD, and chemical composition by EDX in
appropriate profiles. Observations included aggregate distribution, evidence
of fluid movement, and description of interface surface textures. A typical
petrographic report from these studies is included in Appendix B. As
anticipated, there was virtually no bonding between candidate cold-cap grouts
and simulated waste grout. The lower surface of each cold-cap grout appeared
frothy, covered by a 1-mm-thick layer of uniformly sized thin-walled voids,
while the upper surface of the simulated waste grout was smooth.
Analyses of Small Interface Samples
35. Phases identified by XRD are consistent with partial hydration of
cementitious components both in the cold cap and in the simulated wa~teform
15

grout (calcium hydroxide, calcium silicate hydrate, dicalcium silicate, and
mineral constituents of the aggregate). Calcite is most abundant in the
froth, and ettringite is present only in the froth and not within the grouts.
EDX elemental analysis revealed Na, Al, Ti, and S more abundant in froth than
grouts, and Ca more abundant in grouts than in froth. kesults of XRD and EDX
analysis are summarized in Appendix B.
16
PART IV: PHYSICAL MODEL TEST
36. In the final phase of this research, we constructed an insulated
and heated cube proportioned to represent the full depth of one corner of the
cold-cap grout layer of the Hanford demonstration vault and cast a large-scale
physical model of the cold cap. This endeavor incorporated measuring all of
the grout properties tested separately in the previous phases and included
extensive instrumentation and data acquisition. The concept was to simulate
on an engineering scale the environmental conditions in the vault and the
mixing and placement operations as they might occur at the site. Figure 9 is
a photograph of the interior of the cube immediately after placement of first
grout lift. This physical model was maintained at 45 °C to simulate the vault
environment and was instrumented for strain, temperature, and volume change.
Model dimensions were chosen to reflect the actual depth being placed in the
vault, to eliminate the size effects inherent in small specimens, and to give
realistic temperature and strain profiles and volume changes. Long-term data
from this model were intended to validate the measurements made on previously
cast laboratory specimens and provide more complete data for thermal modelling
efforts to follow.
Mixing and Placement
37. At the base of the cube, we placed a 150-mm lift of surrogate PSW
wasteform grout, using the formula provided by Lokken et al. (1988). When the
simulated wasteform grout layer had been in place and at temperature in the
model for several weeks, we then placed the first of three 410-mm lifts of
cold-cap grout. Two more lifts followed after one week and four weeks,
respectively. The cap was cast in separate lifts since the vault will be
filled in this manner to decrease the likelihood of continuous crack
propagation. One quarter of the cube was instrumented with 18 Carlson strain
meters and 19 separate thermocouples, to measure changes in both strain and
temperature from the block centerline to the outside wall as each lift was
added to the cube. Figure 10 shows a 3-D view of the cube with the location
of the 18 strain meters. Six meters were placed in each lift with one at the
cube centerline and the remaining meters placed in a rectangular pattern to
measure changes in the material as the grout approaches the corner of the
17

model. Figures 11 through 13 show the meter trees and the numbered meters
showing their location in the cube. Each cold-cap lift also was instrumented
at the cube centerline with four thermocouples, plus one in the wasteform
grout, to record a continuous profile of temperature data. This thermocouple
tree is shown in Figure 14, with the centerline marked "CL."
38. Each lift of cap grout was batched in a fully automated, computer-
controlled batch plant and mixed for 2 hr in a pug mill prior to being placed
in the cube by concrete bucket. Figure 15 shows the pug mill mixing the grout
for the first lift. Flow and segregation were measured at 30-min intervals
during the 2-hr mixing period, and nine 152- by 305-mm cylinders were cast and
tested for compressive strength in groups of three at 7, 14, and 28 days.
Figure 16 depicts the strength gain with time for two of the three lifts
placed in the physical model compared to the strength figures obtained from
the 2-in. cubes cast for the same mixture in the earlier phase of the project.
The average 28-day compressive strength of the grout placed in the physical
model was approximately 10.7 MPa. None of the lifts exhibited any bleed
water.
Strain and Temperature Measurements
39. Each grout lift was batched at approximately 27 'C and placed
immediately into the physical model which was kept at 45 'C. The highest
temperature attained by any of the three lifts was 61 °C which equated to a
41 'C rise in the grout itself. Figure 17 plots the grout strain versus time
at the centerline of each lift at the center of the cube. The maximum strain
recorded at the block centerline in the first lift was over 2000 microstrains,
which is well above the strain limit expected for cementitious grout. Visual
inspection of the surface revealed several cracks, but it was not obvious
whether they were due to thermal effects or to drying shrinkage, since they
propagated from the instrumentation tree. Figure 18 is a photograph of the
cracks propagating from around the instrumentation supports. While crack
elimination was not a performance requirement, WES did try to prevent cracking
and to determine its cause when it was observed.
40. The second lift of cold-cap grout was placed six days after the
first. In an attempt to remedy the cracking problem, this lift was moist
18
cured by ponding a thin layer of water on the surface each day. Most of this
water was lost each day by a combination of absorption and evaporation, but it
served to keep the surface from drying out and no cracking was observed during
the 30-day period in between lifts 2 and 3. Measurements made on specimens
placed on the grout surface and ponded with the same thickness of water each
day showed that 70 percent of the ponded water was evaporated by the heat from
the model, and we assume that the remaining 30 percent was absorbed or
otherwise incorporated into the grout.
41. The maximum strain measured at the cube centerline in the second
lift was 1550 microstrains. This is also many times the strain limit
typically associated with hardened grout yet this lift showed no visible signs
of cracking. We postulate that the cracking observed in the first lift was
due to drying shrinkage coupled with the restraint imposed by the
instrumentation. The model was not actually a sealed system, but it is
possible that enough water was evaporated from the surface of the grout to
saturate the air above the surface on which cracking was observed. This
situation may have been exacerbated by the failure to seal the plywood ceiling
of the block. This ceiling undoubtedly absorbed water from the air above the
grout surface, which would then continue to draw water from the grout. The
daily wet curing of the second lift surface by ponding apparently prevented
the heat from evaporating enough water away from the surface to cause it to
crack. It is also possible that the elastic modulus of the grout may be low
enough at early ages that the material can accommodate these large strains
without macroscopic damage.
42. The third lift was placed 30 days after the second (during which we
awaited arrival of additional materials). The cube was filled to within
150 mm of the underside of the roof to allow room for surface measurements and
was not cured by ponding with water. The maximum strain in lift three was
attained by the centerline meter and totaled 1300 microstrains. Several
lifting shackles were inserted into the top lift which served as starting
points for cracks as the grout stiffened. A complete listing of the strain vs
time and temperature vs time plots for each meter is presented along with a
reference table identifying each data file and plot in Appendix C.
43. As shown in Figure 14, each lift of cold-cap grout was instrumented
with five thermocouples at the block centerline to record continuous
19

temperature data during the filling operation. Lift 2 also was instrumented
with six additional thermocouples to record temperature variations within the
lift from the cube centerline to the outside wall. Figures 19 through 21 show
temperature profile versus time recorded at the block centerline in each lift.
Figures 22 and 23 show the temperature variation in lift 2 at positions 48 cm
and 15 cm from the model face. As each new lift was added to the model, the
lowest thermocouple in the new lift, which was also the thermocouple nearest
the grout surface, experienced the widest range of temperature variation.
These lift additions are represented by temperature spikes in Figures 20
through 23. The widest variation within a lift occurred in the third lift and
measured 39 °C.
44. The Carlson strain meters placed throughout the model also measured
temperature on a continuous basis, and this also provided information on the
temperature gradient from the model centerline to the outside edges. Elevated
temperature does not cause cracking in grout and concrete but temperature
gradients do. For this reason the model dimensions were specifically chosen
so that the block represented a corner of the vault which is the worst-case
scenario in terms of temperature gradients to the outside walls and the top of
the vault. Figures 24 through 53 illustrate the changes in grout temperature
and thermal strain with time and space as the model was filled.
45. When adjacent Carlson meters in the same lift were compared, there
was very little difference in temperature, with the centermost meter being
only slightly hotter. However, there is a large difference in the measured
strains among meters within a lift, with the innermost meter always recording
substantially higher strains. This trend was true when measuring from the
centerline out to the cube face and also when measuring along the cube face
from the center of the face to a corner. This result is attributed to the
restraint imposed upon the grout layer by the increased proximity of the side
wall of the model. The meters nearest the cube faces and top also showed a
measure of strain relief after the last lift had been placed as evidenced by
the positive (compressive) strains noted with increasing time in Figures 29,
31, and 35. These strains continued to rise for approximately 20 days before
leveling off despite a relatively flat temperature profile during this period.
The temperatures recorded at the edges and top of the cube were in most cases
only a few degrees lower than those measured at the cube centerline.
20

Volume Stability Measurements
46. After the final lift was placed the top of the cube, six dial gages
were attached to a fixed support simulating the vault cover blocks abcve the
grout surface. The locations of these gages are shown in Figure 54. The
actual volume stability of the grout surface was measured to validate the data
obtained from the laboratory prism specimens. Figure 55 shows the deflection
of the surface with respect to the cover blocks as measured by five of the
gages through 90 days age. The sixth gage malfunctioned soon after
installation. The average deflection is 0.021 in (0.52 mm). When divided by
the 54-in. (137 cm) depth of the cold-cap grout, the shrinkage of the cold cap
is calculated to be 0.039 percent. This value meets the shrinkage requirement
of 0.1 percent for the lower lifts but misses the 0.01 percent limit for the
top lift.
Analyses of the Interface in the Physical Model
47. The interface between the layer of simulated wasteforr grout and
the first lift of cold-cap grout in the physical model was sampled by
horizontal coring after these layers had been in contact for 4 months at the
vault temperature. This interface was studied by the same techniques as were
the smaller samples. Again, there was minimal bonding between these layers,
which is desirable for mate-ials with different moduli and coefficients of
thermal expansion. The froth was absent. However, where the two grouts had
separated, the lower surface of the cold cap showed what appeared to be small
channels, <1 mm in diameter and several millimetres long, suggesting fluid
movement. The chemical composition of grouts and interfacial region were
similar to those of the smaller samples, although the phase assemblage
differed in that three forms of calcium carbonate were ieentified on the
wasteform surface, and no ettringite was detected at the interface.
Implications for Chemical Interaction
48. The presence of froth at the interface of samples from small
plastic molds suggests that it was preserved where fluid movement was
21
restricted. Microchannels on the interface from the larger physical model are
consistent with this interpretation. We did not isolate or verify the cause
of these interfacial features. However, the formation of ettringite at the
interface of the small samples may indicate increased availability of sulfate
from PSW. Extensive carbonation of the surface of the wasteform grout in the
Hanford demonstration vault is likely because of the probable use of forced-
flow air filtration system during and soon after placement of wasteform grout.
22

PART V: SUMMARY
49. A nonradioactive sanded cold-cap grout was developed to serve as a
void filler between the waste grout and the underside of the cover blocks in
the first Hanford Grout Vault. Using a small amount of Class H oil-well
cement, a large amount of ASTM Class F fly ash, a natural sand and bentonite
clay, a grout was developed which met a demanding set of physical and
geochemical properties.
50. Based upon this study, the following observations and conclusions
are offered:
a. The required fresh-concrete properties of 2-hr workability with15-sec flow time combined with no bleeding and no segregationcan be met with the right combination of materials.
b. Adiabatic temperature-rise tests indicated that the mixture maybe too hot; however, the full-depth model test placed undervault-like conditions showed a peak temperature rise of only41 'C and a maximum temperature of 61 'C, which is well withinthe project requirements.
c. Although the vault is basically a closed system followingplacement of the cold-cap grcut, the physical model experienceddrying of the surface of the grout layers. This induced dryingshrinkage cracking especially at penetration points where thegrout was restrained by gage supports or other hardware. Strainmeasurements exceeded the nominal strain capacity expected forconventional cement-based grouts. However, the second layer didnot crack when wet cured by ponding.
Recommendations
51. We recommend research to establish the early-age modulus of the
grout material. Minimizing time between successive lifts and ponding water on
the surface of the grout between lifts may alleviate the potential for
cracking, but the demonstration vault may be sealed well enough during and
following closure that it does not experience this apparent water loss by
evaporation. If lower thermal strain and closer volume tolerance are
required, we recommend additional work to develop grout with a lower cement
content.
23

REFERENCES
American Society for Testing and Materials. 1991. 1991 Annual Book of ASTM
Standards, Philadelphia, PA.
a. Designation C 39-86. "Standard Test Method for Compressive Strengthof Cylindrical Concrete Specimens."
b. Designation C 109-90. "Standard Test Method for CompressiveStrength of Hydraulic Cement Mortars (Using 2-in. or 50-mm Cube
Specimens)."
c. Designation C 127-88. "Standard rest Method for Specific Gravityand Absorption of Coarse Aggregate."
d. Designation C 128-88. "Standard Test Method for Specific Gravity
and Absorption of Fine Aggregate."
e. Designation C 136-84a. "Standard Method for Sieve Analysis in Fine
and Coarse Aggregates."
f. Designation C 150-89. "Standard Specification for Portland Cement."
g. Designation C 157-89. "Standard Test Method for Length Change ofHardened Hydraulic-Cement Mortar and Concrete."
h. Designation C 191-82. "Standard Test Method for Time of Setting ofHydraulic Cement by Vicat Needle."
i. Designation C 305-82. "Standard Practice for Mechanical Mixing ofHydraulic Cement Pastes and Mortars of Plastic Consistency."
j. Designation C 618-91. "Standard Specification for Fly Ash and Raw orCalcined Natural Pozzolan for Use as a Mineral Admixture in Portland
Cement Concrete."
k. Designation C 939-87. "Standard Test Method for Flow of Grout forPreplaced-Aggregate Concrete (Flow Cone Method)."
1. Designation C 940-89. "Standard Test Method for Expansion andBleeding of Freshly Mixed Grouts for Preplaced-Aggregate Concrete inLaboratory."
m. Designation C 953-87. "Standard Test Method for Time of Setting ofGrouts for Preplaced-Aggregate Concrete in the Laboratory."
Barrow, S., and R. L. Carrasquillo. 1988. "The Effect of Fly Ash on theTemperature Rise in Concrete," Research Report 481-2, Center forTransportation Research, University of Texas at Austin.
Barrow, R. S., P. M. Hadchiti, and R. L. Carrasquillo. 1989. "TemperatureRise and Durability of Concrete Containing Fly Ash," Proceedings of the ThirdInternational Conference on the Use of Fly Ash, Silica Fume, Slag, and NaturalPozzolans in Concrete, American Concrete Institute, SP 114, pp 331-338.
Cline, M. W., A. R. Tedeschi, and A. K. Yoakum. 1990. "Phosphate/SulfateWaste Grout Campaign Report," WHC-SA-0829-FP, prepared for the U.S. Department
of Energy Assistant Secretary for Defense Programs by Westinghouse Hanford
Company, P.O. Box 1970, Richland, WA.
24
Hanford Support Team. 1990. "Hanford Site Environmental Restoration Cost AndReview," prepared for U.S. Department of Energy Office of EnvironmentalRestoration and Waste Management by U.S. Army Corps of Engineers Division,North Pacific (CENPD), P.O. Box 2870, Portland, OR.
Lokken, R. 0., Reimus, M. A., Martin, P. F. C., and Geldart, S. E. 1988."Characterization of Simulated Low-Level Waste Grout Produced in a Pilot-ScaleTest," PNL-6396, Pacific Northwest Laboratory.
Mindess, S. and J. F. Young. 1981. Concrete, 671 pp, Prentice-Hall,Englewood Cliffs, NJ.
Tikalsky, P. J., and R. L. Carrasquillo. 1988. "Effect of Fly Ash on theSulfate Resistance of Concrete Containing Fly Ash," Research Report 481-1,Center for Transportation Research, University of Texas at Austin.
U.S. Army Corps of Engineers. 1949. Handbook for Concrete and Cement.U.S. Army Engineer Waterways Experiment Station, Vicksburg, MS (with quarterlysupplements).
25

Table 1
Chemical and Physical Properties of Portland Cement
(API Type H) Used in Cold-Cap Grout
Spec LimitsChemical Analysis Result Type II
Si02 , % .......... .................. .. 23.6 20.0 minA1 20 3 , % ......... ................. .. 2.7 6.0 max
Fe 20 3 , % ......... ................. .. 3.5 6.0 max
CaO, % .......... .................. 61.8 *MgO, % .......... .................. 3.4 6.0 maxS03, % ........... .................. 2.5 3.0 max
Loss on ignition, % ............. 0.9 3.0 max
Insoluble residue, % ... ........... 0.24 0.75 maxNa2 0, % .......... .................. .. 0.07 *
K20, % ........... .................. 0.52 *Alkalies-total as Na 20, % ........... 0.41 0.60 max
TiO2 , % .......... .................. .. 0.19 *
P205, % ......... .................. 0.07 *
C3A, % ........... .................. 2 8 max
C3 S, X ......... .................. 40 *
C2 S, % ........... .................. 42 *
C4AF, % ................. .................. 1 *
Physical Tests
Heat of hydration, 7-day, cal/g ...... 59 70 max
Surface area, m2/kg (air permeability) 304 280 min
Autoclave expansion, % ... .......... 0.06 0.80 max
Initial set, min. (Gillmore) ....... 170 60 min
Final set, min. (Gillmore) .. ........ 285 600 max
Air content, % .... .............. 10 12 max
Compressive strength, 3-day, psi ..... 1,700 1,000 min
Compressive strength, 7-day, psi ..... 2,205 1,700 minFalse set (final penetration), % ..... 94 50 min
* ASTM C 150 contains no specification requirements for these chemical
analysis results.

Table 2
Chemical and Physical Properties of Fly Ash
Spec LimitsChemical Analysis Result Class F
SiO2 , % ............ .................... .. 48.5 *A120 3 , % ........... ................... .. 19.8 *
Fe 20 3 , % ........... ................... .. 17.6 *Sum, % . . . . . . . . . . . . . . . . . . . 85.9 70.0 min
MgO, % .................. .................... 0.8 *SO 3 , Z ..................... .................... 1. 5.0 maxMoisture content, Z% ..... .............. .. 0.2 3.0 maxLoss on ignition, % ...... .............. .. 3.2 6.0 maxAvailable alkalies (28-day), % ........ ........ 1.1 1.5 max
Physical Tests
Fineness (45-pm (No. 375) sieve), % retained 24 34 maxWater requirement, % .... ............. .. 103 105 maxDensity, Mg/m 3 . .. .. .. .. . . . . . . . . . .. . . . . . .. 2.38 *
Autoclave expansion, % .... ............ 0.02 0.80 maxPozzolanic activity w/lime, psi .......... * .... 1,020 900 minPozzolanic activ477y w/cement (28-day) % . . 119 75 min
Laboratory cement used: Lone Star Industries, Cape Girardeau, MOLaboratory lime used: Chemstone
* ASTM C 618 contains no specification requirements for results of thesedeterminations.

Table 3
Fine Aggregate Data
Material: Hanford natural basaltic sand, Bulk Specific Gravity - 2.695HAN-I S-2
Source: Acme Concrete Co. Absorption - 1.6%Richland, WA
Cumulative PercentSieve Size Ret. Pass.
4.75-mm (No. 4) 0.8 99.2
2.36-mm (No. 8) 18.4 81.61.18-mm (No. 16) 27.9 72.1600-jm (No. 30) 46.4 53.6300-pm (No. 50) 73.0 27.0
150-pm (No. 100) 90.1 9.9Finer than 150-pm (No. 100) (100.0) 0
Fineness Modulus - 2.57(No. 4 - No. 100)
Material: Laboratory stock crushed Bulk Specific Gravity - 2.69limestone sand, WESSC-9
Source: Vulcan Materials Co. Absorption - 0.9%Calera, AL
Cumulative PercentSieve Size Ret. Pass.
4.75-mm (No. 4) 1 992.36-mm (No. 8) 5 851.18-mm (No. 16) 50 50600-pm (No. 30) 71 29300-pm (No. 50) 85 15150-pm (No. 100) 94 6Finer than 150-pm (No. 100) 100.0) 0
Fineness Modulus - 3.06(No. 4 - No. 100)

Table 4
Chemical Analysis of Bentonite
Material: Big Horn GelHAN-I SMI Density (Mg/m 3 ) = 2.32
Source: Wyo-Gen Inc. Pozzolanic ActivityBillings, MT w/Cement (psi) - 150
X-ray Fluorescence Chemical Analysis
Result
Component (Mass %)
Si02 77.64
A120 3 16.40
Fe 2O3 4.34
MgO 1.60
Na2 O 1. 17
CaO 1.13
K20 0.37
P205 0.19
TiOz 0.12
S03 0.08
Mn2 0 3 0.06
Total 103.10

U- D CD 0 CD
0 0 c0 0 0
A n In In na
W n 4 nN n m (
00
44
' O~ 0 u (D(0
00
.0
14 (aOD 0 C~
14 W .41'40 N
2- %4 t ) . -
0 00
oo00
o -4 O' 00 co S4
o o 0'. . . Go 4 C'
4.
10u u Nu6

Table 6
Compressive Strength Data for
Five Phase II Mixtures
Compressive Strength @ Compressive Strength @23 °C (psi) 38 °C (psi)
Mixture7 days 14 days 28 days 7 days 14 days 28 daysDesignationIIII
CC 9/10 1060 1440 1780 2610 3400 3800Hanford 1/2:1
CC 11/12 1240 1900 2400 3000 3560 4160Limestone 1/2:1
CC 13/14 1520 1440 2600 3500 3400 4300Limestone 1:1
C 15/16 1160 1920 1920 2980 3560 3730Hanford 1:1
CC 20 610 1040 1330 * * *
Hanford 1:1
• No specimens were tested at elevated temperature because all measuredvalues for strength exceeded the performance requirement.

Table 7
Overview of Expansion Bar Data
Length Change (%)Fine Aggregate:Cement Ratio H
and Curing Condition Hanford Limestone
@1/2:1 & 45 °C/I00% RH* +0.007 -0.002
@1/2:1 & 38 °C/40% RH* -0.08 -0.082
@1:1 & 45 °C/100% RH* +0.002 -0.004
@1:1 & 38 °C/40% RH* -0.10 -0.078
@1:1 & 45 °C/I00% RH** -0.03
@1:1 & 38 °C/40% RH** -0.23
* Mixtures containing 481 1b/cy of cement @ 150 days.** Mixtures containing 300 ib/cy of cement @ 90 days.

0. z
m U
S-Jm 0
-J C, LU I
LU~L mUW-
z 4.)
U) m 0
cc)z r1-4
14.
U)
.4.
Lu 0
00
LU 0
m <

-0O0
0-0oW
0~0
C\CJ
0-
0 a
0> z<00 U 0
0 z -0 J <
-(0
0
-0-U'A) 00' ' '
0- 0410 9
0 0 6w 6> * 61(%) NOSN~dX
0-CD
mr I
o 0
CCL
< 0)
0> 1
00
o > wo
ZU) z4w~vw
C/)0 CO
ow00
O:D 0
9-0 0 P6-
6 6 6 6< C)I
(%) NOISNCdX

0
CCD
I I 000
00
ý4-
~CL -4
O> o<
-I-4
0 40
IL -0
0 x~
(%)~C 0OS~X

0
0 00
0
<1 00ý-C~l
LL - J-o
0wcn
Cl) ca
00
z 4.)
C) < -4)
U) 0 o C
U) 0) 4-
0 < I I
(%) NOcNdX

.0
oc
c.J U, L
0F0cc-44
0>'nU) co z
o 00
0;
o 44
00
0
ob,14
~666 66
()NOISNVdX2

Hanford Cold CapCalculated Adiabatic Temperature Rise
BO
0 50--
- 60
Ea) 40
U
Mixture CC16L)-- Mixture CCIOo 20 . . . Mixture CC20
0
0 5 10 15 20 25 30 35 40 45
Time, days
Figure 7. Calculated adiabatic temperature rise for mixtures CClO,
CC16, and CC20 as predicted by the semiadiabatic test

Hanford Cold Cap
Adiabatic Temperature Rise
60 1 t 1 1 1 1 1
U 50
.40
E
, U 30 Mixture CC20Mixture CCIS
U
-4 20
'-4
100 I I I I I I I 1 I
0 2 4 6 8 10 12 14 16 18 20
Time, Days
Figure 8. Adiabatic temperature rise for mixtures CC16 and CC20

Figure 9. Photograph of inside of physical model immediatelyafter placement of the first grout lift

C11
I H
(a) Plan view
3
',.6955 M6972
M6933~ - 6971
M6 950
M16946 - - I' 694
3M16941 - 6944
M'6940 M64
1
(b) Three dimensional
Figure 10. Drawing of physical model showing locationof strain meters

Carlson gage 'TREE' assembly N 1, Carlson gage layout
12- 12 6
14"
lift 3*
M M6953 M6971
16-
If t 2 60"
M6946 M69,19
16"
lift I-
6940 -vI I
14"
base lift
Fi[V'TICN VIFWu F. 0u ̀4 V1 o a
Figure 11. Layout drawing showing location of strain meters

Carlson aaoe TmRE assemrl -, , j aJC [ eIa avo)jJ
14'
"lift 3
I f t 3ill
16"
IftP2I • iT .... 60"
M ,6a9 ,4 , H'6 5 I( -4
S.................................. .. . . .. . . .. . . .. . . .
Ihft 1 i Ti
14"
base oft 1"
Figure 12. layout drawing showing location of strain meters

Carlson gage "TREE' assembly . 3, Carlson gage layout
- - - - - - - - - - -1-
14"
16"iift 2
M6948 M6952 5]
16"
lift 1
6942 M694I ,i
14'
base iift
ELEVATION VIEW
Figure 13. Layout drawing showing location of strain meters

-rs~hr, e , - -ermD 1oupeI layout
14"
lift 3 16 ,6
151
vt4 ... 16 "
143,
lift 2 60o
5- 6. 7 ,-
S.. . . . . . •t' . . . . . . . .. . . . . . . . .. . . . . . . . . 16 "
3*+lift 1
0.14"
base lift
V in top of lower Ift Locate all TO at I" to the north side of tree 3
* centered at this location ELEVATION VIEW
Figure 14. Layout drawing showing location of thermocouples

II•
Figure 15. Photograph of discharging groutfrom the batch plant and pug mill

PSW Vault Cold CapCompressive Strength Test Results
1600-
1400
1200.
C: 1000-
800-
6 00-
0
15 20005 10 15 20 25 30
Age (Days)
-s- 2 inch cubes --- Lift No.1 (4x8) -&- Lift No.2 (4x8)
Figure 16. Compressive strength from lifts in physical model

HANFORD COLD CAP PHYSICAL MODEL
CENTERLINE STRAIN MEASUREMENTS
500
- LIFT I-- LIFT 2
0 -- LIFT 3(nI
Z -5000
-1000
-1500 Ia:
-2000
-2500
0 10 20 30 40 50 60
TIME. DAYS
Figure 17. Centerline strain measurements plotted vs time

!4
SI /
Figure 18. Photograph of the surface of lift 1 at 6 days
of age, showing cracks

4)0 N I I I
0 C)i p
U) rr) cn4
< -j
0 00-im u
00ILLI
LL il 1
-rj
C))
cu 0)
Jo '3UfiV83dIW31

0 0
00
u --
ow Un
M 0Wi ( .- c4
000
C LA
II U.
00c <I
0I I? 0
toL Iu 0 m t
II- 3un-b)W3

0LD
ou -oEw) co
C) COU)J
0-0CY
U))-4;
00
(I)
,7r.- t-- '
000
4)
0u00 ~0
00

LO
0
0-0
w-in >-I
oL -i / 0
CL) D c.--C
< .. 0
1w CCi -
<0 ,. 1-
0-
01LL LL IsZ~-
"4-
t u0oto0.4-
oo (Nno~d

1-41-4
0
0OD 4-'
0 . Ufn 4)
>- EnU
CL D 0
000 '"
CZ 1-
0 U)
01 Inntld3

HANFORD COLD CAP PHYSICAL MODELLIFT1 CARLSON GAGES: M6940;M6941:M6942
140
1200
100CCLii
7 - M6940W---- M6941
M6942
60-0 20 40 60 80 100 120
ELAPSED TIME. DAYS
Figure 24. Plot of temperature vs time recorded by strain metersduring grouting of lifts in the physical model

HANFORD COLD CAP PHYSICAL MODELLIFTI CARLSON GAGES: M6940;M6941;M6942
500
0 -- M6940--- M6941
.M6942
z -5000-J-J
S -1000
z< -1500I-Iin
-2000
-25000 20 40 60 80 100 120
ELAPSED TIME, DAYS
Figure 25. Plot of strain vs time recorded by strain meters duringgrouting of lifts in the physical model

HANFORD COLD CAP PHYSICAL MODELLIFT2 CARLSON GAGES: M6946:M6947;M6948
140
1200
uiDF- 100c -- M6946
-M6947w M6948
80
601 I I I I0 20 40 60 80 100 120
ELAPSED TIME, DAYS
Figure 26. Plot of temperature vs time recorded by strain metersduring grouting of lifts in the physical model

HANFORD COLD CAP PHYSICAL MODEL
LIFT2 CARLSON GAGES: M6946:M6947;M6948
500
0 - M6946U--- W6947
M6948z0 S-500
-J
I--en -1500
S-1 00 --- -- '-. - -
-200010 20 40 60 80 100 120
ELAPSED TIME. DAYS
Figure 27. Plot of strain vs time recorded by strain meters duringgrouting of lifts in the physical model

HANFORD COLD CAP PHYSICAL MODELLIFT3 CARLSON GAGES: M6953:M6955;M6958
160
140
L-
LU 120cc
W 100
Li - M6953
---- M695580 M6958
60 I 10 20 40 60 80 100 120
ELAPSED TIME. DAYS
Figure 28. Plot of temperature vs time recorded by strain metersduring grouting of lifts in the physical model

HANFORD COLD CAP PHYSICAL MODELLIFT3 CARLSON GAGES: M6953;M6955; M6958
500
- - M6953cn--- M6955
S .... M6958Z0I-
I-j
-500
-1000
-1500 1 1 ' 1 1 I
0 20 40 60 80 100 120
ELAPSED TIME. DAYS
Figure 29. Plot of strain vs time recorded by strain meters duringgrouting of lifts in the physical model

uiA.'WORD COLD CAP FHYSICAL ,ODEL
LIFT1 C,-.RLSON GAGES: 146943; V6944' N6945
' 4 ,' .. . .. . - . - , -
0
- 12-6943
- - --. M 944130 --- 694
Li 12 00
"-" '00
;,.-.. 90L
80
0 20 40 60 eo ý00 220
Figure 30. Plot of temperature vs time recorded by strain meters
during grouting of lifts in the physical model

HA;,NFORD COLD CAP P-HYSTCAL MODELLIF'T CARL.SO:.; GAGES: M6943; %169&14, 6945
5 0 0 F . . . . . . . . . . . . . .. . . . . . -
--- M6943-.... M6944
0 -- 1M6945
-500.-J
_.J
t-- -:oo
--_5004-
-20 0)0 L .... .J . . . . .. ... . . . .. . 1 . . .
0 20 40 60 s0 :00
,LASPED "7kME DAYS
Figure 31. Plot of strain vs time recorded by strain meters duringgrouting of lifts in the physical model
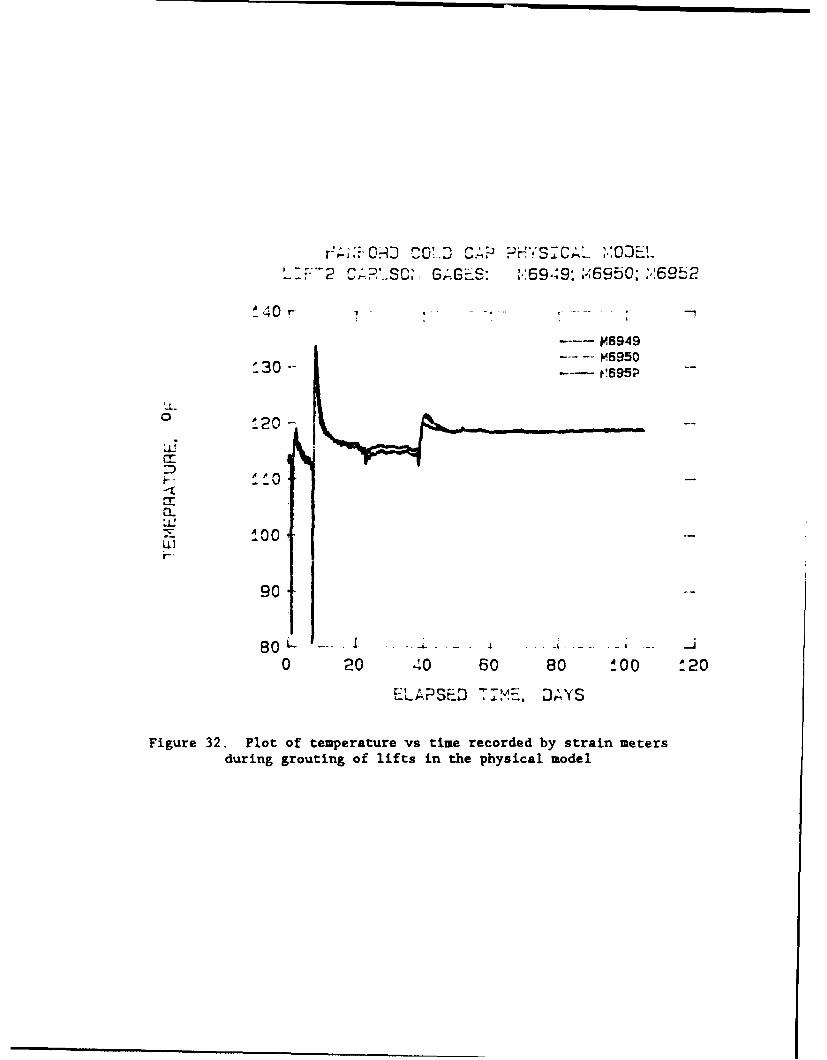
LZ '72 C,.R.SC;, GG:.6S: 6169449; ;46950: 6952
"40,
V,6949' 30 M5•:950
03
o 0
CL: 1100ILl
90
0 20 40 60 80 !00 ý20
'PSED , X"-:. DAYS
Figure 32. Plot of temperature vs time recorded by strain metersduring grouting of lifts in the physical model

HANFORD COLD CAP PHYSICAL MAODEL
LIFT2 CARLSOjN GAGES: 16949: M6950: M6952
2 0 0 r r,
569490 .. . ;6 9 5 0
En ----- P6952
-200-0
-600 -
-800-I--
200 0 -
0 20 .10 60 80 A00 '20-' ,SPED 7-r-,•
Figure 33. Plot of strain vs time recorded by strain meters duringgrouting of lifts in the physical model

.,-,-ORD COLD rPý.P "R-.S... "- -" 0 -
LFT3 C RLSO: GAG S: "69" Y-692: ':697
M697,!3 - - ?H69"7.3 0 M6972
.H6973
-20 -
-r0"2D
UL%: ý00i,--
90
8 0 L... ... -.J
0 20 40 60 80 100 "20
EZAPSED -,-,E. DA.YS
Figure 34. Plot of temperature vs time recorded by strain metersduring grouting of lifts in the physical model

HANYFORD COLED CAP PHYSICAL. W.ODE1.LIFT3 CAR.SOt, GAGES: 69":: p-6972; N!6973
200 , l .. T l
-M697I
- - -- ,69 7 2
U) . 169 "3
-200-
--400-7
'-A-
-600--
0 20 40 60 80 .00 20
EiiSPED -iF.. DAYS
Figure 35. Plot of strain vs time recorded by strain meters duringgrouting of lifts in the physical model

>;~FORDC02'- CAP HSI->Ji.JF C 3 C4RLSO:" G*-GES: .6958: %.69T3
60 . -
"-4 0 -
0
I 20
j0 00
• ----- 6958
80
6 0 L . . ....-. - . - . . .- J. .
0 20 40 60 800f00 f20E , t ' _ A Y S
ELAPSED TiDP
Figure 36. Plot of temperature vs time recorded by strain meters
during grouting of lifts in the physical model
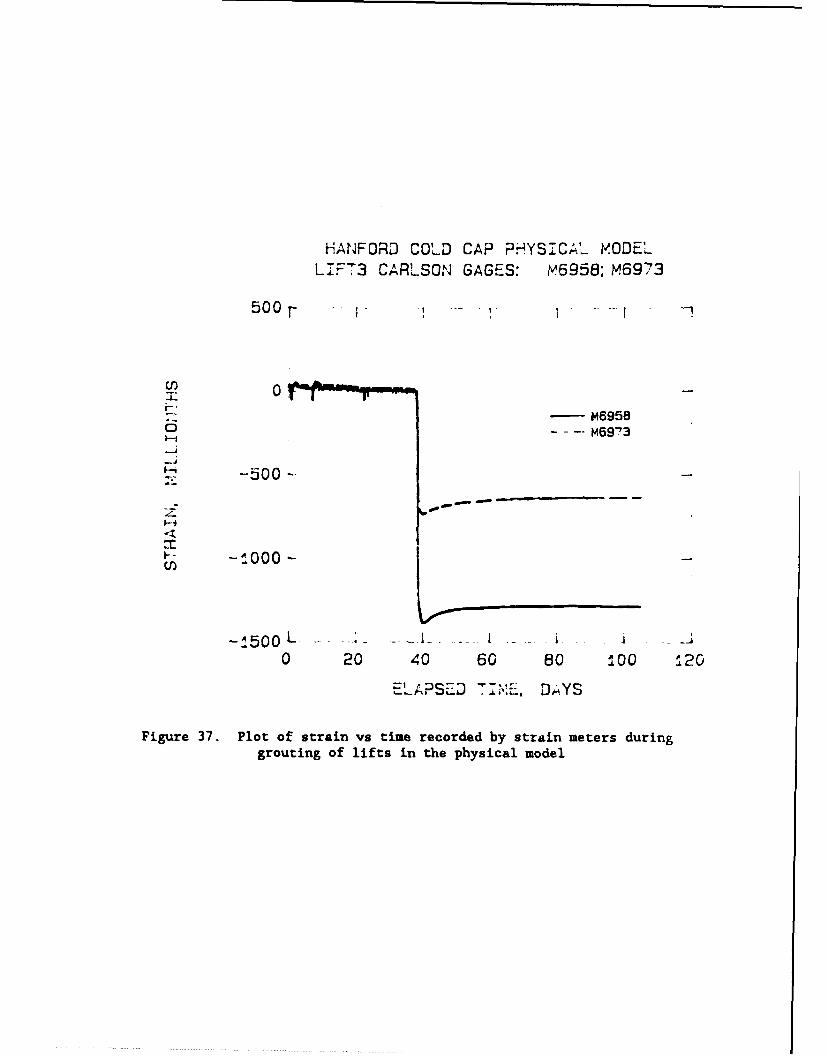
HANFORD COLD CAP PHYSICAL iM.ODELL FT3 CARLSON GAGES: M6958;M6973
500 F.. . -I ' . .I. .
M 0,--- M6958
M6973
F-J
U-5000--
-1 5 0 0 L. ...; ....0 20 40 60 80 00 120
ELAPSID TIME, DAYS
Figure 37. Plot of strain vs time recorded by strain meters duringgrouting of lifts in the physical model

AUi.,;FOR: COLD C,.P HYSC'. ":OB.L?-2 CARLSO;. GAGES: ,,'6948;: ",6952
4 0-t
"-30 -
"20- . -
-- !
S"1-00LUt --0 P6948a3. •-- !6952
F- 90
80
7 0 L . 4..0 20 40 60 80 100 20
ELAPSED ""' DYS
Figure 38. Plot of temperature vs time recorded by strain metersduring grouting of lifts in the physical model

HAý-ORD COL-D CA-P PHYSIC" X.ODEL.LIFT2 CARLS0n; GAIGES: .'6948: .'6952
cn
- VI,69480 .... M6952
-500-
""-.000
1-0
2.)
-2000 L _ .... .0 20 40 60 80 A-00 0 20
EL-APSED TIME. DAYS
Figure 39. Plot of strain vs time recorded by strain meters duringgrouting of lifts in the physical model

HANFORD COLD CAP PHYS&CAL .ODEL
L IFT CARLSOn GAGES: M6942: M6945
0
20o
•. 100
--- �M6942
M •6945
6 00 20 40 60 80 :00 :20
ELAPSED TIME. DAYS
Figure 40. plot of temperature vs time recorded by strain meters
during grouting of lifts in the physical model
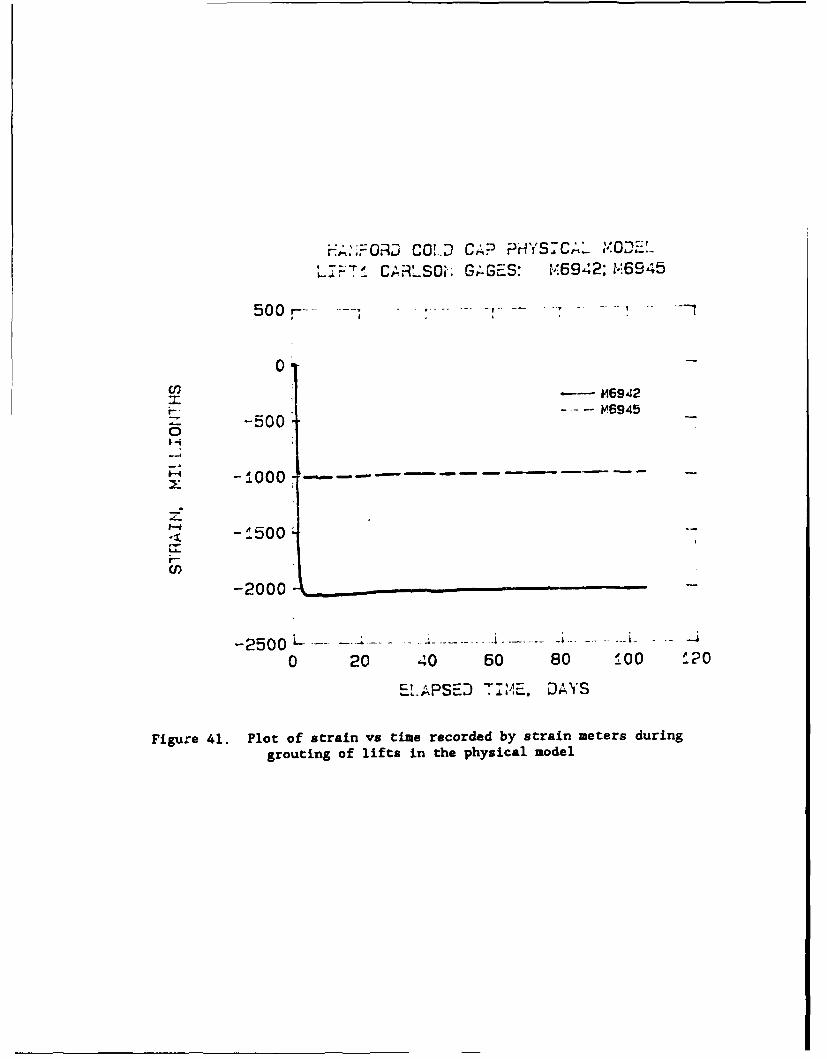
F•.:;FORD COLD CAP PHYSICAL "OJ"IT CAR._SO., G6GES: .,!6942: 1-6945
500 r- . . .. - . . ....
0
-. M .6945
"-5000
IAOO-- j
.:x .500 "-r-I
-2000
-25000
0 20 40 60 80 100 20
A PAPSED T771E. DAYS
Figure 41. Plot of strain vs time recorded by strain meters duringgrouting of lifts in the physical model

.. U'FRt. CO! D C" PHYS:`AL' ','ODE'L T3 C iSO'I GAGES: 1,6955: 1!69":)
!L M6955M.*- ~6972
0L2
0 20 40 60 80 f 0 0 20
ELAP-'-SED 71>'E. DAYS
Figure 42. Plot of temperature vs time recorded by strain metersduring grouting of lifts in the physical model

HANFORD COLD CAP PHYSICAL MODEL
LIFT3 CARLSON GAGES: N16955; M-6972
5 0 0 F .. r T.. .
S-- 1M6955M. 46972(12
I-
-500--r_J
F- -4000-S -15000
-j 5 0 0 L . .. . . .... .,.. ........ ...... • .. ... . . ._J
0 20 40 60 eo 0o0 120
ELAPSED TI1,,E. DAYS
Figure 43. Plot of strain vs time recorded by strain meters duringgrouting of lifts in the physical model
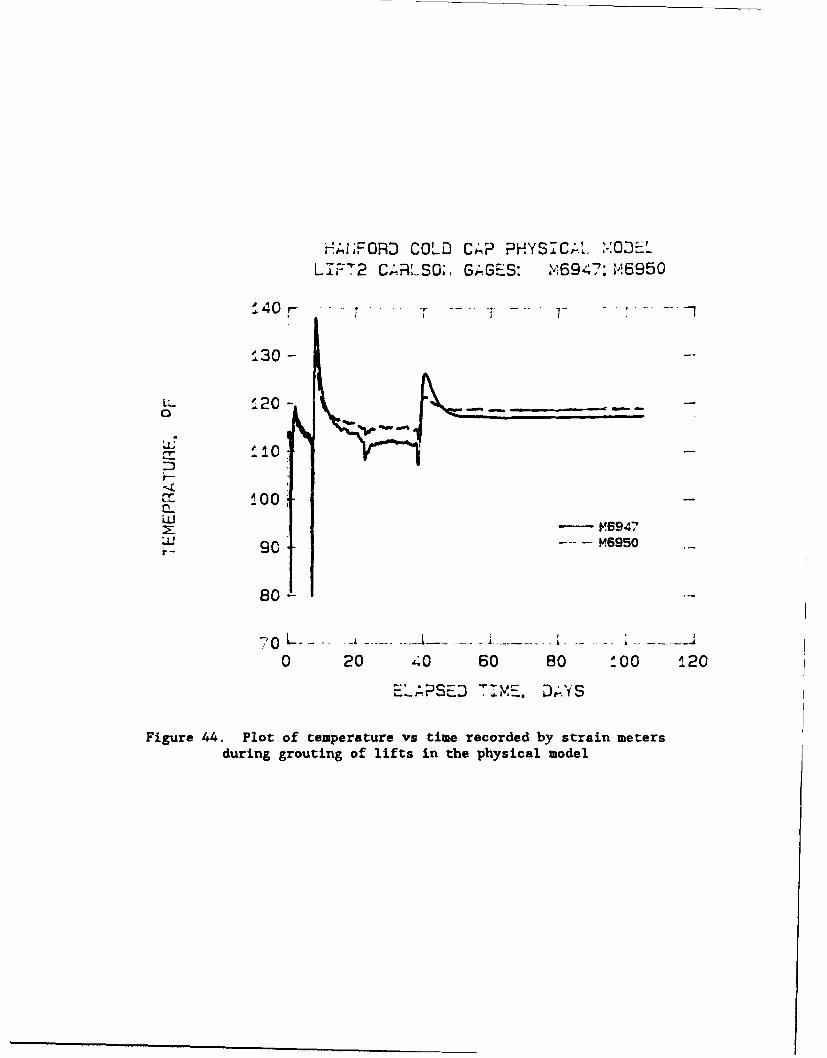
HAi;FORD COLD CAP PHYSICA.L >O "LIFT2 CAitLSO;, GAGE.S: ',16947: M,6950
"130 -
U_8 120-
CC 00LU V 9 7LUt ... 6950i-- 90
80O
0 20 40 60 80 1_00 120
ELAPSED TD , DAYS
Figure 44. Plot of temperature vs time recorded by strain metersduring grouting of lifts in the physical model
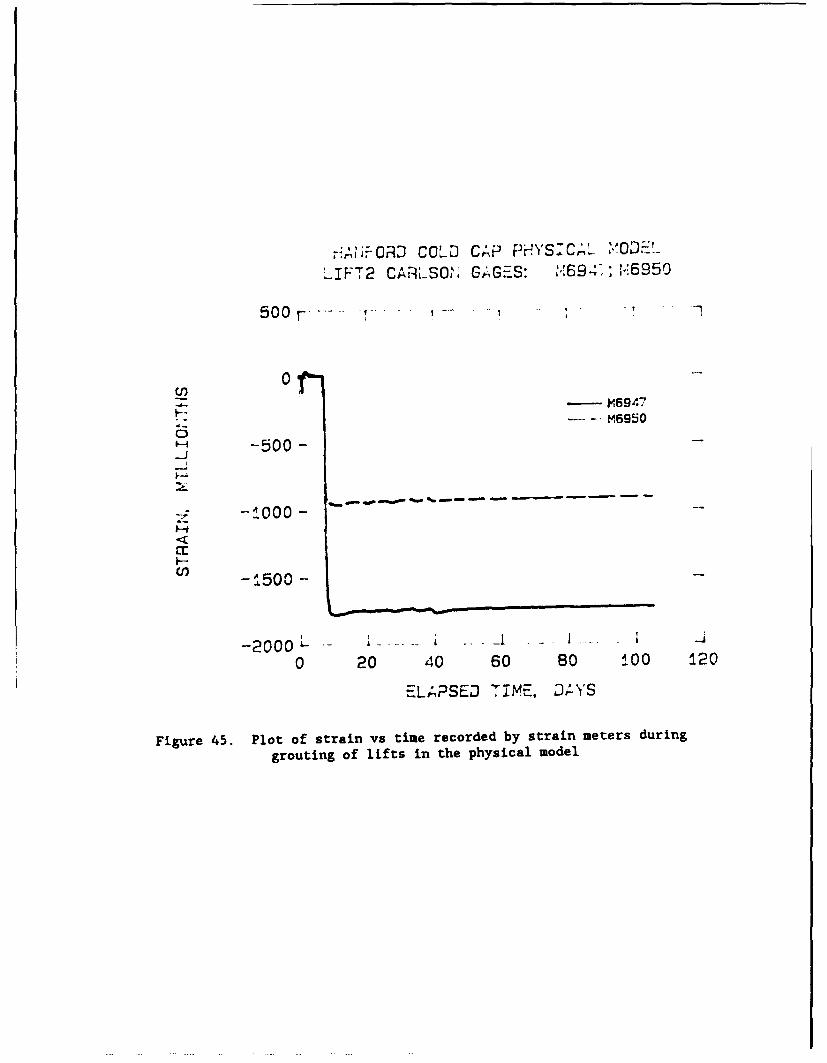
r-:•iAOR COLD CAP PHYSCAL ',nO-
LIFT2 CALSO1; GAGES: i694.; t6950
500 F .. .. 7... '-
0(n. -- M6947
-.. -M6950
0-500-
- O00 -
H
Cn -1500 -
- 2 0 0 0 L . .. .. i . . . . I .. . .
0 20 40 60 80 .00 120
ELAPSED TIME. DAYS
Figure 45. Plot of strain vs time recorded by strain meters during
grouting of lifts in the physical model

HANFORD COLD CAP PH'(SCAL. MODELL CFT A CARLSO>J GAGES: M694 ;: M6944
"20 -- --,-
"00CC
LuJ S"---'-- i6941
S.... M6944
60L
6 0 L -_ _ . . .. . 1 IA I _
0 20 40 60 80 00 120
ELASPIED TM•,E. DAYS
Figure 46. Plot of temperature vs time recorded by strain metersduring grouting of lifts in the physical model

0 ... RD COLD CAP PHYS.T.C, M 0 DLIF? 7_ CRSO,' G GGES: "694. 16944
500 7- ,. ,-
00 -'1
00
j-4
- --- ------ - -694
-2000.
0 20 00 60 80 00 '120
ELSPED T:i-.'E. DP,.S
Figure 47. Plot of strain vs time recorded by strain meters duringgrouting of lifts in the physical model

HANFORD COLD CAP PHYSICAL MODELLIFT3 CARLSON GAGES: M6953;M6971
140,
130 -
J20
wS--M6953
w- - 46971I-90
80
0 20 40 60 80 ±00 120
ELAPSED TIME. DAYS
Figure 48. Plot of temperature vs time recorded by strain metersduring grouting of lifts in the physical model

HANFORD COLD CAP PHYSICAL MODEL
LIFT3 CARLSON GAGES: M6953;M6971
200
- M6953
Cl, -- 6971I 0
z0-J-J
-200
-400
-600 L0 20 40 60 80 100 120
ELAPSED TIME. DAYS
Figure 49. Plot of strain vs time recorded by strain meters duringgrouting of lifts in the physical model

HANFORD COLD CAP PHYSICAL MODELLIFT2 CARLSON GAGES: M6946;M6949
140 ____1_1
1•20 ...........
LLa: 110
c 100
NM946W0- M6949
90
80j70 , I
0 20 40 60 80 100 120
ELAPSED TIME, DAYS
Figure 50. Plot of temperature vs time recorded by strain metersduring grouting of lifts in the physical model

HANFORD COLD CAP PHYSICAL MODELLIFT2 CARLSON GAGES: M6946:M6949
200 1 1 1 I
0- M6946
c- -M M6949Z -200z0
-j -400
-600
S-800
-1000
-1200 I I I0 20 40 60 80 to0 120
ELAPSED TIME, DAYS
Figure 51. Plot of strain vs time recorded by strain meters duringgrouting of lifts in the physical model

HANFORD COLD CAP PHYSICAL MODELLIFT1 CARLSON GAGES: M6940:M6943
140
130
U- 120
tHO
c 100wa-
S1M6940w 90 --- M6943
80
70- I I I
0 20 40 60 80 100 120
ELAPSED TIME, DAYS
Figure 52. Plot of temperature vs time recorded by strain metersduring grouting of lifts in the physical model

HANFORD COLD CAP PHYSICAL MODEL
LIFTI CARLSON GAGES: M6940;M6943
200
0
cnM6940r - M6943
S.-200z0
-J -400
I
-600
cc -BOO --
Sb - -
= -800
--1000
-12000 20 40 60 80 100 120
ELAPSED TIME. DAYS
Figure 53. Plot of strain vs time recorded by strain meters during
grouting of lifts in the physical model
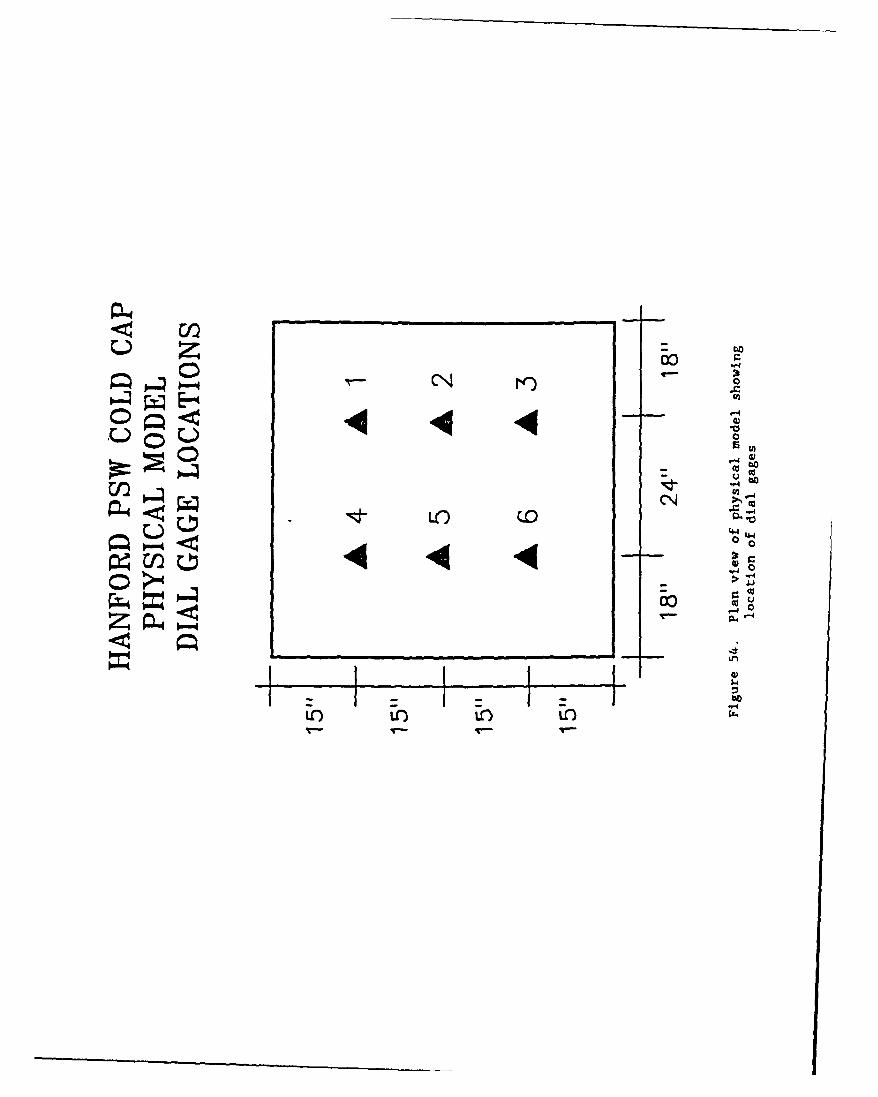
00q0-4
E-44
4 4 4 b002 -
CN P%
0 0
4 4-4N-4~ 0
LA)
I 0)I I- iq
O LO LO IO

HANFORD PSW COLD CAPVOLUME STABILITY VS TIME
0.03
Z 0.02--
Z 0 .0 1 - -... ...... ....... .. '2... .....
LL.. "" . L' ' •
w 0.00k l2-----iii
w -0.04 -_.......................
a-0.0
Figur 55 Delcto of.... the..... vault.urfacevs.tim
(wU AVG.
<: -0.03- .. ... .. ..LLCCD 0.04--- . . . ...
-0.051, -0 1 0 20 30 40 50 60 70 6C 90 100
DAYS
Figure 55. Deflection of the vault surface vs time

APPENDIX A:
PROPORTIONS OF EXPERIMENTAL GROUT MIXTURES TESTED DURING
GROUT DEVELOPMENT

MIXTURE 2B
Mixture Proportions Flow Properties
Material Lb/Cy Time (min) Flow (sec) Comments
Class H Cement 432 5 13.1 Compressive strength
at 7 days (140 °F) -Class F Fly Ash 980 15 11.5 1,900 psi
Masonry Sand 1,113 45 12.8Estimated volume loss
Bentonite 27 75 15.0 to bleed - 1 percent
Water 664 105 17.6
HRWRA 0.78
Retarder 0 oz
MIXTURE 3B
Mixture Proportions Flow Properties
Material Lb/Cy Time (min) Flow (sec) Comments
Class H Cement 486 5 11.0 Compressive strength
Class F Fly Ash 851 30 11.0 at 7 days (140 °F) -3,920 psi
Basalt Sand 1,215 60 11.0Estimated volume loss
Bentonite 27 90 11.2 to bleed - 8.7 percent
Water 664 120 11.3
HRWRA 1.1
Retarder 26 oz
A3

MIXTURE 3B-1
Mixture Proportions Flow Properties
Material Lb/Cy Time (min) Flow (sec) Comments
Class H Cement 468 5 14.0 Cast specimens after
Class F Fly Ash 826 30 14.5 1 hr. Mixture was toothick to use.
Basalt Sand 1,215 60 16.3Estimated volume loss
Bentonite 54 90 to bleed - I percentWater 664 120
HRWRA 1.1
Retarder 26 oz
MIXTURE 3B-2
Mixture Proportions Flow Properties
Material Lb/Cy Time (min) Flow (sec) Comments
Class H Cement 486 5 11.6 Estimated volume loss
Class F Fly Ash 845 30 11.6 to bleed - 4 percent
Basalt Sand 1,215 60 11.7
Bentonite 34 90 11.9
Water 664 120 12.0
HRWRA 1.1
Retarder 26 oz
A4

MIXTURE 5B
Mixture Proportions Flow Properties
Material Lb/Cy Time (min) Flow (sec) Comments
Class H Cement 486 5 15.0 Slight fallout ofaggregate untilClass F Fly Ash 851 30 15.0 30 minutes.
Basalt Sand 1,350 60 15.6Compressive strength
Bentonite 54 90 16.0 at 7 days (140 °F) -
Water 599 120 17.0 4,055 psi
HRWRA 2.43
Retarder 26 oz
MIXTURE 7B
Mixture Proportions Flow Properties
Material Lb/Cy Time (min) Flow (sec) Comments
Class H Cement 486 5 30 sec Aggregate fellout
Class F Fly Ash 1,586 30 excessively.
Basalt Sand 540 60 Estimated volume lossto bleed - 3.5 percentBentonite 27 90
Water 621 120
HRWRA 1.1
Retarder 26 oz
A5

MIXTURE 8B
Mixture Proportions Flow Properties
Material Lb/Cy Time (min) Flow (sec) Comments
Class H Cement 486 5 Did not test flow -
Class F Fly Ash 1,207 30 mixtures -xperiencedexcessive fallout and
Basalt Sand 810 60 bleed.
Bentonite 0 90
Water 675 120
HRWRA 1.35
Retarder 16 oz
MIXTURE 9B
Mixture Proportions Flow Properties
Material Lb/Cy Time (min) Flow (sec) Comments
Class H Cement 486 5 13.0 Cast specimens after30 minutes.
Class F Fly Ash 1,156 30 14.7
Basalt Sand 810 60
Bentonite 54 90
Water 675 120
HRWRA 3.0
Retarder 0 oz
A6

MIXTURE 1OB
Mixture Proportions Flow Properties
Material Lb/Cy Time (min) Flow (sec) Comments
Class H Cement 486 5 13.8 Slight fallout of
Class F Fly Ash 1,182 30 11.8 aggregate at 30 minutes.
Basalt Sand 810 60 11.9 No fallout after60 minutes of mixing.IBentonite 27 90 11.9
Water 675 120 12.0
HRWRA 2.67
Retarder 15.4 oz
MIXTURE 12B
Mixture Proportions Flow Properties
Material Lb/Cy Time (min) Flow (sec) Comments
Class H Cement 486 5 12.5 Slight fallout of
Class F Fly Ash 1,000 30 13.2 aggregate at 60 minutes.
Basalt Sand 1,280 60 14.0
Bentonite 13
Water 594
HRWRA 2.43
Retarder 13.5 oz
A7

MIXTURE lL
Mixture Proportions Flow Properties
Material Lb/Cy Time (min) Flow (sec) Comments
Class H Cement 432 5 12.0 Slight fallout of
Class F Fly Ash 967 30 12.0 aggregate at 30 minutes.
Limestone Sand 1,160 60 12.5 Compressive strength at7 days (140 °F) -Bentonite 54 90 13 2,330 psi
Water 664 120 13.6Estimated volume loss to
HRWRA 1.1 bleed - 2 percent
Retarder 23 oz
MIXTURE 4L
Mixture Proportions Flow Properties
Material Lb/Cy Time (min) Flow (sec) Comments
Class H Cement 468 5 13.0 Compressive strength
at 7 days (140 °F) -Class F Fly Ash 869 30 12.7 3,180 psi
Limestone Sand 1,215 60 13.0
Estimated volume lossBentonite 67.5 90 13.0 to bleed - 3 percent
Water 664 120 13.8
HRWRA 2.43
Retarder 31 oz
A8
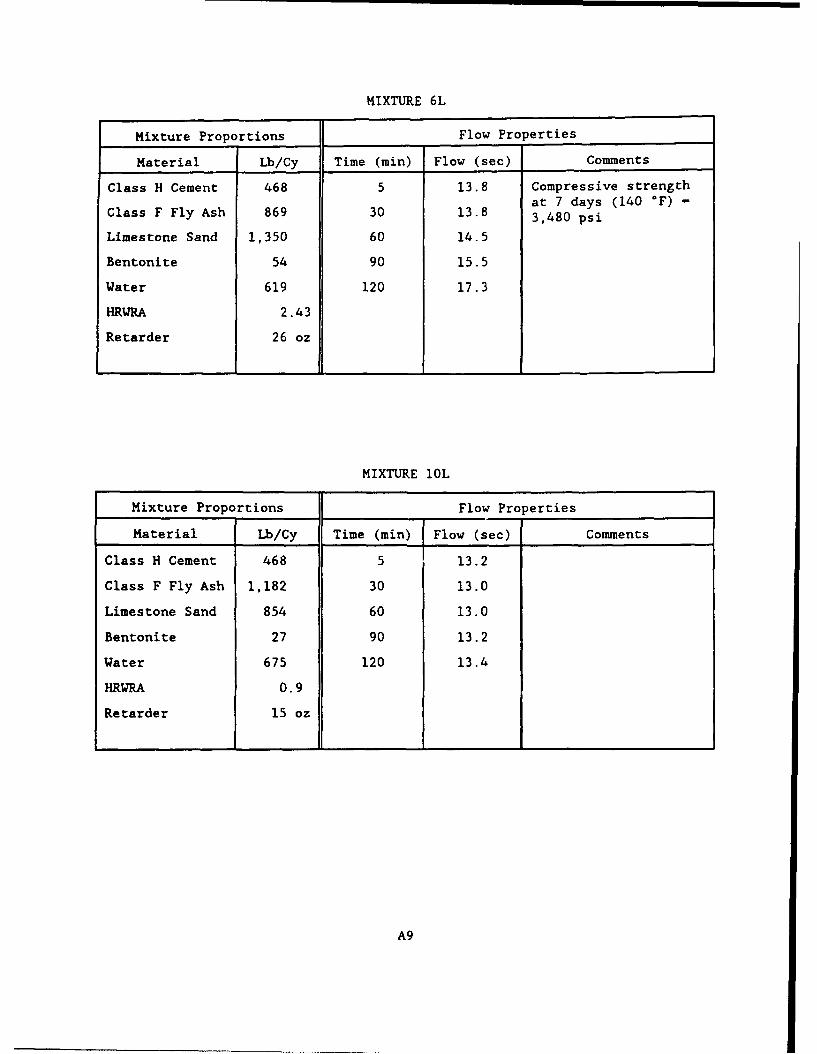
MIXTURE 6L
Mixture Proportions Flow Properties
Material Lb/Cy Time (min) Flow (sec) Comments
Class H Cement 468 5 13.8 Compressive strength
at 7 days (140 "F) -Class F Fly Ash 869 30 13.8 3,480 psi
Limestone Sand 1,350 60 14.5
Bentonite 54 90 15.5
Water 619 120 17.3
HRWRA 2.43
Retarder 26 oz
MIXTURE 10L
Mixture Proportions Flow Properties
Material Lb/Cy Time (min) Flow (sec) Comments
Class H Cement 468 5 13.2
Class F Fly Ash 1,182 30 13.0
Limestone Sand 854 60 13.0
Bentonite 27 90 13.2
Water 675 120 13.4
HRWRA 0.9
Retarder 15 oz
A9

MIXTURE IlL
Mixture Proportions Flow Properties
Material Lb/Cy Time (min) Flow (sec) Comments
Class H Cement 468 5 14.5 Specimens cast after60 minutes of mixing.
Class F Fly Ash 999 30 13.4
Limestone Sand 1,350 60 13.0
Bentonite 13 90
Water 594 120
HRWRA 2.43
Retarder 13.5 oz
MIXTURE 17
Mixture Proportions Flow Properties
Material Lb/Cy Time (min) Flow (sec) Comments
Class K Cement 500 5 11.2 Compressive strength
at 7 days (73 °F) -Class F Fly Ash 1,000 30 13.0 810 psi
Basalt Sand 1,233 60 12.5Specimens cast aiter
Bentonite 0 90 60 minutes of mixing.
Water 600 120
HRWRA 0
Retarder 0
AlO

MIXTURE 18
Mixture Proportions Flow Properties
Material Lb/Cy Time (min) Flow (sec) Comments
Class K Cement 500 5 13.6 Compressive strengthat 7 days (73 °F) -
Class F Fly Ash 1,000 30 13.8 880 psi
Basalt Sand 850 60 14.0
Bentonite 0 90
Water 750 120
HRWRA 2.6
Retarder 15 oz
MIXTURE 19
Mixture Proportions Flow Properties
Material Lb/Cy Time (min) Flow (sec) Comments
Class K Cement 400 5 12.2 Slight aggregate falloutat 5 minutes.
Class F Fly Ash 1,072 30 13.0
Basalt Sand 1,233 60 13.0 No fallout at 60 minutes.
Bentonite 0 90 Compressive strength at
Water 600 120 7 days (73 *F) - 700 psi
HRWRA 0
Retarder 12 oz
All

MIXTURE 20
Mixture Proportions Flow Properties
Material Lb/Cy Time (min) Flow (sec) Comments
Class H Cement 300 5 19
Class F Fly Ash 1,112 30 17.4
Basalt Sand 1,314 60 17.9
Bentonite 38 90 17.8
Water 564 120 18.6
HRWRA 4.86
Retarder 4.6 oz
MIXTURE 21
Mixture Proportions Flow Properties
Material Lb/Cy Time (min) Flow (sec) Comments
Class K Cement 607 5 27 Mixture not fluid
Class F Fly Ash 1,087 30 22 enough.
Basalt Sand 835 60 17.8
Bentonite 48 90 20.0
Water 677 120 16.8
HRWRA 10.3
Retarder 8.3 oz
A12

MIXTURE 22
Mixture Proportions Flow Properties
Material Lb/Cy Time (min) Flow (sec) Comments
Class H Cement 350 5 16.8
Class F Fly Ash 1,077 30 17.1
Basalt Sand 1,296 60 17.3
Bentonite 42 90 17.9
Water 571 120 19.3
HRWRA 5.4
Retarder 5.4 oz
Al3

APPENDIX B:
REPORTS FROM EXAMINATION OF CEMENT, AGGREGATES, AND INTERFACE
BETWEEN COLD-CAP GROUT AND SIMULATED WASTE

US Army Engineer SUBJECT: Petrographic Examination of a
Waterways Experiment Station Class H Oil Well Cement (HAN-I C-1)
3909 Halls Ferry RoadVicksburg, Mississippi 39180-6199 DATE: 22 March 1991
1. In March 1991, you requested a petrographic examination of a Class H OilWell cement received from the Lone Star Industries, Inc., Mary Neal, Texas.The cement was assigned the Structures Laboratory serial No. HAN-l C-1.
2. A composite of the as-received cement was examined by X-ray diffraction(XRD).
3. Approximately 5-g was treated for 30 min in a 20 percent solution ofmaleic acid in methanol. This test was done to remove the silicates, alite(C3S) and belite (C2S), from the sample. The insoluble material was collectedon filter paper, dried and weighed. The percent of silicates in the samplewere calculated. A composite of the residue was examined by XRD.
4. The residue left after the maleic acid treatment was next treated for onehour with a 10 percent solution of ammonium chloride (NH4Cl) in deionizedwater. This test will remove sulfates. The insoluble material was collectedon filter paper, dried and weighed. The percent of material lost was calcu-lated. A composite of the residue was examined by XRD.
5. The tests by selective dissolution to determine the percent of silicatesand sulfates in the sample showed that 81.7 percent were C3S and C2 S. Of the18.3 percent insoluble, 4.9 percent was lost during the NH4CI treatment.However, some MgO was lost during the NH4 CI test, as evidenced by the loss inintensity of MgO XRD lines after treatment with NH4Cl. A good estimate oftotal sulfates in the sample would be approximately three percent.
6. The crystalline phases present, as determined by XRD are:
Alite (C3S)Belite (C2 S)Calcium aluminoferrite (C4AF)MgOGypsum (CS.2H)Anhydrite (CS)Calcium sulfate hemihydrate (CS.l/2H)Quartz (tr)
A trace of potassium sulfate, and a trace of the substituted (NC8 A3 ) calciumaluminate was tentatively identified. Alite was the major phase.
WES FORM No. 1 1 15-ERev may 1990
B3

US Army Engineer SUBJECT: Examination of HAN-I S-3 Sand
Waterways Experiment Station
3909 Halls Ferry Road DATE: 8 March 1991
Vicksburg, Mississippi 39180-6199
1. A small plastic bag containing several pounds of basaltic sand from Acme
Materials, Richland, WA, was received for tests. A composite of the sand was
separated into six sieve sizes. The percent by weight of each size was deter-
mined (Table Bl).
2. X-ray diffraction was used to determine the mineralogy of sand collectedon sieve sizes No. 4 (4.75 mm), No. 100 (150 pm), and Pan (Table B2).
3. A stereomicroscope was used to examine the sand. Particle shapes weredetermined.
4. Selected particles from each sample were picked to be examined as immer-sion mounts prepared using an oil with a refractive index of n - 1.544. Themounts were examined with a polarizing microscope.
5. Chert was found. Some has an index of refraction lower than n - 1.544.
6. The examination showed that this sand, and sand HAN-i S-2 which was a
previous batch from Acme Materials, are similar. The color, mineralogicalcomposition, and shapes of particles are alike. The finer sieve fractions ofboth HAN-I S-2 and S-3 contain considerable quartz.
7. The characteristics of this natural sand make it suitable for use as afine aggregate for grout or concrete.
Table BI
Size Fractions by Weight of HAN-I S-3
Sieve Size Percent Contained
No. 4 (4.75 mm) 2.7
No. 8 (2.36 mm) 19.3
No. 16 (1.18 mm) 13.0
No. 100 (150 pm) 59.0
No. 200 (75 pm) 4.4
Pan 1.1
Total 100
WES FORM No. 1115-ERev May 1990
B4
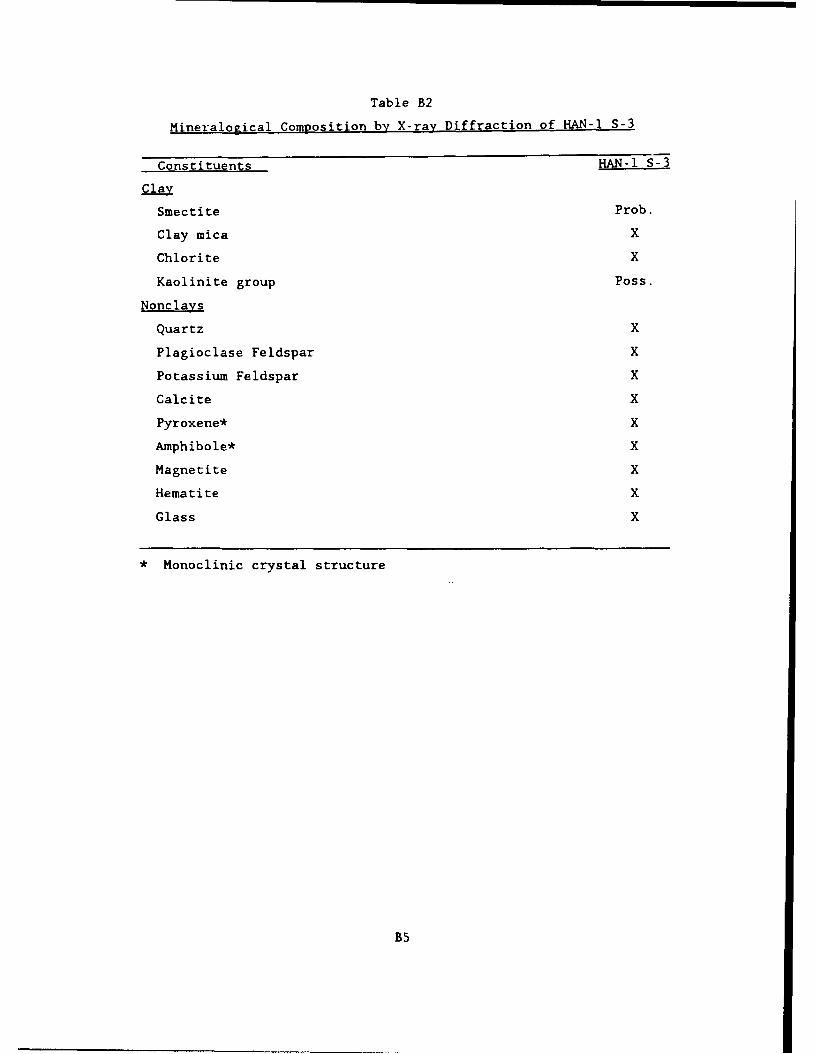
Table B2
Mineralogical Composition by X-ray Diffraction of HAN-i S-3
Constituents HAN-I S-3
Cl ay
Smectite Prob.
Clay mica X
Chlorite X
Kaolinite group Poss.
Nonclays
Quartz X
Plagioclase Feldspar X
Potassium Feldspar X
Calcite X
Pyroxene* X
Amphibole* X
Magnetite X
Hematite X
Glass X
* Monoclinic crystal structure
B5

US Army Engineer SUBJECT: Petrographic Examination of
Waterways Experiment Station Specimen CC-9, Hanford Cold-Cap Grout
3909 Halls Ferry RoadVicksburg, Mississippi 39180-6199 DATE: 3 April 1991
1. Background. Samples of interfaces between candidate cold-cap grouts CC-9
through CC-16 and simulated wasteform grout were examinated to determine char-
acteristics of the interface. Samples were laboratory-cast 2- by 4-in. cylin-
ders, the lower half of each being simulated wasteform grout. Interfaces were
studied for phase composition (X-ray diffraction (XRD)), chemical composition
(energy-dispersive X-ray (EDX)), and physical appearance (microscopy and scan-
ning electronic microscopy (SEM)). These studies revealed no notable differ-ences among all candidate grouts. Results of the studies of CC-9 and CC-11
interfaces are reported here as examples.
2. The interface between cold-cap grout and wasteform had a thin layer of
frothy material for both specimens. The frothy material was filled with airvoids. No bond was formed. Grout and wasteform fell apart when the two spec-imens were demolded. No evidence of fluid movement was found by visualexamination.
3. Examination of the froth by EDX showed sodium (Na) was a little high.Tables B3 and B4 gives a semiquantitative listing of chemical elements foundin froth from the cold-cap and wasteform, respectively.
4. Eleven EDX spectrum were made from a specimen of the cold-cap grout. Tenof the spectrum were collected within 5-mm of the interface with wasteform.One spectrum was collected near the top of the cold-cap, on opposite end fromthe wasteform. Figure BI shows the two spectrum that were collected at oppo-
site ends, superimposed to show that a phosphorus (P) peak is probably presentin the cold-cap grout at the interface, but not present at the other (top) endof the grout. Table B5 gives a semiquantitative listing of chemical elements
in one of the spectrum collected near the interface.
5. SEM examination of pieces of cold-cap and wasteform material showed C-S-Hgel was common to both materials. Small thin platelets of calcium hydroxide
(CH) were also present in both materials. Figures B2 and B3 shows some C-S-H
gel that was typical to both the cold-cap and wasteform, respectively. Fig-ure B2 shows thin platelets of what is probably CH in the top portion of the
photomicrograph. Figure B3 shows thin CH platelets in the lower right corner
of the bottom portion of the photomicrograph. The C-S-H gel in both have theType II reticular network morphology.
6. X-ray diffraction examination of the two froth samples examined showedseveral crystalline phases present. Ettringite, CH, and C-S-H gel were iden-tified by XRD. Tetracalcium aluminate carbonate-ll-hydrate (C 4ACH1 1 ) waspresent in the froth from the cold-cap, but not in froth from the wasteform.
Unhydrated portland cement and fly ash were present in both froth samples;
however, more was present in the cold-cap froth than the froth from wasteform.
7. Examination by XRD of a piece of wasteform, and a piece of the cold-capboth from near the contact zone, showed broad, but well defined peaks of C-S-H
WES FORM No. 1115-ERev May 1990
B6
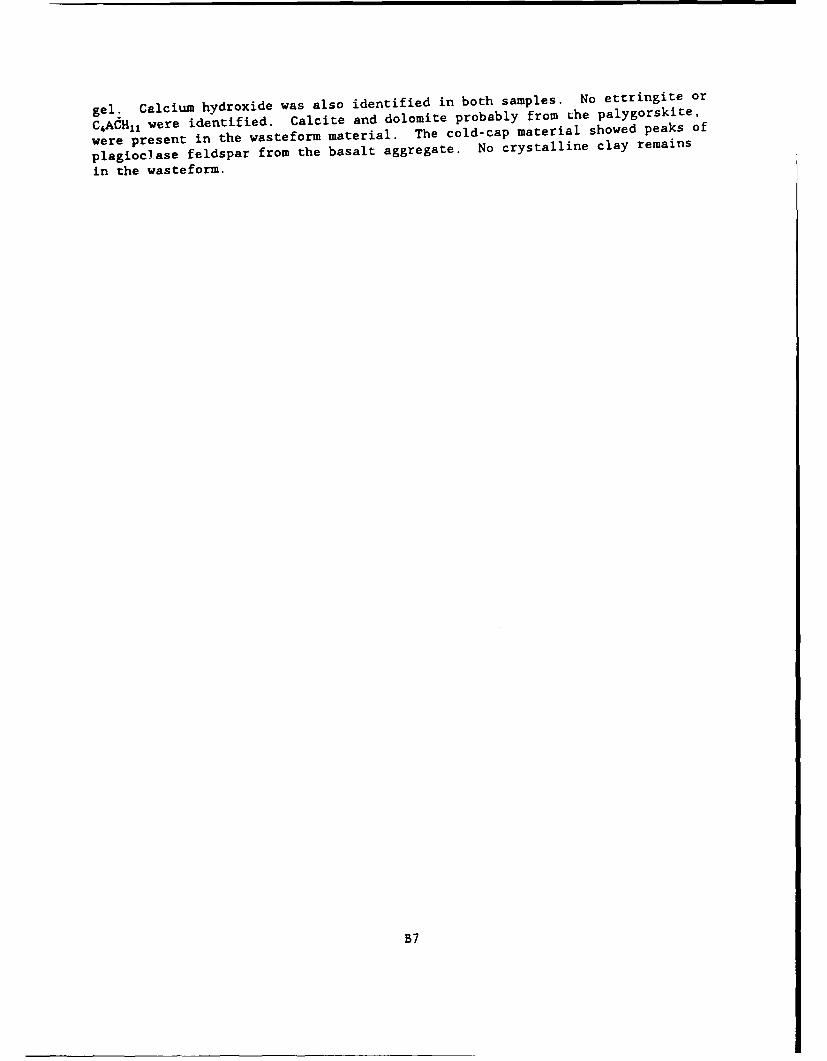
gel. Calcium hydroxide was also identified in both samples. No ettringite or
CACH11 were identified. Calcite and dolomite probably from Lhe palygorskite,
were present in the wasteform material. The cold-cap material showed peaks of
plagioclase feldspar from the basalt aggregate. No crystalline clay remains
in the wasteform.
B7

Table B3
FILE NAME: SPT DIGOIBLABEL: FROTH CC-9 COLD CAP GROUTSTORED ELEMENTS
CA NA MG AL SI P S K TI CRMN FE
X-AXIS LABEL: ENERGY (KEV)SPECTRUM STATUS:
LINEAR BACKGROUND SUBTRACTIONNOT FILTEREDSPECTRUM HAS BEEN PROCESSED BY QUANTSPECTRUM HAS NOT BEEN SMOOTHED
LIVE TIME (SEC): 100.00ACCELER. VOLT. (KEV): 21COLLECTION DATE: 3/28/91START OF SPECTRUM: 0.000END OF SPECTRUM: 20000.00NUMBER OF CHANNELS IN SPECTRUM: 2000BEGINNING OF QUANT DATATAKE OFF ANGLE [DEG]: 35TILT ANGLE [DEG]: 0PROBE CURRENT [AMPS]: 0.54E-09ELEMENT METHOD VALENCE K-RATIO WT %
CA K 2.00 0.23717 27.0491NA K 1.00 0.02617 6.3045MG K 2.00 0.01577 2.9587AL K 3.00 0.11234 17.6140SI K 4.00 0.20761 34.9049P K 5.00 0.00181 0.3858S K 6.00 0.00911 1.5108K K 1.00 0.01075 1.2684TI K 4.00 0.02036 2.6176CR K 3.00 0.00199 0.2384MN K 2.00 0.00000 0.0005FE K 2.00 0.04447 5.1472
# OF ELEMENTS ANALYZED BY QUANT: 12
B8

Table B4
FILE NAME: SPT DIG02BLABEL: FROTH CC-9 WASTE GROUTSTORED ELEMENTS
CA NA MG AL SI P S K TI CRMN FE
X-AXIS LABEL: ENERGY (KEV)SPECTRUM STATUS:
LINEAR BACKGROUND SUBTRACTIONNOT FILTEREDSPECTRUM HAS BEEN PROCESSED BY QUANTSPECTRUM HAS NOT BEEN SMOOTHED
LIVE TIME (SEC): 100.00
ACCELER. VOLT. (KEV): 21COLLECTION DATE: 3/28/91
START OF SPECTRUM: 0.000
END OF SPECTRUM: 20000.00NUMBER OF CHANNELS IN SPECTRUM: 2000BEGINNING OF QUANT DATATAKE OFF ANGLE [DEG]: 35
TILT ANGLE [DEG]: 0
PROBE CURRENT [AMPS]: 0.54E-09
ELEMENT METHOD VALENCE K-RATIO WT %
CA K 2.00 0.25001 28.4356NA K 1.00 0.03047 7.3835
MG K 2.00 0.01351 2.6007AL K 3.00 0.11262 17.8884SI K 4.00 0.18823 31.9687P K 5.00 0.00131 0.2720S K 6.00 0.01661 2.6992K K 1.00 0.00963 1.1313TI K 4.00 0.01936 2.4985
CR K 3.00 0.00091 0.1091MN K 2.00 0.00000 0.0000FE K 2.00 0.04328 5.0130
# OF ELEMENTS ANALYZED BY QUANT: 12
B9

Table B5
FILE NAME: SPT DIGO9BLABEL: HANFORD CC-9 COLD CAP GROUTSTORED ELEMENTS
CA NA MG AL SI P S K TI CRMN FE
X-AXIS LABEL: ENERGY (KEV)SPECTRUM STATUS:
LINEAR BACKGROUND SUBTRACTIONNOT FILTEREDSPECTRUM HAS BEEN PROCESSED BY QUANTSPECTRUM HAS NOT BEEN SMOOTHED
LIVE TIME (SEC): 88.84ACCELER. VOLT. (KEV): 21COLLECTION DATE: 3/29/91START OF SPECTRUM: 0.000END OF SPECTRUM: 20000.00NUMBER OF CHANNELS IN SPECTRUM: 2000BEGINNING OF QUANT DATATAKE OFF ANGLE [DEG]: 35TILT ANGLE [DEG]: 0PROBE CURRENT (AMPS]: 0.54E-09ELEMENT METHOD VALENCE K-RATIO WT %
CA K 2.00 0.30845 34.5640NA K 1.00 0.01341 3.6046MG K 2.00 0.01369 2.6290AL K 3.00 0.10644 16.8832SI K 4.00 0.18631 31.1610P K 5.00 0.00180 0.3663S K 6.00 0.00476 0.7607K K 1.00 0.00803 0.9168TI K 4.00 0.02097 2.7407CR K 3.00 0.00245 0.2959MN K 2.00 0.00031 0.0373FE K 2.00 0.05192 6.0406
# OF ELEMENTS ANALYZED BY QUANT: 12
B1O

r-, I
t4-
III
ti•. - A.1L,
-E i
Figure Bi. The dark portion is the spectrum collected at the top of cold-capgrout. The light portion is the spectrum collected near the interface ofcold-cap and wasteform. A slight peak at 2.013 key is probably P. Sulfur
is probably higher near the interface, also.
B11

I:i F',iire B2
Pnotomicrograph 1. Hanford CC-9cold-cap. The lower half is magni-fied X 5,000. The upper half con-sists of the area in the rectangle
magnified X 25,000. C-S-H gel withtype II reticular network morphologyis present. Thin platelets of CHappear to be present in the upperportion.
Figure 92
i }"~~ iir.'ur, B•
Photomicrograph 2. Hanford CC-9wasteform. The lower half is magni-
fied X 5,000. The upper half con-sists of the area in the rectangle
magnified X 25,000. Type II reticu-lar network morphology C-S-H gel ispresent. Thin platelets of CH arepresent in the lower right corner of
the micrograph.
Figure P,
I1 2

April 20, 1992From: Dr. Charles A. Weiss, Jr./J. Pete BurkesTo: Dr. Lillian WakeleySubject: Mineralogy and Chemistry of Longitudinal Core Samples Taken from Interface betweensimulated Waste and Cold-Cap Grout in Physical Model
X-ray AnalysisX-ray diffraction analysis of bulk samples revealed the presence of the following minerals from mostto least abundant.
(A) Cold Cap Distal from Interface (B) Interface - Cold Cap SideQuartz QuartzNa, Ca-Feldspar Na, Ca-FeldsparDiopside JCaMg(Si0 3)2M - minor Diopside [CaMg(SiO 3 21 - minorCa7SiO 4 (C2S) - minor Ca2SiQ4 (C2S) - minor
Dolomite - minor
(C) Material on Contact - Waste Side (D) Interface - Waste SideQuartz CalciteAlbite QuartzCalcite AragoniteHematite VateriteIron
(E) Waste Side Distal from Interface
Calcite
QuartzDolomite
In addition there is an amorphous component present in all the samples.
Elemental Analysis(E) Waste vs. (A) Cold Car (C) Material on Waste Side vs. (B) Cold Cap Interf.20% less SiO 2 6.5% less SiO24% less A120 3 2% more A12 0 3
I % more P20 5 1.5% more CaO22% more CaO 2.5% more Fe2O3
B13

(C) Material on Waste Side vs. (A) Distal from Cold Cap
3% less SiO2
2.5% more A120 3
1% less CaO
(C) Material on Waste Side vs. (D) Waste Interf.15.5% more SiO2
6% more A120 3
1% less P20 5
24% less CaO
On the waste side of the interface the 3 polymorphs of CaCO3, Calcite, Aragonite, and Vaterite areobserved. Since neither Vaterite, nor Aragonite are observed in any of the other samples, thisindicates that they were formed in situ and not transported from either the waste or cold cap. As withthe cold cap-9 samples, the carbonate minerals probably formed prior to the emplacement of the coldcap. The source for the Ca2' is the waste grout which has 37% CaO far from the interface and 40%CaO at the interface. The source of CO2 is most likely to be the air over the waste.
The other elements in the waste grout are minor compared to water Ca (37%), Al (13%), Si (35%),and Fe (4%) which are presumably derived from the solid components added to the waste, i.e., theType 1111 Portland Cement, the Class F Fly Ash, and the clays.
The material found adhered to the waste side of the interface was derived from the cold cap due tothe presence of Na, Ca-Feldspar which is only found in the cold cap. The elemental analyses
supports this hypothesis, because the chemistry more closely resembles that of the bulk chemistry forthe cold cap.
Dr. Charles A. Weiss, Jr. J. Pete BurkesGeochemist Geologist
B14

APPENDIX C:
PLOTS OF THE DATA FROM INDIVIDUAL STRAIN METERS

0
0
w0 'q2co
<½ x 0 U)
uj
a-tu 0
in cC- j a.
0I~ En0 u
00LLu
0 0 0 0 0 0 0 00 0 0 0 0 0 0
cu cu to c 0 cu
SHILNOIIIH 'NIV81S
C3

00000
I'-
7-0
1LO
0-4
0. 0
o _j w-1-J
C)W
oLL
cu
m CD co )
do0 '3UlIV83dW31
C4

0
0000
00
(n3
Iw LLE
u~ 0
U),0. -1
0 C
00LLJ
0Lf ) 0 Ifl 0 Wr)
I q-q-9Cu Cu
SHINOI-l-lI 'NIVUIS
C5

0C'U
0 'w
0~0
< 0
cc LL
<00
0 L)0
C6u

0Cu
w-
000 CN0
z 0
Lf3
u u CL
C) W
LLi
cru
LLL
0 0) 0 0 0 C0 0 00) C0 C 0C 0U-) ,0 -) 0O Ul
I q~ u Cu
SHINOI-IlIN 'NIVU.IS
C7

Cuj
0
00
-J t
0 u
0~
0-CI 00
a-zC00
u U,
a4: 4:
0 u
LL
00LCu
0C0 0 0cu 0 co to- W4
zlo '3uflJY3dW3J
C8

0
0 00 0
C31
U)CL x
0. z CD I-<~ 0
0 -1 w0 u
ua
0~LLz-
0 0 0 0 0 00 0 0 0 0Cu CNJ to a)
SHiNOI-llIW 'NIVUIS
C9

0
00
w
tolao U)
>- 0
cL. 0
u 0
U)U
CLf0au L4
0 L0
cu
0 0 00 0 c0 0
Jo '3Ufl1'V3dW31
CIO

0
0000
ED -
Iw LLU
0 tLO I--U) 0
cl _j Lw-i a: En
cfroLL
00
0r r 0
SHINOI-llIN 'NIVUIS
cil

Cu
-T74
0
w
C0
>-CD
< 0w
0 U
Cc,Low
Cu
-F 0
00 0 0 0 0 0 0m' Cu ýq 0 N.W, fl
J~o -3ufl1V83dW31
C12

0
0
w00
0 U')
to-zt0
>- C)
00
cc En
0 0
0 00-004
cu CIO0 ru
SHINOIIHI 'NIV81S
C13

0-T Cu
0 L000
ED m - n
00
,x )
< 0u U)
o-z w
<0 0c~C) W
C',
00
m ru 0 CD
:10 3Ufl1vb3dWr31
C14

0000
-i
< 0 nU) 0
>-4 0
a-z< zLD Iu 0
0 -1 w0 u
Cu0 I-cc LL0~LLz-
II
C15u

0
0 to
0 w
CYi
in~
LO I
a).
Cu ow
z-to
00
uC
00
0 0 0 00 0 0 amf ru q-4 0 ) 00 N
.d '3uflV83dW31
C16

00
0 q0
-J>
CL
u 0
U) 0
a: w0 C',
ccJc LL
4Lz
C17U

0
0W-4
cni j0
EDz 0
6-4
cLD
< 0
uC
00
Jo '3uf1Vd3dW31
C18
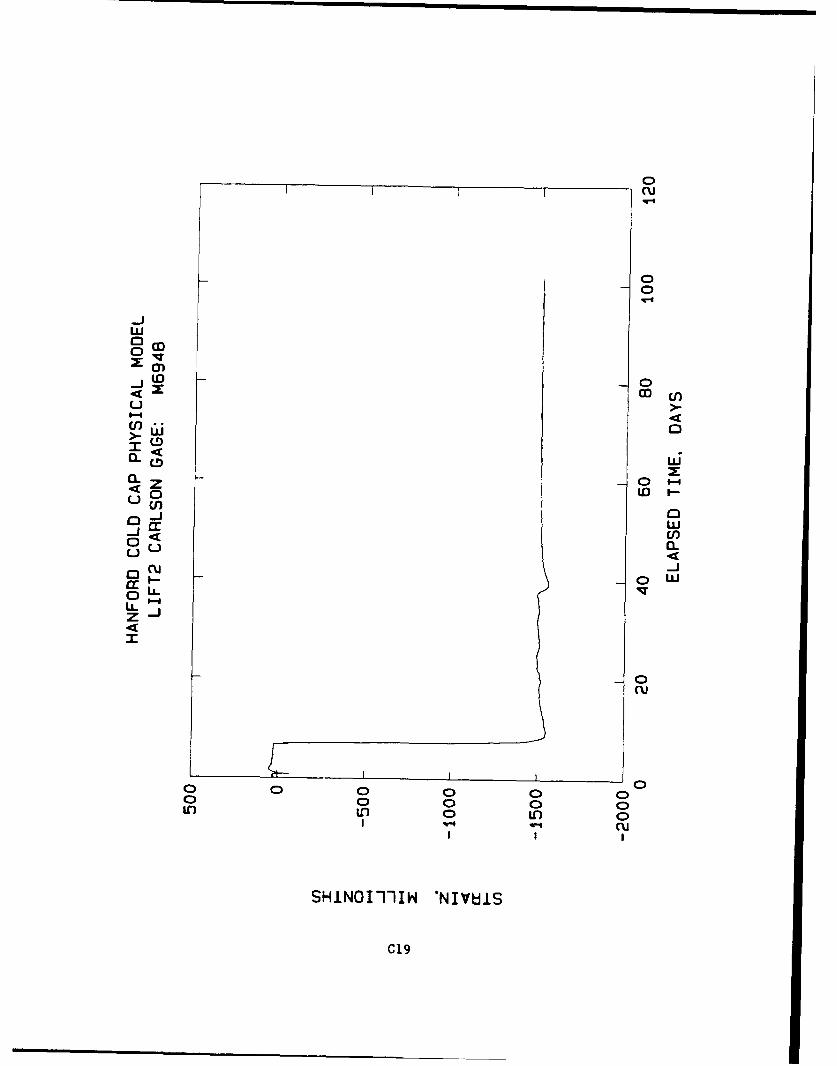
0Cu
000 c0
Iq-
0
1 cD
0 0 to
cl J 0
a:a
0 L0
Cu
0 0C0 0 0 000) 0 0 0 0IL30 ICO 0
SHINOIllII 'NIVUIS
C19

0
-T-
0 a00 I0
a)-
to
m cn
En~ 1 0~LD U
-0
z to~00_j wCc En<a
0 4
cc I
00U.U
0 0 0) 0 0 0) 0) 0m ruj 0) a co
Jo '3ufiV83dW31
C20

0cu
0)0
0M U)u >
1-4 <
in'
uC) to
-i w: Uf)
0LLz _j
Cg 0 C)(I
SHINOI1ThW 'NIVIBIS
C21

00
00
00
0o~
z ED-4 0
4i LL
0 M
Cu o
cc~0LL
ru
m cu Ol Go
AD '3BfiV83dW31
C22

0
00000
to -
00 U0u~
'< Ld
uin 0
0 < a.Cu
cc
z-
00
00 0 0 0 0Cu Cu to Go 0
SHINOI-llIW 'NIVUIS
C2 3

0cu
0
wcoc
0 U'0
x '-4
<L LdP
w
0~ <
C-,j
00
cu
0 0m Cu q40cl) co
q4W-1
J 3UfliV83dW31
C24

-q-
0 n000
U')g
-j -
gu
01
CLO
< z
u0 0 OcOI
CJI
LLfza
ru
C) 0 0 0 00 CC)0 0 0 0 0 0
SHINOI-llIW 'NIVUILS
C25

0 C~00 Lf0
-J>
En 0
C-,
Q. 0
uL 0
0 0uw
0 Cuo
0cm
0 0m cu -' 0 Ol coq-4 -q- V-4
-do '3ufl1V83dW31
C26

0clu
0-0
w
LOiCY) -0
x '-4
<L0 x
a--
00
uC
0 0 0) 0
CC2

Cl m
0 U'0Ol0LO co - p
xJw
cl)u
0U) w
C) W
(~00LL zU
0.4u
C28u
. ......... 0

Cu
0 LO0 U'0
6-4w
C~) 4~
00
CL z<Q 0
u U) 4
0 u
I-
00
cu
0
SHINOIIN NVUI
C29

I I Cu
0
00
0 L0
to - 0
UU
C-J
00
d~Cu
0 00 0
0 C30
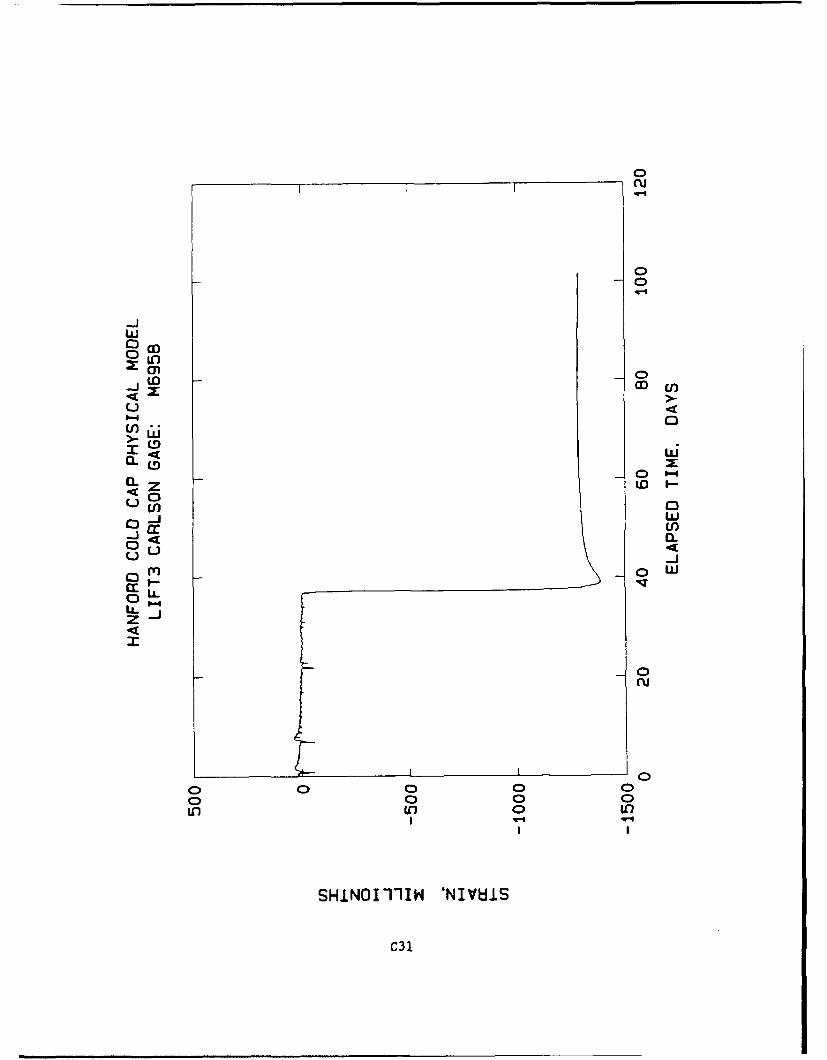
0
0 CID0 U'0
-J -co U
00
< LiiCL 0
<o z00
U 0~
ow
Ccu
0 0
I Ii
SHINOIlIIN 'NIVUIS
C31

Cu
toJ-
co c
>- 0X <
Q- 4 (
< 0
0 -1 w
<0-J
00
cu
0 0 0 0 00to I0 cC
W-4 W-4-.-
Jo '3uflJVb3dW3I
C32

0Cu
0
M 0tD
co - n
xJw
< 0dU)i
ouc0 0
(I-
ccn
~LL
00 0 0 0 00 0 0 0 0
SHINOI-llIW 'NIVUIS
C33

0cu
LU
C-,ED 0
0
az (D-u 0 0
EnLU,C) j 0n
a: M<~,o
L) L
C34>

0l
00
-LJ
1LD C
z 0
U)
Cr) 0 Z
00LLu
fl C C) CD
SHINOIlIIN 'NIV8IS
C35

00
u-ic'J0 N
LO -0
4 00 w
Q0-az -
00
cc in0 L)
LLL
00Ccu
0 U0
q rncu -0 (7) CI
Jo '3UfiV83dW31
C36

0I I ICu
0 r00 r0
1-4
LID
u- 0
0~ -1
0 u~0 4-
0,~IU-z-
0cu
0 00 0 0 0
mcu U3 c
SHJ.NOIIHI 'NIVtBIS
C37

0(U
0
0 0
ZCY 0
>- 0Du
0
u ~LUUl
00LLU
0 0 0
qqm cu 0 0Y) CC)
C', - -
Related Documents


![Laparoscopic vaginal vault closure with conventional ... · vagina [3]. The most difficult procedure of laparoscopic surgery is su-turing. ... scopic vaginal vault suture is the final](https://static.cupdf.com/doc/110x72/5cc0fefe88c9933e3a8b76c5/laparoscopic-vaginal-vault-closure-with-conventional-vagina-3-the-most.jpg)