Group modeling: Selecting a sequence of television items to suit a group of viewers Judith Masthoff University of Brighton, UK [email protected] Abstract. Watching television tends to be a social activity. So, adaptive television needs to adapt to groups of users rather than to individual users. In this paper, we discuss different strategies for combining individual user models to adapt to groups, some of which are inspired by Social Choice Theory. In a first experiment, we explore how humans select a sequence of items for a group to watch, based on data about the individuals’ preferences. The results show that humans use some of the strategies such as the Average Strategy (a.k.a. Additive Utilitarian), the Average Without Misery Strategy and the Least Misery Strategy, and care about fairness and avoiding individual misery. In a second experiment, we investigate how satisfied people believe they would be with sequences chosen by different strategies, and how their satisfaction corresponds with that predicted by a number of satisfaction functions. The results show that subjects use normalization, deduct misery, and use the ratings in a non-linear way. One of the satisfaction functions produced reasonable, though not completely correct predictions. According to our subjects, the sequences produced by five strategies give satisfaction to all individuals in the group. The results also show that subjects put more emphasis than expected on showing the best rated item to each individual (at a cost of misery for another individual), and that the ratings of the first and last items in the sequence are especially important. In a final experiment, we explore the influence viewing an item can have on the ratings of other items. This is important for deciding the order in which to present items. The results show an effect of both mood and topical relatedness. Keywords Group modeling, interactive television, social choice, adaptation, recommender 1 Introduction Interactive television offers the possibility of personalized viewing experiences. Different domains have been identified in which this personalization would have a great impact, such as education (Masthoff & Luckin, 2002), news (Maybury, 2001), advertising (Lekakos, Papakiriakopoulos & Chorianopoulos, 2001), and electronic program guides (Cotter & Smyth, 2000). Adapting television to individual viewers is a topic in itself, and a lot of research has already been done, particularly in the area of electronic program guides. This research tends to build on decades of work on content-based and social filtering. In this paper, we will explore an even more difficult issue: adaptation to a group of viewers. We believe this to be essential for interactive television as, in contrast to the use of PCs, television viewing is largely a family or social activity (Barwise & Ehrenberg, 1988; Kasari & Nurmi, 1992). Unfortunately, television-viewing statistics do not include data on the average number of people watching television together and who watches television with whom (as also noted by Gillard, 1999). It is very likely to be culturally dependent, as the number of televisions per household varies widely. According to a large research study in the UK (Livingstone & Bovill, 1999), television is the medium most often shared with family. Watching television together is top of the list of activities shared between parents and children, and more than two thirds of children watch their favorite programme with somebody else, nearly always family. Children most often watch with their siblings (Van Evra, 1998). Young people would like to watch television with friends, though (due to a lack of resource) many do not manage to do so (Livingstone & Bovill, 1999). Given the rising number of televisions in bedrooms it is likely that watching television with friends will be an increasingly popular activity. Already, television is the most popular conversation topic of young people with friends (Livingstone & Bovill, 1999). For these reasons, we believe that adaptive television should be able to adapt to groups of people watching together. These groups can be quite heterogeneous, and age, gender, intelligence, and personality influence what types of TV programmes people enjoy (Kotler, Wright & Huston, 2001; Gillard, 1999; Livingstone & Bovill,1999). The question then arises how one can adapt to a

Welcome message from author
This document is posted to help you gain knowledge. Please leave a comment to let me know what you think about it! Share it to your friends and learn new things together.
Transcript

Group modeling: Selecting a sequence of television items to suit a group of viewers
Judith Masthoff
University of Brighton, UK [email protected]
Abstract. Watching television tends to be a social activity. So, adaptive television needs to adapt to groups of users rather than to individual users. In this paper, we discuss different strategies for combining individual user models to adapt to groups, some of which are inspired by Social Choice Theory. In a first experiment, we explore how humans select a sequence of items for a group to watch, based on data about the individuals’ preferences. The results show that humans use some of the strategies such as the Average Strategy (a.k.a. Additive Utilitarian), the Average Without Misery Strategy and the Least Misery Strategy, and care about fairness and avoiding individual misery. In a second experiment, we investigate how satisfied people believe they would be with sequences chosen by different strategies, and how their satisfaction corresponds with that predicted by a number of satisfaction functions. The results show that subjects use normalization, deduct misery, and use the ratings in a non-linear way. One of the satisfaction functions produced reasonable, though not completely correct predictions. According to our subjects, the sequences produced by five strategies give satisfaction to all individuals in the group. The results also show that subjects put more emphasis than expected on showing the best rated item to each individual (at a cost of misery for another individual), and that the ratings of the first and last items in the sequence are especially important. In a final experiment, we explore the influence viewing an item can have on the ratings of other items. This is important for deciding the order in which to present items. The results show an effect of both mood and topical relatedness. Keywords Group modeling, interactive television, social choice, adaptation, recommender
1 Introduction
Interactive television offers the possibility of personalized viewing experiences. Different domains have been identified in which this personalization would have a great impact, such as education (Masthoff & Luckin, 2002), news (Maybury, 2001), advertising (Lekakos, Papakiriakopoulos & Chorianopoulos, 2001), and electronic program guides (Cotter & Smyth, 2000). Adapting television to individual viewers is a topic in itself, and a lot of research has already been done, particularly in the area of electronic program guides. This research tends to build on decades of work on content-based and social filtering. In this paper, we will explore an even more difficult issue: adaptation to a group of viewers. We believe this to be essential for interactive television as, in contrast to the use of PCs, television viewing is largely a family or social activity (Barwise & Ehrenberg, 1988; Kasari & Nurmi, 1992). Unfortunately, television-viewing statistics do not include data on the average number of people watching television together and who watches television with whom (as also noted by Gillard, 1999). It is very likely to be culturally dependent, as the number of televisions per household varies widely. According to a large research study in the UK (Livingstone & Bovill, 1999), television is the medium most often shared with family. Watching television together is top of the list of activities shared between parents and children, and more than two thirds of children watch their favorite programme with somebody else, nearly always family. Children most often watch with their siblings (Van Evra, 1998). Young people would like to watch television with friends, though (due to a lack of resource) many do not manage to do so (Livingstone & Bovill, 1999). Given the rising number of televisions in bedrooms it is likely that watching television with friends will be an increasingly popular activity. Already, television is the most popular conversation topic of young people with friends (Livingstone & Bovill, 1999). For these reasons, we believe that adaptive television should be able to adapt to groups of people watching together. These groups can be quite heterogeneous, and age, gender, intelligence, and personality influence what types of TV programmes people enjoy (Kotler, Wright & Huston, 2001; Gillard, 1999; Livingstone & Bovill,1999). The question then arises how one can adapt to a

group of viewers, in such a way that each individual enjoys (and in educational programs, benefits from) the broadcast.
2 Strategies for combining user models
User modeling has been widely studied, particularly the modeling of user preferences (directly or indirectly via observation and inference) (see UMUAI journal, User Modeling conferences). In contrast, group modeling –combining individual user models to model a group– has hardly been investigated in our field. There are only three main adaptive systems that use it: MUSICFX (McCarty & Anagnost, 1998), POLYLENS (O' Conner, Cosley, Konstan & Riedl, 2001), and INTRIGUE (Ardissono, Goy, Petrone, Segnan, & Torasso, 2002). MUSICFX is used in a company's fitness center to select background music to suit a group of people working out at any given time. POLYLENS is a group recommender extension of MOVIELENS, which recommends movies based on an individual's taste as inferred from ratings and social filtering. It allows users to create groups and ask for a recommendation for that group. INTRIGUE recommends places to visit for tourist groups taking into account characteristics of subgroups within that group (such as children and disabled). Though some exploratory evaluation of MUSICFX and POLYLENS has taken place, for none of these systems it has been investigated how effective their group modeling strategies really are, and what the effect would be of using a different strategy. Besides, the application domains of both POLYLENS and MUSICFX differ from television viewing in the sense that these systems do not need to select a group of items: people normally only see one movie per evening, and music stations can play forever1. For INTRIGUE, on the other hand, it is quite likely that a tourist group would visit multiple attractions during their trip, but the selection of a balanced sequence has not been addressed yet. Our view on adaptive interactive television is that reasonably small video segments would be concatenated. The smaller the segments the more adaptation and real interactivity can take place. Though group modeling has hardly been studied in our field, the related issue of social choice (also called group decision making) –deciding what is best for a group given the opinions of individuals– has been studied extensively in economics, politics, sociology, and mathematics (see, e.g. Condorcet, 1785; Pattanaik, 1971; Taylor, 1995). Their construction of a social welfare function is very similar to our group modeling problem. Other areas in which the problem has been studied are Meta-Search, Database Middleware, Collaborative Filtering, and Multi-Agent systems. In Meta-Search, the ranking lists produced by multiple search engines need to be combined into one list (they call this the problem of rank aggregation). See, for instance, Dwork, Kumar, Naor, Sivakumar (2001), and Cohen, Schapire, and Singer (1999). Dwork et al. base their work on social choice theory, and use a variant of the method of Kemeny, which uses an extended Condorcet principle (see Section 2.2 for an explanation of the ordinary Condorcet principle, and why we object to it). In Database Middleware, objects have to be ordered where each object has numerical values for multiple fields (see for instance, Fagin, Lotem, and Naor, forthcoming). In Collaborative Filtering, preferences of a group of individuals have to be aggregated to produce a predicted preference for somebody outside the group. See Pennock, Horvitz and Giles (2000) for an explanation of how social choice theory applies to collaborative filtering. In multi-agent systems, agents need to take decisions that are not only rational from an individual’s point of view, but also from a social point of view. See Hogg and Jennings (1999) for a discussion of social rationality for agents and its links to Social Choice Theory. See Ephrati and Rosenschein, (1996) for how a social decision mechanism (namely the Clarke Tax mechanism) can be used to reach consensus between multiple non-cooperative (possibly cheating) agents. In this section, we will discuss some of the issues, and present a number of example strategies.
2.1 Focusing our problem and introducing an example
Assume the television has a set of items to choose from. These can be news items, quiz questions, MTV music clips, television programs, etc. For our discussion we will just call them items (and video clips in the experiments). Assume the television needs to adapt to a group of viewers. Assume the television knows who the viewers are, and the system has preference ratings for each of them (say from 10, really like, to 1, really hate).
1 This would have been different if MUSICFX selected individual songs rather than radio stations.
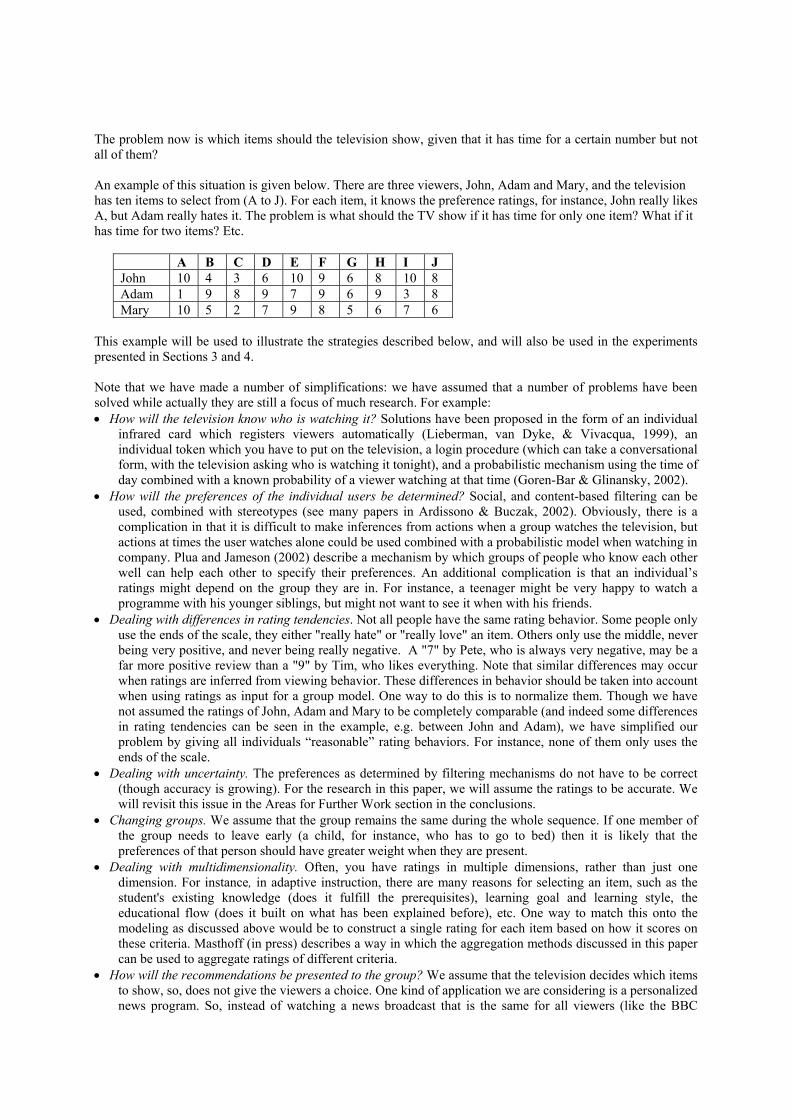
The problem now is which items should the television show, given that it has time for a certain number but not all of them? An example of this situation is given below. There are three viewers, John, Adam and Mary, and the television has ten items to select from (A to J). For each item, it knows the preference ratings, for instance, John really likes A, but Adam really hates it. The problem is what should the TV show if it has time for only one item? What if it has time for two items? Etc.
A B C D E F G H I J John 10 4 3 6 10 9 6 8 10 8 Adam 1 9 8 9 7 9 6 9 3 8 Mary 10 5 2 7 9 8 5 6 7 6
This example will be used to illustrate the strategies described below, and will also be used in the experiments presented in Sections 3 and 4. Note that we have made a number of simplifications: we have assumed that a number of problems have been solved while actually they are still a focus of much research. For example: • How will the television know who is watching it? Solutions have been proposed in the form of an individual
infrared card which registers viewers automatically (Lieberman, van Dyke, & Vivacqua, 1999), an individual token which you have to put on the television, a login procedure (which can take a conversational form, with the television asking who is watching it tonight), and a probabilistic mechanism using the time of day combined with a known probability of a viewer watching at that time (Goren-Bar & Glinansky, 2002).
• How will the preferences of the individual users be determined? Social, and content-based filtering can be used, combined with stereotypes (see many papers in Ardissono & Buczak, 2002). Obviously, there is a complication in that it is difficult to make inferences from actions when a group watches the television, but actions at times the user watches alone could be used combined with a probabilistic model when watching in company. Plua and Jameson (2002) describe a mechanism by which groups of people who know each other well can help each other to specify their preferences. An additional complication is that an individual’s ratings might depend on the group they are in. For instance, a teenager might be very happy to watch a programme with his younger siblings, but might not want to see it when with his friends.
• Dealing with differences in rating tendencies. Not all people have the same rating behavior. Some people only use the ends of the scale, they either "really hate" or "really love" an item. Others only use the middle, never being very positive, and never being really negative. A "7" by Pete, who is always very negative, may be a far more positive review than a "9" by Tim, who likes everything. Note that similar differences may occur when ratings are inferred from viewing behavior. These differences in behavior should be taken into account when using ratings as input for a group model. One way to do this is to normalize them. Though we have not assumed the ratings of John, Adam and Mary to be completely comparable (and indeed some differences in rating tendencies can be seen in the example, e.g. between John and Adam), we have simplified our problem by giving all individuals “reasonable” rating behaviors. For instance, none of them only uses the ends of the scale.
• Dealing with uncertainty. The preferences as determined by filtering mechanisms do not have to be correct (though accuracy is growing). For the research in this paper, we will assume the ratings to be accurate. We will revisit this issue in the Areas for Further Work section in the conclusions.
• Changing groups. We assume that the group remains the same during the whole sequence. If one member of the group needs to leave early (a child, for instance, who has to go to bed) then it is likely that the preferences of that person should have greater weight when they are present.
• Dealing with multidimensionality. Often, you have ratings in multiple dimensions, rather than just one dimension. For instance, in adaptive instruction, there are many reasons for selecting an item, such as the student's existing knowledge (does it fulfill the prerequisites), learning goal and learning style, the educational flow (does it built on what has been explained before), etc. One way to match this onto the modeling as discussed above would be to construct a single rating for each item based on how it scores on these criteria. Masthoff (in press) describes a way in which the aggregation methods discussed in this paper can be used to aggregate ratings of different criteria.
• How will the recommendations be presented to the group? We assume that the television decides which items to show, so, does not give the viewers a choice. One kind of application we are considering is a personalized news program. So, instead of watching a news broadcast that is the same for all viewers (like the BBC

news), you would watch a news program with items in it that are automatically selected for the group of people you are watching with. Most recommender systems, in contrast, would present their list of recommendations to the user, and different ways have been devised on how to do this. For instance, Zimmerman, Parameswaran, and Kurapati (2002) discuss using celebrities (a photo combined with text) to present generated content recommendations (for instance, for an Electronic Program Guide).
All of these problems merit more research, but are beyond the scope of this paper.
2.2 Desirable properties
In Social Choice Theory, some consensus exists about desirable properties of voting systems, but it has been proven that no system can have all these properties (Arrow, 1950), and, arguably, this is why different voting systems exist in different countries, institutions, and societies (see Cranor, 1996, for about 20 of these, and Section 2.3 for a selection). One analysis of 27 democracies over a period of 45 years found a staggering 70 different voting systems being used for national elections (Lijphart, 1994). Some examples of desirable properties that have been proposed: • Pareto rule (Pareto, 1897).
If at least one person prefers x to y and nobody prefers y to x, then x should be above y in the ranking. If nobody prefers x to y and nobody prefers y to x, then x and y should share a place in the ranking. In our example, everybody prefers F to G. Hence, F should precede G in the group list. Similarly, F should precede H, as John and Mary prefer it and Adam does not mind. In this manner, we find: B should precede C D should precede B,C,G E should precede G,I F should precede B,C,D,G,H,J H should precede B,C,G,J J should precede C,G
• Anonymity (May, 1952). If the ratings of two individuals are swapped for all alternatives, then the resulting sequence should remain the same. Note that dictatorship violates this rule, and that it can be well defended that in real life television viewing not everybody has to have equal rights all the time. For instance, if it is John’s birthday than maybe it is fair to give John more satisfaction on that day than the others.
• Positive Association. (Arrow, 1951). If alternative x preceded alternative y in the sequence, then an increase in an individual's rating of x should maintain x's position before y in the sequence. If alternative x appeared equal to alternative y in the sequence, then an increase in an individual's rating of x should lead to x being before or equal to y in the sequence. Note that it is tempting to say that x should precede y in the latter case, but this is too strong a condition. For instance, if the sequence was determined on the basis of Plurality Voting (see below), then x and y could be equal because as many people preferred x to y as preferred y to x. Increasing the rating of x for one individual does not necessarily change this.
• Condorcet winner criterion (Condorcet, 1785). An alternative x is a Condorcet winner if for each other alternative y: x is preferred to y by the majority of individuals. The criterion states that if a Condorcet winner exists then it should top the group list on its own. A weaker version allows it to share the top of the group list. The criterion becomes stronger when modifying the Condorcet winner definition to ”x is preferred or equal to y by the majority of individuals.” In our example, both E and A are Condorcet winners using this definition. We do not agree with this criterion (not even in its weakest form). Assume an item x is rated 10, 1, 10 (as A is in our example). Assume all other items are rated 9, 9, 9. Item x is then a Condorcet winner, but it can be argued that it should not top the group list, given the misery it produces for the second individual.
Our resistance to the Condorcet winner criterion highlights another property we might want our voting systems to have: • Each individual’s satisfaction with the results should be above a certain threshold.
When a sequence of items is selected for a group to watch, the individual’s satisfaction could be measured at the end of the sequence, or, in a stronger version of this rule, at any moment in the sequence. Note that the latter does not necessarily mean that the individual’s satisfaction with each item should be above a certain threshold, as satisfaction is considered in the context of the items shown so far. For instance, consider a sequence “8 9 3 10”. If we want to measure satisfaction at any moment in the sequence, then we would
have to measure the satisfaction after having seen “8”, after having seen “8 9”, “8 9 3”, and “8 9 3 10”. The satisfaction of the individual after having seen “8 9 3” could well be higher than the satisfaction with “3” on its own, so this sequence might pass this criterion, while a sequence “3 8 9 10” might fail.
We will need to determine empirically whether typical TV viewers share our negative feelings about the Condorcet winner criterion, and whether they agree with our individual satisfaction rule.
2.3 Example strategies
Many strategies, also called “social choice rules”, “group decision rules”, and “rank aggregation functions”, have been devised for reaching group decisions given individual opinions. We will discuss some simple ones (the first five originate from social choice theory and the latter five from our specific use), and illustrate them with the example introduced above. The example will show the 'group list' resulting from the strategy, a sequence indicating in which order the items would be chosen. Sometimes, two items score the same, like E and F in the Additive Utilitarian strategy. That is indicated in the group list by placing them between brackets. This means that either E is followed by F, or F followed by E. The main purpose of this section is to show that many different, all seemingly logical, strategies can be devised, all of which have quite distinct results when applying them to the example. 1. Plurality Voting (also called 'first past the post'). Each voter votes for his or her most preferred alternative.
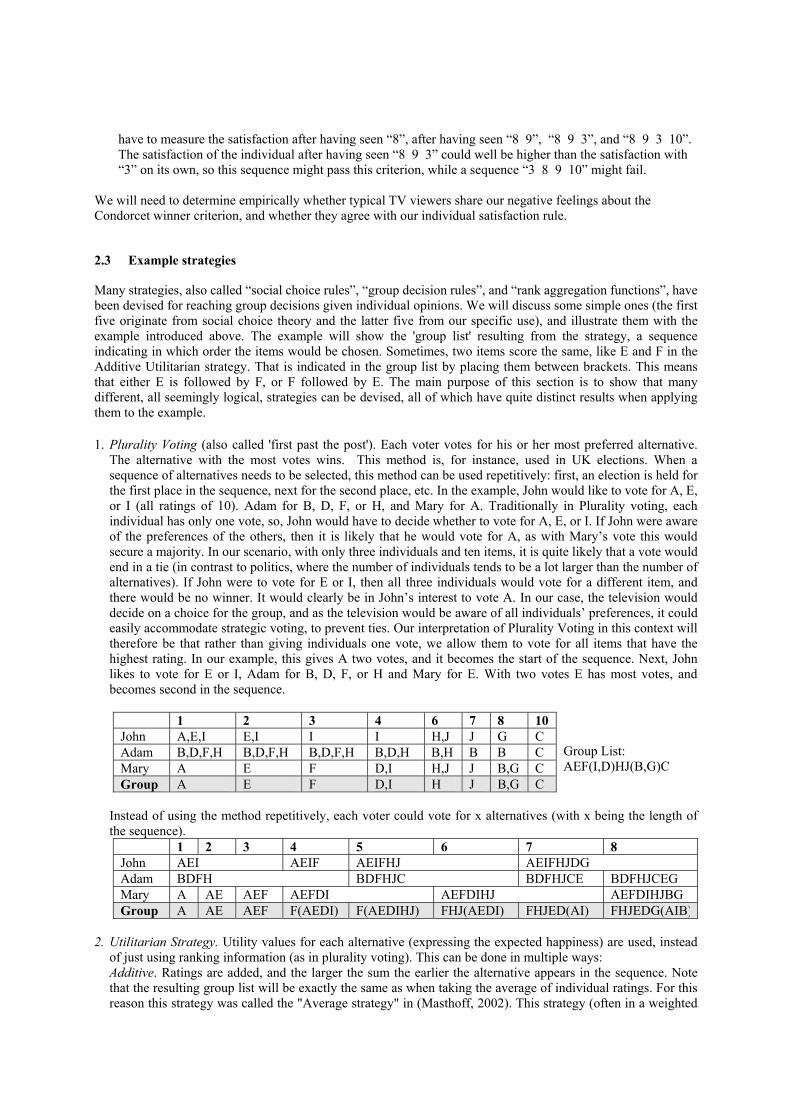
The alternative with the most votes wins. This method is, for instance, used in UK elections. When a sequence of alternatives needs to be selected, this method can be used repetitively: first, an election is held for the first place in the sequence, next for the second place, etc. In the example, John would like to vote for A, E, or I (all ratings of 10). Adam for B, D, F, or H, and Mary for A. Traditionally in Plurality voting, each individual has only one vote, so, John would have to decide whether to vote for A, E, or I. If John were aware of the preferences of the others, then it is likely that he would vote for A, as with Mary’s vote this would secure a majority. In our scenario, with only three individuals and ten items, it is quite likely that a vote would end in a tie (in contrast to politics, where the number of individuals tends to be a lot larger than the number of alternatives). If John were to vote for E or I, then all three individuals would vote for a different item, and there would be no winner. It would clearly be in John’s interest to vote A. In our case, the television would decide on a choice for the group, and as the television would be aware of all individuals’ preferences, it could easily accommodate strategic voting, to prevent ties. Our interpretation of Plurality Voting in this context will therefore be that rather than giving individuals one vote, we allow them to vote for all items that have the highest rating. In our example, this gives A two votes, and it becomes the start of the sequence. Next, John likes to vote for E or I, Adam for B, D, F, or H and Mary for E. With two votes E has most votes, and becomes second in the sequence.
1 2 3 4 6 7 8 10 John A,E,I E,I I I H,J J G C Adam B,D,F,H B,D,F,H B,D,F,H B,D,H B,H B B C Mary A E F D,I H,J J B,G C Group A E F D,I H J B,G C
Group List: AEF(I,D)HJ(B,G)C
Instead of using the method repetitively, each voter could vote for x alternatives (with x being the length of the sequence).
1 2 3 4 5 6 7 8 John AEI AEIF AEIFHJ AEIFHJDG Adam BDFH BDFHJC BDFHJCE BDFHJCEG Mary A AE AEF AEFDI AEFDIHJ AEFDIHJBG Group A AE AEF F(AEDI) F(AEDIHJ) FHJ(AEDI) FHJED(AI) FHJEDG(AIB)
2. Utilitarian Strategy. Utility values for each alternative (expressing the expected happiness) are used, instead
of just using ranking information (as in plurality voting). This can be done in multiple ways: Additive. Ratings are added, and the larger the sum the earlier the alternative appears in the sequence. Note that the resulting group list will be exactly the same as when taking the average of individual ratings. For this reason this strategy was called the "Average strategy" in (Masthoff, 2002). This strategy (often in a weighted
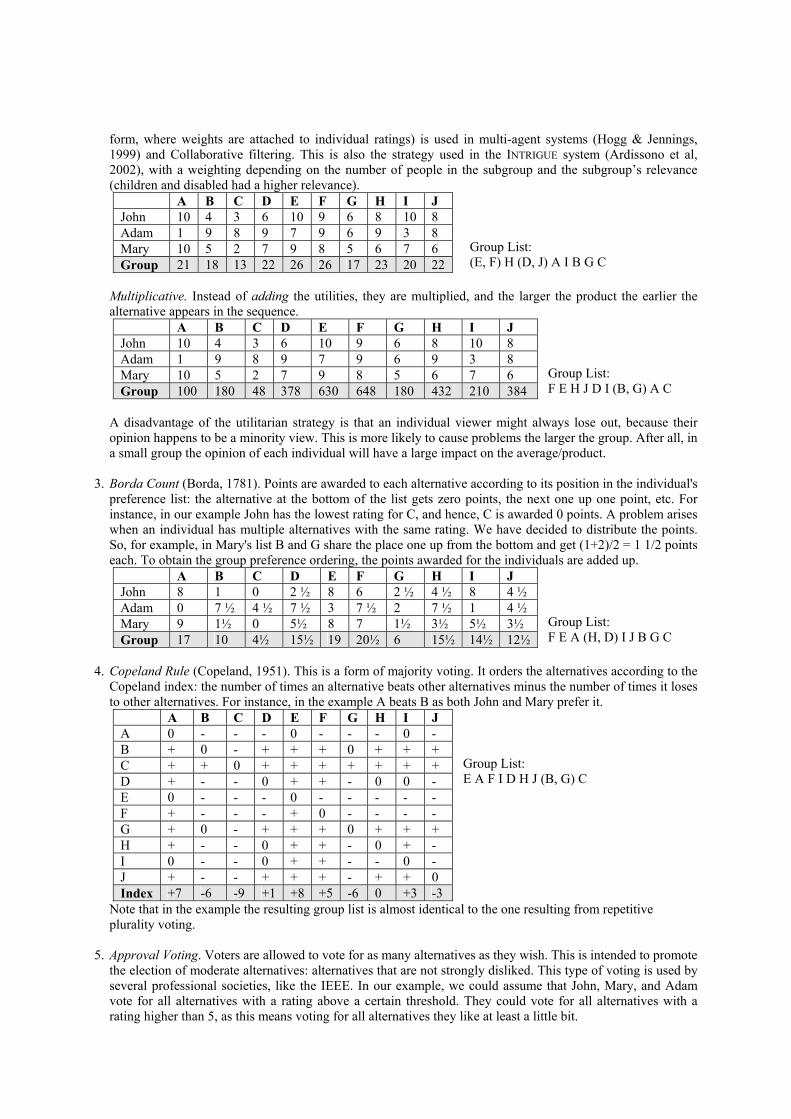
form, where weights are attached to individual ratings) is used in multi-agent systems (Hogg & Jennings, 1999) and Collaborative filtering. This is also the strategy used in the INTRIGUE system (Ardissono et al, 2002), with a weighting depending on the number of people in the subgroup and the subgroup’s relevance (children and disabled had a higher relevance).
A B C D E F G H I J John 10 4 3 6 10 9 6 8 10 8 Adam 1 9 8 9 7 9 6 9 3 8 Mary 10 5 2 7 9 8 5 6 7 6 Group 21 18 13 22 26 26 17 23 20 22
Group List: (E, F) H (D, J) A I B G C
Multiplicative. Instead of adding the utilities, they are multiplied, and the larger the product the earlier the alternative appears in the sequence.
A B C D E F G H I J John 10 4 3 6 10 9 6 8 10 8 Adam 1 9 8 9 7 9 6 9 3 8 Mary 10 5 2 7 9 8 5 6 7 6 Group 100 180 48 378 630 648 180 432 210 384
Group List: F E H J D I (B, G) A C
A disadvantage of the utilitarian strategy is that an individual viewer might always lose out, because their opinion happens to be a minority view. This is more likely to cause problems the larger the group. After all, in a small group the opinion of each individual will have a large impact on the average/product.
3. Borda Count (Borda, 1781). Points are awarded to each alternative according to its position in the individual's
preference list: the alternative at the bottom of the list gets zero points, the next one up one point, etc. For instance, in our example John has the lowest rating for C, and hence, C is awarded 0 points. A problem arises when an individual has multiple alternatives with the same rating. We have decided to distribute the points. So, for example, in Mary's list B and G share the place one up from the bottom and get (1+2)/2 = 1 1/2 points each. To obtain the group preference ordering, the points awarded for the individuals are added up.
A B C D E F G H I J John 8 1 0 2 ½ 8 6 2 ½ 4 ½ 8 4 ½ Adam 0 7 ½ 4 ½ 7 ½ 3 7 ½ 2 7 ½ 1 4 ½ Mary 9 1½ 0 5½ 8 7 1½ 3½ 5½ 3½ Group 17 10 4½ 15½ 19 20½ 6 15½ 14½ 12½
Group List: F E A (H, D) I J B G C
4. Copeland Rule (Copeland, 1951). This is a form of majority voting. It orders the alternatives according to the
Copeland index: the number of times an alternative beats other alternatives minus the number of times it loses to other alternatives. For instance, in the example A beats B as both John and Mary prefer it.
A B C D E F G H I J A 0 - - - 0 - - - 0 - B + 0 - + + + 0 + + + C + + 0 + + + + + + + D + - - 0 + + - 0 0 - E 0 - - - 0 - - - - - F + - - - + 0 - - - - G + 0 - + + + 0 + + + H + - - 0 + + - 0 + - I 0 - - 0 + + - - 0 - J + - - + + + - + + 0 Index +7 -6 -9 +1 +8 +5 -6 0 +3 -3
Group List: E A F I D H J (B, G) C
Note that in the example the resulting group list is almost identical to the one resulting from repetitive plurality voting.
5. Approval Voting. Voters are allowed to vote for as many alternatives as they wish. This is intended to promote
the election of moderate alternatives: alternatives that are not strongly disliked. This type of voting is used by several professional societies, like the IEEE. In our example, we could assume that John, Mary, and Adam vote for all alternatives with a rating above a certain threshold. They could vote for all alternatives with a rating higher than 5, as this means voting for all alternatives they like at least a little bit.
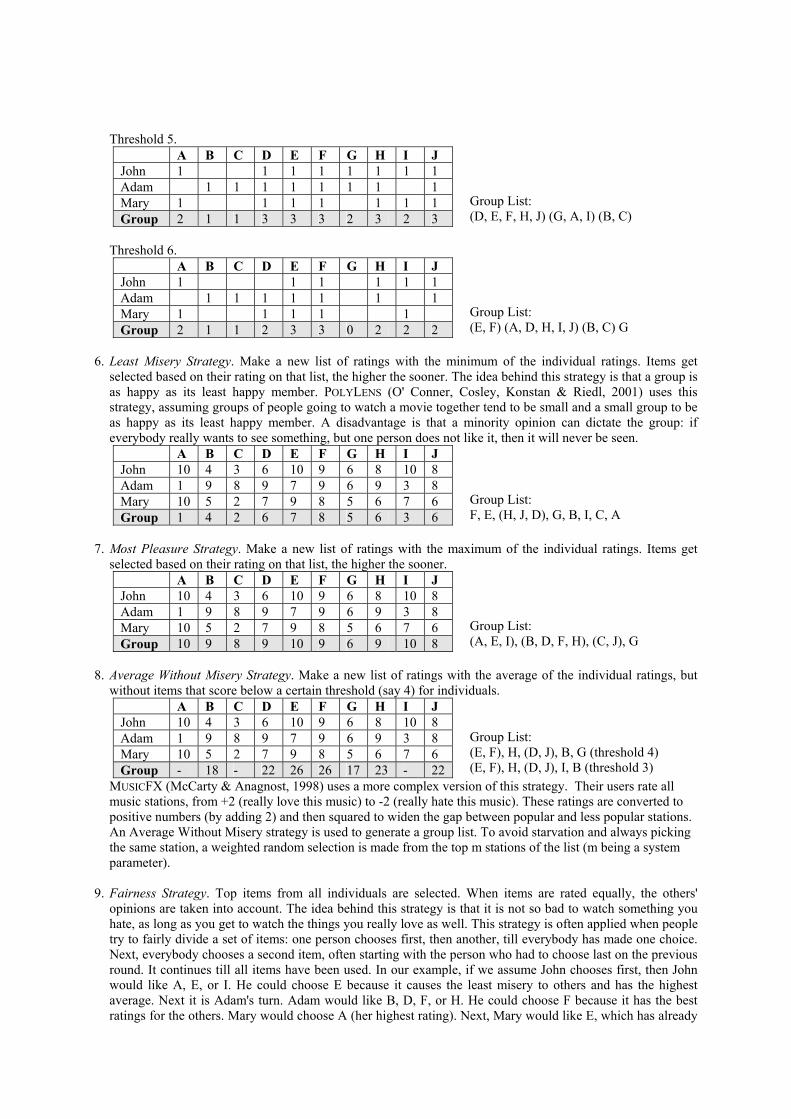
Threshold 5. A B C D E F G H I J John 1 1 1 1 1 1 1 1 Adam 1 1 1 1 1 1 1 1 Mary 1 1 1 1 1 1 1 Group 2 1 1 3 3 3 2 3 2 3
Group List: (D, E, F, H, J) (G, A, I) (B, C)
Threshold 6.
A B C D E F G H I J John 1 1 1 1 1 1 Adam 1 1 1 1 1 1 1 Mary 1 1 1 1 1 Group 2 1 1 2 3 3 0 2 2 2
Group List: (E, F) (A, D, H, I, J) (B, C) G
6. Least Misery Strategy. Make a new list of ratings with the minimum of the individual ratings. Items get
selected based on their rating on that list, the higher the sooner. The idea behind this strategy is that a group is as happy as its least happy member. POLYLENS (O' Conner, Cosley, Konstan & Riedl, 2001) uses this strategy, assuming groups of people going to watch a movie together tend to be small and a small group to be as happy as its least happy member. A disadvantage is that a minority opinion can dictate the group: if everybody really wants to see something, but one person does not like it, then it will never be seen.
A B C D E F G H I J John 10 4 3 6 10 9 6 8 10 8 Adam 1 9 8 9 7 9 6 9 3 8 Mary 10 5 2 7 9 8 5 6 7 6 Group 1 4 2 6 7 8 5 6 3 6
Group List: F, E, (H, J, D), G, B, I, C, A
7. Most Pleasure Strategy. Make a new list of ratings with the maximum of the individual ratings. Items get
selected based on their rating on that list, the higher the sooner. A B C D E F G H I J John 10 4 3 6 10 9 6 8 10 8 Adam 1 9 8 9 7 9 6 9 3 8 Mary 10 5 2 7 9 8 5 6 7 6 Group 10 9 8 9 10 9 6 9 10 8
Group List: (A, E, I), (B, D, F, H), (C, J), G
8. Average Without Misery Strategy. Make a new list of ratings with the average of the individual ratings, but
without items that score below a certain threshold (say 4) for individuals. A B C D E F G H I J John 10 4 3 6 10 9 6 8 10 8 Adam 1 9 8 9 7 9 6 9 3 8 Mary 10 5 2 7 9 8 5 6 7 6 Group - 18 - 22 26 26 17 23 - 22
Group List: (E, F), H, (D, J), B, G (threshold 4) (E, F), H, (D, J), I, B (threshold 3)
MUSICFX (McCarty & Anagnost, 1998) uses a more complex version of this strategy. Their users rate all music stations, from +2 (really love this music) to -2 (really hate this music). These ratings are converted to positive numbers (by adding 2) and then squared to widen the gap between popular and less popular stations. An Average Without Misery strategy is used to generate a group list. To avoid starvation and always picking the same station, a weighted random selection is made from the top m stations of the list (m being a system parameter).
9. Fairness Strategy. Top items from all individuals are selected. When items are rated equally, the others'
opinions are taken into account. The idea behind this strategy is that it is not so bad to watch something you hate, as long as you get to watch the things you really love as well. This strategy is often applied when people try to fairly divide a set of items: one person chooses first, then another, till everybody has made one choice. Next, everybody chooses a second item, often starting with the person who had to choose last on the previous round. It continues till all items have been used. In our example, if we assume John chooses first, then John would like A, E, or I. He could choose E because it causes the least misery to others and has the highest average. Next it is Adam's turn. Adam would like B, D, F, or H. He could choose F because it has the best ratings for the others. Mary would choose A (her highest rating). Next, Mary would like E, which has already
been shown, and then F, which also has already been shown. Therefore, it makes sense to let Adam choose. He likes B, D, or H. He chooses H, as that has the best ratings for the others. Following this strategy, we could end up with a group list like: E, F, A, H, I, D, B, etc. The list would, of course, be different if we let Mary or Adam choose first. However, we would expect A to be within the first three items, as it is the item Mary prefers most.
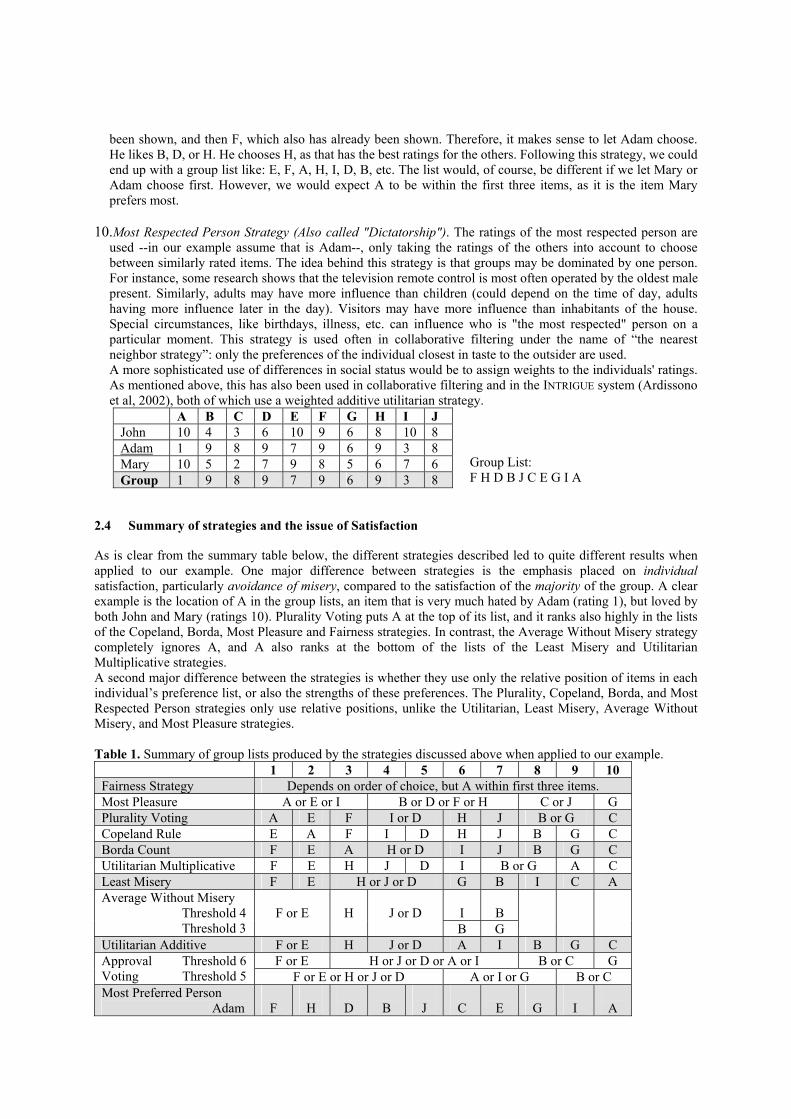
10.Most Respected Person Strategy (Also called "Dictatorship"). The ratings of the most respected person are
used --in our example assume that is Adam--, only taking the ratings of the others into account to choose between similarly rated items. The idea behind this strategy is that groups may be dominated by one person. For instance, some research shows that the television remote control is most often operated by the oldest male present. Similarly, adults may have more influence than children (could depend on the time of day, adults having more influence later in the day). Visitors may have more influence than inhabitants of the house. Special circumstances, like birthdays, illness, etc. can influence who is "the most respected" person on a particular moment. This strategy is used often in collaborative filtering under the name of “the nearest neighbor strategy”: only the preferences of the individual closest in taste to the outsider are used. A more sophisticated use of differences in social status would be to assign weights to the individuals' ratings. As mentioned above, this has also been used in collaborative filtering and in the INTRIGUE system (Ardissono et al, 2002), both of which use a weighted additive utilitarian strategy.
A B C D E F G H I J John 10 4 3 6 10 9 6 8 10 8 Adam 1 9 8 9 7 9 6 9 3 8 Mary 10 5 2 7 9 8 5 6 7 6 Group 1 9 8 9 7 9 6 9 3 8
Group List: F H D B J C E G I A
2.4 Summary of strategies and the issue of Satisfaction
As is clear from the summary table below, the different strategies described led to quite different results when applied to our example. One major difference between strategies is the emphasis placed on individual satisfaction, particularly avoidance of misery, compared to the satisfaction of the majority of the group. A clear example is the location of A in the group lists, an item that is very much hated by Adam (rating 1), but loved by both John and Mary (ratings 10). Plurality Voting puts A at the top of its list, and it ranks also highly in the lists of the Copeland, Borda, Most Pleasure and Fairness strategies. In contrast, the Average Without Misery strategy completely ignores A, and A also ranks at the bottom of the lists of the Least Misery and Utilitarian Multiplicative strategies. A second major difference between the strategies is whether they use only the relative position of items in each individual’s preference list, or also the strengths of these preferences. The Plurality, Copeland, Borda, and Most Respected Person strategies only use relative positions, unlike the Utilitarian, Least Misery, Average Without Misery, and Most Pleasure strategies. Table 1. Summary of group lists produced by the strategies discussed above when applied to our example.
1 2 3 4 5 6 7 8 9 10 Fairness Strategy Depends on order of choice, but A within first three items. Most Pleasure A or E or I B or D or F or H C or J G Plurality Voting A E F I or D H J B or G C Copeland Rule E A F I D H J B G C Borda Count F E A H or D I J B G C Utilitarian Multiplicative F E H J D I B or G A C Least Misery F E H or J or D G B I C A
I
B
Average Without Misery Threshold 4 Threshold 3
F or E
H
J or D
B G
Utilitarian Additive F or E H J or D A I B G C F or E H or J or D or A or I B or C G Approval Threshold 6
Voting Threshold 5 F or E or H or J or D A or I or G B or C Most Preferred Person Adam
F
H
D
B
J
C
E
G
I
A

As discussed in Section 2.2, we believe strategies should have a property like “Each individual’s satisfaction with the results should be above a certain threshold”. So, to determine how good the strategies are we need a way of measuring each individual’s satisfaction with the sequences they produce. Note that this is something the choice strategies do not tell us. One way of doing this would be to have a Satisfaction Function that takes as input a sequence and an individual’s and their friends’ ratings and produces as output a number that quantifies the individual’s satisfaction with that sequence. Ideally, such a Satisfaction Function would be empirically validated, for example by predicting individuals’ satisfaction with sequences and then measuring in an experiment how satisfied they really are (see Experiment 2, Section 4). A good Satisfaction Function would be a fast way to test how strategies perform under many different circumstances (like group size, ratings, sequence length, etc.). Additionally, the construction of a good Satisfaction Function would provide valuable insights into what makes a good strategy. A basic Satisfaction Function In its simplest form, a Satisfaction Function would take as input a set of ratings for any sequence of clips and produce as output a real number. One such function that has been used a lot is Addition: the summation of the individual’s ratings of the clips concerned. So, for instance, John’s satisfaction with FEAHD would be 43 (9+10+10+8+6), while Mary’s would be 40 (8+9+10+6+7). Though without thresholds we cannot say whether these numbers amount to high or low satisfaction, the function would predict that John would be more satisfied than Mary.
The issue of normalization A basic Satisfaction Function as sketched above only considers the ratings of the selected clips. It does not take into account how these ratings compare to those of the unselected clips. So, for instance, ratings of “6 5 6 7” would produce the same satisfaction whether the other clips had ratings of “9 10 10 10 10 9” or “1 2 1 3 1 4”. To counteract this, normalization can be used, by dividing the sum of ratings of the selected clips by the maximal “possible” sum for that individual. For instance, the maximum sum for John for a sequence of five items is 47 (namely 10+10+10+9+8), while the maximum for Mary is 41. So, John’s satisfaction with FEAHD would be 0.91 (43/47), while Mary’s would be 0.98 (40/41). We could then conclude that Mary would be more satisfied than John (in contradiction with the results without normalization). Normalization is one way to counteract differences in rating tendencies.2 The issue of linearity An issue that has not been taken into account by any of the described strategies is that ratings are not necessarily linear. The question arises whether the difference between a “9” and a “10” should really be as big as between a “6” and a “7”. We have the hypothesis that the further away from the middle point of the scale (in our example 5.5 can be seen as Neutral), the larger the difference between subsequent ratings. So, both the differences between a 9 and a 10 and between a 1 and a 2 are larger than the difference between a 6 and a 7. To achieve this, we could convert the ratings “1 2 3 4 5 6 7 8 9 10” for our satisfaction function into “ –25 –16 –9 –4 –1 +1 +4 +9 +16 +25”. This has for instance as a result that FE would give Mary a higher satisfaction (16+4=20) than JC (9+9=18), while the satisfaction would be equal if ratings were considered linear (FE= 9+7=16, JC = 8+8=16).
The issue of misery Another question is whether satisfaction depends on pleasure only (the sum of the positive numbers as a proportion of the maximum achievable pleasure) or whether it is also affected negatively by disagreeable experiences (more than because of losing out on possible pleasure).
The issue of order Until now, we have considered the Satisfaction Function to take as input a set of ratings (whether only of selected or also of unselected items). This assumes that the order of the sequence does not impact the Satisfaction. However, the impact of viewing an item on the user's happiness is likely not only to depend on the viewer's liking for the item in isolation, but also on the context in which the item is shown. It is well known in the advertising world that the context of an advertisement has an impact on its effectiveness and resulting brand evaluation. In particular, studies have shown that the viewer's mood (as induced by watching the preceding 2 Note that normalization only works when we assume each individual to have some items they like. For instance, we would not want to conclude that a selection of “2 2 2 2” with other items of “1 1 1 1 1”, would make this individual 100% satisfied.
program) has a significant effect on brand evaluations (Meloy, 2000; Gardner, 1985), with the viewer responding more positively if they were in a more positive mood. The liking of a television program has a similar significant effect (Murray, Lastovicka, and Singh, 1992; Schumann and Thorson, 1990). So, we hypothesize that an item that is rated as, say, a 3 could be perceived more highly after having watched a 10, and less highly after having watched a 1. There is also an interaction between the emotional tone of commercials and programs (Kamins, Marks, and Skinner, 1991): viewers preferred a sad commercial in the middle of a sad program, and a humorous commercial in a humorous program. This forms the basis for consistency theory, which suggests that viewers try to maintain a mood throughout a program. For example, after watching a "September 11th" news item, viewers might prefer watching another sad item, rather than a funny one, even when normally they would rate the funny one higher. Other content aspects are also likely to play a role. An item about “the position of the Kurds in Iraq” may be appreciated more than its individual rating suggests, after having just seen an item about “the US position on Iraq”.
The issue of solidarity Is it possible to determine an individual’s satisfaction without considering the satisfaction of the others in the group? Would a person be as satisfied with a certain sequence when his friend got a sequence of “1 2 1 3” as he would be when his friend got a sequence of “7 8 6 8”? Hogg and Jennings (1999) deal with this issue in multi-agent systems by adding a weighted measure of the satisfaction of the society. They consider weights between 0 (a very selfish agent) and 1 (a very sociable agent). In fact, the situation could be even more complicated: somebody could be jealous of the pleasure of their friend, so their satisfaction would decrease if their friend’s ratings increased. Note that this is quite likely when siblings are watching television together. So, how do we decide which is the best Satisfaction Function? A way to find such function is to determine some plausible functions before measuring (reported) human satisfaction in an experiment, and to use these functions to predict the experimental outcomes. A comparison between the predictions and the real outcomes would then produce insights into the relative merits of the Satisfaction functions and their weaknesses. Additionally, the experiment could produce the needed threshold value. We will report on such an experiment in Section 4. First, however, we have explored how people act when confronted with the task our strategies perform.
3 Experiment 1: How real people do it
One can easily create hundreds of strategies (the strategies above are only the tip of the iceberg). The important question is which strategy is most effective and will be most liked by viewers. As a starting point, we want to determine what strategy real people use. We have performed a first experiment to explore this.
3.1 Experimental design
Method Subjects were divided into two groups, experiencing different experimental conditions. In both conditions, subjects were given the same individual ratings of three people, John, Adam, and Mary, for a set of video clips. In seven questions, they were asked which clips the three should view as a group, given that they only had time to see respectively 1, 2, 3, 4, 5, 6, or 7 clips, and why they made that selection. The task presented to both groups differed only in that in condition 2, "John, Mary and Adam" had been replaced by "John (29), Mary (32), and their grandfather Adam (81)" (see Appendix A for exact task wordings). A between-subject design was used, as a pilot test revealed large order effects: subjects felt compelled to change their group ratings in favor of Adam, if they received condition 2 after condition 1. The individual ratings had been chosen primarily to enable differentiating between the strategies we expected subjects to use (same ratings were used as in Section 2). In addition, we ensured that John and Mary had quite similar ratings, while Adam’s ratings were frequently the opposite of the ratings of the other two. We also ensured that for one clip, namely clip A, John and Mary had maximal positive ratings (10), while Adam had a maximal negative rating (1). The latter would give a good idea of the importance subjects assigned to avoiding misery. The ratings can also be seen as representing different rating behavior: Adam has not used the maximum of the scale (10), while John has used it three times. Research questions We wanted answers to the following research questions:

• Do subjects follow a clear strategy? Is it possible to describe subjects' individual behavior in terms of a logical strategy? Are the strategies discussed above being used?
• Is there a dominant strategy? Is one strategy used by a majority of subjects, and, if so, which strategy is it? • Do subjects take pleasure, misery, and fairness into account? Which do they find most important? • Do subjects follow the rules (exhibit the desirable properties as discussed in Section 2.2)? • Is social standing taken into account? Does subjects' behavior change if one person in the group can be
regarded as more important? We expected the results of both experimental conditions to provide some answers to the first four questions, and the difference between the conditions to provide some insight in the last question. Our hypothesis was that in Condition 2, Adam would be regarded as more important (because of his age), and the selections would be more geared toward his taste. Note that we have deliberately chosen to make this experiment an indirect one: rather than having an actual group sit down to decide what to watch, subjects were asked what they thought people should watch. There are two reasons for this. Firstly, we really wanted our subjects to think about what would be best for the group as a whole. Giving them a role to play (i.e. to represent John, Adam or Mary) could lead to them trying to defend their own interests (even with clear instructions to consider the group as a whole). Secondly, as discussed in our literature review in Section 2, individuals behave differently depending on who else is in the group. Some people tend to be more accommodating of others, some are more timid and others more outspoken, some are better at arguing their case, or are just more respected. We did not want the eloquence with which John, Mary and Adam argued their case to influence the outcomes.
Subjects Thirty nine subjects participated in the experiment. All were final-year undergraduate students of the IT faculty attending a lecture of the Adaptive Interactive Systems module. The students were studying various courses (B.A. Computer and Information Systems, B.Sc. Computer Studies, B.Sc. Computer Science, and B.Sc. Software Engineering). The experiment took place in a lecture room. Subjects were assigned to experimental condition depending on where they sat: the left of the room was assigned to condition 1 (18 subjects, 16 male, 2 female, average age 28, standard deviation 9.7), the right to condition 2 (21 subjects, 15 male, 6 female, average age 24, standard deviation 3). Students participated in the experiment voluntarily (in addition to the numbers mentioned above, 9 students chose not to participate). The spread over courses was similar for both conditions.
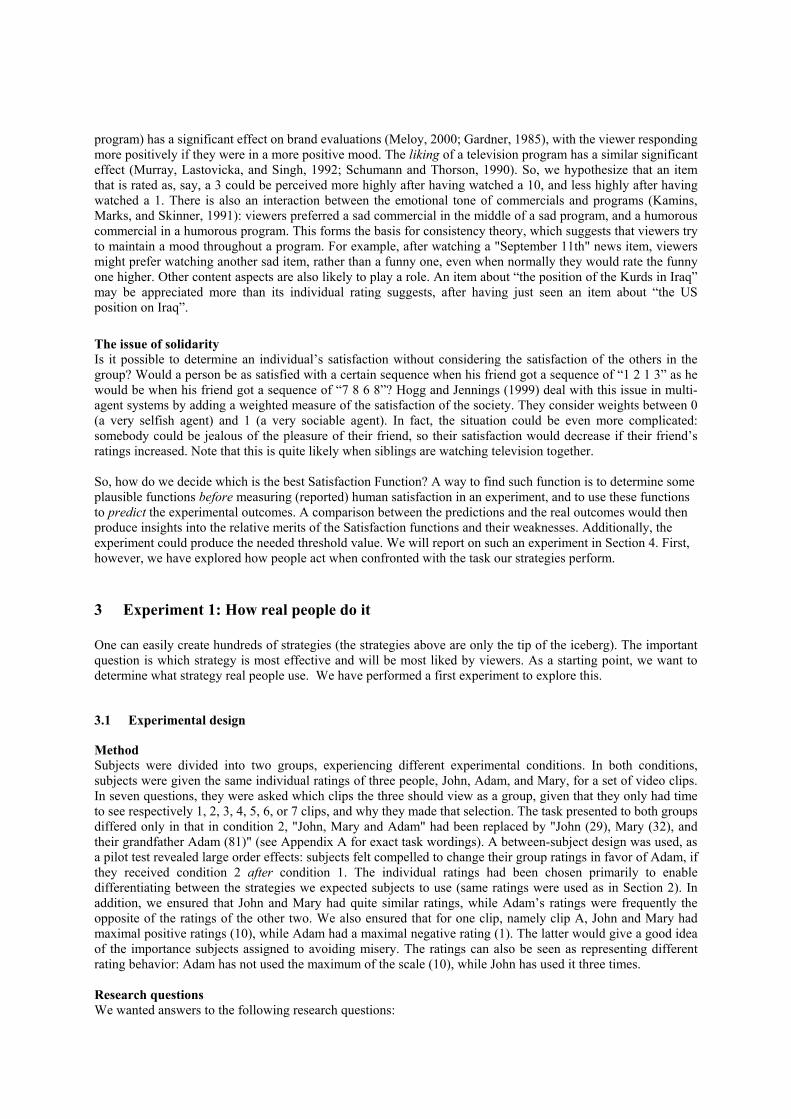
3.2 Results and discussion
Subjects do not seem to answer the questions independently: they responded which new clip should be added to the sequence they had already chosen for the previous question. This made it possible to present the results in the way we have done in Tables 2 and 3 (for respectively, Condition 1 and 2), only showing the new clip selected for each question. However, from an experimental point of view, this is not ideal: it might have influenced their strategy, making it perhaps less likely that they use the "fair strategy" (which only makes sense when selecting a larger group of clips). We need to explore whether the results would be different if we asked the subjects immediately to select, say, six clips. A between-subject design could be used to distinguish between different set sizes. Table 2 shows the results for Condition 1, and Table 3 for Condition 2. As can be seen in the tables, subjects did not always make a unique selection for a clip, sometimes they answered "D or J". We have tried to keep the tables as simple (and uncrowded) as possible: if a cell does not have a clip name in it, then the first name above it applies. For instance, sub11 replied F to the first question. Subjects have been ordered to make the tables as easy to view as possible. The tables include information about how well the subjects' replies fit some of the strategies discussed in Section 2: • Bold borderlines indicate replies that are in correspondence with the Average Strategy. So, for instance, all
replies of sub14 were the same as those by the Average Strategy. The first two replies by sub16 were the same as those by the Average Strategy, but sub16’s later replies differed.
• Gray cell shading indicates replies that are in correspondence with the Least Misery Strategy. So, for instance, all replies of sub11 were the same as those by the Least Misery Strategy. The first three replies by sub16 were the same as those by the Least Misery Strategy, but sub16’s later replies differed.
• Bold dotted borderlines indicate replies that are in correspondence with the Average Without Misery Strategy. So, for instance, all replies of sub2 were the same as those by the Average Without Misery Strategy.
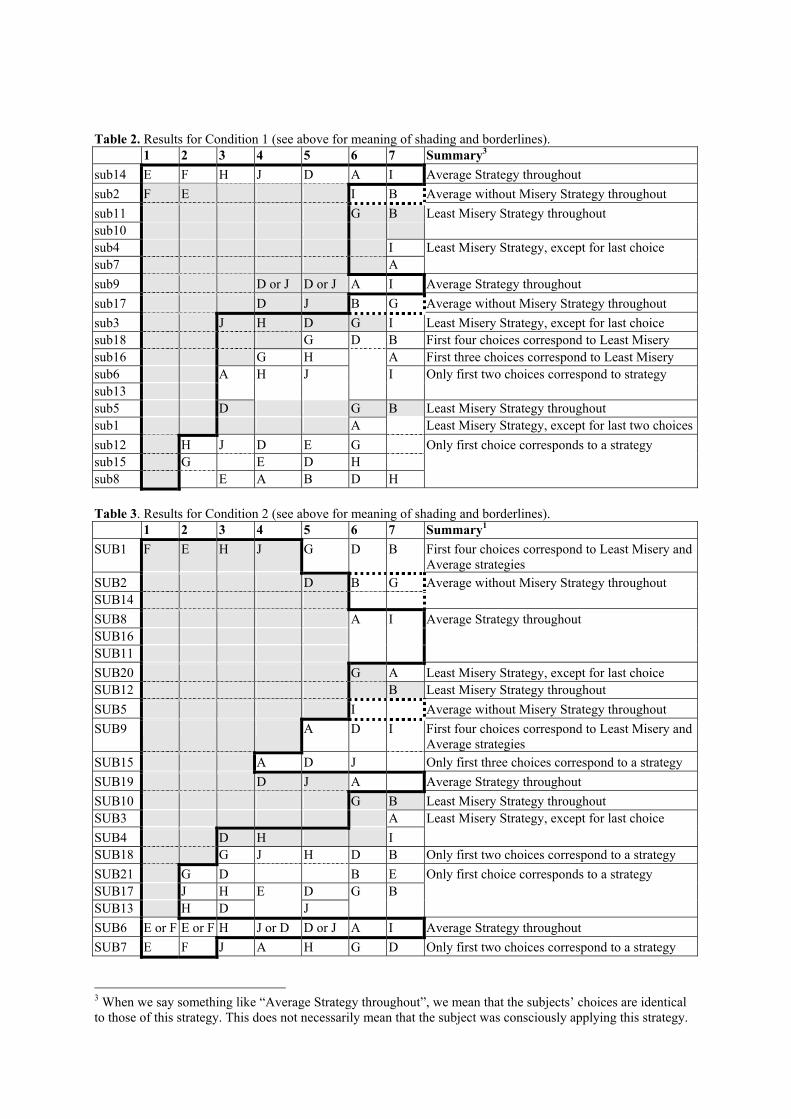
Table 2. Results for Condition 1 (see above for meaning of shading and borderlines). 1 2 3 4 5 6 7 Summary3 sub14 E F H J D A I Average Strategy throughout sub2 F E I B Average without Misery Strategy throughout sub11 G B sub10
Least Misery Strategy throughout
sub4 I sub7 A
Least Misery Strategy, except for last choice
sub9 D or J D or J A I Average Strategy throughout sub17 D J B G Average without Misery Strategy throughout sub3 J H D G I Least Misery Strategy, except for last choice sub18 G D B First four choices correspond to Least Misery sub16 G H A First three choices correspond to Least Misery sub6 A H J I sub13
Only first two choices correspond to strategy
sub5 D G B Least Misery Strategy throughout sub1 A Least Misery Strategy, except for last two choicessub12 H J D E G sub15 G E D H sub8 E A B D H
Only first choice corresponds to a strategy
Table 3. Results for Condition 2 (see above for meaning of shading and borderlines). 1 2 3 4 5 6 7 Summary1 SUB1 F E H J G D B First four choices correspond to Least Misery and
Average strategies SUB2 D B G SUB14
Average without Misery Strategy throughout
SUB8 A I SUB16 SUB11
Average Strategy throughout
SUB20 G A Least Misery Strategy, except for last choice SUB12 B Least Misery Strategy throughout SUB5 I Average without Misery Strategy throughout SUB9 A D I First four choices correspond to Least Misery and
Average strategies SUB15 A D J Only first three choices correspond to a strategy SUB19 D J A Average Strategy throughout SUB10 G B Least Misery Strategy throughout SUB3 A SUB4 D H I
Least Misery Strategy, except for last choice
SUB18 G J H D B Only first two choices correspond to a strategy SUB21 G D B E SUB17 J H E D G B SUB13 H D J
Only first choice corresponds to a strategy
SUB6 E or F E or F H J or D D or J A I Average Strategy throughout SUB7 E F J A H G D Only first two choices correspond to a strategy 3 When we say something like “Average Strategy throughout”, we mean that the subjects’ choices are identical to those of this strategy. This does not necessarily mean that the subject was consciously applying this strategy.

Note that strategies can have overlapping starts of their group lists. For instance, both the Average Strategy and the Least Misery Strategy allow a start of FEHDJ. This means that cells can have both a gray cell shading and a bold borderline. So, for instance, sub7's replies followed the Average Strategy for the first five clips, and in correspondence with the Least Misery Strategy for the first six clips. Also, note, we have only used the Bold dotted borderlines, when the Average Without Misery Strategy starts deviating from the Average Strategy. Do subjects follow a clear strategy? There is evidence that human subjects use the strategies mentioned above, particularly the Average Strategy, the Average Without Misery Strategy and the Least Misery Strategy. • Average Strategy. Two subjects in Condition 1 (sub14 and 9) and five subjects in Condition 2 (SUB8, 16,
11, 19, and 6) exactly followed the Average Strategy. Their papers tended to show additions on them. • Least Misery Strategy. Three subjects in Condition 1 (sub11, 10, and 5) and two subjects in Condition 2
(SUB12, and 10) exactly followed the Least Misery Strategy. Three subjects in Condition 1 (sub4, 7, 3) and three in Condition 2 (SUB 20, 3, 4) followed the Least Misery strategy almost completely. For clip 7, three selected A ("while Adam hates it, the others really like it so he will just have to put up with it", "Mary seems to lose out in most clips, so A is for her", "Might as well please two out of three"), three selected I ("Closest", "At least the majority will be satisfied").
• Average Without Misery Strategy. Two subjects in Condition 1 (sub 17, 2) and three subjects in Condition 2 (SUB2, 14, 5) exactly followed the Average Without Misery Strategy. Three subjects used a threshold of 4 or 5 and two subjects (sub2, SUB5) used a threshold of 2 or 3. As expressed by one subject "I try to please all of them making sure that no is lower than five". Note that the resulting sequence for the Average Without Misery Strategy for a threshold of 2 or 3 coincides with Multiplicative Utilitarianism (but no signs of multiplications where found on the papers).
• Fairness Strategy. Two subjects (sub6, 13) used some kind of a Fairness Strategy. Both selected A relatively early. They made comments like "Although Adam gave 1 mark for A, he gets to see F", "Although some gave some clips low marks, they all get to see some they rated highly". Other subjects applied fairness towards the end: "Mary 's average ratings have been low, so give her something she will enjoy" (sub1, explaining selecting A), "Mary seems to lose out in most clips, so A is for her" (SUB3), "As Adam did not like A, pick D next as he scored it a 9" (SUB15).
• Approval voting. The subjects’ explanations did not show any sign of using Approval voting. Nevertheless, thirteen subjects’ sequences fall within those permitted by Approval voting with threshold 5, and eleven within those permitted by Approval voting with threshold 6 (seven of which are in common with threshold 5). These seem high numbers, but it has to be taken into account that Approval voting (particularly with threshold 5) did not put many restrictions on the sequences it allowed.
• Nobody used plurality voting (in either form) and nobody used the Copeland rule. Nobody completely followed the Borda count (though two subjects’ behavior on the first four items coincides with it: sub6 and sub13).
Is there a dominant strategy? There does not seem to be a clearly dominant strategy, but Average, Average Without Misery, and Least Misery are all plausible candidates for implementation. Fairness plays a role, but our human subjects did not have a clear strategy for applying it. Do subjects take misery into account? Many subjects take misery into account, as evidenced by the high proportion of subjects using the Least Misery and Average Without Misery strategies. Even subjects that do completely deviate from the Least Misery or Average With Least Misery strategies, like sub12, sub15, SUB21, SUB18, SUB17, and SUB13 avoid misery: all left out A and I from their selection. Therefore, preference should be given to a strategy that takes misery into account. Is social standing taken into account? We did not find any statistically significant differences between the conditions. Only one subject explicitly mentioned age as a reason for a selection: "A is not chosen because only the young ones like the topic" (SUB5). Our intention of making Adam the most respected person did not completely succeed: one subject (SUB7) actually mentioned "Adam's scores have been ignored to some extend because of age", another (SUB21) said "overall pick the average highest, if there is any difference attempt to match the two people with the same age". Overall, it seems that this part of the experiment was not successful: in future we will have to make it more obvious that one person is socially more important (perhaps by making it their birthday).

Do subjects follow the rules? No, subjects sometimes exhibit completely unexpected behavior. Four subjects in Condition 1 and four in Condition 2 selected G (ratings 6,6,5) before D (ratings 6,9,7). This seems rather illogical, and breaks the Pareto rule. Two of these subjects explained using disparities in ratings as a basis for selection. This would mean that a group is happy if everybody were equally happy or miserable. Overall, ten subjects broke the Pareto rule, in the following manners:
B (4,9,5) before D (6,9,7)
B (4,9,5) before H (8,9,6)
G (6,6,5) before D (6,9,7)
G (6,6,5) before H (8,9,6)
G (6,6,5) before J (8,8,6)
G (6,6,5) before E (10,7,9)
J (8,8,6) before H (8,9,6)
sub8 x x x x x x sub18 x x sub16 x x x sub15 x x x x x sub3 x SUB1 x SUB18 x x x x SUB21 x x x x x SUB7 x x SUB17 x
The only plausible explanation seems to be that subjects thought fairness to be more important than pleasure. Subjects also do not follow the Condorcet winner criterion. In its stronger form, A and E were both Condorcet winners, but almost all subjects started their sequence with F. This backs up our resistance against the Condorcet winner criterion.
4 Experiment 2: How people judge the sequences produced
In the previous experiment, we have investigated what strategies people follow and what they find important when making a decision on behalf of a group (for instance, misery, fairness, etc). However, the fact that, for instance, many people used a Least Misery strategy does not necessarily mean that our television should use this strategy (though it seems a reasonable option, given the results of Experiment 1). Similarly, the fact that nobody used the Copeland rule does not necessarily mean that the television should definitely not use that strategy. Perhaps that strategy was just to complex for a human to apply. In this experiment, we have turned the game around: instead of asking subjects to produce a satisfying sequence, we have presented subjects with sequences produced by the strategies, and asked them how satisfied they would be with such a sequence. We wanted to determine which strategy produces the most satisfaction for all members of the group. To gain a better understanding of what determines an individual’s satisfaction, we have also compared a number of satisfaction functions (see Section 2.4) to see which provides the best predictions.
4.1 Experimental design
Method Subjects were told that they were going to watch video clips with their two friends. They were given the same individual ratings of three people, themselves, Friend1, and Friend2, for a set of video clips. The ratings used were the same as those in Experiment 1, with John’s ratings corresponding to their own, Adam’s ratings to Friend1’s, and Mary’s ratings to Friend2’s.4 They were told the TV had selected a sequence of clips for them, and were asked how satisfied they and their friends would be given that sequence, and why. This was repeated
4 We decided to use “Friend1” and “Friend2” rather “Adam” and “Mary” to avoid any influence on the subjects’ behavior. After all, names imply gender. It would have been better to use three male names in Experiment 1. Though we did not detect any influence, we decided to avoid the risk in this experiment.

three times: all subjects were given three different sequences on three pieces of paper, stapled together. (See Appendix B for the exact wording.) The table below shows the sequences used, and the reason for using them:
Sequence Reason FEAHD Social choice according to Borda Count EAFID Social choice according to Copeland rule AEFID Social choice according to Plurality voting (one for one) FEHJDI Social choice according to Utilitarian multiplicative EFHDJB Social choice according to Average without misery FEHJDG Social choice according to Least misery AEIBDF Social choice according to Most pleasure EFHDJA Social choice according to Utilitarian additive AIEFD Social choice set according to Plurality voting and Copeland rule, but in another sequence with
the most negative items for Adam at the start. Together with EAFID and AEFID used to see if the order of the sequence influences the results.
Sequences have been kept as short as possible, not to overburden the experimental subjects. Some of the sequences are longer (6 items) than others (5 items), because they would not distinguish between voting strategies otherwise. Though we used “I”, “Friend1” and “Friend2” in the text of the experiment, we will use “John”, “Adam” and “Mary” in our discussion (this makes it easier to compare between experiments). Note: as before we have chosen for an indirect experiment: rather than having an actual group sit down and measure how satisfied each individual would be with a certain sequence, subjects were asked how satisfied they thought all members of the group would be. Measuring satisfaction would require subjects to really experience the clips, and this would have required a set of clips with ratings accurately reflecting our subjects’ tastes. To compare multiple sequences, we either would need different groups of people with the same tastes (difficult to find and control) or use a within subject design. However, order effects could have been large, as showing a clip multiple times would influence its rating.
Satisfaction functions we will use to make predictions We have used six simple satisfaction functions to predict the outcomes of this experiment: 1. Linear Addition without Normalization: The most basic satisfaction function discussed in Section 2.4, where
the individual’s ratings of the selected items are summed. 2. Linear Addition with Normalization: As the previous one, but now with normalization. 3. Quadratic Addition, Pleasure only, without Normalization: Ratings are transformed as described in Section
2.4 (10 becomes 25, 1 becomes –25 etc). The individual’s positive ratings of the selected items are summed. Negative ratings are ignored.
4. Quadratic Addition, Pleasure only, with Normalization. 5. Quadratic Addition, Pleasure minus Misery, without Normalization: As Quadratic Addition, Pleasure only,
but now the negative ratings are also incorporated in the sum. 6. Quadratic Addition, Pleasure minus Misery, with Normalization. The differences in predictions between 1,3,5 on the one hand and 2,4,6 on the other hand will provide insight into whether subjects use Normalization. The differences in predictions between 3,4 on the one hand, and 5,6 on the other hand will provide insight into whether the subjects deduct misery. The differences in predictions between 1,2 on the one hand, and 3,4,5,6 will provide insight into whether subjects use the ratings as linear. We have not used the order of the sequence as input for our satisfaction functions. We did consider adding a satisfaction function that uses the sequence of the ratings: increasing the added satisfaction of an item if the previous rating was high. However, we decided to leave this to future research, as we want to resolve some of the other issues first, and did not know enough yet about the influence ordering could have.
Predictions of the Satisfaction Functions Linear Addition with Normalization (left) and without Normalization (right)
00.20.40.60.8
1
FEAHDAIEFD
FEHJDI
EFHDJB
FEHJDG
AEIBDF
EFHDJA
JohnAdamMary
0102030405060
FEAHDAIEFD
FEHJDI
EFHDJB
FEHJDG
AEIBDF
EFHDJA
JohnAdamMary
Quadratic Addition, Pleasure Only, with Normalization (left) and without Normalization (right)
0
0.2
0.4
0.6
0.8
1
FEAHDAIEFD
FEHJDI
EFHDJB
FEHJDG
AEIBDF
EFHDJA
John
Adam
Mary
0
20
40
60
80
100
FEAHDAIEFD
FEHJDI
EFHDJB
FEHJDG
AEIBDF
EFHDJA
John Adam Mary
Quadratic Addition, Pleasure minus Misery, with Normalization (left) and without Normalization (right)
0
0.2
0.4
0.6
0.8
1
FEAHDAIEFD
FEHJDI
EFHDJB
FEHJDG
AEIBDF
EFHDJA
JohnAdamMary
020406080
100
FEAHDAIEFD
FEHJDI
EFHDJB
FEHJDG
AEIBDF
EFHDJA
John Adam Mary
Some of the more prominent differences: • Effect of Normalization. (Comparing the left hand graphs with the right hand graphs).
FEAHD, AIEFD, AEIBDF: John beats Mary without normalization, Mary beats John with normalization. EFHDJB: John beats Mary without normalization, Mary and John almost equal with normalization. FEHJDG: Adam beats John with normalization. John and Adam quite equal without. John beats Mary without normalization, and they are quite equal with normalization.
• Effect of deducting Misery. (Comparing the middle two graphs with the bottom two graphs). EFHDJA: Adam beats Mary without deduction of misery. With deduction, Mary beats Adam (or is almost equal to Adam, without normalization).
• Effect of Quadratic versus Linear. (Comparing the top two graphs with the bottom four graphs). FEHJDI: In Linear Addition, John and Mary are quite equal. In the others, John clearly beats Mary. FEHJDG: In Quadratic, Adam clearly beats Mary. In Linear, Adam and Mary are quite equal.
EFHDJA: In Linear, Mary beats John (or is equal to John without normalization). In Quadratic, John beats Mary.
Research questions 1. Is one of our satisfaction functions a good predictor of subject behavior? The satisfaction functions above
predict how each individual’s satisfaction compares to that of the other two individuals for a particular sequence, as well as how it compares to their own satisfaction for other sequences. For instance, according to the Quadratic-Addition-Pleasure-Only satisfaction functions, John and Mary would be more satisfied with AIEFD than Adam, and both would prefer AIEFD to FEHJDI. The predictions of the various satisfaction functions differ, and in the experiment we can compare these predictions with the satisfactions as indicated by our experimental subjects. A main question was whether the predictions of one our satisfaction functions would closely match those of our subjects. We also wanted answers to the following related questions, to better understand what makes a good satisfaction function: • Do subjects use normalization? • Do subjects deduct misery? • Do subjects use linear rating scales? We can use the differences in predictions as discussed above to answer these three questions. If one of the satisfaction functions is a very good predictor, then it might be possible to also determine thresholds. Let s be the predicted satisfaction of an individual with a sequence. We would like to determine thresholds t1, t2, t3, t4 and t5, such that:
- s < t1: individual is very dissatisfied with the sequence (score of 1 on the scale of the experiment) - t1 ≤ s < t2 : individual is dissatisfied with the sequence (score of 2 or 3 on the scale) - t3 ≤ s < t4: individual is satisfied with the sequence (score of 5 or 6 on the scale) - t4 ≤ s : individual is very satisfied with the sequence (score of 7 on the scale)
If one of the Normalized satisfaction functions were a good predictor, then all thresholds would have to be between 0 and 1.
2. Does the order of the sequence influence subjects’ satisfaction ratings? What aspects of order do subjects mention? We have given the subjects sequences of selected items, rather than sets. This allows the subjects to use this information if they want to. We hope that the subjects’ explanations will provide us with more insight into how order influences satisfaction. To study this further, we have included three experimental conditions (EAFID, AEFID, AIEFD) that are exactly the same, with the same set of items being selected, except that they are presented in a different order. Note that in our experiments we have deliberately abstracted items (A to J) instead of telling the subjects about the item content. This ensures that subjects use the ratings provided rather than their own personal opinions. This has as side effect that the subjects cannot use content information (the emotional tone or how the content is related to the content of other items). So, our experiment will be restricted to the impact of the ratings profile of a sequence on satisfaction (for instance, exploring the difference between “7 1 9 3 9” and “1 3 7 9 9”), and not the emotional or content profile. It might be possible to change this in a future experiment, but it is a tricky issue to handle: for instance, telling subjects an item is ‘sad’ might influence their opinion of that item in isolation, not just as part of a sequence.
3. Do subjects use social aspects to determine individual satisfaction? We have not used social aspects (solidarity or jealousy) in our satisfaction functions. Without having resolved the other issues first, it would have led to an explosion in possible satisfaction functions. Even more so, as the selfishness/sociality of our individual subjects would have an impact, and different ‘average sociality’ weightings would have been needed for the predictions. However, we hoped that subjects’ explanations would indicate whether they had taken social aspects into account.
4. Is there one strategy (or multiple ones) that is clearly better than the others, in terms of keeping all members of the group happy? As subjects would indicate the satisfaction of all members of the group, we could investigate whether there is a sequence (i.e. the result of a particular selection strategy) with positive satisfaction (i.e. score 5 or above) on average --or better even for all subjects-- for all members of the group.
Subjects Twenty-two subjects participated in the experiment. All were academic staff of the University of Brighton. Subjects were assigned to experimental condition at random. To control for order effects, each sequence appeared similarly often as first, second and third paper. Permutated sequences AIEFD, AEFID, and EAFID were not given to the same subjects, so, there was a complete between-subjects design for those. Each sequence was studied by at least seven subjects (some by eight).
4.2 Results and discussion
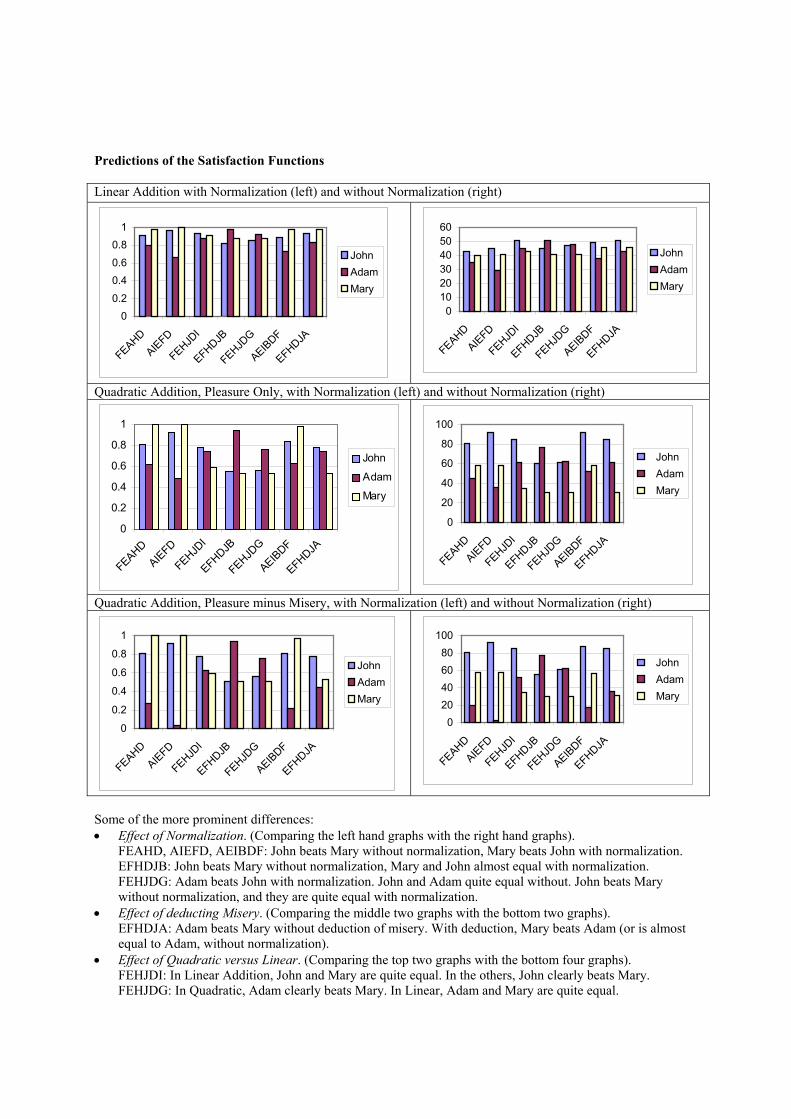
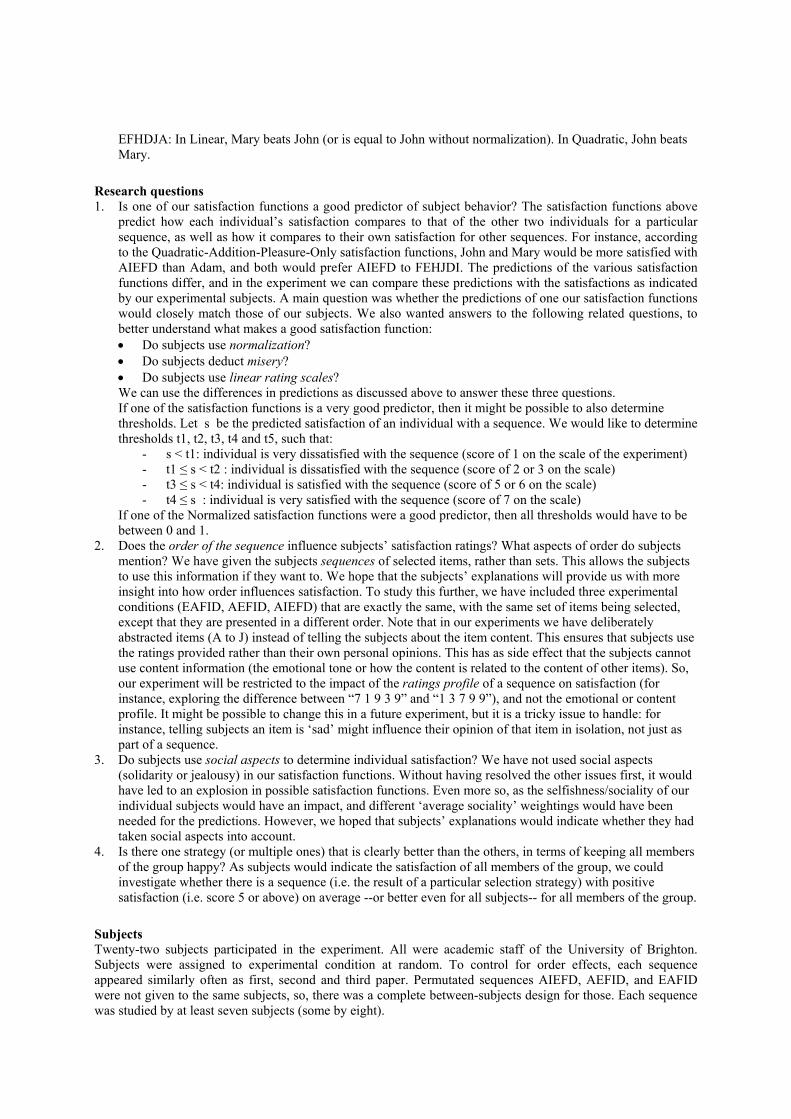
The figure below shows the average satisfaction scores per condition.
1
2
3
4
5
6
7
FEAHDAIEFD
AEFIDEAFID
FEHJDI
EFHDJB
FEHJDG
AEIBDF
EFHDJA
JohnAdamMary
Do subjects use normalization? Comparing the results with the prominent differences between the predictions of the satisfaction functions (see Section 4.1), we find: • FEAHD: There is a trend that Mary beats John, as predicted by normalization. This is not statistically
significant, but “without normalization” predicted John to beat Mary. • AIEFD, AEIBDF: John and Mary are quite equal, which is more in tune with normalization. • EFHDJB: Mary and John almost equal, as predicted by normalization. • FEHJDG: There is a trend that Adam beats John, as predicted by normalization, but this is not statistically
significant. However, John clearly beats Mary, as predicted by “without normalization” (this is statistically significant, p<0.01).
So, overall, there is some evidence that normalization has taken place, but with a contradictory result for FEHJDG (which is a strange case, as will be discussed below).
Do subjects deduct misery? Comparing the results with the predictions of the satisfaction functions (see Section 4.1), we find: • EFHDJA: There is a trend that Mary beats Adam as predicted by deducting misery. This is not statistically
significant, but without deducting misery it was predicted that Adam beats Mary. So, there is some evidence that misery is taken into account (deducted). This is in line with the results of Experiment 1.
Do subjects use linear rating scales? Comparing the results with the predictions of the satisfaction functions (see Section 4.1), we find: • FEHJDI: John beats Mary, as predicted by Quadratic. This is statistically significant (p<0.01). • FEHJDG: Adam clearly beats Mary, as predicted by Quadratic. This is statistically significant (p<0.001) So, there is clear evidence that Quadratic is a better measure than Linear.
Does the order of the sequence influence satisfaction? Order is mentioned by six subjects: • One subject (S22) mentioned that the first clip mainly influenced his ratings. Another subject (S3) explained
a low rating for Adam in AIEFD: “had to endure his two least favorite clips. Then he gave up and went away.”
• One subject (S20) considered how the individuals’ experience changed over time. For FEHJDH he mentions the problem of John feeling a decline of “quality” from the second clip onwards. He also mentioned that John would be quite satisfied with EFHDJA “ending in a high” (in addition to seeing good clips). In support of this, another subject explained a low satisfaction of Adam with EFHDJA by “never finish on a bad one”

(S7). A third subject (S18) shared this interest in the end of the sequence: she mentioned that Adam and Mary would be more satisfied than John with FEAHD (contrary to general belief) because they get more favorite clips towards the end. She also gave John a low rating (3) for EFHDJA because she assumed it to be boring to see too many favorites in a row!
• One subject (S13) explicitly indicated not having taken order into account. No statistically significant differences were found between the results of EAFID, AEFID, and AIEFD. This is not surprising given the small number of subjects who mentioned order. Most subjects treated the sequences as sets. The ordering issue will need to be studied further in future experiments, particularly investigating the impact of the start of the sequence, the end, and the increase or decrease of pleasure over time.
Do subjects use social aspects to determine individual satisfaction? Most subjects did not explicitly do so. • Only three subjects (S15, S12, and S11) mentioned taking the mood of the others into account when
determining the satisfaction of an individual. Another subject (S16) mentioned “If satisfaction depends on others being satisfied I could not assess this, because there was too much to hold in short-term memory. I had no overall model of the situation, and merely did the three evaluations independently.”
• One of these subjects (S11) mentioned that it would be important to know more about the context: “if watching at your own house, your visitors’ satisfaction becomes more important”.
Is one of the satisfaction functions a good predictor? Comparing the average profile above with the profile of the normalized “Quadratic Addition, Pleasure minus Misery” satisfaction function, it can be concluded that they are quite similar. There are, however, still a number of noticeable differences: • Adam’s satisfaction for AIEFD (and its permutations) is low, but not as low as predicted. Similarly, Adam’s
satisfaction for AEIBDF is higher than expected. Perhaps the numbers associated with low ratings (like –25 for a rating of 1) should be less negative than we have them. So, deducting misery, but less severely.
• The difference between John’s and Mary’s satisfaction for FEHJDG is larger than expected. Comparing Mary’s satisfaction for FEHJDG with that for EFHDJB shows a significant difference (p<0.05). This is strange as the only difference between both sequences (except order) is the G in one sequence and the B in the other, both of which have the same rating for Mary. Perhaps subjects did take a social aspect into account: preferring B (which at least gives pleasure to Adam) to G (which gives pleasure to nobody), and feeling more upset about missing favorite A because G pleases nobody. Many subjects mention missing A as the reason for giving a low mark.
• John’s satisfaction for EFHDJA is lower than expected (compared to Adam’s and Mary’s satisfaction). This might be partly caused by the somewhat odd behavior of subject S18 (See order section above). Another subject mentioned giving John a low rating (3) because of missing out on one of his favorites (I).
• The last two points (and the frequency with which subjects used the argument of missing the favorite for giving a lower mark) indicates that a higher weight has to be given to favorites, such that satisfaction goes down when all favorites are missed.
These differences have made it impossible to determine thresholds.
Is there a strategy that keeps everyone happy? On average, John, Adam and Mary were all reported to be not dissatisfied with FEAHD (Borda Count), FEHJDI (Multiplicative Utilitarian), EFHDJB (Average without Misery), AEIBDF (Most pleasure) and EFHDJA (Additive Utilitarian). Looking at individual subjects’ responses, FEHJDI (Multiplicative Utilitarian) is the only sequence that has ratings of at least 4 for all subjects for all individuals. The average ratings for this sequence are even above 5 for John, Adam, and Mary, showing a certain degree of satisfaction for all of them. So, Multiplicative Utilitarian seems the most promising strategy, but the others are not bad either. Of course, we need to investigate this issue further, using different individual ratings and different lengths of the sequence. However, on the basis of this experiment, we can reduce the number of strategies to be investigated (discarding Copeland rule, Plurality voting, Least misery).
Other issues • One subject mentioned that the length of the clips would be important. (S19) This is a valid point, as
viewing something you hate for five minutes or an hour would indeed make a big difference.
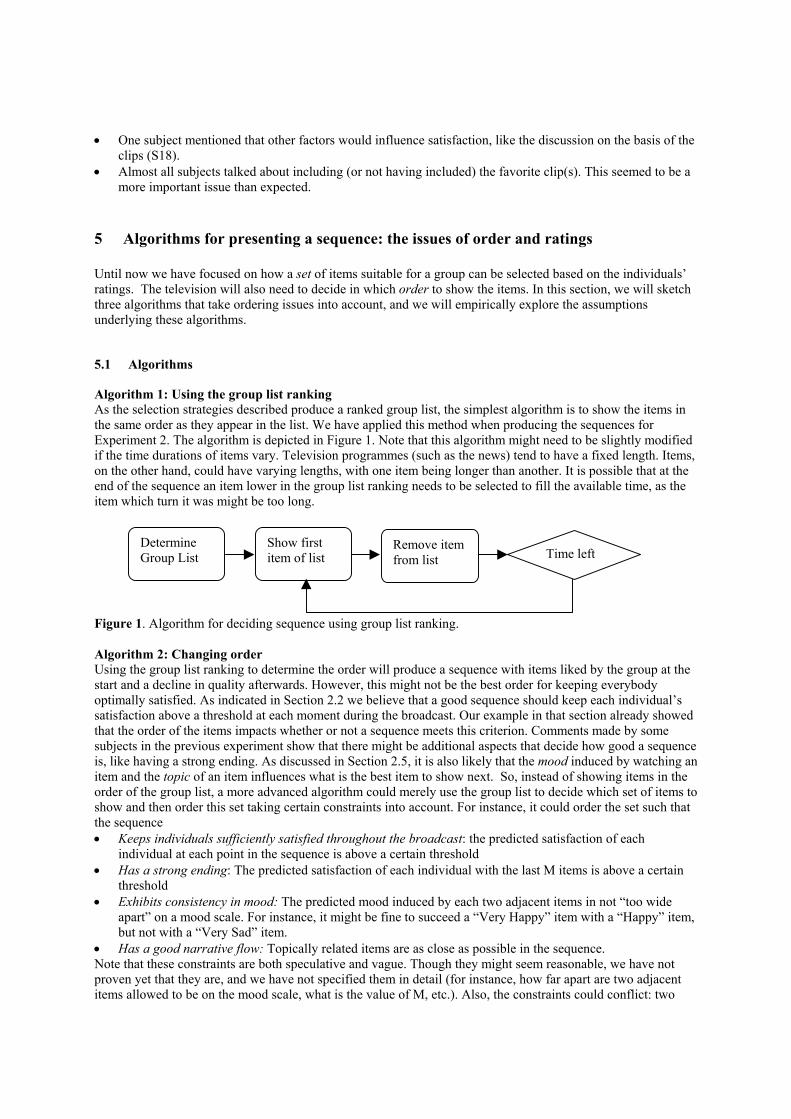
• One subject mentioned that other factors would influence satisfaction, like the discussion on the basis of the clips (S18).
• Almost all subjects talked about including (or not having included) the favorite clip(s). This seemed to be a more important issue than expected.
5 Algorithms for presenting a sequence: the issues of order and ratings
Until now we have focused on how a set of items suitable for a group can be selected based on the individuals’ ratings. The television will also need to decide in which order to show the items. In this section, we will sketch three algorithms that take ordering issues into account, and we will empirically explore the assumptions underlying these algorithms.
5.1 Algorithms
Algorithm 1: Using the group list ranking As the selection strategies described produce a ranked group list, the simplest algorithm is to show the items in the same order as they appear in the list. We have applied this method when producing the sequences for Experiment 2. The algorithm is depicted in Figure 1. Note that this algorithm might need to be slightly modified if the time durations of items vary. Television programmes (such as the news) tend to have a fixed length. Items, on the other hand, could have varying lengths, with one item being longer than another. It is possible that at the end of the sequence an item lower in the group list ranking needs to be selected to fill the available time, as the item which turn it was might be too long.
Remove item from list
Show first item of list Time left
Determine Group List
Figure 1. Algorithm for deciding sequence using group list ranking. Algorithm 2: Changing order Using the group list ranking to determine the order will produce a sequence with items liked by the group at the start and a decline in quality afterwards. However, this might not be the best order for keeping everybody optimally satisfied. As indicated in Section 2.2 we believe that a good sequence should keep each individual’s satisfaction above a threshold at each moment during the broadcast. Our example in that section already showed that the order of the items impacts whether or not a sequence meets this criterion. Comments made by some subjects in the previous experiment show that there might be additional aspects that decide how good a sequence is, like having a strong ending. As discussed in Section 2.5, it is also likely that the mood induced by watching an item and the topic of an item influences what is the best item to show next. So, instead of showing items in the order of the group list, a more advanced algorithm could merely use the group list to decide which set of items to show and then order this set taking certain constraints into account. For instance, it could order the set such that the sequence • Keeps individuals sufficiently satisfied throughout the broadcast: the predicted satisfaction of each
individual at each point in the sequence is above a certain threshold • Has a strong ending: The predicted satisfaction of each individual with the last M items is above a certain
threshold • Exhibits consistency in mood: The predicted mood induced by each two adjacent items in not “too wide
apart” on a mood scale. For instance, it might be fine to succeed a “Very Happy” item with a “Happy” item, but not with a “Very Sad” item.
• Has a good narrative flow: Topically related items are as close as possible in the sequence. Note that these constraints are both speculative and vague. Though they might seem reasonable, we have not proven yet that they are, and we have not specified them in detail (for instance, how far apart are two adjacent items allowed to be on the mood scale, what is the value of M, etc.). Also, the constraints could conflict: two

items can be highly topically related but induce widely different moods. In the experiment below we will explore our assumptions that mood and topical relatedness should have an impact on the order. Figure 2. Algorithm for deciding sequence using ordering constraints. Algorithm 3: Changing ratings There seems to be one major flaw in the reasoning above: until now we have tacitly assumed that we can first select a set of items and then order them, ignoring that ratings might change as an effect of viewing an item. Having shown an item to the group, issues like mood consistency and topical relatedness might well lead to an item outside the selected set being more suitable to show next than the items in our selected set. We believe that the individuals’ ratings should be recalculated taking into account the items they have seen so far. This leads to the algorithm depicted in Figure 3. Different rules could be used for the recalculation of ratings. For instance: • If an item is topically related to the item shown, then increase its rating (by an amount proportionate to the
relatedness). • If an item has the same mood as the item shown, then increase it’s rating, and decrease the rating if the
moods conflict (by an amount proportionate with the intensity of the mood). A question is whether changes in ratings need to apply only for the duration of the next selection or for longer. For instance, suppose the TV shows a “very sad” item. This might lead to a reduction in ratings for “happy” items. If the TV were to show a “neutral” item next, should the ratings for the “happy” items be restored to their previous value, or remain reduced?
• If the (predicted) viewer’s satisfaction is high after watching the items so far, then increase ratings, and if the (predicted) satisfaction is low then decrease ratings. To give an example of how this might work: Assume Adam is shown a number of items he likes. This gives him high satisfaction. Because of this, his ratings for other items (like the ones he normally hates) will increase. This makes it more likely these items will be selected (for instance, by passing the threshold in an Average Without Misery strategy). Assume as a consequence an item he normally hates is shown, like item A. This reduces his satisfaction and therefore his ratings for other items, making it more likely he will see something he enjoys soon.
Determine Group List
Determine order to show items in
Show items in this order
Determine top N items to show
Update Ratings
Show first item of list
Determine Group List Time left
Figure 3. Algorithm for deciding sequence using rating modification. Note that this algorithm allows items to be shown multiple times. This can be counteracted by sharply decreasing the rating of items that have been shown, or by adding a constraint to the “Show first item of the list” that it has to be the first item not already shown. Whilst showing a news item multiple times needs to be avoided, this might not be equally true for all types of programmes and viewers. Toddlers, for instance, very happily watch something they like multiple times. Similarly, a music clip might warrant watching multiple times for a fan. It seems therefore best to leave this issue to be dealt with by the sub-algorithm that determines each individual’s ratings. To investigate whether this algorithm is indeed better than the other two algorithms discussed, our next step is to explore if people do indeed adjust their ratings. More particularly, we would also like to gain insight into the effects of mood, satisfaction, and topical relatedness on the ratings of items after having viewed another item.
5.2 Experimental design
Method Subjects were told that they were going to watch the evening news, and that the television would select a sequence of news items for them. They were asked to rate seven news items on how much they would want to watch them and how they might expect the news item to make them feel. After they had rated all seven items, subjects were told what the first item on the news was, an item that they had not yet seen. They were asked to rate this first item on how much they would want to watch it and how they might expect the item to make them feel. Next, they were asked to rate the other seven news items again, given that they had just watched that first item. There were two experimental conditions. In Condition A, the first news item was “Brighton University Watts Building on Fire: hundreds feared dead”. In Condition B, it was “England football team has to play Bulgaria in the next round”. (See Appendix C for the exact wording.) The table below shows the news items used, and the reason for using them.
News item Reason “[Insert name of your favorite sport’s club] wins important game”
Expect that most subjects would want to see this item and that it would make them feel very happy.
“Fleet of limos for Jennifer Lopez 100-metre trip”5 This item and the next two were real news items that were chosen to be not topically related to the “England football team has to play Bulgaria in the next round” and “Brighton University Watts Building on Fire: hundreds feared dead” items.
“Heart disease could be halved”5 Expect that it would make most subjects happy. “Is there room for God in Europe?”5 Expect that subjects would differ in opinion. “Earthquake hits Bulgaria” Expect that most subjects would want to see this item
and that it would make them feel sad. Also picked “Bulgaria” to make this item weakly topically related to the “England football team has to play Bulgaria in next match” item.
“UK fire strike continues” Expect that most subjects would not want to see this item at the start. The UK fire strike had already been in the news for months. Item is weakly topically related to “Brighton University Watts Building on Fire: hundreds feared dead” item.
“Main three Bulgarian players injured after Bulgaria-Spain football match”
Expect that most subjects would not want to see this item at the start. Item is strongly topically related to the “England football team has to play Bulgaria in next match” item.
“Brighton University Watts Building on Fire: hundreds feared dead” (only in Condition A)
Most of the subjects’ lectures take place in Watts Building. We therefore expected them to be both very interested in and very sad about this item. Constructed to investigate the effect of mood.
“England football team has to play Bulgaria in the next round” (only in Condition B)
Topically related to two other items, with a different degree of relatedness. Constructed to investigate the effect of topical relatedness.
Research questions We wanted answers to the following research questions: • Do people adjust ratings? Does having watched the first news item influence the ratings for the other news
items? If this is the case, then a new group list will have to be determined after each presented item, as in Algorithm 3 of the previous section. If the ratings stay the same, then we could apply an ordering algorithm to the group list, as in Algorithm 2 of the previous section. Our hypothesis was that in both conditions the ratings would change.
• Does mood influence the way ratings are adjusted? Condition A was constructed to test this. We expected all subjects to feel very sad after viewing the “Brighton University Watts Building on Fire: hundreds feared
5 These news headlines were taken from the Yahoo news site http://uk.news.yahoo.com/ on 28-2-2003.

dead” item. Our hypothesis was that this would influence their ratings, particularly of items of a conflicting (“happy”) mood, such as the “[Insert name of your favorite sport’s club] wins important game” item.
• Does topical relatedness influence the way ratings are adjusted? Does having watched the first news item influence the ratings of topically related items to a higher extent than the ratings of topically unrelated items? Condition B was constructed to test this. Our hypothesis was that after watching the “England football team has to play Bulgaria in the next round” item, subjects would change their ratings for the “Main three Bulgarian players injured after Bulgaria-Spain football match” item, and, to a lesser extent, for the “Earthquake hits Bulgaria” item.
• Does the subject’s satisfaction influence the way ratings are adjusted? Does a subject with a high rating for the first item increase the ratings of the other items? Does a subject with a low rating for the first item decrease the ratings of the other items? We can only test this on items that are topically unrelated and in the same mood (or these aspects might cause a change). Our hypothesis was that the rating for the “Earthquake hits Bulgaria” item would increase after having seen the “Brighton University Watts Building on Fire: hundreds feared dead” item, as both are sad items, topically unrelated, and the “on fire” item is expected to have a high interest rating.
• Is there an interaction between these factors? Is there an interaction between the subject’s satisfaction of an item and the effect of topical relatedness on ratings for other items? Our hypothesis is that subjects who express an interest in the “England football team has to play Bulgaria in the next round” item are more likely to increase the rating of the topically related “Main three Bulgarian players injured after Bulgaria-Spain football match” item than subjects who were not interested.
Subjects Thirty-four subjects participated in the experiment. All were final-year undergraduate students of the IT faculty attending a lecture of the Adaptive Interactive Systems module6. The students were studying various courses (B.A. Computer and Information Systems, B.Sc. Computer Studies, B.Sc. Computer Science, and B.Sc. Software Engineering). The experiment took place in a lecture room. Subjects were randomly assigned to an experimental condition. Students participated in the experiment voluntarily (in addition to the numbers mentioned above, two students chose not to participate). The spread over courses was similar for both conditions.
5.3 Experimental results and discussion
Influence of viewing an item on ratings for other items The results for Condition A (“Brighton University Watts Building on Fire: hundreds feared dead”) clearly confirm our hypothesis that there can be a large influence of viewing an item on the ratings of other items. Figure 4 shows a dramatic decrease in ratings after seeing this item. All subjects modified at least one rating, and the difference in ratings was statistically significant. We can therefore conclude that Algorithm 3 is the best candidate. Influence of mood The results for Condition A (“Brighton University Watts Building on Fire: hundreds feared dead”) were hoped to shed some light on the influence of mood. We clearly succeeded in producing an item that made all subjects expect to feel sad. All subjects chose “very sad”, with the exception of two who chose the category just above that. However, we probably succeeded too well: subjects were expecting to be sad to the extent that most decreased their ratings across the board. Some subjects expressed this by making comments like “I would not be interested to see anything anymore, when worried about friends dying”. This does confirm our hypothesis that mood can influence ratings, but not our more particular hypothesis about the way it would affect them. We did not find that the ratings of happy items decreased more than those of sad items. On the contrary, the Heart Disease item (judged by subjects as making them happy) showed a smaller decrease than the sad Earthquake item. So, contrary to our hypothesis and the literature described in Section 2, it might be that subjects actually prefer a happy item to distract them from the sad news. Subjects’ comments also indicate that there is more to items than mood and topic: namely, an importance dimension. Subjects commented that after seeing the
6 Note: this experiment took place almost a year after Experiment 1, so none of these subjects had participated before.
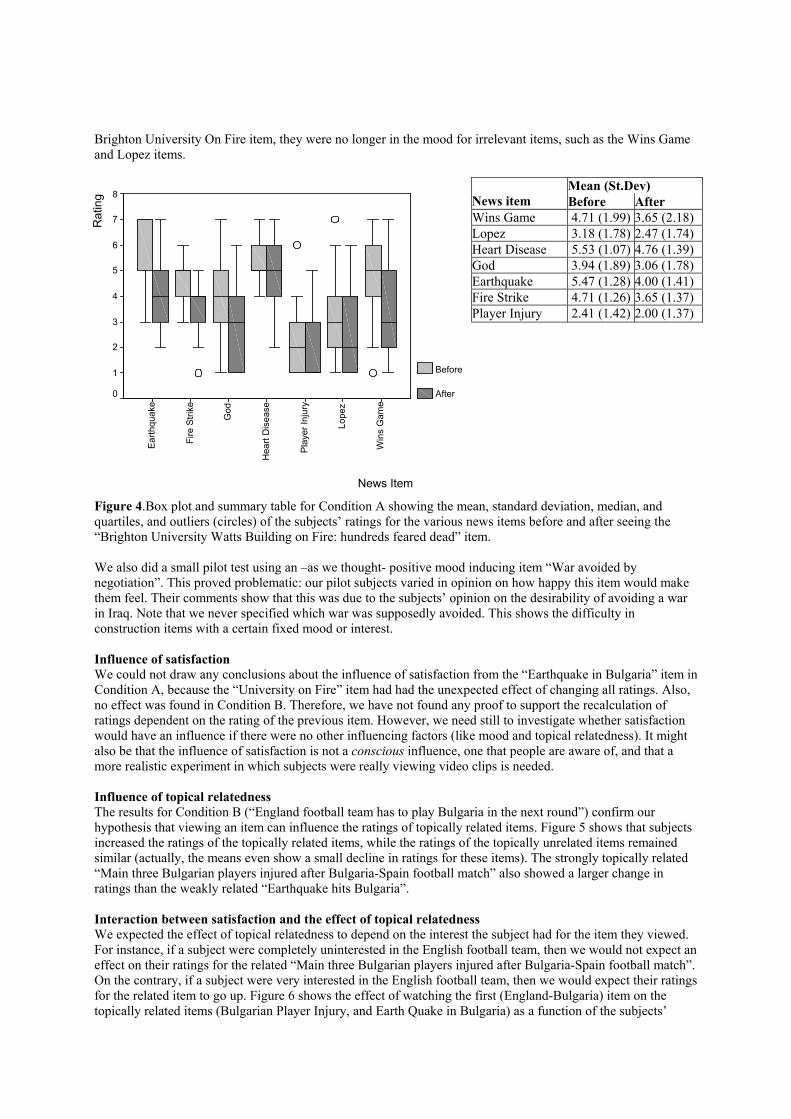
Brighton University On Fire item, they were no longer in the mood for irrelevant items, such as the Wins Game and Lopez items.
Mean (St.Dev) News item Before After Wins Game 4.71 (1.99) 3.65 (2.18) Lopez 3.18 (1.78) 2.47 (1.74) Heart Disease 5.53 (1.07) 4.76 (1.39) God 3.94 (1.89) 3.06 (1.78) Earthquake 5.47 (1.28) 4.00 (1.41) Fire Strike 4.71 (1.26) 3.65 (1.37) Player Injury 2.41 (1.42) 2.00 (1.37)
News Item
Win
s G
ame
Lope
z
Play
er In
jury
Hea
rt D
isea
se
God
Fire
Stri
ke
Earth
quak
e
Rat
ing 8
7
6
5
4
3
2
1
0
Before
After
Figure 4.Box plot and summary table for Condition A showing the mean, standard deviation, median, and quartiles, and outliers (circles) of the subjects’ ratings for the various news items before and after seeing the “Brighton University Watts Building on Fire: hundreds feared dead” item. We also did a small pilot test using an –as we thought- positive mood inducing item “War avoided by negotiation”. This proved problematic: our pilot subjects varied in opinion on how happy this item would make them feel. Their comments show that this was due to the subjects’ opinion on the desirability of avoiding a war in Iraq. Note that we never specified which war was supposedly avoided. This shows the difficulty in construction items with a certain fixed mood or interest. Influence of satisfaction We could not draw any conclusions about the influence of satisfaction from the “Earthquake in Bulgaria” item in Condition A, because the “University on Fire” item had had the unexpected effect of changing all ratings. Also, no effect was found in Condition B. Therefore, we have not found any proof to support the recalculation of ratings dependent on the rating of the previous item. However, we need still to investigate whether satisfaction would have an influence if there were no other influencing factors (like mood and topical relatedness). It might also be that the influence of satisfaction is not a conscious influence, one that people are aware of, and that a more realistic experiment in which subjects were really viewing video clips is needed. Influence of topical relatedness The results for Condition B (“England football team has to play Bulgaria in the next round”) confirm our hypothesis that viewing an item can influence the ratings of topically related items. Figure 5 shows that subjects increased the ratings of the topically related items, while the ratings of the topically unrelated items remained similar (actually, the means even show a small decline in ratings for these items). The strongly topically related “Main three Bulgarian players injured after Bulgaria-Spain football match” also showed a larger change in ratings than the weakly related “Earthquake hits Bulgaria”. Interaction between satisfaction and the effect of topical relatedness We expected the effect of topical relatedness to depend on the interest the subject had for the item they viewed. For instance, if a subject were completely uninterested in the English football team, then we would not expect an effect on their ratings for the related “Main three Bulgarian players injured after Bulgaria-Spain football match”. On the contrary, if a subject were very interested in the English football team, then we would expect their ratings for the related item to go up. Figure 6 shows the effect of watching the first (England-Bulgaria) item on the topically related items (Bulgarian Player Injury, and Earth Quake in Bulgaria) as a function of the subjects’

ratings for the first item. The figure to a certain extent supports our hypothesis, with the increases in ratings mainly for subjects who expressed some interest (rating 5 and above), and the decreases in ratings mainly for subjects who were not that interested (ratings 4 and below).
Mean (St.Dev) News item Before After Wins Game 5.06 (1.92) 5.18(1.70) Lopez 2.47 (1.51) 2.29 (1.40) Heart Disease 5.76 (.97) 5.59 (1.06) God 3.47 (1.81) 3.47 (1.66) Earthquake 4.76 (1.52) 4.88 (1.36) Fire Strike 4.47 (1.59) 4.41 (1.66) Player Injury 3.76 (1.44) 4.18 (1.63)
News Item
Win
s G
ame
Lope
s
Play
er In
jury
Hea
rt D
isea
se
God
Fire
Stri
ke
Earth
Qua
ke
Rat
ing 8
7
6
5
4
3
2
1
0
Before
After
Figure 5.Box plot and summary table for Condition B showing the mean, standard deviation, median, quartiles, and outliers (circles) of the subjects’ ratings for the various news items before and after seeing the “England football team has to play Bulgaria in the next round” item.
-3
-2
-1
0
1
2
3
4
0 1 2 3 4 5 6 7 8
-2
-1
0
1
2
3
4
0 1 2 3 4 5 6 7 8
Figure 6. Rating differences for “Main three Bulgarian players injured after Bulgaria-Spain football match” (left) and “Earthquake hits Bulgaria” (right) after seeing the “England football team has to play Bulgaria in the next round” news item (y-axis), plotted against the rating of the subject for the latter (x-axis). Size of the bubbles indicates number of subjects.
6 Conclusions Group modeling is an interesting research area with a wide possibility of applications, both in interactive television and beyond. In this paper, we have defined the problems associated with adaptation to groups, described our initial research in this area, discovered some answers and many more questions that need answering.

6.1 Conclusions from the study
The main results from this study are: •
•
•
•
•
•
•
•
•
•
People use some of the choice strategies described in Section 2, such as the Average Strategy (a.k.a. Additive Utilitarian), the Average Without Misery Strategy and the Least Misery Strategy, and care about fairness and avoiding individual misery. (Experiment 1) People use normalization: their satisfaction does not only depend on the selected items, but also on the not selected ones. (Experiment 2) People deduct misery: their satisfaction is negatively affected by disagreeable experiences, more than because of losing out on possible pleasure. (Experiment 2) People use the ratings in a non-linear way: i.e. the difference in ratings between say 9 and 10 is regarded as larger than that between 7 and 8. (Experiment 2) The “Normalized Quadratic Addition, Pleasure minus Misery” satisfaction functions produced reasonable, though not completely correct predictions. (Experiment 2) The sequences produced by five choice strategies (Borda Count, Multiplicative Utilitarian, Average without Misery, Most pleasure, and Additive Utilitarian) gave, in our example, on avarage satisfaction to all individuals in the group. (Experiment 2) Multiplicative Utilitarian seems the best strategies as it’s sequence produced satisfaction for all individuals in the group according to all subjects. (Experiment 2) People’s opinion about items can change dramatically as a result of watching another item. Hence, ratings need to be recalculated after showing each item, and a new Group list needs to be determined before selecting the next item. (Experiment 3) People’s opinion about items can change as a result of the mood induced by watching an item. Watching a very sad item can decrease the ratings for other items. Contrary to expectation, it does not seem to decrease the ratings of conflicting mood items more than those of similar mood. (Experiment 3) People’s opinion about items can change as a result of their topical relatedness to a shown item. There is an interaction with Satisfaction: if the person is interested in the shown item, than the ratings of topically related items are more likely to increase. (Experiment 3)
6.2 Limitations of the study
Indirectness of the experiments As discussed in Sections 3 and 4, we have deliberately chosen to make the experiments indirect. In Experiment 1, rather than having an actual group sit down to decide what to watch, subjects were asked what they thought people should watch. In Experiment 2, rather than having an actual group sit down and measure how satisfied each individual would be with a certain sequence, subjects were asked how satisfied they thought all members of the group would be. In Experiment 3, real news headings were used for items, rather than the abstract items used in the earlier experiments. But again, we did not really show the items to the subjects, but asked them how much they wanted to see them and how they expected viewing them would make them feel. We explained the reasons for this indirect approach in Sections 3 and 4, and they mainly had to do with controlling the experiment. However, as always, the more an experiment is controlled, the less it resembles the real world. Subjects used in the experiments The sets of subjects were quite homogeneous, particularly the level of education: either having or studying for a degree, mostly in computing. Subjects were also from a relatively narrow age range (though not as narrow as the word “student” suggests, as we have a large proportion of mature students), and the majority of subjects in Experiments 1 and 3 were male. This raises some doubts about the generalisability of the results, as the demographic of a television audience is a lot more heterogeneous. However, as the indirectness of our experiments did require a certain level of education, it would have been impossible to use a cross section of the population. This would also have required a rather large group of subjects. Nevertheless, the generalisability of the results remains to be proven. Example used in the experiments In both Experiments1 and 2, we have used the example of a group of three people, with particular ratings for these three people. It still needs to be proven that our result about the suitability of the strategies is generalisable to larger groups, and different rating distributions.
Assumptions made As discussed in Section 2, we have made a number of assumptions. In a sense, all of them are limitations of this study. The most important limitation seems our assumption that ratings are accurate: recommender systems need to be able to deal with uncertainty. This might mean that rather than having an accurate rating for an individual for an item, we might have a probability distribution that indicates the likelihood of certain ratings for that item. Or it might mean that we have an estimated rating with an indication of how certain the system is about its estimation. Taking uncertainty into account would have made our experiments far more complicated. We had, therefore, decided to separate concerns, and start with the assumption that ratings were accurate. We believe that most results –in the sense of what is important to people, like avoiding misery- would still hold when dealing with uncertainty, but that an additional set of rules would apply in that case.
6.3 Areas for further work
Our research has only just started, and raises many questions that warrant further research. For example: •
•
•
•
•
•
The Multiplicative Utilitarian strategy seems a good strategy to use, but more experiments are needed to confirm this. These experiments would need to deal with the limitations mentioned above. One way to reduce the effort involved in empirical evaluations would be to have a good Satisfaction Function to predict experimental results. The “Normalized Quadratic Addition, Pleasure minus Misery” satisfaction function is a promising start, but needs further improvement to become more accurate. Finding a highly accurate Satisfaction Function would also allow us to mathematically determine the optimal strategy. The ordering of the sequence requires more investigation. This is not only a group adaption issue, but applies also when dealing with only one viewer. We need to determine what exactly the effect of mood is, how to correctly predict the size of the effect of topical relatedness on ratings, and how to deal with the importance dimension. Invisible members can be added to a group (to represent teachers, or parents) to ensure that a viewer’s (student or child) overall viewing experience is more appropriate. It should be investigated how this can be done and can be made both acceptable and beneficial for the viewer. Similarly, television critics could be added as members of a group. Their ratings would accurately reflect their opinions. An individual’s satisfaction might be influenced by adequate user interface design. For instance, when showing an item, it could be indicated to the viewers what the next item(s) will be (for instance, using a subtitle). This tells viewers who do not like the current item that the next one will be to their taste. This might avoid dissatisfaction, boredom, and walking away from the television.
7 References
Ardissono, L. and Buczak, A. (Eds.) (2002). Proceedings of the 2nd workshop on Personalization in Future TV, Malaga.
Ardissono, L., Goy, A., Petrone, G., Segnan, M., and Torasso, P. (2002). Tailoring the recommendation of tourist information to heterogeneous user groups. In S. Reich, M. Tzagarakis, and P. De Bra (Eds.), Hypermedia: Openness, structural awareness, and adaptivity, International Workshops OHS-7, SC-3, and AH-3, 2001. Lecture Notes in Computer Science 2266, pp. 280-295. Springer Verlag.
Arrow, K. (1950). A difficulty in the concept of social welfare. Journal of Political Economics, 58, pp328-346. Arrow, K. (1951). Social choice and individual values. New York: John Wiley and Sons Barwise, P., and Ehrenberg, A. (1988). Television and its audience. London: Sage. Borda, J.C. (1781). Mémoire sur les elections au scrutine. Histoire de l’Académie Royale des Sciences. Cohen, W., Schapire, R., and Singer, Y. (1999). Learning to order things. Journal of Artificial Intelligence
Research, 10, pp243-270. Condorcet, Marquis de (1785). Essai sur l'application de l'analyse à la probalité des décisions rendues à la
pluralité des voix. Paris. O' Conner, M., Cosley, D., Konstan, J.A., and Riedl, J. (2001). PolyLens: A recommender system for groups of
users. In Proceedings of ECSCW 2001, Bonn, Germany, pp. 199-218. As accessed on http://www.cs.umn.edu/Research/GroupLens/ poly-camera-final.pdf .
Copeland, A.H. (1951). A reasonable social welfare function. Mimeo, University of Michigan.
Cotter, P. and Smyth, B. (2000). PTV: Intelligent personal TV guides. Proceedings of the 12th Innovative Applications of Artificial Intelligence conference. AAAI Press.
Cranor, L.F. (1996). Declared-strategy voting: An instrument for group decision-making. Ph.D. Thesis, Washington University. http://ccrc.wustl.edu/~lorracks/dsv/diss/node4.html
Dwork, C. , Kumar, R., Naor, M., Sivakumar (2001). Rank aggregation methods for the web. WWW10, May 2001, Hong Kong.
Ephrati, E., and Rosenschein, J.S. (1996). Deriving consensus in multi agent systems. Artificial Intelligence, 87, pp21-74.
Fagin, R. Lotem, A. and Naor, M. (forthcoming). Optimal aggregation algorithms for middleware. Journal of Computing System Science.
Gardner, M. (1985). Mood states and consumer behavior: A critical review. Journal of Consumer Research, 12, pp 281-300.
Gillard, P. (1999). The child audience: Who are they and how are they using TV and new media? Paper presented at the Children's Television Policy Forum and Reception, Sydney, 22 July. As accessed on http://www.aba.gov.au/abanews/conf/1999/ pdfrtf/20years_gillard.rtf .
Goren-Bar, D., and Glinansky, O. (2002). Family stereotyping: A model to filter TV programs for multiple viewers. In L. Ardissono and A. Buczak (Eds.) Proceedings of the 2nd workshop on Personalization in Future TV, Malaga.
Hogg, L., and Jennings, N.R. (1999). Variable sociability in agent-based decision making. Proceedings of the 6th International Workshop on Agent Theories Architectures and Languages.
Kamins, M.A., Marks, L.J. and Skinner, D. (1991). Television commercial evaluation in the context of program induced mood: Congruency versus consistency effects. Journal of Advertising, 20 (2), 1-14.
Kasari, H., Nurmi, S. (1992). TV audience segments based on viewing behaviour. In Advertising Research Foundation (ARF) and European Society for Opinion and Marketing Research (ESOMAR), Worldwide Broadcast Audience Research symposium. Toronto.
Kotler, J., Wright, J., and Huston, A. (2001). Television use in families with children. In J. Bryant and J.A. Bryant (Eds.), Television and the American family, pp 33-48. Mahwah, N.J.: Lawrence Erlbaum Associates.
Lekakos, G., Papakiriakopoulos, D. & Chorianopoulos, K. (2001). An integrated approach to interactive and personalized TV advertising. In L. Ardissono and Y. Faihe (Eds.). Proceedings of the 2001 workshop on Personalization in Future TV, Sonthofen.
Lieberman, H., van Dyke, N., and Vivacqua, A. (1999) Let’s browse: A collaborative web browsing agent. Proceedings of the 1999 International Conference on Intelligent User Interfaces.
Lijphart, A. (1994). Electoral systems and party systems: A study of twenty-seven democracies 1945, 1990. Oxford University Press: Oxford.
Livingstone, S., and Bovill, M. (1999). Young people, new media. Summary report of the research project: Children, young people and the changing media environment. As accessed on http://www.lse.ac.uk/Depts/Media/people/slivingstone/young_people_report.pdf .
Masthoff, J. (2002). Modeling a group of television viewers. In proceedings of the Future TV: Adaptive Instruction in Your Living Room workshop.
Masthoff, J. (in press). Modeling the multiple people that are me. Proceedings of the 2003 User Modeling conference, Pittsburgh.
Masthoff J. and Luckin, R. (Eds.) (2002). Proceedings of the workshop Future TV: Adaptive Instruction in Your Living Room, associated with the Intelligent Tutoring Systems conference, San Sebastian, 2 June.
May, K.O. (1952). A set of independent, necessary and sufficient conditions for simple majority decision. Econometrica, 20, pp680-684.
Maybury, M.T. (2001). PersonalCasting: Tailored broadcast news. In L. Ardissono and Y. Faihe (Eds.). Proceedings of the 2001 workshop on Personalization in Future TV, Sonthofen.
McCarthy, J., and Anagnost, T. (1998). MusicFX: An arbiter of group preferences for computer supported collaborative workouts., in proceedings of the ACM 1998 conference on CSCW, Seattle, WA, pp. 363-372.
Meloy, M. (2000). Mood-driven distortion of product information. Journal of Consumer Research, 27, pp345-359.
Murry, J., Lastovicka, J., Singh, S. (1992). Feeling and liking responses to television programs: An examination of two explanations for media-context effects. Journal of Consumer Research, 18, pp441-451.
Pareto, V. (1897). Cours d’economie politique. Rouge: Lausanne. Pattanaik, P.K. (1971). Voting and collective choice. Cambridge: Cambridge university press.

Pennock, D., Horvitz, E., and Giles, C. L. (2000). Social choice theory and recommender Systems: Analysis of the axiomatic foundations of collaborative filtering. AAAI.
Plua, C., and Jameson, A. (2002). Collaborative preference elicitation in a group travel recommender system. In F. Ricci and B. Smyth (Eds.) Recommendation and personalization in eCommerce. Proceedings of the AH’2002 workshop Recommendation and Personalization in eCommerce, Malaga, pp148-154.
Schumann, D., and Thorson, E. (1990). The influence of viewing context on commercial effectiveness: A selection-processing model. Current Issues and Research in Advertising, 12, pp 1-24.
Taylor, A. (1995) Mathematics and politics: Strategy, voting, power and proof. New York: Springer Verlag. Van Evra, J. (1998). Television and child development. Mahwah, N.J.: Lawrence Erlbaum Associates. Zimmerman, J., Parameswaran, L., and Kurapati, K. (2002). Celebrity recommender. In L. Ardissono and A.
Buczak (Eds.) Proceedings of the 2nd workshop on Personalization in Future TV, Malaga
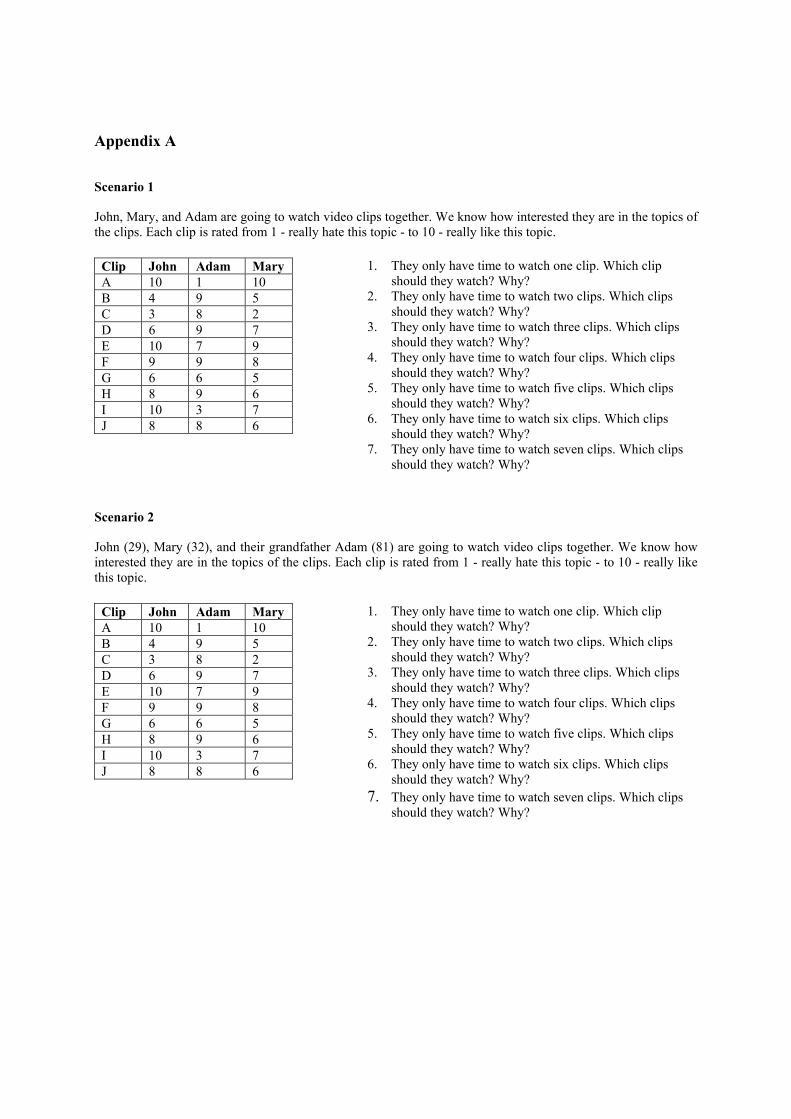
Appendix A
Scenario 1
John, Mary, and Adam are going to watch video clips together. We know how interested they are in the topics of the clips. Each clip is rated from 1 - really hate this topic - to 10 - really like this topic.
Clip John Adam Mary A 10 1 10 B 4 9 5 C 3 8 2 D 6 9 7 E 10 7 9 F 9 9 8 G 6 6 5 H 8 9 6 I 10 3 7 J 8 8 6
1. They only have time to watch one clip. Which clip should they watch? Why?
2. They only have time to watch two clips. Which clips should they watch? Why?
3. They only have time to watch three clips. Which clips should they watch? Why?
4. They only have time to watch four clips. Which clips should they watch? Why?
5. They only have time to watch five clips. Which clips should they watch? Why?
6. They only have time to watch six clips. Which clips should they watch? Why?
7. They only have time to watch seven clips. Which clips should they watch? Why?
Scenario 2
John (29), Mary (32), and their grandfather Adam (81) are going to watch video clips together. We know how interested they are in the topics of the clips. Each clip is rated from 1 - really hate this topic - to 10 - really like this topic.
Clip John Adam Mary A 10 1 10 B 4 9 5 C 3 8 2 D 6 9 7 E 10 7 9 F 9 9 8 G 6 6 5 H 8 9 6 I 10 3 7 J 8 8 6
1. They only have time to watch one clip. Which clip should they watch? Why?
2. They only have time to watch two clips. Which clips should they watch? Why?
3. They only have time to watch three clips. Which clips should they watch? Why?
4. They only have time to watch four clips. Which clips should they watch? Why?
5. They only have time to watch five clips. Which clips should they watch? Why?
6. They only have time to watch six clips. Which clips should they watch? Why?
7. They only have time to watch seven clips. Which clips should they watch? Why?

Appendix B Age: Gender: M / F You and two friends (Friend1 and Friend2) are going to watch video clips together. The Television knows how interested you are in the topics of the clips. Each clip is rated from 1 -really hate this topic- to 10 -really like this topic. Clip You Friend1 Friend2 A 10 1 10 B 4 9 5 C 3 8 2 D 6 9 7 E 10 7 9 F 9 9 8 G 6 6 5 H 8 9 6 I 10 3 7 J 8 8 6 It decides to show you the following sequence of clips: E A F I D Very dissatisfied Neutral Very satisfied
1 2 3 4 5 6 7 How satisfied would you be? Why?
1 2 3 4 5 6 7 How satisfied do you believe Friend1 would be? Why?
1 2 3 4 5 6 7 How satisfied do you believe Friend2 would be? Why?

Appendix C Age: Gender: M / F You are going to watch the evening news. A number of things have happened today, and the news programme has to make a selection about what to show you. Decide for the following new items how interested you would be to see them, and how you think they would make you feel. Each news item is described by its headline, more detail would be given in the news. Assume all news items to be true.
“[Insert name of your favorite sport’s club] wins important game” Really Really Hate to Neutral Want to
1 2 3 4 5 6 7 How much would you want to watch this news item? Very Very Sad Neutral Happy
1 2 3 4 5 6 7 How might you expect this news item to make you feel?
“Fleet of limos for Jennifer Lopez 100-metre trip” Really Really Hate to Neutral Want to
1 2 3 4 5 6 7 How much would you want to watch this news item? Very Very Sad Neutral Happy
1 2 3 4 5 6 7 How might you expect this news item to make you feel?
“Heart disease could be halved” Really Really Hate to Neutral Want to
1 2 3 4 5 6 7 How much would you want to watch this news item? Very Very Sad Neutral Happy
1 2 3 4 5 6 7 How might you expect this news item to make you feel?
“Is there room for God in Europe?” Really Really Hate to Neutral Want to
1 2 3 4 5 6 7 How much would you want to watch this news item? Very Very Sad Neutral Happy
1 2 3 4 5 6 7 How might you expect this news item to make you feel?

“Earthquake hits Bulgaria” Really Really Hate to Neutral Want to
1 2 3 4 5 6 7 How much would you want to watch this news item? Very Very Sad Neutral Happy
1 2 3 4 5 6 7 How might you expect this news item to make you feel?
“UK fire fighter strike continues” Really Really Hate to Neutral Want to
1 2 3 4 5 6 7 How much would you want to watch this news item? Very Very Sad Neutral Happy
1 2 3 4 5 6 7 How might you expect this news item to make you feel?
“Main three Bulgarian players injured after Bulgaria-Spain football match” Really Really Hate to Neutral Want to
1 2 3 4 5 6 7 How much would you want to watch this news item? Very Very Sad Neutral Happy
1 2 3 4 5 6 7 How might you expect this news item to make you feel?
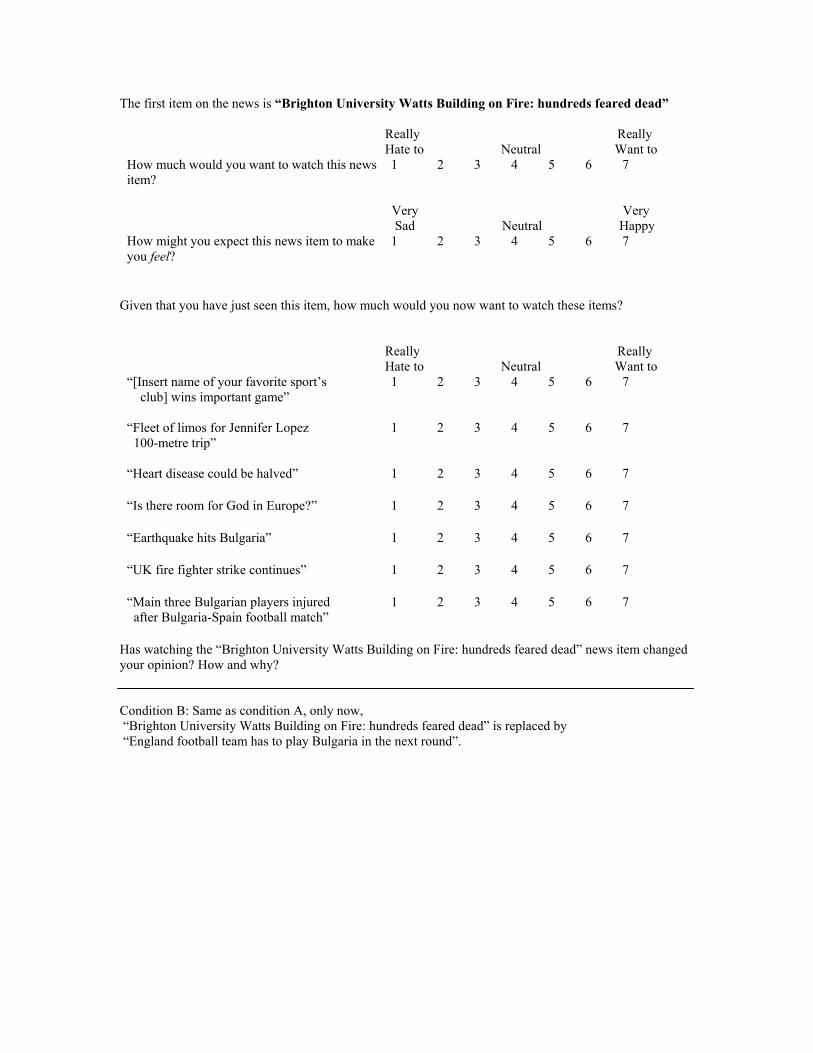
The first item on the news is “Brighton University Watts Building on Fire: hundreds feared dead”
Really Really Hate to Neutral Want to
1 2 3 4 5 6 7 How much would you want to watch this news item?
Very Very Sad Neutral Happy
1 2 3 4 5 6 7 How might you expect this news item to make you feel?
Given that you have just seen this item, how much would you now want to watch these items?
Really Really Hate to Neutral Want to
1 2 3 4 5 6 7 “[Insert name of your favorite sport’s club] wins important game”
1 2 3 4 5 6 7 “Fleet of limos for Jennifer Lopez 100-metre trip”
1 2 3 4 5 6 7 “Heart disease could be halved” 1 2 3 4 5 6 7 “Is there room for God in Europe?” 1 2 3 4 5 6 7 “Earthquake hits Bulgaria” 1 2 3 4 5 6 7 “UK fire fighter strike continues” 1 2 3 4 5 6 7 “Main three Bulgarian players injured
after Bulgaria-Spain football match” Has watching the “Brighton University Watts Building on Fire: hundreds feared dead” news item changed your opinion? How and why? Condition B: Same as condition A, only now, “Brighton University Watts Building on Fire: hundreds feared dead” is replaced by “England football team has to play Bulgaria in the next round”.
Related Documents