Group Ltd Annual Report 2014

Welcome message from author
This document is posted to help you gain knowledge. Please leave a comment to let me know what you think about it! Share it to your friends and learn new things together.
Transcript

Group Ltd Annual Report 2014

1988 - COMPANY ESTABLISHED- ONE BRANCH IN PENROSE, AUCKLAND
2005 - LISTED NZX- REVENUE $61M- BRANCHES 21
2012 - REVENUE EXCEEDS $100M- REVENUE $119M- BRANCHES 32
2013 - MADISON ACQUIRED – ADDING REVENUE OF $60M P.A AND 75 STAFF
- BRANCHES 41
2015 - OBJECTIVE FOR YEAR - REVENUE $200M
- STAFF 235

[ C O N T E N T S ]
p4 FY14 Highlights p6 Letter from the Board
p8 Structure and strategy p14 Chief Executive’s Report
p17 Our locations p18 Corporate Governance Statement
p22 Independent Auditor’s Report p23 Financial Statements
p27 Notes to the Financial Statements p61 Shareholder and statutory information
p64 Directory
A N N U A L R E P O R T 2 0 1 4 | 3

Another record year of strong revenue growth as Madison joins the Group and lifts revenue by 14% to almost $150m.
The culmination of a full year’s contribution from Madison, a well positioned business as a whole and a strong economy, give us confidence in our targets for 2015.
[ H I G H L I G H T S ]
4 | AW F G R O U P

[ H I G H L I G H T S ]
The acquisition of Madison in November 2013 and its strong performance since joining the Group clearly demonstrated that our path for the future in widening our servicing offering to become a full spectrum recruitment services business is the correct one.
Equally, the short term cost of strengthening our talent pool and strongly advancing our technology capability, leaves us in a position to take the lead in delivering to meet our clients’ needs.
2014 was one of acquisition, integration and investment to position ourselves for the future. Profits for the period fell by 43% whilst underlying earnings (see note 13 on page 43) dipped by 14% on the prior year. However, our investments mean that we remain well positioned to deliver the high service levels that will differentiate the Group from the competition.
PERMANENT CANDIDATE PLACEMENTS
+3,000p.a.
LOST TIME INJURY FREQUENCY RATE (LTIFR)
11.36Down 57% over past 5 years
DIVIDEND FOR YEAR
14.0cpsIn line with earnings dividend down on like for like basis (excluding 2013 special)
BRANCHES NATIONALLY PERMANENT STAFF
41 235Acquisition of Madison has expanded the operation significantly
REVENUE
$148.7mSupported by a 5 month contribution from newly acquired Madison
PROFIT FOR THE PERIOD
$3.9mDown 43% on previous years record of $6.9m
UNDERLYING EARNINGS
$4.6mA strong performance tempered by higher staff costs required to strengthen for the future
UNDERLYING EARNINGS PER SHARE
17.8cpsReflecting lower underlying earnings
A N N U A L R E P O R T 2 0 1 4 | 5

[ L E T T E R F R O M T H E B O A R D ]

[ L E T T E R F R O M T H E B O A R D ]
On behalf of AWF Group Limited (the Group), we present to you a commentary on the challenges and achievements for the year ended 31 March 2014.
Turnover for the Group rose 14% to $148.7m ($130.5m previous year) whilst profit for the period was $3.95m, down 43% on the previous year’s record $6.92m. It should be noted that the previous year benefited from a $2.24m gain on the sale of subsidiary Panacea Healthcare.
Underlying Earnings1, which adjusts for items of amortization and the profit on the disposal of the subsidiary, fell 14% to $4.65m from $5.42m in the prior year. EBITDA2 (Earnings before interest, tax depreciation and amortization) reached $8.39m in 2014 against $8.34m in 2013.
As we signaled in the Half Year Report and at the Special Shareholders’ meeting (18/11/13), the Group had determined to invest in significant internal business capability to ensure that the newly expanded AWF Group was well positioned to move ahead. This investment came at a cost of in excess of $1m in direct operating costs within the year.
The acquisition of Madison Recruitment in late 2013 was similarly a strategically important move and is already being validated by the Group capability to offer the full range of recruitment services to Corporate New Zealand.
We have separately reported that Madison is tracking to acquisition projections and, as importantly, the Group is achieving significant new business as a result of the combined Allied Work Force and Madison proposition.
The Board felt it prudent to adjust the final dividend to reflect the historic linkage of total dividends paid to 70%-80% of underlying earnings after tax. Accordingly a final dividend of 7.6 cents per share (fully imputed) was declared, taking total dividend for the financial year 2013/14 to 14 cents per share.
Shareholders will have noted that the Group has gone from zero debt to potentially $36m of debt following the acquisition of Madison Recruitment. Whilst your Board considers this debt level manageable under current trading conditions and finance costs, it will be our objective to address a debt reduction program over the next few months as a clearer picture of overall Group performance emerges. We envisage a further update to Shareholders on this
matter at the forthcoming Annual Shareholders meeting to be held at the Crowne Plaza, Auckland on 23rd July 2014.
Effective October 2013 we appointed Julia Hoare to the Board. Having recently retired from PwC Julia brings excellent first-hand knowledge of financial matters including presentation requirements. Julia chairs the Audit Finance and Risk Committee.
The 2014/15 year has started well with the combined AWF and Madison resources delivering to 2014/15 plans.
Finally, may we again acknowledge the commitment to service standards and performance from the expanded AWF Group of professionals.
Reconciliation of reported Profit for the Period to Underlying Earnings1
FY14 FY13
Profit for the period 3 3,952 6,923
Add back amortisation of intangible assets 4 967 1,025
Tax effect on adjustments 5 (271) (288)
Subtract gain on sale of subsidiary 6 (2,242)
Underlying Earnings 1 4,648 5,418
Earnings per share (cents) 15.1 26.5
Underlying earnings per share (cents) 7 17.8 20.7
Reconciliation of Profit before tax to Earnings Before Interest Tax Depreciation and Amortisation (EBITDA)2
FY14 FY13
Profit before tax 3 5,843 7,192
Add back finance costs 714 289
Add back depreciation and amortisation 1,879 879
Subtract investment revenue (51) (22)
EBITDA 8,385 8,338
1 Underlying earnings is a non-GAAP measure which adjusts for items of amortisation and the profit on disposal of subsidiary. In the Directors’ opinion this more clearly reflects the operating performance of the Group. This treatment is consistent with the previous reporting period. 2 Earnings before Interest, Tax, Depreciation and Amortisation (EBITDA) is a non-GAAP measure which allows a comparison of profitability between different companies by removing the effects of interest, tax, depreciation and amortization. 3 The reported profit information has been prepared in accordance with New Zealand general accepted accounting practice and complies with New Zealand Equivalents to International Financial Reporting Standards. The reported profit information has been extracted from audited financial statements. 4 Included in the assets of subsidiaries acquired are identifiable intangible assets that are amortised over their useful lives. These amortisation charges have been added back in the calculation of underlying earnings. 5 Taxation adjustments as a result of adjustments to 2 above. 6 The sale of the Group’s subsidiary Panacea Healthcare Limited resulted in a gain of $2.242 million during the year ended 31 March 2013. 7 Underlying earnings per share have been calculated on the same basis and using the same number of shares issued as earnings per share as reported in the audited annual financial statements.
For the Board
Ross Keenan Chairman
Simon Hull Managing Director
Ted van Arkel Director
Julia Hoare Director
A N N U A L R E P O R T 2 0 1 4 | 7

[ AW F G R O U P ]
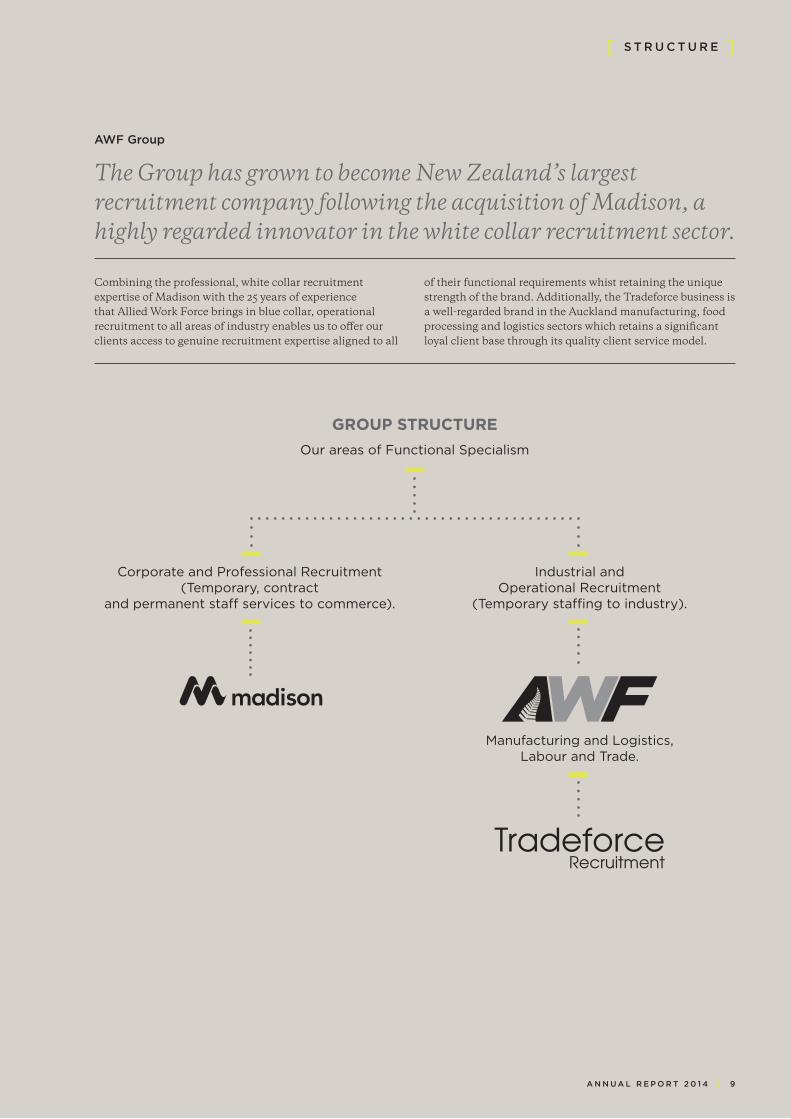
Combining the professional, white collar recruitment expertise of Madison with the 25 years of experience that Allied Work Force brings in blue collar, operational recruitment to all areas of industry enables us to offer our clients access to genuine recruitment expertise aligned to all
of their functional requirements whist retaining the unique strength of the brand. Additionally, the Tradeforce business is a well-regarded brand in the Auckland manufacturing, food processing and logistics sectors which retains a significant loyal client base through its quality client service model.
GROUP STRUCTUREOur areas of Functional Specialism
Corporate and Professional Recruitment (Temporary, contract
and permanent staff services to commerce).
Industrial and Operational Recruitment
(Temporary staffing to industry).
Manufacturing and Logistics, Labour and Trade.
AWF Group
The Group has grown to become New Zealand’s largest recruitment company following the acquisition of Madison, a highly regarded innovator in the white collar recruitment sector.
[ S T R U C T U R E ]
A N N U A L R E P O R T 2 0 1 4 | 9

“To be the leading provider of quality recruitment and staffing solutions to New Zealand business”
OUR VISION
[ S T R AT E G Y ]
1 0 | AW F G R O U P

Our objective
To drive growth and maximise shareholder value in the long-term through investments in strategies that will grow the business - including strategic acquisitions, attracting top leadership talent and investment in market leading systems and technology to best meet the needs of clients and candidates now, and into the future.
A focus on quality customer service• Building enduring, sustainable and mutually beneficial
relationships with key clients through:
• An investment in account management capability
• Leveraging client feedback and research insights to continuously improve our service offering
• Operational performance improvement to drive consistency and quality in all aspects of service delivery
• Continued commitment to maintaining the strongest national recruitment network in the country with 41 branches nationwide. This enables us to provide a quality local service to clients in the majority of places they do business.
Operational performance improvement• A commitment to zero harm in the workplace through our
focus on living the values in our health and safety culture
• A focus on quality and continuous improvement in processes in line with key performance metrics
• Continued investment in induction processes and staff training and development programs
• Driving cost out of the business through systems that increase efficiency
• Strong engagement with external stakeholders such as the Ministry of Business, Innovation and Employment, ACC, WorkSafe New Zealand and IRD to ensure we meet or exceed the relevant statutory standards for our industry.
Delivering shareholder value• Optimising the Group’s capital structure by reducing the
debt level
• Re-establishing forward momentum
• Achieving the Group’s stated financial goals for 2015 of revenue of $200m and underlying earnings exceeding $8m
• Delivering a consistent upward trend in returns to shareholders
• Strong engagement with our shareholder community to communicate the future vision for the business
• Continuous improvement in the quality of financial reporting to provide meaningful information to the investor community.
Our strategic pillars
To meet our vision and objective, we are focused on the following key priority areas:
Growth and innovation• Investment to position the business for long term growth
including:
• Realising the benefits of strategic acquisitions to that position AWF Group as a full service recruitment provider to meet the needs of our clients
• Investment in new Operating, Customer Relationship Management and web based candidate application systems to lead the market in the technology we offer our clients and candidates
• Investment in business development aligned to market growth sectors, particularly infrastructure and construction in the Christchurch and Auckland markets, and the manufacturing and logistics sectors more broadly.
Investment in our people• Attraction and retention of top talent into our senior and
divisional management teams
• Ongoing investment in our people engagement strategies through living our culture and values and new initiatives such as rewards and recognition programs for candidates
• Competing effectively for talent in a constrained employment market – key initiatives include:
• Investment in refreshing employment brands to position the Group as the employer of choice in chosen markets
• Building in-house training capability to upskill people, including formal apprenticeships and cadetships programmes and skills based training
• Development of strategic partnerships with tertiary training providers, community groups and Iwi to provide career development opportunities to high performing candidates.
[ S T R AT E G Y ]
A N N U A L R E P O R T 2 0 1 4 | 1 1

GROWTH
[ K E Y S T R AT E G I E S ]
Growth to $200M in revenue by 2015
ObjectiveInvesting in client relationships to position AWF Group as the preferred supplier of choice.
Continuing to build the AWF and Madison brands as leading experts within their respective functional areas.
Expanding the scope of services that we provide to existing clients as a full spectrum recruitment service provider.
Leveraging the value added service and innovation capability of Madison across the wider group.
Generating profitable new business growth – targeting key accounts that align to our strengths.
Differentiating from competitors as the best and preferred supplier in our chosen markets and growth sectors.
Progress14% revenue growth to $150M.
Secured appointments as the preferred supplier for all recruitment services for two large listed employers and major infrastructure projects.
Leveraging brand research and client feedback insights to align our service model to value drivers for our clients.
Focusing on opportunities within major growth sectors of construction and infrastructure development led from Auckland and Christchurch.
Continuing investment in our capability to respond effectively in a candidate short market, including building the largest pre-vetted pool of work-ready candidates in the country.
OutlookBudgeted revenue to reach $200M in 2015.
Significant cross sell opportunities, leveraging our extensive client base.
Continued investment in building our client-centric culture.
Achieving synergies through offering the value added services that Madison can provide such as 360 degree reporting across key Group accounts, to add value.
Valuing our people
ObjectiveTo be recognised by our people and within the market as one of the best places to work.
To develop a high performance culture through motivating, engaging and developing our people.
Providing opportunities for staff to realise their potential.
ProgressImplementation of our people engagement strategy including:
• Establishing apprenticeships and cadetship programs with 52 employees currently participating in these programs.
• Launching employee recognition and reward scheme and values champions awards to celebrate the contributions of our people.
• Brand research into our employment value proposition for candidates to sharpen our focus on the key areas that matter.
• Implementation of staff surveys to measure employee engagement.
OutlookLaunch of our formal learning and development program.
Investment in expanding our apprenticeship and cadetship programs (22 apprentices currently in training to reach 40 by 2015).
Recruitment and retention focus, through creating a rewarding and positive work environment.
PEOPLE
1 2 | AW F G R O U P

PARTNERSHIPS
[ K E Y S T R AT E G I E S ]
Build enduring partnerships with stakeholders
ObjectivePartner with community groups, training providers and Government institutions to create greater skills development opportunities for our candidates.
Work closely with our key external stakeholders to meet or exceed the best practice standards for our industry.
Build our brand reputation for excellence through championing industry improvement.
ProgressPartnerships with Pasifika Trade Training, Ngai Tahu, CPIT and Weltec to promote temporary work opportunities for trade course trainees and full-time employment for trade graduates in the metropolitan regions.
A strategic relationship with Te Puni Kokiri to provide cadetships to candidates in areas of increasing occupational shortage.
Partnership with Work and Income New Zealand through the Limited Service Volunteers program.
Established market leading health and safety practices resulting in reduced lost time hours as a percentage of total hours to 0.26%.
Developed in-house capability to conduct drug and alcohol screening to meet the AS/NZ 4308.2008 standards for Drug Screening – a recruitment industry differentiator.
Membership to the ACC Accredited Employer Partnership Programme.
OutlookRegular review of stakeholder relationships and engagement to ensure that our mutual objectives are met.
Partnering with other Iwi and institutions to build talent pipelines that meet the needs of our people, communities and clients.
OPERATIONAL
Performance focus to deliver returns
ObjectiveAchieve greater efficiencies across internal processes by redesigning and replacing outdated systems.
Leverage people management systems to improve performance in line with organisational priorities.
Lead the industry for best practice health and safety performance.
ProgressThe implementation of the new Operating and Customer Relationship Management system, commenced with the Tradeforce business and a staged rollout planned for the 35 Allied Work Force branches from July 2014.
Implementation of new HR performance management tools to drive greater transparency and accountability.
Well advanced with developing our health and safety risk management plan to ensure compliance with the reforms in the Health and Safety in Employment Act which will come into effect in April 2015.
Implemented the high risk hazard policy to mitigate the areas which pose the greatest risk of serious harm to our people.
Implemented a comprehensive online health and safety induction program to educate our people on the behaviours that will keep them safe.
Increased the level of drug testing across the business with the investment in two NZQA accredited drug test collectors per branch.
OutlookImplementation of client interface, candidate management and business intelligence tools to dramatically enhance client and candidate experiences.
Continuation of our program of internal and external audits to ensure that our processes and controls are effective in mitigating risk.
Drive greater worker participation through embedding health and safety champions in the business across our temporary and permanent staff.
Engender a culture of open and transparent communication to identify and manage emerging health and safety risks.
A N N U A L R E P O R T 2 0 1 4 | 1 3

[ C H I E F E X E C U T I V E ’ S R E P O R T ]

This has had an impact on profitability in the short term, however the investment was necessary to achieve our priorities for growth and will add significant value moving forward. Further, with the strategies we have in place to improve the quality of our systems and processes, we can expect a return to the previous levels of profitability the Group has enjoyed in the short term.
The key initiatives implemented to drive continuous improvement in FY14 include:
• Strengthening our leadership team
• Embedding the strategic pillars that will position the business for future growth
• Replacement of out-dated Operating System and Customer Relationship Management systems to enhance the efficiency of the processes and controls in place across the business
• Enhancing our customer service capability
• Investment in our people engagement strategy to retain and motivate our people.
The FY15 year will be an exciting one as we realise the benefits of the strong foundations now in place.
Our Strategic pillars:
As a group, our vision is: To be the leading provider of quality recruitment and staffing solutions to New Zealand business.
We have taken some great steps to achieving this aim in 2014.
We are focused on the Strategic Pillars that we believe are critical to our long term success – the key aspects of our strategy are outlined on pages 11-13. Underpinning this is our investment in our people and ensuring that we have the right strategies in place to attract, engage and retain the best people to meet our business needs, as well as those of our clients. Our focus is stronger than it has ever been on strengthening our connection with our candidate and potential candidate base and we have driven technological developments within the Group with this in mind this year.
We are also investing in aligning our business to the needs of our clients now and into the future through leveraging the combined strengths and synergies that the Group can offer, particularly through the addition of Madison’s specialist capability. We are well underway with our marketing and communication strategy which will focus on communicating a refreshed value proposition to the market, culminating in a re-launch of the Group, Madison and Tradeforce websites later in the year.
Underpinning our growth strategy is our desire to add value to our clients with diverse requirements across the recruitment services spectrum. Clients told us that they want to work with fewer providers, but without sacrificing the benefits of genuine specialism in the quite different areas of blue collar operational and white collar corporate recruitment, where the requirements may range from a flexible unskilled work force right through to the permanent placements for mid management and executive level requirements.
The addition of Madison to the Group has already been well received in the market. As a Group, Allied Work Force / Madison were recently selected as the preferred recruitment service provider for two of this country’s largest listed employers.
We have made a significant investment to increase our service delivery capability. The development of our new operating system is well underway and is rolling out across our extensive network. This new technology will drive greater efficiency across all processes as well as providing valuable business intelligence and insights – a benefit both to the Group and to our clients.
Our Financial Performance
Financially, the addition of Madison provided the Group with five months of acquisition growth, propelling the business to yet another revenue record of $148.7m.
The need to strengthen our talent team or, more accurately, invest in Group capability also added over $1m of costs to the business resulting in profit for the period finishing at $3.95m, down 43% on the previous year’s record $6.92m. However, this prior year result benefitted from a $2.24m gain on sale of subsidiary Panacea Healthcare.
I believe that a clearer reflection of the 2014 performance can be gained by looking at underlying earnings. (see notes page 13-43) This non-GAAP measure adjusts for items of amortisation and the profit on disposal of subsidiary. On this measure profit result fell by 14% to $4.65m from $5.42m in 2013. In light of our ongoing investment for the future, this is a sound performance.
The final dividend declared for the year of 7.6cps takes the full year dividend to 14 cps, a reduction of 10% on the 15 cps (excluding a 3 cps special dividend) paid in 2013. Our expectation is that this decrease in returns to shareholders will be reversed in the coming year as the Group realises the benefits of our past investments.
“As our results indicate, this year has been one of consolidation and investment in our capabilities which has added additional cost to the business.”
[ C H I E F E X E C U T I V E S R E P O R T ]
A N N U A L R E P O R T 2 0 1 4 | 1 5

Our People
Combined, the Group, including Allied Work Force, Madison and Tradeforce, now employs 235 permanent staff and over 4,000 temporary and contracting staff every day. It also places more than 3,000 staff into permanent employment each year.
The 2014 year was a challenging one which our people responded to well. It’s pleasing to see the emerging talent already in our business step up into leadership positions through a number of internal promotions. Our recruitment strategies have positioned us strongly for new business growth, including senior sales and marketing appointments to sharpen our winning focus in the market. We have also been successful in retaining the strong leadership team of Madison, who will play a valuable role both in terms of continuing the growth of the existing Madison business, as well as working with the rest of the Group leadership team to leverage the combined value proposition which Allied Work Force / Madison offer to the market.
A snapshot of our businesses
Allied Work Force LimitedAllied Work Force (Allied) is the traditional core blue collar temporary labour provider of the Group. Allied provides semi-skilled and skilled, predominantly temporary staff to industry across the country through a network of 35 branches. Its client base extends across all aspects of industry, with a strong focus on the construction and infrastructure development, manufacturing, food processing, timber processing and waste management sectors.
Allied had a mixed 2014 year with strength in operations evident in the North but a less positive environment in the South. This culminated in a drop in revenue in 2013. Late in the financial period Allied was successful in achieving some significant new client wins and expects to resume their forward momentum in the 2015 year. Expectations are to see solid gains in Christchurch from mid-2014 challenged only by the staff shortages. We are concentrating our business development focus on the Central and Southern North Island to improve our pace of growth.
MadisonMadison was acquired by the Group on 4th November 2013 and traded as part of the Group for 5 months of the 2014 year.
Madison is a generalist white collar recruitment services provider to all aspects of the public and private sectors. Its client base covers a wide range of central and local government business together with a strong corporate sector presence in Health, Insurance, Telco and Banking amongst others. Madison makes up to 1,000 temporary and contract placements daily and over 1,500 permanent placements annually through a network of 5 branch operations in Auckland Central, South Auckland, Hamilton, Wellington and Christchurch.
Madison began to reap the benefits in the period of a stronger economy and more mobility in the white collar sector. The business has performed strongly in line with our expectations. Madison is well positioned for the 2015 year and we have high confidence that it will reach its targets.
Tradeforce RecruitmentTradeforce is our Auckland based provider of semi-skilled and skilled manufacturing and food processing staff to South Auckland industry. Tradeforce experienced a good year as a result of its focus on business retention and quality client management. The new year has commenced positively with a number of good new business opportunities and Tradeforce is showing forward momentum.
Economic outlook
The labour market across all spectrums, from temporary workers to contractors and permanent employees, has changed rapidly since late 2012. A strengthening economy has finally impacted on employer confidence levels to the point that 52% are now seeking to expand their permanent workforce in the second half of 2014. This is considerable improvement over the last 5 years.
Unemployment in New Zealand sits at 6% and falling. However this statistic alone does not paint an accurate picture. A large proportion of this pool has no will to work or is unable to meet the benchmarks required by today’s employers. There is a major imbalance in the availability of potential employees between the three major cities and the regional cities and towns of the country. Christchurch for example has a recorded unemployment rate of 2.4% and the shortage of skilled and unskilled workforce is extreme. Whilst Auckland’s unemployment rate exceeds 7%, the willing workforce is far less and there are shortages in many sectors and across key role types.
Conversely, there is considerable energy in the white collar, contractor and permanent skilled employee sector which is generating job mobility for employees as they search for new challenges or better terms and conditions. The result of this is an increasingly active permanent recruitment sector.
With these changing market dynamics has come an even greater need for employers to demonstrate the benefits of their employment value proposition to employees, not only to attract but to retain staff – a challenge that both the Group and our clients are already responding to.
Focus for the 2015 financial year
As I have stated above, 2015 is a year when we plan to strengthen our focus on attracting and retaining the best candidates the market can offer, which in turn will see us retain the best clients.
Improving the skills of our talented candidate pool will mean we can deliver higher achievers aligned to our clients’ needs. We will do this by offering training and development opportunities such as cadetships and apprenticeships, by working more closely with Industry Training entities and Technical institutions and by developing our interface with candidates.
[ C H I E F E X E C U T I V E S R E P O R T ]
Mike Huddleston Chief Executive Officer
1 6 | AW F G R O U P

Auckland
New Plymouth
Hawera
Wanganui
Kapiti
Nelson
Hamilton
Kerikeri
Whangarei
Waihi
Tauranga
Gisborne
Hawkes Bay
Palmerston North
Rotorua
Wellington
Blenheim
Christchurch
Dunedin
Invercargill
Queenstown
[ O U R L O C AT I O N S ]
City City
West Auckland Mt Roskill Mt Roskill
North Shore East Tamaki
Penrose Silverdale Pukekohe
South East South
Kaitaia
AWF LabourAWF Manufacturing & LogisticsAWF TradesMadisonTradeforce Recruitment
KEY
A N N U A L R E P O R T 2 0 1 4 | 1 7
[ AW F G R O U P ]

The Company will continue to monitor developments in corporate governance practices and update its policies to ensure AWF maintains appropriate standards of governance.
This statement sets out the corporate governance policies, practices and processes followed by the Board throughout the year. AWF complies with the corporate governance principles set out in the NZX Corporate Governance Best Practice Code. The company also complies with the principles in the Financial Markets Authority’s Corporate Governance Principles and Guidelines.
The Board
The Board is responsible for the affairs and activities of the Company. It establishes the Group’s objectives, strategies for achieving these objectives, the overall policy framework within which the business of the Group is conducted, and monitors Management’s performance with respect to these matters. The Board has delegated the day-to-day management of the Group to the Chief Executive Officer. Other delegations are covered in a Delegations Policy.
The Company’s Constitution and the Board Charter set out the policies and guidelines for the operation of the Board.
Board Composition and Operations
As at 31 March 2014, the Board comprised five Directors. Ross Keenan (Chairman), Eduard van Arkel and Julia Hoare have been determined as independent Directors as defined by NZX Listing Rule 1.6.1. Managing Director, Simon Hull, and Chief Executive Officer, Mike Huddleston, are Executive Directors.
The Board is elected by the shareholders of the Company. In accordance with the Company’s constitution and the NZX Listing Rules, one third of the Directors are required to retire by rotation every year and may offer themselves for re-election by shareholders. During the year, Julia Hoare was appointed to the Board at a meeting of the Directors. Ms Hoare’s appointment will be ratified at the annual meeting of shareholders.
The Board holds regularly scheduled meetings and other meetings on an as-required basis. Board papers are circulated ahead of each meeting. The Board has access to senior executives and external advisers to provide further information.
Board Remuneration
Directors’ fees for the year ended 31 March 2014 totalled $177,000. A fee of $70,000 per annum is paid to the Chairman, $42,000 to Eduard van Arkel and Simon Hull, and $45,000 to Julia Hoare ($23,000 paid during the current financial year). Further information is provided in the Statutory Information section of the annual report.
Independent Directors’ fees were last reviewed independently in 2010. Directors are eligible to participate in the Restrictive Share Scheme.
The terms of any Directors’ retirement payments are as prescribed in the Constitution and require prior approval of shareholders in general meeting. No retirement payments have been made to any Director.
The Board of Directors of AWF is responsible for the corporate governance of the Company. The Board has established a culture that ensures commitment to and compliance with good corporate governance principles, and ethical conduct is at the heart of the Company’s business practices.
[ C O R P O R AT E G O V E R N A N C E S TAT E M E N T ]
A N N U A L R E P O R T 2 0 1 4 | 1 9
[ C O R P O R AT E G O V E R N A N C E S TAT E M E N T ]
5. Organisation CommitteeThe role of the Organisation Committee shall be a reference point for the Chief Executive in matters around organisational change as shall be required from time to time. The committee is also responsible for reviewing Directors’ fees, the Chief Executive’s remuneration and for setting and reviewing the remuneration policies of the company.
The members of the Committee are Eduard van Arkel (Chairman), Ross Keenan, Simon Hull, Julia Hoare.
Remuneration of Auditors
Details of remuneration paid to Auditors are set out in note 11 of the Financial Statements.
Non-Audit Services
The External Financial Auditors Independence Policy sets out the Company’s position in regard to non-audit services.
Deloitte are the auditors of AWF Group Limited and whilst their main role is to provide audit services to the Company, the Company does employ their specialist advice where appropriate. In each instance, the Board has considered the nature of the advice sought in context of the audit relationship. In accordance with the advice received from the Audit, Finance and Risk Committee, the Board does not consider these services have compromised the auditor independence for the following reasons:
• All non-audit services have been reviewed by the Audit, Finance and Risk Committee to ensure they do not impact the impartiality and objectivity of the auditor
• None of the services undermined the general principles relating to auditor independence, including not reviewing or auditing the auditor’s own work, not acting in a management or decision making capacity for the Company, not acting as advocate for the Company or not jointly sharing economic risk or rewards.
Board Committees
The Board has five formally constituted committees of Directors. Each Committee has a charter or terms of reference that establishes its purpose, structure and responsibilities. The Committees make recommendations to the Board and may only make decisions on matters for which they have been given specific authority.
1. Audit, Finance and Risk Committee The Audit, Finance and Risk Committee provides assurance and assistance to the Board and Chief Executive on the Company’s risk, control and compliance framework, and its external financial reporting and accountability responsibilities.
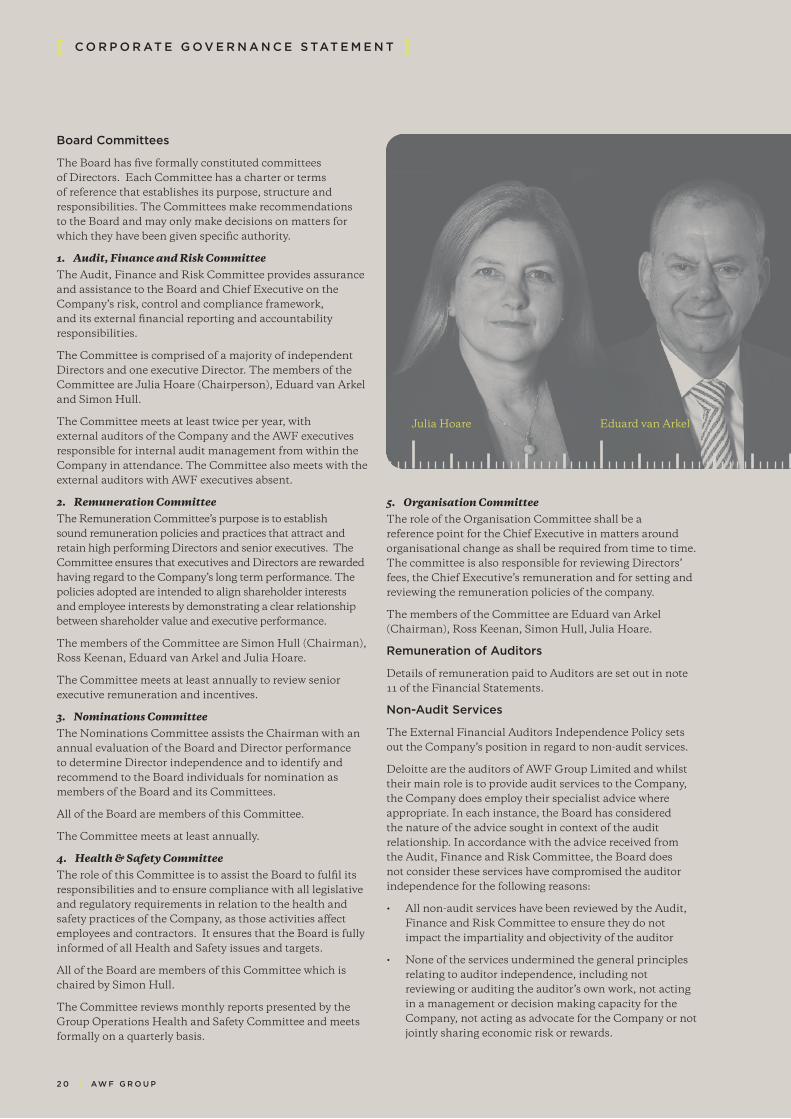
The Committee is comprised of a majority of independent Directors and one executive Director. The members of the Committee are Julia Hoare (Chairperson), Eduard van Arkel and Simon Hull.
The Committee meets at least twice per year, with external auditors of the Company and the AWF executives responsible for internal audit management from within the Company in attendance. The Committee also meets with the external auditors with AWF executives absent.
2. Remuneration CommitteeThe Remuneration Committee’s purpose is to establish sound remuneration policies and practices that attract and retain high performing Directors and senior executives. The Committee ensures that executives and Directors are rewarded having regard to the Company’s long term performance. The policies adopted are intended to align shareholder interests and employee interests by demonstrating a clear relationship between shareholder value and executive performance.
The members of the Committee are Simon Hull (Chairman), Ross Keenan, Eduard van Arkel and Julia Hoare.
The Committee meets at least annually to review senior executive remuneration and incentives.
3. Nominations Committee The Nominations Committee assists the Chairman with an annual evaluation of the Board and Director performance to determine Director independence and to identify and recommend to the Board individuals for nomination as members of the Board and its Committees.
All of the Board are members of this Committee.
The Committee meets at least annually.
4. Health & Safety CommitteeThe role of this Committee is to assist the Board to fulfil its responsibilities and to ensure compliance with all legislative and regulatory requirements in relation to the health and safety practices of the Company, as those activities affect employees and contractors. It ensures that the Board is fully informed of all Health and Safety issues and targets.
All of the Board are members of this Committee which is chaired by Simon Hull.
The Committee reviews monthly reports presented by the Group Operations Health and Safety Committee and meets formally on a quarterly basis.
Julia Hoare Eduard van Arkel
2 0 | AW F G R O U P

Share Trading
The Company has adopted a Securities Trading policy that sets out the formal procedures Directors and employees are required to follow to ensure compliance with the Securities Act 1988.
Diversity
The Company does not currently have a diversity policy however the Directors are considering the introduction of such a policy, consistent with their belief that a diverse workforce contributes to improved business performance, enables innovation and enhances the Company’s relationship with its customers.
Directors’ indemnity and insurance
The Company has insured all its Directors and the Directors of its subsidiaries against liabilities to other parties (except the Company or a related party of the Company) that may arise from their position as Directors. The insurance does not cover liabilities arising from criminal actions.
The Company has executed a Deed of Indemnity, indemnifying all Directors to the extent permitted by section 162 of the Companies Act 1993.
Risk Management
The Board is responsible for ensuring that key business and financial risks are identified and appropriate controls and procedures are in place to effectively manage those risks. In managing the Company’s business risks, the Board approves and monitors policy and process in such areas as internal
Gender Composition of Directors and Officers
Directors Officers(Senior Management)
Male 4 12
Female 1 9
[ C O R P O R AT E G O V E R N A N C E S TAT E M E N T ]
audit, treasury management, financial performance and capital expenditure. The Board also monitors expenditure against approved projects and approves the capital plan.
The Company has insurance policies in place covering most areas of risk to its assets and business. Policies are reviewed and renewed annually with reputable insurers.
Directors may seek their own independent professional advice to assist with their responsibilities. During the 2013 financial year no Director sought their own independent professional advice.
Interests Register
The board maintains an Interests Register. In considering matters affecting the Company, Directors are required to disclose any actual or potential conflicts. Where a conflict or potential conflict has been disclosed, the Director takes no further part in receipt of information or participation in discussions on that matter.
Disclosure/Shareholder Relations
The Company has procedures in place to ensure key financial and material information is communicated to the market in a clear and timely manner.
Consistent with best practice and a policy of continuous disclosure, external communications that may contain market sensitive data are released through NZX in the first instance. Further communication is encouraged with press releases through mainstream media.
The Company’s website is actively used as a portal for shareholder reports, news releases and other communications released to shareholders and media.
The Board formally reviews its proceedings at the conclusion of each meeting to determine whether there may be a requirement for a disclosure announcement.
Ross Keenan Simon HullMichael Huddleston
A N N U A L R E P O R T 2 0 1 4 | 2 1
Report on the Financial StatementsWe have audited the financial statements of AWF Group Limited and group on pages 23 to 60, which comprise the consolidated and separate statements of financial position of AWF Group Limited, as at 31 March 2014, the consolidated and separate statements of comprehensive income, statements of changes in equity and statements of cash flows for the year then ended, and a summary of significant accounting policies and other explanatory information.
This report is made solely to the company’s shareholders, as a body, in accordance with Section 205(1) of the Companies Act 1993. Our audit has been undertaken so that we might state to the company’s shareholders those matters we are required to state to them in an auditor’s report and for no other purpose. To the fullest extent permitted by law, we do not accept or assume responsibility to anyone other than the company’s shareholders as a body, for our audit work, for this report, or for the opinions we have formed.
Board of Directors’ Responsibility for the Financial StatementsThe Board of Directors are responsible for the preparation of financial statements in accordance with generally accepted accounting practice in New Zealand and that give a true and fair view of the matters to which they relate, and for such internal control as the Board of Directors determine is necessary to enable the preparation of financial statements that are free from material misstatement, whether due to fraud or error.
Auditor’s ResponsibilitiesOur responsibility is to express an opinion on these financial statements based on our audit. We conducted our audit in accordance with International Standards on Auditing and International Standards on Auditing (New Zealand). Those standards require that we comply with ethical requirements and plan and perform the audit to obtain reasonable assurance about whether the financial statements are free from material misstatement.
An audit involves performing procedures to obtain audit evidence about the amounts and disclosures in the financial statements. The procedures selected depend on the auditor’s judgement, including the assessment of the risks of material misstatement of the financial statements, whether due to fraud or error. In making those risk assessments, the auditor considers internal control relevant
to the entity’s preparation of financial statements that give a true and fair view of the matters to which they relate in order to design audit procedures that are appropriate in the circumstances, but not for the purpose of expressing an opinion on the effectiveness of the entity’s internal control. An audit also includes evaluating the appropriateness of the accounting policies used and the reasonableness of accounting estimates, as well as the overall presentation of the financial statements.
We believe that the audit evidence we have obtained is sufficient and appropriate to provide a basis for our audit opinion.
Other than in our capacity as auditor and the provision of IT advisory services and due diligence services, we have no relationship with or interests in AWF Group Limited or any of its subsidiaries.
OpinionIn our opinion, the financial statements on pages 23 to 60:
• complywithgenerallyacceptedaccountingpracticein New Zealand;
• complywithInternationalFinancialReportingStandards; and
• giveatrueandfairviewofthefinancialpositionof AWF Group Limited and group as at 31 March 2014, and their financial performance and cash flows for the year then ended.
Report on Other Legal and Regulatory RequirementsWe also report in accordance with section 16 of the Financial Reporting Act 1993. In relation to our audit of the financial statements for the year ended 31 March 2014:
• wehaveobtainedalltheinformationandexplanationswe have required; and
• inouropinionproperaccountingrecordshavebeenkept by AWF Group Limited as far as appears from our examination of those records.
Chartered Accountants28 May 2014Auckland, New Zealand
To the shareholders of
AWF Group Limited
[ I N D E P E N D E N T A U D I T O R ’ S R E P O R T ]
This audit report relates to the financial statements of AWF Group Ltd for the year ended 31 March 2014 included on AWF Group Ltd’s website. The Board is responsible for the maintenance and integrity of AWF Group Ltd’s website. We have not been engaged to report on the integrity of the AWF Group Ltd’s website. We accept no responsibility for any changes that may have occurred to the financial statements since they were initially presented on the website. The audit report refers only to the financial statements named above. It does not provide an opinion on any other information which may have been hyperlinked to/from these financial statements. If readers of this report are concerned with the inherent risks arising from electronic data communication they should refer to the published hard copy of the audited financial statements and related audit report to confirm the information included in the audited financial statements presented on this website. Legislation in New Zealand governing the preparation and dissemination of financial statements may differ from legislation in other jurisdictions.
2 2 | AW F G R O U P

Group Company
Notes 31/03/2014 31/03/2013 31/03/2014 31/03/2013$'000 $'000 $'000 $'000
Revenue 5 148,691 130,477 2,100 1,688
Investment revenue 6 51 22 4,859 4,088
Profit on sale of subsidiary 7 1,030
Direct costs (2,936) (2,917)
Employee benefits expense 11 (129,417) (112,403) (1,038) (1,069)
Depreciation and amortisation expense 11 (1,879) (879)
Other operating expenses 11 (7,696) (6,819) (316) (316)
Finance costs 8 (714) (289) (585) (170)
Acquisition related costs expense (257) (257)
Profit before tax 11 5,843 7,192 4,763 5,251
Income tax expense 9 (1,891) (2,240) (58) (55)
Profit for the period from continuing operations
3,952 4,952 4,705 5,196
Discontinued operations
Profit for the period from discontinued operations
10 1,971
Profit for the period 3,952 6,923 4,705 5,196
Other comprehensive income
Total comprehensive income for the period, net of tax
3,952 6,923 4,705 5,196
Profit for the period income is attributable to equity holders of the parent
3,952 6,923
Total comprehensive income is attributable to equity holders of the parent
3,952 6,923
Earnings per share
Total basic and diluted earnings per share (cents/share)
12 15.1 26.5
AWF Group LimitedStatement of Comprehensive Incomefor the year ended 31 March 2014
These financial statements should be read in conjunction with the notes to the financial statements on pages 27 to 60.
[ F I N A N C I A L S TAT E M E N T S ]
A N N U A L R E P O R T 2 0 1 4 | 2 3

Group Company
Notes 31/03/2014 31/03/2013 31/03/2014 31/03/2013$'000 $'000 $'000 $'000
Assets
Non-current assets
Property, plant and equipment 20 2,220 1,674
Investments in subsidiaries 16 64,328 28,328
Goodwill 21 28,694 10,561
Other intangible assets 22 18,224 2,433
Deferred tax 9 775 4
49,138 15,443 64,328 28,332
Current assets
Trade and other receivables 15 24,677 18,559 8
Cash and cash equivalents 14 3,146 1,373 1,386 1,745
Taxation paid in advance 9 11
Advances to subsidiaries 31 11,234 10,974
27,823 19,932 12,639 12,719
Total assets 76,961 35,375 76,967 41,051
Equity and liabilities
Capital and reserves
Share capital 26 14,545 14,545 39,198 39,198
Treasury account 27 (803) (803) (803) (803)
Group share scheme reserve 28 86 23 86 23
Retained earnings 29 6,935 7,842 1,424 1,578
Equity attributable to equity holders of the parent
20,763 21,607 39,905 39,996
Total equity 20,763 21,607 39,905 39,996
Non-current liabilities
Deferred tax liabilities 9 1,405 25
Borrowings 24 28,183 803 28,183 803
29,588 803 28,208 803
Current liabilities
Trade and other payables 23 17,268 11,319 354 227
Borrowings 24 2,500 2,500
Taxation payable 9 570 1,238 25
Provisions 25 272 408
Madison Group second payment 18 6,000 6,000
26,610 12,965 8,854 252
Total liabilities 56,198 13,768 37,062 1,055
Total equity and liabilities 76,961 35,375 76,967 41,051
AWF Group LimitedStatement of Financial Positionas at 31 March 2014
These financial statements should be read in conjunction with the notes to the financial statements on pages 27 to 60.
[ F I N A N C I A L S TAT E M E N T S ]
2 4 | AW F G R O U P

Group Company
Notes 31/03/2014 31/03/2013 31/03/2014 31/03/2013$'000 $'000 $'000 $'000
Cash flows from operating activities
Receipts from customers 147,671 136,456 2,092 1,688
Dividends Received 4,859 4,088
Interest Received 51 22
Payments to suppliers and employees (139,297) (128,189) (1,421) (1,275)
Net cash generated from operations 8,425 8,289 5,530 4,501
Income taxes paid (3,225) (2,183) (65) 66
Interest paid (714) (337) (585) (170)
Net cash from operating activities 32 4,486 5,769 4,880 4,397
Cash flows from investing activities
Proceeds on disposal of property, plant and equipment
65 117
Payments for property, plant and equipment
20 (850) (825)
Payments for intangible assets 22 (322) (1,491)
Acquisition of subsidiaries 18 (26,627) (1,845) (30,000)
Sale of subsidiary 19 6,729 5,783
Retention funds paid on acquisition of subsidiary
300
Net cash (used in)/from investing activities (27,734) 2,985 (30,000) 5,783
Cash flows from financing activities
Dividends paid to equity holders of the parent
29 (4,859) (3,738) (4,859) (3,738)
Payment for share buy-back to equity holders of the parent
(802) (802)
Advances to subsidiaries (260) (554)
Proceeds from borrowings 29,880 803 29,880 803
Repayment of borrowings (4,403) (4,403)
Net cash from/(used in) financing activities 25,021 (8,140) 24,761 (8,694)
Net increase in cash and cash equivalents 1,773 614 (359) 1,486
Cash and cash equivalents at the beginning of the period
1,373 759 1,745 259
Cash and cash equivalents at the end of the period
Bank balances and cash 14 3,146 1,373 1,386 1,745
AWF Group LimitedConsolidated Cash Flow Statementfor the year ended 31 March 2014
These financial statements should be read in conjunction with the notes to the financial statements on pages 27 to 60.
[ F I N A N C I A L S TAT E M E N T S ]
A N N U A L R E P O R T 2 0 1 4 | 2 5
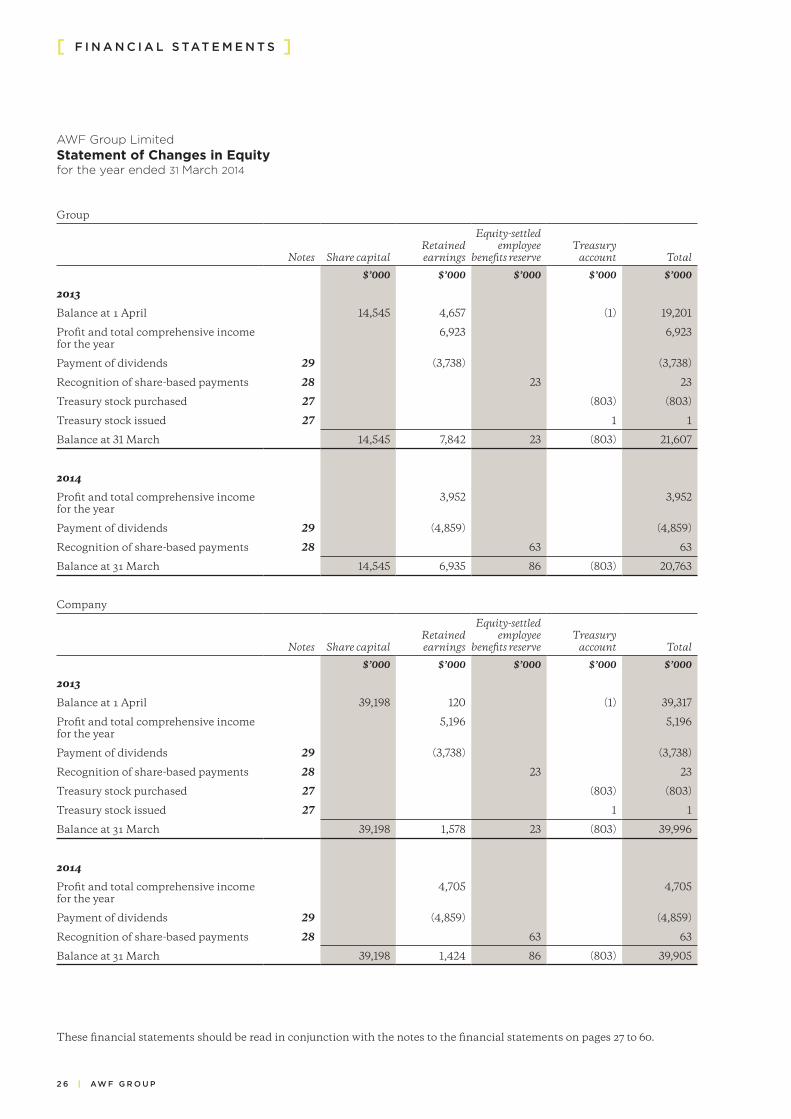
Group
Notes
Share capital
Retained earnings
Equity-settled employee
benefits reserve
Treasury
account
Total
$’000 $’000 $’000 $’000 $’000
2013
Balance at 1 April 14,545 4,657 (1) 19,201
Profit and total comprehensive income for the year
6,923 6,923
Payment of dividends 29 (3,738) (3,738)
Recognition of share-based payments 28 23 23
Treasury stock purchased 27 (803) (803)
Treasury stock issued 27 1 1
Balance at 31 March 14,545 7,842 23 (803) 21,607
2014
Profit and total comprehensive income for the year
3,952 3,952
Payment of dividends 29 (4,859) (4,859)
Recognition of share-based payments 28 63 63
Balance at 31 March 14,545 6,935 86 (803) 20,763
Company
Notes
Share capital
Retained earnings
Equity-settled employee
benefits reserve
Treasury
account
Total
$’000 $’000 $’000 $’000 $’000
2013
Balance at 1 April 39,198 120 (1) 39,317
Profit and total comprehensive income for the year
5,196 5,196
Payment of dividends 29 (3,738) (3,738)
Recognition of share-based payments 28 23 23
Treasury stock purchased 27 (803) (803)
Treasury stock issued 27 1 1
Balance at 31 March 39,198 1,578 23 (803) 39,996
2014
Profit and total comprehensive income for the year
4,705 4,705
Payment of dividends 29 (4,859) (4,859)
Recognition of share-based payments 28 63 63
Balance at 31 March 39,198 1,424 86 (803) 39,905
AWF Group LimitedStatement of Changes in Equityfor the year ended 31 March 2014
These financial statements should be read in conjunction with the notes to the financial statements on pages 27 to 60.
[ F I N A N C I A L S TAT E M E N T S ]
2 6 | AW F G R O U P

1. General informationAWF Group Limited (the Company) is a listed company incorporated in New Zealand. The addresses of its registered office and principal place of business are disclosed in the directory to the annual report. The principal activities of the Company and its subsidiaries (the Group) are described in note 4.
The Company is a profit-oriented entity incorporated and domiciled in New Zealand. Its principal services are the supply of temporary staff and recruitment of permanent staff.
2. Summary of significant accounting policies2.1 Statement of compliance
The company is a reporting entity for the purposes of the Financial Reporting Act 1993 and its financial statements comply with that Act.
The financial statements have been prepared in accordance with Generally Accepted Accounting Practice in New Zealand (‘NZ GAAP’). They comply with New Zealand equivalents to International Financial Reporting Standards (‘NZ IFRS’) and other applicable Financial Reporting Standards as appropriate for profit-oriented entities.
The financial statements comply with the International Financial Reporting Standards (‘IFRS’).
The financial statements were authorised for issue by the directors on 28 May 2014.
2.2 Basis of preparationThe Group financial statements have been prepared on the historical cost basis. Accounting policies are selected and applied in a manner which ensures that the resulting financial information satisfies the concepts of relevance and reliability, thereby ensuring that the substance of the underlying transactions or other events is reported. The functional and presentation currency is New Zealand dollars. The principal accounting policies adopted are set out below.
2.3 Accounting judgements and major sources of estimation uncertaintyIn the application of the Group’s accounting policies, the directors are required to make judgements, estimates and assumptions about the carrying amounts of assets and liabilities that are not readily apparent from other sources. The estimates and associated assumptions are based on historical experience and other factors that are considered to be relevant. Actual results may differ from these estimates. Refer to note 3 for further discussion.
2.4 Adoption of new and revised Standards and InterpretationsAdoption status of relevant new financial reporting standards and interpretationsStandards, interpretations and amendments to published standards that came into effect during the reporting yearCertain new standards, amendments and interpretations to existing standards have been published that are mandatory for the Group’s accounting periods beginning on or after 1 April 2013. Where applicable, comparative years have been restated in accordance with the standards, interpretations and amendments.
NZ IFRS 10 Consolidated Financial Statements, NZ IAS 27 Separate Financial Statements (revised 2011), NZ IAS 28 Investments in Associates and Joint Ventures (revised 2011) – effective for annual reporting periods beginning on or after 1 January 2013. NZ IFRS 10 replaces NZ IAS 27 Consolidated and Separate Financial Statements and NZ SIC-12 Consolidation – Special Purpose Entities. This amendment does not affect any of the amounts recognised in the financial statements and no additional disclosure is required in the current period.
NZ IFRS 11 Joint Arrangements- applicable to annual reporting periods beginning on or after 1 January 2013. This standard replaces NZ IAS 31 Interests in Joint Ventures, and requires a party to a joint arrangement to determine the type of joint arrangement in which it is involved by assessing its rights and obligations and then account for those rights and obligations in accordance with that type of joint arrangement as defined in this standard. This amendment does not affect any of the amounts recognised in the financial statements and no additional disclosure is required in the current period.
NZ IFRS 12 Disclosure of Interests in Other Entities – effective for annual periods beginning on or after 1 January 2013 with early adoption permitted. This Standard applies to entities that have an interest in subsidiaries, joint arrangements, associates or unconsolidated structured entities. It establishes disclosure objectives and specifies minimum disclosures that an entity must provide to meet those objectives. The adoption of this standard requires the Group to disclose information that helps users of its financial statements evaluate the nature of and risks associated with its interests in other entities and the effects of those interests on its financial statements. This amendment does not affect any of the amounts recognised in the financial statements and no additional disclosure is required in the current period.
NZ IFRS 13 Fair Value measurement- effective for the annual periods beginning on or after 1 January 2013, with early application permitted.
AWF Group LimitedNotes to the Financial Statementsfor the year ended 31 March 2014
[ N O T E S T O T H E F I N A N C I A L S TAT E M E N T S ]
A N N U A L R E P O R T 2 0 1 4 | 2 7

This Standard establishes a single framework for measuring fair value where that is required by other Standards, and applied to both financial and non-financial items measured at fair value. This amendment only affects amounts recognised at fair value regarding the acquired intangible assets from Madison Group (see notes 18 and 22). There are however no additional disclosures required in the current period.
Amendments to NZ IAS 19 Employee Benefits (2011) - applicable to annual reporting periods beginning on or after 1 January 2013. This amendment revises the requirements for pensions and other post-retirement benefits, termination benefits and other changes. The Group does not anticipate any significant impact to the result from application of this standard. This amendment does not affect any of the amounts recognised in the financial statements and no additional disclosure is required in the current period.
Annual Improvements to NZ IFRSs: 2009-2011 Cycle – effective for annual periods beginning on or after 1 January 2013. The annual improvements are largely clarifications, including amendments to NZ IAS 1: Presentation of Financial Statements which reduce the requirements for comparative information in the event of a change in accounting policy, reclassification or restatement. These amendments do not affect any of the amounts recognised in the financial statements and no additional disclosure is required in the current period.
Amendments to NZ IFRS 7 Financial Instruments: Disclosures — Offsetting Financial Assets and Financial Liabilities – effective for annual periods beginning on or after 1 January 2013. This amends the disclosure requirements in NZ IFRS 7 Financial Instruments: Disclosure to require information about all recognised financial instruments that are set off in accordance with NZ IAS 32 Financial Instruments: Presentation. The amendments also require disclosure of information about recognised financial instruments subject to enforceable master netting arrangements and similar agreements even if they are not set off under NZ IAS 32. This amendment does not affect any of the amounts recognised in the financial statements and no additional disclosure is required in the current period.
NZ IAS 1 (amendment) Presentation of Financial Statements - effective for annual periods beginning on or after 1 July 2012 with earlier application permitted. The amendments retain the option to present profit or loss and other comprehensive income in either a single continuous statement or in two separate but consecutive statements. Items of other comprehensive income are required to be grouped into those that will and will not subsequently be reclassified to profit or loss. Tax on items of other
comprehensive income is required to be allocated on the same basis. The measurement and recognition of items of profit or loss and other comprehensive income are not affected by the amendment. This amendment did not affect any of the amounts recognised in the financial statements.
Standards, amendments and interpretations to existing standards that are not yet effective and have not been early adopted by the Group
Certain new standards, amendments and interpretations to existing standards have been published that are mandatory for the Group’s accounting periods beginning on or after 1 April 2014 but which the Group has not early adopted:
NZ IFRS 9 Financial instruments – effective for annual reporting periods beginning on or after 1 January 2017 with early adoption permitted. This standard introduces new requirements for the classification and measurement of financial assets. All recognised financial assets that are currently in the scope of NZ IAS 39 will be measured at either amortised cost or fair value. In order for financial assets to be measured at amortised cost certain criteria must be met. A revision to NZ IFRS 9 also adds guidance on the classification and measurement of financial liabilities and the derecognition of financial instruments. Most of the requirements in NZ IAS 39 for classification and measurement of financial liabilities were carried forward unchanged to NZ IFRS 9. Most of the requirements in NZ IAS 39 in relation to the derecognition of financial assets and financial liabilities have been retained, but additional disclosures are now required under NZ IFRS 7. This new standard and subsequent revision are likely to affect the Group’s accounting for its financial assets and liabilities. However, the Group is yet to assess NZ IFRS 9’s full impact and has not yet decided when to adopt NZ IFRS 9.
Amendments to NZ IFRS 10 Consolidated Financial Statements, NZ IFRS 12 Disclosure of Interests in Other Entities and NZ IAS 27 Separate Financial Statements – Investment Entities – effective for annual periods beginning on or after 1 January 2014. The amendments set out new requirements for investment entities. Where an entity qualifies as an “investment entity” it does not consolidate its subsidiaries but measures its investments at fair value. Consideration of the criteria for meeting the definition of an “investment entity” will require a degree of judgement based on facts and circumstances, and these changes may impact entities beyond those traditionally seen as investment-type entities. The Group is yet to assess the full impact of these amendments.
[ N O T E S T O T H E F I N A N C I A L S TAT E M E N T S ]
2 8 | AW F G R O U P
NZ IAS 32 (amendment) Financial Instruments: Presentation - Offsetting Financial Assets and Financial Liabilities - effective for annual periods beginning on or after 1 January 2014 and requires retrospective application for comparative periods. The amendments are intended to clarify existing application issues relating to the offsetting rules and reduce the level of diversity in current practice. The amendment clarifies the meaning of ‘currently has a legally enforceable right of set-off ’ and ‘simultaneous realisation and settlement’. The Group does not anticipate any significant impact to result from the application of this amendment.
NZ IAS 39 (amendment) Financial Instruments – Recognition and Measurement - effective for annual periods beginning on or after 1 January 2014. The amendments permit the continuation of hedge accounting in circumstances where a derivative, which has been designated as a hedging instrument, is novated from one counterparty to a central counterparty as a consequence of laws or regulations. The Group does not anticipate any significant impact to result from the application of this amendment.
FRS 42 Prospective Financial Statements and FRS 44 New Zealand Additional Disclosures (amendment) - effective for annual periods beginning on or after 1 January 2014. The amendments resolve a conflict between the requirements of FRS 42 to present prospective financial statements in respect of an annual period, and the requirements of the Securities Regulations 2009 (in certain cases) to present prospective financial statements in respect of an interim period. The amendments to FRS 42 permit an entity to present prospective financial statements in respect of an interim period but also require the entity, under FRS 44, to present a comparison of actual amounts versus the previously published prospective interim financial information in the subsequent interim financial statements. The Group does not anticipate any significant impact to result from the application of this amendment.
NZ IAS 19 (amendment) Defined Benefit Plans: Employee Contributions - effective for annual periods beginning on or after 1 July 2014. The amendments reduce the complexity of allocating employee or third party contributions to a defined benefit plan to periods of service using the projected unit credit method. Instead, entities are permitted to account for contributions which are independent of the number of years of service, as a reduction in the service cost in the same period in which they are payable (e.g. where the contribution is a fixed percentage of an employee’s salary). This is an accounting policy choice. Other contributions are required to be attributed to periods of service either using the plan’s contribution formula,
or on a straight line basis. The Group does not anticipate any significant impact to result from the application of this amendment.
Annual Improvements to NZ IFRSs: 2010-2012 Cycle – effective for annual periods beginning on or after 1 July 2014. The annual improvements are largely clarifications, covering:
• thedefinitionofvestingconditioninNZIFRS2Share based payments
• accountingforcontingentconsiderationinabusiness combination under NZ IFRS 3 Business Combinations
• disclosurereaggregatingoperatingsegmentsunder NZ IFRS 8 Operating Segments
• fairvalueofshorttermreceivablesandpayablesunder NZ IFRS 13 Fair Value Measurement
• restatementofaccumulateddepreciation/amortisation under the revaluation method in NZ IAS 16 Property, Plant and Equipment and NZ IAS 38 Intangible Assets
• managemententitiesprovidingkeymanagementpersonnel services to a reporting entity under NZ IAS 24 Related Party Disclosures.
The Group is yet to assess the full impact of these amendments.
Annual Improvements to NZ IFRSs: 2011-2013 Cycle – effective for annual periods beginning on or after 1 July 2014. These annual improvements are also largely clarifications, including clarification of the:
• scopeexclusionforjointventuresunderNZIFRS3 Business Combinations
• scopeoftheportfolioexceptionunderNZIFRS13Fair Value Measurement
• interrelationshipbetweenNZIFRS3BusinessCombinations and NZ IAS 40 Investment Property.
The Group is yet to assess the full impact of these amendments.
2.5 Basis of consolidationThe consolidated financial statements incorporate the financial statements of the Company and entities (including structured entities) controlled by the Company and its subsidiaries. Control is achieved when the Company:
• haspowerovertheinvestee;• isexposed,orhasrights,tovariablereturnsfrom
its involvement with the investee; and• hastheabilitytouseitspowertoaffectitsreturns.
The Company reassesses whether or not it controls an investee if facts and circumstances indicate that there are changes to one or more of the three elements of control listed above.
[ N O T E S T O T H E F I N A N C I A L S TAT E M E N T S ]
A N N U A L R E P O R T 2 0 1 4 | 2 9

With effect from 1 April 2005, AWF Group Limited acquired the share capital of Allied Work Force Limited (previously known as Allied Work Force Regional Limited), affected through an exchange of equity interests. Allied Work Force Limited has the power to govern the financial and operating policies of AWF Group Limited and in accordance with NZ IFRS 3 Business Combinations (2004) paragraph 21, was treated as the acquirer for reporting purposes and the business combination of Allied Work Force Limited and AWF Group Limited was accounted for as a reverse acquisition. The effect of this treatment is that the financial statements represent a continuation of the business of Allied Work Force Limited.
Non controlling interests in the net assets of consolidated subsidiaries are identified separately from the Group’s equity therein. The interests of non controlling shareholders may be initially measured either at fair value or at the non controlling interest’s proportionate share in the fair value of the acquiree’s identifiable net assets. The choice of measurement basis is made on an acquisition-by-acquisition basis. Subsequent to acquisition, non controlling interest consists of the amount attributed to such interests at initial recognition and the non controlling interest’s share of changes in equity since the date of combination. Total comprehensive income is allocated between equity holders of the parent and to non-controlling interests even if this results in the non controlling interests having a deficit balance.
The results of subsidiaries acquired or disposed of during the year are included in profit or loss from the effective date of acquisition or up to the effective date of disposal, as appropriate. Where necessary, adjustments are made to the financial statements of subsidiaries to bring the accounting policies used into line with those used by other members of the Group.
All intra group transaction, balances, income and expenses are eliminated in full on consolidation.
Changes in the Group’s interest in a subsidiary that do not result in a loss of control are accounted for as equity transactions. Any difference between the amount by which the non controlling interests are adjusted and the fair value of the consideration paid or received is recognised directly in equity and attributed to owners of the Company.
When the Group loses control of a subsidiary, the profit or loss on disposal is calculated as the difference between:
1. the aggregate of the fair value of the consideration received and the fair value of any retained interest; and
2. the previous carrying amount of the assets (including goodwill), and liabilities of the subsidiary and any non controlling interest.
Amounts previously recognised in other comprehensive income in relation to the subsidiary are accounted for (i.e. reclassified to profit or loss or transferred directly to retained earnings) in the same manner as would be required if the relevant assets or liabilities were disposed of. The fair value of any investment retained in the former subsidiary at the date when control is lost is regarded as the fair value on initial recognition for subsequent accounting under NZ IAS 39 Financial Instruments: Recognition and Measurement or, when applicable, the cost on initial recognition of an investment in an associate or jointly controlled entity.
2.5.1 Business combinationsAcquisition of subsidiaries and businesses are accounted for using the acquisition method.
The cost of the acquisition is measured at the aggregate of the fair values, at the date of exchange, of assets given, liabilities incurred or assumed, and equity instruments issued by the Group in exchange for control of the acquiree. Acquisition related costs are recognised in profit or loss as incurred.
Where applicable, the cost of acquisition includes any asset or liability resulting from a contingent consideration arrangement, measured at its acquisition date fair value. Subsequent changes in such fair values are adjusted against the cost of acquisition where they qualify as measurement period adjustments (see below). All other subsequent changes in the fair value of contingent consideration classified as an asset or liability are accounted for in accordance with relevant NZ IFRSs. Changes in the fair value of contingent consideration classified as equity are not recognised.
The Group’s goodwill policy is set out in note 2.13.
The acquiree’s identifiable assets, liabilities and contingent liabilities that meet conditions for recognition under NZ IFRS 3 (2008) are recognised at their fair value at the acquisition date, except that:
• deferredtaxassetsorliabilitiesorassetsrelatedtoemployee benefit arrangements are recognised and measured in accordance with NZ IAS 12 Income taxes and NZ IAS 19 Employee Benefits respectively;
• liabilitiesorequityinstrumentsrelatedtothereplacement by the Group of an acquiree’s share based payment awards are measured in accordance with NZ IFRS 2 Share based Payment, and
• assets(ordisposalgroups)thatareclassifiedasheld for sale in accordance with NZ IFRS 5 Non Current Assets Held for Sale and Discontinued Operations are recognised and measured at fair value less cost to sell.
If the initial accounting for a business combination is incomplete by the end of the reporting period in which the combination occurs, the Group reports
[ N O T E S T O T H E F I N A N C I A L S TAT E M E N T S ]
3 0 | AW F G R O U P
provisional amounts for the items for which the accounting is incomplete. Those provisional amounts are adjusted during the measurement period (see below), or additional assets or liabilities are recognised to reflect new information obtained about facts and circumstances that existed as of the acquisition date that, if known, would have affected the amounts recognised as of that date.
The measurement period is the period from the date of acquisition to the date the Group receives complete information about facts and circumstances that existed as of the acquisition date and is subject to a maximum of one year.
Where a business combination is achieved in stages, the Group’s previously held interests in the acquired entity are remeasured to fair value at the acquisition date (i.e. the date the Group attains control) and the resulting gain or loss, if any, is recognised in profit or loss. Amounts arising from interests in the acquiree prior to the acquisition date that have previously been recognised in other comprehensive income are reclassified to profit or loss, where such treatment would be appropriate if that interest were disposed of.
2.6 Goods and services taxRevenues, expenses, liabilities and assets are recognised net of the amount of goods and services tax (GST), except:
i. where the amount of GST incurred is not recoverable from the taxation authority, it is recognised as part of the cost of acquisition of an asset or as part of an item of expense; or
ii. for receivables and payables which are recognised inclusive of GST.
The net amount of GST recoverable from, or payable to, the taxation authority is included as part of receivables or payables. Cash flows are included in the statement of cash flows on a gross basis. The GST component of cash flows arising from investing and financing activities which is recoverable from, or payable to, the taxation authority is classified as operating cash flows.
2.7 Revenue recognitionRevenue is measured at the fair value of the consideration received or receivable. Permanent placement fees are recognised in the accounting period when a candidate accepts an offer of employment. Temporary and contractors placements fees are recognised when services are provided. Revenue is reduced for estimated customer returns, rebates and other similar allowances.
2.7.1 Rendering of servicesRevenue from the provision of services is recognised when the services are provided.
2.7.2 Dividend and interest revenueDividend revenue from investments is recognised when the shareholder’s right to receive payment has been established.
Interest revenue is accrued on a time basis using the effective interest method.
2.8 Borrowing costsBorrowing costs are recognised in the profit or loss in the period in which they are incurred.
2.9 TaxationIncome tax expense represents the sum of the tax currently payable and deferred tax.
2.9.1 Current taxThe tax currently payable is based on taxable profit for the year. Taxable profit differs from profit as reported in the statement of comprehensive income because it excludes items of income or expenses that are taxable or deductible in other years and it further excludes items that are never taxable or deductible. The Group’s liability for current tax is calculated using tax rates that have been enacted or substantively enacted by the balance sheet date.
2.9.2 Deferred taxDeferred tax is recognised on differences between the carrying amounts of assets and liabilities in the financial statements and the corresponding tax bases used in the computation of taxable profit, and is accounted for using the balance sheet liability method. Deferred tax liabilities are generally recognised for all taxable temporary differences and deferred tax assets are recognised to the extent that it is probable that taxable profits will be available against which deductible temporary differences can be utilised. Such assets and liabilities are not recognised if the temporary difference arises from goodwill or from the initial recognition (other than in a business combination) of other assets and liabilities in a transaction that affects neither the taxable profit nor the accounting profit.
Deferred tax liabilities are recognised for taxable temporary differences arising on investments in subsidiaries, except where the Group is able to control the reversal of the temporary difference and it is probable that the temporary difference will not reverse in the foreseeable future.
The carrying amount of deferred tax assets is reviewed at each balance sheet date and reduced to the extent that it is no longer probable that sufficient taxable profits will be available to allow all or part of the assets to be recovered.
Deferred tax is calculated at the tax rates that are expected to apply in the period when the liability is settled or the asset realised based on tax rates that
[ N O T E S T O T H E F I N A N C I A L S TAT E M E N T S ]
A N N U A L R E P O R T 2 0 1 4 | 3 1

have been enacted or substantively enacted by the end of the reporting period. The measurement of deferred tax liabilities and assets reflects the tax consequences that would follow from the manner in which the Group expects, at the reporting date, to recover or settle the carrying amounts of its assets and liabilities.
Deferred tax assets and liabilities are offset when there is a legally enforceable right to set off current tax assets against current tax liabilities and when they relate to income taxes levied by the same taxation authority and the Group intends to settle its current tax assets and liabilities on a net basis.
2.9.3 Current and deferred tax for the periodCurrent and deferred tax are recognised as an expense or income in profit or loss, except when they relate to items recognised in other comprehensive income or directly in equity, in which case the tax is also recognised in other comprehensive income or directly in equity, or where they arise from the initial accounting for a business combination. In the case of a business combination, the tax effect is taken into account in calculating goodwill or in determining the excess of the acquirer’s interest in the net fair value of the acquiree’s identifiable assets, liabilities and contingent liabilities over cost of the business combination.
2.10 Statement of cash flowsFor the purpose of the statement of cash flows, cash and cash equivalents include cash on hand and in banks and investments in money market instruments, net of outstanding bank overdrafts. The following terms are used in the statement of cash flows:
• Operatingactivitiesaretheprincipalrevenueproducing activities of the Group and other activities that are not investing or financing activities;
• Investingactivitiesaretheacquisitionanddisposal of long term assets and other investments not included in cash equivalents; and
• Financingactivitiesareactivitiesthatresultin changes in the size and composition of the contributed equity and borrowings of the entity.
2.11 LeasingLeases are classified as finance leases whenever the terms of the lease transfer substantially all the risks and rewards of ownership to the lessee. All other leases are classified as operating leases.
Assets held under finance leases are recognised as assets of the Group at their fair value at the inception of the lease or, if lower, at the present value of the minimum lease payments. The corresponding liability to the lessor is included in the balance sheet as a finance lease obligation. Lease payments are apportioned between finance charges and reduction of the lease obligation so as to achieve a constant rate of interest on the remaining balance of the liability. Finance charges are charged to profit or loss.
Rentals payable under operating leases are charged to profit or loss on a straight-line basis over the term of the relevant lease. Benefits received and receivable as an incentive to enter into an operating lease are also spread on a straight-line basis over the lease term.
2.12 Property, plant and equipmentFixtures and equipment, motor vehicles and leasehold improvements are stated at cost less accumulated depreciation and any accumulated impairment losses.
Depreciation is charged so as to write off the cost or valuation of assets, over their useful lives, using the diminishing value method.
Assets held under finance leases are depreciated over their expected useful lives on the same basis as owned assets or, where shorter, the term of the relevant lease.
The gain or loss arising on the disposal or retirement of an item of property, plant and equipment is determined as the difference between the sales proceeds and the carrying amount of the asset and is recognised in profit or loss.
2.13 GoodwillGoodwill arising on the acquisition of a subsidiary is recognised as an asset at the date that control is acquired (the acquisition date). Goodwill is measured as the excess of the sum of the consideration transferred, the amount of any non controlling interest in the acquiree and the fair value of the acquirer’s previously held equity interest (if any) in the acquiree over the fair value of the identifiable net assets recognised.
If, after reassessment, the Group’s interest in the fair value of the acquiree’s identifiable net assets exceeds the sum of the consideration transferred, the amount of any non controlling interest in the acquiree and the fair value of the acquirer’s previously held equity interest (if any) in the acquiree, the excess is recognised immediately in profit or loss as a bargain purchase gain.
Goodwill is not amortised, but is reviewed for impairment at least annually. For the purpose of impairment testing, goodwill is allocated to each of the Group’s cash generating units expected to benefit from the synergies of the combination. Cash generating units to which goodwill has been allocated are tested for impairment annually, or more frequently when there is an indication that the unit may be impaired. The recoverable amount is the higher of fair value less cost to sell and the value in use. If the recoverable amount of the cash generating unit is less than the carrying amount of the unit, the impairment loss is allocated first to reduce the carrying amount of any goodwill allocated to the unit and then to the other assets of the unit pro-rata on the basis of the carrying
[ N O T E S T O T H E F I N A N C I A L S TAT E M E N T S ]
3 2 | AW F G R O U P

amount of each asset in the unit. Any impairment loss on goodwill is recognised immediately in profit or loss and is not subsequently reversed.
On disposal of a subsidiary, the attributable amount of goodwill is included in the determination of the profit or loss on disposal.
2.14 Intangible assets2.14.1 Intangible assets acquired in a business combination
Intangible assets acquired in a business combination are identified and recognised separately from goodwill where they satisfy the definition of an intangible asset and their fair values can be measured reliably. The cost of such intangible assets is their fair value at the acquisition date.
Subsequent to initial recognition, intangible assets acquired in a business combination are reported at cost less accumulated amortisation and accumulated impairment losses. Amortisation is charged on a straight-line basis over their estimated useful lives. The estimated useful lives, residual values and amortisation method are reviewed at the end of each reporting period, with the effect of any changes in estimate being accounted for on a prospective basis.
2.15 Impairment of tangible and intangible assets excluding goodwillAt the end of each reporting period, the Group reviews the carrying amounts of its tangible and intangible assets to determine whether there is any indication that those assets have suffered an impairment loss. If any such indication exists the recoverable amount of the asset is estimated in order to determine the extent of the impairment loss (if any). The recoverable amount is the higher of an asset’s fair value less costs to sell and value in use. In assessing value in use, the estimated cash flows are discounted to their present value using a pre-tax discount rate that reflects current market assessments of the time value of money and the risks specific to the asset for which the estimates of future cash flows have not been adjusted.
If the recoverable amount of an asset is estimated to be less than its carrying amount, the carrying amount of the asset is reduced to its recoverable amount. An impairment loss is recognised immediately in profit or loss.
Where an impairment loss subsequently reverses, the carrying amount of the asset is increased to the revised estimate of its recoverable amount, but the increased carrying amount does not exceed the carrying amount that would have been determined had no impairment loss been recognised for the asset in prior periods. A reversal of an impairment loss is recognised immediately in profit or loss. Impairment of goodwill is not reversed.
2.16 Financial instrumentsFinancial assets and financial liabilities are recognised on the Group’s balance sheet when the Group becomes a party to the contractual provisions of the instrument. All of the financial assets of the company and group, which include trade and other receivables, other current assets (deposits) and advances to subsidiaries, are classified as loans and receivables at amortised cost.
2.16.1 Trade and other receivablesTrade and other receivables are measured on initial recognition at fair value and subsequently at amortised cost. Appropriate allowances for estimated irrecoverable amounts are recognised in profit and loss when there is objective evidence that the asset is impaired. The allowance recognised is measured as the difference between the asset’s carrying amount and the present value of estimated future cash flows discounted at the effective interest rate computed at initial recognition.
2.16.2 Cash and cash equivalentsCash and cash equivalents comprise cash on hand and demand deposits and other short-term highly liquid investments that are readily convertible to a known amount in cash and are subject to an insignificant risk of changes in value.
2.16.3 Financial liabilities and equityFinancial liabilities and equity instruments issued by the Group are classified according to the substance of the contractual arrangements entered into and the definitions of a financial liability and an equity instrument. An equity instrument is any contract that evidences a residual interest in the assets of the Group after deducting all of its liabilities. The accounting policies adopted for specific financial liabilities and equity instruments are set out below. All of the financial liabilities of the company and group, which include trade and other payables and borrowings, are classified as financial liabilities at amortised cost.
2.16.4 Bank borrowingsInterest-bearing bank loans and overdrafts are initially measured at fair value, and are subsequently measured at amortised cost, using the effective interest rate method. Any difference between the proceeds (net of transaction costs) and settlement or redemption of borrowing is recognised as interest over the term of the borrowings in accordance with the Group’s accounting policy for borrowing costs (see above).
2.16.5 Advances to subsidiariesAdvances to subsidiaries are non-interest bearing and repayable on demand. Accordingly their carrying value is equivalent to their face value.
[ N O T E S T O T H E F I N A N C I A L S TAT E M E N T S ]
A N N U A L R E P O R T 2 0 1 4 | 3 3

2.16.6 Trade and other payablesTrade and other payables are initially measured at fair value, and subsequently measured at amortised cost, using the effective interest rate method.
2.16.7 Equity instrumentsEquity instruments issued by the Company are recorded at the proceeds received, net of direct issue costs.
2.17 ProvisionsProvisions are recognised when the Group has a present obligation as a result of a past event, and it is probable that the Group will be required to settle that obligation, and a reliable estimate can be made of the amount of the obligation.
The amount recognised as a provision is the best estimate of the consideration required to settle the present obligation at the end of the reporting period taking into account the risks and uncertainties surrounding the obligation. Where a provision is measured using the cash flows estimated to settle the present obligation, its carrying amount is the present value of those cash flows.
2.17.1 Rehabilitation under the ACC partnership programA provision for rehabilitation is recognised when there is a present obligation as a result of a work place accident and it is probable that an outflow of economic benefit will be required to settle the obligation, and the amount of the provision can be measured reliably.
2.18 Employee benefitsProvision is made for benefits accruing to employees in respect of wages and salaries, annual leave, long service leave, and sick leave when it is probable that settlement will be required and they are capable of being measured reliably.
Provisions made in respect of employee benefits expected to be settled within 12 months are measured at their nominal values using the remuneration rate expected to apply at the time of settlement.
Provisions made in respect of employee benefits which are not expected to be settled within 12 months are measured as the present value of the estimated future cash outflows to be made by the Group in respect of services provided by employees up to reporting date.
2.19 Share-based paymentsThe company operates an equity-settled share based incentive scheme for senior staff and directors that are settled in ordinary shares. The fair value of these share-based payments is calculated on grant date using an appropriate valuation model. The fair value is included in employee benefits expense on a straight line basis over the vesting period, based
on the company’s estimate of the number of equity instruments that will eventually vest. The same amount is credited to shareholders equity.
At each balance date, the company re-assesses its estimates of the number of equity instruments expected to vest. The impact of the revision of original estimates, if any, is recognised in employee benefits expense immediately, with a corresponding adjustment to shareholders equity.
3. Accounting judgments and major sources of estimation uncertainty
3.1 Judgement in applying accounting policiesThe following are the judgements, apart from those involving estimations that the directors have made in the process of applying the entity’s accounting policies and that have the most significant effect on the amounts recognised in these financial statements:
Operating segmentsDetermining whether operating segments can be aggregated together as a reportable segment requires the directors to consider whether the operating segments are similar in the nature of their services, the nature of the production processes, the type or class of customer for their services, the methods used to provide their services and the nature of the regulatory environment.
Amortisation of identifiable intangible assetsDetermining the period over which identifiable intangible assets are amortised requires the directors to consider the useful lives of the assets. The directors use their judgement in determining the useful lives of these assets.
3.2 Major sources of estimation uncertaintyThe following are the key assumptions concerning the future, and other major sources of estimation uncertainty at 31 March 2014, that have a significant risk of resulting in a material adjustment to the carrying amounts of assets and liabilities within the next financial year:
Impairment of goodwillDetermining whether goodwill is impaired requires an estimation of the value in use of the group of cash-generating units to which goodwill has been allocated. The value in use calculation requires the directors to estimate the future cash flows expected to arise from those cash-generating units and a suitable discount rate in order to calculate present value.
Details of the value in use calculation are provided in note 21.
[ N O T E S T O T H E F I N A N C I A L S TAT E M E N T S ]
3 4 | AW F G R O U P

4. Segment information4.1 Services from which reportable segments derive
their revenuesThe directors have identified the following reportable segments.
Temporary staffing to industryThe Group operates branches under the brand names AWF Labour, AWF Manufacturing and Logistics, AWF Trades and Tradeforce Recruitment in major towns and cities throughout New Zealand. Each branch or a combination of branches where operating in the same market (as outlined in note 21) are considered to be separate operating segments for which discrete financial information is available and whose operating results are regularly reviewed by the Group’s chief operating decision maker. All branches derive their revenues from temporary staffing services to industry. All operating segments have been aggregated into a single reportable segment on the basis that the nature of the services, the nature of the operating processes, the type or class of customer for the services, the methods used to provide their services and the nature of the regulatory environment are the same for all branches.
Temporary, contract and permanent staff services to commerceThe Group operates branches under the brand names Madison Recruitment and Madison Force in major cities throughout New Zealand. Each branch or a combination of branches where operating in the same market (as outlined in note 21) are considered
to be separate operating segments for which discrete financial information is available and whose operating results are regularly reviewed by the Group’s chief operating decision maker. All branches derive their revenues from temporary, contract and permanent staff services to commerce. All operating segments have been aggregated into a single reportable segment on the basis that the nature of the services, the nature of the operating processes, the type or class of customer for the services, the methods used to provide their services and the nature of the regulatory environment are the same for all branches.
Healthcare staff servicesA single operating segment and whose operating results are regularly reviewed by the Group’s chief operating decision maker. This segment derives its revenues from labour supply to the health sector. This segment was disposed of last financial year and is included for comparative purposes only.
All revenues from external customers, and non-current assets other than financial instruments, deferred tax assets, post-employment benefit assets, and rights arising under insurance contracts are attributed to the Group’s country of domicile.
The Group’s reportable segments under NZ IFRS 8 are therefore as follows:
• Temporarystaffingservicestoindustry• Temporary,contractandpermanentstaffservices
to commerce• Healthcarestaffservices(disposedofinAugust2012)
[ N O T E S T O T H E F I N A N C I A L S TAT E M E N T S ]
A N N U A L R E P O R T 2 0 1 4 | 3 5

4.2 Segment revenue and results
Group
Segment revenue Segment profit
2014 2013 2014 2013$'000 $'000 $'000 $'000
Continuing operations
Temporary staffing to industry 125,536 130,477 7,471 8,844
Temporary, contract and permanent staff services to commerce
23,155 982
Total for continuing operations 148,691 130,477 8,453 8,844
Other income 51 22
Central administration costs and directors’ salaries
(1,690) (1,385)
Acquisition related costs expense (257)
Finance costs (714) (289)
Profit before tax 5,843 7,192
Discontinued operations
Healthcare staff services 8,375 (296)
Total for discontinued operations 8,375 (296)
Finance costs (48)
Gain on disposal of operations 2,242
Profit/(loss) before tax 1,898
Income tax expense (continuing and discontinued)
(1,891) (2,167)
Total revenue (excluding investment revenue) and profit
148,691 138,852 3,952 6,923
Revenue reported above represents revenue generated from external customers. There were no inter-segment sales in the year (2013: $Nil).
The accounting policies of the reportable segments are the same as the Group’s accounting policies described in note 2. Segment profit represents the profit earned by each segment without allocation of central administration costs and directors’ salaries, investment revenue, finance costs, and income tax expense. This is the same measure reported to the chief operating decision maker for the purpose of resource allocation and assessment of segment performance.
4.3 Segment assets
Group
2014 2013
$’000 $’000
Temporary staffing to industry 30,491 33,630
Temporary, contract and permanent staff services to commerce 45,057
Total segment assets 75,548 33,630
Unallocated assets 1,413 1,745
Total assets 76,961 35,375
For the purposes of monitoring segment performance and allocating resources between segments, the chief operating decision maker monitors the tangible, intangible and financial assets attributable to each segment. All assets are allocated to reportable segments other than cash and cash equivalents and tax assets of the parent. Goodwill has been allocated to reportable segments as described in note 21. Assets used jointly by reportable segments are allocated on the basis of the revenues earned by individual reportable segments.
[ N O T E S T O T H E F I N A N C I A L S TAT E M E N T S ]
3 6 | AW F G R O U P

4.4 Segment liabilities
Group
2014 2013
$’000 $’000
Temporary staffing to industry 10,669 12,713
Temporary, contract and permanent staff services to commerce 44,374
Total segment liabilities 55,043 12,713
Unallocated liabilities 1,155 1,055
Total liabilities 56,198 13,768
For the purposes of monitoring segment performance and allocating resources between segments, the chief operating decision maker monitors the liabilities attributable to each segment. All liabilities are allocated to reportable segments other than bank loans and tax liabilities of the parent.
4.5 Other segment information
Group
Depreciation and amortisation
Employee benefits
Additions to non-current assets
2014 2013 2014 2013 2014 2013
$’000 $’000 $’000 $’000 $’000 $’000
Temporary staffing to industry 1,170 879 107,916 111,334 (848) 1,969
Temporary, contract and permanent staff services to commerce
709 20,463 34,543
Healthcare staff services 611 7,481 (4,255)
Unallocated 1,038 1,069
Total 1,879 1,490 129,417 119,884 33,695 (2,286)
4.6 Geographical information
The Group operates in one geographical area New Zealand (country of domicile). All revenues from external customers, and non-current assets other than financial instruments, deferred tax assets, post-employment benefit assets, and rights arising under insurance contracts are attributed to the Group’s country of domicile.
4.7 Information about major customers
The Group has no customers individually making up 10% of its revenue and therefore does not have a large reliance on its major customers. In 2013 the Group had no customers individually making up 10% of its revenue.
[ N O T E S T O T H E F I N A N C I A L S TAT E M E N T S ]
A N N U A L R E P O R T 2 0 1 4 | 3 7

5. RevenueGroup Company
2014 2013 2014 2013
$'000 $'000 $'000 $'000
Continuing operations
Temporary staffing and recruitment services 148,691 130,477
Management fees 2,100 1,688
148,691 130,477 2,100 1,688
Discontinued operations
Healthcare staff services 8,375
148,691 138,852 2,100 1,688
6. Investment revenueGroup Company
2014 2013 2014 2013
$'000 $'000 $'000 $'000
Interest revenue
Bank interest 51 22
Total interest revenue 51 22
Dividends received 4,859 4,088
Total investment revenue 22 4,859 4,088
7. Other gains and losses Company
2014 2013
$'000 $'000
Other income
Net gain on disposal of investment 1,030
1,030
8. Finance costsGroup Company
2014 2013 2014 2013
$'000 $'000 $'000 $'000
Interest on bank overdrafts and loans 693 240 585 170
Other interest expense 21 49
Total finance costs 714 289 585 170
[ N O T E S T O T H E F I N A N C I A L S TAT E M E N T S ]
3 8 | AW F G R O U P

9. Income taxes9.1 Income tax recognised in profit or loss
Group Company
2014 2013 2014 2013
$'000 $'000 $'000 $'000
Current tax expense in respect of the current year 2,099 2,836 29 59
Deferred tax benefit relating to the origination and reversal of temporary differences
(208) (669) 29 (4)
Total tax expense 1,891 2,167 58 55
Attributable to:
Continuing operations 1,891 2,240 58 55
Discontinued operations (73)
Total tax expense 1,891 2,167 58 55
The total charge for the year can be reconciled to the accounting profit as follows:
Group Company
2014 2013 2014 2013
$'000 $'000 $'000 $'000
Profit from continued operations 5,843 7,192 4,763 5,251
Profit from discontinued operations (344)
Profit from operations 5,843 6,848 4,763 5,251
Tax at the income tax rate of 28% (2013:28%) 1,636 1,917 1,334 1,470
Tax effect of income that is exempt from taxation (1,361) (1,433)
Tax effect of expenses that are not deductible in determining taxable profit
255 250 85 18
Tax expense and effective rate for the year 1,891 2,167 58 55
32.4% 31.6% 1.2% 1.0%
The tax rate used for the reconciliation above is the corporate tax rate of 28% (2013: 28%) payable by New Zealand corporate entities on taxable profits under New Zealand tax law.
9.2 Current tax assets and liabilities
Group Company
2014 2013 2014 2013
$'000 $'000 $'000 $'000
Current tax liabilities
Income tax payable/(receivable) 570 1,238 (11) 25
[ N O T E S T O T H E F I N A N C I A L S TAT E M E N T S ]
A N N U A L R E P O R T 2 0 1 4 | 3 9

9.3 Deferred tax balances
The following are the major deferred tax assets/(liabilities) recognised by the Group, and the movements thereon, during the current reporting period.
ACC levies
Staff leave
pay accruals
Bad debt
provisions
ACC rehabilitation
claims
Identifiable intangible
assets
Total
$’000 $’000 $’000 $’000 $’000 $’000
At 1 April 2012 216 368 69 134 (1,086) (299)
Charge (credit) to profit or loss for the year
(6) 362 48 (21) 286 669
Acquisitions (462) (462)
Disposal of subsidiary (127) (3) 997 867
At 31 March 2013 210 603 114 113 (265) 775
Charge (credit) to profit or loss for the year
7 129 (6) (38) 116 208
Acquisitions 10 178 (2,576) (2,388)
At 31 March 2014 227 910 108 75 (2,725) (1,405)
Deferred tax balances are classified as:
Group Company
2014 2013 2014 2013
$'000 $'000 $'000 $'000
Deferred tax assets 775 4
Deferred tax liabilities 1,405 25
9.4 Imputation balances
Group Company
2014 2013 2014 2013
$'000 $'000 $'000 $'000
Imputation credits available for subsequent reporting periods based on a tax rate of 28%
5,088 4,559 844 775
The above amounts represent the balance of the imputation account as at the end of the reporting period, adjusted for:
• Imputationcreditsthatwillarisefromthepaymentoftheamountoftheprovisionforincometax;• Imputationdebitsthatwillarisefromthepaymentofdividendsrecognisedasaliabilityatthereportingdate;and• Imputationcreditsthatwillarisefromthereceiptofdividendsrecognisedasreceivablesatthereportingdate.
The consolidated amounts include imputation credits that would be available to the parent entity if subsidiaries paid dividends.
The imputed portions of the final dividends recommended after 31 March 2013 will be imputed out of existing imputation credits or out of imputation credits arising from the payment of income tax in the year ended 31 March 2014.
[ N O T E S T O T H E F I N A N C I A L S TAT E M E N T S ]
4 0 | AW F G R O U P

10. Discontinued operations
10.1 Disposal of healthcare staff services business
On 25 July 2012, the Board of Directors entered into a sale agreement to dispose of the Group’s shares in Panacea Healthcare Limited. The disposal was completed on 31 August 2012, on which date control of Panacea Healthcare Limited passed to the acquirer. This transaction means that the Group is no longer involved in the healthcare staff services sector. Details of the assets and liabilities disposed of are disclosed in note 19.
10.2 Analysis of profit for the period from discontinued operations
The results of the discontinued operations included in the statement of comprehensive income are set out below.
The comparative profit and cash flows from discontinued operations have been re-presented to include those operations classified as discontinued in the current period.
Group
2014 2013
$'000 $'000
Profit for the period from discontinued operations
Revenue 8,375
Expenses (8,719)
Profit before tax (344)
Income tax 73
(271)
Gain on disposal of operation 2,242
Net profit/(loss) for the year from discontinued operations 1,971
10.3 Cash flows from discontinued operations
Group
2014 2013
$'000 $'000
Net cash flows from operating activities 1,017
Net cash flows from investing activities (1,848)
Net cash flows from financing activities 760
Net cash flows (71)
[ N O T E S T O T H E F I N A N C I A L S TAT E M E N T S ]
A N N U A L R E P O R T 2 0 1 4 | 4 1

11. Profit for the yearGroup Company
2014 2013 2014 2013
$'000 $'000 $'000 $'000
Profit before tax
Profit before tax has been arrived at after charging the following expenses from continuing and discontinued operations:
Bad and doubtful debts expense 287 225
Attributable to:
Continuing operations 287 225
Discontinued operations 11
287 236
Depreciation and amortisation expense
Depreciation of property, plant and equipment 682 465
Amortisation of intangible assets 1,197 1,025
Total depreciation and amortisation expense 1,879 1,490
Attributable to:
Continuing operations 1,879 879
Discontinued operations 611
1,879 1,490
Net (profits)/losses on disposal of property, plant and equipment
(25) 124
Attributable to:
Continuing operations (25) 124
Discontinued operations
(25) 124
Employee benefits
Share-based payments
Equity-settled share-based payments 63 23 63 23
Other
Employer contributions to Kiwisaver 1,798 645 24 15
Other employee benefits 127,619 119,216 1,014 1,031
129,417 119,861 1,038 1,046
Total employee benefits 129,417 119,884 1,038 1,069
Attributable to:
Continuing operations 129,417 112,403 1,038 1,069
Discontinued operations 7,481
129,417 119,884 1,038 1,069
Remuneration of auditors
Audit of financial statements 123 94 123 94
Due diligence 95 95
IT advisory services 22 18
Fees paid to auditors 240 112 218 94
Donations 68 42
[ N O T E S T O T H E F I N A N C I A L S TAT E M E N T S ]
4 2 | AW F G R O U P

12. Earnings per shareGroup
2014 2013
Cents per share Cents per share
Basic and diluted earnings per share:
From continuing operations 15.1 19.0
From discontinued operations 7.5
Total basic and diluted earnings per share 15.1 26.5
The earnings and number of ordinary shares used in the calculation of basic and diluted earnings per share are as follows:
Group
2014 2013
Earnings used in the calculation of total basic and diluted earnings per share 3,952 6,923
Profit for the year from discontinued operations used in the calculation of basic and diluted earnings per share from discontinued operations
1,971
Earnings used in the calculation of basic and diluted earnings per share from continuing operations
3,952 4,952
Number of ordinary shares 26,125,503 26,125,503
13. Supplementary information - underlying earnings
Underlying earnings is a non-GAAP measure which adjusts for amortisation of identifiable intangible assets acquired through acquisition of subsidiaries, profit on disposal of subsidiaries and impairment of goodwill. In the opinion of the directors, underlying earnings more correctly reflects the operating performance of the Group. This treatment is consistent with the previous reporting period.
Group Company
31/03/2014 31/03/2013 31/03/2014 31/03/2013
Profit for the year 3,952 6,923 4,705 5,204
Add back amortisation of intangible assets 967 1,025
Tax effect on adjustments (271) (288)
Subtract gain on sale of subsidiary (2,242) (1,030)
Underlying earnings after tax 4,648 5,418 4,705 4,174
Total underlying earnings is attributable to:
Continuing operations 4,648 5,267
Discontinued operations 151
4,648 5,418
13.1 Underlying earnings per share
Group
2014 2013
Cents per share Cents per share
Basic and diluted earnings per share:
From continuing operations 17.8 20.1
From discontinued operations 0.6
Total basic and diluted earnings per share 17.8 20.7
The number of shares used in the calculation of underlying earnings per share is detailed in note 12.
[ N O T E S T O T H E F I N A N C I A L S TAT E M E N T S ]
A N N U A L R E P O R T 2 0 1 4 | 4 3

14. Cash and cash equivalents
For the purposes of the statement of cash flows, cash and cash equivalents includes cash on hand and in banks and investments in money market instruments, net of outstanding bank overdrafts. Cash and cash equivalents at 31 March as shown in the statement of cash flows can be reconciled to the related items in the statement of financial position as follows:
Group Company
2014 2013 2014 2013
$'000 $'000 $'000 $'000
Cash at bank 3,146 1,373 1,386 1,745
AWF Group Limited has a guarantee to New Zealand Exchange Limited for $75,000 dated 24 May 2005.
15. Trade and other receivables
Group Company
2014 2013 2014 2013
$'000 $'000 $'000 $'000
Trade receivables 25,054 18,957 8
Allowance for doubtful debts (377) (398)
Amounts receivable from the sale of services 24,677 18,559 8 -
Trade receivablesThe credit period on sale of services is 30 days. No interest is charged on trade receivables for the first 30 days from the date of invoice. Thereafter, interest is charged at 1.5 per cent per month on the outstanding balance.
Before accepting a new customer, the Group conducts reference checks using external sources. Customer checks and approval of credit limits are performed independently of the sales function, and are reviewed on an ongoing basis.
Included in the Group’s trade receivable balance are debtors with a carrying amount of $2.546 million (2013: $2.686 million) which are past due at the reporting date for which the Group has not provided as there has not been significant change in credit quality and the amounts are still considered recoverable. The Group does not hold any collateral over these balances.
Group
2014 2013
$’000 $’000
30–60 days 2,251 2,115
60+ days 295 571
Total 2,546 2,686
Movement in provision for doubtful debts
Group
2014 2013
$’000 $’000
Opening balance 398 241
Impairment losses recognised 358 443
Amounts written off as uncollectable (88) (119)
Impairment losses reversed (291) (167)
Closing balance 377 398
The Group’s management has reviewed outstanding debtors on a branch-by-branch basis and the doubtful debt provision at 31 March 2014 represents the best estimate of amounts that will not be collected. The concentration of credit risk is limited due to the customer base being large and unrelated. Accordingly, the directors believe that there is no further credit provision required in excess of the provision for doubtful debts.
[ N O T E S T O T H E F I N A N C I A L S TAT E M E N T S ]
4 4 | AW F G R O U P

Ageing of impaired trade receivables
Group
2014 2013
$’000 $’000
0–30 days 12 20
30–60 days 34 41
60+ days 331 337
Total 377 398
16. Investments in subsidiaries
Company
2014 2013
$’000 $’000
Investments in subsidiaries
Balance at 1 April 28,328 33,081
Shares in subsidiary sold during the year (4,753)
Shares in subsidiary acquired during the year 36,000
Balance at 31 March 64,328 28,328
The Company assesses, at each reporting date, whether there is any indication that investments in subsidiaries may be impaired. The recoverable amounts of subsidiaries are determined from value in use calculations using the same assumptions and approach as that described for determining the recoverable amount of Goodwill in note 21. The discount rate used in determining the value in use was 8.3% (2013: 10.0%).
The Company has an investment in Allied Work Force Limited (100%). Allied Work Force Limited is incorporated in New Zealand and provides temporary staffing services and has a balance date of 31 March.
17. Subsidiaries
Name of subsidiary
Place of incorporation and operation
Proportion of ownership
interest
Proportion of voting
power held
Principal
activity
2014
Allied Work Force Limited NZ 100 100 Labour hire
Allied Work Force Christchurch Limited1 NZ 100 100 Labour hire
Madison Recruitment Limited NZ 100 100 Recruitment
Madison Force Limited NZ 100 100 Recruitment
2013
Allied Work Force Limited NZ 100 100 Labour hire
Allied Work Force Christchurch Limited1 NZ 100 100 Labour hire
1 The company has “B shares” on issue equating to 12.5% of the total shares in the company. These shares are held by an employee and are entitled to distributions. Under accounting standards these shares, which have no voting rights, are classified as a liability of the company and not as an ownership interest.
Effective 4 November 2013 AWF Group Limited acquired the shares of Madison Recruitment Limited and Madison Force Limited for $36 million. (see note 18).
[ N O T E S T O T H E F I N A N C I A L S TAT E M E N T S ]
A N N U A L R E P O R T 2 0 1 4 | 4 5
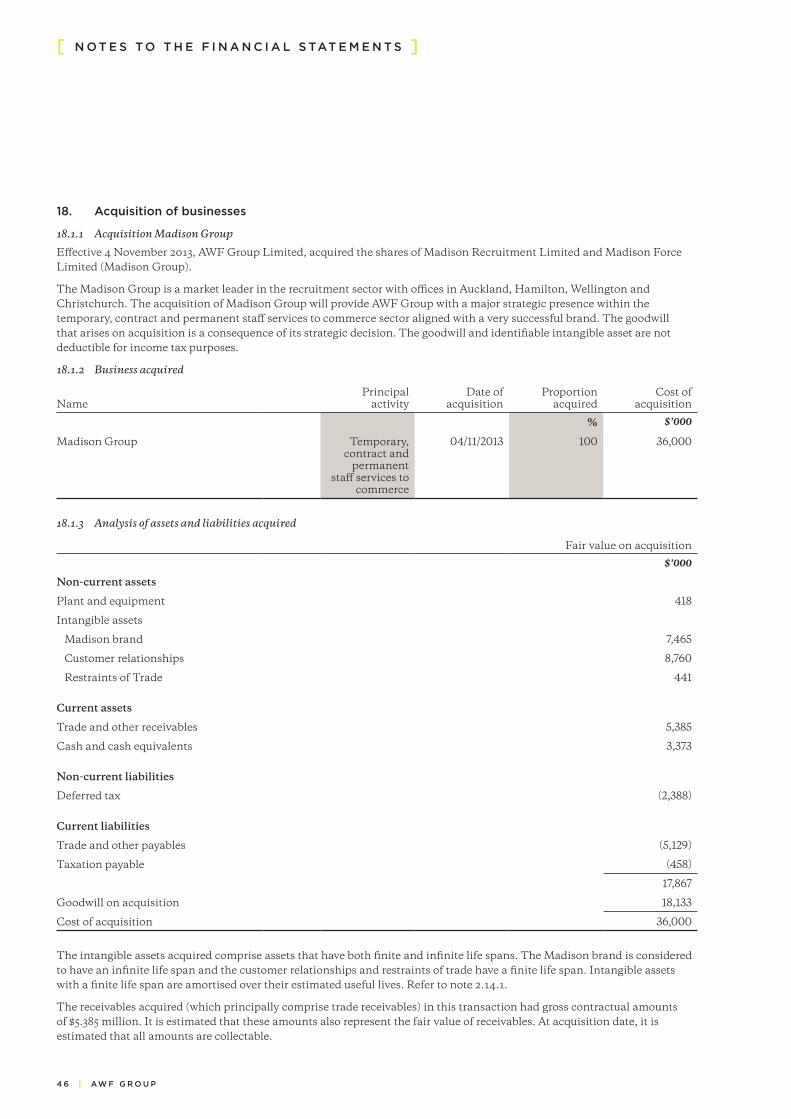
18. Acquisition of businesses
18.1.1 Acquisition Madison Group
Effective 4 November 2013, AWF Group Limited, acquired the shares of Madison Recruitment Limited and Madison Force Limited (Madison Group).
The Madison Group is a market leader in the recruitment sector with offices in Auckland, Hamilton, Wellington and Christchurch. The acquisition of Madison Group will provide AWF Group with a major strategic presence within the temporary, contract and permanent staff services to commerce sector aligned with a very successful brand. The goodwill that arises on acquisition is a consequence of its strategic decision. The goodwill and identifiable intangible asset are not deductible for income tax purposes.
18.1.2 Business acquired
Name
Principal activity
Date of acquisition
Proportion acquired
Cost of acquisition
% $’000
Madison Group Temporary, contract and
permanent staff services to
commerce
04/11/2013 100 36,000
18.1.3 Analysis of assets and liabilities acquired
Fair value on acquisition
$’000
Non-current assets
Plant and equipment 418
Intangible assets
Madison brand 7,465
Customer relationships 8,760
Restraints of Trade 441
Current assets
Trade and other receivables 5,385
Cash and cash equivalents 3,373
Non-current liabilities
Deferred tax (2,388)
Current liabilities
Trade and other payables (5,129)
Taxation payable (458)
17,867
Goodwill on acquisition 18,133
Cost of acquisition 36,000
The intangible assets acquired comprise assets that have both finite and infinite life spans. The Madison brand is considered to have an infinite life span and the customer relationships and restraints of trade have a finite life span. Intangible assets with a finite life span are amortised over their estimated useful lives. Refer to note 2.14.1.
The receivables acquired (which principally comprise trade receivables) in this transaction had gross contractual amounts of $5.385 million. It is estimated that these amounts also represent the fair value of receivables. At acquisition date, it is estimated that all amounts are collectable.
[ N O T E S T O T H E F I N A N C I A L S TAT E M E N T S ]
4 6 | AW F G R O U P

18.1.4 Cost of acquisitions
The cost of acquisition of Madison Group was made up as follows:
$’000
Paid in cash 30,000
Contingent consideration 6,000
36,000
Under the contingent consideration arrangement, the Group is required to pay the vendors an additional amount of up to $6 million if Madison Groups EBITDA (earnings before interest, tax, depreciation and amortisation) for the earn-out period exceeds $5 million. The directors estimate the amount payable under this arrangement will be $6 million. $6 million represents the estimated fair value of this obligation at the acquisition date.
Acquisition related costs amounting to $257,000 have been excluded from the consideration transferred and have been recognised as an expense in profit or loss in the current year.
18.1.5 Net cash outflow on acquisition
$’000
Total purchase consideration 36,000
Less non cash considerations:
Contingent consideration 6,000
Consideration paid in cash 30,000
Less: cash and bank balances acquired 3,373
26,627
18.1.6 Goodwill arising on acquisition
Goodwill arose in the acquisition of Madison Group as the consideration paid included amounts in relation to the benefit of future market development and the assembled client base, candidate data base and workforce. The portion of these benefits that relates to contracts with major clients, the Madison brand, and the restraint of trade agreements imposed on the vendors have been valued separately as intangible asset. The remaining benefits are not recognised separately from goodwill as they do not meet the recognition criteria for identifiable intangible assets.
18.1.7 Impact of acquisitions on the results of the Group
For the period 4 November 2013 to 31 March 2014, included in Group profit is $1.265 million and in Group revenue $23.156 million attributable to Madison Group.
Had this business combination been effected at 1 April 2013, the revenue of the Group from continuing operations would have been $186.3 million, and the profit for the year from continuing operations would have been $5.2 million. The directors consider these ‘pro-forma’ numbers to represent an approximate measure of the performance of the combined group on an annualised basis and provide a reference point for comparison in future periods.
In determining the ‘pro-forma’ revenue and profit of the Group had Madison Group been acquired at the beginning of the current year, the directors have:
• Calculatedborrowingcostsonthefundinglevels,creditratingsanddebt/equitypositionoftheGroupafterthebusinesscombination; and
• Calculatedamortisationofidentifiableintangibleassetsacquiredbasedonthevalueoftheseassetsatdateofacquisition.
18.2.1 Acquisition Nursing NZ (subsequently disposed of)
Effective 2 April 2012, Panacea Healthcare Limited (PHC), a wholly owned subsidiary of AWF Group Limited, acquired the business assets and goodwill of Nursing NZ (NNZ) from New Zealand Home Help Services Limited.
On 31 August 2012, the Group disposed of Panacea Healthcare Limited (refer note 19).
[ N O T E S T O T H E F I N A N C I A L S TAT E M E N T S ]
A N N U A L R E P O R T 2 0 1 4 | 4 7

NNZ is a specialist healthcare staff service provider and provides Accident Compensation Commission (ACC) funded home support services and care for the aged in the Otago and Canterbury regions of the South Island. The acquisition of NNZ gave PHC a larger representation across New Zealand and strengthened its relationship with ACC. The goodwill that arises on acquisition is a consequence of its strategic decision. The goodwill and identifiable intangible asset are not deductible for income tax purposes.
18.2.2 Business acquired
Name
Principal activity
Date of acquisition
Proportion acquired
Cost of acquisition
% $’000
Nursing NZ Healthcare staff services
provider
02/04/2012 100 1,845
18.2.3 Analysis of assets and liabilities acquired
Fair value on acquisition
$’000
Non-current assets
Plant and equipment 63
Intangible assets 1,650
Non-current liabilities
Deferred tax (462)
1,251
Goodwill on acquisition 594
Cost of acquisition 1,845
18.2.4 Cost of acquisitions
The cost of acquisition of Nursing NZ was made up as follows:
$’000
Paid in cash 1,845
18.2.5 Net cash outflow on acquisition
$’000
Total purchase consideration 1,845
18.2.6 Goodwill arising on acquisition
Goodwill arose in the acquisition of Nursing NZ as the consideration paid included amounts in relation to the benefit of future market development and the assembled client base and workforce of New Zealand Home Help Service Limited. The portion of these benefits that relates to contracts with major clients has been valued separately as an intangible asset. The remaining benefits are not recognised separately from goodwill as the future economic benefits arising from them cannot be reliably measured and they do not meet the definition of intangible assets.
18.2.7 Impact of acquisitions on the results of the Group
For the period 2 April 2012 to 31 August 2012, included in Group profit is $164,000 and in Group revenue $1,972,000 attributable to Nursing New Zealand.
At set out in note 19, the Group has disposed of its shareholding of Panacea Healthcare Limited, the acquirer of Nursing New Zealand; it will no longer contribute to Group earnings.
[ N O T E S T O T H E F I N A N C I A L S TAT E M E N T S ]
4 8 | AW F G R O U P

19. Disposal of business
On 25 July 2012, the directors entered into a sale agreement to dispose of the Group’s shares in Panacea Healthcare Limited. The disposal was completed on 31 August 2012, on which date control of Panacea Healthcare Limited passed to the acquirer. This transaction means that the Group is no longer involved in the healthcare staff services sector. Details of the assets and liabilities disposed of are as follows:
$’000
Current assets
Cash and bank balances 486
Trade receivables 1,291
Non-current assets
Property, plant and equipment 163
Goodwill 2,230
Other intangible assets 3,562
Current liabilities
Payables (1,892)
Non-current liabilities
Deferred tax liabilities (867)
Net assets disposed of 4,973
Gain on disposal 2,242
Disposal proceeds 7,215
19.1 Consideration
Consideration paid in cash 7,215
19.2 Net cash inflow on disposal
Consideration received in cash 7,215
Less: cash and bank balances disposed of (486)
6,729
[ N O T E S T O T H E F I N A N C I A L S TAT E M E N T S ]
A N N U A L R E P O R T 2 0 1 4 | 4 9

20. Property, plant and equipmentGroup
Motor vehicles
Fixtures and equipment
Leasehold improvements
Total
$’000 $’000 $’000 $’000
Cost
At 1 April 2012 1,402 1,993 861 4,256
Additions 392 274 159 825
Disposals (345) (406) (150) (901)
Acquisitions through business combinations 25 38 63
Disposal of subsidiary (25) (153) (59) (237)
At 1 April 2013 1,449 1,746 811 4,006
Additions 245 388 217 850
Disposals (197) (4) (201)
Acquisitions through business combinations 417 417
At 31 March 2014 1,497 2,547 1,028 5,072
Accumulated depreciation
At 1 April 2012 865 1399 338 2602
Depreciation charge for the year 188 219 58 465
Eliminated on disposals (255) (317) (89) (661)
Disposal of subsidiary (3) (52) (19) (74)
At 1 April 2013 795 1249 288 2332
Depreciation charge for the year 230 375 77 682
Eliminated on disposals (162) (162)
At 31 March 2014 863 1624 365 2852
Carrying amount
At 31 March 2014 634 923 663 2,220
At 31 March 2013 654 497 523 1,674
The following diminishing value rates are used for the depreciation of property plant and equipment:
Motor vehicles 25 to 36%
Fixtures and equipment 10 to 60%
Leasehold improvements 4 to 14%
21. GoodwillGroup
2014 2013
$’000 $’000
Balance at 1 April 10,561 12,197
Additional amounts recognised from business combinations occurring during the year (note 18)
18,133 594
Amounts relating to businesses disposed of during the year (note 19) (2,230)
Impairment of goodwill
Balance at 31 March 28,694 10,561
[ N O T E S T O T H E F I N A N C I A L S TAT E M E N T S ]
5 0 | AW F G R O U P

21.1 Allocation of goodwill to cash-generating units
Goodwill has been allocated for impairment testing purposes to the following groups of cash-generating units:
• Temporarystaffingtoindustry• Temporary, contract and permanent staff services to commerce
The carrying amount of goodwill was allocated to the following groups of cash-generating units:
Group
2014 2013
$’000 $’000
Temporary staffing services to industry
AWF Manufacturing and Logistics - Wellington 1,201 1,201
Quin Trades - Wellington 1,280 1,280
AWF Kaitaia 383 383
AWF Auckland branches 4,793 4,793
AWF Queenstown 10 10
AWF Mourant 815 815
Tradeforce Recruitment 2,079 2,079
Temporary, contract and permanent staff services to commerce
Madison Group 18,133
28,694 10,561
21.2 Annual test for impairment
The Group tests goodwill annually for impairment or more frequently if there are indications that goodwill might be impaired.
The recoverable amount of each cash generating unit is determined from value in use calculations which use a discounted cash flow analysis. The key assumptions for the value in use calculations are those regarding the discount rates, growth rates and expected changes to selling prices and direct costs during the period. Management estimates discount rates using rates that reflect current market assumptions of the time value of money and risk specific to the cash generating units. The growth rates are based on management’s best estimate. Changes in selling price and direct costs are based on past practices and expectations of future changes in the market.
The Group prepares cash flow forecasts derived from the most recent financial budgets approved by management for the next year and estimates future cash flows based on an estimated growth rate of 2.5% (2013: 2.5%). This rate does not exceed the average long-term growth rate for the relevant markets.
The discount rate used to discount the forecast cash flows is 8.15% (2013: 10.0%).
Management have provided the below table to show sensitivity on the key assumptions used by Quin Trades and how the changes in the assumptions would affect the recoverable amount. Management has determined that the key assumptions used for Quin Trades are the discount rate and the FY2015 budgeted cash flow amount.
The below table shows the range of recoverable amount less the carrying amount of Quin Trades based on changes in the discount rate and the achieved percentage of projected budget.
Change in discount rate
% of projected budget
324,865 7.65% 7.90% 8.15% 8.40% 8.65%
90% 304,463 231,108 164,245 103,048 46,827
85% 216,437 147,158 84,009 26,212 (26,886)
80% 128,412 63,207 3,773 (50,624) (100,598)
75% 40,386 (20,743) (76,462) (127,460) (174,311)
[ N O T E S T O T H E F I N A N C I A L S TAT E M E N T S ]
A N N U A L R E P O R T 2 0 1 4 | 5 1

Should Quin Trades only achieve 75% of its sales budget for the year end 31 March 2015, the discounted cash flows generated from this unit would indicate impairment of approximately $76,462 based on a discount rate of 8.15%.
The directors believe that apart from Quin Trades as described above that any reasonable possible change in the key assumptions on which recoverable amount is based would not cause the aggregate carrying amount to exceed the aggregate recoverable amount of the cash generating units.
22. Other intangible assets
Other intangible assets represent the value of customer relationships, brand values and restraints of trade acquired through business combinations, where the economic value can reliably be assessed and computer software.
Software
Customer Relationships
Brand value
Restraint of Trade
Total
$’000 $’000 $’000 $'000 $'000
Cost
At 1 April 2012 5,748 5,748
Additions 1,491 1,491
Acquisitions through business combinations
1,650 1,650
Disposal of subsidiary (5,652) (5,652)
At 1 April 2013 1,491 1,746 3,237
Additions 322 322
Acquisitions through business combinations
8,760 7,465 441 16,666
At 31 March 2014 1,813 10,506 7,465 441 20,225
Accumulated depreciation
At 1 April 2012 1,869 1,869
Amortisation charge for the year 1,025 1,025
Disposal of subsidiary (2,090) (2,090)
At 1 April 2013 804 804
Amortisation charge for the year 230 936 31 1,197
At 31 March 2014 230 1,740 31 2,001
Carrying amount
At 31 March 2014 1,583 8,766 7,465 410 18,224
At 31 March 2013 1,491 942 2,433
The amortisation expense has been included in the line item “depreciation and amortisation expense” in profit or loss.
The useful lives of customer relationships and restraints of trade used in the calculation of amortisation ranges from 4 to 6 years.
Computer software is amortised at a rate of 14.3% from the time it is brought into use.
[ N O T E S T O T H E F I N A N C I A L S TAT E M E N T S ]
5 2 | AW F G R O U P

23. Trade and other payables
Trade creditors and accruals principally comprise amounts outstanding for trade purchases and ongoing costs.
Group Company
2014 2013 2014 2013
$'000 $'000 $'000 $'000
Trade payables 1,558 628
GST 2,763 2,166
PAYE 2,269 1,600
Accruals 10,678 6,925 354 227
Trade creditors and accruals 17,268 11,319 354 227
The directors consider that the carrying amount of trade payables approximates their fair value.
24. BorrowingsGroup Company
2014 2013 2014 2013
$'000 $'000 $'000 $'000
Unsecured - at amortised cost
Bank loan 30,683 803 30,684 803
30,683 803 30,684 803
Classified as:
Current 2,500 2,500
Non-current 28,183 803 28,184 803
30,683 803 30,684 803
24.1 Summary of borrowing arrangements
The Company has bank loan facilities with ANZ Bank New Zealand Limited. The Company has a loan facility of $27.5 million which was fully drawn at 31 March 2014 and another facility of $6.0 million which was not drawn at 31 March 2014.
The loan facilities are secured by cross guarantee and indemnity between Allied Work Force Limited, AWF Group Limited, Allied Work Force Christchurch Limited, Madison Recruitment Limited and Madison Force Limited.
Interest is calculated on a floating rate and the current weighted average rate is 5.38% (2013: 5.05%). The rate is reviewed every three months. The loans are interest only loans and are repayable between 27 June 2015 and 1 December 2015. The balance at 31 March 2014 was $28,302,500 (2013: $802,500).
The Company has a Commercial Flexi Facility with ANZ Bank New Zealand Limited.
The facility is secured by cross guarantee and indemnity between Allied Work Force Limited, AWF Group Limited, Allied Work Force Christchurch Limited, Madison Recruitment Limited and Madison Force Limited.
Interest is calculated on a floating rate and the current weighted average rate is 6.1% (2013: Nil). The rate is reviewed every three months. The facility is payable on demand and management predict the balance outstanding will be repaid within twelve months. The balance at 31 March 2014 was $2,500,000 (2013: $Nil).
[ N O T E S T O T H E F I N A N C I A L S TAT E M E N T S ]
A N N U A L R E P O R T 2 0 1 4 | 5 3
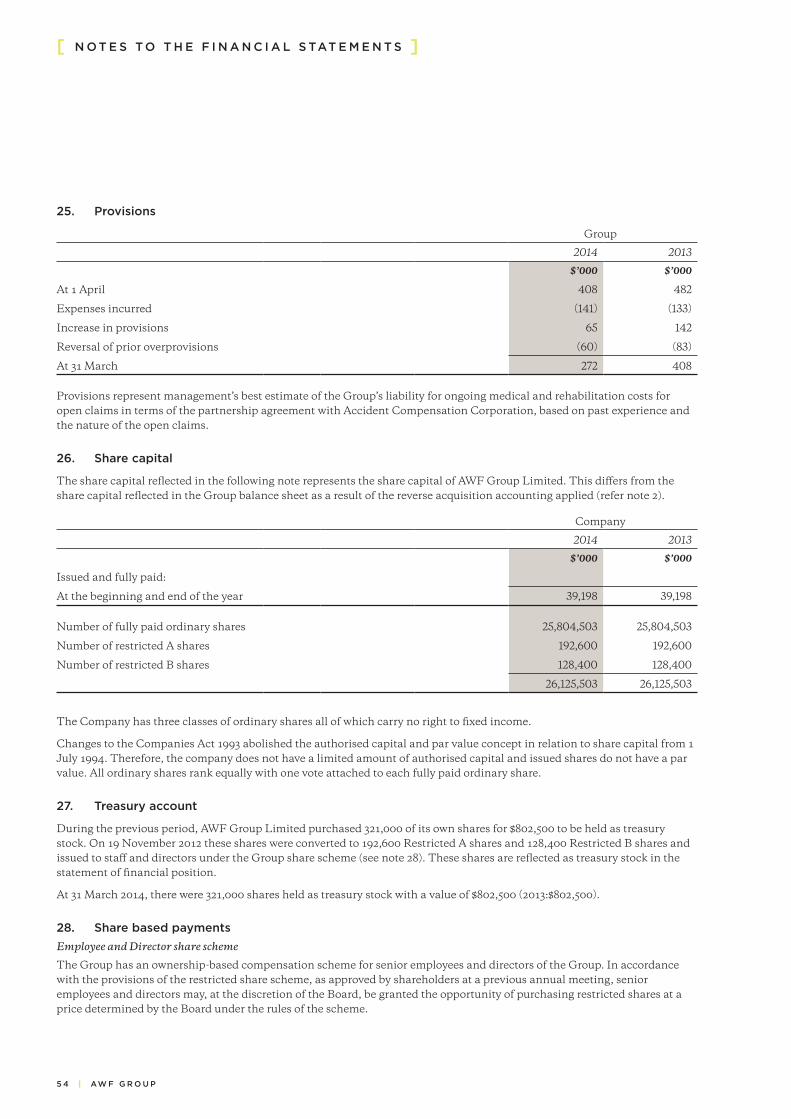
25. Provisions
Group
2014 2013
$’000 $’000
At 1 April 408 482
Expenses incurred (141) (133)
Increase in provisions 65 142
Reversal of prior overprovisions (60) (83)
At 31 March 272 408 Provisions represent management’s best estimate of the Group’s liability for ongoing medical and rehabilitation costs for open claims in terms of the partnership agreement with Accident Compensation Corporation, based on past experience and the nature of the open claims.
26. Share capital
The share capital reflected in the following note represents the share capital of AWF Group Limited. This differs from the share capital reflected in the Group balance sheet as a result of the reverse acquisition accounting applied (refer note 2).
Company
2014 2013
$’000 $’000
Issued and fully paid:
At the beginning and end of the year 39,198 39,198
Number of fully paid ordinary shares 25,804,503 25,804,503
Number of restricted A shares 192,600 192,600
Number of restricted B shares 128,400 128,400
26,125,503 26,125,503
The Company has three classes of ordinary shares all of which carry no right to fixed income.
Changes to the Companies Act 1993 abolished the authorised capital and par value concept in relation to share capital from 1 July 1994. Therefore, the company does not have a limited amount of authorised capital and issued shares do not have a par value. All ordinary shares rank equally with one vote attached to each fully paid ordinary share.
27. Treasury account
During the previous period, AWF Group Limited purchased 321,000 of its own shares for $802,500 to be held as treasury stock. On 19 November 2012 these shares were converted to 192,600 Restricted A shares and 128,400 Restricted B shares and issued to staff and directors under the Group share scheme (see note 28). These shares are reflected as treasury stock in the statement of financial position.
At 31 March 2014, there were 321,000 shares held as treasury stock with a value of $802,500 (2013:$802,500).
28. Share based paymentsEmployee and Director share scheme
The Group has an ownership-based compensation scheme for senior employees and directors of the Group. In accordance with the provisions of the restricted share scheme, as approved by shareholders at a previous annual meeting, senior employees and directors may, at the discretion of the Board, be granted the opportunity of purchasing restricted shares at a price determined by the Board under the rules of the scheme.
[ N O T E S T O T H E F I N A N C I A L S TAT E M E N T S ]
5 4 | AW F G R O U P
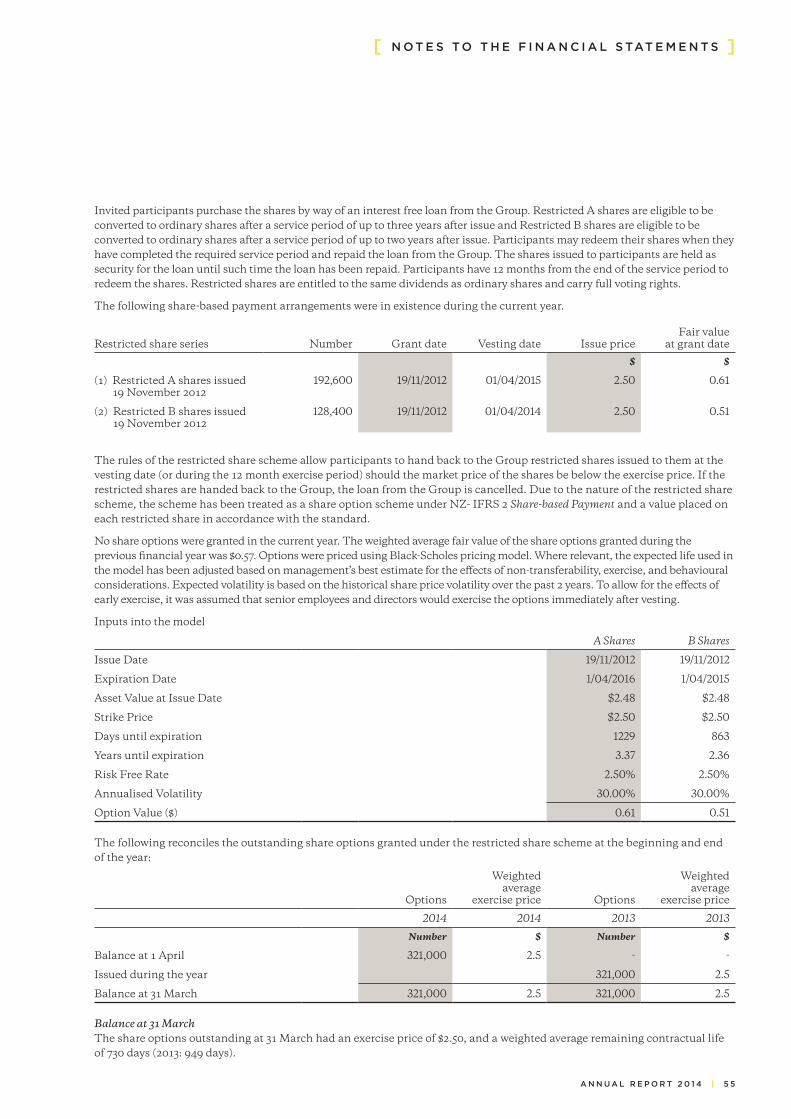
Invited participants purchase the shares by way of an interest free loan from the Group. Restricted A shares are eligible to be converted to ordinary shares after a service period of up to three years after issue and Restricted B shares are eligible to be converted to ordinary shares after a service period of up to two years after issue. Participants may redeem their shares when they have completed the required service period and repaid the loan from the Group. The shares issued to participants are held as security for the loan until such time the loan has been repaid. Participants have 12 months from the end of the service period to redeem the shares. Restricted shares are entitled to the same dividends as ordinary shares and carry full voting rights.
The following share-based payment arrangements were in existence during the current year.
Restricted share series
Number
Grant date
Vesting date
Issue price
Fair value at grant date
$ $
(1) Restricted A shares issued 19 November 2012
192,600 19/11/2012 01/04/2015 2.50 0.61
(2) Restricted B shares issued 19 November 2012
128,400 19/11/2012 01/04/2014 2.50 0.51
The rules of the restricted share scheme allow participants to hand back to the Group restricted shares issued to them at the vesting date (or during the 12 month exercise period) should the market price of the shares be below the exercise price. If the restricted shares are handed back to the Group, the loan from the Group is cancelled. Due to the nature of the restricted share scheme, the scheme has been treated as a share option scheme under NZ- IFRS 2 Share-based Payment and a value placed on each restricted share in accordance with the standard.
No share options were granted in the current year. The weighted average fair value of the share options granted during the previous financial year was $0.57. Options were priced using Black-Scholes pricing model. Where relevant, the expected life used in the model has been adjusted based on management’s best estimate for the effects of non-transferability, exercise, and behavioural considerations. Expected volatility is based on the historical share price volatility over the past 2 years. To allow for the effects of early exercise, it was assumed that senior employees and directors would exercise the options immediately after vesting.
Inputs into the model
A Shares B Shares
Issue Date 19/11/2012 19/11/2012
Expiration Date 1/04/2016 1/04/2015
Asset Value at Issue Date $2.48 $2.48
Strike Price $2.50 $2.50
Days until expiration 1229 863
Years until expiration 3.37 2.36
Risk Free Rate 2.50% 2.50%
Annualised Volatility 30.00% 30.00%
Option Value ($) 0.61 0.51 The following reconciles the outstanding share options granted under the restricted share scheme at the beginning and end of the year:
Options
Weighted average
exercise price
Options
Weighted average
exercise price
2014 2014 2013 2013
Number $ Number $
Balance at 1 April 321,000 2.5 - -
Issued during the year 321,000 2.5
Balance at 31 March 321,000 2.5 321,000 2.5
Balance at 31 MarchThe share options outstanding at 31 March had an exercise price of $2.50, and a weighted average remaining contractual life of 730 days (2013: 949 days).
[ N O T E S T O T H E F I N A N C I A L S TAT E M E N T S ]
A N N U A L R E P O R T 2 0 1 4 | 5 5

Expense recognisedThe expense recognised by the Group and Company in the current reporting period is $62,655 (2013: $23,000) (note 11).
29. Retained earnings and dividends
Group Company
2014 2013 2014 2013
$'000 $'000 $'000 $'000
Balance at 1 April 7,842 4,657 1,578 120
Dividends paid (4,859) (3,738) (4,859) (3,738)
Total comprehensive income for the year attributable to equity holders of the parent
3,952 6,923 4,705 5,196
Balance at 31 March 6,935 7,842 1,424 1,578
2014 2013
Cents per share Total $’000 Cents per share Total $’000
Recognised amounts
Prior year final dividend 12.2 3,187 8.0 2,090
Interim dividend 6.4 1,672 6.4 1,648
4,859 3,738
Unrecognised amounts
Final dividend 7.6 1,986 12.2 3,187 On 28 May 2014 the directors approved the payment of a fully imputed final dividend of 7.6 cents per share (total dividend $1,985,538) to be paid on 27 June 2014 to all shareholders registered on 20 June 2014.
30. Financial instruments
Capital risk managementThe Group manages its capital to ensure that the entities in the Group will be able to continue as a going concern while maximising the return to stakeholders through the optimisation of the debt and equity balance. The Group’s overall strategy remains unchanged from 2013.
The capital structure of the Group consists of debt, which includes the borrowings disclosed in note 24, cash and cash equivalents and equity attributable to equity holders of the parent, comprising issued share capital, treasury account and retained earnings as disclosed in notes 26, 27 and 29 respectively.
The directors review the capital structure on a periodic basis. As part of this review the directors consider the cost of capital and the risks associated with each class of capital. The directors will balance the overall capital structure through payment of dividends, new share issues, and share buy backs as well as the issue of new debt or the redemption of existing debt.
Cash and cash equivalentsCash and cash equivalents comprise cash held by the Group and short-term bank deposits with an original maturity of less than three months. The carrying amount of these assets approximates their fair value.
Interest is earned at 0.33% (2013: 2.68%) on bank balances.
Advances to subsidiariesAdvances to subsidiaries are non-interest bearing and repayable on demand. The directors consider that the carrying amount of advances to subsidiaries approximates their fair value.
Fair Value of Financial InstrumentsThe carrying amounts of financial instruments at balance date approximate the fair value at that date.
Financial Risk Management ObjectivesThe Group monitors and manages the financial risks relating to the operations of the Group. These risks include market risk, credit risk and liquidity risk.
[ N O T E S T O T H E F I N A N C I A L S TAT E M E N T S ]
5 6 | AW F G R O U P
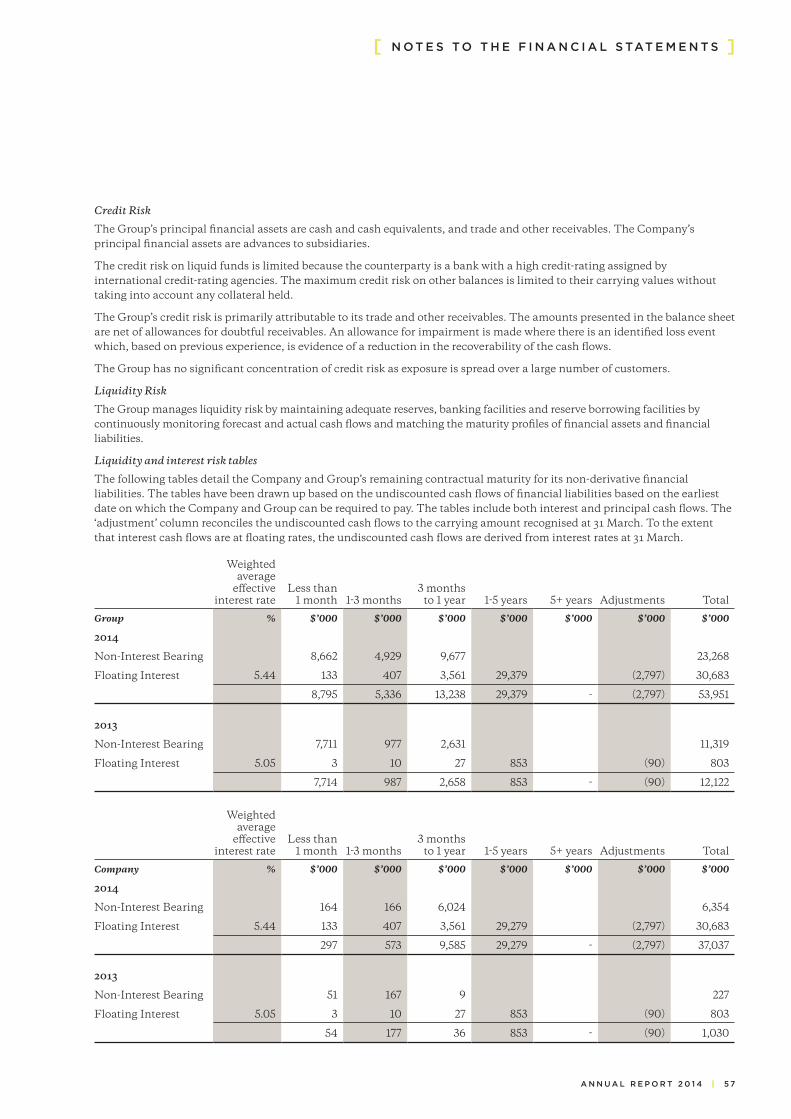
Credit Risk
The Group’s principal financial assets are cash and cash equivalents, and trade and other receivables. The Company’s principal financial assets are advances to subsidiaries.
The credit risk on liquid funds is limited because the counterparty is a bank with a high credit-rating assigned by international credit-rating agencies. The maximum credit risk on other balances is limited to their carrying values without taking into account any collateral held.
The Group’s credit risk is primarily attributable to its trade and other receivables. The amounts presented in the balance sheet are net of allowances for doubtful receivables. An allowance for impairment is made where there is an identified loss event which, based on previous experience, is evidence of a reduction in the recoverability of the cash flows.
The Group has no significant concentration of credit risk as exposure is spread over a large number of customers.
Liquidity Risk
The Group manages liquidity risk by maintaining adequate reserves, banking facilities and reserve borrowing facilities by continuously monitoring forecast and actual cash flows and matching the maturity profiles of financial assets and financial liabilities.
Liquidity and interest risk tables
The following tables detail the Company and Group’s remaining contractual maturity for its non-derivative financial liabilities. The tables have been drawn up based on the undiscounted cash flows of financial liabilities based on the earliest date on which the Company and Group can be required to pay. The tables include both interest and principal cash flows. The ‘adjustment’ column reconciles the undiscounted cash flows to the carrying amount recognised at 31 March. To the extent that interest cash flows are at floating rates, the undiscounted cash flows are derived from interest rates at 31 March.
Weighted average
effective interest rate
Less than 1 month
1-3 months
3 months to 1 year
1-5 years
5+ years
Adjustments
Total
Group % $’000 $’000 $’000 $’000 $’000 $’000 $’000
2014
Non-Interest Bearing 8,662 4,929 9,677 23,268
Floating Interest 5.44 133 407 3,561 29,379 (2,797) 30,683
8,795 5,336 13,238 29,379 - (2,797) 53,951
2013
Non-Interest Bearing 7,711 977 2,631 11,319
Floating Interest 5.05 3 10 27 853 (90) 803
7,714 987 2,658 853 - (90) 12,122
Weighted average
effective interest rate
Less than 1 month
1-3 months
3 months to 1 year
1-5 years
5+ years
Adjustments
Total
Company % $’000 $’000 $’000 $’000 $’000 $’000 $’000
2014
Non-Interest Bearing 164 166 6,024 6,354
Floating Interest 5.44 133 407 3,561 29,279 (2,797) 30,683
297 573 9,585 29,279 - (2,797) 37,037
2013
Non-Interest Bearing 51 167 9 227
Floating Interest 5.05 3 10 27 853 (90) 803
54 177 36 853 - (90) 1,030
[ N O T E S T O T H E F I N A N C I A L S TAT E M E N T S ]
A N N U A L R E P O R T 2 0 1 4 | 5 7

Currency Risk
The Group does not undertake transactions in foreign currencies and therefore has no currency risk.
Interest Rate Risk
The Group is exposed to interest rate risk as it borrows funds at both fixed and floating interest rates. The risk is managed by maintaining an appropriate mix between fixed and floating rate borrowings.
The sensitivity analysis has been based on the exposure to interest rates for borrowings at 31 March.
A 50 point increase or decrease is used when reporting interest rate risk internally to key management personnel and represents management’s assessment of the reasonably possible change in interest rates.
If interest rates had been 50 basis points higher/lower and all other variables were held constant, the Group’s profit for the year ended 31 March would increase/decrease by $43,000 (2013 $3,000).
The Group’s sensitivity to interest rates has changed during the current year mainly due to the increased level of borrowing.
31. Related party transactions
31.1 Controlling entity
The SA Hull Family Trust No.2, which holds 14,958,836 shares or 58.0% in the company, is the ultimate controlling entity of the Group.
31.2 Trading transactions
During the year, group entities entered into the following trading transactions with a related party that is not a member of the Group:
Property leases
2014 2013
$’000 $’000
Hull Properties Limited 75 113 Simon Hull is a shareholder of Hull Properties Limited. Lease payments are on commercial terms. No amounts remain unpaid at 31 March 2014 (2013: Nil).
AWF Group Limited received the following amounts from its subsidiary Allied Work Force Limited:
Company
2014 2013
$’000 $’000
Management fees 2,100 1,800
Dividends 4,859 4,088
6,959 5,888
Advances to subsidiaries at 31 March were as follows:
Company
2014 2013
$’000 $’000
Allied Work Force Limited 11,234 10,974
[ N O T E S T O T H E F I N A N C I A L S TAT E M E N T S ]
5 8 | AW F G R O U P

31.3 Compensation of key management personnel
The remuneration of directors and other members of key management during the year was as follows:
Group Company
2014 2013 2014 2013
$'000 $'000 $'000 $'000
Short-term benefits 1,116 1,121 881 867 The remuneration of directors and key executives is determined by the remuneration committee having regard to the performance of individuals and market trends.
32. Net cash flow from operating activities
Group Company
2014 2013 2014 2013
$'000 $'000 $'000 $'000
Reported profit after tax 3,952 6,923 4,705 5,196
Non-cash items:
Depreciation and amortisation 1,879 1,490
Loss on disposal of property, plant and equipment (25) 124
Movement in deferred tax (208) (669) 29 (4)
Movement in bad debt provision plus bad debt write off in current year
287 236
Gain on sale of subsidiary (2,242) (1,030)
Equity-settled share-based payments 63 23 63 23
1,996 (1,038) 92 (1,011)
Movements in working capital excluding movements relating to purchase of subsidiaries:
Decrease/(increase) in trade and other receivables (1,020) (2,632) (8)
Increase in trade and other payables 820 1,937 127 87
Increase in provisions (136) (74)
Increase in taxation payable (1,126) 653 (36) 125
(1,462) (116) 83 212
Net cash inflows from operating activities 4,486 5,769 4,880 4,397
[ N O T E S T O T H E F I N A N C I A L S TAT E M E N T S ]
A N N U A L R E P O R T 2 0 1 4 | 5 9

33. Operating lease arrangements
Group
2014 2013
$’000 $’000
Minimum lease payments under operating leasesrecognised as an expense in the year
1,636 1,259
At the balance sheet date, the Group has outstanding commitments under non-cancellable operating leases, which fall due as follows:
Group
$’000 $’000
Within one year 1,811 1,293
In the second to fifth years inclusive 4,750 3,538
After five years 1,908 3,072
8,469 7,902
Operating lease payments represent rentals payable by the Group for its operational properties and motor vehicles.
Property leases are negotiated for an average term of nine years and rentals are fixed for an average of three years.
Motor vehicles are negotiated for a period of three to five years and are fixed.
34. Capital commitments and contingent liabilities
The Group has no capital commitments at 31 March 2014 (2013: $Nil).
The Group has no contingent liabilities at 31 March 2014 (2013: $Nil).
35. Events after the reporting period35.1 Final dividend
On 28 May 2014 the directors approved the payment of a fully imputed final dividend of $1.986 million (7.6 cents per share) to be paid on 27 June 2014.
36. Approval of financial statements
The financial statements were approved by the board of directors and authorised for issue on 28 May 2014.
Director Director 28 May 2014 28 May 2014
[ N O T E S T O T H E F I N A N C I A L S TAT E M E N T S ]
6 0 | AW F G R O U P
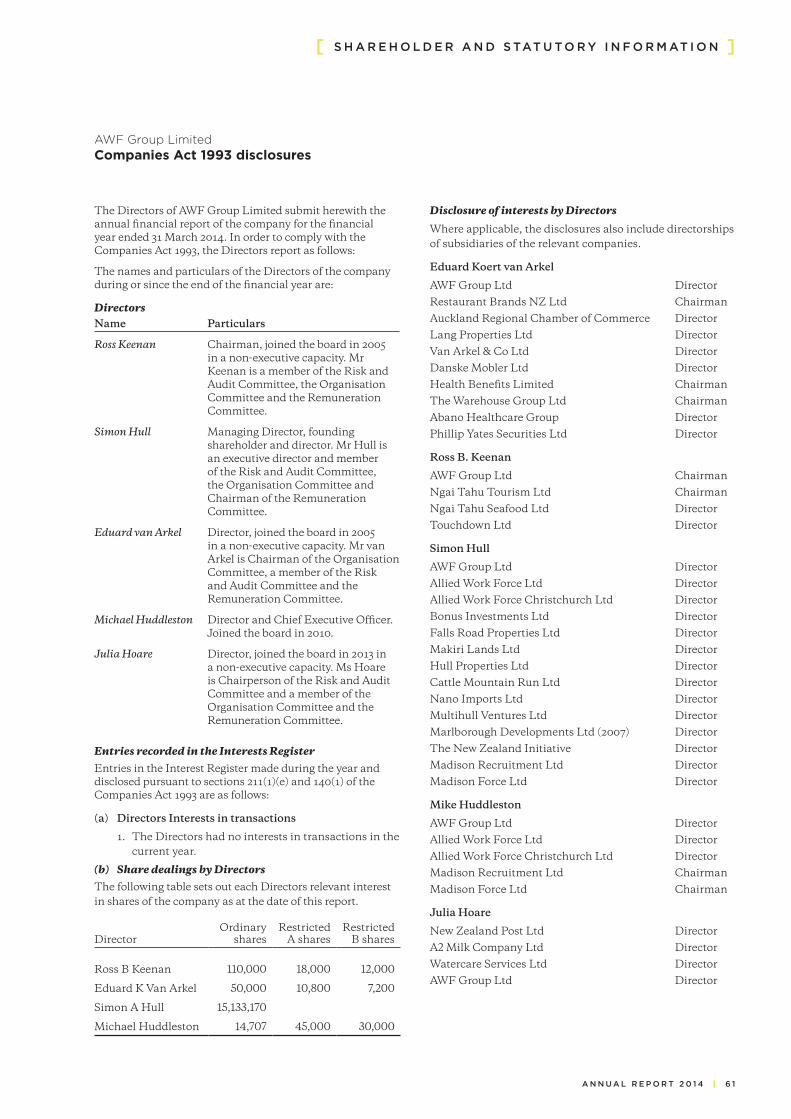
The Directors of AWF Group Limited submit herewith the annual financial report of the company for the financial year ended 31 March 2014. In order to comply with the Companies Act 1993, the Directors report as follows:
The names and particulars of the Directors of the company during or since the end of the financial year are:
DirectorsName Particulars
Ross Keenan Chairman, joined the board in 2005 in a non-executive capacity. Mr Keenan is a member of the Risk and Audit Committee, the Organisation Committee and the Remuneration Committee.
Simon Hull Managing Director, founding shareholder and director. Mr Hull is an executive director and member of the Risk and Audit Committee, the Organisation Committee and Chairman of the Remuneration Committee.
Eduard van Arkel Director, joined the board in 2005 in a non-executive capacity. Mr van Arkel is Chairman of the Organisation Committee, a member of the Risk and Audit Committee and the Remuneration Committee.
Michael Huddleston Director and Chief Executive Officer. Joined the board in 2010.
Julia Hoare Director, joined the board in 2013 in a non-executive capacity. Ms Hoare is Chairperson of the Risk and Audit Committee and a member of the Organisation Committee and the Remuneration Committee.
Entries recorded in the Interests Register
Entries in the Interest Register made during the year and disclosed pursuant to sections 211(1)(e) and 140(1) of the Companies Act 1993 are as follows:
(a) Directors Interests in transactions
1. The Directors had no interests in transactions in the current year.
(b) Share dealings by Directors
The following table sets out each Directors relevant interest in shares of the company as at the date of this report.
Director
Ordinary shares
Restricted A shares
Restricted B shares
Ross B Keenan 110,000 18,000 12,000
Eduard K Van Arkel 50,000 10,800 7,200
Simon A Hull 15,133,170
Michael Huddleston 14,707 45,000 30,000
Disclosure of interests by Directors
Where applicable, the disclosures also include directorships of subsidiaries of the relevant companies.
Eduard Koert van Arkel
AWF Group Ltd DirectorRestaurant Brands NZ Ltd ChairmanAuckland Regional Chamber of Commerce DirectorLang Properties Ltd Director Van Arkel & Co Ltd Director Danske Mobler Ltd DirectorHealth Benefits Limited ChairmanThe Warehouse Group Ltd ChairmanAbano Healthcare Group DirectorPhillip Yates Securities Ltd Director
Ross B. Keenan
AWF Group Ltd ChairmanNgai Tahu Tourism Ltd ChairmanNgai Tahu Seafood Ltd DirectorTouchdown Ltd Director
Simon Hull
AWF Group Ltd DirectorAllied Work Force Ltd DirectorAllied Work Force Christchurch Ltd DirectorBonus Investments Ltd DirectorFalls Road Properties Ltd DirectorMakiri Lands Ltd DirectorHull Properties Ltd DirectorCattle Mountain Run Ltd DirectorNano Imports Ltd DirectorMultihull Ventures Ltd DirectorMarlborough Developments Ltd (2007) DirectorThe New Zealand Initiative DirectorMadison Recruitment Ltd DirectorMadison Force Ltd Director
Mike Huddleston
AWF Group Ltd DirectorAllied Work Force Ltd DirectorAllied Work Force Christchurch Ltd DirectorMadison Recruitment Ltd ChairmanMadison Force Ltd Chairman
Julia Hoare
New Zealand Post Ltd DirectorA2 Milk Company Ltd DirectorWatercare Services Ltd DirectorAWF Group Ltd Director
AWF Group LimitedCompanies Act 1993 disclosures
[ S H A R E H O L D E R A N D S TAT U T O R Y I N F O R M AT I O N ]
A N N U A L R E P O R T 2 0 1 4 | 6 1

Changes in state of affairs
During the year there was no significant change in the state of affairs of the consolidated entity other than that referred to in the financial statements or notes thereto.
Director Remuneration
The following table discloses the remuneration of the Directors of the company:
Director
Fees
Salary
Share-based payments
Total
$’000 $’000 $’000 $’000
Ross Keenan 70 6 76
Eduard van Arkel 42 4 46
Simon Hull 42 42
Julia Hoare 23 23
Michael Huddleston 422 15 437
177 422 25 624
Employee Remuneration
Grouped below, in accordance with section 211(1)(g) of the Companies Act 1993, are the number of employees or former employees of the company, excluding Directors of the company, who received remuneration and other benefits in their capacity as employees, totalling $100,000 or more, during the year:
Remuneration Number of Employees Remuneration Number of Employees
2014 2013 2014 2013
$100,000 - 109,999 3 9 $190,000 - 199,999
$110,000 - 119,999 4 2 $220,000 - 229,999
$120,000 - 129,999 1 $230,000 - 239,999 1
$130,000 - 139,999 3 1 $240,000 - 249,999
$140,000 - 149,999 1 1 $250,000 - 259,999 1 1
$150,000 - 159,999 1 1 $260,000 - 269,999
$160,000 - 169,999 2 1 $270,000 - 279,999 1
$170,000 - 179,999 1 $370,000 - 379,999
$180,000 - 189,999 $430,000 - 439,999 1 1
Additional stock exchange information As at 12 May 2014Share registry
Link Market Services 138 Tancred Street Ashburton New Zealand PO Box 384 Ashburton 8300 New Zealand Telephone: +64 3 308 8887
6 2 | AW F G R O U P

Distribution of holders of quoted shares
Size of holding
Number of fully paid ordinary shareholders
Percentage
Number of fully paid share
Percentage
1 - 1000 67 12.93 47,929 0.19
1001 - 5000 230 44.4 739,219 2.86
5001 - 10000 99 19.11 794,231 3.08
10001 - 50000 88 16.99 1,936,100 7.5
50001 - 100000 15 2.9 1,107,149 4.29
100001 and Over 19 3.67 21,179,875 82.08
Total 518 100 25,804,503 100
Substantial security holders
Pursuant to sub-part 3 of part two of the Securities Markets Act 1988, the following persons has given notice at 28 May 2014 that they were substantial security holders in the company and held a “relevant interest” in the number of fully paid ordinary shares shown below:
Substantial security holder
Fully paid shares in which relevant interest is held
Date of noticeNumber Percentage
SA Hull 15,133,170 58.65% 6/06/2005
Milford Asset Management Limited 1,341,047 5.20% 23/01/2014
Twenty largest holders of quoted equity securities
Investor Total Units Percentage
Simon Alexander Hull & David John Cox 14,958,836 57.97
New Zealand Central Securities Depository Limited 1,515,592 5.87
Russell John Field & Anthony James Palmer 1,125,000 4.36
David Mitchell Odlin 460,400 1.78
Susanne Rhoda Webster 426,750 1.65
Peter Abe Hull & Antoinette Ngaire Edmonds & Rennie Cox Trustees No 1 Ltd 364,157 1.41
Ian Harold Holland 333,800 1.29
Rotorua Trust Perpetual Capital Fund Limited 333,000 1.29
Custodial Services Limited 272,455 1.06
Barry Maurice Holland 244,000 0.95
Joanna Hickman & John Anthony Callaghan & Kevin James Hickman 194,936 0.76
Simon Hull 174,334 0.68
FNZ Custodians Limited 144,375 0.56
Custodial Services Limited 132,090 0.51
Garrett Smythe Limited 125,000 0.48
Ross Barry Keenan 110,000 0.43
Custodial Services Limited 109,650 0.42
Custodial Services Limited 101,300 0.39
Custodial Services Limited 98,177 0.38
Lay Dodd Trustee Services Limited & Patricia Anne Neal 97,371 0.38
Murray Alan Hilder & Janet Mary Hilder & Dale Paretovich 97,371 0.38
21,418,594 83.00
A N N U A L R E P O R T 2 0 1 4 | 6 3

www.awf.co.nz
Directors
Ross Keenan (Chairman) Michael Huddleston (Chief Executive Officer) Eduard van Arkel (Independent Director) Julia Hoare (Independent Director) Simon Hull (Managing Director)
Auditor
Deloitte Deloitte Centre 80 Queen Street PO Box 33 AUCKLAND Ph: 09 309 4944 Fax: 09 309 4947
Solicitors
Russell McVeagh Vero Centre 48 Shortland Street PO Box 8 AUCKLAND Ph: 09 367 8000 Fax: 09 367 8163
Share Registry
Link Market Services 138 Tancred Street PO Box 384 ASHBURTON Ph: 03 308 8887 or: 0800 377 388 Fax: 03 308 1311
Registered Office of AWF Group Limited
2 Walls Road PO Box 12832 Penrose AUCKLAND Ph: 09 526 8770 Fax: 09 579 0224
Directory
Related Documents


