Group E1: Data Quality Control and Quality Assurance Junhong (June) Wang, Scot Loehrer To introduce the following areas, determine their priorities and make recommendations • Where we are with regard to the service being discussed • What trends we have observed • What challenges we see in the future Facilities to cover: 1. Sounding system: Kate Young/June Wang 2. ISS: Bill Brown 3. ISFS: Steve Oncley 4. S-Pol: Bob Rilling 5. ELDORA: Wen-Chau/Michael 6. REAL: Bruce Morley 7. CSU CHILL: Pat Kennedy 8. WCR: Samuel Haimov 9. Airbone: Al Schanot 10. Composite data: Scot Loehrer

Group E1: Data Quality Control and Quality Assurance Junhong (June) Wang, Scot Loehrer To introduce the following areas, determine their priorities and.
Jan 02, 2016
Welcome message from author
This document is posted to help you gain knowledge. Please leave a comment to let me know what you think about it! Share it to your friends and learn new things together.
Transcript
Group E1: Data Quality Control and Quality Assurance
Junhong (June) Wang, Scot Loehrer
To introduce the following areas, determine their priorities and make recommendations
• Where we are with regard to the service being discussed
• What trends we have observed
• What challenges we see in the future
Facilities to cover:
1. Sounding system: Kate Young/June Wang 2. ISS: Bill Brown 3. ISFS: Steve Oncley 4. S-Pol: Bob Rilling
5. ELDORA: Wen-Chau/Michael 6. REAL: Bruce Morley 7. CSU CHILL: Pat Kennedy 8. WCR: Samuel Haimov 9. Airbone: Al Schanot10. Composite data: Scot Loehrer
Specific possible areas to cover for Data Quality Control & Quality Assurance (Priority, Priority, Priority)
1. Data delivery (timeliness and quality)• Trends: towards real time data delivery• Challenges:
• communications between users and providers, • different delivery time for multiple facilities, • going too far with quick-look the data
• Solutions: • better coordination within EOL for multiple facilities, • asking PIs prioritize the data request,
Specific possible areas to cover for Data Quality Control & Quality Assurance (Priority, Priority, Priority)
2. Automated and in-field QC/QA for real-time data QC/QA
and delivery• Trends: more requests for real-time data QC/QA and delivery• Challenges:
• different community have different needs (DA/quick look)• requirement for combining different sensor data
• Solutions: • collaborations and communications among communities• hardware engineer in the field• automated QC/QA is based on multiple years of
experiences

Specific possible areas to cover for Data Quality Control & Quality Assurance (Priority, Priority, Priority)
3. Value-added data and “statistic views of data”• Trend: more requests• Challenges:
• Where to set the threshold?• Define user requirements• Different ways to calculate certain parameters
• Solutions: • VAD is a good practice for original data quality • With new techniques, there are some probabilistic
evaluations of data. Leave the decision to PIs. • For long term, it is good not to remove the “bad” data,
which might mean removing the good data. Important not to remove marginal data.
• Provide a list of algorithm commonly used.
Specific possible areas to cover for Data Quality Control & Quality Assurance (Priority, Priority, Priority)
4. Composites and operational data sources: common
QC/QA• Trends: more needs• Challenges:
• Access to consistent and centralized detailed metadata from all networks
• Adequately obtaining the operational data• Different version of QCed operational data not produced by
NCAR (proprietary processing algorithms)• Solutions:
• a good reference on metadata definition (Fed., …, USGS)• Development of metadata database for networks (e.g. Fac.
Assessment)
Specific possible areas to cover for Data Quality Control & Quality Assurance (Priority, Priority, Priority)
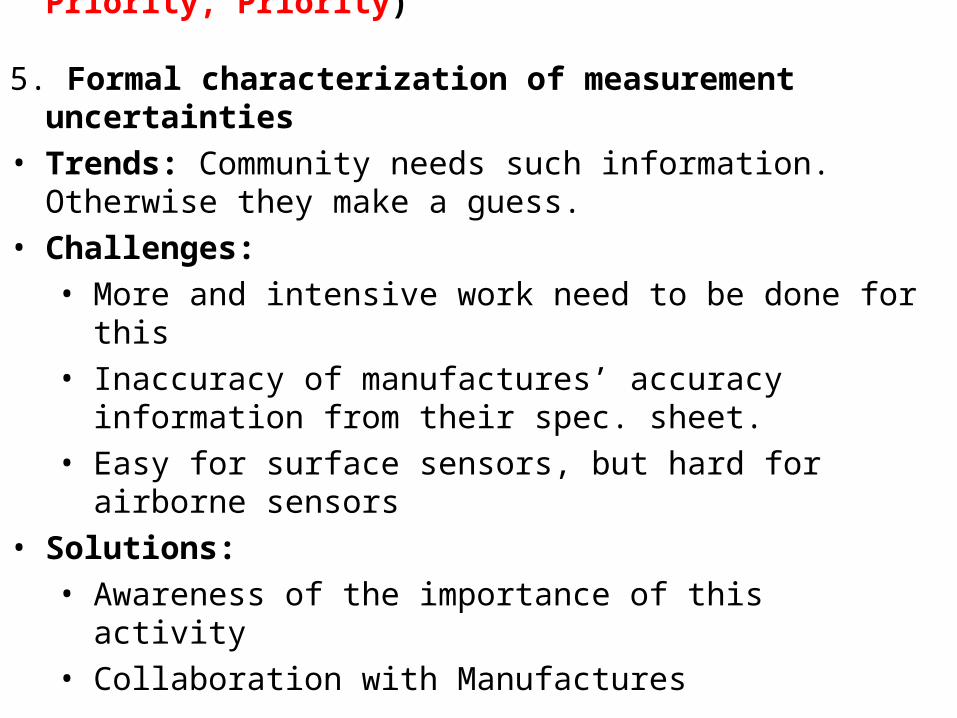
5. Formal characterization of measurement uncertainties• Trends: Community needs such information. Otherwise they
make a guess.• Challenges:
• More and intensive work need to be done for this• Inaccuracy of manufactures’ accuracy information from
their spec. sheet.• Easy for surface sensors, but hard for airborne sensors
• Solutions:• Awareness of the importance of this activity• Collaboration with Manufactures
Specific possible areas to cover for Data Quality Control & Quality Assurance (Priority, Priority, Priority)
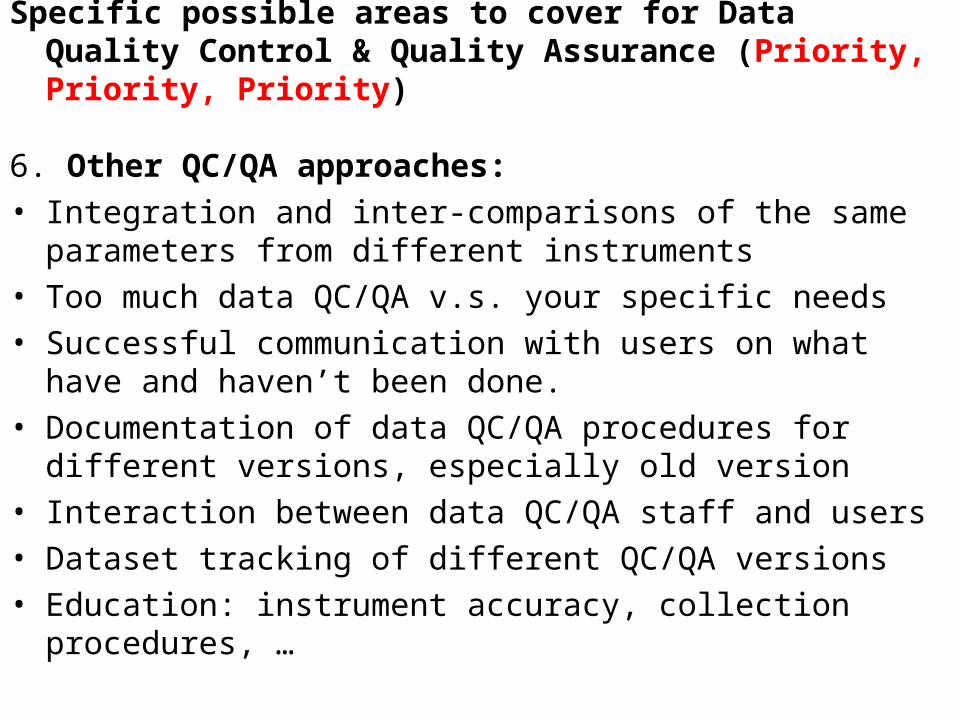
6. Other QC/QA approaches: • Integration and inter-comparisons of the same parameters
from different instruments • Too much data QC/QA v.s. your specific needs• Successful communication with users on what have and
haven’t been done. • Documentation of data QC/QA procedures for different
versions, especially old version• Interaction between data QC/QA staff and users• Dataset tracking of different QC/QA versions• Education: instrument accuracy, collection procedures, …
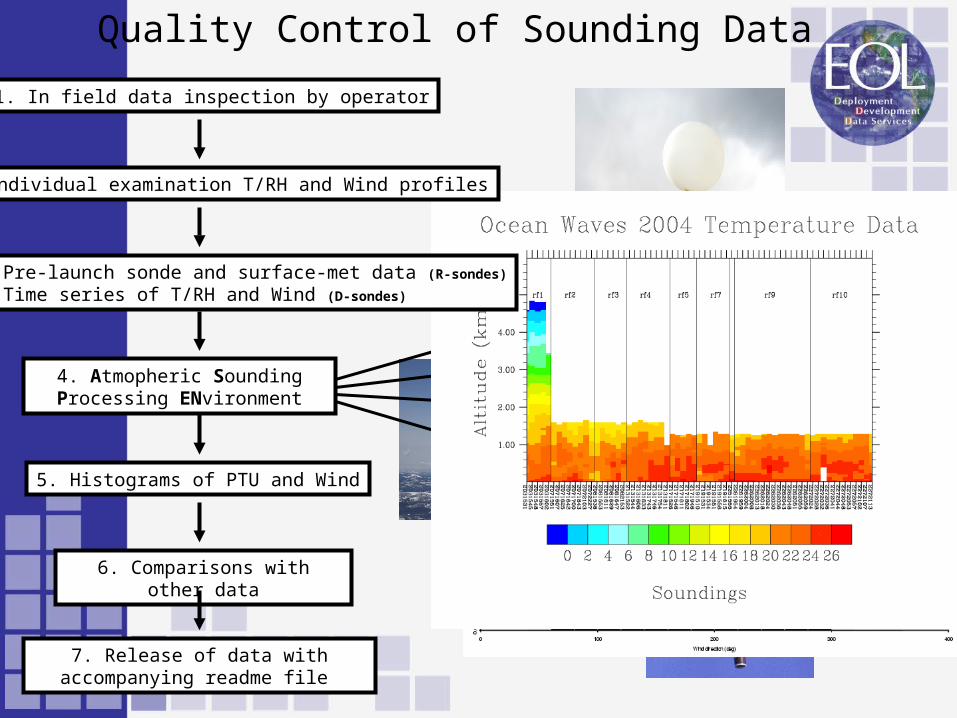
Quality Control of Sounding Data
1. In field data inspection by operator
4. Atmopheric Sounding Processing ENvironment
6. Comparisons with other data
5. Histograms of PTU and Wind
7. Release of data with accompanying readme file
Provides analysis tools (skew-t diagrams, xy-plot)
Removes suspect data pointsRemoves suspect data points
Performs smoothingPerforms smoothing
Batch mode for processing large datasetsBatch mode for processing large datasets
2. Individual examination T/RH and Wind profiles
3. Pre-launch sonde and surface-met data (R-sondes)
Time series of T/RH and Wind (D-sondes)
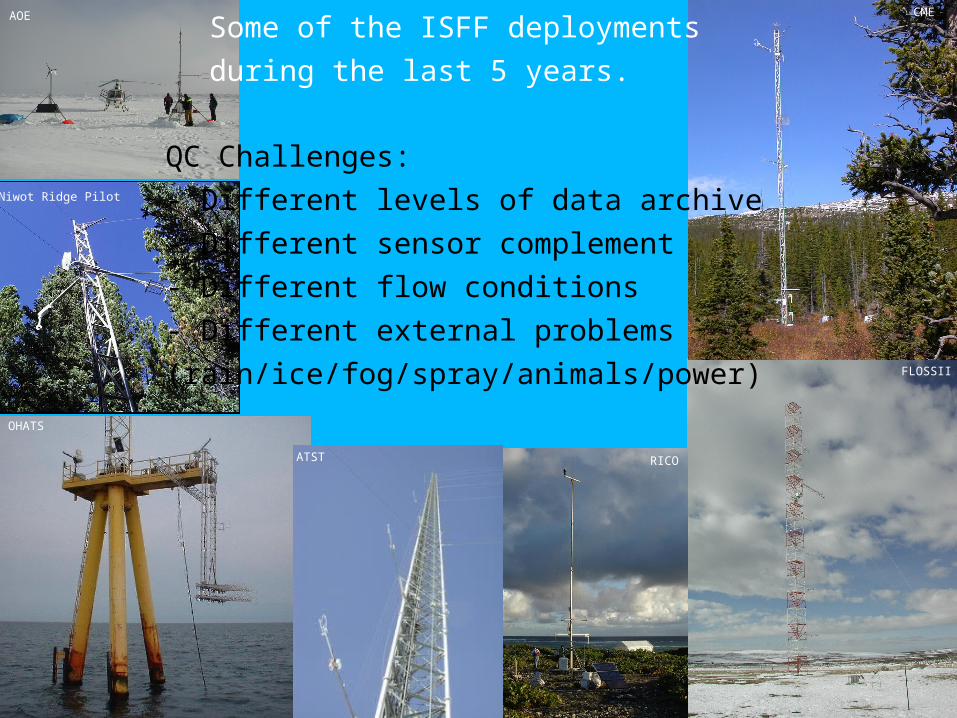
Some of the ISFF deployments
during the last 5 years.
QC Challenges:
- Different levels of data archive
- Different sensor complement
- Different flow conditions
- Different external problems
(rain/ice/fog/spray/animals/power)
AOE
Niwot Ridge Pilot
OHATS
ATST RICO
FLOSSII
CME
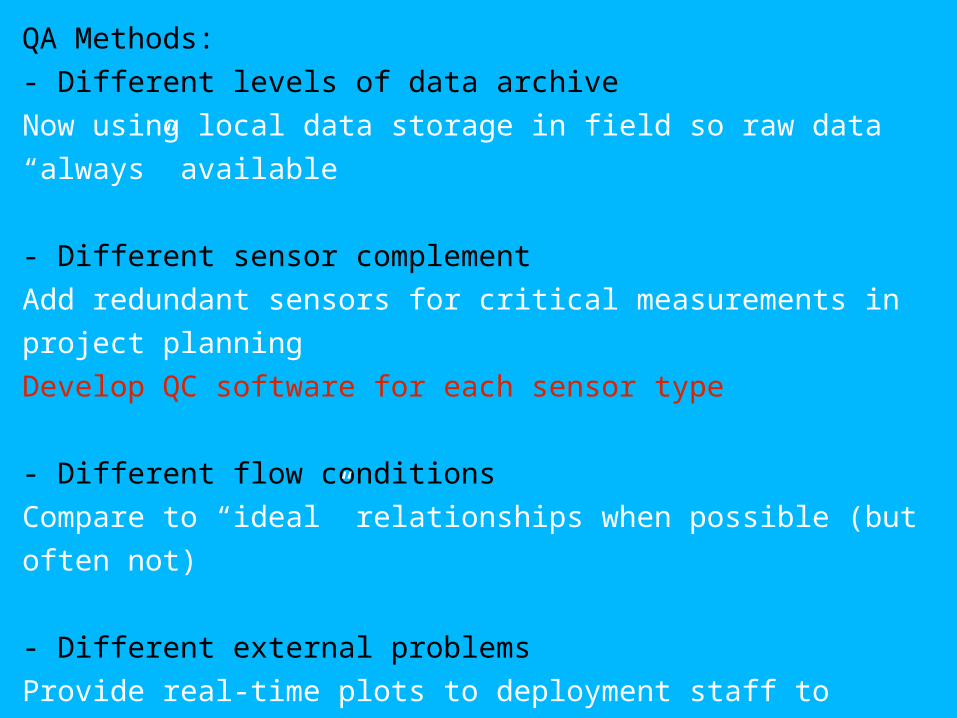
QA Methods:
- Different levels of data archive
Now using local data storage in field so raw data “always” available
- Different sensor complement
Add redundant sensors for critical measurements in project planning
Develop QC software for each sensor type
- Different flow conditions
Compare to “ideal” relationships when possible (but often not)
- Different external problems
Provide real-time plots to deployment staff to identify problems
Often takes months of post-analysis to determine algorithm
(sometimes resort to manual identification of bad data)
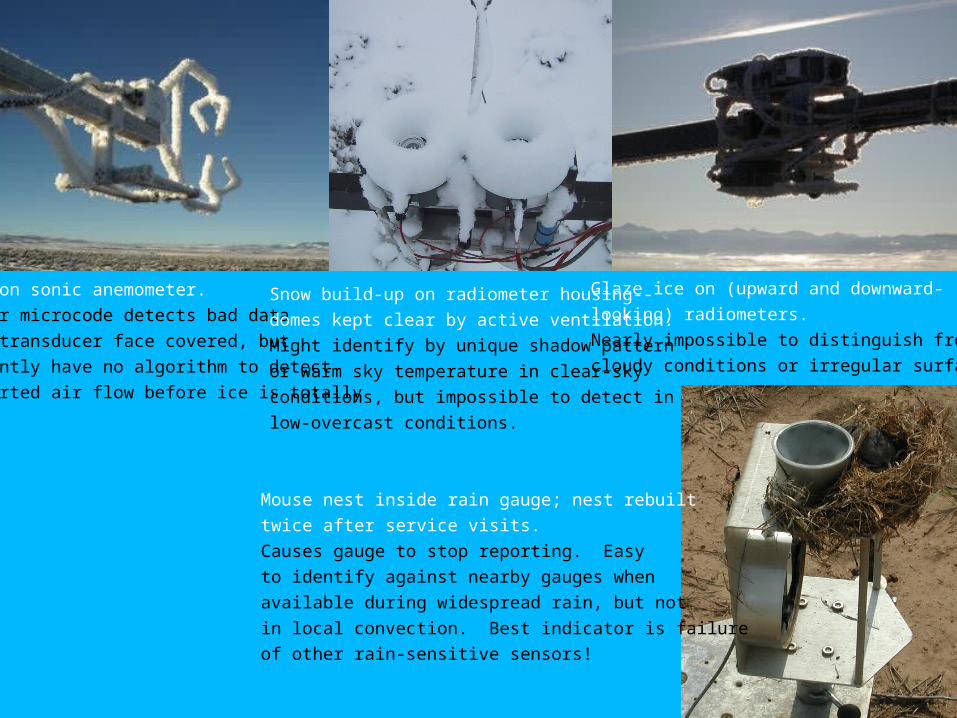
Rime on sonic anemometer.
Sensor microcode detects bad data
when transducer face covered, but
currently have no algorithm to detect
distorted air flow before ice is totally
gone.
Glaze ice on (upward and downward-
looking) radiometers.
Nearly impossible to distinguish from
cloudy conditions or irregular surface.
Snow build-up on radiometer housing--
domes kept clear by active ventilation.
Might identify by unique shadow pattern
or warm sky temperature in clear-sky
conditions, but impossible to detect in
low-overcast conditions.
Mouse nest inside rain gauge; nest rebuilt
twice after service visits.
Causes gauge to stop reporting. Easy
to identify against nearby gauges when
available during widespread rain, but not
in local convection. Best indicator is failure
of other rain-sensitive sensors!
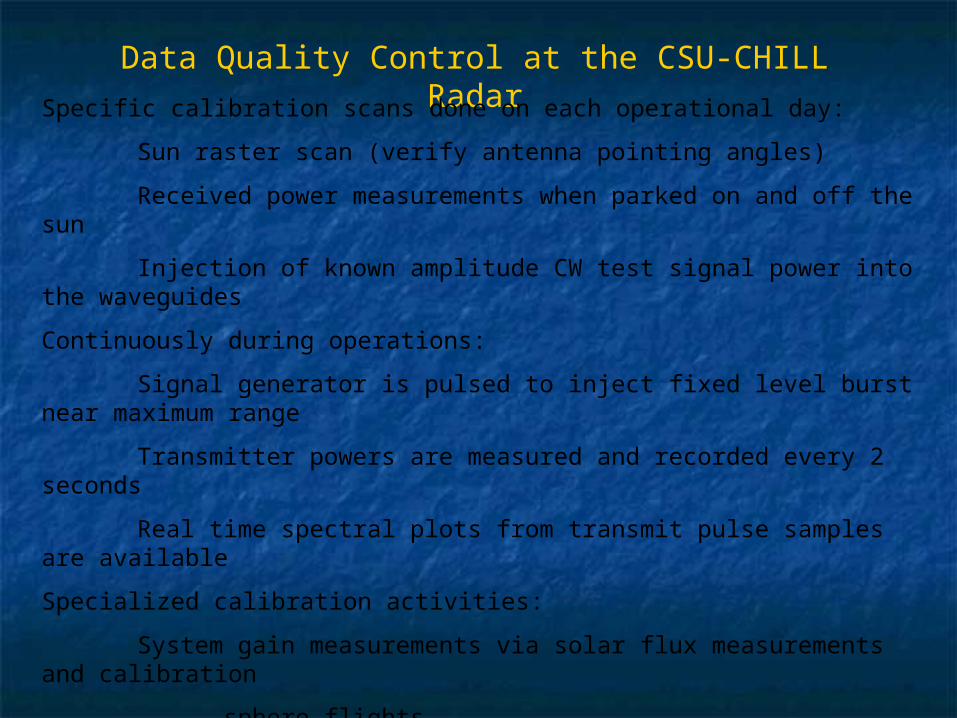
Data Quality Control at the CSU-CHILL Radar
Specific calibration scans done on each operational day:
Sun raster scan (verify antenna pointing angles)
Received power measurements when parked on and off the sun
Injection of known amplitude CW test signal power into the waveguides
Continuously during operations:
Signal generator is pulsed to inject fixed level burst near maximum range
Transmitter powers are measured and recorded every 2 seconds
Real time spectral plots from transmit pulse samples are available
Specialized calibration activities:
System gain measurements via solar flux measurements and calibration
sphere flights
Efforts made to collect vertically pointing scan when rain is falling at
the site (provides a 0 dB ZDR calibration reference)
Analysis of spectral plots from selected received signals (clutter, etc.)
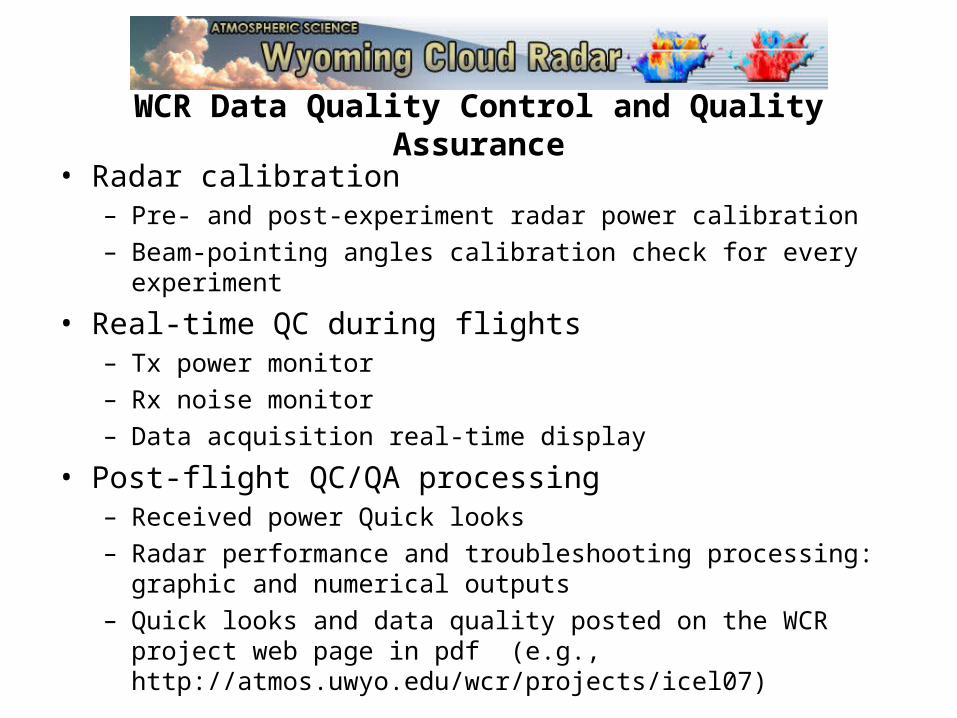
WCR Data Quality Control and Quality Assurance
• Radar calibration– Pre- and post-experiment radar power calibration– Beam-pointing angles calibration check for every experiment
• Real-time QC during flights– Tx power monitor– Rx noise monitor– Data acquisition real-time display
• Post-flight QC/QA processing– Received power Quick looks– Radar performance and troubleshooting processing: graphic and
numerical outputs– Quick looks and data quality posted on the WCR project web page
in pdf (e.g., http://atmos.uwyo.edu/wcr/projects/icel07)
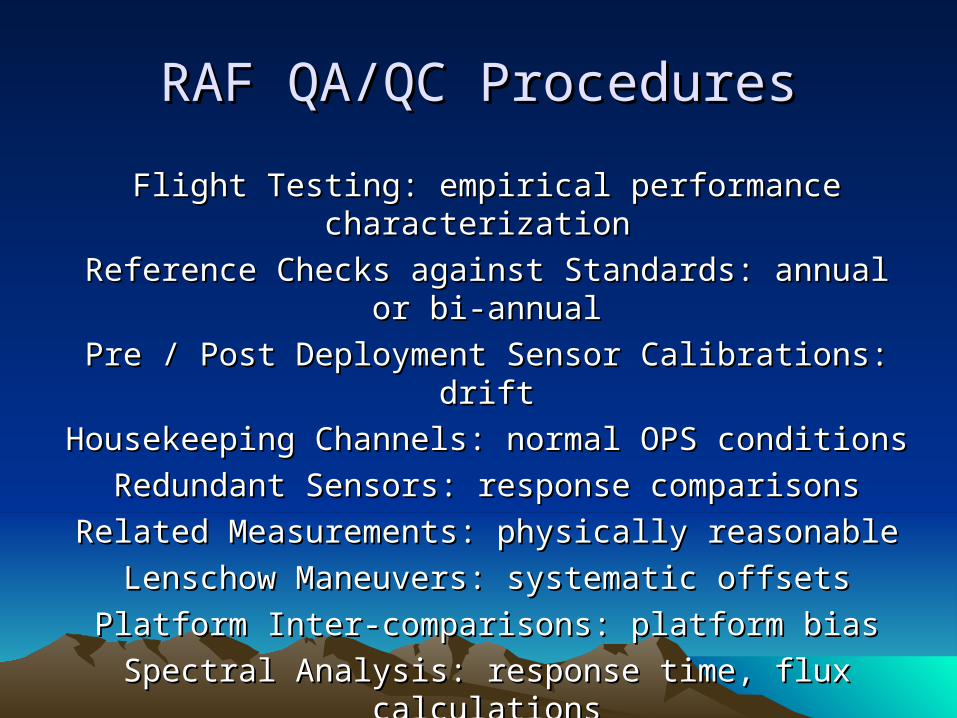
RAF QA/QC ProceduresRAF QA/QC Procedures
Flight Testing: empirical performance characterization Flight Testing: empirical performance characterization
Reference Checks against Standards: annual or bi-annualReference Checks against Standards: annual or bi-annual
Pre / Post Deployment Sensor Calibrations: driftPre / Post Deployment Sensor Calibrations: drift
Housekeeping Channels: normal OPS conditionsHousekeeping Channels: normal OPS conditions
Redundant Sensors: response comparisonsRedundant Sensors: response comparisons
Related Measurements: physically reasonableRelated Measurements: physically reasonable
Lenschow Maneuvers: systematic offsetsLenschow Maneuvers: systematic offsets
Platform Inter-comparisons: platform biasPlatform Inter-comparisons: platform bias
Spectral Analysis: response time, flux calculationsSpectral Analysis: response time, flux calculations
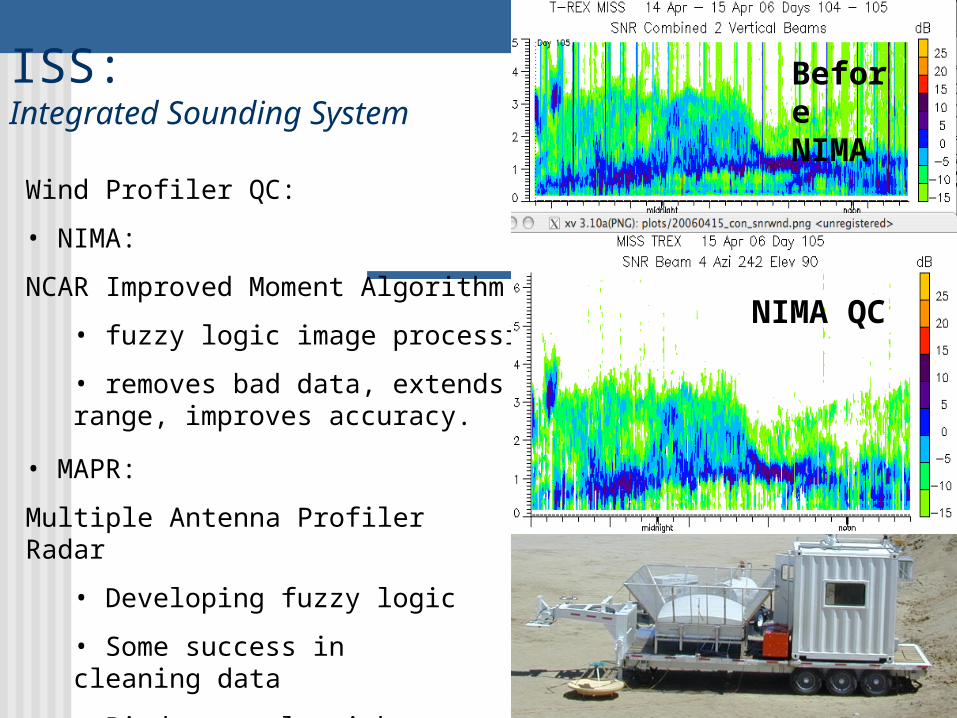
ISS: Integrated Sounding System
MAPR at ISPA
MISS at T-REX
Wind Profiler QC:
• NIMA:
NCAR Improved Moment Algorithm
• fuzzy logic image processing
• removes bad data, extends range, improves accuracy.
NIMA QC
Before NIMA
• MAPR:
Multiple Antenna Profiler Radar
• Developing fuzzy logic
• Some success in cleaning data
• Bird removal tricky
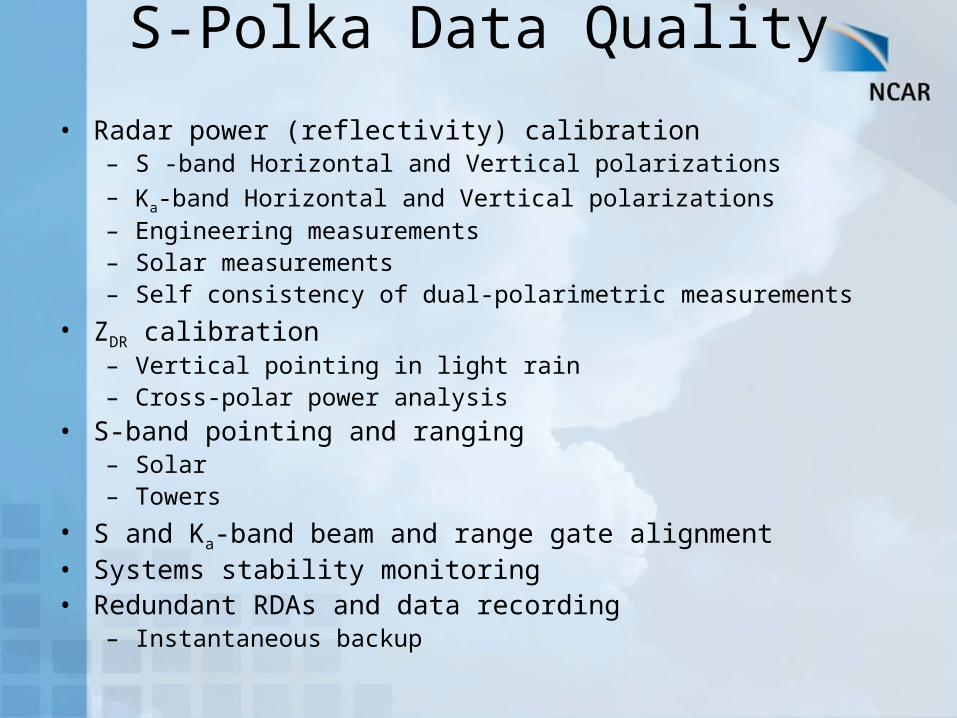
S-Polka Data Quality • Radar power (reflectivity) calibration
– S -band Horizontal and Vertical polarizations– Ka-band Horizontal and Vertical polarizations– Engineering measurements– Solar measurements– Self consistency of dual-polarimetric measurements
• ZDR calibration– Vertical pointing in light rain– Cross-polar power analysis
• S-band pointing and ranging – Solar – Towers
• S and Ka-band beam and range gate alignment• Systems stability monitoring • Redundant RDAs and data recording
– Instantaneous backup
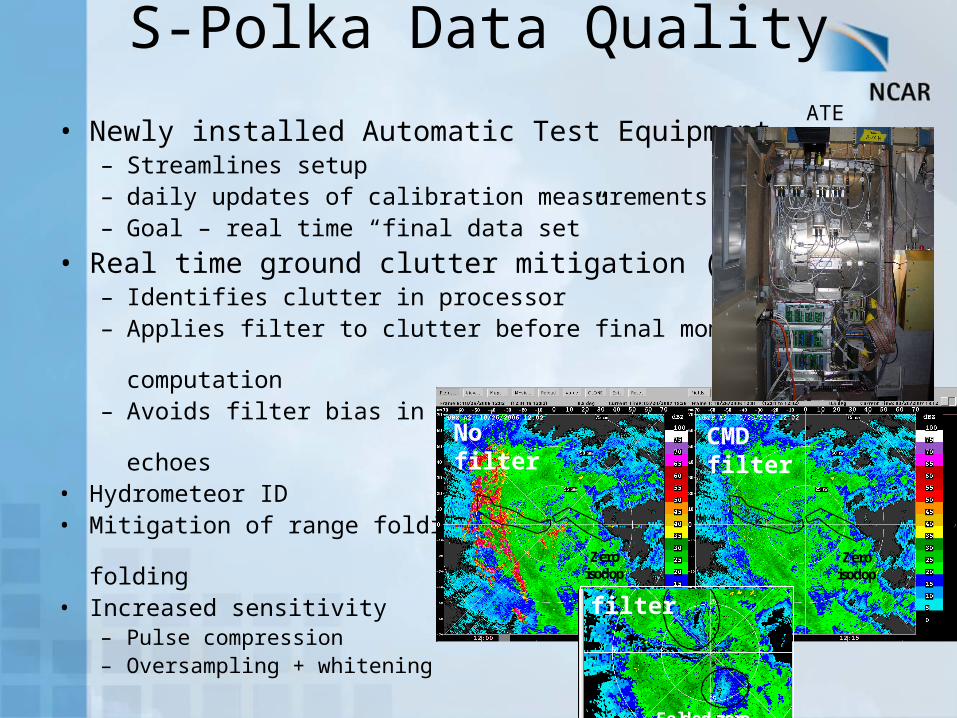
S-Polka Data Quality • Newly installed Automatic Test Equipment
– Streamlines setup– daily updates of calibration measurements– Goal – real time “final data set”
• Real time ground clutter mitigation (CMD)– Identifies clutter in processor – Applies filter to clutter before final moment
computation– Avoids filter bias in
pure weather echoes• Hydrometeor ID• Mitigation of range folding
through phase-coded pulses folding• Increased sensitivity
– Pulse compression– Oversampling + whitening
Zero isodop
Zero isodop
ATE
Folded zero isodop
Folded zero isodop
No filter CMD filter
filter
ASOS
AWOS
ARM
Others (25)
OKMESO
ABLE
SCAN
LAIS
HPCN
WTXMESO
RWIS
MADIS
PAAWS
ICN
GWMD
NMSU
HRLY
HRLY
HRLY
HRLY
HRLY
HRLY
HRLY
MERGE
Gross LimitChecks
HorizontalQC
Visual
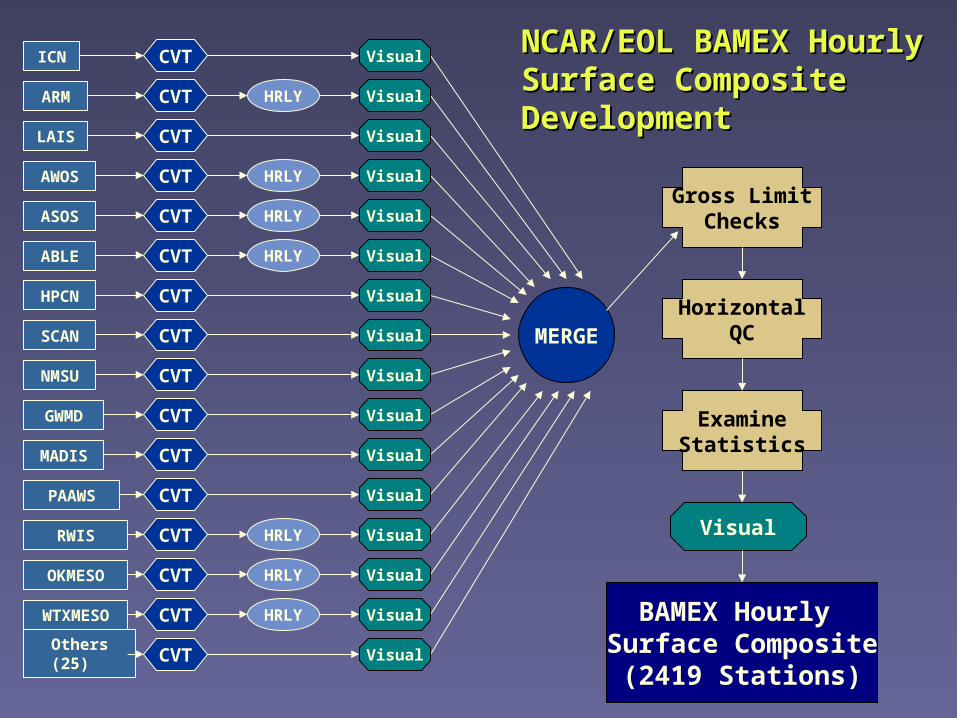
BAMEX Hourly Surface Composite
(2419 Stations)
NCAR/EOL BAMEX NCAR/EOL BAMEX Hourly Surface Hourly Surface Composite Composite DevelopmentDevelopment
ExamineStatistics
Visual
Visual
Visual
Visual
Visual
Visual
Visual
Visual
Visual
Visual
Visual
Visual
Visual
Visual
Visual
Visual
CVT
CVT
CVT
CVT
CVT
CVT
CVT
CVT
CVT
CVT
CVT
CVT
CVT
CVT
CVT
CVT
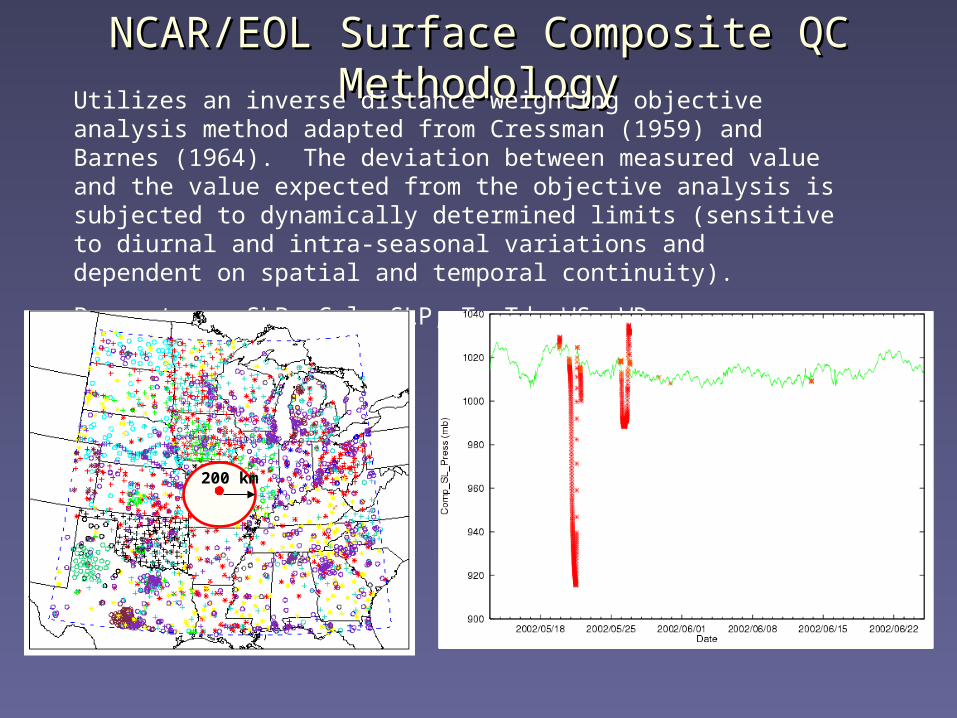
NCAR/EOL Surface Composite QC MethodologyNCAR/EOL Surface Composite QC Methodology
Utilizes an inverse distance weighting objective analysis method adapted from Cressman (1959) and Barnes (1964). The deviation between measured value and the value expected from the objective analysis is subjected to dynamically determined limits (sensitive to diurnal and intra-seasonal variations and dependent on spatial and temporal continuity).
Parameters: SLP, Calc SLP, T, Td, WS, WD
200 km
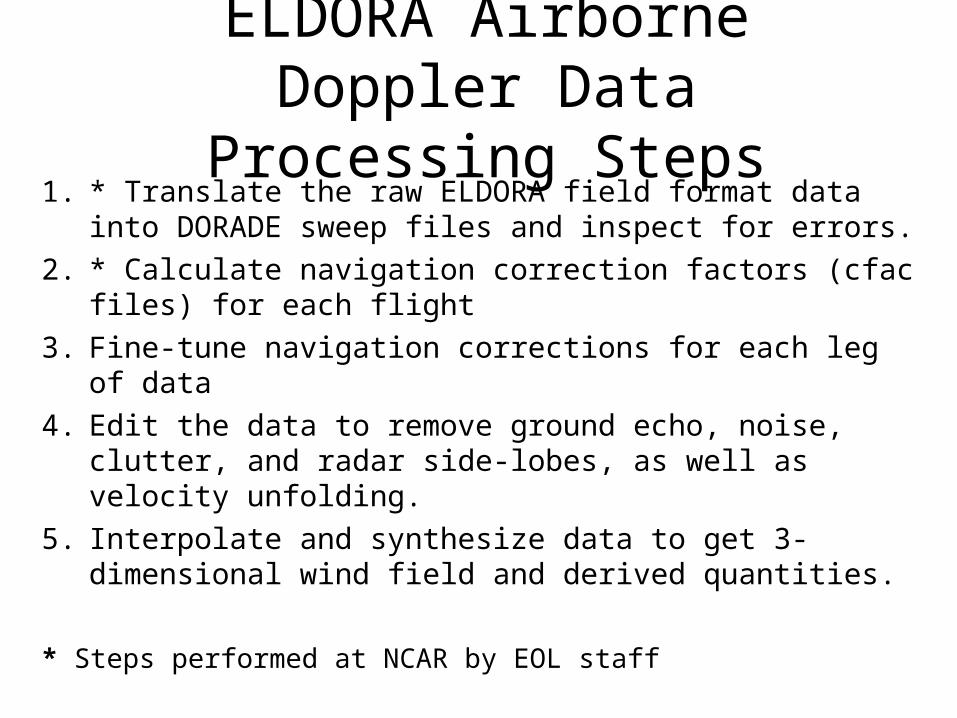
ELDORA Airborne Doppler Data Processing Steps
1. * Translate the raw ELDORA field format data into DORADE sweep files and inspect for errors.
2. * Calculate navigation correction factors (cfac files) for each flight
3. Fine-tune navigation corrections for each leg of data
4. Edit the data to remove ground echo, noise, clutter, and radar side-lobes, as well as velocity unfolding.
5. Interpolate and synthesize data to get 3-dimensional wind field and derived quantities.
* Steps performed at NCAR by EOL staff
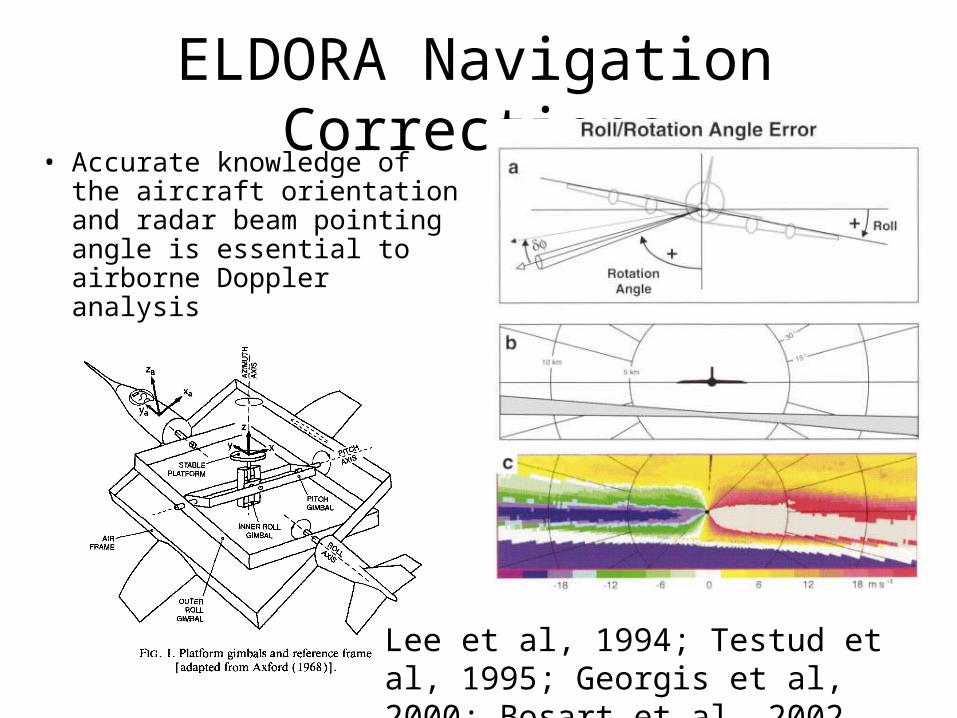
ELDORA Navigation Corrections• Accurate knowledge of the
aircraft orientation and radar beam pointing angle is essential to airborne Doppler analysis
Lee et al, 1994; Testud et al, 1995; Georgis et al, 2000; Bosart et al, 2002
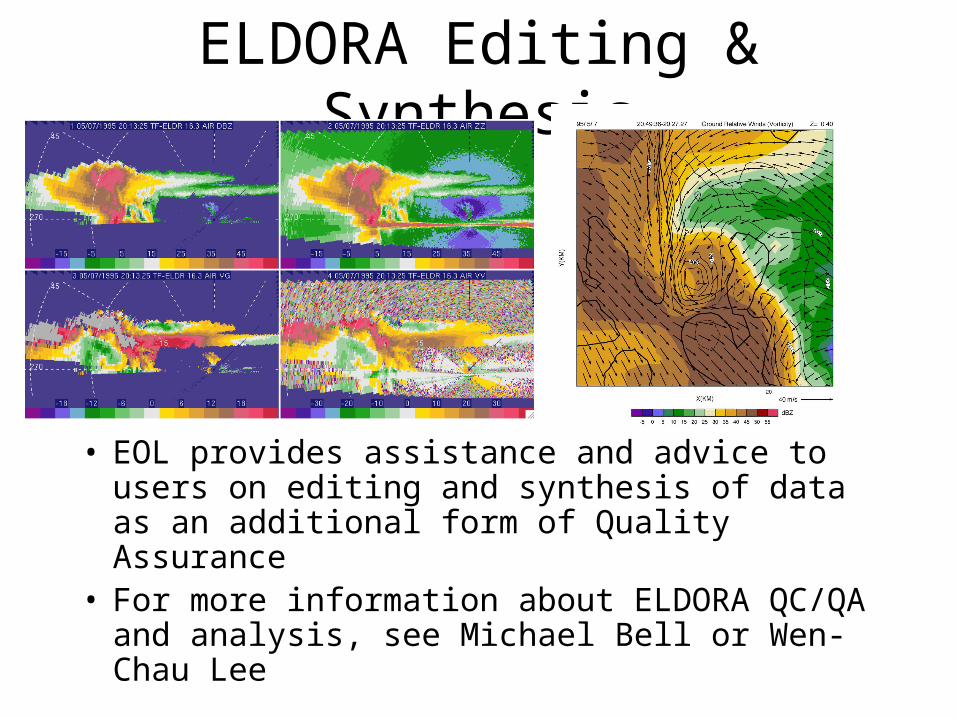
ELDORA Editing & Synthesis
• EOL provides assistance and advice to users on editing and synthesis of data as an additional form of Quality Assurance
• For more information about ELDORA QC/QA and analysis, see Michael Bell or Wen-Chau Lee
REAL Data Highlights• Data from CHATS 15 March 11 June 2007
http://www.eol.ucar.edu/lidar/real/project_chats.html
• Continuous and unattended operation via satellite web link
• Over 2.6 Tbytes of raw data
• One RHI and one PPI quick-look image uploaded to Boulder per min
• Over 100K quick-look images available in real-time
• Over 500K quick-look images available with post project processing• Hourly animation of RHI and PPI data available online
http://www.eol.ucar.edu/platform/REAL/viewer_select.html
• netCDF format data from CHATS and T-REX available on Mass Store
• IDL and Matlab routines to read, grid and display netCDF files
• Contacts – Shane Mayor ([email protected]), Scott Spuler ([email protected]), Bruce Morley ([email protected])
Related Documents


