GROUNDWATER MONITORING INFORMATION QUARTERLY REPORT FOR PERIOD APRIL TO JUNE 2016 BY LOUTH COUNTY COUNCIL TO ENVIRONMENTAL PROTECTION AGENCY FOR WASTE LICENCE REFERENCE: W0033-01 DROGHEDA LANDFILL SITE COLLON ROAD, MELL, DROGHEDA For inspection purposes only. Consent of copyright owner required for any other use. EPA Export 28-09-2016:01:56:04

Welcome message from author
This document is posted to help you gain knowledge. Please leave a comment to let me know what you think about it! Share it to your friends and learn new things together.
Transcript

GROUNDWATER MONITORING
INFORMATION
QUARTERLY REPORT FOR PERIOD APRIL TO JUNE 2016
BY
LOUTH COUNTY COUNCIL
TO
ENVIRONMENTAL PROTECTION AGENCY
FOR
WASTE LICENCE REFERENCE: W0033-01
DROGHEDA LANDFILL SITE
COLLON ROAD, MELL, DROGHEDA
For
insp
ectio
n pur
pose
s only
.
Conse
nt of
copy
right
owne
r req
uired
for a
ny ot
her u
se.
EPA Export 28-09-2016:01:56:04

For
insp
ectio
n pur
pose
s only
.
Conse
nt of
copy
right
owne
r req
uired
for a
ny ot
her u
se.
EPA Export 28-09-2016:01:56:04

Drogheda Landfill Site (W0033-01) Environmental Monitoring (April to June 2016)
Groundwater Monitoring
Ref: IBR0856
Status: Final Date: July 2016
i
Document Control Sheet
Client Louth County Council
Project Title Drogheda Landfill Site
Document Title Environmental Monitoring (April to June 2016) Groundwater Monitoring
Document No. IBR0856/Reports
This Document Comprises
DCS TOC Text No. of Tables No. of Figures No. of
Appendices
1 1 5 2 0 2
Rev. Status Author(s) Reviewed & Approved By Issue Date
1.0 Final
_________________________ Angela McGinley, Senior Scientist
_________________________
Donal Doyle, Director
18/07/16
Copyright RPS Ireland Limited. All rights reserved. The report has been prepared for the exclusive use of our client and unless otherwise agreed in writing by RPS Ireland Limited no other party may use, make use of or rely on the contents of this report. The report has been compiled using the resources agreed with the client and in accordance with the scope of work agreed with the client. No liability is accepted by RPS Ireland Limited for any use of this report, other than the purpose for which it was prepared. RPS Ireland Limited accepts no responsibility for any documents or information supplied to RPS Ireland Limited by others and no legal liability arising from the use by others of opinions or data contained in this report. It is expressly stated that no independent verification of any documents or information supplied by others has been made. RPS Ireland Limited has used reasonable skill, care and diligence in compiling this report and no warranty is provided as to the report’s accuracy. No part of this report may be copied or reproduced, by any means, without the written permission of RPS Ireland Limited.
For
insp
ectio
n pur
pose
s only
.
Conse
nt of
copy
right
owne
r req
uired
for a
ny ot
her u
se.
EPA Export 28-09-2016:01:56:04

Drogheda Landfill Site (W0033-01) Environmental Monitoring (April to June 2016)
Groundwater Monitoring
Ref: IBR0856
Status: Final Date: July 2016
ii
Contents
1 Introduciition .................................................................................................................................... 1 2 Groundwater ................................................................................................................................... 2
2.1 Baseline Data .......................................................................................................................... 3 2.2 Downgradient Data .................................................................................................................. 4
2.2.1 Borehole BH5A ................................................................................................................ 5
2.3 Groundwater Levels ................................................................................................................ 6
Appendices
Appendix A - Drawings
Appendix B – Groundwater Analysis Results and Graphs
For
insp
ectio
n pur
pose
s only
.
Conse
nt of
copy
right
owne
r req
uired
for a
ny ot
her u
se.
EPA Export 28-09-2016:01:56:04

Drogheda Landfill Site (W0033-01) Environmental Monitoring (April to June 2016)
Groundwater Monitoring
Ref: IBR0856
Status: Final Date: July 2016
1
1 Introduction
This report has been prepared to meet the monitoring conditions set out in accordance with
waste licence (Reference W0033-01) for the landfill site at Collon Road, Mell, Drogheda.
The waste licence requires the provision of environmental monitoring results for
groundwater, surface water, leachate and landfill gas as detailed under Condition 3.7 and
Schedules D and F.
The groundwater results contained in this report are for the period April to June 2016 and are
assessed against the European communities (Drinking Water) (No. 2) Regulations 2007
parametric value (DWR), EPA Interim guideline values (IGV) and the SI. No. 9/2010
European Communities Environmental Objectives (Groundwater) Regulations 2010 (GTV).
A table showing the DWR, IGV and GTV from applicable regulations is to be found in
Appendix B.
For
insp
ectio
n pur
pose
s only
.
Conse
nt of
copy
right
owne
r req
uired
for a
ny ot
her u
se.
EPA Export 28-09-2016:01:56:04

Drogheda Landfill Site (W0033-01) Environmental Monitoring (April to June 2016)
Groundwater Monitoring
Ref: IBR0856
Status: Final Date: July 2016
2
2 Groundwater
As required under the waste licence, groundwater monitoring has been undertaken at the
borehole locations as set out in Schedule F of the waste licence. Drawing No. IBR0509/100
(Appendix A) details these locations. Schedule F of the waste licence requires the
monitoring of certain parameters on either a monthly, quarterly or annual basis; the
frequency of the monitoring of groundwater parameters are shown in Table 2.1. BH1A to
BH11A were installed in August 2001.
Table 2.1 Groundwater Parameters Monitoring Frequencies
Monitoring
Frequency
BH1A, BH4A, BH6A, BH9A,
BH10A, BH11A
BH2A, BH3A, BH5A, BH7A,
BH8A
Visual Inspection and Odour, Groundwater Level, Ammoniacal Nitrogen, Chloride, Cadmium, Chromium, Electrical Conductivity, pH, Temperature, Iron, Lead, Manganese, Potassium, Sodium, Barium, Nickel, Nitrate, Nitrite, Phenol, Zinc
Groundwater Level, Ammoniacal Nitrogen, Electrical Conductivity, pH, Temperature
Dissolved Oxygen, TON, TOC, Zinc
Visual Inspection and Odour, Chloride, Dissolved Oxygen, Cadmium, Chromium, Iron, Lead, Manganese, Potassium, Sodium, TON, TOC, Barium, Nickel, Nitrate, Nitrite, Phenol
Annually Boron, Calcium, Copper, Cyanide, Fluoride, Magnesium, Mercury, Sulphate, Total Alkalinity, Total Phosphorous, Residues on Evaporation, Faecal Coliforms, Total Coliforms List I & II substances monitored biannually from BH10, annually from other boreholes
Boron, Calcium, Copper, Cyanide, Fluoride, Magnesium, Mercury, Sulphate, Total Alkalinity, Orthrophosphate, Residues on Evaporation, Zinc, Faecal Coliforms, Total Coliforms
Boreholes BH1A, BH2A BH4A and BH7A1 provide an indication of the upgradient baseline
groundwater characteristics whilst BH3A, BH6A, BH8A, BH9A BH10A and BH11A are
considered as intermediate and downgradient locations. In addition BH10A provides down-
gradient information in a borehole that was penetrated through a karstic void and hence is
potentially an area of relatively high groundwater flows emanating from the site. BH11A
provides information on the nature of the groundwater deep beneath the landfill site. In
general the regional groundwater flow across the site will be towards the River Boyne,
1 BH5A no longer used as an up gradient borehole.
For
insp
ectio
n pur
pose
s only
.
Conse
nt of
copy
right
owne
r req
uired
for a
ny ot
her u
se.
EPA Export 28-09-2016:01:56:04

Drogheda Landfill Site (W0033-01) Environmental Monitoring (April to June 2016)
Groundwater Monitoring
Ref: IBR0856
Status: Final Date: July 2016
3
however due to the karstified nature of the bedrock local groundwater flow directions can be
highly variable during varying climatic conditions. Groundwater monitoring results are
included in Appendix B.
2.1 Baseline Data
Samples were collected on the 29th June 2016. Monitoring was carried out upgradient of the
site in order to obtain an overview of the background level of contaminants present within the
surrounding groundwater. This allows for a baseline to be established from which the actual
impact caused by the site on the area can be assessed.
The pH levels in the upgradient boreholes were within the recommended lower and upper
limits in accordance with the DWR ranging between 6.95 and 7.6.
Electrical Conductivity (EC) (which is dependent on the amount of dissolved materials in
solution with the groundwater) for all upgradient boreholes were within the IGV of
1000µS/cm and the DWR of 2500µS/cm ranging between 412 and 825 µS/cm.
Ammonia concentrations (<0.11 mg/l) were below the IGV (0.15 mg/l) and GTV (0.175 mg/l
N) in all up-gradient boreholes.
Chloride concentrations were below the IGV of 30 mg/l except BH4A (35.2 mg/l), and are
within the GTV overall threshold value range of 24-187.5 mg/l Cl. This result is consistent
with previous monitoring periods.
Phenol concentrations of <0.5 ug/l were recorded in all upgradient boreholes. This is below
the IGV of 0.5µg/l.
Total Organic Carbon (TOC) concentrations in the upgradient boreholes ranged from <1 to
2.16 mg/l. Total Organic Nitrogen (TON) concentrations in the up-gradient boreholes ranged
from <0.7 to 4.1 mg/l. Dissolved oxygen (DO) ranged from 8.05 to 8.52 mg/l.
Potassium exceeded IGV of 5mg/l at BH7A when a concentration of 11.4 mg/l was recorded.
This result is consistent with previous monitoring periods.
Barium, Cadmium, Chromium, Iron, Lead, Magnesium, Manganese, Nickel, Nitrite, Sodium
and Zinc concentrations were all below the IGV, GWR 2010 and DWR for this monitoring
period or the lower limit of detection for the methodology.
For
insp
ectio
n pur
pose
s only
.
Conse
nt of
copy
right
owne
r req
uired
for a
ny ot
her u
se.
EPA Export 28-09-2016:01:56:04
Drogheda Landfill Site (W0033-01) Environmental Monitoring (April to June 2016)
Groundwater Monitoring
Ref: IBR0856
Status: Final Date: July 2016
4
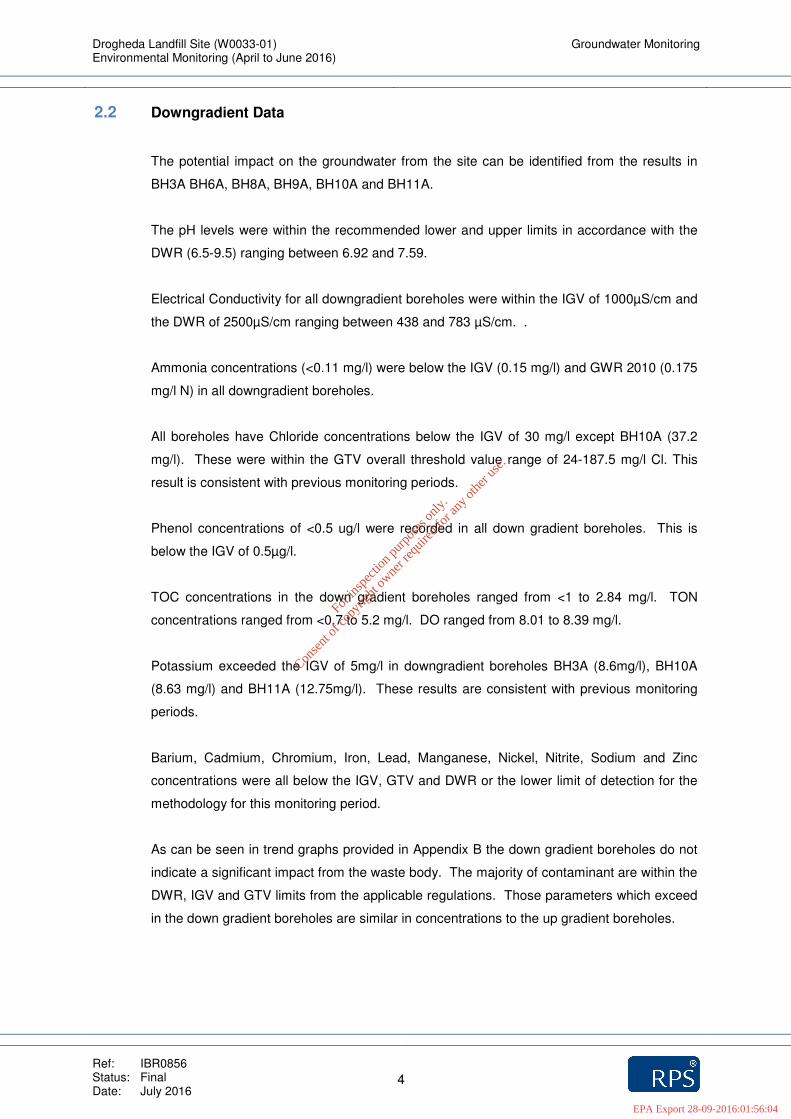
2.2 Downgradient Data
The potential impact on the groundwater from the site can be identified from the results in
BH3A BH6A, BH8A, BH9A, BH10A and BH11A.
The pH levels were within the recommended lower and upper limits in accordance with the
DWR (6.5-9.5) ranging between 6.92 and 7.59.
Electrical Conductivity for all downgradient boreholes were within the IGV of 1000µS/cm and
the DWR of 2500µS/cm ranging between 438 and 783 µS/cm. .
Ammonia concentrations (<0.11 mg/l) were below the IGV (0.15 mg/l) and GWR 2010 (0.175
mg/l N) in all downgradient boreholes.
All boreholes have Chloride concentrations below the IGV of 30 mg/l except BH10A (37.2
mg/l). These were within the GTV overall threshold value range of 24-187.5 mg/l Cl. This
result is consistent with previous monitoring periods.
Phenol concentrations of <0.5 ug/l were recorded in all down gradient boreholes. This is
below the IGV of 0.5µg/l.
TOC concentrations in the down gradient boreholes ranged from <1 to 2.84 mg/l. TON
concentrations ranged from <0.7 to 5.2 mg/l. DO ranged from 8.01 to 8.39 mg/l.
Potassium exceeded the IGV of 5mg/l in downgradient boreholes BH3A (8.6mg/l), BH10A
(8.63 mg/l) and BH11A (12.75mg/l). These results are consistent with previous monitoring
periods.
Barium, Cadmium, Chromium, Iron, Lead, Manganese, Nickel, Nitrite, Sodium and Zinc
concentrations were all below the IGV, GTV and DWR or the lower limit of detection for the
methodology for this monitoring period.
As can be seen in trend graphs provided in Appendix B the down gradient boreholes do not
indicate a significant impact from the waste body. The majority of contaminant are within the
DWR, IGV and GTV limits from the applicable regulations. Those parameters which exceed
in the down gradient boreholes are similar in concentrations to the up gradient boreholes.
For
insp
ectio
n pur
pose
s only
.
Conse
nt of
copy
right
owne
r req
uired
for a
ny ot
her u
se.
EPA Export 28-09-2016:01:56:04

Drogheda Landfill Site (W0033-01) Environmental Monitoring (April to June 2016)
Groundwater Monitoring
Ref: IBR0856
Status: Final Date: July 2016
5
2.2.1 Borehole BH5A
BH5A is no longer considered an upgradient borehole as it appears to be influenced by
leachate emission from the adjacent waste.
The pH level was within the recommended lower and upper limits in accordance with the
DWR (6.5-9.5).
Electrical Conductivity for BH5A was below the IGV of 1000µS/cm. Ammonia concentration
was 0.71 mg/l N above the IGV (0.15mg/l) and GTV (0.175 mg/l N). Ammonia
concentrations in this borehole have varied from less than the limit of detection up to 6.78
mg /l N (last three years) at times.
Chloride concentration of 40.2 mg/l was above the IGV of 30 mg/l but is within the GTV
overall threshold value range of 24-187.5 mg/l Cl. This result is consistent with previous
monitoring periods.
Phenol concentration was <0.5 ug/l. TOC concentration was <1 mg/l and TON 8.6 mg/l.
Dissolved oxygen in borehole BH5A was 7.56 mg/l.
Barium, Cadmium, Chromium, Iron, Lead, Manganese, Nickel, Nitrite, Potassium, Sodium
and Zinc concentrations were all below the IGV, GTV and DWR or the lower limit of
detection for the methodology for this monitoring period.
The Hydrogeological Review report undertaken in 2015 indicated that there is no obvious
downward trend evident from the chemical data within BH5a (i.e. ammonia). The source of
contamination in this borehole is not reducing over time. The report recommended the
replacement of monitoring borehole BH5a should be considered and supervised by a
hydrogeologist to ensure an appropriate well installation has been undertaken and that the
boreholes are not providing a contaminant pathway to the underlying aquifer.
BH5a will be decommissioned as part of the capping works to be completed on site in late
2016.
For
insp
ectio
n pur
pose
s only
.
Conse
nt of
copy
right
owne
r req
uired
for a
ny ot
her u
se.
EPA Export 28-09-2016:01:56:04

Drogheda Landfill Site (W0033-01) Environmental Monitoring (April to June 2016)
Groundwater Monitoring
Ref: IBR0856
Status: Final Date: July 2016
6
2.3 Groundwater Levels
Groundwater levels monitoring is undertaken at eleven locations on site as show on Table
2.2.
Table 2.2 Groundwater Level mOD
Borehole m (OD) TOP
Water Level Depth (m)
Water Level m (OD)
Water Level Depth (m)
Water Level m (OD)
31-Mar-16 29-Jun-16
BH1A 31.953 23.56 8.39 23.81 8.14
BH2A 32.362 22.42 9.94 22.65 9.71
BH3A 33.664 26.20 7.46 26.52 7.14
BH4A 33.57 26.78 6.79 22.81 10.76
BH5A 36.13 29.20 6.93 29.46 6.67
BH6A 35.951 29.05 6.90 29.22 6.73
BH7A 25.172 12.02 13.15 12.22 12.95
BH8A 36.151 29.02 7.13 29.18 6.97
BH9A 34.345 26.13 8.22 26.28 8.07
BH10A 32.776 25.92 6.86 25.99 6.79
BH11A 21.715 15.06 6.66 15.3 6.42
For
insp
ectio
n pur
pose
s only
.
Conse
nt of
copy
right
owne
r req
uired
for a
ny ot
her u
se.
EPA Export 28-09-2016:01:56:04

Drogheda Landfill Site (W0033-01) Environmental Monitoring (April to June 2016)
Groundwater Monitoring
Ref: IBR0856
Status: Final Date: July 2016
Appendix A
Drawings
For
insp
ectio
n pur
pose
s only
.
Conse
nt of
copy
right
owne
r req
uired
for a
ny ot
her u
se.
EPA Export 28-09-2016:01:56:04

For
insp
ectio
n pur
pose
s only
.
Conse
nt of
copy
right
owne
r req
uired
for a
ny ot
her u
se.
EPA Export 28-09-2016:01:56:04

For
insp
ectio
n pur
pose
s only
.
Conse
nt of
copy
right
owne
r req
uired
for a
ny ot
her u
se.
EPA Export 28-09-2016:01:56:04

For
insp
ectio
n pur
pose
s only
.
Conse
nt of
copy
right
owne
r req
uired
for a
ny ot
her u
se.
EPA Export 28-09-2016:01:56:04

Drogheda Landfill Site (W0033-01) Environmental Monitoring (April to June 2016)
Groundwater Monitoring
Ref: IBR0856
Status: Final Date: July 2016
Appendix B
Groundwater Analysis Results and Graphs
For
insp
ectio
n pur
pose
s only
.
Conse
nt of
copy
right
owne
r req
uired
for a
ny ot
her u
se.
EPA Export 28-09-2016:01:56:04

For
insp
ectio
n pur
pose
s only
.
Conse
nt of
copy
right
owne
r req
uired
for a
ny ot
her u
se.
EPA Export 28-09-2016:01:56:04

Date Collected DWR IGV 2010 GW Regs 31-Jan-13 12-Feb-13 26-Mar-13 16-Apr-13 08-May-13 11-Jun-13 23-Jul-13 07-Aug-13 17-Sep-13 08-Oct-13 19-Nov-13 03-Dec-13 18-Feb-14 08-Apr-14 09-Sep-14 18-Nov-14 24-Feb-15 14-Apr-15 08-Sep-15 17-Nov-15 31-Mar-16 29-Jun-16
Alkalinity mg/l CaCO3 344 202 305
Aluminium ug/l 200 200 150 <5 55 <5 <5 113.7 <5 <5 <5 <5 <10 <10 <10.0 <10.0 <10.0 <10.0 <10.0 <10.0 <10.0 <10.0
Ammonia mg/l N 0.23 mg/l N 0.11 mg/l N 0.175 <0.03 <0.03 <0.03 <0.03 <0.03 0.03 <0.03 <0.03 <0.03 0.03 0.035 0.02 0.028 0.047 <0.020 <0.020 <0.020 <0.020 <0.020 0.028 <0.11 <0.11
Antimony ug/l 5 <0.5 <0.5 <0.5 <0.5 <0.5 <0.5 <0.5 <0.5 <0.5 <1 <1 <1.0 <1.0 <1.0 <1.0 <1.0 <1.0 <1.0 <1.0
Arsenic ug/l 10 7.5 0.6 1.24 2.29 1.27 1.12 1.58 2.42 1.95 1.5 2.14 3.24 <1.0 <1.0 <1.0 2.2 1.2 1.1 1.8 1
Barium ug/l 100 84.2 75 26.5 17.8 66.1 33.3 18.4 19.9 19.1 46.8 29.7 80 77 80 42 59 43 29 24 0.08 0.06
Beryllium ug/l <0.5 <0.5 <0.5 <0.5 <0.5 <0.5 <0.5 <0.5 <0.5 <1 <1 <1.0 <1.0 <1.0 <1.0 <1.0 <1.0 <1.0 <1.0
B.O.D. mg/l O2 - -
Boron µg/l 1000 1000 750 11.7 14.3 20 21.3 17 26.8 22.8 21.6 22.4 21.6 27.6 12 12 11 21 16 29 20 21
Cadmium µg/l 5 5 3.75 <0.1 <0.1 0.2 0.2 0.2 0.2 0.2 0.2 0.3 0.1 0.1 0.03 0.03 0.06 0.11 0.1 0.23 0.24 0.4 <0.0006 <0.0006
Calcium mg/l Ca 200 81.1 85.97 131.99 136.73 114.28 135.45 139.73 138.33 147.88 102.77 104.95 85 70 78 110 100 110 140 140
C.O.D. mg/l O2 - -
Chloride mg/l Cl 250 30 13 16 14 27 29 19 25 30 39 39 26 28 13 12 12 23 18 23 27 34 11.4 9.2
Chromium µg/l 50 30 37.5 <0.5 0.9 1.6 1.4 0.7 1.5 0.9 1 1.7 1.3 3.9 1.4 <1.0 <1.0 1.5 1.8 1.3 1.3 1.9 <0.002 <0.002
Cobalt µg/l <0.5 <0.5 <0.5 <0.5 0.6 <0.5 <0.5 <0.5 <0.5 <1 <1 <1.0 <1.0 <1.0 <1.0 <1.0 <1.0 <1.0 <1.0
Coliform Bacteria (No/100 ml ) 0 21 172 109
Conductivity µS/cm @ 25 2500 1000 1875 508 546 422 761 819 636 752 820 849 860 650 704 504 430 477 668 581 670 771 822 377 412
Copper µg/l 2000 30 1500 1.1 1.8 2.2 4.9 6.5 3.9 4.5 3.5 5.1 2 2 2.2 <1.0 1.6 1.5 1.9 3.4 3 4.6
Cyanide mg/l 0.05 10 <0.05 <0.05 <0.05
D.O. % Saturation 51 32 28 30 60 67 92 52 52 45 34 32 8.24 8.51
E_ Coli No/100 ml 0 0 3 2
Fluoride mg/l 0.8 1000 <0.150 0.15 <0.20
Iron µg/l 200 200 <10 101.3 11.4 <10 256.8 21.9 <10 20 <10 <10 <10 <10.0 <10.0 <10.0 <10.0 <10.0 16 <10.0 <10.0 <0.23 <0.23
Lead µg/l 25 10 18.75 <0.5 2.4 <0.5 <0.5 5.2 <0.5 <0.5 <0.5 <0.5 <1 <1 <1.0 <1.0 <1.0 <1.0 <1.0 <1.0 <1.0 <1.0 <0.006 <0.006
Magnesium mg/l Mg 50 8.92 9.17 10.32 9.08 10.47 10.27 9.82 9.14 9.27 9.99 9.41 9.3 10 10 9.4 9.8 9.5 9.7 9.3
Manganese µg/l 50 50 4.6 32.2 3.2 1.2 208.4 3 1.5 1.9 1.5 <5 <5 <5.0 <5.0 <5.0 <5.0 7 5 <5.0 14 0.008 0.01
Mercury µg/l 1 1 0.75 nm nm <0.05 nm nm nm nm nm nm nm nm <0.050 <0.020
Molybdenum µg/l 35 <0.5 <0.5 0.5 <0.5 <0.5 1.4 <0.5 <0.5 <0.5 <1 <1 <1.0 <1.0 <1.0 5 <1.0 <1.0 <1.0 <1.0
Nickel µg/l 20 20 15 <0.5 1.8 5.1 7.4 5.8 2.8 4.6 4.3 6.3 1.4 1.9 <1.0 <1.0 <1.0 1.1 1.3 3.3 3.1 5.2 <0.003 <0.003
Nitrate mg/l N <0.7 <0.7
Nitrite mg/l N 0.5 0.1 0.375 <0.002 <0.002 <0.002 <0.002 <0.002 <0.002 <0.002 <0.002 <0.002 <0.002 <0.004 <0.004 <0.004 <0.004 <0.004 <0.004 <0.004 <0.004 <0.004 <0.004 <0.08 <0.08
o-Phosphate mg/l P 30 0.07 <0.010 0.048
pH 6.5 - 9.5 6.1 7.4 7.4 7.1 7.2 7.3 7.2 7.4 7.1 7.1 7.3 7.1 7.2 7.1 7.5 7.1 7.1 6.7 7 7.2 6.82 6.95
Phenol mg/l 0.0005 <0.002 <0.002 <0.002 <0.002 <0.002 <0.002 <0.002 <0.002 <0.002 <0.002 <0.002 <0.002 <0.002 <0.002 <0.002 <0.002 <0.002 <0.002 <0.002 <0.025 <0.50 <0.50
Potassium mg/l 5 1.14 1.81 5.68 6.41 3.4 5.31 7 7.72 3.84 4.47 1.3 0.98 0.74 3.4 2.6 4.1 5 6.9 0.44 0.48
Sampling Depth m 17.6 15.1 15.7 19.9 21.4 20.9 22.8 23.2 24.1 22.6 22.9 22 18 19.9 22.1 21.6 19.2 20.8 23.6 23.9
Selenium µg/l 10 0.6 <0.5 <0.5 <0.5 <0.5 0.6 <0.5 <0.5 <0.5 <1 <1 <1.0 <1.0 <1.0 <1.0 <1.0 <1.0 <1.0 <1.0
Silver µg/l nm nm nm
Sodium mg/l 200 150 150 8.98 10.52 16.14 16.21 12.88 15.21 16.53 17.7 18.69 15.72 15.19 8.8 8.7 8.3 13 11 14 15 18 7.16 8.26
Strontium µg/l 189.6 196.78 209.45 200.11 220.4 210.61 218.41 199.58 212.03 189.86 189.2 190 190 200 200 200 200 200 200
Sulphate mg/l SO4 250 200 187.5 22.4 6.8 18 - -
Suspended Solids mg/l - -
Temp °C 9.1 8.3 7.2 10.7 11.5 11.3 21.3 14.2 10.7 13.4 8.2 8.1 9 13.7 12.3 12.9 9.1 10.7 11.1 10.1 15.3 14.6
Thallium µg/l <0.1 <0.1 0.3 0.34 0.2 0.27 0.33 0.4 0.45 <1 <1 <1.0 <1.0 <1.0 <1.0 <1.0 <1.0 <1.0 <1.0
Time sampled 11:00 13:25 13:50 10:20 13:20 12:55 0.4513889 0.5486111 0.5625 10:50 10:35 13:35 12:55 10:45 13:00 10:20 10:40 13:10 14:35 13:55
Tin (µg/l ) µg/l nm nm nm
T.O.C. mg/l NAC 62.8 <1.5 <1.5 2.1 <1.5 1.8 3 1.9 1.7 2.5 1.6 <1.5 <1 1.6
T.O.N mg/l N NAC 0.33 0.99 0.45 2.82 2.9 1.47 2.27 3.11 2.73 2.83 1.5 2.2 <0.20 <0.20 <0.20 1.9 1.1 2 2.9 3.5 <0.7 <0.7
Total S Solids mg/l
Uranium µg/l 3.79 9.14 20.52 14.34 9.42 15.06 21.38 14.94 12.51 17.88 26.88 2.3 <1.0 <1.0 17 8.8 11 14 9
Vanadium µg/l 1.06 1.91 2.8 1.67 1.75 2.5 3.48 2.78 1.83 3.5 5.55 <1.0 <1.0 <1.0 3.3 1.6 1.7 2.5 <1.0
Zinc µg/l 100 20.5 25 20.4 20.5 23.9 23.6 13.3 11.4 13.6 15.2 15.1 13 12 8.6 11 20 20 12 20 <0.018 <0.018
Water Level m OD 31.953 14.353 16.853 16.253 12.053 10.553 11.053 9.153 7.853 9.053 9.953 13.953 12.053 9.853 10.353 12.753 11.153 8.353 8.053
D.O. is measured in mg/l instead of % since March 2016 due to a change in laboratory for laboratory analysis.
BH1A
Drogheda Landfill Site Groundwater Quality
Monitoring Point:
For
insp
ectio
n pur
pose
s only
.
Conse
nt of
copy
right
owne
r req
uired
for a
ny ot
her u
se.
EPA Export 28-09-2016:01:56:04

Date Collected DWR IGV 2010 GW Regs 31-Jan-13 12-Feb-13 26-Mar-13 16-Apr-13 08-May-13 11-Jun-13 23-Jul-13 07-Aug-13 17-Sep-13 08-Oct-13 19-Nov-13 03-Dec-13 18-Feb-14 08-Apr-14 09-Sep-14 18-Nov-14 24-Feb-15 14-Apr-15 08-Sep-15 17-Nov-15 31-Mar-16 29-Jun-16
Alkalinity mg/l CaCO3 348 353 308
Aluminium ug/l 200 200 150 <5 5.5 5.1 <5 <10.0 <10.0 <10.0 <10.0 <10.0 <10.0 12 <10.0
Ammonia mg/l N 0.23 mg/l N 0.11 mg/l N 0.175 <0.03 <0.03 <0.03 <0.03 <0.03 <0.03 <0.03 <0.03 <0.03 <0.03 <0.020 <0.020 <0.020 0.021 <0.020 <0.020 <0.020 <0.020 <0.020 <0.020 <0.11 <0.11
Antimony ug/l 5 <0.5 <0.5 <0.5 <0.5 <1.0 <1.0 <1.0 <1.0 <1.0 <1.0 <1.0 <1.0
Arsenic ug/l 10 7.5 0.51 0.6 <0.5 <0.5 <1.0 <1.0 <1.0 <1.0 <1.0 <1.0 <1.0 <1.0
Barium ug/l 100 69.8 63 64.2 62.9 56 59 57 55 56 57 57 60 0.053 0.047
Beryllium ug/l <0.5 <0.5 <0.5 <0.5 <1.0 <1.0 <1.0 <1.0 <1.0 <1.0 <1.0 <1.0
B.O.D. mg/l O2 - -
Boron µg/l 1000 1000 750 19.3 28.5 30.3 33.1 58 36 32 25 26 29 22 23
Cadmium µg/l 5 5 3.75 <0.1 <0.1 <0.1 <0.1 0.03 0.06 0.03 0.06 0.04 0.05 0.03 0.03 <0.0006 <0.0006
Calcium mg/l Ca 200 118.55 124.92 128.86 128.36 140 130 120 110 120 110 110 110
C.O.D. mg/l O2 - -
Chloride mg/l Cl 250 30 12 14 16 16 20 19 18 18 18 18 16 18 16 15.1
Chromium µg/l 50 30 37.5 <0.5 1.5 1.4 1.4 2.2 <1.0 <1.0 1 2 1.1 1.2 1.5 <0.002 <0.002
Cobalt µg/l <0.5 <0.5 <0.5 <0.5 <1.0 <1.0 <1.0 <1.0 <1.0 <1.0 <1.0 <1.0
Coliform Bacteria (No/100 ml ) 0 10 365 79
Conductivity µS/cm @ 25 2500 1000 1875 675 694 691 707 724 722 719 726 730 728 738 735 719 724 703 664 639 645 636 668 649 645
Copper µg/l 2000 30 1500 2.8 5.3 1.6 1.8 <1.0 2.1 2 2.7 3 3.2 3.5 2.4
Cyanide mg/l 0.05 10 <0.05 <0.05 <0.05
D.O. % Saturation 39 47 36 98 51 49 56 71 55 53 62 44 8.11 8.15
E_ Coli No/100 ml 0 0 3 0
Fluoride mg/l 0.8 1000 <0.150 0.16 <0.20
Iron µg/l 200 200 <10 20 <10 <10 <10.0 <10.0 <10.0 <10.0 <10.0 <10.0 11 28 <0.23 <0.23
Lead µg/l 25 10 18.75 <0.5 <0.5 <0.5 <0.5 <1.0 <1.0 <1.0 <1.0 <1.0 <1.0 <1.0 <1.0 <0.006 <0.006
Magnesium mg/l Mg 50 10.03 11.3 11.42 11.27 9.4 12 12 10 10 10 9.2 10
Manganese µg/l 50 50 2.3 2.6 3.2 <1 <5.0 <5.0 <5.0 <5.0 <5.0 <5.0 15 <5.0 0.015 0.012
Mercury µg/l 1 1 0.75 nm <0.05 nm nm <0.050 <0.020
Molybdenum µg/l 35 <0.5 <0.5 <0.5 <0.5 <1.0 <1.0 <1.0 <1.0 2 <1.0 <1.0 <1.0
Nickel µg/l 20 20 15 <0.5 2.9 <0.5 1 <1.0 <1.0 <1.0 <1.0 <1.0 <1.0 <1.0 <1.0 0.005 <0.003
Nitrate mg/l N 1.5 <0.7
Nitrite mg/l N 0.5 0.1 0.375 <0.002 <0.002 <0.002 <0.002 <0.004 <0.004 <0.004 <0.004 <0.004 <0.004 <0.004 <0.004 <0.08 <0.08
o-Phosphate mg/l P 30 0.04 0.033 0.048
pH 6.5 - 9.5 7 7.2 7.1 7.1 7.1 7.1 7.1 7.2 7.2 7.1 7.2 7.2 7.2 7.2 7.4 7.1 7.1 7.1 7.2 7.2 7.12
Phenol mg/l 0.0005 <0.002 <0.002 <0.002 <0.002 <0.002 <0.002 <0.002 <0.002 <0.002 <0.002 <0.002 <0.025 <0.50 <0.50
Potassium mg/l 5 2.51 3.06 3.23 3.44 24 3.9 3.1 2.6 2.7 2.7 2.9 2.9 2.36 1.96
Sampling Depth m 17.8 15.9 15.6 19.4 21 21.7 22.7 24.5 25 14.2 14.9 22.4 17 21.1 22 21.7 19.9 21.5 22.4 23
Selenium µg/l 10 <0.5 0.7 0.7 <0.5 <1.0 <1.0 <1.0 <1.0 <1.0 <1.0 <1.0 <1.0
Silver µg/l nm nm
Sodium mg/l 200 150 150 8.92 10.64 11.19 11.83 22 14 13 9.8 10 10 9.3 11 8.64 8.68
Strontium µg/l 199.05 213.84 219.43 228.56 200 210 210 190 190 190 180 200
Sulphate mg/l SO4 250 200 187.5 15.8 20.7 16 - -
Suspended Solids mg/l - -
Temp °C 9.4 7.4 6 11 11.5 11.3 21.4 14.5 10.5 15.2 9.2 nm 8.6 10.7 10.9 12.4 6.9 10.9 12.1 10.1 15.5 13.5
Thallium µg/l <0.1 0.11 <0.1 0.11 <1.0 <1.0 <1.0 <1.0 <1.0 <1.0 <1.0 <1.0
Time sampled 11:25 13:10 13:25 10:55 13:00 12:40 11:15 12:50 13:05 11:20 10:50 13:15 12:40 11:15 12:40 10:50 10:55 12:40 14:15 13:35
Tin (µg/l ) µg/l nm nm
T.O.C. mg/l NAC 85.9 3.4 3.9 4.1 3.5 3.6 4.6 5.8 5.4 5.2 6.2 4 2.02 2.16
T.O.N mg/l N NAC 0.73 1.74 2 2.13 2.3 2.1 1.9 1.2 1.4 1.5 1.9 2 1.5 0.9
Total S Solids mg/l
Uranium µg/l 0.94 1.06 0.99 1.07 <1.0 1 1 <1.0 <1.0 <1.0 <1.0 <1.0
Vanadium µg/l 0.75 <0.5 0.55 0.75 <1.0 <1.0 <1.0 <1.0 <1.0 <1.0 <1.0 <1.0
Zinc µg/l 100 9.6 7.4 6.4 7.6 5.2 8.1 4.7 5.7 9.6 10 5.9 11 <0.018 <0.018
Water Level m OD 32.362 14.562 16.462 16.762 12.962 11.362 10.662 9.662 7.362 17.462 15.362 11.262 10.362 10.662 12.462 10.862 9.962 9.362
D.O. is measured in mg/l instead of % since March 2016 due to a change in laboratory for laboratory analysis.
Monitoring Point:
Drogheda Landfill Site Groundwater Quality
BH2A
For
insp
ectio
n pur
pose
s only
.
Conse
nt of
copy
right
owne
r req
uired
for a
ny ot
her u
se.
EPA Export 28-09-2016:01:56:04

Date Collected DWR IGV 2010 GW Regs 31-Jan-13 12-Feb-13 26-Mar-13 16-Apr-13 08-May-13 11-Jun-13 23-Jul-13 07-Aug-13 17-Sep-13 08-Oct-13 19-Nov-13 03-Dec-13 18-Feb-14 08-Apr-14 09-Sep-14 18-Nov-14 24-Feb-15 14-Apr-15 08-Sep-15 17-Nov-15 31-Mar-16 29-Jun-16
Alkalinity mg/l CaCO3 272 254 285
Aluminium ug/l 200 200 150 <5 <5 <5 5.2 <10.0 <10.0 <10.0 <10.0 <10.0 <10.0 <10.0 <10.0
Ammonia mg/l N 0.23 mg/l N 0.11 mg/l N 0.175 <0.03 0.03 <0.03 0.03 <0.03 <0.03 <0.03 <0.03 0.23 0.04 0.9 0.34 <0.020 0.058 <0.020 0.038 <0.020 <0.020 0.094 0.025 <0.11 <0.11
Antimony ug/l 5 <0.5 <0.5 <0.5 <0.5 <1.0 <1.0 <1.0 <1.0 <1.0 <1.0 <1.0 <1.0
Arsenic ug/l 10 7.5 <0.5 <0.5 <0.5 <0.5 <1.0 <1.0 <1.0 <1.0 <1.0 <1.0 <1.0 <1.0
Barium ug/l 100 56.6 54.5 54.3 56.5 63 53 50 44 47 52 48 54 0.047 0.041
Beryllium ug/l <0.5 <0.5 <0.5 <0.5 <1.0 <1.0 <1.0 <1.0 <1.0 <1.0 <1.0 <1.0
B.O.D. mg/l O2 - -
Boron µg/l 1000 1000 750 52.7 56.4 61.6 59.4 31 66 66 58 62 64 60 60
Cadmium µg/l 5 5 3.75 <0.1 <0.1 <0.1 <0.1 0.04 0.03 0.06 0.05 0.04 0.05 0.04 0.03 <0.0006 <0.0006
Calcium mg/l Ca 200 128.73 135.93 139.73 134.28 130 140 140 120 130 140 130 130
C.O.D. mg/l O2 - -
Chloride mg/l Cl 250 30 54 62 56 51 77 67 63 51 55 75 51 41 39.7 28.8
Chromium µg/l 50 30 37.5 0.6 1.7 2 2 2.1 1.1 <1.0 1.4 2.1 1.5 1.7 1.7 <0.002 <0.002
Cobalt µg/l <0.5 <0.5 <0.5 <0.5 <1.0 <1.0 <1.0 <1.0 <1.0 <1.0 <1.0 <1.0
Coliform Bacteria (No/100 ml ) 0 14 >2420 3
Conductivity µS/cm @ 25 2500 1000 1875 849 822 840 883 895 889 879 862 864 874 903 901 922 898 882 812 812 904 842 794 834 783
Copper µg/l 2000 30 1500 1.1 0.8 <0.5 1.2 4.2 <1.0 2.1 <1.0 <1.0 1.6 <1.0 <1.0
Cyanide mg/l 0.05 10 <0.05 <0.05 <0.05
D.O. % Saturation 56 61 50 62 50 47 52 60 nm 59 68 74 8.03 8.1
E_ Coli No/100 ml 0 0 0 0
Fluoride mg/l 0.8 1000 <0.150 0.16 <0.20
Iron µg/l 200 200 17.4 <10 <10 11.9 <10.0 <10.0 <10.0 <10.0 <10.0 <10.0 <10.0 <10.0 <0.23 <0.23
Lead µg/l 25 10 18.75 <0.5 <0.5 <0.5 <0.5 <1.0 <1.0 <1.0 <1.0 <1.0 <1.0 <1.0 <1.0 <0.006 <0.006
Magnesium mg/l Mg 50 8.18 8.89 9.09 9.03 12 9.5 9.6 7.9 8.6 9.3 8 7.6
Manganese µg/l 50 50 7.5 6.5 3.1 4.6 <5.0 <5.0 7.4 11 <5.0 <5.0 6.5 27 0.016 0.016
Mercury µg/l 1 1 0.75 nm <0.05 nm nm <0.050 <0.020
Molybdenum µg/l 35 <0.5 <0.5 <0.5 <0.5 <1.0 <1.0 <1.0 <1.0 <1.0 <1.0 <1.0 <1.0
Nickel µg/l 20 20 15 <0.5 0.8 <0.5 1 1.2 <1.0 <1.0 <1.0 <1.0 <1.0 <1.0 <1.0 <0.003 <0.003
Nitrate mg/l N 6.5 5.2
Nitrite mg/l N 0.5 0.1 0.375 0.004 0.004 0.002 0.012 <0.004 0.006 0.005 0.043 <0.004 0.005 0.025 <0.004 <0.08 <0.08
o-Phosphate mg/l P 30 0.02 0.039 0.031
pH 6.5 - 9.5 7.2 7.2 7.1 7.2 7.2 7.2 7.1 7.2 7.1 7.1 7.1 7.1 7.1 7.2 7.2 7.1 7.2 7.1 7.2 7.2 6.9 6.92
Phenol mg/l 0.0005 <0.002 <0.002 <0.002 <0.002 <0.002 <0.002 <0.002 <0.002 <0.002 <0.002 <0.002 <0.025 <0.50 <0.50
Potassium mg/l 5 21.35 22.02 24.58 25.5 3.4 27 22 18 19 20 15 13 11.4 8.6
Sampling Depth m 23 23.8 26.1 24.9 25 26.4 26.8 26.3 27 13 13.2 27.8 26.1 26.8 25.8 24.9 26 25.7 26.1 26.5
Selenium µg/l 10 0.9 0.6 0.7 0.7 <1.0 <1.0 <1.0 <1.0 <1.0 <1.0 <1.0 <1.0
Silver µg/l nm nm
Sodium mg/l 200 150 150 17.77 20.7 20.88 20.53 13 23 23 19 20 30 20 20 17.7 15.6
Strontium µg/l 177.3 189.75 195 204.77 220 180 190 170 180 190 170 170
Sulphate mg/l SO4 250 200 187.5 75.4 74.7 66 - -
Suspended Solids mg/l - -
Temp °C 9.4 9.5 9.2 11.1 11.1 11 13.8 13 10.7 11.8 10.4 8.6 10.3 10.7 11.8 10.9 10 10.9 11.3 10.3 16.1 14.2
Thallium µg/l <0.1 <0.1 <0.1 <0.1 <1.0 <1.0 <1.0 <1.0 <1.0 <1.0 <1.0 <1.0
Time sampled 13:05 10:15 10:25 13:45 10:35 10:10 10:30 10:00 14:30 10:40 11:35 nt 09:35 13:40 14:40 10:30 13:15 10:30 10:15 10:00
Tin (µg/l ) µg/l nm nm
T.O.C. mg/l NAC 69.6 2.1 2.6 3.3 2.1 2.3 4.3 2.9 2.7 2.8 2.6 2.4 <1 <1
T.O.N mg/l N NAC 3.76 4.03 4.52 4.16 6.7 6.1 6.9 6.7 6.6 6.5 6.2 5.6 6.5 5.2
Total S Solids mg/l
Uranium µg/l 0.66 0.69 0.71 0.73 1 <1.0 <1.0 <1.0 <1.0 <1.0 <1.0 <1.0
Vanadium µg/l 0.56 <0.5 <0.5 0.59 <1.0 <1.0 <1.0 <1.0 <1.0 <1.0 <1.0 <1.0
Zinc µg/l 100 17.1 19.5 5.9 25 8.3 22 16 24 21 18 16 20 <0.018 <0.018
Water Level m OD 33.664 10.664 9.864 7.564 8.764 8.664 7.264 6.864 6.664 20.464 5.864 7.564 6.864 7.864 8.764 7.664 7.964 7.564 7.164
D.O. is measured in mg/l instead of % since March 2016 due to a change in laboratory for laboratory analysis.
Monitoring Point:
Drogheda Landfill Site Groundwater Quality
BH3A
For
insp
ectio
n pur
pose
s only
.
Conse
nt of
copy
right
owne
r req
uired
for a
ny ot
her u
se.
EPA Export 28-09-2016:01:56:04

Date Collected DWR IGV 2010 GW Regs 31-Jan-13 12-Feb-13 26-Mar-13 16-Apr-13 08-May-13 11-Jun-13 23-Jul-13 07-Aug-13 17-Sep-13 08-Oct-13 19-Nov-13 03-Dec-13 18-Feb-14 08-Apr-14 09-Sep-14 18-Nov-14 24-Feb-15 14-Apr-15 08-Sep-15 17-Nov-15 31-Mar-16 29-Jun-16
Alkalinity mg/l CaCO3 376 387
Aluminium ug/l 200 200 150 11.3 843.6 <5 <5 <10.0 <10.0 <10.0 <10.0
Ammonia mg/l N 0.23 mg/l N 0.11 mg/l N 0.175 <0.03 <0.03 <0.03 <0.03 <0.03 <0.020 <0.020 <0.020 <0.020 <0.11 <0.11
Antimony ug/l 5 <0.5 <0.5 <0.5 <0.5 <1.0 <1.0 <1.0 <1.0
Arsenic ug/l 10 7.5 <0.5 1.5 <0.5 <0.5 <1.0 <1.0 <1.0 <1.0
Barium ug/l 100 12.8 26.6 10 9.5 12 10 11 12 0.012 0.013
Beryllium ug/l <0.5 <0.5 <0.5 <0.5 <1.0 <1.0 <1.0 <1.0
B.O.D. mg/l O2 - -
Boron µg/l 1000 1000 750 31.7 31.7 27.3 29.5 29 34 32 40
Cadmium µg/l 5 5 3.75 <0.1 0.2 <0.1 <0.1 <0.020 <0.020 0.02 0.02 <0.0006 <0.0006
Calcium mg/l Ca 200 156.38 157.46 149.85 150.84 160 150 160 150
C.O.D. mg/l O2 - -
Chloride mg/l Cl 250 30 43 42 42 42 42 41 40 41 41 37.8 35.2
Chromium µg/l 50 30 37.5 <0.5 2.3 1.2 1.1 1.7 <1.0 1.8 1.1 <0.002 <0.002
Cobalt µg/l <0.5 1.3 <0.5 <0.5 <1.0 <1.0 <1.0 <1.0
Coliform Bacteria (No/100 ml ) 0 40 5
Conductivity µS/cm @ 25 2500 1000 1875 919 904 901 911 921 882 888 865 866 933 825
Copper µg/l 2000 30 1500 1 3.1 2.3 0.8 <1.0 <1.0 <1.0 <1.0
Cyanide mg/l 0.05 10 <0.05 <0.05
D.O. % Saturation 22 83 87 70 75 72 8.36 8.05
E_ Coli No/100 ml 0 0 0
Fluoride mg/l 0.8 1000 <0.150 <0.20
Iron µg/l 200 200 74.1 1451.2 24.6 <10 <10.0 13 17 47 <0.23 <0.23
Lead µg/l 25 10 18.75 <0.5 1 <0.5 <0.5 <1.0 <1.0 <1.0 <1.0 <0.006 <0.006
Magnesium mg/l Mg 50 13.05 13.24 13.24 12.89 13 13 14 14
Manganese µg/l 50 50 <1 202.4 <1 2.4 <5.0 <5.0 <5.0 <5.0 0.046 0.036
Mercury µg/l 1 1 0.75 nm nm <0.05 nm <0.020
Molybdenum µg/l 35 <0.5 <0.5 <0.5 <0.5 <1.0 <1.0 <1.0 <1.0
Nickel µg/l 20 20 15 <0.5 3.7 13.3 1.1 <1.0 <1.0 <1.0 <1.0 <0.003 <0.003
Nitrate mg/l N 3.7 3.5
Nitrite mg/l N 0.5 0.1 0.375 <0.002 <0.002 <0.002 <0.002 <0.002 <0.004 <0.004 <0.004 <0.004 <0.08 <0.08
o-Phosphate mg/l P 30 0.02 <0.010
pH 6.5 - 9.5 6.4 7 7.1 7.2 7.3 7.2 7.3 7.2 7 7.15 7.2
Phenol mg/l 0.0005 <0.002 <0.002 <0.002 <0.002 <0.002 <0.002 nm <0.002 <0.002 <0.50 <0.50
Potassium mg/l 5 1.31 1.31 1.39 1.39 1.7 1.2 1.3 1.3 1.14 2.22
Sampling Depth m 16.9 17 18 20.2 22 18.5 16.3 24.1 24.5
Selenium µg/l 10 <0.5 <0.5 <0.5 <0.5 <1.0 <1.0 <1.0 <1.0
Silver µg/l nm nm nm
Sodium mg/l 200 150 150 18.46 19.02 18.58 17.94 19 19 19 20 19.1 18.3
Strontium µg/l 258.6 270.93 255.14 248.87 260 250 260 260
Sulphate mg/l SO4 250 200 187.5 52.1 49 - -
Suspended Solids mg/l - -
Temp °C 9.3 8.2 7.1 10.8 11.7 9.2 12.3 9 10.8 16.8 16.1
Thallium µg/l <0.1 <0.1 <0.1 <0.1 <1.0 <1.0 <1.0 <1.0
Time sampled 11:55 12:50 13:10 11:30 12:45 12:20 11:10 11:15 12:15
Tin (µg/l ) µg/l nm nm nm
T.O.C. mg/l NAC 94.5 <1.5 <1.5 1.8 1.8 3 <1 <1
T.O.N mg/l N NAC 3.15 3.27 3.14 3.27 3.11 4 3.8 3.5 3.7 3.7 4.1
Total S Solids mg/l
Uranium µg/l 4.2 4.63 4.98 4.58 4.5 4.4 4.4 4.5
Vanadium µg/l 0.61 2.19 <0.5 <0.5 <1.0 <1.0 <1.0 <1.0
Zinc µg/l 100 4.1 10.4 3.7 4.7 2.5 2.3 2.1 2.2 <0.018 <0.018
Water Level m OD 33.57 16.67 16.57 15.57 13.37 11.57
D.O. is measured in mg/l instead of % since March 2016 due to a change in laboratory for laboratory analysis.
Monitoring Point:
Drogheda Landfill Site Groundwater Quality
BH4A
For
insp
ectio
n pur
pose
s only
.
Conse
nt of
copy
right
owne
r req
uired
for a
ny ot
her u
se.
EPA Export 28-09-2016:01:56:04

Date Collected DWR IGV 2010 GW Regs 31-Jan-13 12-Feb-13 26-Mar-13 16-Apr-13 08-May-13 11-Jun-13 23-Jul-13 07-Aug-13 17-Sep-13 08-Oct-13 19-Nov-13 03-Dec-13 18-Feb-14 08-Apr-14 09-Sep-14 18-Nov-14 24-Feb-15 14-Apr-15 08-Sep-15 17-Nov-15 31-Mar-16 29-Jun-16
Alkalinity mg/l CaCO3 266 278 248
Aluminium ug/l 200 200 150 <5 <5 <5 <5 <5 13 <10.0 <10.0 <10.0 <10.0 <10.0 <10.0 <10.0
Ammonia mg/l N 0.23 mg/l N 0.11 mg/l N 0.175 6.78 6.13 3.44 2.37 1.27 0.49 0.15 0.08 <0.03 0.04 2.5 0.96 5.8 3.1 0.085 5.7 2 1.1 <0.020 <0.020 0.69 0.71
Antimony ug/l 5 <0.5 <0.5 <0.5 <0.5 <0.5 <1.0 <1.0 <1.0 <1.0 <1.0 <1.0 <1.0 <1.0
Arsenic ug/l 10 7.5 <0.5 <0.5 <0.5 <0.5 <0.5 <1.0 <1.0 <1.0 <1.0 <1.0 <1.0 <1.0 <1.0
Barium ug/l 100 101.2 20.9 10.9 27.9 9.7 99 31 13 81 24 22 12 13 0.021 0.022
Beryllium ug/l <0.5 <0.5 <0.5 <0.5 <0.5 <1.0 <1.0 <1.0 <1.0 <1.0 <1.0 <1.0 <1.0
B.O.D. mg/l O2 - -
Boron µg/l 1000 1000 750 169.7 105.4 68.7 117.3 61.5 180 130 77 170 110 92 57 56
Cadmium µg/l 5 5 3.75 0.5 0.1 <0.1 <0.1 <0.1 0.36 0.15 0.03 0.39 0.13 0.09 0.03 0.03 <0.0006 <0.0006
Calcium mg/l Ca 200 117.23 99.8 89.33 73.45 86.2 110 110 90 110 100 93 85 81
C.O.D. mg/l O2 - -
Chloride mg/l Cl 250 30 52 49 42 37 60 39 54 45 37 47 42 38 34 35 38.4 40.2
Chromium µg/l 50 30 37.5 <0.5 5.2 7.7 <0.5 8.3 2.5 4 7.2 1.7 5.7 5.7 8.1 8.1 0.012 0.01
Cobalt µg/l 0.6 <0.5 <0.5 <0.5 <0.5 <1.0 <1.0 <1.0 <1.0 <1.0 <1.0 <1.0 <1.0
Coliform Bacteria (No/100 ml ) 0 78 62 83
Conductivity µS/cm @ 25 2500 1000 1875 919 908 856 740 688 645 613 611 590 601 742 702 884 782 620 870 706 660 597 589 706 694
Copper µg/l 2000 30 1500 5.1 2.1 0.6 0.9 <0.5 3.3 1.6 <1.0 3.2 <1.0 <1.0 <1.0 <1.0
Cyanide mg/l 0.05 10 <0.05 <0.05 <0.05
D.O. % Saturation 22 25 19 19 31 36 34 24 28 20 22 69 52 7.38 7.58
E_ Coli No/100 ml 0 61 0 0
Fluoride mg/l 0.8 1000 <0.150 0.17 <0.20
Iron µg/l 200 200 <10 10.9 <10 16.8 <10 21 <10.0 10 <10.0 <10.0 65 <10.0 13 <0.23 <0.23
Lead µg/l 25 10 18.75 <0.5 <0.5 <0.5 <0.5 <0.5 <1.0 <1.0 <1.0 <1.0 <1.0 <1.0 <1.0 <1.0 <0.006 <0.006
Magnesium mg/l Mg 50 15.37 13.44 11.33 4.74 10.48 15 15 12 15 14 13 11 11
Manganese µg/l 50 50 490.3 81.1 15.3 <1 1.7 490 75 7 410 51 32 <5.0 <5.0 0.055 0.041
Mercury µg/l 1 1 0.75 nm <0.05 nm nm nm <0.050 <0.020
Molybdenum µg/l 35 <0.5 <0.5 <0.5 <0.5 <0.5 <1.0 <1.0 <1.0 <1.0 <1.0 <1.0 <1.0 <1.0
Nickel µg/l 20 20 15 30.3 13.5 3.3 2 2.4 23 8.5 1.4 24 5.7 4.2 <1.0 <1.0 0.006 <0.003
Nitrate mg/l N 8.9 7.1
Nitrite mg/l N 0.5 0.1 0.375 0.053 0.006 0.016 <0.002 <0.002 0.643 <0.004 0.01 0.004 0.005 0.006 <0.004 <0.004 0.33 0.51
o-Phosphate mg/l P 30 0.03 0.04 0.032 0.027
pH 6.5 - 9.5 7.2 7.1 7.1 7.1 7.2 7.2 7.1 7.3 7.4 7.1 7.1 7.2 7.1 7.1 7.1 7.1 7.2 7.1 7.4 7.4 7.14 7.16
Phenol mg/l 0.0005 <0.002 <0.002 <0.002 <0.002 <0.002 <0.002 <0.002 <0.002 <0.002 <0.002 <0.002 <0.002 <0.025 <0.50 <0.50
Potassium mg/l 5 10.4 6.11 3.87 2.5 3.45 11 8 3.9 9.1 5.6 4.7 3.1 3.1 4.64 3.86
Sampling Depth m 22.7 23 24 23.9 25.9 25.3 27.6 28.1 27.1 18 26 22.3 25.1 26 25.4 25.8 26 26.8 26.4
Selenium µg/l 10 0.6 0.5 <0.5 <0.5 <0.5 <1.0 <1.0 <1.0 <1.0 <1.0 <1.0 <1.0 <1.0
Silver µg/l nm nm
Sodium mg/l 200 150 150 31.31 25.51 19.42 31.43 17.64 33 30 21 30 25 23 18 19 22 23.1
Strontium µg/l 227.34 143.67 108.87 94.35 109.61 220 160 120 220 150 130 100 110
Sulphate mg/l SO4 250 200 187.5 31.9 24.5 29.6 19 - -
Suspended Solids mg/l - -
Temp °C 9.2 10.2 9.8 10.8 12.6 12.2 20.2 14.8 10.5 14 9.9 nm 10.3 12.3 10.9 12.4 6.5 12 11.1 11.3 15.9 15.6
Thallium µg/l 2.66 0.57 0.22 <0.1 0.13 2.4 <1.0 <1.0 2 <1.0 <1.0 <1.0 <1.0
Time sampled 12:25 12:35 12:05 11:55 12:30 12:15 11:45 12:30 11:45 11:50 11:20 13 12:00 11:50 12:15 11:40 11:40 11:45 13:50 13:15
Tin (µg/l ) µg/l nm nm
T.O.C. mg/l NAC 79.7 <1.5 1.9 3.8 17.4 1.7 2.5 2.2 <1.5 1.7 <1.5 <1.5 <1 <1
T.O.N mg/l N NAC 7.12 7.85 7.36 5.96 0.23 4.89 11 8.3 7.3 9.2 8.3 7.8 6.6 6.2 9.2 8.6
Total S Solids mg/l
Uranium µg/l 0.93 1.34 1.03 0.24 1.04 <1.0 1.2 1 <1.0 1.2 1.2 1 <1.0
Vanadium µg/l 0.75 <0.5 0.58 <0.5 0.77 <1.0 <1.0 <1.0 <1.0 <1.0 <1.0 <1.0 <1.0
Zinc µg/l 100 30.9 9.2 6.2 5.1 5.3 25 9 6.3 20 7.6 16 3.2 9.9 <0.018 <0.018
Water Level m OD 36.13 13.43 13.13 12.13 12.23 10.23 10.83 8.03 18.13 10.13 13.83 11.03 10.13 10.73 10.33 10.13 9.33 9.73
D.O. is measured in mg/l instead of % since March 2016 due to a change in laboratory for laboratory analysis.
Monitoring Point:
Drogheda Landfill Site Groundwater Quality
BH5A
For
insp
ectio
n pur
pose
s only
.
Conse
nt of
copy
right
owne
r req
uired
for a
ny ot
her u
se.
EPA Export 28-09-2016:01:56:04

Date Collected DWR IGV 2010 GW Regs 31-Jan-13 12-Feb-13 26-Mar-13 16-Apr-13 08-May-13 11-Jun-13 23-Jul-13 07-Aug-13 17-Sep-13 08-Oct-13 19-Nov-13 03-Dec-13 18-Feb-14 08-Apr-14 09-Sep-14 18-Nov-14 24-Feb-15 14-Apr-15 08-Sep-15 17-Nov-15 31-Mar-16 29-Jun-16
Alkalinity mg/l CaCO3 182 198 163
Aluminium ug/l 200 200 150 <5 19 8.8 <5 25.1 <5 <5 5.5 <10 <10 <10.0 10 <10.0 <10.0 <10.0 <10.0 <10.0 <10.0
Ammonia mg/l N 0.23 mg/l N 0.11 mg/l N 0.175 <0.03 <0.03 <0.03 <0.03 <0.03 <0.03 <0.03 <0.03 0.08 0.03 <0.020 0.022 <0.020 <0.020 <0.020 <0.020 <0.020 <0.020 <0.020 <0.020 <0.11 <0.11
Antimony ug/l 5 <0.5 <0.5 <0.5 <0.5 <0.5 <0.5 <0.5 <0.5 <1 <1 <1.0 <1.0 <1.0 <1.0 <1.0 <1.0 <1.0 <1.0
Arsenic ug/l 10 7.5 <0.5 <0.5 <0.5 <0.5 <0.5 <0.5 <0.5 <0.5 <1 <1 <1.0 <1.0 <1.0 <1.0 <1.0 <1.0 <1.0 <1.0
Barium ug/l 100 40.3 41.5 40.9 35.2 33.7 36 36 36 38.5 39.5 41 40 37 35 36 38 38 40 0.041 0.043
Beryllium ug/l <0.5 <0.5 <0.5 <0.5 <0.5 <0.5 <0.5 <0.5 <1 <1 <1.0 <1.0 <1.0 <1.0 <1.0 <1.0 <1.0 <1.0
B.O.D. mg/l O2 - -
Boron µg/l 1000 1000 750 45.5 45.6 24.9 27.1 34.9 42.3 42.3 44 49.4 55.9 37 37 48 46 42 46 33 33
Cadmium µg/l 5 5 3.75 <0.1 <0.1 <0.1 <0.1 <0.1 <0.1 <0.1 <0.1 <0.1 <0.1 <0.020 <0.020 0.02 <0.020 <0.020 0.02 <0.020 <0.020 <0.0006 <0.0006
Calcium mg/l Ca 200 63.29 63.76 70.98 67.47 70.84 69.16 69.16 66.69 66.58 64.84 68 71 67 64 68 65 66 64
C.O.D. mg/l O2 - -
Chloride mg/l Cl 250 30 16 16 15 14 16 17 23 23 27 38 44 22 20 27 26 21 22 17 20 20.4 19.6
Chromium µg/l 50 30 37.5 <0.5 1 0.9 0.8 0.7 1 1 1.2 <1 1.8 1.5 <1.0 <1.0 <1.0 1.3 <1.0 <1.0 1.3 <0.002 <0.002
Cobalt µg/l <0.5 <0.5 <0.5 <0.5 <0.5 <0.5 <0.5 <0.5 <1 <1 <1.0 <1.0 <1.0 <1.0 <1.0 <1.0 <1.0 <1.0
Coliform Bacteria (No/100 ml ) 0 13 35 1
Conductivity µS/cm @ 25 2500 1000 1875 413 424 431 420 423 415 419 419 611 438 463 485 424 423 428 428 407 409 405 408 432 426
Copper µg/l 2000 30 1500 1.1 1.6 0.9 0.6 1.3 0.5 0.5 0.7 <1 1.2 6.6 <1.0 <1.0 <1.0 <1.0 <1.0 <1.0 1.9
Cyanide mg/l 0.05 10 <0.05 <0.05 <0.05
D.O. % Saturation 76 78 54 54 65 73 67 72 80 74 72 78 81 8.55 8.26
E_ Coli No/100 ml 0 0 0 0
Fluoride mg/l 0.8 1000 0.15 0.21 <0.20
Iron µg/l 200 200 17.2 50.7 29 <10 92.9 <10 <10 <10 15.5 10.1 <10.0 <10.0 <10.0 15 <10.0 10 <10.0 <10.0 <0.23 <0.23
Lead µg/l 25 10 18.75 <0.5 2.3 <0.5 <0.5 2.1 <0.5 <0.5 <0.5 <1 <1 <1.0 <1.0 <1.0 <1.0 <1.0 <1.0 <1.0 <1.0 <0.006 <0.006
Magnesium mg/l Mg 50 2.34 2.56 2.96 2.68 2.79 2.65 2.65 2.58 2.76 2.68 2.6 2.8 2.7 2.5 2.7 2.8 2.4 2.5
Manganese µg/l 50 50 2.6 8.8 4.5 1.1 17 1.5 1.5 1.6 <5 <5 <5.0 <5.0 <5.0 <5.0 <5.0 <5.0 <5.0 7.2 0.009 0.006
Mercury µg/l 1 1 0.75 nm nm <0.05 nm nm nm nm nm nm nm <0.050 <0.020
Molybdenum µg/l 35 <0.5 <0.5 <0.5 <0.5 <0.5 <0.5 <0.5 <0.5 <1 <1 <1.0 <1.0 <1.0 <1.0 <1.0 <1.0 <1.0 <1.0
Nickel µg/l 20 20 15 2.7 1 0.7 1.3 2.1 0.6 0.6 1.3 1.1 1.5 <1.0 <1.0 <1.0 <1.0 <1.0 <1.0 <1.0 <1.0 <0.003 <0.003
Nitrate mg/l N 0.7 <0.7
Nitrite mg/l N 0.5 0.1 0.375 <0.002 <0.002 <0.002 <0.002 <0.002 <0.002 <0.002 <0.002 0.002 <0.004 <0.004 <0.004 <0.004 <0.004 <0.004 <0.004 <0.004 <0.004 <0.004 <0.08 <0.08
o-Phosphate mg/l P 30 0.02 0.028 <0.010
pH 6.5 - 9.5 6.9 7.4 7.4 7.6 7.6 7.6 7.6 7.6 7.3 7.6 7.6 7.4 7.8 7.6 7.7 7.7 7.6 7.6 7.7 7.8 7.51 7.48
Phenol mg/l 0.0005 <0.002 <0.002 <0.002 <0.002 <0.002 <0.002 <0.002 <0.002 <0.002 <0.002 nm <0.002 <0.002 <0.002 <0.002 <0.002 <0.002 <0.002 <0.025 <0.50 <0.50
Potassium mg/l 5 0.86 0.79 1.19 1.23 0.81 1.3 1.11 1.54 1.41 1.3 1 0.96 0.86 0.91 1.3 0.76 0.88 0.62 0.5
Sampling Depth m 27.5 27.3 26.8 27.8 28.4 28.8 29.6 29.6 27.6 28.6 29.2 28.7 28.1 28.9 29 28.6 28.4 28.5 29 28.8
Selenium µg/l 10 <0.5 <0.5 <0.5 <0.5 <0.5 <0.5 <0.5 <0.5 <1 <1 <1.0 <1.0 <1.0 <1.0 <1.0 <1.0 <1.0 <1.0
Silver µg/l nm nm nm
Sodium mg/l 200 150 150 15.25 16.09 11.91 11.86 14.56 15.87 15.87 16.44 18.56 19.86 14 15 18 16 15 17 13 14 12.9 11.6
Strontium µg/l 83.88 90 92.43 88.59 92.25 88.38 88.38 93.63 89.41 91.79 91 87 88 86 86 89 83 89
Sulphate mg/l SO4 250 200 187.5 11.6 11.9 14 - -
Suspended Solids mg/l - -
Temp °C 9.4 10.2 9.6 10.5 10.4 10.6 13.8 13.8 14.8 11 10 8.3 10.1 10.4 11 10.9 9.8 10.5 10.7 10.3 15.5 14.5
Thallium µg/l <0.1 <0.1 <0.1 <0.1 <0.1 <0.1 <0.1 <0.1 <1 <1 <1.0 <1.0 <1.0 <1.0 <1.0 <1.0 <1.0 <1.0
Time sampled 10:40 10:30 10:45 10:00 10:50 10:25 11:20 11:20 12:30 11:20 12:10 10:45 9:45 10:15 10:05 10:50 10:15 11:00 10:45 10:20
Tin (µg/l ) µg/l nm nm nm
T.O.C. mg/l NAC 43.7 <1.5 <1.5 <1.5 2.5 <1.5 <1.5 3.4 1.5 <1.5 1.8 <1.5 3.2 <1 <1
T.O.N mg/l N NAC 0.86 1.1 1.12 1.11 1.25 1.04 0.78 0.78 1.51 0.59 0.3 0.72 0.67 0.76 0.7 0.76 0.85 0.75 0.76 0.7 <0.7
Total S Solids mg/l
Uranium µg/l 0.41 0.42 0.4 0.39 0.47 0.39 0.39 0.44 <1 <1 <1.0 <1.0 <1.0 <1.0 <1.0 <1.0 <1.0 <1.0
Vanadium µg/l 0.51 <0.5 <0.5 <0.5 <0.5 <0.5 <0.5 0.52 <1 <1 <1.0 <1.0 <1.0 <1.0 <1.0 <1.0 <1.0 <1.0
Zinc µg/l 100 22.4 29.7 30.6 8.6 13.6 4.4 4.4 18.7 29.7 17.2 16 8.7 5.1 15 6.4 7.4 9.1 11 <0.018 <0.018
Water Level m OD 35.951 8.451 8.651 9.151 8.151 7.551 7.151 6.351 8.351 6.751 7.251 7.851 7.051 6.951 7.351 7.551 7.451 6.951 7.151
D.O. is measured in mg/l instead of % since March 2016 due to a change in laboratory for laboratory analysis.
Monitoring Point:
Drogheda Landfill Site Groundwater Quality
BH6A
For
insp
ectio
n pur
pose
s only
.
Conse
nt of
copy
right
owne
r req
uired
for a
ny ot
her u
se.
EPA Export 28-09-2016:01:56:05

Date Collected DWR IGV 2010 GW Regs 31-Jan-13 12-Feb-13 26-Mar-13 16-Apr-13 08-May-13 11-Jun-13 23-Jul-13 07-Aug-13 17-Sep-13 08-Oct-13 19-Nov-13 03-Dec-13 18-Feb-14 08-Apr-14 09-Sep-14 18-Nov-14 24-Feb-15 14-Apr-15 08-Sep-15 17-Nov-15 31-Mar-16 29-Jun-16
Alkalinity mg/l CaCO3 140 158 140
Aluminium ug/l 200 200 150 nm 14.6 29.4 59.5 <10.0 <10.0 11 <10.0 <10.0 <10.0 <10.0 <10.0
Ammonia mg/l N 0.23 mg/l N 0.11 mg/l N 0.175 nm <0.03 <0.03 <0.03 <0.03 <0.03 <0.03 <0.03 <0.03 0.06 <0.020 <0.020 <0.020 <0.020 0.026 0.024 <0.020 <0.020 <0.020 <0.020 <0.11 <0.11
Antimony ug/l 5 nm 0.58 0.95 1.16 <1.0 <1.0 1.2 <1.0 <1.0 <1.0 <1.0 <1.0
Arsenic ug/l 10 7.5 nm 8.74 44.61 47.05 <1.0 8.2 15 15 8.2 6.7 9.8 6
Barium ug/l 100 nm 32.6 10.3 8.4 41 30 24 28 31 28 29 32 0.029 0.03
Beryllium ug/l nm <0.5 <0.5 <0.5 <1.0 <1.0 <1.0 <1.0 <1.0 <1.0 <1.0 <1.0
B.O.D. mg/l O2 - -
Boron µg/l 1000 1000 750 nm 38.8 26.2 33.6 37 53 60 55 49 50 60 65
Cadmium µg/l 5 5 3.75 nm <0.1 0.2 0.1 <0.020 0.03 0.05 0.04 0.03 0.03 0.02 0.03 <0.0006 <0.0006
Calcium mg/l Ca 200 nm 58.95 13.39 12.16 68 75 46 56 62 60 46 58
C.O.D. mg/l O2 - -
Chloride mg/l Cl 250 30 nm 34 67 60 22 23 27 27 20 17 17 18 16.7 15.5
Chromium µg/l 50 30 37.5 nm 11.7 24.7 24.6 1.5 6.7 12 8.7 6.1 5.3 8.3 7.8 0.007 0.006
Cobalt µg/l nm <0.5 <0.5 <0.5 <1.0 <1.0 <1.0 <1.0 <1.0 <1.0 <1.0 <1.0
Coliform Bacteria (No/100 ml ) 0 41 236 980
Conductivity µS/cm @ 25 2500 1000 1875 nm 578 577 571 561 565 627 621 606 595 451 454 424 539 471 540 468 442 439 511 470 451
Copper µg/l 2000 30 1500 nm 1.9 1 1.4 6.6 2.9 2.3 3.8 2.7 2.1 2.6 3.3
Cyanide mg/l 0.05 10 <0.05 <0.05 <0.05
D.O. % Saturation nm 90 50 57 73 85 82 91 92 84 92 92 8.9 8.52
E_ Coli No/100 ml 0 0 1 0
Fluoride mg/l 0.8 1000 0.2 0.22 <0.20
Iron µg/l 200 200 nm 20.7 <10 <10 <10.0 <10.0 <10.0 <10.0 <10.0 <10.0 <10.0 <10.0 <0.23 <0.23
Lead µg/l 25 10 18.75 nm <0.5 <0.5 <0.5 <1.0 <1.0 <1.0 <1.0 <1.0 <1.0 <1.0 <1.0 <0.006 <0.006
Magnesium mg/l Mg 50 nm 7.53 1.59 2.1 2.6 9.6 7.6 8.6 8.8 8.6 9.1 13
Manganese µg/l 50 50 nm 1.4 <1 <1 <5.0 <5.0 <5.0 <5.0 <5.0 <5.0 <5.0 <5.0 0.01 0.011
Mercury µg/l 1 1 0.75 nm 0.1 nm nm <0.050 <0.020
Molybdenum µg/l 35 nm 18.8 63.9 70 <1.0 7.6 22 16 9.2 6.8 10 9.1
Nickel µg/l 20 20 15 nm 2.6 1.3 1 <1.0 <1.0 <1.0 <1.0 <1.0 <1.0 <1.0 <1.0 <0.003 <0.003
Nitrate mg/l N <0.7 <0.7
Nitrite mg/l N 0.5 0.1 0.375 nm <0.002 <0.002 <0.002 <0.004 <0.004 <0.004 <0.004 <0.004 <0.004 <0.004 <0.004 <0.08 <0.08
o-Phosphate mg/l P 30 <0.02 <0.010 <0.010
pH 6.5 - 9.5 nm 7.5 7.6 7.9 8 7.9 9.1 9.5 9.7 9.5 7.8 7.6 7.8 7.9 8 8.1 8.3 8.1 7.9 8.2 7.84 7.6
Phenol mg/l 0.0005 nm <0.002 <0.002 <0.002 <0.002 <0.002 <0.002 <0.002 <0.002 <0.002 <0.002 <0.025 <0.50 <0.50
Potassium mg/l 5 nm 45.55 124.56 113.3 1.3 23 39 33 21 16 30 22 15.4 11.4
Sampling Depth m nm 6 5.4 6.8 8.7 9.2 9.3 10.2 13.1 9.8 10.3 9.1 28.1 9.4 12.3 11.7 8.4 8 12 10.9
Selenium µg/l 10 nm 71.8 109 100 <1.0 86 100 110 68 62 77 110
Silver µg/l nm nm
Sodium mg/l 200 150 150 nm 13.55 18.09 16.66 14 11 10 11 9.8 9.1 7.4 8.3 7.13 7.56
Strontium µg/l nm 218.29 267.75 47.14 91 230 150 210 210 210 170 190
Sulphate mg/l SO4 250 200 187.5 82.2 89.8 64 - -
Suspended Solids mg/l - -
Temp °C nm 7.2 6 11 nm 11.4 19.5 14.6 10.6 14 9.6 nm 10.1 10.7 10.8 15.8 9.8 11.5 11.6 10.3 15.8 14.5
Thallium µg/l nm <0.1 <0.1 <0.1 <1.0 <1.0 <1.0 <1.0 <1.0 <1.0 <1.0 <1.0
Time sampled 13:05 12:10 12:20 12:35 12:10 11:50 12:35 12:00 12:30 12:35 14:25 12:30 9:45 12:30 11:45 12:40 12:05 11:15 13:05 12:40
Tin (µg/l ) µg/l nm nm
T.O.C. mg/l NAC nm 2 1.8 2.3 <1.5 2.3 4.5 4.1 3.6 2.3 3.3 3.3 <1 <1
T.O.N mg/l N NAC nm 0.32 0.9 0.79 0.72 <0.20 0.36 0.36 0.25 0.25 0.44 <0.20 <0.7 <0.7
Total S Solids mg/l
Uranium µg/l nm 1.23 0.36 0.3 <1.0 1.5 <1.0 1.3 1.4 1.4 1 1.4
Vanadium µg/l nm 2.23 41 44.47 <1.0 2 7.4 5 2 1.7 3.5 2.6
Zinc µg/l 100 nm 10.8 1.3 5.8 16 4.4 2.6 13 6.4 24 2.7 5.7 <0.018 <0.018
Water Level m OD 25.172 19.172 19.772 18.372 16.472 15.972 15.872 12.072 14.872 16.072 15.772 12.872 13.472 16.772 17.172 13.172 14.272
D.O. is measured in mg/l instead of % since March 2016 due to a change in laboratory for laboratory analysis.
Monitoring Point:
Drogheda Landfill Site Groundwater Quality
BH7A
For
insp
ectio
n pur
pose
s only
.
Conse
nt of
copy
right
owne
r req
uired
for a
ny ot
her u
se.
EPA Export 28-09-2016:01:56:05

Date Collected DWR IGV 2010 GW Regs 31-Jan-13 12-Feb-13 26-Mar-13 16-Apr-13 08-May-13 11-Jun-13 23-Jul-13 07-Aug-13 17-Sep-13 08-Oct-13 19-Nov-13 03-Dec-13 18-Feb-14 08-Apr-14 09-Sep-14 18-Nov-14 24-Feb-15 14-Apr-15 08-Sep-15 17-Nov-15 31-Mar-16 29-Jun-16
Alkalinity mg/l CaCO3 210 202 219
Aluminium ug/l 200 200 150 <5 <5 <5 <5 <10.0 <10.0 <10.0 <10.0 <10.0 <10.0 <10.0 <10.0
Ammonia mg/l N 0.23 mg/l N 0.11 mg/l N 0.175 <0.03 <0.03 <0.03 <0.03 <0.03 <0.03 <0.03 <0.03 <0.03 <0.03 <0.020 <0.020 <0.020 <0.020 <0.020 <0.020 <0.020 <0.020 <0.020 <0.020 <0.11 <0.11
Antimony ug/l 5 <0.5 <0.5 <0.5 <0.5 <1.0 <1.0 <1.0 <1.0 <1.0 <1.0 <1.0 <1.0
Arsenic ug/l 10 7.5 <0.5 0.61 <0.5 <0.5 <1.0 <1.0 <1.0 <1.0 <1.0 <1.0 <1.0 <1.0
Barium ug/l 100 21.1 19.3 18.4 20.9 18 17 19 18 18 18 19 18 0.018 0.021
Beryllium ug/l <0.5 <0.5 <0.5 <0.5 <1.0 <1.0 <1.0 <1.0 <1.0 <1.0 <1.0 <1.0
B.O.D. mg/l O2 - -
Boron µg/l 1000 1000 750 20.7 20.6 55.1 78.7 23 26 41 27 23 24 49 26
Cadmium µg/l 5 5 3.75 <0.1 <0.1 <0.1 <0.1 <0.020 <0.020 <0.020 <0.020 <0.020 <0.020 <0.020 <0.020 <0.0006 <0.0006
Calcium mg/l Ca 200 85.4 81.62 77.41 76.42 84 85 78 84 81 77 75 76
C.O.D. mg/l O2 - -
Chloride mg/l Cl 250 30 14 17 53 55 16 17 41 16 19 18 43 15 22.2 22.6
Chromium µg/l 50 30 37.5 0.8 1.3 1.1 1.2 2.2 <1.0 <1.0 1.4 1.6 1.1 1 1.5 <0.002 <0.002
Cobalt µg/l <0.5 <0.5 <0.5 <0.5 <1.0 <1.0 <1.0 <1.0 <1.0 <1.0 <1.0 <1.0
Coliform Bacteria (No/100 ml ) 0 16 9 5
Conductivity µS/cm @ 25 2500 1000 1875 496 505 500 484 491 510 524 528 539 549 492 497 471 464 507 488 451 452 493 449 488 474
Copper µg/l 2000 30 1500 0.7 <0.5 <0.5 0.5 <1.0 <1.0 <1.0 <1.0 <1.0 <1.0 <1.0 <1.0
Cyanide mg/l 0.05 10 <0.05 <0.05 <0.05
D.O. % Saturation 86 90 56 49 90 84 74 93 91 87 62 94 8.88 8.45
E_ Coli No/100 ml 0 0 0 0
Fluoride mg/l 0.8 1000 <0.150 <0.150 <0.20
Iron µg/l 200 200 <10 <10 <10 17.1 22 <10.0 32 50 <10.0 <10.0 <10.0 <10.0 <0.23 <0.23
Lead µg/l 25 10 18.75 <0.5 <0.5 <0.5 <0.5 <1.0 <1.0 <1.0 <1.0 <1.0 <1.0 <1.0 <1.0 <0.006 <0.006
Magnesium mg/l Mg 50 3.95 3.77 3.2 3.72 4 4.1 4.1 4.1 3.8 3.8 2.8 3.7
Manganese µg/l 50 50 1.7 2 1.4 1.9 <5.0 <5.0 <5.0 <5.0 <5.0 <5.0 <5.0 <5.0 0.012 0.02
Mercury µg/l 1 1 0.75 nm <0.05 nm nm <0.050 <0.020
Molybdenum µg/l 35 <0.5 <0.5 2 0.9 <1.0 <1.0 <1.0 <1.0 <1.0 <1.0 <1.0 <1.0
Nickel µg/l 20 20 15 <0.5 <0.5 <0.5 2.2 <1.0 <1.0 <1.0 <1.0 <1.0 <1.0 <1.0 <1.0 <0.003 <0.003
Nitrate mg/l N <0.7 <0.7
Nitrite mg/l N 0.5 0.1 0.375 <0.002 <0.002 <0.002 <0.002 0.005 <0.004 <0.004 <0.004 <0.004 <0.004 <0.004 <0.004 <0.08 <0.08
o-Phosphate mg/l P 30 <0.02 <0.010 <0.010
pH 6.5 - 9.5 7.5 7.4 7.4 7.5 7.4 7.5 7.5 7.6 7.5 7.5 7.4 7.5 7.3 7.5 7.5 7.4 7.4 7.5 7.6 7.8 7.33 7.26
Phenol mg/l 0.0005 <0.002 <0.002 <0.002 <0.002 <0.002 <0.002 <0.002 <0.002 <0.002 <0.002 <0.025 <0.50 <0.50
Potassium mg/l 5 0.5 0.71 0.87 1.73 0.65 0.41 0.93 0.32 0.34 0.37 0.63 0.42 <0.18 <0.18
Sampling Depth m 26.2 27.5 26.7 28.2 28.7 29.1 29.7 29.3 29.6 28.2 28.9 29.2 26.9 28.7 29.1 24.6 29 29 29 29.2
Selenium µg/l 10 1.5 2.1 <0.5 <0.5 1 <1.0 <1.0 1.2 1.1 <1.0 <1.0 <1.0
Silver µg/l nm nm
Sodium mg/l 200 150 150 10.93 11.09 23.65 27.8 11 12 23 9.9 11 12 21 11 10.3 9.51
Strontium µg/l 94.44 89.39 85.5 91.66 91 88 90 95 87 89 78 88
Sulphate mg/l SO4 250 200 187.5 10.3 8.7 7 - -
Suspended Solids mg/l - -
Temp °C 9.4 10.1 9.7 10.5 10.5 10.4 12.4 11.9 10.4 11 9.9 8.4 10.3 10.7 10.8 10.8 10.1 10.6 10.9 10.3 15.4 16.2
Thallium µg/l <0.1 <0.1 <0.1 0.1 <1.0 <1.0 <1.0 <1.0 <1.0 <1.0 <1.0 <1.0
Time sampled 11:05 10:55 11:05 10:25 11:10 10:40 11:50 10:55 11:20 11:40 12:40 11:10 10:10 10:45 10:20 11:15 10:40 11:20 11:05 10:40
Tin (µg/l ) µg/l nm nm
T.O.C. mg/l NAC 61.5 <1.5 1.8 2.4 <1.5 <1.5 3.4 2.2 <1.5 <1.5 1.9 <1.5 <1 <1
T.O.N mg/l N NAC 0.33 0.35 0.12 0.27 0.44 0.2 <0.20 0.34 0.21 0.27 0.25 0.29 <0.7 <0.7
Total S Solids mg/l
Uranium µg/l 0.36 0.33 0.25 0.27 <1.0 <1.0 <1.0 <1.0 <1.0 <1.0 <1.0 <1.0
Vanadium µg/l <0.5 <0.5 <0.5 <0.5 <1.0 <1.0 <1.0 <1.0 <1.0 <1.0 <1.0 <1.0
Zinc µg/l 100 12.3 12.3 14.6 12.3 4.2 4.2 4.5 11 2.2 4.8 3.6 7.5 <0.018 <0.018
Water Level m OD 36.151 9.951 8.651 9.451 7.951 7.451 7.051 6.451 6.551 7.251 6.951 9.251 7.451 7.051 11.551 7.151 7.151 7.151 6.951
D.O. is measured in mg/l instead of % since March 2016 due to a change in laboratory for laboratory analysis.
Monitoring Point:
Drogheda Landfill Site Groundwater Quality
BH8A
For
insp
ectio
n pur
pose
s only
.
Conse
nt of
copy
right
owne
r req
uired
for a
ny ot
her u
se.
EPA Export 28-09-2016:01:56:05

Date Collected DWR IGV 2010 GW Regs 31-Jan-13 12-Feb-13 26-Mar-13 16-Apr-13 08-May-13 11-Jun-13 23-Jul-13 07-Aug-13 17-Sep-13 08-Oct-13 19-Nov-13 03-Dec-13 18-Feb-14 08-Apr-14 09-Sep-14 18-Nov-14 24-Feb-15 14-Apr-15 08-Sep-15 17-Nov-15 31-Mar-16 29-Jun-16
Alkalinity mg/l CaCO3 268 246 269
Aluminium ug/l 200 200 150 <5 20.4 <5 <5 18.7 <5 <5 <5 <5 <10 <10 <10.0 <10.0 <10.0 <10.0 <10.0 <10.0 <10.0 <10.0
Ammonia mg/l N 0.23 mg/l N 0.11 mg/l N 0.175 <0.03 <0.03 <0.03 <0.03 <0.03 <0.03 <0.03 <0.03 <0.03 <0.03 <0.020 0.026 <0.020 0.06 <0.020 <0.020 <0.020 <0.020 <0.020 <0.020 <0.11 <0.11
Antimony ug/l 5 <0.5 <0.5 <0.5 <0.5 <0.5 <0.5 <0.5 <0.5 <0.5 <1 <1 <1.0 <1.0 <1.0 <1.0 3.5 <1.0 <1.0 <1.0
Arsenic ug/l 10 7.5 <0.5 <0.5 <0.5 <0.5 <0.5 <0.5 <0.5 <0.5 <0.5 <1 <1 <1.0 <1.0 <1.0 <1.0 <1.0 <1.0 <1.0 <1.0
Barium ug/l 100 29.2 29.6 26.2 24.2 27.9 28.2 26.8 27.9 28.6 29.2 28.6 27 25 28 25 26 27 26 29 0.025 0.025
Beryllium ug/l <0.5 <0.5 <0.5 <0.5 <0.5 <0.5 <0.5 <0.5 <0.5 <1 <1 <1.0 <1.0 <1.0 <1.0 <1.0 <1.0 <1.0 <1.0
B.O.D. mg/l O2 - -
Boron µg/l 1000 1000 750 24.7 23.7 25.3 30.6 69.5 112.2 108.5 117.3 109 86.8 78.8 26 29 57 28 28 31 73 51
Cadmium µg/l 5 5 3.75 <0.1 <0.1 <0.1 <0.1 <0.1 <0.1 <0.1 <0.1 <0.1 <0.02 <0.02 0.02 <0.020 0.02 <0.020 0.02 <0.020 <0.020 <0.020 <0.0006 <0.0006
Calcium mg/l Ca 200 109.07 108.06 106.02 97.02 94.68 80.88 75.04 73.45 82.83 86.84 89.65 110 110 100 100 100 100 90 95
C.O.D. mg/l O2 - -
Chloride mg/l Cl 250 30 19 18 16 16 23 38 54 56 60 57 48 42 19 19 35 23 19 20 41 34 15.4 16.8
Chromium µg/l 50 30 37.5 <0.5 1.7 1.3 1 0.7 1 <0.5 <0.5 1.9 <1 2 2.2 <1.0 <1.0 1.3 1.7 1.2 <1.0 1.6 <0.002 <0.002
Cobalt µg/l <0.5 <0.5 <0.5 <0.5 <0.5 <0.5 <0.5 <0.5 <0.5 <1 <1 <1.0 <1.0 <1.0 <1.0 <1.0 <1.0 <1.0 <1.0
Coliform Bacteria (No/100 ml ) 0 3 0 3
Conductivity µS/cm @ 25 2500 1000 1875 591 581 556 559 561 569 573 580 590 602 608 603 567 563 579 572 546 557 567 575 570 512
Copper µg/l 2000 30 1500 0.8 1.1 <0.5 0.5 1 0.7 0.8 0.9 0.6 <1 <1 <1.0 <1.0 <1.0 <1.0 <1.0 2.8 <1.0 <1.0
Cyanide mg/l 0.05 10 <0.05 <0.05 <0.05
D.O. % Saturation 66 63 26 24 61 50 43 79 56 59 35 56 7.93 8.01
E_ Coli No/100 ml 0 0 0 0
Fluoride mg/l 0.8 1000 <0.150 <0.150 <0.20
Iron µg/l 200 200 24.4 11.7 <10 <10 34.5 <10 <10 16.8 <10 <10 <10 26 <10.0 11 <10.0 <10.0 <10.0 <10.0 <10.0 <0.23 <0.23
Lead µg/l 25 10 18.75 <0.5 0.5 <0.5 <0.5 <0.5 <0.5 <0.5 <0.5 <0.5 <1 <1 <1.0 <1.0 <1.0 <1.0 <1.0 <1.0 <1.0 <1.0 <0.006 <0.006
Magnesium mg/l Mg 50 4.26 4.41 4.55 4.28 4.88 5.16 4.78 4.74 4.9 4.89 5.03 4.3 4.5 4.9 4.1 4.6 4.5 4.4 4.3
Manganese µg/l 50 50 2.2 7.4 1.1 <1 13 <1 <1 <1 <1 <5 <5 <5.0 <5.0 <5.0 <5.0 <5.0 <5.0 <5.0 <5.0 0.014 0.015
Mercury µg/l 1 1 0.75 nm nm <0.05 nm nm nm nm nm nm nm nm <0.050
Molybdenum µg/l 35 <0.5 <0.5 <0.5 <0.5 <0.5 <0.5 <0.5 <0.5 <0.5 <1 <1 <1.0 <1.0 <1.0 <1.0 4.7 <1.0 <1.0 <1.0
Nickel µg/l 20 20 15 <0.5 <0.5 <0.5 1.1 2.4 1.7 2.5 2 1.9 1.6 1.1 <1.0 <1.0 <1.0 <1.0 <1.0 <1.0 <1.0 <1.0 <0.003 <0.003
Nitrate mg/l N <0.7 <0.7
Nitrite mg/l N 0.5 0.1 0.375 <0.002 <0.002 <0.002 <0.002 <0.002 <0.002 <0.002 <0.002 <0.002 0.002 <0.004 <0.004 <0.004 <0.004 <0.004 <0.004 <0.004 <0.004 <0.004 <0.004 <0.08 <0.08
o-Phosphate mg/l P 30 0.02 0.012 <0.010
pH 6.5 - 9.5 6.8 7.3 7.2 7.3 7.2 7.3 7.4 7.5 7.4 7.4 7.3 7.2 7.1 7.2 7.3 7.2 7.3 7.2 7.4 7.3 7.21 7.18
Phenol mg/l 0.0005 <0.002 <0.002 <0.002 <0.002 <0.002 <0.002 <0.002 <0.002 <0.002 <0.002 <0.002 <0.002 <0.002 <0.002 <0.002 <0.002 <0.002 <0.002 <0.002 <0.025 <0.50 <0.50
Potassium mg/l 5 0.63 0.66 0.97 1.08 1.31 2.45 2.5 2.55 2 1.81 0.64 0.97 1.1 0.39 0.59 0.67 1.1 1 0.39 0.86
Sampling Depth m 26.5 25.3 26.2 27.3 27 27.4 28.7 27.5 28.1 27.1 27.5 28 25.2 27 25.4 28.4 28.9 26 26.1 26.2
Selenium µg/l 10 <0.5 <0.5 <0.5 <0.5 0.7 <0.5 <0.5 <0.5 <0.5 <1 <1 <1.0 <1.0 <1.0 <1.0 <1.0 <1.0 <1.0 <1.0
Silver µg/l nm nm nm
Sodium mg/l 200 150 150 7.16 7.33 8.81 10.29 21.46 31.21 30.46 31.43 30.16 24.85 21.42 8.3 9.7 18 8.1 9.5 10 21 17 9.02 8.78
Strontium µg/l 119.54 123.42 116.71 110.48 110.3 99.91 103.42 94.35 107.75 109.47 107.5 120 110 120 120 110 120 100 120
Sulphate mg/l SO4 250 200 187.5 6 4.9 5 - -
Suspended Solids mg/l - -
Temp °C 9.1 10.1 9.8 10.6 10.5 10.6 11.8 12.3 10.5 11 9.7 8.7 10.3 10.6 10.8 10.6 10 10.6 10.9 10.4 15.6 14.8
Thallium µg/l <0.1 <0.1 <0.1 <0.1 <0.1 <0.1 <0.1 <0.1 <0.1 <1 <1 <1.0 <1.0 <1.0 <1.0 <1.0 <1.0 <1.0 <1.0
Time sampled 11:30 11:15 11:25 10:55 11:30 11:05 12:10 11:15 11:45 12.05 13:00 11:35 10:30 11:15 10:45 11:35 11:05 11:45 11:45 10:55
Tin (µg/l ) µg/l nm nm nm
T.O.C. mg/l NAC 70.7 <1.5 1.6 2.3 <1.5 <1.5 2.4 <1.5 <1.5 1.6 3 <1.5 <1 <1
T.O.N mg/l N NAC <0.08 <0.08 0.16 <0.08 0.08 <0.08 <0.08 0.16 0.23 <0.08 <0.20 <0.20 <0.20 <0.20 <0.20 <0.20 <0.20 0.25 <0.20 <0.20 <0.7 <0.7
Total S Solids mg/l
Uranium µg/l 0.27 0.28 0.27 0.25 0.27 0.23 0.24 0.24 0.24 <1 <1 <1.0 <1.0 <1.0 <1.0 <1.0 <1.0 <1.0 <1.0
Vanadium µg/l <0.5 <0.5 <0.5 <0.5 <0.5 <0.5 <0.5 <0.5 0.51 <1 <1 <1.0 <1.0 <1.0 <1.0 <1.0 <1.0 <1.0 <1.0
Zinc µg/l 100 6.4 3.1 4.8 4.4 3.5 2.7 4.2 5.1 7.6 21.2 5.6 5.1 4 5.9 8.8 1.8 3.7 4.6 13 <0.018 <0.018
Water Level m OD 34.345 7.845 9.045 8.145 7.045 7.345 6.945 5.645 6.245 6.845 6.345 9.145 7.345 8.945 5.945 5.445 8.345 8.245 8.145
D.O. is measured in mg/l instead of % since March 2016 due to a change in laboratory for laboratory analysis.
Monitoring Point:
Drogheda Landfill Site Groundwater Quality
BH9A
For
insp
ectio
n pur
pose
s only
.
Conse
nt of
copy
right
owne
r req
uired
for a
ny ot
her u
se.
EPA Export 28-09-2016:01:56:05

Date Collected DWR IGV 2010 GW Regs 31-Jan-13 12-Feb-13 26-Mar-13 16-Apr-13 08-May-13 11-Jun-13 23-Jul-13 07-Aug-13 17-Sep-13 08-Oct-13 19-Nov-13 03-Dec-13 18-Feb-14 08-Apr-14 09-Sep-14 18-Nov-14 24-Feb-15 14-Apr-15 08-Sep-15 17-Nov-15 31-Mar-16 29-Jun-16
Alkalinity mg/l CaCO3 135 142 141
Aluminium ug/l 200 200 150 5.8 99.5 16.2 6.6 200.3 10.3 6.3 13.3 11.9 14 <10 11 <10.0 <10.0 <10.0 <10.0 <10.0 <10.0 <10.0
Ammonia mg/l N 0.23 mg/l N 0.11 mg/l N 0.175 <0.03 <0.03 <0.03 <0.03 <0.03 <0.03 <0.03 0.15 0.05 <0.03 <0.020 0.049 <0.020 0.028 <0.020 <0.020 <0.020 <0.020 <0.020 <0.020 <0.11 <0.11
Antimony ug/l 5 <0.5 <0.5 <0.5 <0.5 <0.5 <0.5 <0.5 <0.5 <0.5 <1 <1 <1.0 <1.0 <1.0 <1.0 <1.0 <1.0 <1.0 <1.0
Arsenic ug/l 10 7.5 0.76 0.52 0.57 0.63 1.23 1.78 2.45 1.56 1.25 <1 <1 <1.0 <1.0 <1.0 <1.0 <1.0 <1.0 1.1 <1.0
Barium ug/l 100 40.3 36.2 39.6 47.3 53.9 58.7 65.7 58.6 63.3 68.6 72.3 22 47 57 47 49 60 26 33 0.041 0.045
Beryllium ug/l <0.5 <0.5 <0.5 <0.5 <0.5 <0.5 <0.5 <0.5 <0.5 <1 <1 <1.0 <1.0 <1.0 <1.0 <1.0 <1.0 <1.0 <1.0
B.O.D. mg/l O2 - -
Boron µg/l 1000 1000 750 127.7 98.4 139.6 172.1 191.8 206.4 193.6 194.7 204.2 191.6 186.9 33 120 190 150 130 160 170 160
Cadmium µg/l 5 5 3.75 <0.1 <0.1 <0.1 <0.1 <0.1 <0.1 <0.1 <0.1 <0.1 <0.1 <0.1 <0.020 <0.020 0.02 <0.020 <0.020 <0.020 <0.020 <0.020 <0.0006 <0.0006
Calcium mg/l Ca 200 41.9 41.64 46.86 41.82 43.75 42.68 40.85 38.97 41.5 42.65 42.38 47 51 41 39 47 46 21 23
C.O.D. mg/l O2 - -
Chloride mg/l Cl 250 30 56 44 27 55 70 72 74 75 76 75 71 72 20 45 69 58 55 59 63 60 51.5 37.2
Chromium µg/l 50 30 37.5 <0.5 1.6 1.2 <0.5 0.6 0.5 <0.5 <0.5 0.7 <1 <1 3.8 1.6 <1.0 <1.0 1.2 <1.0 <1.0 <1.0 <0.002 <0.002
Cobalt µg/l <0.5 <0.5 <0.5 <0.5 <0.5 <0.5 <0.5 <0.5 <0.5 <1 <1 <1.0 <1.0 <1.0 <1.0 <1.0 <1.0 <1.0 <1.0
Coliform Bacteria (No/100 ml ) 0 2 93 23
Conductivity µS/cm @ 25 2500 1000 1875 457 418 385 481 531 521 532 541 545 537 538 551 330 452 507 472 456 493 388 387 442 438
Copper µg/l 2000 30 1500 1.4 1.8 1.5 2.5 2.5 7.2 1.3 1.9 1 1.3 1.2 <1.0 1.2 1.3 1.5 <1.0 1.6 1.3 1
Cyanide mg/l 0.05 10 <0.05 <0.05 <0.05
D.O. % Saturation 67 71 13 30 87 62 46 66 71 51 63 64 8.36 8.39
E_ Coli No/100 ml 0 1 0 0
Fluoride mg/l 0.8 1000 <0.150 0.19 <0.20
Iron µg/l 200 200 <10 112.9 28.4 18 287.2 26.4 24.7 98.6 20.2 35 <10 13 <10.0 15 15 <10.0 17 <10.0 <10.0 <0.23 <0.23
Lead µg/l 25 10 18.75 <0.5 1.1 <0.5 <0.5 0.9 <0.5 <0.5 1.1 <0.5 <1 <1 <1.0 <1.0 <1.0 <1.0 <1.0 <1.0 <1.0 <1.0 <0.006 <0.006
Magnesium mg/l Mg 50 7.41 6.29 8.24 9.04 10.17 10.44 9.9 10.02 10.17 10.46 10.58 3.4 7.3 10 8.5 8.2 9.3 8.2 8.3
Manganese µg/l 50 50 6.7 17.4 1.5 2 56.2 25.5 926.7 74.1 81.7 48.4 202.8 <5.0 <5.0 11 <5.0 <5.0 <5.0 <5.0 <5.0 0.007 0.01
Mercury µg/l 1 1 0.75 nm nm <0.05 nm nm nm nm nm nm nm nm <0.050 <0.020
Molybdenum µg/l 35 0.6 0.7 0.6 <0.5 0.6 1 1.1 1 0.7 <1 <1 <1.0 <1.0 <1.0 <1.0 <1.0 <1.0 <1.0 <1.0
Nickel µg/l 20 20 15 2.5 2.5 4.6 4.6 6.2 4 6.6 5.6 5.7 5.8 5 <1.0 2.6 3.9 3.2 2.5 3.5 3.6 3.1 0.01 0.016
Nitrate mg/l N <0.7 <0.7
Nitrite mg/l N 0.5 0.1 0.375 <0.002 <0.002 <0.002 <0.002 <0.002 <0.002 0.002 0.012 0.009 <0.002 <0.004 <0.004 <0.004 <0.004 <0.004 <0.004 <0.004 <0.004 <0.004 <0.004 <0.08 <0.08
o-Phosphate mg/l P 30 <0.02 0.019 <0.010
pH 6.5 - 9.5 7.3 7.6 7.7 7.8 7.8 7.7 7.6 7.7 7.6 7.7 7.8 7.6 7.8 7.8 7.8 7.8 7.9 7.8 8.1 8.1 7.77 7.59
Phenol mg/l 0.0005 <0.002 <0.002 <0.002 <0.002 <0.002 <0.002 <0.002 <0.002 <0.002 <0.002 <0.002 <0.002 <0.002 <0.002 <0.002 <0.002 <0.002 <0.002 <0.002 <0.025 <0.50 <0.50
Potassium mg/l 5 5.92 4.67 6.33 7.88 8.64 9.18 8.89 9.4 8.91 8.6 1.4 5.4 8.3 6.7 5.9 7.1 6.9 6.5 5.64 8.63
Sampling Depth m 25.2 25.1 23.8 25.3 25 25.3 26.9 26 25.9 17.9 18.2 25.5 23.9 25.1 24.7 24.2 25.7 25.9 25.9 26.1
Selenium µg/l 10 <0.5 0.6 <0.5 <0.5 <0.5 <0.5 <0.5 <0.5 <0.5 <1 <1 1.5 <1.0 <1.0 <1.0 <1.0 <1.0 <1.0 <1.0
Silver µg/l nm nm nm
Sodium mg/l 200 150 150 31.47 25.45 34.02 39.01 43.05 44.14 42.45 42.79 43.54 41.79 41.1 16 30 42 33 30 36 36 35 30.4 25.6
Strontium µg/l 96.05 95.59 103.21 108.46 114.26 114.08 116.26 113.36 122.44 118.3 120.41 87 110 120 110 110 120 81 82
Sulphate mg/l SO4 250 200 187.5 19.7 24 23 - -
Suspended Solids mg/l - -
Temp °C 8.7 7.6 6.4 6.7 9.6 14.6 20.1 18.9 16.3 15.9 10.7 8.8 8.6 8.9 16.6 10.5 6.1 9.1 16 12.3 16.3 16.1
Thallium µg/l <0.1 <0.1 <0.1 <0.1 <0.1 0.13 0.18 0.13 0.12 <1 <1 <1.0 <1.0 <1.0 <1.0 <1.0 <1.0 <1.0 <1.0
Time sampled 11:45 11:35 11:50 11:20 11:45 11:25 12:30 11:35 12:00 12:20 13:15 11:55 10:55 11:45 11:10 11:55 11:30 12:10 12:20 11:15
Tin (µg/l ) µg/l nm nm nm
T.O.C. mg/l NAC 35.5 3.5 6.9 7.1 1.5 3.7 7.5 4.9 4.2 5.1 9.4 4.3 3.14 2.84
T.O.N mg/l N NAC 0.27 0.51 0.97 0.51 0.3 0.31 0.09 0.09 0.22 0.28 0.29 <0.20 2.4 0.64 <0.20 <0.20 0.47 <0.20 <0.20 <0.20 <0.7 <0.7
Total S Solids mg/l
Uranium µg/l 0.46 0.5 0.57 0.43 0.44 0.31 0.26 0.3 0.28 <1 <1 <1.0 <1.0 <1.0 <1.0 <1.0 <1.0 <1.0 <1.0
Vanadium µg/l 0.51 <0.5 <0.5 <0.5 0.78 <0.5 <0.5 <0.5 0.61 <1 <1 <1.0 <1.0 <1.0 <1.0 <1.0 <1.0 <1.0 <1.0
Zinc µg/l 100 2.6 26.6 5.1 4 5 2.3 4.7 61.3 2.3 16.7 2 6.1 3.2 7.4 6.3 3.2 5.6 <1.0 1.9 <0.018 <0.018
Water Level m OD 32.776 7.576 7.676 8.976 7.476 7.776 7.476 5.876 6.876 14.576 7.276 8.876 7.676 8.076 8.576 7.076 6.876 6.876 6.676
D.O. is measured in mg/l instead of % since March 2016 due to a change in laboratory for laboratory analysis.
Monitoring Point:
Drogheda Landfill Site Groundwater Quality
BH10A
For
insp
ectio
n pur
pose
s only
.
Conse
nt of
copy
right
owne
r req
uired
for a
ny ot
her u
se.
EPA Export 28-09-2016:01:56:05

Date Collected DWR IGV 2010 GW Regs 31-Jan-13 12-Feb-13 26-Mar-13 16-Apr-13 08-May-13 11-Jun-13 23-Jul-13 07-Aug-13 17-Sep-13 08-Oct-13 19-Nov-13 03-Dec-13 18-Feb-14 08-Apr-14 09-Sep-14 18-Nov-14 24-Feb-15 14-Apr-15 08-Sep-15 17-Nov-15 31-Mar-16 29-Jun-16
Alkalinity mg/l CaCO3 226 222 225
Aluminium ug/1 200 200 150 <5 17.7 <5 <5 28 <5 6.3 <5 <5 <10 <10 <10.0 <10.0 <10.0 <10.0 <10.0 <10.0 <10.0 <10.0
Ammonia mg/l N 0.23 mg/l N 0.11 mg/l N 0.175 <0.03 <0.03 <0.03 <0.03 <0.03 <0.03 <0.03 0.15 <0.03 <0.03 <0.020 <0.020 <0.020 <0.020 <0.020 <0.020 <0.020 <0.020 <0.020 0.022 <0.11 <0.11
Antimony ug/1 5 <0.5 <0.5 <0.5 <0.5 <0.5 <0.5 <0.5 <0.5 <0.5 <1 <1 <1.0 <1.0 <1.0 <1.0 <1.0 <1.0 <1.0 <1.0
Arsenic ug/0 10 7.5 <0.5 <0.5 <0.5 <0.5 <0.5 <0.5 2.45 <0.5 <0.5 <1 <1 <1.0 <1.0 <1.0 <1.0 <1.0 <1.0 <1.0 <1.0
Barium ug/1 100 41.4 42.2 39.6 36.3 40.6 36.5 65.7 31.6 31.1 27.4 31.6 41 39 36 34 42 41 31 33 0.043 0.044
Beryllium ug/2 <0.5 <0.5 <0.5 <0.5 <0.5 <0.5 <0.5 <0.5 <0.5 <1 <1 <1.0 <1.0 <1.0 <1.0 <1.0 <1.0 <1.0 <1.0
B.O.D. mg/l O2 - -
Boron µg/l 1000 1000 750 174.2 193.5 212.6 207.2 208.2 189.2 193.6 149.3 150.3 102.7 173.1 170 190 170 80 160 170 100 71
Cadmium µg/l 5 5 3.75 <0.1 <0.1 <0.1 <0.1 <0.1 <0.1 <0.1 <0.1 <0.1 <0.1 <0.1 0.03 0.03 0.04 <0.020 0.03 0.03 0.02 0.03 <0.0006 <0.0006
Calcium mg/l Ca 200 90.18 93.9 98.86 96.47 107.97 101.55 40.85 85.98 89.87 81.77 81.41 87 96 84 78 93 80 77 73
C.O.D. mg/l O2 - -
Chloride mg/l Cl 250 30 36 38 41 41 45 45 42 75 35 35 29 37 37 36 38 25 32 33 27 22 23.4 22.6
Chromium µg/l 50 30 37.5 1.6 2.5 3.2 2 1.7 2.3 <0.5 2 2.6 2.9 3.7 2.6 2.1 1.6 2.9 2.4 1.9 2.3 2.8 <0.002 <0.002
Cobalt µg/l <0.5 <0.5 <0.5 <0.5 <0.5 <0.5 <0.5 <0.5 <0.5 <1 <1 <1.0 <1.0 <1.0 <1.0 <1.0 <1.0 <1.0 <1.0
Coliform Bacteria (No/100 ml ) 0 5 172 10
Conductivity µS/cm @ 25 2500 1000 1875 849 869 896 925 942 938 892 541 833 812 744 788 804 838 776 687 736 742 681 617 686 629
Copper µg/l 2000 30 1500 1.4 2.2 0.8 1 1.5 <0.5 1.3 0.8 <0.5 <1 1 1.4 <1.0 <1.0 2.2 <1.0 <1.0 <1.0 <1.0
Cyanide mg/l 0.05 10 <0.05 <0.05 <0.05
D.O. % Saturation 45 40 37 55 53 38 55 72 38 33 45 65 8.4 8.05
E_ Coli No/100 ml 0 0 1 0
Fluoride mg/l 0.8 1000 <0.150 0.15 <0.20
Iron µg/l 200 200 16.3 31.3 <10 <10 79.4 10.2 24.7 19.2 <10 <10 <10 <10.0 <10.0 <10.0 <10.0 <10.0 12 <10.0 <10.0 <0.23 <0.23
Lead µg/l 25 10 18.75 <0.5 0.9 <0.5 <0.5 0.8 <0.5 <0.5 <0.5 <0.5 <1 <1 <1.0 <1.0 <1.0 <1.0 <1.0 <1.0 <1.0 <1.0 <0.006 <0.006
Magnesium mg/l Mg 50 27.61 28.81 31.37 32.65 30.7 32.08 9.9 29.72 27.85 28.43 28.66 29 26 27 23 26 25 24 22
Manganese µg/l 50 50 2 5.9 <1 <1 24.2 2.9 926.7 <1 <1 <5 <5 <5.0 <5.0 <5.0 <5.0 <5.0 <5.0 <5.0 <5.0 0.01 0.022
Mercury µg/l 1 1 0.75 nm nm <0.05 nm nm nm nm nm nm nm nm <0.050 <0.020
Molybdenum µg/l 35 0.6 <0.5 0.6 <0.5 <0.5 1.1 1.1 0.6 <0.5 <1 <1 <1.0 <1.0 <1.0 <1.0 <1.0 <1.0 <1.0 <1.0
Nickel µg/l 20 20 15 0.5 0.6 0.7 2.1 2.3 <0.5 6.6 0.8 1.2 <1 1.3 <1.0 1.2 <1.0 <1.0 <1.0 <1.0 <1.0 <1.0 <0.003 <0.003
Nitrate mg/l N 1.5 1.8
Nitrite mg/l N 0.5 0.1 0.375 <0.002 <0.002 <0.002 <0.002 <0.002 <0.002 <0.002 0.012 <0.002 <0.002 <0.004 <0.004 <0.004 <0.004 <0.004 <0.004 <0.004 <0.004 <0.004 <0.004 <0.08 <0.08
o-Phosphate mg/l P 30 <0.02 <0.010 <0.010
pH 6.5 - 9.5 7.3 7.5 7.4 7.6 7.5 7.5 7.5 7.7 7.5 7.5 7.5 7.5 7.5 7.5 7.5 7.6 7.5 7.6 7.7 7.6 7.73 7.52
Phenol mg/l 0.0005 <0.002 <0.002 <0.002 <0.002 <0.002 <0.002 <0.002 <0.002 <0.002 <0.002 <0.002 <0.002 <0.002 <0.002 <0.002 <0.002 <0.002 <0.002 <0.002 <0.025 <0.50 <0.50
Potassium mg/l 5 22.37 24.78 25.07 25.32 24.15 23.03 18.62 18.71 14.33 20.84 22 24 20 10 19 20 14 9.9 11 12.75
Sampling Depth m 12.4 14.2 11.1 13.9 14.7 14 16 26 15 15.8 16.3 15.1 14 14.2 18.6 18.2 14.8 14.9 15 17
Selenium µg/l 10 0.9 1.1 1.4 0.9 0.9 1.1 <0.5 1.1 1.3 <1 <1 <1.0 <1.0 <1.0 <1.0 <1.0 1 <1.0 <1.0
Silver µg/l nm nm nm
Sodium mg/l 200 150 150 27.35 30.31 33.26 32.72 36.08 32.35 42.45 26.01 26.16 20.78 30.98 29 31 29 17 28 27 19 15 18.3 17.7
Strontium µg/l 189.63 176.52 192.15 173.86 187.86 175.08 116.26 151.87 161.31 141.87 148.07 180 170 150 180 190 150 130 150
Sulphate mg/l SO4 250 200 187.5 190.2 125.6 118 - -
Suspended Solids mg/l - -
Temp °C 11.2 13.5 13 13.5 13.5 13.4 14.7 18.9 13.5 13.8 13.2 9.2 13.3 13.7 14.4 13.6 13 13.6 13.7 13 17 16.2
Thallium µg/l 0.27 0.36 0.3 0.33 0.33 0.23 0.18 0.19 0.17 <1 <1 <1.0 <1.0 <1.0 <1.0 <1.0 <1.0 <1.0 <1.0
Time sampled 12:20 13:50 14:15 12:15 13:55 13:25 13:10 11:35 14:00 13:15 13:35 13:50 13:30 12:45 13:45 12:50 12:15 12:55 15:05 11:55
Tin (µg/l ) µg/l nm nm nm
T.O.C. mg/l NAC 56.6 2.2 2.7 2.9 2.5 2.7 4.1 12.4 2.6 3.1 3.1 3 1.08 1.56
T.O.N mg/l N NAC 1.81 1.92 2.09 1.68 2.41 1.59 1.91 0.09 1.31 1.32 1.6 2.1 2.5 2.6 2.2 0.98 1.9 2.3 1.2 0.92 1.5 1.8
Total S Solids mg/l
Uranium µg/l 1.03 0.92 0.96 0.82 0.87 0.82 0.26 0.78 0.75 <1 <1 <1.0 <1.0 <1.0 <1.0 <1.0 <1.0 <1.0 <1.0
Vanadium µg/l 0.61 <0.5 <0.5 <0.5 <0.5 <0.5 <0.5 <0.5 0.5 <1 1.13 <1.0 <1.0 <1.0 <1.0 <1.0 <1.0 <1.0 <1.0
Zinc µg/l 100 7.4 6.8 3.6 2.6 7.2 3.8 4.7 7 5 17.3 6.2 6.6 17 5.4 6.4 5.9 4 3 8.8 <0.018 <0.018
Water Level m OD 21.715 9.315 7.515 10.615 7.815 7.015 7.715 5.715 6.715 5.415 6.615 7.715 7.515 3.115 3.515 6.915 6.815 6.715 4.715
D.O. is measured in mg/l instead of % since March 2016 due to a change in laboratory for laboratory analysis.
Monitoring Point:
Drogheda Landfill Site Groundwater Quality
BH11A
For
insp
ectio
n pur
pose
s only
.
Conse
nt of
copy
right
owne
r req
uired
for a
ny ot
her u
se.
EPA Export 28-09-2016:01:56:05

1600
2000
2400
2800
uS
/cm
@ 2
0
Conductivity
BH1A
BH2A
BH3A
BH4A
BH5A
BH6A
5
6
7
8
9
10
11
12
pH
un
its
Date of Sampling
pH
BH1A
BH2A
BH3A
BH4A
BH5A
BH6A
BH7A
BH8A
BH9A
BH10A
BH11A
DWR
DWR
0
400
800
1200
1600
uS
/cm
@ 2
0
Date of Sampling
BH7A
BH8A
BH9A
BH10A
BH11A
IGV
DWR
0
4
8
12
16
20
24
De
gre
e C
Date of Sampling
Temperature
BH1A
BH2A
BH3A
BH4A
BH5A
BH6A
BH7A
BH8A
BH9A
BH10A
BH11A
IGV
For
insp
ectio
n pur
pose
s only
.
Conse
nt of
copy
right
owne
r req
uired
for a
ny ot
her u
se.
EPA Export 28-09-2016:01:56:05

0
10
20
30
40
50
60
70
80
90
100
Axis
Title
TOC
BH1A
BH2A
BH3A
BH4A
BH5A
BH6A
BH7A
BH8A
BH9A
BH10A
BH11A
80
100
120
Dissolved Oxygen
BH1A
BH2A
BH3A
BH4A
BH5A
0
20
40
60
DO
%
Date of Sampling
BH6A
BH7A
BH8A
BH9A
BH10A
BH11A
0
2
4
6
8
10
mg
/l
Dissolved Oxygen mg/l
BH1A
BH2A
BH3A
BH4A
BH5A
BH6A
BH7A
BH8A
BH9A
BH10A
BH11A
Date of Sampling
For
insp
ectio
n pur
pose
s only
.
Conse
nt of
copy
right
owne
r req
uired
for a
ny ot
her u
se.
EPA Export 28-09-2016:01:56:05

0
2
4
6
8
10
12
mg
/l N
Date of Sampling
Ammoniacal Nitrogen
BH1A
BH2A
BH3A
BH4A
BH6A
BH7A
BH8A
BH9A
BH10A
BH11A
IGV
DWR
GWR
For
insp
ectio
n pur
pose
s only
.
Conse
nt of
copy
right
owne
r req
uired
for a
ny ot
her u
se.
EPA Export 28-09-2016:01:56:05

0
200
400
600
800
1000
1200
1400
1600
1800
2000
µg
/l
Date
Manganese
BH1A
BH2A
BH3A
BH4A
BH5A
BH6A
BH7A
BH8A
BH9A
BH10A
BH11A
DWR /
IGV
1500
2000
Iron
BH1A
BH2A
BH3A
BH4A
BH5A
0
0.02
0.04
0.06
0.08
mg
/l
Date
Manganese mg/l
BH1A
BH2A
BH3A
BH4A
BH5A
BH6A
BH7A
BH8A
BH9A
BH10A
BH11A
DWR /
IGV
0.25
0.3
Iron mg/l
BH1A
BH2A
BH3A
BH4A
0
500
1000
µg
/l
Date
BH6A
BH7A
BH8A
BH9A
BH10A
BH11A
DWR /
IGV
0
50
100
150
200
250
300
mg
/l
Date
Chloride
BH1A
BH2A
BH3A
BH4A
BH5A
BH6A
BH7A
BH8A
BH9A
BH10A
BH11A
IGV
DWR
GWR
0.1
0.15
0.2
mg
/l
Date
BH5A
BH6A
BH7A
BH8A
BH9A
BH10A
BH11A
For
insp
ectio
n pur
pose
s only
.
Conse
nt of
copy
right
owne
r req
uired
for a
ny ot
her u
se.
EPA Export 28-09-2016:01:56:05

0
30
60
90
120
150
mg
/l
Date
Potassium
Potassiu
m
BH1A
BH2A
BH3A
BH4A
BH5A
BH6A
BH7A
BH8A
BH9A
BH10A
BH11A
IGV
DWR
5
6
7
Cadmium
BH1A
BH2A
BH3A
BH4A
BH5A
BH6A
0.0000
Cadmium mg/l
BH1A
BH2A
BH3A
BH4A
BH5A
0
25
50
75
100
125
150
175
200
mg
/l
Date
Sodium
BH1A
BH2A
BH3A
BH4A
BH5A
BH6A
BH7A
BH8A
BH9A
BH10A
BH11A
IGV
DWR
GWR
0
1
2
3
4
µg
/l
Date
BH7A
BH8A
BH9A
BH10A
BH11A
DWR /
IGV
0.0000
mg
/l
Date
BH6A
BH7A
BH8A
BH9A
BH10A
BH11A
For
insp
ectio
n pur
pose
s only
.
Conse
nt of
copy
right
owne
r req
uired
for a
ny ot
her u
se.
EPA Export 28-09-2016:01:56:05

0
10
20
30
40
50
60
Ug
/l
Date
Chromium
BH1A
BH2A
BH3A
BH4A
BH5A
BH6A
BH7A
BH8A
BH9A
BH10A
BH11A
DWR
IGV
GWR
80
100
120
140
Nickel
BH1A
BH2A
BH3A
BH4A
BH5A
BH6A
BH7A
0.01
0.02
Nickel mg/l
BH1A
BH2A
BH3A
BH4A
BH5A
-0.01
-0.01
0.00
0.01
0.01
0.02
0.02
0.03
Ug
/l
Date
Chromium mg/l
BH1A
BH2A
BH3A
BH4A
BH5A
BH6A
BH7A
BH8A
BH9A
BH10A
BH11A
0
100
200
300
400
500
600
Ug
/l
Date
Barium
BH1A
BH2A
BH3A
BH4A
BH5A
BH6A
BH7A
BH8A
BH9A
BH10A
BH11A
DWR
IGV
0
20
40
60
µg
/l
Date
BH7A
BH8A
BH9A
BH10A
BH11A
DWR / IGV
-0.01
0
mg
/l
Date
BH6A
BH7A
BH8A
BH9A
BH10A
BH11A
0
100
200
300
400
500
600
mg
/l
Date
Barium mg/l
BH1A
BH2A
BH3A
BH4A
BH5A
BH6A
BH7A
BH8A
BH9A
BH10A
BH11A
For
insp
ectio
n pur
pose
s only
.
Conse
nt of
copy
right
owne
r req
uired
for a
ny ot
her u
se.
EPA Export 28-09-2016:01:56:05

0
25
50
75
100
125
150
175
200
225
250
Ug
/l
Date
Zinc
BH1A
BH2A
BH3A
BH4A
BH5A
BH6A
BH7A
BH8A
BH9A
BH10A
BH11A
IGV
8
10
12
TON
BH1A
BH2A
BH3A
BH4A
BH5A
0
0.05
0.1
mg
/l
Date
Zinc mg/l
BH1A
BH2A
BH3A
BH4A
BH5A
BH6A
BH7A
BH8A
BH9A
BH10A
BH11A
0
2
4
6
mg
/l
Date
BH5A
BH6A
BH7A
BH8A
BH9A
BH10A
BH11A
0.00
0.01
0.02
0.03
0.04
0.05
mg
/l
Date
Phenol
BH1A
BH2A
BH3A
BH4A
BH5A
BH6A
BH7A
BH8A
BH9A
BH10A
BH11A
DWR
For
insp
ectio
n pur
pose
s only
.
Conse
nt of
copy
right
owne
r req
uired
for a
ny ot
her u
se.
EPA Export 28-09-2016:01:56:05

0
5
10
15
20
25
30
Ug
/l
Date
Lead
BH1A
BH2A
BH3A
BH4A
BH5A
BH6A
BH7A
BH8A
BH9A
BH10A
BH11A
IGV
DWR
0.5
0.6
0.7
0.8
Nitrite
BH1A
BH2A
BH3A
BH4A
BH5A
BH6A
0.0
0.0
0.0
0.0
0.0
mg
/l
Date
Lead mg/l
BH1A
BH2A
BH3A
BH4A
BH5A
BH6A
BH7A
BH8A
BH9A
BH10A
BH11A
0
0.1
0.2
0.3
0.4
mg
/l
Date
BH7A
BH8A
BH9A
BH10A
BH11A
DWR
IGV
For
insp
ectio
n pur
pose
s only
.
Conse
nt of
copy
right
owne
r req
uired
for a
ny ot
her u
se.
EPA Export 28-09-2016:01:56:05
Related Documents