IWMI-TATA WATER POLICY RESEARCH PROGRAM International Water Management Institute ANNUAL PARTNERS’ MEET 2002 Groundwater Issues in Eastern and Western Alluvium of Ganga Basin Niranjan Pant

Welcome message from author
This document is posted to help you gain knowledge. Please leave a comment to let me know what you think about it! Share it to your friends and learn new things together.
Transcript

AN
GrW
IWMI-TATA WATER POLICYRESEARCH PROGRAM
M
NUAL PARTNERS’ MEET 2002
oundwater Issues in Eastern and estern Alluvium of Ganga Basin
International Water anagement Institute
Niran jan Pant
This is a pre-publication discussion paper prepared for the IWMI-Tata Program Annual Partners' Meet 2002. Most papers included represent work carried out under or supported by the IWMI-Tata Water Policy Research Program funded by Sir Ratan Tata Trust, Mumbai and the International Water Management Institute, Colombo. This is not a peer-reviewed paper; views contained in it are those of the author(s) and not of the International Water Management Institute or Sir Ratan Tata Trust.

GROUNDWATER ISSUES IN EASTERN AND WESTERN ALLUVIUM OF GANGA BASIN
NI R A N J A N PA N T
IWMI-TATA WATER POLICY RESEARCH PROGRAM ANNUAL PARTNERS’ MEET 2002

Contents
Abstract ____________________________________________________________ 1
Introduction ________________________________________________________ 1
Ground Water Resources of U.P ________________________________________ 3
Regional disparity____________________________________________________ 3
Ground water development ____________________________________________ 6
Agricultural productivity ______________________________________________ 7
Flooding and Water logging ___________________________________________ 9
Evolution of public policy ____________________________________________ 11
Main Features of Shallow Tube-wells___________________________________ 13
Power Scenario in U.P _______________________________________________ 16
Access of Ground Water to the Poor ____________________________________ 17
Community/ Group-Tube-wells. _______________________________________ 19
Transfer of Management of Public Tube-wells to Co-operatives and Panchayats ______________________________________________________ 20
Ground Water markets_______________________________________________ 21
Treadle Pumps _____________________________________________________ 23
Conclusions _______________________________________________________ 24
References_________________________________________________________ 25

1
Ground Water Issues in Eastern and Western Alluvium of Ganga Basin Niranjan Pant
Abstract The eastern and western regions Utter Pradesh are marked by two contrasting features. In terms of ground water resources, the eastern region is richer than the western region. While ground water development diminishes as we move from west to east. The agricultural backwardness of the eastern region arises on account of a variety of factors covered in the paper. While it is desirable that the eastern region emulates its western counterpart in all positive agricultural practices, care needs to be taken to avoid unplanned over exploitation of ground water, which has become a menace in several areas of the western region of Utter Pradesh. Introduction The Ganga basin forms the major portion of the north Indian plains and occupies an area of over 0. 557 million square km. It has flat surface, fertile alluvial soil and favourable climate. Apart from millions of ground water extraction works, there is an extensive system of irrigation canals fed by perennial rivers in the basin. The lower portion of the basin in particular, receives sufficient rainfall for wet crops. The plain forming part of the basin supports one of most dense population in the world. The total population of just three states of U.P, Bihar and West Bengal which lie in the basin, stood over 293 million in 1991. The basin contains one of the best reservoirs of ground water in the world. The area has been formed out of thick alluvial deposits, which at places extend up to a depth of 3000 meters below the ground level. A considerable portion of this alluvial thickness consists of porous and granular materials, such as sand, grave and boulders, which are good water suppliers. The enormity of ground water availability from the Ganga Basin and its utilizations can be fully appreciated by an examination of Table 1. However, before it is done, it should be understood that while the title of the paper refers to the eastern and western alluvium of Ganga Basin, the examination is confined to the eastern and western plains of Uttar Pradesh. While the basin deals with hydraulic boundaries, the regions like eastern and western parts of U.P subsume districts, which have administrative boundaries. Keeping this in mind table 1 consists of two parts. The first part of the table provides basin wise data, while the second part provides Uttar Pradesh data, including that of the two regions of the state. The data in the table clearly shows that the Ganga basin is the largest basin in India. It contains 17.17mhm/yr replenishable ground water resource, which is about 38% of such resource in India. The rest of the 17 other basins together contain 62% of replenishable ground water resource. The other important point, which emerges from table is that only about 31% of ground water resources in the Ganga basin have been developed. This gives an idea of the enormity of the ground water resources and the vast potential available for its development in the basin. However, what is important from the point of view of this paper is that whole of Uttar Pradesh constitutes a part of Ganga basin and the state contains about 47% of the basin’s replenishable ground water resources. Further, the Eastern and Western regions of U.P, which are intended to be examined in this paper, contain about 72% of

2
TABLE 1: G
round Water Potential, B
asin wise and R
egionwise (U
P) Sl.
Basin
Total replenishable G
.W
resource (m
.h.m/yr)
Provision for drinking industrial &
other uses (m
hm/yr)
Utilisable G
.W
Resources for
irrigation (mhm
/yr)
Net D
raft (m
hm/yr)
Balance G
.W. Potential
available for exploitation (m
hm/yr)
Level of G
W D
ev. (%
)
1 2
3 4
5 6
7 8
1 Indus
2.5543 0.3870
2.1673 1.7186
0.4487 79.2968
2 G
anga 17.1725
2.5824 14.59
4.4931 10.097
30.7955 3
Kutch Com
posite & Saurashtra com
posite 1.3948
0.2514 1.1434
0.4545 0.6889
39.7499
4 C
ambai C
omposite
0.7908 0.1201
0.6707 0.2026
0.4681 30.2072
5 N
armada
1.189 0.1793
1.0097 0.1552
0.0545 15.3709
6 Tapi
0.8173 0.1439
0.6734 0.1764
0.4970 26.1954
7 Subarnrekha
0.2185 0.0328
0.1857 0.0165
0.1692 8.8853
8 Brahm
ani with
0.5879 0.0882
0.4997 0.0258
0.4739 5.1631
Baitarni
9 M
ahanadi 2.1293
0.3194 1.0099
0.0782 1.7317
4.3207 10 N
orth East Com
posite 2.2788
0.3418 1.9370
0.2621 1.6749
13.5312 11 G
odavari 4.6762
0.7342 3.9420
0.5907 3.3513
14.9848 12 krishna
2.6646 0.4342
2.2304 0.6493
1.5811 29.1114
13 Pennar 0.5047
0.0757 0.4290
0.1355 0.2935
31.5851 14 M
adras Com
posite 2.0907
0.3137 1.7770
0.8165 0.9605
45.9482
& Tamilnadu com
posite
15 C
auvery 1.3598
0.2041 1.1557
0.5168 0.6389
44.7175 16 W
estern Ghat
1.8289 0.2858
1.5431 0.3027
1.2404 19.6164
com
posite
17 Brahm
aputra 2.7857
0.4179 2.3678
0.0503 2.3175
2.1243 18 M
eghna 0.1795
0.0269 0.1526
0.0049 0.1477
3.211
Total 45.2233
6.9388 38.2845
10.649727.6348
27.8173
UP
8.045 1.207
6.838 2.494
4.344 36.48
Eastern U
P 2.976
0.446 2.529
0.857 1.672
36.66
Western U
P 2.779
0.417 2.363
1.074 1.288
48.06
Total 5.755
0.863 4.892
1.931 2.96
NA
Source: BHU
-JAL January- March 1991 ( Special Issue on G
round Water Statistics), p- 94& 98-99

3
the state’s replenishable ground water resources and about 34% of that the Ganga basin. This means that although our examination does not deal with the whole of the eastern and western alluvium of Ganga basin, it does cover a considerable portion of two parts (upper /western and eastern / lower) of the basin. Although the level of ground water development in Uttar Pradesh and more particularly in its western part is higher compared to the basin as a whole, there is tremendous scope for its development in its eastern part. The data also affirms that the level of ground water development is most impressive in Uttar Pradesh and more particularly in its western part. Ground Water Resources of U.P The state of U.P has a total geographical area of 29.4 million ha comprising of seven hydrological regimes. Bhabar, Tarai, Himalaya, Central and East Gangetic alluvial plains, Bundelkhand and Vindhyan regions. The alluvial plain areas cover about 21. 24 million ha. having fertile soils and voluminous ground water resource. The net sown area of the state is 17. 48 million ha with cropping intensity of 148.7 %. An area of about 367 thousand ha is estimated as wetlands. The critical and semi critical waterlogged areas stood at 5.39 and 4.06 millions ha respectively in October 1996 in 49 districts of the state. The available water resources of the state are enormous with irrigation prospects. The available surface water for irrigation is estimated at about 9. 86 mhm with an ultimate irrigation potential of 15.95 mhm. The annual replenishable ground water is presently estimated to be 7.16 mhm with an ultimate irrigation potential of 15.03 mhm. In addition to this utilizable static ground water, there is further scope to utilize an additional ground water of about 7.45 mhm between water levels of 5-10 meters with an additional ultimate ground water potential of 15. 69 mhm. This means in U. P the available water for irrigation is about 24. 27 mhm (consisting of 14.61 mhm ground water and 9.86 mhm surface water). As regards ultimate irrigation potential, it is estimated to be 46.67mhm with 30. 72 mhm in respect of ground water and 15. 95mhm in respect of surface water (Rai et al 2000). This clearly means that there is tremendous scope for the utilization of ground water resources in the state. Regional disparity The state of Uttar Pradesh1 like most of the large states of India presents a picture of disparities in term of agro climatic features and resource endowments. It is divided into 3 broad regions containing 83 districts. The hilly region of the north comprises of 12 districts. High mountains formed of sedimentary rocks broken by valleys and deep gorges characterize the terrain. The hill areas are sparsely populated and communication is difficult. Further, many are in accessible. The Gangetic plain consist of 64 districts. The plain stretches across the entire length of the state from west to east, flanked by Terai and Bhabar 2 areas in the north and Vindhyas plateau in the south.
1 In this paper U.P. includes Uttaranchal, which is a separate state now. This has been done because most of the data used in the paper for U.P. includes Uttaranchal. 2 Bhabar denotes a gravel talus with somewhat steep slope fringing the outer margins of the hills everywhere.

4
Table-2: Indicators of Development in the Eastern and Western Alluviums of Uttar Pradesh
Sl. Particulars Western Eastern U.P 1 General
1.1 Population in Million (1991) 49.5 52.7 139.1 1.2 Geographical area in sq.km.(1991) 82192 85844 29441111.3 Density of population- per km (1991) 603 614 473 1.4 Percent of urban population to total population (1991) 26.3 11.6 19.8 1.5 Percent of literacy (1991) 42 38.5 41.6 1.6 Percent of Schedule castes (1991) 31.5 37.3 100 1.7 Average Monsoon rain fall (in mm) 765.7 891.3 N.A. 2 Infrastructure
2.1 Percapita electricity consumption (kwh-1997-98) 206.2 109.3 163.1 2.2 Percent of electrified villages (kwh-1998-99) 87 76.4 78.5 2.3 Post Officer per lakh population (1994-95) 11.1 13 13.5 2.4 Telegraph officer per lakh population (1995-96) 3.3 2.3 3.3 2.5 Telephone per lakh population (1995-96) 705 282 538 2.6 Length of metalled road under PWD per 1ooo sq km (1994-95) 326.2 308.7 288.0 3 Credit Facilities
3.1 Credit deposit ratio (June 1996) 38.6 28.2 32.9 3.2 Scheduled Commercial Banks per lakh population (95-96) 5.7 5.00 5.8 3.3 Co-operative agri. marketing centres per lakh Population(94-95) 4 1.4 2.6 3.4 Co-operative marketing societies per lakh pop. (94-95) 0.19 0.13 0.18 3.5 Joint agricultural Co-operative societies (1994-95) 1.1 0.6 0.9 4 Agriculture Related
4.1 Percent of marginal holdings (> 1 ha., 1990-91) 66.1 82.3 73.8 4.2 Average size of marginal holding (.1ha. 1990-91) 0.41 0.35 0.38 4.3 Percent of farmers against main workers (1990-91) 47.9 54.8 53.3 4.4 Percent of agricultural labours against main workers (90-91) 18.5 22.5 18.9 4.5 Consumption of electricity in Ag. As % of total con, 1997-98) 51.0 46.3 41.5 4.6 Cultivable area as% of reported area (1994-95) 82.7 77.0 70.9 4.7 Net cultivated area as% of cultivable area (1997-98) 90.6 86.0 83.3 4.8 Net irrigated area as% of net cropped area (94-95) 85.1 61.8 67.4 4.9 % of area irrigated by State tubewells (94-95) 4.2 11.2 6.6
4.10 % of area irrigated by Pvt. tubewells (94-95) 67.4 56.2 57.7 4.11 % of balance GW to total safe yield (96-97) 54.0 64.0 60.0 4.12 Cropping intensity (1997-98) 156.2 150.3 148.7 4.13 Commercial crop area as % of gross cropped area (94-95) 32.7 10.8 20.6 4.14 % of kharif area affected by floods (1997-98) 3.4 11.6 7.6 4.15 Availability of tractor per gross cropped area (in ha. 97-98) 34.4 77.4 49.7 4.16 Distribution of fertilizer per ha gross cropped area (in ha.97-98) 145.2 117.3 117.4 4.17 Value of Agr. Produce per ha on current prices (93-94) 14164 11029 11941 4.18 Productivity of food grains (q/ha 97-98) 25.2 19.4 20.3 4.19 Productivity of wheat (q/ha 97-98) 29.8 22.8 24.9 4.2 Productivity of Rice (q/ha 97-98) 25.1 20.3 21.4
4.21 Productivity of potatoes (q/ha. 97-98) 168.3 126.7 146.7 4.22 Productivity of oil seeds (q/ha 97-98) 6.7 5.2 6.1 4.23 Productivity of sugar cane (q/ha 97-98) 654.3 516.8 610.8 4.24 Gross value of Agr. Produce per rural person on current prices (93-94) 3568 1883 2614 4.25 Income from primary sector as % of net domestic out put (96-97) 74.8 74.3 15.8 Note: UP includes Uttranchal Source: GO UP, 2002 and Districtwise Indicators of Development, Economics and Statistic Division, State Planning Institue, UP. 1966
5
The entire alluvial plain is divided into three-sub regions- western (27districts), central (10districts) and eastern (27districts). The Gangetic plain is watered by rivers Yamuna, Ganga, and its major tributaries Ramganga, Gomti, Ghagra, and Gandale. The whole plain is alluvial and very fertile. The southern region is demarked by Vindhya hills and the plateau. It is called Bundelkhand and comprises of 7 districts. The tract is marked by scanty and erratic rainfall and scarce water resources. It has been mentioned by us that the eastern and western parts of the Gangetic plain are most important in terms of ground water resource endowments not only in U.P but also in the whole of the Ganga basin. However, in terms of ground water development, there is lot of variations in the two regions (see table 1) Although eastern and western region form part of the same Gangetic plain, the two regions present a picture of contrast. The eastern tract is flood prone with periodic occurrences of droughts and is least developed. The western tract although receives much less rainfall is assisted by old canal networks and high development of ground water resource. According to some, this kind of disparity is on account of historical antecedents. During the British period, nearly all the agricultural developments in the state took place in the western U. P. A major development was the construction of a network of canal system which reduced the element of risk in agriculture and gave farmers incentives to experiment with the new techniques and crops with new farm related industries. Farmers of the eastern U.P on the other hand with their high density of population resulting in high pressure on land and complete dependence on natural forces for agriculture, were not in a position to take risk and experiment in ways that if they failed, could threaten their very existence ( Singh 1976) In an effort to find out the extent of disparity between the two regions, we have put all the indicators of development in table 2, containing data in respect of two regions and the state as a whole. All the indicators have been clubbed under, four headings dealing with general features, infrastructure facilities, credit facilities and agriculture related development. The first striking point, which emerges from the data, is that two regions together constitute the most important segment of the state. The two regions together contain 73% of the population, 57% of the state’s geographical area and 72% (table1) of state’s replenishable ground water resource. Although the two regions contain the same number of 27 districts each, the eastern region is larger in terms of population as well as in area than its western part. Eastern region has greater density of population, greater percentage of scheduled castes and higher monsoon rainfall. Western part on the other hand has higher rate of literacy and urbanization, greater per capita consumption of electricity, higher proportion of electrified villages, higher proportion of telegraph offices, telephones and higher length of metalled roads. It is obvious from this examination that eastern region lags behind the western region in respect of all the indicators of development but is ahead in respect of indicators, which lead to backwardness. In respect of credit facilities, it is found that western region is more favorably disposed in comparison to the eastern tract. Western region forges ahead in all respects, such as credit deposit ratio, number of banks cooperative agricultural marketing centers and cooperative societies etc.

6
The forth and the largest section of the table deals with agriculture related indicators. Here also the same trend continues which was found to be in respect of first three sections. Eastern U.P lags behind western U.P in respect of all such indicators which are positively related to modern / advance agriculture. On the other hand, the region is ahead of the western region in respect of indicators which hinder modern / advance agriculture. An important point, which emerges on the basis of the table, is that the eastern region not only lags behind western region but is also behind the state as a whole. In all, 43 indicators have been used in the table and only in respect of one indicator, i.e. number of post offices (2.3) eastern U.P scores higher than western U.P. Here also, it is possible that the post offices are established keeping in mind population norms. In all other respects, the eastern region lags behind the western region. In comparison to the state as a whole in respect of first 18 indicators, only in case of length of metalled roads, eastern region’s position is better than U.P as a whole. However, in agriculture related indicators, eastern region’s position is better than the state as a whole and in respect of 9 indicators out of 25 indicators. On the basis of table 2, the picture that emerges presents the eastern region in very poor light. It is a region, which abounds with small and poor farmers with a preponderance of marginal holdings and socially and economically backward area. A large part of the area is affected by floods. In the absence of adequate credit facilities, the resource base of farmers remains poor and small area is covered with commercial crops. This is further aggravated by lower cropping intensity and low fields of crops, which ultimately leads to reduction of gross value of agriculture produce. Ground water development As early as in late 1970’s, Dhawan had highlighted the wide differences in the agricultural development of eastern and western U.P on account of extent of ground water irrigation in two regions. On further examination, he found that tube well irrigation in the alluvial Gangetic plains diminishes in force as one moves from west to east (including Bihar and Bengal). This downward trend according to him coincides with a like pattern in the matter of agricultural growth. The downward trend as we move from west to east in the Gangetic plain is on account of several factors such as progress in land consolidation, spread of rural electrification, institutional support and finance (Dhawan 1982). Under exploitation of available ground water in Eastern U.P is regarded as the main cause of this region’s agricultural backwardness. Even today it utilizes only 36% of its available ground water resource. It is pointed out that excepting parts of the erstwhile Mirzapur district, the rest of the region, have large groundwater resources. It is felt that if the same are exploited intensively in a planned manner, they can help improve crop intensity, promote crop diversification and increase productivity of crops. Therefore, exploitation of ground water is given highest priority (RBI 1984). A general impression that still prevails among the policy makers and researchers is that the development of ground water is quite slow in Eastern U.P. Table 3 discounts this kind of thinking. No doubt Eastern U.P lags behind Western U.P in the development of ground water as it utilizes only 36% of ground water resource compared to western region’s 46% utilization. However, the pace of development has been more rapid in the east compared to the west. Data in table 3 reveals that in 1964 –65 in Eastern U.P only about 11% area was irrigated by tube wells which went up to about 62% in 1983-84 and about 73% in 1999-2000. As against this in case of

7
Western U.P, the tube well irrigated area in 1964-65 was about 20% and went up to 62% in 1983-84 and about 79% in 1999-2000. This means the pace of ground water development was heavily in favor of Western U.P in the mid 1960’s but Eastern U.P matched Western U.P by mid 1980’s. This means that growth of ground water in Eastern U.P is faster until mid 1980’s. No doubt presently the pace of development is marginally in favor of Western U.P. Agricultural productivity It is interesting to note that the pace of ground water development has affected the productivity of main crops of rice and wheat to a great extent during this period in the eastern region. In 1964-65, the productivity of rice was 7.97 ql / ha in the west and 7. 16 ql / ha in the east. In 1983-84, the same was 14.61 ql / ha in the west. In 1997-98, the productivity of rice went up to 25. 1 ql / ha for west and 20.3 ql / ha for the east. In respect of wheat, the productivity in 1964-65 was 9.26 ql / ha for west and 7.31 ql / ha for the east. It went up to 21.55 ql / ha for the west and 15. 94 ql / ha for the east. In 1983-84, again it went up to 29.8 ql / ha for the west and 22.8 ql / ha for the east. An interesting trend emerges on the basis of this data. In 1964-65, the productivity of Western U.P was marginally higher compared to Eastern U.P. A dramatic change, however, is noticed in 1983-84. In 1983-84, western region registers a tremendous growth in the two crops, more particularly, in case of wheat. While incase of Eastern region, although there are marginal gains in the productivity of rice, even wheat productivity has doubled here. But what is important is that large variations in productivity of two crop occurred in the two regions in 1983-84. This is in spite of the fact that during this period ground water utilization in eastern region had reached at par with the western region.

8
Table-3: Source wise Irrigated area (in thousand ha)
Eastern W
estern State
Sl. Source
64-65 83-84
99-2000 64-65
83-84 99-2000
64-65 83-84
99-2000
1 Canals
303 856
1025 1149
1267 721
2225 3330
2988
%
14.56
27.79 24.95
49.51 27.57
14.74 40.53
33.71 23.97
2 Tubewells
225 1899
2980 467
2839 3885
715 5467
8700
%
10.81
61.66 72.52
20.12 61.77
79.42 13.06
55.34 69.77
3 Others
1553 325
104 705
490 286
2548 1082
781
%
74.63
10.55 2.53
30.37 10.66
5.84 46.41
10.95 6.26
4 Net Irrigated area
2081 3080
4109 2321
4596 4892
5490 9879
12469
%
100.00
100.00 100.00
100.00 100.00
100.00 100.00
100.00 100.00
Note: Adapted from
: A study of agricultural development in Eastern U
P Director Agricultural Statistics and
C
rop Insurance UP Lucknow
, Publication No.112 Sept. 1986, page 8 and D
irectorate of agriculture, UP Lucknow
, Decem
ber-2000

9
Another interesting feature is noticeable in 1997-98. During this period, the productivity of rice in the eastern region has doubled in comparison to rice productivity in 1983-84. In respect of wheat, productivity is doubled in 1983-84 and trebled in 1997-98. This means that productivity gains are maximum in respect of both the crops in eastern region in 1997- 98 In fact the field level data collected by us during our reconnaissance visits in Jaunpur and Moradabad districts during October- November 2001 indicates a much higher productivity. However, it should be noted that the village in Jaunpur and the village in Moradabad represent agriculturally most advanced villages. In case of Jaunpur (Eastern U.P), the village was Chakra in Dhobi block. It was a high caste (Thakur) dominated village. Irrigation in the village was done mainly by private shallow tube wells, which were 40 in number and all were electrical. Most of them were of 5 hp. The availability of power in the village was reported to be 12-18 hours per day, which is quite exceptional in the eastern region. Water charges on sale of water were around Rs. 10 per hour. The ground water level in the village was around 10 ft (post monsoon). The village from Moradabad was Singhpur Saini, forming part of the Sambhal block, which remains to be a dark block of the district. It was a Jat dominated village. The enormity of ground water utilization can be gauged by the fact that there are 500 electric and 200 diesel pump sets in the village. Although electricity was available for 10-15 hours per day, farmers kept pump sets as an insurance against electricity failure. The water level in the village was reported to be 4o-45 feet (post monsoon). Sale of ground water by tube well was Rs. 40-45 per hour, while it was Rs. 20 per hour for electric tube well. The productivity of important crops in the two villages was reported to be as follows. Crops Productivity ql / ha Jaunpur Moradabad (Chakra) (Singhapur Saini) 1. Rice 35 –40 25 – 30 2.Wheat 40 – 45 30 – 35 3.Sugarcane 750 – 800 700 – 750 4. Potato 250 – 300 N.A 5. Gram / Peas / Pigeon pee 25 – 30 N.A Although the above data is not indicative of the general productivity levels in Eastern U.P, it does show that there are areas in the Eastern U.P where productivity is as high as anywhere in the western U.P Flooding and Water logging Frequent occurrence of floods is a common feature of the eastern region. According to 1997 – 98 estimates, while 11.6% kharif area in the eastern region is affected by floods, only 3.4% of the kharif area is affected by floods in the western region (table 2,item 4.14). The east west differences are most conspicuous if we examine the data for the districts of Jaunpur and Moradabad. While Jaunpur contains 56183 ha of area, which is flood prone, there is no such area in Moradabad (GOUP 1999). Ghagra,

10
Rapti and Gandak are notoriously flood-creating rivers. Even smaller rivers like Rohni, Burhi, Rapti, Arni, Kuwano, Gurra, Tons, Kunhra, Ghongi, Burhi Gandak deluge in flooding the region. It is estimated that Rapti alone inundates 350,000 ha of area every year in Bahraich, Gonda, Basti, Siddhartha Nagar and Deoria districts (Shah. 2001) The problem in the eastern region has been further enhanced due to unplanned and haphazard use of water resources in the state. As a result, large areas suffer from miseries of rising water table. It would not be out of context to mention a field visit the author had carried out fifteen years ago with Tushar Shah and Robert Chambers through the commands of Sharda Sahayak and Gandak. We had moved by road from Lucknow to Deoria via Barabanki, Gonda and Gorakhpur. After the visit Robert Chambers had circulated a note, and his comments in respect of water logging remain relevant even today after a lapse of 15 years. He had written, “All canals we saw on Sharda Sahayak and also on Gandak were running full, although it had recently rained and it is doubtfull whether anyone was taking water. One wonders whether there is any attempt at all to throttle back on water deliveries. It seems crazy to send more water into these areas when they are already in such trouble. There are difficulties over travel time, but I would have thought long term weather fore castes could enable managers, without any one losing, to reduce flows at times like that of our visit”(Chambers 1987) The magnitude of water logging can be gauged if the following figures recently worked out by the State Ground Water Investigation Department are taken into consideration. These figures are based on the data collected from 3173 hydrograph monitoring stations, which have been set up by the GOUP. The waterlogged area has been divided in two groups. The one is “critical area” which refers to the areas where ground water level is between 0 to 2 meters. The other is “semi critical” area, which relates to the areas where ground water level is between 2 to 3 meters. U.P west east Critical area in thousand ha. 4803 1090 2360 Percentage of such area against the reporting area in thousand ha. 23. 89 13. 50 31. 45 Semi critical area in thousand ha. 3911 1188 1731 Percentage of such area as against reporting area 19. 45 14. 71 23. 07 Critical and semi critical area in thousand ha. 8714 2278 4091 Percentage of such area against reporting area. 43. 34 28. 21 54. 52 Reporting area (in thousand ha) 20107 8077 7502

11
Although the preceding data sets alarm bells for the Western U.P also, the villages visited by us in the districts of Jaunpur and Moradabad showed a picture in contrast. While in Jaunpur, we witnessed a number of villages with accumulated water, in Moradabad a number of villages had very deep ground water table. In Moradabad 16 out of 19 blocks were critical, semi critical or over exploited. In Jaunpur only 2 out of 20 blocks were having critical water levels. The growing menace of water logging in the eastern region is mainly on account of impeded drainage caused by historical antecedents, high ground water recharge and frequent flooding. One more reason that came to our notice during the recent field visits (October- November 2001) was the construction of rural roads under MPLADS and MLALADS by departments and organizations which do not have the full technical know how 3 In the absence of the close scrutiny of the quality of work, lack of resources and absence of technical expertise no attention is being paid to drainage. In some cases even the existing drainage passages are being blocked to meet the district level targets. Evolution of public policy Tube well technology got it’s first shot as a public funded programme in the early1930s when two public tube wells were installed in Moradabad district. At the beginning of the first five-year plan, the number of state tube wells stood at 2000.By the end of first five-year plan, another 3000 state tube wells were added (GOUP 1971). In the wake of developmental planning, tube well indivisibility witnessed substantial reduction, which induced many farmers to invest in their own tube wells. This inducement was reinforced by the advent HYV seeds and progress in land consolidation, rural electrification, institutional credit etc. However, public policy for a long time continued to encourage state owned tube wells for the rural poor. During the 1980s new design public tube wells were devised with intended beneficiary participation in the operation, water distribution and maintenance of tube well system. However, the performance of such tube wells was found to be far below the expectations. The poor performance of such tube wells had been on both technical and organizational grounds (Pant 1993). In respect of private tube well, the growth was stupendous and the stock of private tube- well rose in U.P from about 3 thousand in 1951 to 600 thousand in 1977 (Dhawan 1982). By mid 1970s, tube-well irrigation had overtaken canal irrigation, which was the dominant mode of irrigation earlier to that. The rapid growth of private tube-wells had its repercussions on the power point. Historically, as the ground water development was building up in the state, the demand on the power was not significant since there was surplus power available in most areas until the 1970s. However, after that and in early 1980s, the large-scale ground water development in the private sector had led to a situation where the rural demand for electricity always exceeded power availability. It was around this time, power generation and transmission capacity became the constraint to the rate at which electrical connection to tube-well points could be made. In table 4 we are able to put together data from 1980 onwards in respect of various modes of ground water extraction prevalent in the two regions of U.P. Looking at the table, it is found that the traditional modes of
3 Under the schemes members of the Parliament and the State Legislature are allocated Rs. 2 crore and Rs. 50 lakhs respectively for the development of the areas they represent. In U.P most of the money coming from these sources is being spent on the construction of roads under the overall supervision of the district administration.
12
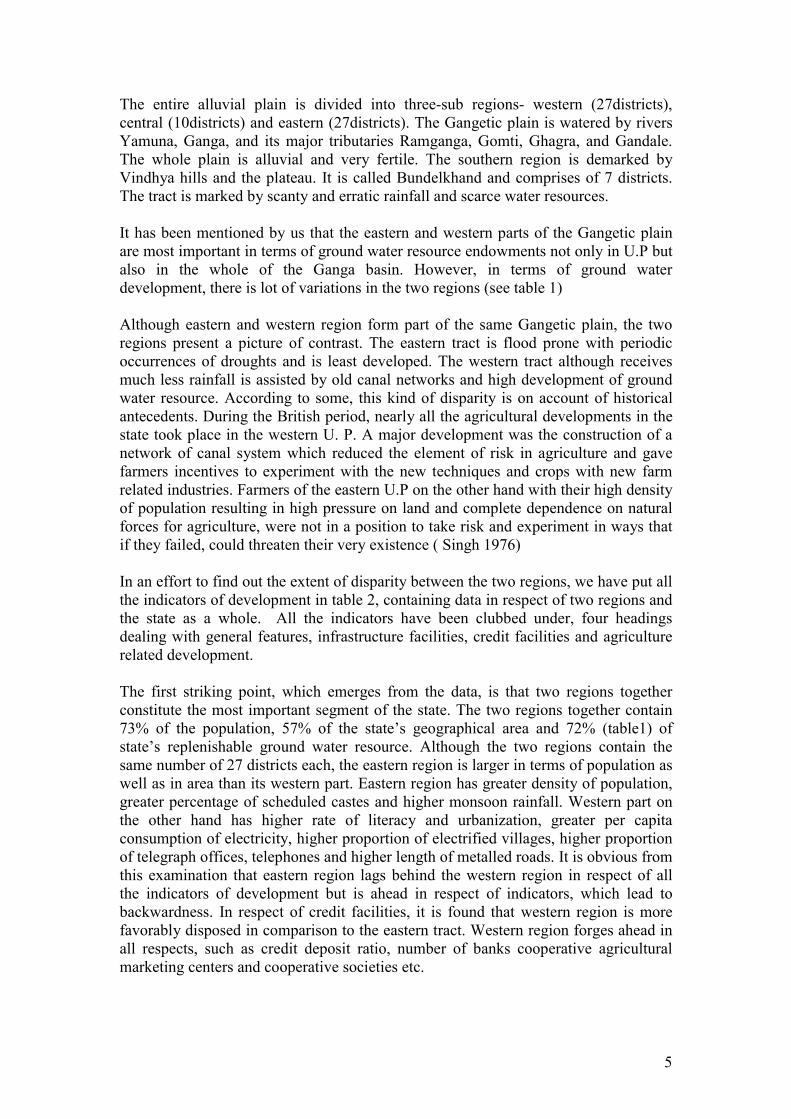
ground water irrigation, i.e. dug-wells and Persian wheels seemed to be quite popular in both the regions until mid 1980s. In fact, in case of dug-wells the decline had started by mid 1980s. In respect of Persian wheel, the popularity had continued even during 1980s. Between the two regions, dug-well seemed to be more popular in the eastern region compared to the western region. Persian wheel seemed to be equally popular in the two regions although marginally more popular in the western region.
Table –4: No. of Ground Water Works in Eastern & Western Alluvium
At the end of year
Dugwell Persian Wheel Diesel Pumping set Electric Tubewell
East West. UP East West. UP East West. UP East West. UP
1979-80 271151 (53.60) 258583 (46.64)
679443 (46.14)
15338 (41.06)
179410 (41.65)
239671 (36.36)
128954 (16.30)
317028 (11.73)
581998 (9.38)
183083 (24.94)
217432 (21.17)
465969 (23.08)
1984-85 228655 (45.20) 222371 (40.11)
586119 (39.80)
15500 (41.11)
179786 (41.74)
245022 (37.18)
258727 (12.61)
526343 (19.46)
1030488 (16.61)
285902 (38.95)
290068 (28.24)
674753 (33.43)
1993-94 N.A N.A N.A N.A N.A N.A 525389 (25.61)
710862 (26.29)
1624923 (26.20)
81431 (11.09)
194027 (18.89)
306978 (15.21)
1998-99 6110 (11.20) 73430 (13.25)
207042 (14.06)
50147 (17.85)
71540 (16.61)
174371 (26.46)
1138065 (55.48)
1149837 (42.52)
2965357 (47.81)
183623 (25.02)
325743 (31.71)
570748 (28.28)
Total 505916 554384 1472604 280985 430736 659064 2051135 2704070 6202766 734039 1027270 2018448
(100.00) (100.00) (100.00) (100.00) (100.00) (100.00) (100.00) (100.00) (100.00) (100.00) (100.00) (100.00), Source: Updated Minor Irrigation Censuses GOUP
In respect of diesel pump-sets, it is found that there is a progressive increase in their numbers in the two regions. But the growth of diesel pump tube-wells is more pronounced after the mid 1980s in case of the eastern region. In fact, after 1993, the growth of diesel pumping sets is higher in the Eastern U.P in comparison to the Western region. The reverse is noticed, however, in case of electric tube-wells. Here, up to 1984-85, the growth is greater in Eastern U.P while after that period; growth is higher in Western U.P. However, what is noteworthy, there is a decline in the growth of electric tube-wells between mid 1980s and mid 1990s in both the regions and the decline is more severe in case of eastern region. However, there is a growth again after the mid 1990s and the growth is higher for the eastern region. The total number of pump-sets (both E&D) is always higher in the western region compared to the eastern region. However, the proportion of increase goes on declining over the years. While in 1980, the proportion of the total pumps (in the two regions) was 63% for the western region, the same declined by 52% in 1998-99. The proportion of diesel pumps in relation to electric pumps was always higher in the western region and the proportion went on increasing from 59. 3 % in 1980 to 64. 5% in 1985 and then 78. 6% in 1994 after which it registers a marginal decline of 0. 7%. In case of eastern region, the picture is quite different. Here, the proportion of electric pumps was more than diesel in 1980 and 1985 where their proportion was 58.7% and 52.5% respectively. Here a dramatic decline in the number of electric tube-wells occurs between mid 1980s and mid 1990s when the proportion of electric pumps

13
decline to 13.4%. During the same period, diesel pumps record an overwhelming increase from 41.3% to 86.6%. After the mid 1990s and till 1998-99, like the western region, the eastern region also records a marginal decline of 0.5%. The inevitable conclusion the data provides is that the power position in Eastern U.P deteriorated very fast between mid 1980s and mid 1990 when many villagers in Eastern U.P discarded their electric tube-wells. The author had witnessed this phenomenon when he conducted two surveys in the Eastern U.P in 1989 and 1990. In fact, during the first survey, the author had found the actual availability of electricity for the World Banks tube-wells to be 8. 6 hours per day for Basti and 9.5 hours per day for Deoria. This is despite the fact that these tube-wells were connected with a dedicated power supply which was to provide them an average guaranteed electricity of 18 hours per day (Pant 1989). Another significant point emerging from the data is that power situation has improved in both the regions between 1994 and 1999 as during this period, the decline of electric tube-well is checked and in fact marginal increase in the growth of electric tube-wells is noticed in both the regions. The validity of this conclusion needs to be checked at the field level. The field level data collected by us from 10 villages (6 from Jaunpur and 4 from Moradabad) during the reconnaissance in October – November 2001 shows that in Moradabad (west) about 65% pump-sets were electrical and the remaining 35% were diesel. One common feature here was that a large proportion of farmers kept diesel pump-sets as an insurance against the failure of electricity. On the contrary, in Jaunpur (east), if we leave Chakra village, over 95% of pump-sets were electrical. Main Features of Shallow Tube-wells Table 5 presents the main features of Shallow tube-wells in two regions. The data has been derived from the updated census of 1993-94 carried out by the Minor Irrigation Department of Uttar Pradesh. The first two items dealing with the socio-economic base of the owners are most important from the view -point of access of ground water to the rural poor. In respect of the holding size of owners, it is found that 56% owners in the east and about 36% owners in the west are marginal farmers. If we add small holders also (up to 2 ha), it is found that 85% of such farmers in the east and 69% in west own these Shallow tube-wells. It is understandable that a higher proportion of marginal and small farmers would own such shallow tube-wells as holding size in the east are quite small. However, these findings are different from what we had found during our survey of villages in Bahraich, Faizabad and Basti. In three districts together, we had found 25% of marginal farmers owned shallow tube-wells and together with small farmers, about 57% farmers owned such own such shallow-wells. As per our survey, there were 43% farmers above 2 ha who owned such shallow –wells, against 15% as per Minor Irrigation Department survey (Pant 1992). In terms of caste, it is found that almost similar trends prevail in the two regions.

14
Table 5 Important features of shallow Tubewells/Pumpsets:
Sl. Ownership by Land East West East+West UP
1 Holding size 1.1 Marginal(0-1 ha) 374670 305165 679835 862395 (%) 56.3 33.5 43.0 43.53
1.2 Small (1-2 ha) 189301 326508 515809 643856 (%) 28.4 35.8 32.7 32.50
1.3 Medium (2-10 ha) 95087 268806 363893 440148 (%) 14.2 29.5 23.1 22.21
1.4 Big (above 2 ha) 7109 11648 18757 34738 (%) 1.1 1.2 1.2 1.76
1.5 All size owner 666167 912127 1578294 1981137 (%) 100.0 100.0 100.0 100.0 2 Ownership by caste
2.1 Schedule caste 69499 100880 170379 261511 (%) 10.12 11.06 10.66 13.20
2.2 Scheduled Tribe 8718 11408 20186 29840 (%) 1.27 1.26 1.26 1.51
2.3 Others 608734 799779 1408513 1689786 (%) 88.61 87.68 88.08 85.29
2.4 All Casts 686951 912117 1599078 1981137 (%) 100.00 100.00 100.00 100.00 3 Shallow TWs by source of Finance
3.1 Govt. Fund 21205 49007 70212 95004 (%) 3.28 0.54 4.5 4.79
3.2 Farmer's saving 219291 567162 786453 988372 (%) 33.96 62.18 50.48 49.88
3.3 Loan & saving 87974 149822 237796 293120 (%) 13.62 16.42 15.26 14.79
3.4 Subsidy and Bank loan 309892 137519 447411 580439 (%) 47.99 15.07 28.72 29.29
3.5 Subsidy only 5239 6680 11919 16968 (%) 0.81 0.73 0.77 0.86
3.6 Other's 2168 2004 4172 7712 (%) 0.34 0.22 0.27 0.39
3.7 All Sources 645769 912194 1557963 1981615 (%) 100.00 100.00 100.00 100.00 Shallow TWs by horse power of lifting devices
4.1 (0 to 2 hp) 3053 4367 7420 1105 (%) 0.47 0.47 0.47 0.56
4.2 (2 to 4 hp) 10400 1468 11868 14289 (%) 1.61 0.16 0.75 0.72
4.3 (4 to 6 hp) 79869 120623 200492 228265 (%) 12.36 12.90 12.68 11.51
4.4 (6 to 8 hp) 445757 570200 1015957 1286966 (%) 69.01 60.99 64.26 64.92
4.5 (8 to 10 hp) 86870 220047 306817 401451 (%) 13.45 23.54 19.41 20.25
4.6 (Above 10 hp) 19916 16743 36659 38679

15
(%) 3.08 1.78 2.32 1.95 4.7 Unspecified 161 1492 1653 1859 (%) 0.02 0.16 0.11 0.09
4.8 All STW 646026 934940 1580966 1982566 (%) 100.00 100.00 100.00 100.00 5 Shallow TWs by Ownership
5.1 Govt. owned 265 230 493 951 (%) 0.04 0.02 0.03 0.04
5.2 Coop.Societies Owned 46 35 81 102 (%) - - - -
5.3 Panchayat owned 25 24 49 310 (%) - - - -
5.4 Group owned 1535 5552 7087 7777 (%) 0.24 0.61 0.45 0.39
5.5 Others 9 26 35 66 (%) - - - -
5.6 Individual farmers owned 644142 906513 1550655 1973369 (%) 99.71 99.36 99.50 99.55
5.7 All types 646022 912380 1558400 1982266 (%) 100.00 100.00 100.00 100.00 Source: Updated Minor Irrigation census (1993-94), GOUP Note: Percentage in bold letters UP excludes the hill districts of Uttaranchal While in the east, about 11% of SC& ST own shallow-wells, in the west, their proportion goes to 12%. This revelation is particularly significant, if it is kept in mind that the percentage of SCs and STs is higher in the east compared to the west. Major differences are noticed in the eastern and western region when the source of finance for the Shallow tube-well is examined. In the eastern region, the most important source of finance is subsidy and bank loan, which is availed by about 48% owners. In the western region, the most important source of funding is farmer’s savings as about 62% of farmers use their savings to buy the pumping-set. The second most important source of funding in the eastern region is farmer’s savings and about 34% of farmers resort to it, while in the west, the second most important source of funding is loans and savings and about 16% of farmers resort to it. The third most important source of funding in the eastern region is loan and saving and about 14% owners resort to this source. As against this, the third most important source of funding in the western region is subsidy and bank loan and about 15% owners resort to this source. The comparative picture that emerges from this data is that, while the majority of farmers in the western region have a sound resource base, their majority counterpart in the eastern region resort to debts and subsidies to own the pump. In terms of pumpage of water, it is found that 6 to 8 hp pumps are most favored in both the regions. In Eastern U.P, their percentage is 69, while in the western part they constitute 61% of total pumps. It is this range of pumps, which can be used for both diesel and electricity and can be utilized for allied agricultural operations. In terms of ownership of shallow tube-wells, it is found that more than 99% of such wells, are owned by individual farmers and only less than 1% are owned by government, panchayats, co-operative societies etc.

16
Power Scenario in U.P The installed power capacity in U.P as on March 31, 2001 stood at 5635.3 mw, which were 9. 7% of India’s installed capacity. About 73% of it was thermal and 27% of it was hydel. The gross generation of electricity in the state stood at 24765 MKWH and it constituted 8.2% of India’s gross generated power. The power available to the State from the Central sector was 40.6 % against the national average of 33.5%. Despite the heavy Central sector borrowing, the critical shortage of power supply in the State can be gauged by the fact that a large majority of pumps in rural U.P, more particularly in the Eastern U.P have converted to diesel as a source of energy. In table 6, an attempt has been made to highlight the main characteristics of power sector in U.P vis-à-vis country as a whole. In U. P. the share of agriculture in total sales in percentage terms has ranged between 35-37%, which is higher than 31-32% for the India as a whole. Although the share of revenue from agriculture in UP ranges between 10 to 13 %, it is better than 4 to 5% share, which is found at the all India level. The per capita consumption of electricity in U.P has ranged between 186-207 kWh compared to the range of 299-348 kWh consumed per capita at the all India level. The unit cost of power supply in the U.P ranges between 222-253 paise / kWh as against 215-240 paise/ kWh at the all India level. The number of employees per thousand consumers as well as average tariff for sale of electricity in U.P is lower than what prevails at all India level.
TABLE – 6: Main Characteristics Of Power Sector In Up And In India
Sl. Particulars 1993-94 1994-95 1995-96 1996-97 1997-98 1 % Share of Agriculture in total
sales-UP 37.5 36.8 36.3 36.24 34.85
2 % share of revenue from agriculture in total sales revenue-UP
12.90 13.25 10.77 10.09 9.56
3 % share Agriculture in total sales for all SEBs (States) (Av.)
31.5 32.6 32.3 31.09 32.12
4 % share of Revenue from Ag. in total sales revenue Av. of all SEBs
4.77 4.37 3.98 3.56 3.56
5 % share of industry in total sale of power UP
25.30 24.34 24.62 23.26 22.32
6 % share of industry in total sale of power all SEBs
34.70 33.57 32.08 32.79 31.63
7 Per capita consumption of Electricity (Kwh)- UP
186.0 204.0 207.0 197.0 199.6
. -do- all India
299.0 320.0 336.0 334 348.5
8 % Energy surplus (+)/Deficit at the end of 8th plan 1996-97- UP
- - - 13.9 -
. -do- all India
11.5
9 Unit cost of Power Supply (Paise/kwh), UPSEB
169.4 177.5 192.0 222.3 253.3
. -do- all India
149 163.4 179.6 215.8 240.2
10 Rate of Purchase of Power (Paise/kwh), UPSEB
102 106.7 99.0 119.7 134.2

17
. -do- all India
87.0 94 109.9 119.1 140.7
11 No of employees per thousand consumers, UPSEB
- 16.60 15.7 14.65 13.82
. -do- all India
12.60 11.40 10.75 10.40
12 Average tariff for sale of electricity paise/kwh
111.8 122.4 - 143.0 171.6
. -do- all India
116.7 12.8 - 165.0 180.9
Source: Annual Report on the working of State Electricity Boards and electricity Departments. Planning Commission, June, 2001
In table 7, a comparison has been made between U.P.S.E.B and all S.E Bs in respect of average tariff levied on various categories of consumers during 1996-2001. The three things, which clearly emerge from the table, are: First, the overall charges of U.P.S.E.B fall short of charges at the all India level and in respect of three categories of consumers i.e., domestic, commercial (since 1998) and outside the state, the charges of U.P.S.E.B are lower than the all India charges. However, in respect of agriculture / irrigation, industry (since 1999) and railway traction U.P.S.E.B tariff is lower than the all India average tariff. The second, the tariff rates are lower than the unit cost of power supply in respect of domestic agriculture and outside. Here, the biggest gap arises in respect of outside consumers, where tariffs are 13 times lower than the unit cost of power supply. There is every possibility that this power is provided to Nepal. Third, the subsidy in respect of agriculture is 88.2% at the all India level and 80.3% in respect of Uttar Pradesh. By and large, the power scenario that exists in U.P is far worse in the eastern region in comparison to the western region. As we had seen in table 4, there was a large dieselisation of ground water irrigation between mid 1980s and mid 1990s on account of near disappearance of electricity from rural Eastern U.P. Tushar Shah who has examined the whole question of power scenario in U.P including power sector reforms has offered some solutions to the problem. One of the solutions, which appear pragmatic at face value, is the transferring power distribution to the panchayats. This proposition does need a threadbare discussion if democratic de-centralizations have to succeed. What makes Shah’s proposition attractive is the prospect of sharing of meeting collection cost between U.P.S.E.B and the panchayats (Shah, 2001). But is it possible? Access of Ground Water to the Poor During the early 1980s, it was found that the main beneficiaries of ground water irrigation in the Gangetic plains were larger farmers (Pant1984a). This was on account of either their resource base or accessibility to credit and thus their ability to use new seed, water, and fertilizer technologies. Benefits to the poor had been co-incidental rather than a matter of deliberate policy and were much less than what they must have been. Around that time, the desirability of well-directed efforts to give benefits of ground water to rural poor of Bangladesh, India and Nepal were discussed in a four-week seminar at IDS. The solutions were suggested on two fronts: first, improvement in traditional lift irrigation devices relying predominantly on human and animal energy source, second, developing and improving new small scale technology especially designed for small farmers such as hand or bicycle powered pumps relying on human or solar energy (IDS 1980)

18
Table – 7: Average Tariff for various categories of consum
ers (Paise/kwh)
1996
1997 1998
1999 2000
UPSEB
All SEBsU
PSEBO
ther SEBs U
PSEBO
thersSEBs U
PSEBO
ther SEBs U
PSEBO
ther SEBs C
ategories of Consum
ers
1996 1997
1997 1998
1998 1999
1999 2000
2000 2001
Dom
estic 99.19
106.24 104.95
137.23 112.81
140.86 129.53
158.66129.53
174.16
Com
mercial
264.56 240.3
303.61 295.42
313.25 324.32
313.25 356.60
313.25341.20
Agriculture/Irrigation 42.48
21.2 49.65
20.22 49.5
20.59 48.95
21.0249.97
28.42
Industrial 275.95
276.89 383.45
314.63 222.76
322.01 418.42
346.08423.36
360.23
Rly.Traction
354.59 346.42
414.53 382.17
456.26 405.94
428.7 414.72
421.00420.76
Outside State
14.5 151.39
15.98 138.53
19.14 164.84
19.14 182.81
19.14194.79
Overall Av.
142.98 165.74
171.56 180.85
180.61 185.75
182.02 199.13
183.35212.00
Source: Annual Report on the W
orking of State Electricity Boards & Departm
ents, Planning Com
mission, June 2001.

19
Community/ Group-Tube-wells. Around that time author’s findings were that the group tube-wells installed with the initiative of PADI (predecessor of CAPART) and owned and operated by groups of small and marginal farmers were doing a fine job in the backward regions of eastern U.P (Deoria) and North Bihar (Vaishali) was widely acclaimed. It provided an organizational solution to the problem of indivisibility of tube-well, particularly in Eastern U.P (Pant, 1984b). At that time, community / group-tube-wells were regarded as a viable alternative for the marginal farmers of Eastern U.P whose plots were not only small but were scattered all around. However, by 1988, the group had started dis-integrating on account of World Bank tube-well programme and the free boring scheme4. During 1996-98, another variant of group/ community tube-well was tried under a government project. The project was undertaken under one million well scheme of government of India and was implemented by U.P Project and Tube-well Corporation. It was taken up on the initiative of the then Managing Director of the Corporation. Under the scheme, about 100 tube-wells, each with a command of 20 ha was installed in the districts of Lucknow and Kanpur. The management of tube-wells was handed over to committees of beneficiary farmers to be headed by a local representative. The scheme failed on account of delay in getting electric connection, frequent electric failures after connection was obtained and factionalism over who would head the committee. Free boring scheme The origin of free boring scheme were laid in the RBI report of 1984 which recommended a heavy dose of subsidy for the development of ground water in the Eastern India. Following this report, the government of U.P launched a poverty targeted free boring scheme. Under the programme, free boring facility to the extent of Rs.3000 was provided to the small and marginal farmers. Additionally, they were also provided subsidies of 33.3% and 50% to small and marginal /SC&ST farmers respectively for the purchase of electric or diesel pumps. U.P Government used its own financial resources to enhance the rate of subsidy provided by the GOI from 25% to 33.3% and from 33.3% to 50 % (Pant 1991). The liberal dose of subsidy together with achievement targets to be obtained, there was mushrooming of shallow tube-wells in both the regions. In table 8, year wise attainment of free borings in Moradabad district has been provided. If we look at the level, it is found that the largest numbers of borings were done during late1980 and mid 1990s. It was the period when greatest number of diesel / electric pumps were installed at the state and at the regional levels also. The dramatic drop of borings in 1997-98 was because of detection of large scale bungling in the purchase of boring pipes during the previous year. This led to the suspension of the then Chief Engineer of Minor Irrigation Department and appointment of a probe committee because of 4 During a field visit to Deoria in October 2001, the author visited village Barsat where one of the earliest group tube-wells was installed in 1981. It was found that of the four tube-wells then installed around the village, two were still operative. Another interesting discovery was that one of the persons who was then working as a daily wage fourth grade staff with the PADI project had started a NGO of his own in the village after his services were terminated from the project. During 1999-2000, with the funding from CAPART he had installed 15 group tube-wells in adjoining areas. All the pumps were of diesel, and mostly the pumps were of 10 horse power

20
which practically no progress was made that year. Since next year, the backlog of previous year was also added; good progress was made in 1998-99. The reason for fewer borings in recent years is that the actual achievements are far below the targets set for the same. This is despite the fact that targets have been reduced by one fourth in recent years. In Jaunpur district, the targets for 2001-2002 were 1569, while the achievement up to October 2001,under general component was 8.5% and under special component, it was 5.5%, giving an overall achievement of 7.5%
Table – 8: Free Borings in District Moradabad
Year Under General Plan
Under Special Component
Under I million Wells Plan
Total
1984-85 212 - - 212
1985-86 779 - - 779
1986-87 888 - - 888
1987-88 879 - - 879
1988-89 3476 - - 3476
1989-90 3155 - - 3155
1990-91 1952 - - 1952
1991-92 2262 - - 2262
1992-93 1231 - 205 1436
1993-94 1009 - 661 1670
1994-95 1190 - 1550 2670
1995-96 1270 - 555 1825
1996-97 191 497 996 1617
1997-98 16 5 - 21
1998-99 492 1513 - 2005
1999-00 384 148 - 532
2000-01 166 345 - 511
Total 19482 2441 3967 25890
Source: Assistance Engineer Minor Irrigation Moradabad Tushar Shah regards the free boring scheme of U.P a roaring success and considers the mechanism adopted as a role model for rest of eastern India. He also thinks that the scheme is one of the three options (the other two being water markets and treadle-pumps) for access of ground water to the rural poor (Shah 2001). However, our own surveys carried out in Eastern U.P during 1989 and 1990 (Pant 1989 and 1992) bring out a contrary picture in this regard which is substantiated by the 1993-94 Minor Irrigation Census presented in table 5. Transfer of Management of Public Tube-wells to Co-operatives and Panchayats One of the mechanisms used by the state governments for better access of tube-well irrigation to the rural poor is to transfer tube-wells to co-operatives / panchayats. In a policy decision in 1992, about 50 state tube-wells were transferred to beneficiary farmers to run it as a co-operative venture. An internal evaluation done by the

21
department found that only about 10% of the transferred tube-wells had run satisfactorily and only one studied by the author (Pant 1995) sustained the satisfactory working for a longer period of time. In another policy decision in 1999, the state government transferred the management of all the state tube-wells to panchayats. We have been able to obtain the data for a division and a sub-division in Gorakhpur in respect of working of these tube-wells before and after the transfer to the panchayats. The deterioration is most obviously visible after the transfer (see table 9). As regard the access of poor farmers to the tube-well water, we did not find any difference. However, it was found that greater proportion of local influential shared the water theft. Ground Water markets The author had examined the question of access of ground water to the poor right from 1981 and had found in all his studies that ground water markets were the main source of irrigation of marginal and poor farmers. In one of his recent studies, the author had found that the smallest farmers with land holdings up to 0.4 ha were the biggest beneficiaries of ground water markets and that they gained the least from the public tube-wells. The data reveal that among this category of farmers 60% irrigated their wheat crop by purchased water as against 7% who used public tube-well for their wheat irrigation (Pant 1992) During the October / November 2001 field visit, the author found that water markets still remained the main source of irrigation of marginal farmers’ land. In respect of water rates, it was found that in Jaunpur, Gorakhpur and Deoria, sale of water from electric pumps was non prevalent and diesel drawn water was sold at Rs.40-50 per hour. The same rate was prevalent for diesel pump sets in Moradabad. In addition, in Moradabad, water from electric tube-wells sold at Rs.20 per hour or Rs.60 per acre.

22
Table –9: Working of State Tube W
ells
Part-A: Tubewell D
ivision- II, Gorakhpur
(area in ha.)
Sl. N
o. Year N
o.of STWs
Net Irrigated
area (in 000)Av. Per
TW
Watering
area (in 000) Av. Per TWR
unning hrs. (in 000)
Av.per TW
Assessed
Water charges
(Rs. in 000)
Av. Per TW
Before Transfer to Panchayats
1 1996-97 302
8.6 28.5
13.1 43.5
309.8 996.1
3657.8 12112.1
2 1997-98 302
7.9 26.4
10.8 35.9
279 923.8
1493.4 4945.3
3 1998-99 302
5.6 18.5
7.5 24.8
154.9 513.2
1768.5 5856.2
After Transfer to Panchayats
4 99-2000 467
4.1 8.9
5.6 12.1
117.3 251.3
1480 3169.3
467 3.7
8.0 4.9
10.7 123.5
264.701508
3229.2
Part-B: Tubew
ell Sub-Division-I
Before Transfer to Panchayats
1 1997-98 93
3.1 33.6
5.4 58.6
123.5 1329
588.3 6326.7
2 1998-99 93
1.7 18.3
3.3 35.5
101.4 1090.5
491.1 5281.1
After Transfer to Panchayats
3 99-2000 150
1.1 7.5
1.4 9.3
85.1 567.4
365.2 2434.8
4 2000-01 150
1.0 6.9
1.3 9.2
63.9 426.2
360.5 2403.4
Source : Gorakhpur Tubew
ell Division-II

23
Treadle Pumps This is a low cost foot operated pumps to enable small and marginal farmers to increase their income in high water table area of Bangladesh, Nepal and India. It was developed in Bangladesh in 1980 by Norwegian working in a local NGO. International Development Enterprises (IDE) promoted in India in 1995. The brand in India is known as Krishak Bandhu or KB. KB pumps follow the basic lifting principle of the hand pump. It consist of two barrels, plungers and pedals and is operated by one person, including a child who moves his weight on the foot pedal while holding a bamboo frame for support (Bhanot 1999). A report, which has reviewed evidence from a variety of sources, including their own study concludes that the pump raises annual incomes of adopter households by conservative estimate to Rs. 5000 per year. The researchers of the study are highly impressed by the performance of the pumps. According to them, the total sales of the pumps in India and Nepal are around 2 lakhs and they wonder as to why the sales are not picking up enough to tap the potential of 1 lakh pumps per year (Shah et al 2000). Our own field level impressions (October2001) based on the interviews of 7 pump owners substantiate that most of the owners are very small farmers. The average land holding size of the owners was 0. 35 acres and the largest owner were having one acre of land. Out of seven pumps only one was found to be in the working condition. The person from Gorakhpur recently bought this particular one for Rs. 1500. The other six were provided largely free to the farmers by a NGO who had received a grant for this purpose from OXFAM etc. During the field examinations and discussions, the main points that emerged regarding the pump were: 1 It was used for the cultivation of vegetables only. 2. Most of the owners found the job of taking water from the pump tiring and monotonous and they preferred buying water even @ Rs. 50 per hour. They argued that it was more advantageous to work as a laborer and earn more money than the advantage derived from drawing the water from the pump. Some of them said that they preferred Dhekuli (the traditional method), while their children preferred drawing water from this pump. 3. The pump is capable of irrigation very small patch of land, which was invariably homestead land. 4. It was reported that after two years it was difficult to maintain the treadle pump as lots of wear and tear occur and replacements of parts was not feasible. 5. The presence of the pump even in high water table areas of Terai of eastern U.P. is not that widespread as reported by the IDE. 6. The month of October is not a proper time to see the working of treadle pumps. The better time to see it’s working is after November. Although the pump has been appreciated by one and all, the questions regarding its wide range acceptance and sustainability in high water table poverty ridden areas with preponderance of marginal holdings remain unanswered. In addition to the issues discussed in the preceding, there are other issues like consolidation of holdings, regulation of ground water and conjunctive use of ground and surface water. These issues are equally relevant to the topic of the paper. However, on account of non-availability of the data on these aspects at this stage, we have not been able to take up these issues in this paper.
24
Conclusions The Gangetic alluvium in the state of Uttar Pradesh presents a picture in contrast between the eastern and western parts. The eastern part characterizes: over population, existence of very small and fragmented holdings, poor infrastructure, poor credit facilities, meager electrification, flood proneness, impeded drainage and water- logging. Consequently, low consumption of fertilizers and HYV seeds etc leading to low cropping intensity and low crop yields. In contrast, the western part is favorably oriented in terms of all the shortcomings. The strategy invariably suggested for the improvement in agricultural front in the eastern part lays emphasis on greater development of abundantly available ground water in this part of the alluvium. Although, eastern part still lags behind the western part, it has made tremendous stride particularly after the mid 1980s and in recent years has tried to catch up with the western part. An important feature of development in the two regions is that every trend, which occurs in the west, is followed in the east after some time lag. It is desirable that such steps need to be taken in the east, which have proved beneficial for the agricultural development of west, for example land reforms. At the same time, lessons need to be taken in respect of negative aspects of ground water development. One such issue is over exploitation of ground water. The enormity of excessive use of ground water in the western region can be understood by the fact that of the total 22 over exploited / critical blocks in the two regions, 21 are in the western region, Again about 76% of semi critical blocks fall in the western region as against 24% in the western region. One of the strategies generally suggested to eliminate unplanned use of ground water is through integrated planning and management of ground and surface water resources. In actual practice, it could never be done in the absence of a coordinating agency, which planned and implemented water resources projects, basin or sub basin wise. In order to counter this lacuna in 1999, the government of U.P constituted a State Water Resources Agency (SWARA) under the chairmanship of the chief secretary. Recently (June 2001), as part of the World Bank funded the state water re-structuring project, efforts are being made to give practical shape to this organization. It is envisaged to establish a Water Resources Data and Analysis Center under the agency to provide logistic support to it. The success of integrated water resources development in general and balanced ground water development of the state in particular will depend mainly on the effectiveness of these institutional measures.

25
References Bhanot, Arun. 1999(October) SPAN, USIS, New Delhi pp 7-9. Chambers, Robert. 1987. Notes on a visit to Eastern U.P. 26-28 February. Dhawan, B. D.1982. Development of Tube-well Irrigation in India. Agricole Publishing Academy.
New Delhi, pp. 39-59. GOUP 1971. Working of State Tube-wells in Uttar Pradesh- An Evaluation Study, State Planning
Institute, U.P, Lucknow, pp 1-2. GOUP. 1999, (March). Block wise Ground Water Status Report, District Moradabad GOUP. 1999, (August). Block-wise Ground Water Status Report, District Jaunpur. IDS. 1982. Who Gets a Last Resource? The Potential and Challenge of Lift Irrigation for the Rural
Poor, University of Sussex, Study Seminar, pp 3-4. Pant, N. 1984 a. Organization, Technology and Performance of Irrigation Systems in Uttar Pradesh,
Giri Institute of Development Studies, Lucknow (mimeo). Pant, N. 1984 b. Community Tub-wells: An Organizational Alternative to Small Farmers’ Irrigation.
Economic and Political Weekly. Vol. XIX, No. 26(Review of Agriculture). Pant, N. 1989. Water Distribution and Management in New Design Public Tube-wells in Eastern Uttar
Pradesh, Centre for Development Studies, Lucknow. Pp 65-66. Pant, N. 1991. Ground Water Issues in Eastern India in Future Directions for Indian Irrigation-
Research and Policy Issues, ed, Ruth Meinzen-Dick and Mark Svendsen, International Food Policy Research Institute, Washington DC. Pp. 258-260.
Pant. N. 1992. New Trends IN Indian Irrigation- Commercialization of Ground Water, Ashish
Publishing House, New Delhi. P 58. Pant. N. 1993. Performance of the World Bank Tube-well in Ground Water Irrigation and the Rural
Poor: Options for Development in the Gangetic Basin ed. by F. Kahnert and G Levine, The World Bank, Washington DC.
Pant. N. 1995. Turning of Public Tube-wells in Uttar Pradesh: Case Study of a Successful Cooperative
Society, IIMI and FAO, Rome pp. 177- 190 Rai. D; A, N.Singh, A. Hussain; N. Hasan and R.K Khanna. 2000. Ground water development
strategies for optimization of sustainable agricultural production in U.P. plains, Remote Sensing Applications Center, Lucknow.
RBI: 1984. Report on Agricultural Productivity in Eastern India, vol. II, Pp. 391-393. Shah. T, M. Alam, M. D. Kumar, R. K. Nagar and M. Singh. 2000. IWMI, Sri Lanka. Shah. T.2001. Wells and Welfare in Ganga Basin: Public Policy and Private Initiative in Eastern Uttar
Pradesh, Research Report No. 54, IWMI, Sri Lanka. Singh. Srinath. 1976. Modernization of Agriculture, Heritage Publishers. New Delhi.

International Water Management Institute 127, Sunil Mawatha, Pelawatta, Battaramulla, Sri Lanka. Tel: 94-1-867404, 869080, 872178, 872181 Fax: 94-1-866854 Email: [email protected] Website: http://www.iwmi.org
IWMI-Tata Water Policy Research Program Office Elecon, Anand-Sojitra Road, Vallabh Vidyanagar, Gujarat – 388 120, India. Tel: 91-2692-29311-13 Fax: 91-2692-29311-13 Email: [email protected] Website: http://www.iwmi.org/iwmi-tata
International Water Management Institute India Regional Office, ICRISAT Patancheru, Andhra Pradesh – 502 324, India Tel: 91-40-3296161 Fax: 91-40-3241239 Email: [email protected] Website: http://www.iwmi.org
Related Documents


