00 MONTH 2017 | VOL 000 | NATURE | 1 LETTER doi:10.1038/nature21403 Groundwater depletion embedded in international food trade Carole Dalin 1 , Yoshihide Wada 2,3,4,5 , Thomas Kastner 6,7 & Michael J. Puma 3,4,8 Recent hydrological modelling 1 and Earth observations 2,3 have located and quantified alarming rates of groundwater depletion worldwide. This depletion is primarily due to water withdrawals for irrigation 1,2,4 , but its connection with the main driver of irrigation, global food consumption, has not yet been explored. Here we show that approximately eleven per cent of non-renewable groundwater use for irrigation is embedded in international food trade, of which two-thirds are exported by Pakistan, the USA and India alone. Our quantification of groundwater depletion embedded in the world’s food trade is based on a combination of global, crop- specific estimates of non-renewable groundwater abstraction and international food trade data. A vast majority of the world’s population lives in countries sourcing nearly all their staple crop imports from partners who deplete groundwater to produce these crops, highlighting risks for global food and water security. Some countries, such as the USA, Mexico, Iran and China, are particularly exposed to these risks because they both produce and import food irrigated from rapidly depleting aquifers. Our results could help to improve the sustainability of global food production and groundwater resource management by identifying priority regions and agricultural products at risk as well as the end consumers of these products. Excessive abstraction of groundwater for irrigation is leading to rapid depletion of aquifers in key food-producing regions around the world (such as north-western India, the North China Plain, the central USA and California 3,5 ). This depletion of the largest liquid freshwater stock on Earth threatens the sustainability of food production, and water and food security, not only locally 3,5 , but also globally via international food trade. Aquifer depletion can also induce significant environmental degradation, such as land subsidence and seawater intrusion 6,7 . The globalized dimension of groundwater depletion is poorly understood because of the lack of research integrating crop water use, groundwater depletion and international food trade. Studies of water resources embedded in food trade 8–11 — virtual water trade—have sometimes distinguished between blue water (surface water and groundwater) and green water (soil moisture) sources 12,13 , which can provide additional information on the potential environmental impact of their use. More recently, indicators of water scarcity have been introduced 14 , which help to evaluate the sustainability of global food supply. However, although the need to integrate recent evaluations of groundwater abstraction with virtual water trade and water footprint (embedded water) techniques has been highlighted 15 , groundwater use, and in particular groundwater depletion for irrigation (GWD), has not been accounted for in global virtual water trade analyses. Here, we aim to fill this crucial gap in the quantification of the water sustainability of global agriculture and food trade. To do so, we estimate the amount of GWD embedded in the world’s food produc- tion and international food trade. GWD is defined as the volume of 1 Institute for Sustainable Resources, University College London, 14 Upper Woburn Place, London WC1H 0NN, UK. 2 International Institute for Applied Systems Analysis, Schlossplatz 1, A-2361 Laxenburg, Austria. 3 Columbia University, Center for Climate Systems Research, 2880 Broadway, New York, New York 10025, USA. 4 NASA Goddard Institute for Space Studies, 2880 Broadway, New York, New York 10025, USA. 5 Department of Physical Geography, Utrecht University, Heidelberglaan 2, 3584 CS Utrecht, The Netherlands. 6 Institute of Social Ecology, Vienna, Alpen-Adria Universitaet Klagenfurt, Wien, Graz, Schottenfeldgasse 29, 1070 Vienna, Austria. 7 Senckenberg Biodiversity and Climate Research Centre (BiK-F), Senckenberganlage 25, 60325 Frankfurt am Main, Germany. 8 Center for Climate and Life, Columbia University, 61 Route 9W, Palisades, New York 10964, USA. Groundwater stress index Wheat Maize Rice Sugarcane Cotton Fodder grasses Other <1 >1 Groundwater depletion for irrigation <1 km 3 yr –1 1–2 km 3 yr –1 2–10 km 3 yr –1 10–30 km 3 yr –1 >30 km 3 yr –1 USA MEX SPA ARG SAF IND CHI AUS PAK ITA GRE TUN EGY LYB ALG RUS TUR SAU YEM IRN IRQ KAZ OMA MOR BAR UAE Figure 1 | Crop-specific contribution to groundwater depletion worldwide in 2010. The pie charts show fractions of groundwater depletion for irrigation (GWD) of major crops by country, and their sizes indicate total GWD volume. The background map shows groundwater stress index (corresponding to overexploitation when larger than one) of major aquifers 15 . Some countries have overexploited aquifers but no pie chart is shown because groundwater use is not primarily related to irrigation. https://ntrs.nasa.gov/search.jsp?R=20170003339 2020-03-16T10:00:56+00:00Z

Welcome message from author
This document is posted to help you gain knowledge. Please leave a comment to let me know what you think about it! Share it to your friends and learn new things together.
Transcript

0 0 M O N T H 2 0 1 7 | V O L 0 0 0 | N A T U R E | 1
LETTERdoi:10.1038/nature21403
Groundwater depletion embedded in international food tradeCarole Dalin1, Yoshihide Wada2,3,4,5, Thomas Kastner6,7 & Michael J. Puma3,4,8
Recent hydrological modelling1 and Earth observations2,3 have located and quantified alarming rates of groundwater depletion worldwide. This depletion is primarily due to water withdrawals for irrigation1,2,4, but its connection with the main driver of irrigation, global food consumption, has not yet been explored. Here we show that approximately eleven per cent of non-renewable groundwater use for irrigation is embedded in international food trade, of which two-thirds are exported by Pakistan, the USA and India alone. Our quantification of groundwater depletion embedded in the world’s food trade is based on a combination of global, crop-specific estimates of non-renewable groundwater abstraction and international food trade data. A vast majority of the world’s population lives in countries sourcing nearly all their staple crop imports from partners who deplete groundwater to produce these crops, highlighting risks for global food and water security. Some countries, such as the USA, Mexico, Iran and China, are particularly exposed to these risks because they both produce and import food irrigated from rapidly depleting aquifers. Our results could help to improve the sustainability of global food production and groundwater resource management by identifying priority regions and agricultural products at risk as well as the end consumers of these products.
Excessive abstraction of groundwater for irrigation is leading to rapid depletion of aquifers in key food-producing regions around the world
(such as north-western India, the North China Plain, the central USA and California3,5). This depletion of the largest liquid freshwater stock on Earth threatens the sustainability of food production, and water and food security, not only locally3,5, but also globally via international food trade. Aquifer depletion can also induce significant environmental degradation, such as land subsidence and seawater intrusion6,7. The globalized dimension of groundwater depletion is poorly understood because of the lack of research integrating crop water use, groundwater depletion and international food trade.
Studies of water resources embedded in food trade8–11— virtual water trade—have sometimes distinguished between blue water (surface water and groundwater) and green water (soil moisture) sources12,13, which can provide additional information on the potential environmental impact of their use. More recently, indicators of water scarcity have been introduced14, which help to evaluate the sustainability of global food supply. However, although the need to integrate recent evaluations of groundwater abstraction with virtual water trade and water footprint (embedded water) techniques has been highlighted15, groundwater use, and in particular groundwater depletion for irrigation (GWD), has not been accounted for in global virtual water trade analyses.
Here, we aim to fill this crucial gap in the quantification of the water sustainability of global agriculture and food trade. To do so, we estimate the amount of GWD embedded in the world’s food produc-tion and international food trade. GWD is defined as the volume of
1Institute for Sustainable Resources, University College London, 14 Upper Woburn Place, London WC1H 0NN, UK. 2International Institute for Applied Systems Analysis, Schlossplatz 1, A-2361 Laxenburg, Austria. 3Columbia University, Center for Climate Systems Research, 2880 Broadway, New York, New York 10025, USA. 4NASA Goddard Institute for Space Studies, 2880 Broadway, New York, New York 10025, USA. 5Department of Physical Geography, Utrecht University, Heidelberglaan 2, 3584 CS Utrecht, The Netherlands. 6Institute of Social Ecology, Vienna, Alpen-Adria Universitaet Klagenfurt, Wien, Graz, Schottenfeldgasse 29, 1070 Vienna, Austria. 7Senckenberg Biodiversity and Climate Research Centre (BiK-F), Senckenberganlage 25, 60325 Frankfurt am Main, Germany. 8Center for Climate and Life, Columbia University, 61 Route 9W, Palisades, New York 10964, USA.
Groundwater stress indexWheatMaize
RiceSugarcane
CottonFodder grasses
Other
<1>1
Groundwater depletion for irrigation
<1 km3 yr–11–2 km3 yr–1
2–10 km3 yr–110–30 km3 yr–1
>30 km3 yr–1
USA
MEX
SPA
ARG SAF
IND
CHI
AUS
PAK
ITAGRE
TUN
EGYLYBALG
RUS
TUR
SAU
YEM
IRN
IRQ
KAZ
OMA
MOR
BAR
UAE
Figure 1 | Crop-specific contribution to groundwater depletion worldwide in 2010. The pie charts show fractions of groundwater depletion for irrigation (GWD) of major crops by country, and their sizes indicate total GWD volume. The background map shows groundwater
stress index (corresponding to overexploitation when larger than one) of major aquifers15. Some countries have overexploited aquifers but no pie chart is shown because groundwater use is not primarily related to irrigation.
https://ntrs.nasa.gov/search.jsp?R=20170003339 2020-03-16T10:00:56+00:00Z

2 | N A T U R E | V O L 0 0 0 | 0 0 M O N T H 2 0 1 7
LETTERRESEARCH
groundwater that is abstracted for irrigation use in excess of the natural recharge rate and irrigation return flow5, accounting for environmental flow requirements, and thus corresponds to an unsustainable use of groundwater for crop production. We combine global crop production data (FAOSTAT; http://www.fao.org/faostat/en/#data/QC) with crop- specific estimates of GWD (using the PCR-GLOBWB model1,5) for 26 crop classes in the years 2000 and 2010 to obtain GWD intensities for each commodity–country pair (see equation (1) in the Methods). We then multiply the bilateral trade flows (FAOSTAT; http://www.fao.org/faostat/en/#data/TM) of 360 crop commodities by the GWD intensity of each commodity in the country of export to obtain the GWD volume embedded in trade (see equation (2) in the Methods). Importantly, we apply an origin-tracing algorithm16 to identify export flows from inter-mediary countries and assign them to the original country of produc-tion (see Methods). We identify the countries and crops contributing to global GWD, highlight key exporters and end-consumers of these crops irrigated from overexploited aquifers, and point out associated risks for local and global food and water security.
Global GWD has increased by 22% in ten years, from 240 km3 in 2000, when it sustained 20% of the world’s irrigation5, to 292 km3 in 2010. Over this period, global GWD has increased mostly owing to rises in India (23%), China (102%) and the USA (31%, Figs 1 and 2). The commodities analysed here (excluding non-traded ones) account for 241 km3 of GWD (83% of the total) in 2010. Most GWD is concen-trated in a few regions that rely significantly on overexploited aquifers to grow crops, mainly the USA, Mexico, the Middle East and North Africa, India, Pakistan and China (Figs 1 and 2 and Table 1), including almost all the major breadbaskets and population centres of the planet. The crops leading to the most depletion globally in 2010, both because
of their large production and high GWD intensity, are wheat (22% of global GWD, or 65 km3 yr−1), rice (17%), sugar crops (7%), cotton (7%) and maize (5%). India and Pakistan use the largest volumes of GWD (30% and 11% of global GWD, respectively, Fig. 1, Table 1). India has the largest GWD for wheat and rice (31.3 km3 yr−1 and 21.3 km3 yr−1, respectively), and China and the USA dominate GWD for maize (4.7 km3 yr−1 and 3.0 km3 yr−1, respectively).
We observe important differences in GWD intensity across regions and crop classes (Supplementary Table 1). On average (in countries with GWD), wheat, rice and maize are produced using 812, 199 and 72 litres of GWD per kilogram of crop, respectively. High extremes are found in Kuwait (21,900 litres per kilogram of wheat), Iran (2,100 litres per kilogram of rice) and Saudi Arabia (790 litres per kilogram of maize).
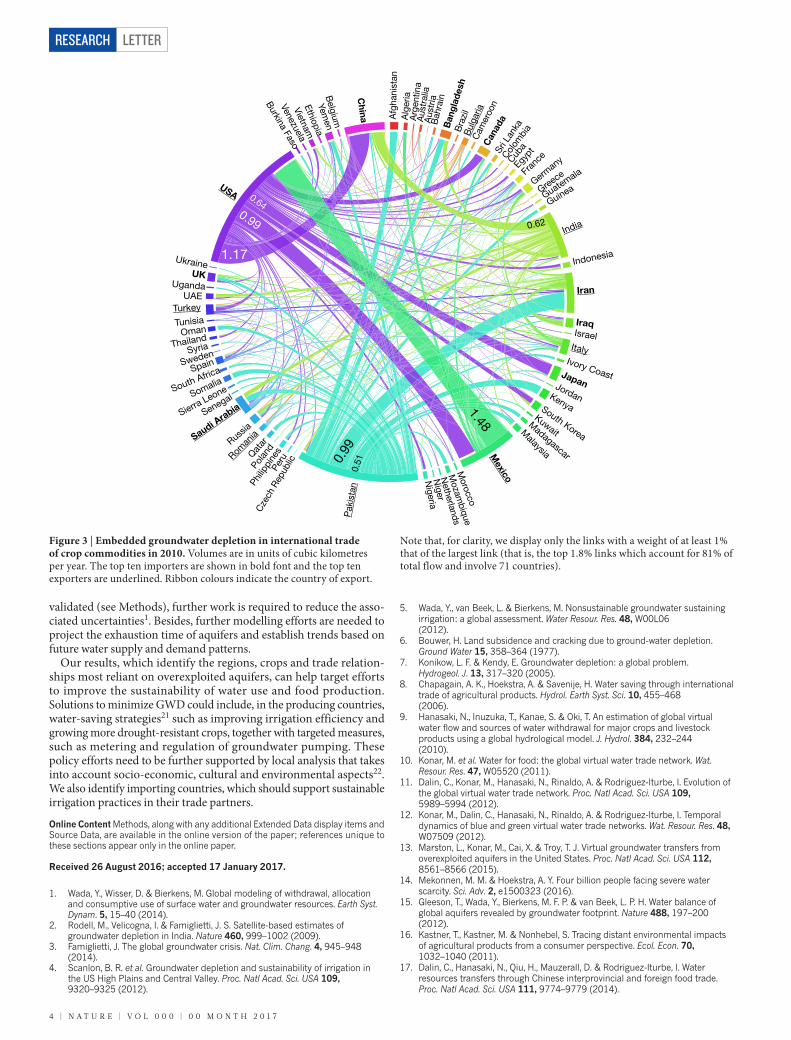
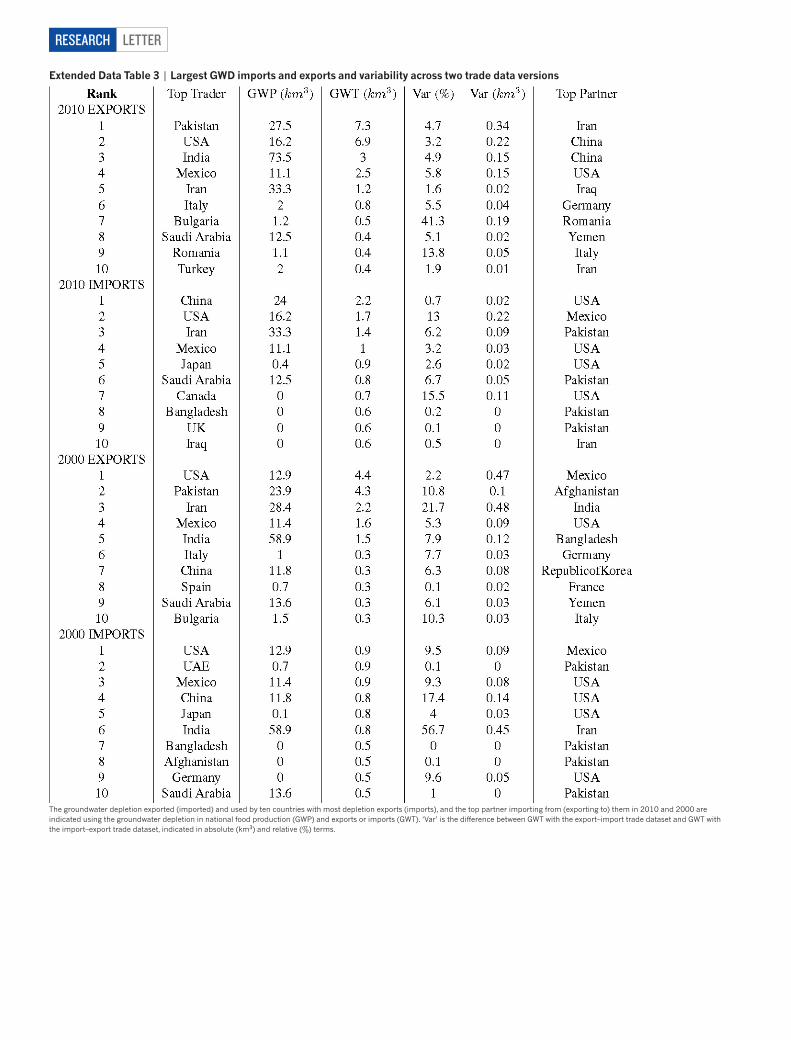
The countries irrigating crops from overexploited aquifers export them in various proportions (Table 1). India keeps most of its large GWD-based crop production for domestic use (only 4% of GWD exported), while the USA, Pakistan and Mexico export significant portions of their GWD-based crop production (42%, 26% and 23%, respectively; Table 1). The exports of Pakistan, the USA and India alone account for more than two-thirds of all GWD embedded in food trade (Extended Data Table 3). Pakistan is the largest exporter, with 29% of the global GWD trade volume, followed by the USA (27%) and India (12%; Fig. 3 and Table 1).
Globally, about 11% of GWD (25 km3 yr−1) is embedded in inter-national crop trade, while 18% of global crop production is traded internationally. This difference could be due to either crops with relatively smaller GWD intensity being more traded than others, or countries with relatively less GWD exporting more than other countries.
Table 1 | Groundwater depletion embedded in food production and trade for the ten countries with the most domestic GWD
Year Rank NameGWD in production (km3 yr−1)
Fraction of global GWD (%)
GWD in imports (km3 yr−1)
Fraction of GWD in national consumption (%)
GWD in exports (km3 yr−1)
Fraction of GWD in national production (%)
2010
1 India 73.5 33.9 0.2 0.3 3.0 4.0
2 Iran 33.3 15.4 1.4 4.2 1.2 3.5
3 Pakistan 27.5 12.7 0.2 1.2 7.3 26.4
4 China 24.0 11.1 2.2 8.5 0.3 1.1
5 USA 16.2 7.5 1.7 15.3 6.9 42.4
6 Saudi Arabia 12.5 5.7 0.8 6.0 0.4 3.5
7 Mexico 11.1 5.1 1.0 10.6 2.5 22.6
8 Libya 2.5 1.1 0.1 2.4 0 0.1
9 Turkey 2.0 0.9 0.5 22.6 0.4 18.0
10 Italy 2.0 0.9 0.5 27.9 0.8 39.2
Total top ten 204.6 84.8 8.6 4.5 22.8 11.1
Total world 241.4 100 25.6 NA 25.6 NA
2000
1 India 58.9 33.0 0.8 1.4 1.5 2.6
2 Iran 28.4 15.9 0.3 1.1 2.2 7.7
3 Pakistan 23.9 13.4 0.3 1.4 4.3 18.1
4 Saudi Arabia 13.6 7.6 0.5 3.3 0.3 2.1
5 USA 12.9 7.2 0.9 9.8 4.4 33.9
6 China 11.8 6.6 0.8 6.7 0.3 2.6
7 Mexico 11.4 6.4 0.9 8.2 1.6 14.2
8 Libya 2.7 1.5 0 1.3 0.1 2.5
9 Turkey 1.6 0.9 0.3 16.1 0.3 15.7
10 Bulgaria 1.5 0.8 0 1.1 0.3 18.7
Total top ten 166.7 85.6 4.8 3.1 15.3 9.2
Total world 194.7 100 17.7 NA 17.7 NA
Groundwater depletion (GWD) for irrigation embedded in national food production, imported and exported GWD, and corresponding fractions of GWD in global food production, national food con-sumption and national food production, respectively, in the years 2000 and 2010. We also show totals for these ten countries and for the world. NA, not applicable.
0 0 M O N T H 2 0 1 7 | V O L 0 0 0 | N A T U R E | 3
LETTER RESEARCH
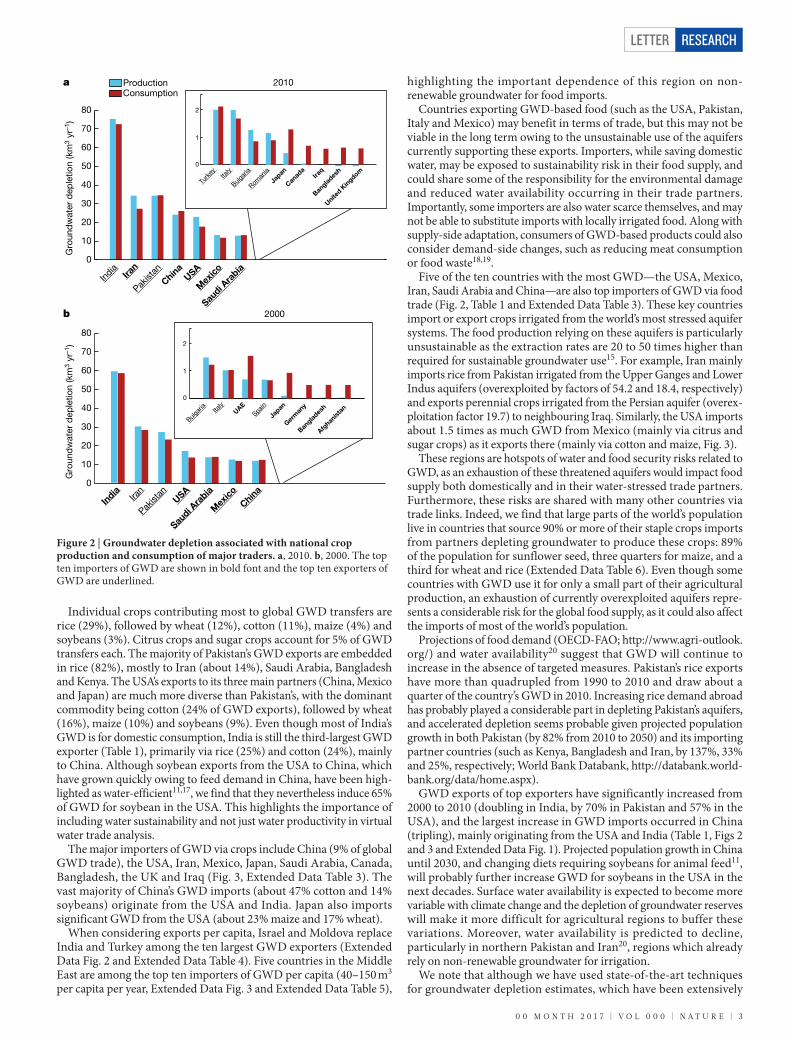
Individual crops contributing most to global GWD transfers are rice (29%), followed by wheat (12%), cotton (11%), maize (4%) and soybeans (3%). Citrus crops and sugar crops account for 5% of GWD transfers each. The majority of Pakistan’s GWD exports are embedded in rice (82%), mostly to Iran (about 14%), Saudi Arabia, Bangladesh and Kenya. The USA’s exports to its three main partners (China, Mexico and Japan) are much more diverse than Pakistan’s, with the dominant commodity being cotton (24% of GWD exports), followed by wheat (16%), maize (10%) and soybeans (9%). Even though most of India’s GWD is for domestic consumption, India is still the third-largest GWD exporter (Table 1), primarily via rice (25%) and cotton (24%), mainly to China. Although soybean exports from the USA to China, which have grown quickly owing to feed demand in China, have been high-lighted as water-efficient11,17, we find that they nevertheless induce 65% of GWD for soybean in the USA. This highlights the importance of including water sustainability and not just water productivity in virtual water trade analysis.
The major importers of GWD via crops include China (9% of global GWD trade), the USA, Iran, Mexico, Japan, Saudi Arabia, Canada, Bangladesh, the UK and Iraq (Fig. 3, Extended Data Table 3). The vast majority of China’s GWD imports (about 47% cotton and 14% soybeans) originate from the USA and India. Japan also imports significant GWD from the USA (about 23% maize and 17% wheat).
When considering exports per capita, Israel and Moldova replace India and Turkey among the ten largest GWD exporters (Extended Data Fig. 2 and Extended Data Table 4). Five countries in the Middle East are among the top ten importers of GWD per capita (40–150 m3 per capita per year, Extended Data Fig. 3 and Extended Data Table 5),
highlighting the important dependence of this region on non- renewable groundwater for food imports.
Countries exporting GWD-based food (such as the USA, Pakistan, Italy and Mexico) may benefit in terms of trade, but this may not be viable in the long term owing to the unsustainable use of the aquifers currently supporting these exports. Importers, while saving domestic water, may be exposed to sustainability risk in their food supply, and could share some of the responsibility for the environmental damage and reduced water availability occurring in their trade partners. Importantly, some importers are also water scarce themselves, and may not be able to substitute imports with locally irrigated food. Along with supply-side adaptation, consumers of GWD-based products could also consider demand-side changes, such as reducing meat consumption or food waste18,19.
Five of the ten countries with the most GWD—the USA, Mexico, Iran, Saudi Arabia and China—are also top importers of GWD via food trade (Fig. 2, Table 1 and Extended Data Table 3). These key countries import or export crops irrigated from the world’s most stressed aquifer systems. The food production relying on these aquifers is particularly unsustainable as the extraction rates are 20 to 50 times higher than required for sustainable groundwater use15. For example, Iran mainly imports rice from Pakistan irrigated from the Upper Ganges and Lower Indus aquifers (overexploited by factors of 54.2 and 18.4, respectively) and exports perennial crops irrigated from the Persian aquifer (overex-ploitation factor 19.7) to neighbouring Iraq. Similarly, the USA imports about 1.5 times as much GWD from Mexico (mainly via citrus and sugar crops) as it exports there (mainly via cotton and maize, Fig. 3).
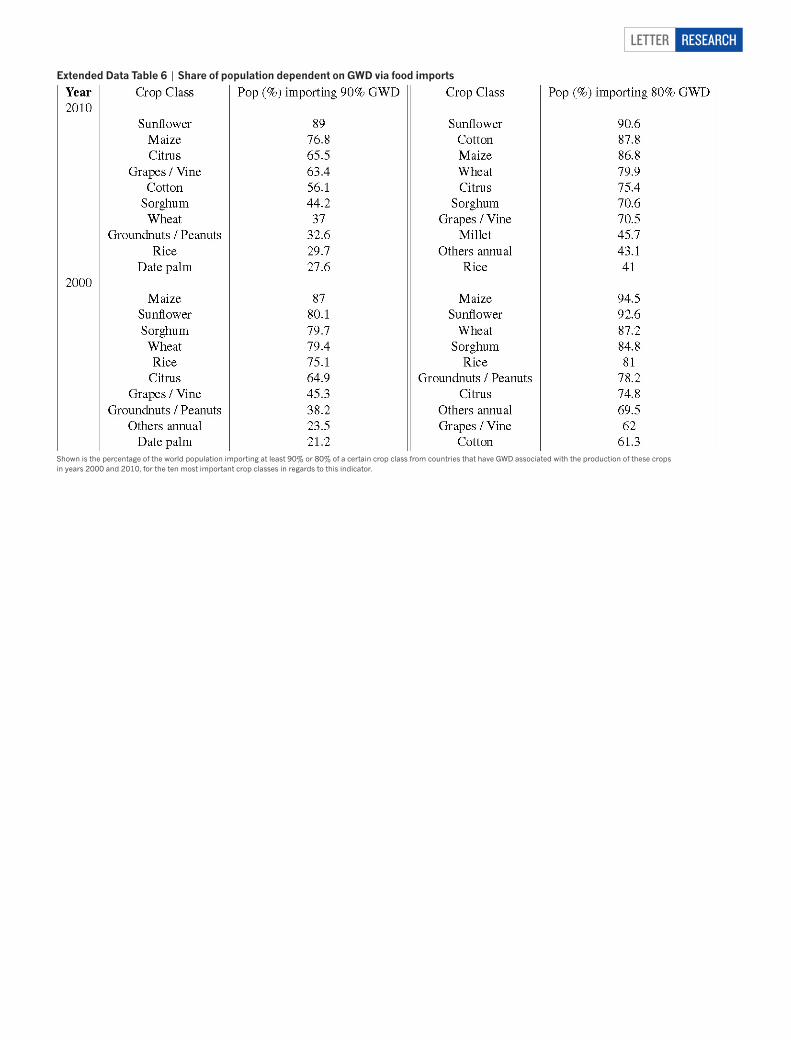
These regions are hotspots of water and food security risks related to GWD, as an exhaustion of these threatened aquifers would impact food supply both domestically and in their water-stressed trade partners. Furthermore, these risks are shared with many other countries via trade links. Indeed, we find that large parts of the world’s population live in countries that source 90% or more of their staple crops imports from partners depleting groundwater to produce these crops: 89% of the population for sunflower seed, three quarters for maize, and a third for wheat and rice (Extended Data Table 6). Even though some countries with GWD use it for only a small part of their agricultural production, an exhaustion of currently overexploited aquifers repre-sents a considerable risk for the global food supply, as it could also affect the imports of most of the world’s population.
Projections of food demand (OECD-FAO; http://www.agri- outlook.org/) and water availability20 suggest that GWD will continue to increase in the absence of targeted measures. Pakistan’s rice exports have more than quadrupled from 1990 to 2010 and draw about a quarter of the country’s GWD in 2010. Increasing rice demand abroad has probably played a considerable part in depleting Pakistan’s aquifers, and accelerated depletion seems probable given projected population growth in both Pakistan (by 82% from 2010 to 2050) and its importing partner countries (such as Kenya, Bangladesh and Iran, by 137%, 33% and 25%, respectively; World Bank Databank, http://databank.world-bank.org/data/home.aspx).
GWD exports of top exporters have significantly increased from 2000 to 2010 (doubling in India, by 70% in Pakistan and 57% in the USA), and the largest increase in GWD imports occurred in China (tripling), mainly originating from the USA and India (Table 1, Figs 2 and 3 and Extended Data Fig. 1). Projected population growth in China until 2030, and changing diets requiring soybeans for animal feed11, will probably further increase GWD for soybeans in the USA in the next decades. Surface water availability is expected to become more variable with climate change and the depletion of groundwater reserves will make it more difficult for agricultural regions to buffer these variations. Moreover, water availability is predicted to decline, particularly in northern Pakistan and Iran20, regions which already rely on non-renewable groundwater for irrigation.
We note that although we have used state-of-the-art techniques for groundwater depletion estimates, which have been extensively
0
10
20
30
40
50
60
70
80
Gro
und
wat
er d
eple
tion
(km
3 yr
–1)
India
Pakist
anIran
China
USA
Mex
ico
ProductionConsumption
0
10
20
30
40
50
60
70
80
Gro
und
wat
er d
eple
tion
(km
3 yr
–1)
India
Iran
Pakist
anUSA
Saudi A
rabia
Mex
ico
China
2000Sau
di Ara
bia
2010a
b
0
Turk
ey Italy
Bulgar
ia
Roman
ia
Japan
Canad
aIra
q
Banglad
esh
United K
ingdom
2
1
0
2
1
Bulgar
iaIta
lyUAE
Spain
Japan
Germ
any
Banglad
esh
Afghan
istan
Figure 2 | Groundwater depletion associated with national crop production and consumption of major traders. a, 2010. b, 2000. The top ten importers of GWD are shown in bold font and the top ten exporters of GWD are underlined.
4 | N A T U R E | V O L 0 0 0 | 0 0 M O N T H 2 0 1 7
LETTERRESEARCH
validated (see Methods), further work is required to reduce the asso-ciated uncertainties1. Besides, further modelling efforts are needed to project the exhaustion time of aquifers and establish trends based on future water supply and demand patterns.
Our results, which identify the regions, crops and trade relation-ships most reliant on overexploited aquifers, can help target efforts to improve the sustainability of water use and food production. Solutions to minimize GWD could include, in the producing countries, water-saving strategies21 such as improving irrigation efficiency and growing more drought-resistant crops, together with targeted measures, such as metering and regulation of groundwater pumping. These policy efforts need to be further supported by local analysis that takes into account socio-economic, cultural and environmental aspects22. We also identify importing countries, which should support sustainable irrigation practices in their trade partners.
Online Content Methods, along with any additional Extended Data display items and Source Data, are available in the online version of the paper; references unique to these sections appear only in the online paper.
Received 26 August 2016; accepted 17 January 2017.
1. Wada, Y., Wisser, D. & Bierkens, M. Global modeling of withdrawal, allocation and consumptive use of surface water and groundwater resources. Earth Syst. Dynam. 5, 15–40 (2014).
2. Rodell, M., Velicogna, I. & Famiglietti, J. S. Satellite-based estimates of groundwater depletion in India. Nature 460, 999–1002 (2009).
3. Famiglietti, J. The global groundwater crisis. Nat. Clim. Chang. 4, 945–948 (2014).
4. Scanlon, B. R. et al. Groundwater depletion and sustainability of irrigation in the US High Plains and Central Valley. Proc. Natl Acad. Sci. USA 109, 9320–9325 (2012).
5. Wada, Y., van Beek, L. & Bierkens, M. Nonsustainable groundwater sustaining irrigation: a global assessment. Water Resour. Res. 48, W00L06 (2012).
6. Bouwer, H. Land subsidence and cracking due to ground-water depletion. Ground Water 15, 358–364 (1977).
7. Konikow, L. F. & Kendy, E. Groundwater depletion: a global problem. Hydrogeol. J. 13, 317–320 (2005).
8. Chapagain, A. K., Hoekstra, A. & Savenije, H. Water saving through international trade of agricultural products. Hydrol. Earth Syst. Sci. 10, 455–468 (2006).
9. Hanasaki, N., Inuzuka, T., Kanae, S. & Oki, T. An estimation of global virtual water flow and sources of water withdrawal for major crops and livestock products using a global hydrological model. J. Hydrol. 384, 232–244 (2010).
10. Konar, M. et al. Water for food: the global virtual water trade network. Wat. Resour. Res. 47, W05520 (2011).
11. Dalin, C., Konar, M., Hanasaki, N., Rinaldo, A. & Rodriguez-Iturbe, I. Evolution of the global virtual water trade network. Proc. Natl Acad. Sci. USA 109, 5989–5994 (2012).
12. Konar, M., Dalin, C., Hanasaki, N., Rinaldo, A. & Rodriguez-Iturbe, I. Temporal dynamics of blue and green virtual water trade networks. Wat. Resour. Res. 48, W07509 (2012).
13. Marston, L., Konar, M., Cai, X. & Troy, T. J. Virtual groundwater transfers from overexploited aquifers in the United States. Proc. Natl Acad. Sci. USA 112, 8561–8566 (2015).
14. Mekonnen, M. M. & Hoekstra, A. Y. Four billion people facing severe water scarcity. Sci. Adv. 2, e1500323 (2016).
15. Gleeson, T., Wada, Y., Bierkens, M. F. P. & van Beek, L. P. H. Water balance of global aquifers revealed by groundwater footprint. Nature 488, 197–200 (2012).
16. Kastner, T., Kastner, M. & Nonhebel, S. Tracing distant environmental impacts of agricultural products from a consumer perspective. Ecol. Econ. 70, 1032–1040 (2011).
17. Dalin, C., Hanasaki, N., Qiu, H., Mauzerall, D. & Rodriguez-Iturbe, I. Water resources transfers through Chinese interprovincial and foreign food trade. Proc. Natl Acad. Sci. USA 111, 9774–9779 (2014).
Afg
hani
stan
Alg
eria
Arg
entin
aA
ustr
alia
Aus
tria
Bah
rain
Ban
glad
esh
Bra
zil
Bul
garia
Cam
eroo
nC
anad
aSr
i Lan
kaCol
ombi
a
Cuba
Egypt
Fran
ce
German
y
Greece
Guatemala
Guinea
India
Indonesia
Iran
IraqIsrael
ItalyIvory CoastJapanJordanKenyaSouth Korea
KuwaitMadagascar
MalaysiaM
exico
Morocco
Mozam
bique
Netherlands
Niger
Nigeria
Pak
ista
n
Cze
ch R
epub
lic
Peru
Philip
pine
s
Polan
d
Qatar
Roman
iaRuss
iaSaudi A
rabiaSenegal
Sierra LeoneSomaliaSouth AfricaSpainSwedenSyriaThailandOman
TunisiaTurkey
UAEUganda
UK
Ukraine
USA
Burkina FasoVenezuelaVietnam
EthiopiaYem
enB
elgium
China
1.17
0.99
1.48
0.99
0.62
0.51
0.64
Figure 3 | Embedded groundwater depletion in international trade of crop commodities in 2010. Volumes are in units of cubic kilometres per year. The top ten importers are shown in bold font and the top ten exporters are underlined. Ribbon colours indicate the country of export.
Note that, for clarity, we display only the links with a weight of at least 1% that of the largest link (that is, the top 1.8% links which account for 81% of total flow and involve 71 countries).

0 0 M O N T H 2 0 1 7 | V O L 0 0 0 | N A T U R E | 5
LETTER RESEARCH
18. Jalava, M., Kummu, M., Porkka, M., Siebert, S. & Varis, O. Diet change a solution to reduce water use? Environ. Res. Lett. 9, 074016 (2014).
19. Vanham, D., Bouraoui, F., Leip, A., Grizzetti, B. & Bidoglio, G. Lost water and nitrogen resources due to EU consumer food waste. Environ. Res. Lett. 10, 084008 (2015).
20. Schewe, J. et al. Multimodel assessment of water scarcity under climate change. Proc. Natl Acad. Sci. USA 111, 3245–3250 (2014).
21. Wada, Y., Gleeson, T. & Esnault, L. Wedge approach to water stress. Nat. Geosci. 7, 615–617 (2014).
22. Aldaya, M. M., Martínez-Santos, P. & Llamas, M. R. Incorporating the water footprint and virtual water into policy: reflections from the Mancha Occidental region, Spain. Water Resour. Manage. 24, 941–958 (2010).
Supplementary Information is available in the online version of the paper.
Acknowledgements C.D. acknowledges the funding support of the Belmont Forum (SAHEWS project, NERC NE/L008785/1), the Economic and Social Research Council through the Centre for Climate Change Economics and Policy, and the Natural Environment Research Council Fellowship (NERC NE/N01524X/1). T.K. was supported by the European Research Council Starting Grant LUISE (263522) and the Swedish Research Council Formas (grant number 231-2014-1181). M.J.P. acknowledges fellowship support from the Columbia University Center for Climate and Life. Y.W. is supported by a
Japan Society for the Promotion of Science (JSPS) Oversea Research Fellowship (JSPS-2014-878). This paper was presented at the conference Virtual Water in Agricultural Products: Quantification, Limitations and Trade Policy (Lincoln, Nebraska, USA, 14–16 September 2016), sponsored by the OECD Co-operative Research Programme: Biological Resource Management for Sustainable Agricultural Systems (CRP). The CRP financially supported C.D. to participate in the conference. The opinions expressed and arguments employed in this paper are the sole responsibility of the authors and do not necessarily reflect those of the OECD or of the governments of its Member countries.
Author Contributions C.D., Y.W. and M.J.P. designed the research. Y.W. carried out the simulation to estimate non-renewable groundwater abstraction per crop class. T.K., M.J.P. and C.D. processed the trade data. C.D. performed the analysis. C.D. wrote the paper with help from Y.W., M.J.P. and T.K.
Author Information Reprints and permissions information is available at www.nature.com/reprints. The authors declare no competing financial interests. Readers are welcome to comment on the online version of the paper. Publisher’s note: Springer Nature remains neutral with regard to jurisdictional claims in published maps and institutional affiliations. Correspondence and requests for materials should be addressed to C.D. ([email protected]).
Reviewer Information Nature thanks M. Aldaya, D. Vanham and the other anonymous reviewer(s) for their contribution to the peer review of this work.

LETTERRESEARCH
METHODSSimulation of nonrenewable groundwater abstraction for crop water use. Water used by irrigated crops is obtained from three sources: local precipitation contributing to soil moisture available for root water uptake (green water), irrigation water taken from rivers, lakes, reservoirs, wetlands and renewable groundwater, and irrigation water abstracted from non-renewable groundwater23.
Here, we explicitly quantify globally the amount of nonrenewable groundwater abstraction to sustain current irrigation practice (GWD) separately for 26 crop types based on the MIRCA2000 dataset24, for years 2000 and 2010. Irrigated crop-land areas from MIRCA2000 are scaled to year 2010 based on national irrigated cropland areas annual data (FAOSTAT; http://www.fao.org/faostat/en/#data/RL). We use a global hydrological and water resources model1,5 to simulate crop water use for the 26 irrigated crop types, and available blue and green water to meet this demand at a 0.5° spatial resolution (about 50 km at the Equator). To distinguish non-renewable groundwater abstraction from renewable water sources, we keep track of the amount of groundwater pumped for each irrigated crop on the basis of crop growing areas and seasons, including multi-cropping practices and considering sub-grid variability of different crop types5. We subsequently compare this amount with simulated groundwater recharge to estimate non-renewable groundwater that is withdrawn for separate crops. We then obtain country-level groundwater depletion GWD(i, K, n) (in kilograms of water) per crop class K in each country i and year n by summing the gridded groundwater depletion per crop class over the grid cells within the country’s boundaries. All model simulations by PCR-GLOBWB have been conducted at the 0.5 degree resolution, including groundwater depletion, groundwater recharge, and irrigation return flow. The results have then been aggregated to the country scale to match the trade data.
Note that groundwater recharge used in this calculation is based on a long-term average (1960–2010)5,25, which reduces potentially large inter-annual variability. Besides, natural groundwater recharge from precipitation is averaged over each grid cell, but return flow from irrigation is simulated for separate crop areas of each grid cell. For example, higher return flow occurs from the rice-growing fraction of the grid cell compared to other crop-growing fractions (such as wheat and maize), owing to flooding irrigation practice. Irrigation return flow, that is, percolation losses from irrigation water supply, is constrained by the reported country- specific loss factor based on ref. 26, where different irrigation types (such as flooding irrigation, sprinklers and drip) and the associated conveyance and management loss factors are considered.
We also note that the global model used to estimate groundwater depletion has been extensively validated in earlier work. For example, simulated river discharge, total water storage, total water withdrawal and total consumptive water use, and surface and groundwater withdrawal have been validated against discharge station data from the Global Runoff Data Centre (more than 3000 stations), GRACE (NASA Gravity Recovery and Climate Experiment) satellite observations, and country statistics from FAO AQUASTAT, EUROSTAT, USGS (United States Geological Survey), Indian, Chinese, and Mexican national government statistics, respectively1,5,25,27. These comparisons show good agreement for river discharge and total water storage (R2 greater than 0.8) for most of the catchments of the world. For water use, comparison with the reported value per country also shows a good agreement from 1970 to 2010, with R2 being over 0.95. Although the correlations are high for most countries, deviations are relatively large (more than 20%) for several countries like Iraq, Lithuania, Puerto Rico, Mali, Djibouti and Bhutan. However, these countries have negligible groundwater depletion and the overall impact on GWD embedded in trade flows is thus very limited.
Estimated groundwater depletion has also been validated for over 30 regions and mostly compared well (R2 about 0.8) with regional reported depletion values for areas including Northern India and Pakistan, North China Plains, High Plains Aquifer, Central Valley California, Arabian Peninsula, and Mexico25.Food production and trade data. We use detailed trade matrices data (FAOSTAT; http://www.fao.org/faostat/en/#data/TM) to calculate the trade T of a commodity c, from a country i to another country j in year n (2000 or 2010), noted T(i, j, c, n). To smooth out annual variability in trade data, we use a three-year average around each year of interest. We note that the portion of production not exported inter-nationally may be traded within the country’s boundaries, but we do not focus on this here.
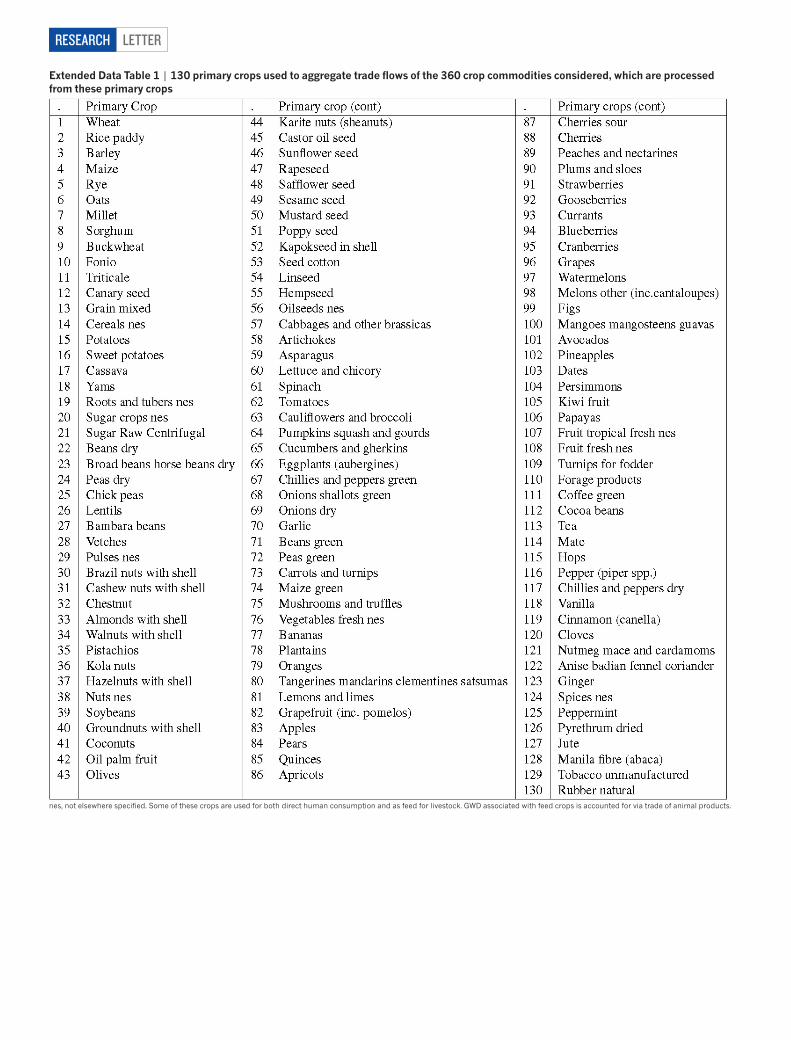
We first aggregate these trade matrices T for 360 commodities c (excluding those not present in trade data, mostly fodder crops, Extended Data Tables 1 and 2) into the primary crop equivalent of 130 primary crops (listed in Extended Data Table 1), using the following conversion factor based on the extraction rate R from FAO commodity trees28: ∑/ × / ′
′∈
R c R c R c(1 ( )) ( ( ) ( ))c branch
. The first term is based on
the definition of the FAO extraction rate, where R(c) is the FAO extraction rate for commodity c, and the second term avoids counting a primary crop twice (such as
raw wheat) if two by-products in the same branch (such as wheat bran and wheat flour) originating from this primary crop are traded. We also include estimates of feed crops embodied in traded animal products29. The trade matrices obtained are noted Tpe(i, j, c, n): trade from country i to j of commodities derived from primary crop c in year n, in primary crop equivalent.
Second, we correct trade flows by applying the origin-tracing algorithm developed in ref. 16. This is an important preliminary stage to the multiplication of trade flows by the water coefficient in the country of export. Some reported trade in the published FAOSTAT detailed trade matrices data (http://www.fao.org/faostat/en/#data/TM) can be re-exports (including after processing) of crops grown in a third country. This correction method aims to re-assign trade flows to the original country of production, addressing reported exports in excess of domestic production, based on production and trade data (FAOSTAT; http://www.fao.org/faostat/en/#data/QC and http://www.fao.org/faostat/en/#data/TM), so that the GWD intensity of the country of production is applied rather than that of an intermediary country.
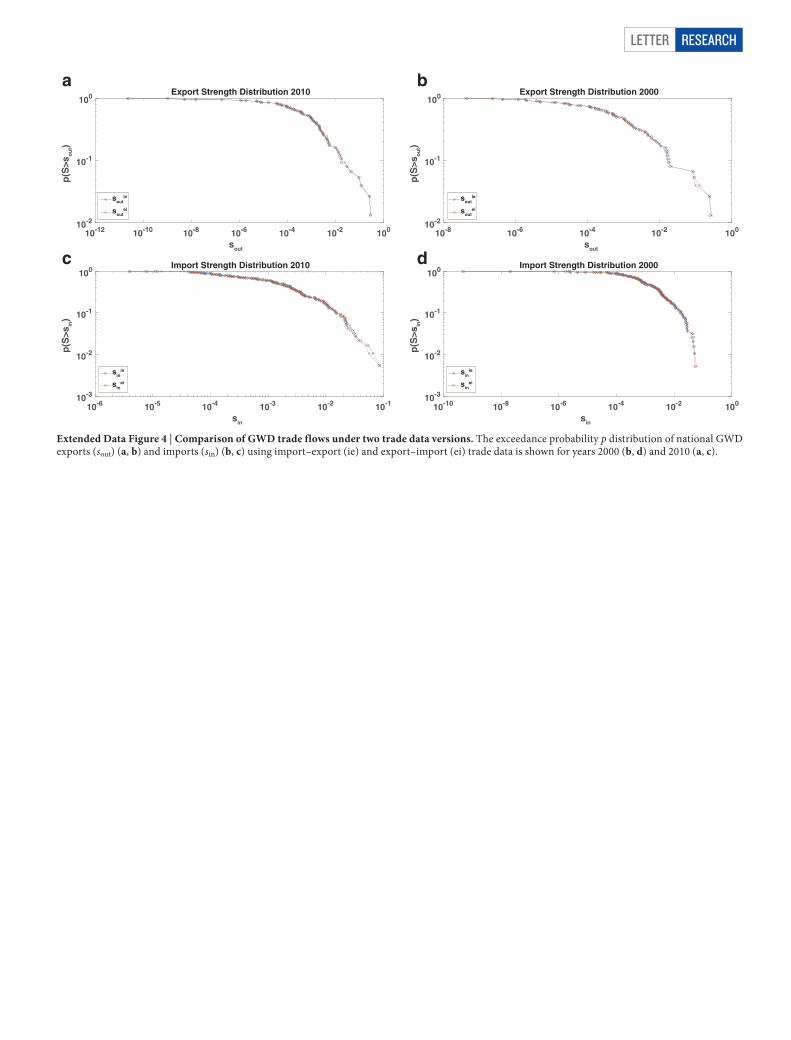
A potential source of uncertainty in the trade data relates to differences in reports by importers and exporters for the same trade link. For instance, country A reports an import volume from country B different from that of the export volume reported by country B to country A. This can be due to actual factors such as shipments leaving and arriving in different years or being rerouted while at sea, but can also be due to differences in reporting quality among nations. To test how this uncertainty affects the overall outcome of our study, we performed the calculations with two different trade datasets: import–export and export–import.
In the first trade dataset, import–export, we use reported import data, with reported export data only used to fill data gaps. Assuming that imports reporting is more reliable than exports reporting owing to customs records at the port of entry, we present our main results based on this version. In the second trade dataset, export–import, we use the reported export data, with reported import data only used to fill data gaps. We find that the distributions of national GWD exports and imports obtained using import–export trade data are very similar to those obtained with export–import trade data (Extended Data Fig. 4). For top trading nations, we find that varying trade data has a relatively small effect on national GWD imports and exports: less than 15% variation (Extended Data Table 3), with the exceptions of Bulgaria’s exports (41% or 0.19 km3) in 2010, Iran’s exports in 2000 (22% or 0.48 km3) and India’s imports in 2000 (57% or 0.45 km3).GWD intensity and GWD in trade. The groundwater depletion intensity (the GWD per unit crop) of each crop class in each country and year is obtained as follows:
∑= /∈
i K n i K n P i c nGWC( , , ) GWD( , , ) ( , , ) (1)c K
where GWC(i, K, n) is the groundwater depletion intensity (or ‘content’) of crops in class K, country i and year n (in kilograms of water per kilogram of crop); P(i, c, n) is the production of raw commodity c in country i and year n (in kilograms of crop), obtained from FAOSTAT (http://www.fao.org/faostat/en/#data/QC); and GWD(i, K, n) is the non-renewable groundwater abstraction for irrigation of crops in class K, for country i and year n (in kilograms of water). We obtain the list of raw commodities (c) belonging to each of the 26 MIRCA crop classes by using the MIRCA list24 and selecting the crops with extraction rate R(c) = 1. We then assume that, for country i and year n, each raw commodity in a class K (for example, lemon and orange in the citrus class) has a GWC equal to GWC(i, K, n).
The variability in GWD intensities across countries with GWD may be explained by two major factors: the crop’s water productivity and the mix of rainfall and irrigation water sources. For example, Pakistan and India have relatively similar water use for rice (3,300 and 2,900 litres per kilogram, respectively30), but because India has more surface water resources, it uses eight times less GWD per unit rice than Pakistan (148 litres per kilogram versus 1,280 litres per kilogram; see Supplementary Table 1).
Then we use the GWC coefficient to convert trade flows into virtual water flows, as follows:
= ×i j c n i K n T i j c nGWT ( , , , ) GWC( , , ) ( , , , ) (2)pe pe
where GWTpe(i, j, c, n) is the GWD embedded in trade from country i to j of com-modities derived from primary crop c in year n (kilograms of water), Tpe(i, j, c, n) is the trade from country i to j of commodities derived from primary crop c in primary crop equivalent (kilograms of crop) in year n, and K is the crop class to which primary crop c belongs. Finally, we obtain the GWD embedded in trade per crop class with the following sum: ∑=
∈
i j K n i j c nGWT ( , , , ) GWT ( , , , )c K
peclass
pe .

LETTER RESEARCH
Similarly, we calculate GWD embedded in production (GWP) by multiplying production by GWD intensity. We use food production data as three-year aver-ages around 2000 and 2010 (FAOSTAT; http://www.fao.org/faostat/en/#data/QC), corresponding to the commodities belonging to the 26 crop classes represented in the groundwater estimates (see list in ref. 24).
We find that a smaller share of GWD associated with food production is traded, relative to the share of food production being traded, which can be explained by two phenomena. First, crops with relatively smaller GWD intensity may be more traded than others, or countries with relatively less GWD may be exporting more than other countries. The former is true for soybean, which is much more traded (61% of production) than more GWD-intense rice (6%); however, GWD-intense wheat is slightly more traded (25%) than average. The latter is directly illustrated with India, the country with most GWD, which exports only 7% of its cereal production, while France, with little GWD, exports 47% of its cereal production (FAOSTAT; http://www.fao.org/faostat/en/#data/TM). However, other countries with significant GWD are large food exporters, such as the USA, with 22% of cereal production exported (FAOSTAT; http://www.fao.org/faostat/en/#data/TM).Code availability. The global hydrological model PCR-GLOBWB is an open source model that can be obtained from Utrecht University at http:// www.globalhy-drology.nl/models/pcr-globwb-2-0/. The algorithm for processing trade data is detailed in ref. 16, the corresponding code is available upon request (from T.K.). Similarly, the calculation of GWC and GWT is detailed in this section and the code is available upon request from C.D.Data availability. The data sources for groundwater abstraction per crop are listed above. Food production, food trade, population, and national harvested
area statistics are available in the FAOSTAT database (http://faostat.fao.org). The conversion factors from raw crop to processed crop commodities are given in Supplementary Table 2.
23. Siebert, S. & Doll, P. Quantifying blue and green virtual water contents in global crop production as well as potential production losses without irrigation. J. Hydrol. 384, 198–217 (2010).
24. Portmann, F., Siebert, S. & Doll, P. Mirca2000 global monthly irrigated and rainfed crop areas around the year 2000: a new high-resolution data set for agricultural and hydrological modeling. Glob. Biogeochem. Cycles 24, GB1011 (2010).
25. Wada, Y. et al. Past and future contribution of global groundwater depletion to sea-level rise. Geophys. Res. Lett. 39, L09402 (2012).
26. Rohwer, J., Gerten, D. & Lucht, W. Development of Functional Types of Irrigation for Improved Global Crop Modelling. Report 104 (Institute for Climate Impact Research, 2007).
27. Wada, Y., van Beek, L. & Bierkens, M. Modelling global water stress of the recent past: on the relative importance of trends in water demand and climate variability. Hydrol. Earth Syst. Sci. 15, 3785–3808 (2011).
28. FAO. Technical Conversion Factors for Agricultural Commodities. http://www.fao.org/fileadmin/templates/ess/documents/methodology/tcf.pdf (FAO Rome, January 2015).
29. Kastner, T., Karl-Heinz, E. & Haberl, H. Rapid growth in agricultural trade: effects on global area efficiency and the role of management. Environ. Res. Lett. 9, 034015 (2014).
30. Dalin, C. & Conway, D. Water resources transfers through Southern African food trade: water efficiency and climate signals. Environ. Res. Lett. 11, 015005 (2016).

LETTERRESEARCH
Arm
enia
Afg
hani
stan
Alge
riaAr
gent
ina
Aust
ralia
Aust
riaBa
hrai
nBe
lgiu
m L
uxem
bour
g
Bang
lade
shBr
azil
Bulg
aria
Cam
eroo
nCan
ada
SriLan
kaColo
mbia
Congo
Cuba
Denmark
Egypt
France
Germany
Greece
Guinea
India
Indonesia
Iran
IraqIrelandIsraelItalyCote d’IvoireJapanJordan
Kenya
Republic of Korea
Kuwait
Lebanon
Libya
Madagascar
Malaysia
MaliM
exico
Mor
occo
Net
herla
nds
Nig
erN
iger
iaN
orw
ayPakis
tan
Philipp
ines
PolandPortu
galQatarRomaniaRussiaSaudi ArabiaSingaporeSouth AfricaSpain
SudanSwedenSwitzerlandSyria
TurkmenistanThailand
OmanTunisia
Turkey
UAE
UK
Ukraine
USA
Burkina FasoU
zbekistanVenezuela
Yemen
Belgium
China2000
0.600.84
0.73
0.65
0.48
0.44
0.360.43
Extended Data Figure 1 | Embedded groundwater depletion in international trade of crop commodities in 2000. Volumes are given in units of cubic kilometres per year. The top ten importers are shown in bold font and the top ten exporters are underlined. Ribbon colours indicate the
country of export. For clarity, we display only the links with a weight of at least 1% that of the largest link (the top 1.8% links that account for 81% of total flow and involve 72 countries).

LETTER RESEARCH
Afg
hani
stan
Alg
eria
Arge
ntin
aAu
stra
liaAu
stria
Bahr
ain
Bang
lade
shBo
livia
Braz
il
Bulga
ria
Canada
SriLanka
ChileColombia
Cuba
Cyprus
Denmark
Belarus
EgyptEstonia
France
Georgia
Germany
GreeceGuineaHungaryIndia
IndonesiaIran
IraqIsrael
ItalyCote d’Ivoire
Kazakhstan
Japan
Jordan
Kenya
Republic of Korea
Kuwait
Lebanon
LibyaM
adagascar
Malaysia
Mexico
Mor
occo
Moz
ambi
que
Mol
dova
Net
herla
nds
Nig
eria
Pakis
tan
Czech
Rep
ublicPeru
Philipp
ines
Poland
Portug
alQatarRomania
Russia
SaudiArabia
SloveniaSlovakiaSomalia
SouthAfricaSpain
TajikistanSweden
SwitzerlandSyria
Tthailand
Oman
Tunisia
Turkey
UAE
UKUkraine
USAU
zbekistanVietnamEthiopiaYem
enBelgium
China
12.5
9.5
7.1
Extended Data Figure 2 | Embedded groundwater depletion in crop exports per capita in 2010. GWD is given in units of cubic metres per capita of the exporting nation per year. The top ten exporters are underlined. For clarity, we display only the links with a weight of at least 1% that of the largest link (the top 3.2% links that account for 79% of total flow).

LETTERRESEARCH
Arm
enia
Afg
hani
stan
Alge
riaAu
stra
liaAu
stria
Baha
mas
Bahr
ain
Barb
ados
Berm
uda
Bhut
anBo
tswan
aAru
baBe
lize
Bulgar
iaCan
ada
Cayman
Islan
ds
SriLan
ka
Costa Rica
Cyprus
Benin
Denmark
El Salvador
Faroe Islands
French Polynesia
Djibouti
GambiaGermanyKiribatiGreeceGuatemalaGuineaIceland
India
IranIraqIrelandIsraelItalyCote d’Ivoire
JordanKenya
Republic of Korea
Kuwait
Lebanon
Liberia
LibyaM
adagascar
Malaysia
Maldives
Malta
Mauritius
Mexico
Mozam
biqueNet
herla
nds
Net
herla
nds
Ant
illes
New
Zea
land
Nor
way
Pakist
an
PanamaCzech RepublicPortugalGuinea Bissau
Qatar
Romania
Saudi Arabia
Senegal
Seychelles
Sierra Leone
Slovenia
Slovakia
SingaporeSomalia
South AfricaSpain
Sweden
SwitzerlandSyria
Turkmenistan
Trinidad and TobagoO
man
TunisiaTurkey
UA
EU
K
69.011
6.3
62.7
20.8
Extended Data Figure 3 | Embedded groundwater depletion in crop imports per capita in 2010. GWD is given in units of cubic metres per capita of the importing nation per year. The top ten importers are shown in bold font. For clarity, we display only the links with a weight of at least 1% that of the largest link (the top 1.6% links that account for 76% of total flow).
LETTER RESEARCH
10-12 10-10 10-8 10-6 10-4 10-2 100
sout
10-2
10-1
100
p(S
>so
ut)
Export Strength Distribution 2010
soutie
soutei
10-6 10-5 10-4 10-3 10-2 10-1
sin
10-3
10-2
10-1
100
p(S
>sin)
Import Strength Distribution 2010
sinie
sinei
10-8 10-6 10-4 10-2 100
sout
10-2
10-1
100
p(S
>so
ut)
Export Strength Distribution 2000
soutie
soutei
10-10 10-8 10-6 10-4 10-2 100
sin
10-3
10-2
10-1
100
p(S
>sin)
Import Strength Distribution 2000
sinie
sinei
a b
c d
Extended Data Figure 4 | Comparison of GWD trade flows under two trade data versions. The exceedance probability p distribution of national GWD exports (sout) (a, b) and imports (sin) (b, c) using import–export (ie) and export–import (ei) trade data is shown for years 2000 (b, d) and 2010 (a, c).
LETTERRESEARCH
Extended Data Table 1 | 130 primary crops used to aggregate trade flows of the 360 crop commodities considered, which are processed from these primary crops
nes, not elsewhere specified. Some of these crops are used for both direct human consumption and as feed for livestock. GWD associated with feed crops is accounted for via trade of animal products.

LETTER RESEARCH
Extended Data Table 2 | Crops in the GWD data (from MIRCA crop classes) that are excluded from the trade analysis
Trade volumes of the excluded fodder crops and grasses are negligible relative to other crops included in our trade analysis. Sugar beet and sugar cane are included as a generic sugar crop related to the primary crop ‘sugar raw centrifugal’.
LETTERRESEARCH
Extended Data Table 3 | Largest GWD imports and exports and variability across two trade data versions
The groundwater depletion exported (imported) and used by ten countries with most depletion exports (imports), and the top partner importing from (exporting to) them in 2010 and 2000 are indicated using the groundwater depletion in national food production (GWP) and exports or imports (GWT). ‘Var’ is the difference between GWT with the export–import trade dataset and GWT with the import–export trade dataset, indicated in absolute (km3) and relative (%) terms.

LETTER RESEARCH
Extended Data Table 4 | Ten largest exporters of GWD per capita of exporting nation in 2010
Exported GWD is in cubic metres per capita.

LETTERRESEARCH
Extended Data Table 5 | Ten largest importers of GWD per capita of importing nation in 2010
Imported GWD is in cubic metres per capita.
LETTER RESEARCH
Extended Data Table 6 | Share of population dependent on GWD via food imports
Shown is the percentage of the world population importing at least 90% or 80% of a certain crop class from countries that have GWD associated with the production of these crops in years 2000 and 2010, for the ten most important crop classes in regards to this indicator.
Related Documents