STATE OF UTAH DEPARTMENT OF NATURAL RESOURCES Technical Publication No. 99 GROUND-WATER HYDROLOGY OF OGDEN VALLEY AND SURROUNDING AREA, EASTERN WEBER COUNTY, UTAH, AND SIMULATION OF GROUND-WATER FLOW IN THE VALLEY-FILL AQUIFER SYSTEM By Charles Avery U.S. Geological Survey Prepared by the United States Geological Survey in cooperation with the Utah Department of Natural Resources Division of Water Rights 1994

Welcome message from author
This document is posted to help you gain knowledge. Please leave a comment to let me know what you think about it! Share it to your friends and learn new things together.
Transcript

STATE OF UTAHDEPARTMENT OF NATURAL RESOURCES
Technical Publication No. 99
GROUND-WATER HYDROLOGY OF OGDEN VALLEY ANDSURROUNDING AREA, EASTERN WEBER COUNTY, UTAH,
AND SIMULATION OF GROUND-WATER FLOW IN THEVALLEY-FILL AQUIFER SYSTEM
By Charles AveryU.S. Geological Survey
Prepared by theUnited States Geological Survey
in cooperation with theUtah Department of Natural Resources
Division of Water Rights1994

CONTENTS
Abstract 1Introduction 2
Purpose and scope 3Methods of investigation........................................................................................................................ 3Previous studies 3Hydrologic-data site numbering system 4Acknowledgments 4
Description of study area.................................................................................................................................. 4Physiography........................................................................................... 4Climate 4Population, land use, and water supplies.. 6Hydrogeologic setting 7
Stratigraphy and hydrogeologic units 7Structure 7
Surface-water hydrology 14Streams 14Reservoirs 14Irrigation and other diversions 20Water quality 21
Ground-water hydrology of consolidated rocks surrounding Ogden Valley..................................................... 21Recharge 21Discharge '" 25
Ground-water hydrology of valley-fill deposits in Ogden Valley.................................................................... 27Recharge '" 27Movement. 37Hydraulic characteristics. 37Storage. 42Discharge . 42Effects of Pineview Reservoir 51Water quality 51
Water budget for the valley-fill aquifer system................................................................................................. 53Recharge '" 53
Precipitation 53Irrigation and irrigation distribution losses 53Losing streams 57Pineview Reservoir. 59Subsurface inflow 59
Discharge 60Gaining streams 60Springs and drains....................................................... 61Wells. 61Evapotranspiration. 61Pineview Reservoir 63Subsurface outflow...... 63
Simulation of ground-water flow in the valley-fill aquifer system 63Model design and assumptions............ 63
Model boundary conditions 65
iii
CONTENTS-Continued
Streams 65Drains 67Wells 67Evapotranspiration 67Areal recharge 67Hydraulic properties 67
Hydraulic conductivity 67Storage coefficient............................................................................................................. 68Vertical hydraulic conductivity 68
Initial conditions........................................................................................................................... 68Model calibration and simulation 71
Steady-state calibration................................................................................................................ 71Water levels........................ 71Gains and losses in streams and drains............................... 71Water budget 73
Transient simulation..................................................................................................................... 73Water-level changes 73Spring Creek drainage 74Water budget 74
Simulation of hypothetical conditions 75Drought......................................................................................................................................... 79Increased discharge from wells 79
Need for further refinement of the computer simulation.................. 81Summary and conclusions................................................................................................................................. 81References cited................................................................................................................................................ 82
PLATES
[Plates are in pocket]
1. Map showing geology, precipitation, and selected hydrologic-data sites in Ogden Valley, Utah,and surrounding area
2. Map showing hydrologic-data sites and ground-water quality in Ogden Valley, Utah, 1985
FIGURES
1. Map showing location of the study area 22. Diagram showing numbering system used in Utah for hydrologic-data sites. 53. Photograph of the Wasatch Range on west side of Ogden Valley near Liberty, Utah 64. Photograph of Pineview Reservoir (looking north along the North Fork Ogden River arm of
the reservoir) 75. Map showing thickness of valley-fill deposits 136. Map showing location of sites in Spring Creek drainage where discharge was measured monthly.. 167. Hydrograph showing daily mean discharge at Spring Creek at Huntsville (station 10137900),
September 1985 through April 1987.... 178. Composite hydrograph of discharge determined from monthly measurements at seven sites iII
the Spring Creek drainage, November 1984 through June 1986 18
iv

FIGURES-Continued
9. Hydrographs of daily mean discharge at the South Fork Ogden River near Huntsville (station10137500) and at Wheeler Creek near Huntsville (station 10139300), July 1984 throughSeptember 1986 19
10. Photograph of Liberty Springs at Liberty, Utah (looking east from hillside on Wasatch Rangetoward Bear River Range) 27
II. Map showing potentiometric surface of the principal aquifer, June 1985 38
12-19. Hydrographs showing:12. Water level in wells in the upper South Fork Ogden River valley, 1984-86 3913. Water level in wells near the Ogden well field and Pineview Reservoir, and stage of
Pineview Reservoir, 1984-86 4014. Water level in wells in the principal aquifer near Pineview Reservoir, 1935-61 4315. Water level in wells in the principal aquifer near Pineview Reservoir, 1932-84 4416. Water level in wells in the principal aquifer and stage of Pineview Reservoir, 1984-86 4517. Water level in wells in the upper South Fork Ogden River valley, 1984-86 4618. Water level in wells in the North Fork Ogden River valley, 1984-86 4719. Water level in wells near the North Fork Ogden River channel, 1984-86 48
20. Map showing water-level rise in the principal aquifer from late February to early June 1985 4921. Hydrographs showing water level in wells in the shallow water-table aquifer, 1970-71 5022. Graphs showing Ogden well-field pumpage, water level in well (A-6-2)18bad-l, and stage of
Pineview Reservoir, July 1984 through July 1986 6223. Schematic section of the two-layer ground-water flow model simulating the aquifer system in
Ogden Valley 6424-26. Maps showing:
24. Model grid, areal distribution of active cells, and boundary steady-state recharge anddischarge for the model of the ground-water system in Ogden Valley........................................ 66
25. Distribution of hydraulic-conductivity values for layer 2 (principal aquif~r) of computermodel for Ogden Valley............................................ 69
26. Distribution of hydraulic-conductivity values for layer 1 (shallow water-table aquifer)of computer model for Ogden Valley............. 70
27. Graphs showing simulated and measured water-level change for three observation wells in theupper North Fork Ogden River valley, 1985-86 76
28. Graphs showing simulated and measured water-level change for three observation wells in thesouth part of Ogden Valley, 1985-86 77
29. Map showing simulated water-level change in the principal aquifer, mid-February throughMay 1985 78
30. Graphs showing water-level change in wells for 1985-86 simulation and for droughtsimulation 80
TABLES
I. Description of hydrogeologic units..................................................................................................... 82. Streamflow characteristics at selected gaging stations 153. Mean monthly and mean annual discharge for selected gaging stations 154. Miscellaneous measurements of streamflow, specific conductance, and water temperature
during base flow in Ogden Valley, February 23 to March I, 1985 225. Miscellaneous measurements of streamflow, specific conductance, and water temperature during
base flow, upper Middle Fork Ogden River, October 1984, and Wheeler Creek, October 1985 246. Records of springs...................................... 28
v

TABLES-Continued
7. Records of wells.................................................................................................................................. 30
8. Chemical analyses of water samples from wells 54
9. Chemical analyses of water samples from springs 56
10. Water budget for the valley-fill aquifer system, mid-February 1985 through January 1986 58
11. Water level in selected observation wells during February and June 1985 and May 1986 72
12. Simulated water budget for the valley-fill aquifer system, mid-February 1985 throughJanuary 1986 74
13. Simulated and measured discharge to Spring Creek........................................................................... 79
CONVERSION FACTORS, VERTICAL DATUM, AND ABBREVIATED WATER-QUALITY UNITS
Multiply By To obtain
acre 4,047 square meter0.004047 square kilometer
acre-foot 1,233 cubic metercubic foot per second 0.02832 cubic meter per second
28.32 liter per secondfoot 0.3048 meter
foot per day 0.3048 meter per dayfoot squared per day 0.0929 meter squared per day
gallon 3.785 litergallon per minute 0.06308 liter per second
inch 25.4 millimeter2.54 centimeter
mile 1.609 kilometersquare mile 2.590 square kilometer
Water temperature is given in degrees Celsius (0C), which can be converted to degrees Fahrenheit (oF) by thefollowing equation:
OF = 1.8 (0e) + 32.
Air temperature is given in degrees Fahrenheit (OF), which can be converted to degrees Celsius (oC) by thefollowing equation:
°C =(OF - 32)11.8.
Sea level: In this report "sea level" refers to the National Geodetic Vertical Datum of 1929-a geodetic datumderived from a general adjustment of the first order level nets of the United States and Canada, formerly called SeaLevel Datum of 1929.
Chemical concentration is given in milligrams per liter (mg/L) or micrograms per liter (j..lglL). Milligrams perliter expresses the concentration of chemical constituents in solution as weight (milligrams) of solute per unitvolume (liter) of water. One thousand micrograms per liter is equivalent to 1 milligram per liter. For concentrationsless than 7,000 milligrams per liter, the numerical value is about the same as for concentrations stated in the inchpound units of parts per million.
vi

GROUND-WATER HYDROLOGY OF OGDEN VALLEYAND SURROUNDING AREA, EASTERN WEBERCOUNTY, UTAH, AND SIMULATION OF GROUND-WATERFLOW IN THE VALLEY-FILL AQUIFER SYSTEM
By Charles AveryU.S. Geological Survey
ABSTRACT
The ground-water resources in Ogden Valley, eastern Weber County, Utah, were the subjectof a study to provide a better understanding of thehydrologic system in the valley and to estimate thehydrologic effects of future ground-water development. The study area included the drainage basinof the Ogden River upstream from Pineview Reservoir dam and the drainage basin of Wheeler Creek.Ogden Valley and the surrounding area are underlain by rocks that range in age from Precambrian toQuaternary.
The consolidated rocks that transmit andyield the most water in the area surrounding OgdenValley are the Paleozoic carbonate rocks and theWasatch Formation of Tertiary age. Much of therecharge to the consolidated rocks is from snowmelt that infiltrates the Wasatch Formation, whichunderlies a large part of the study area. Dischargefrom the consolidated rocks is by streams, evapotranspiration, springs, subsurface outflow, andpumping from wells. Water in the consolidatedrocks is a calcium bicarbonate type and has a dissolved-solids concentration of less than 250 milligrams per liter.
The unconsolidated valley-fill deposits,which constitute the valley-fill aquifer system, aremore than 750 feet thick in parts of Ogden Valley.Water in the northern part of Ogden Valley andalong the margins of the southern part of the valleyis unconfined; water in the center of the southernpart of the valley is confined in the lower, principalaquifer and unconfined in the overlying shallowwater-table aquifer. Direct infiltration from snow-
melt and seepage from stream channels are themajor sources of recharge during spring runoff.During the remainder of the year, subsurfaceinflow from bedrock and infiltration of irrigationwater probably are the major sources of recharge.Ground-water discharge occurs by seepage tostreams, springs, drains, and Pineview Reservoir;by evapotranspiration; and by pumping fromwells.
Ground-water flow in the principal aquifer isfrom the valley margins toward Pineview Reservoir in the southern part of Ogden Valley. Mostground-water flow near Pineview Reservoir isupward but downward leakage may occur near theOgden well field.
In general, the dissolved-solids concentration of water in the valley-fill aquifer system doesnot exceed 350 milligrams per liter. Most of thewater is a calcium bicarbonate type.
A three-dimensional finite-difference computer model of the valley-fill aquifer system wasused to simulate ground-water flow. Transmissivity values for the principal aquifer estimated fromthe model ranged from 20 to 230,000 feet squaredper day. Simulated recharge to the valley-fill aquifer system determined for the transient simulationranged from 109 to 284 cubic feet per second, andsimulated discharge ranged from 115 to 209 cubicfeet per second. The model also was used to simulate the hydrologic effects of a hypothetical 1year drought and increased discharge from wells.

1140 1'3" 1120
42"'-- - - ---,- - - --~ - ~-I\.( I
I \ CACHE\ I1BOX ELDER ,~.~~CHI
I ~:Jtat 0 ~~l. J41oL__~~_ .I~ ~~""".It;.':'_--l10
0
_
, _~ SUMM~_ roA(~GET1-1 I
Sa~~ ke City --...,~ --'I. '1lSAL~ ~('- 11
1
-/- I UINTAH '
I ILAK';r'/"jASAlCH I
I t........... ,I, I I
~L_'""~---~,d~;~-\J ,",""" ! iI l. L..;---,----'-------,. I
1JUAB (- r" CARBON f I
I-----------lir-) i \------t-----1I MILLARD I SANPETE I EMERY r GRAND I
39' 1- /)-------1 { -I,' I '
~--------.L;./ SEVIER' \.---1___--,,-_-.l ----J _
I BEAVER \'\ PIUTE r \. I
38" ~---------~---'----WAY~~----; jI IRON'--: GARFIELD r( I
I r' ,I
t---LL.._.,-J--L------------J) SAN JUAN IWASHINGTON I KANE,} II' ,I I j I3JO ol.....- __ ----J..j ... _ ----d: ..l ...l.- _ - .--I
o 20 40 60 MILES
6 2'0 40 60 KILOMETERS
EXPlANATION
~ STUDYAREA
Figure 1. Location of the study area.
INTRODUCTION
Since about 1915, Ogden, Utah (fig. 1), whichhad a population of 64,907 in 1980 (Bureau of the Census, 1982), has obtained most of its municipal watersupply from Ogden Valley in eastern Weber County,northern Utah (pI. 1). At present (1987), Ogden obtainsmost of its municipal water supply from ground waterfrom a well field in Ogden Valley and from surfacewater from Pineview Reservoir and Wheeler Creek (pI.2). Because the population of Ogden has decreasednearly 10 percent since 1960, additional municipalwater supplies probably will not be needed in the nearfuture. In contrast, the population in Ogden Valley hasincreased steadily, especially in the last few years, andprobably will continue to increase. Thus, the need for
2
additional municipal water supplies in the valley willincrease.
Land use in Ogden Valley is changing from cropland and pasture that is irrigated almost entirely by surface-water sources and springs to subdivided housingtracts that primarily use individual or small communitywells. Hydrologic changes that result from the changesin land use may affect the quantity and quality ofground water.
The increased use of ground water in Ogden Valley and the potential effects of land-use changes onwater quantity and quality is of concern to local waterusers, developers, and the State of Utah. In addition,downstream users are concerned that increased groundwater withdrawals may reduce streamflow. To addressthese concerns, the U.S. Geological Survey, in cooperation with the Utah Department of Natural Resources,Division of Water Rights, studied the ground-waterresources of Ogden Valley from July 1984 to June1987. The purpose of the study was to provide a betterunderstanding of the hydrologic system in Ogden Valley and to estimate the hydrologic effects of futureground-water development.
Most usable ground water in Ogden Valleycomes from aquifers in the unconsolidated valley-filldeposits. The valley-fill deposits in Ogden Valleyextend about IS miles in length, I to 4 miles in width,and trend in a northwest-southeast direction. The seriesof aquifers and confining units of the unconsolidatedvalley-fill deposits are referred to as the valley-fill aquifer system in this report.
Ground water in Ogden Valley has been considered fully appropriated for many years. Additionalwater development in the area could be accomplishedthrough a transfer based on an existing irrigation-waterright or through an exchange of surface-water rights forwater in Pineview Reservoir, which stores water forirrigation, municipal supply, hydroelectric-power generation, and flood control. Surface-water rights areleased from the Weber Basin Conservancy District.The majority of surface-water-right exchanges are fordomestic use although some large users recently havefiled exchange applications. Through the surfacewater-right exchange application program, the quantityof water that will be pumped by the new well is releasedfrom Pineview Reservoir. The surface-water-rightexchange application program assures an adequate supply of water for downstream users. Downstreamdemands on Ogden River water include irrigation,municipal supply, and hydroelectric-power generation.

Purpose and Scope
This report describes the results of the hydrologicstudy of Ogden Valley and the surrounding area.Hydrologic data collected during the study and selecteddata from previous studies were used to interpret theground-water hydrology of the study area. These datawere also used to develop a digital-computer model tosimulate ground-water flow in the aquifer system ofOgden Valley.
The report describes hydrologic conditions inOgden Valley in terms of ground-water recharge,movement, and discharge; surface-water and groundwater relations; ground-water storage; and generalwater quality. A water budget for 1985 was preparedfrom data collected during 1985 and from other information. Available data were evaluated in the context ofunderstanding and analyzing changes to the hydrologicsystem.
Methods of Investigation
Most of the detailed hydrologic data for thisstudy were collected from August 1984 to July 1986.Additional data from other sources also are included inthis report. Electrical resistivity soundings were madethroughout Ogden Valley to estimate the thickness ofalluvial deposits. Major springs and wells in OgdenValley and the surrounding area, including all publicsupply and other large-yield wells, were inventoried.Water levels in 21 wells were measured monthly(except for biweekly measurements in April 1985) fora 2-year period. Also, water levels in a large number ofwells were measured in February and June 1985 and inJune 1986. A 4-day aquifer test was conducted on 7observation wells in the city of Ogden well field. Single-well, I-hour aquifer tests were conducted on 5domestic wells.
Measurements were made of water dischargingfrom the valley-fill deposits into Pineview Reservoir.Open-ended barrels that had a collection port on theclosed end (seepage meters) were driven into the bottom of the reservoir, and the volumes of water collectedover time were measured. Data obtained were used tocalculate the estimated total discharge.
Surface-water and water-quality data also werecollected. Streamflow measurements were made during February 1985 on major streams, except for theSouth Fork Ogden River. Streamflow measurementswere made on the upper Middle Fork Ogden River dur-
ing October 1984 and on Wheeler Creek during October 1985. Flow measurements were made on severalirrigation ditches during the summer of 1985. Watersamples from 23 wells, 5 springs, and 2 minor seepswere collected to analyze the quality of ground water.
A three-dimensional, finite-difference digitalcomputer model was used to simulate ground-waterflow in the valley-fill aquifer system of Ogden Valley.The model was used to evaluate the adequacy of available data in simulating ground-water flow in OgdenValley. Hydrologic effects of a hypothetical droughtand of increased withdrawals from wells also were simulated.
Previous Studies
Fortier (1897) made discharge measurements ofthe Ogden River, its major tributaries, and irrigation useto resolve a water-rights dispute between irrigators inOgden Valley and irrigators near Ogden. From July toSeptember, increasingly more surface water flowed outof the valley than flowed into it; the discrepancy wasattributed to seepage from irrigated lands that had beenreturned to surface water.
Browning (1925) analyzed a series of surfacewater discharge measurements made on the OgdenRiver system during the summers of 1921 and 1925.Numerous gaining and losing reaches in the river system were detected and related to the hydraulic connection between river and aquifer. Browning (1925)indicated that withdrawals from the now-abandonedOgden artesian well field may have had some effect onstreamflow depletion.
The first comprehensive study of ground-waterresources for Ogden Valley was conducted by Leggetteand Taylor (1937). Leggette and Taylor (1937) investigated the ground-water hydrology near the Ogden artesian well field before the existence of PineviewReservoir.
Thomas (1945, 1952, 1963) used water-level datato identify sources of recharge to the artesian aquifer inthe valley-fill deposits that supplies the Ogden artesianwell field. He also determined a tentative water budgetfor the aquifer (Thomas, 1963).
Lofgren (1955) described the vaHey-fill depositsin Ogden Valley. Some inferences were made as to thehydrologic characteristics of the various deposits.
The most recent hydrologic study in Ogden Valley was conducted by Doyuran (1972). Water-quality
3

sampling indicated coliform counts that locallyexceeded standards and iron bacteria in water that discharged from artesian wells. Vegetation distributionwas mapped, and vegetative evapotranspiration wasestimated.
Hydrologic-Data Site Numbering System
The hydrologic-data site numbering system usedin Utah is shown in figure 2. Surface-water gaging stations that have continuous discharge records availableare identified by an eight-digit downstream-order number adopted by the U.S. Geological Survey. For example, the gaging station on the South Fork Ogden Rivernear Huntsville, Utah, is designated 10137500.
Acknowledgments
The author gratefully acknowledges the cooperation given by Gary Clark and the Ogden City WaterUtilities during the 4-day aquifer test. Thanks also areexpressed to those persons who permitted access totheir property and water wells in order to accomplishthe necessary data collection.
DESCRIPTION OF STUDY AREA
The study area consists of the drainage basin ofthe Ogden River upstream from the dam at PineviewReservoir, which was completed in 1936, and the drainage basin of Wheeler Creek, which flows into theOgden River just downstream from the Pineview Reservoir dam. The drainage area of the Ogden Riverupstream from Pineview Reservoir dam is 310 squaremiles; the drainage area of Wheeler Creek is 11.1square miles. Downstream from Pineview Reservoirdam, the Ogden River flows through Ogden Canyon tothe Great Salt Lake, west of Ogden, Utah.
Physiography
The study area is in the Middle Rocky MountainsPhysiographic Province (Fenneman, 1931), which ischaracterized mainly by anticlinal mountain ranges andintermontane basins. The Wasatch Range borders thewest side of Ogden Valley, and the Bear River Range, asubdivision of the Wasatch Range, borders the northeast side of Ogden Valley. Ogden Valley is in the lowwestern part of the study area. Pineview Reservoir is inthe southern part of Ogden Valley and is a control forsurface-water discharge from the valley. The three
4
major tributaries of the Ogden River-the North Fork,Middle Fork, and South Fork-flow from the uplandareas surrounding Ogden Valley into Pineview Reservoir (pI. 1).
High mountains border Ogden Valley except onthe north and south where lower hills form dividesbetween the Ogden River and adjacent drainages. Thealtitude of the southeastern part of the valley is about4,900 feet. The altitude increases to about 5,000 feet atthe North Fork Ogden River at Eden and to about 5,100feet at the canyon mouths of Middle Fork Ogden Riverand South Fork Ogden River. The altitude of the northern part of the valley near Eden is about 5,100 feet. Thealtitude increases to about 5,600 feet in the upper NorthFork Ogden River drainage, north of Liberty. Themountains surrounding Ogden Valley are more than3,000 feet above the valley floor (fig. 3). About 15 percent of the study area is above 8,000 feet (Haws andothers, 1970, fig. 4). Willard Peak, northwest of OgdenValley, is the highest point in the study area and has analtitude of 9,764 feet.
Climate
Climatic records have been collected at the site ofPineview Reservoir dam since 1935. Average annualprecipitation at the station for 1951-80 was 28.79inches (U.S. National Oceanic and AtmosphericAdministration, 1982). Annual precipitation for 19351986 ranged from 17.09 inches in 1966 to 53.45 inchesin 1983. The climate at Pineview Reservoir dam isaffected by orographic features of Ogden Canyon.
Two other stations recently have been establishedto record climatic data. One station is at HuntsvilleMonastery in the southeastern part of Ogden Valley,and the other is at Snow Basin in the mountains of thesouthwestern part of the study area. Sufficient record isnot available to establish long-term climatic values atthese stations; however, the average annual precipitation at Pineview Reservoir dam for 1977-85 was 11.9inches greater than that at Huntsville Monastery.
The estimated distribution of normal (1931-60)annual precipitation ranges from about 20 inches nearHuntsville and the low hills to the south to about 40inches near the high mountains on the west side of thestudy area (U.S. Weather Bureau, 1963). The averageannual precipitation in the Ogden River drainage abovePineview Reservoir dam is about 20.5 billion cubic feetbased on the U.S. Weather Bureau (1963) precipitationdistribution. The Wheeler Creek drainage receives an
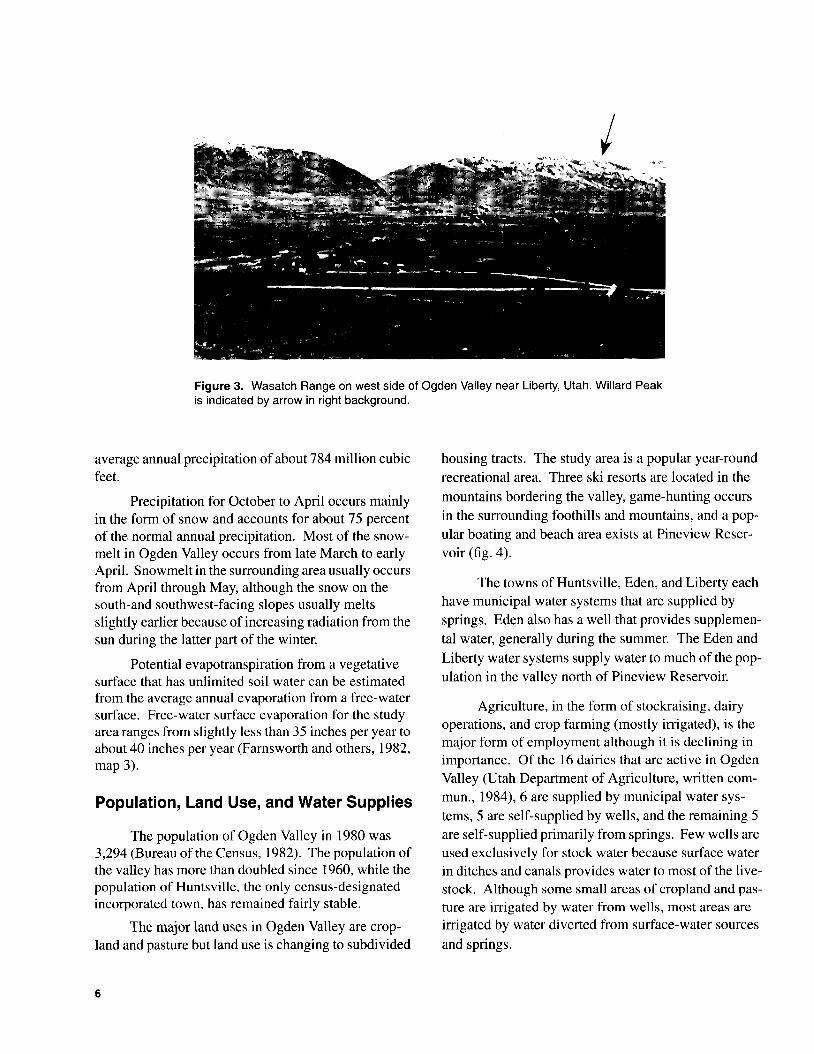
Figure 3. Wasatch Range on west side of Ogden Valley near Liberty, Utah. Willard Peakis indicated by arrow in right background.
average annual precipitation of about 784 million cubicfeet.
Precipitation for October to April occurs mainlyin the form of snow and accounts for about 75 percentof the normal annual precipitation. Most of the snowmelt in Ogden Valley occurs from late March to earlyApril. Snowmelt in the surrounding area usually occursfrom April through May, although the snow on thesouth-and southwest-facing slopes usually meltsslightly earlier because of increasing radiation from thesun during the latter part of the winter.
Potential evapotranspiration from a vegetativesurface that has unlimited soil water can be estimatedfrom the average annual evaporation from a free-watersurface. Free-water surface evaporation for the studyarea ranges from slightly less than 35 inches per year toabout 40 inches per year (Farnsworth and others, 1982,map 3).
Population, Land Use, and Water Supplies
The population of Ogden Valley in 1980 was3,294 (Bureau of the Census, 1982). The population ofthe valley has more than doubled since 1960, while thepopulation of Huntsville, the only census-designatedincorporated town, has remained fairly stable.
The major land uses in Ogden Valley are cropland and pasture but land use is changing to subdivided
6
housing tracts. The study area is a popular year-roundrecreational area. Three ski resorts are located in the
mountains bordering the valley, game-hunting occursin the surrounding foothills and mountains, and a popular boating and beach area exists at Pineview Reservoir (fig. 4).
The towns of Huntsville, Eden, and Liberty eachhave municipal water systems that are supplied bysprings. Eden also has a well that provides supplemental water, generally during the summer. The Eden andLiberty water systems supply water to much of the population in the valley north of Pineview Reservoir.
Agriculture, in the form of stockraising, dairyoperations, and crop farming (mostly irrigated), is themajor form of employment although it is declining inimportance. Of the 16 dairies that are active in OgdenValley (Utah Department of Agriculture, written commun., 1984),6 are supplied by municipal water systems, 5 are self-supplied by wells, and the remaining 5are self-supplied primarily from springs. Few wells areused exclusively for stock water because surface waterin ditches and canals provides water to most of the livestock. Although some small areas of cropland and pasture are irrigated by water from wells, most areas areirrigated by water diverted from surface-water sources
and springs.

Figure 4. Pineview Reservoir (looking north along the North Fork Ogden River arm ofthe reservoir). Ogden well field is indicated by arrow on promontory on right side ofphotograph.
Hydrogeologic Setting
Ogden Valley and the surrounding area areunderlain by rocks that range in age from Precambrianto Quaternary although Mesozoic rocks are not found inthe area (table 1). The Precambrian rocks are mainlymetasedimentary. Carbonate rocks predominate in thePaleozoic sequence, whereas deposits of Cenozoic ageare predominately alluvial in origin. At its higheststage of about 5,090 feet, Pleistocene Lake Bonnevilleextended into Ogden Valley through Ogden Canyon.Unconsolidated lacustrine sediments undoubtedly weredeposited in the valley, but stratigraphic correlation toother Lake Bonneville deposits was not attempted.
Stratigraphy and Hydrogeologic Units
Rocks in the stratigraphic section were groupedinto six hydrogeologic units (table 1) based on relatively uniform lithology, similarity in values of primarypermeability, and types and values of secondary permeability. The hydrogeologic units are the valley-filldeposits of Quaternary age (including fluvial, slopewash, and fanglomerate deposits), Norwood Tuff ofTertiary age, Wasatch Formation of Tertiary age, carbonate rocks of Paleozoic age, clastic rocks of lower
Cambrian age, and metasedimentary rocks of Precambrian age.
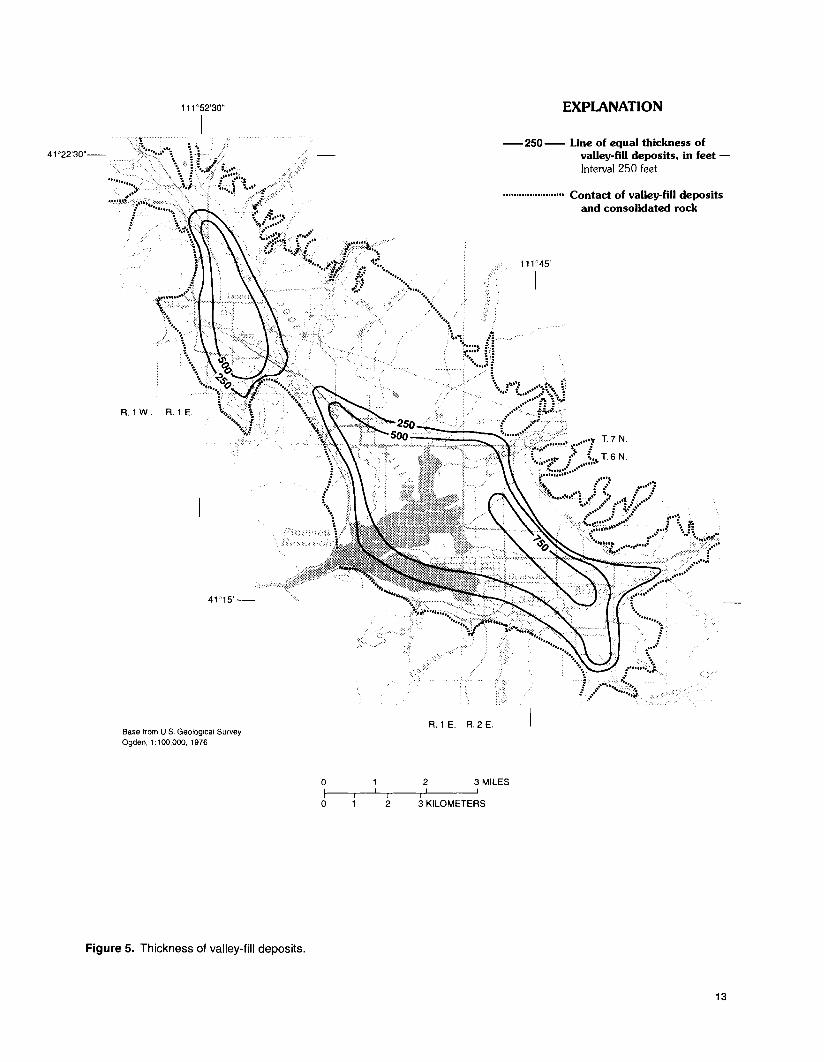
On the basis of drillers' logs and a resistivity survey, the valley-fill deposits in Ogden Valley are estimated to be greater than 500 feet thick at Liberty andgreater than 750 feet thick northeast of Huntsville, Utah(fig. 5). A gravity survey by Stewart (1958) indicatesthat the Wasatch Formation, Norwood Tuff, and valleyfill deposits in Ogden Valley may be as much as 5,000feet thick.
Structure
Ogden Valley is a graben having west-and eastbounding faults oriented in a northwest-southeastdirection. Along the faults, fairly permeable alluviumcommonly is displaced against less permeablemetasedimentary rocks or Norwood Tuff. Stewart(1958) determined that displacement on the westernfault zone of Ogden Valley was 2,000 feet, and displacement on the eastern fault zone was 1,800 feet. Abranch of the western fault zone may displace the nearsurface sediments, now under Pineview Reservoir, byabout 25 feet as shown on a cross section interpretedfrom well logs (Thomas, 1945, fig. 2). Stewart (1958)mapped another possible buried fault parallel to thewestern-bounding fault.
7

Table 1. Description of hydrogeologic units
Hydrogeologic units: The codes shown with unit names are used to identify hydrogeologic units, formations, or other deposits in plate I and
in tables 6,7, 8, and 9.
General lithology and thickness: Descriptions modified from Lofgren (1955), Mullens (\ 969), Crittenden (1972), Sorensen and Crittenden
(1979), Crittenden and Sorensen (\ 985a, 1985b), and Davis (\ 985).
ECI>
..c:-ell...W
ECI>
"ien
tilCI>';:CI>en
Q)l:::Q)ooS'"]!l1.'tll:::IIIQ)l:::Q)oo
15:I:
Formation or deposit
Fluvial deposits(lIIALVM)
Siopewash and fanglomerate(lIIALVM)
Valley-fill deposits(lIIALVM)
General lithology and thickness
Poorly sorted, unconsolidated silt, sand, gravel,and cobbles in flood plains and terraces as muchas 160 feet above river level. Thickness as muchas 20 feet.
QUarlzite cobbles, boulders, and gravel derivedprimarily from erosion of the WasatchFormation. Thickness as much as IDO feet.
Brownish-tan, well-sorted, unconsolidated sandand silt; gravel and cobbles along the majorstream channel. Thickness as much as 150 feet.
Water-bearingcharacteristics1
Low to moderate permeability.
Low to moderate permeability.
Moderate permeability.
Hydrogeologic
unit
>-:vl:::...~o ;,o 0
NoZwo
8
CUl:::cuoo...'""Qj
a:
Q)l:::Q)o
~'Qja:.2a:
'tlQ)l:::l:::IlI cuCUol:::oCUO!0,-0-wO4»4;e.~e.o:::l-
'tll:::'"Ill;'-0CUcu
l:::oCUIll0'"OCUcu'"-(JIll ...l1.cu-e.
CUe.~:::lo~0('0,w~
Valley-fill deposits(l12ALVM)
Valley-fill deposits(Il2ALVM)
Norwood Tuff(I 23NRWD)
Wasatch Formation and Evanston(?) Formation (undivided)(I 24WSTC)
Interbedded cobbles, gravel, sand, silt, and clay.A dark-blue and variegated, micaceous, siltyclay layer (as much as IDO feet thick) existsthroughout the lower valley. Probable thicknessas much as 500 feet.
Interbedded gravel, sand, silt, and clay. Thisdeposit likely occurs in deep parts of thestructural trough. Probable thickness as much as250 feet.
White to tan-weathering, fine- to mediumbedded, friable tuff and sandy tuff. Maximumthickness may exceed 1,200 feet.
Light reddish-brown, poorly sorted,unconsolidated to poorly consolidatedsandstone and pebble, cobble, and boulderconglomerate. Matrix is gravel, sand, and silt.Interbeds of sandy siltstone. Basal, brownishgray, conglomeratic sandstone, conglomerateand gray siltstone. Thickness as much a~ 3,DOOfeet.
Moderate to high permeability.Major water-yielding unit in OgdenValley. Well yields of more thanI ,DOO gallons per minute possible.
Moderate to high permeability.
Very low to low permeability.Small-yield wells pump from thisunit but drawdowns are large.
Low to moderate permeability.Major recharge medium for theupper drainage. Confined unit withlow artesian pressure.

Table 1. Description of hydrogeologic units-Continued
ECIls:.Ew
oo~woJ
~
:l'CCIlen
c:III'2III>>.UIc:c::.
c:III"Q.Q.
'iiiUI
"iiiUI
:E
c:III'2o>QIo
Formation or deposit
Park City Formation
Phosphoria Formation
Wells Formation
Round Valley Limestone
Humbug Formation(33IHMBG)
Lodgepole Limestone(337LDGP)
Deseret Limestone
Gardison Limestone
Beirdneau Sandstone
General lithology and thickness
Franson Member-Interbedded chert,limestone, sandstone, and sparse phosphate rockin upper part; light- to medium-gray, chertylimestone and dolomite in lower part. Thicknessabout 400 feet.Grandeur Member-Dark-gray, fetid limestoneand dolomite; basal, light-gray limestone.Thickness 250 to 280 feet.
Meade Peak Member-Dark-gray, phosphaticlimestone, dolomite, siltstone, and pelletalphosphorite. Thickness 230 feet.
Light-gray to grayish-orange sandstone. Minorlight-gray limestone and dolomite in upper part.Thickness 400 feet. Medium- to light-gray,granular dolomite and medium-dark-graylimestone in lower part. Thickness 200 feet.
Gray, cherty limestone and pale-red siltstone.Thin beds of gray to green limestone in upperpart; gray, cherty limestone in lower part.Thickness 250 to 300 feet.
Tan and gray siltstone and fine-grainedsandstone with interbedded dark- to mediumgray limestone and dolomite. Thickness about1,600 feet.
Dark-gray limestone; medium-gray dolomite attop. Thickness 900 feet.
Dark- to light-gray, medium- to thin-beddedlimestone and dolomite with thin beds of darkgray to black chert. Thickness 200 to 250 feet.
Medium- to dark-gray, thick-bedded to massivedolomite in upper part; dark-gray to black, thinto medium-bedded dolomite in lower part.Thickness 295 to 850 feet.
Tall-, orange-, and brown-weathering. fine- tomedium-grained sandstone. dolomiticsandstone, and dolomite. Thickness 250 to 300feet.
Water-bearingcharacteristics1
Probably low permeabilityresulting from bedding partings,fractures, and voids developedfrom solution of bicarbonate fromthe rock. Large springs in theeastern part of the study areaoriginate from this unit.
Hydrogeologic
unit
9

Table 1. Description of hydrogeologic units-Continued
IEIVJ:.~
III1-
LU
o<5NoW..J
~
IIICIl";:CIlen
c:.!!!c:o>CDC
c:.!!!5iii
c:l'll...-
8. .~0.0;:)'0o
c:l'll'':..cEl'lloa;0.0.
::::l
Formation or deposit
Hyrum Dolomite
Water Canyon Formation
Fish Haven Dolomite
and
Laketown Dolomite(undivided)
Garden City Formation
St. Charles Limestone(37ISCRL)
Nouman Dolomite
Bloomington Formation
Maxfield Limestone
General lithology and thickness
Dark-gray to black, thin- to thick-bedded, finegrained dolomite with lenses of intraformationaldolomitic breccia. Thickness about 350 feet.
Medium- to dark-gray dolomite in upper part;medium-gray dolomitic sandstone in lower part.Thickness about 80 feet.
Dark- to brownish-gray, very fine to finegrained dolomite; sparse beds of very light graydolomite. Thickness 520 to 650 feet.
Light-gray, medium- to thick-bedded limestone,dolomite, and dolomitic limestone withinterbedded siltstone or intraformationalconglomerate. Thickness about 350 feet.
Dark-gray, white-weathering, thin- to thickbedded dolomite with basal, gray-brownweathering quartzite. Thickness 450 to 700 feet.
Light-gray, thin- to thick-bedded, finelycrystalline dolomite with interbedded graylimestone in upper part. Thickness 450 to 650feet.
Tan to drab-olive, thin-bedded shale.Interbedded, gray to orange-brown limestone inupper part. Thickness 165 feet. Light- to darkgray limestone in middle part. Thickness 500feet. Tan and olive shale with some interbeddedgray limestone in lower part. Thickness 300feet.
Medium to dark-gray, thin-bedded limestonewith drab-olive to greenish-brown, micaceousshale interbedded with gray limestone in middlepart. Thickness 850 feet.
Water-bearingcharacteristics1
Hydrogeologic
unit
10

Table 1. Description of hydrogeologic units-Continued
EGl~
16..w
IIIGl
';::Glen
Formation or deposit
Blacksmith Limestone
General lithology and thickness
Gray- to blue-gray, thin- to medium-bedded
limestone and dolomite. Thickness about1,200('1) feet.
Water-bearingcharacteristics1
Hydrogeologic
unit
Light- to dark-gray, medium- to thin-beddedsilty limestone with interbedded gray sandstoneand greenish shale. Thickness 700(?) feet.
c.!!!iiEl'll()Glis'C:\j
Ute Limestone
Langston Dolomite Brown-weathering, thin-bedded,dolomite. Thickness 170 feet.
massive
()(5NoW..J
~
Cl'll';:J:IEl'll()
~o..J
Ophir Formation
Tintic Quartzite(374TNTC)
Geertsen CanyonQuartzite
Light blue-gray limestone and shaly limestone.Drab-olive shale in upper part, blue-graylimestone and tan to orange-brown limestone inmiddle part; light-brown to drab-olive,micaceous shale and brown-weatheringsandstone and dolomite in lower part.Thickness 450 to 600 feet.
White, pink, buff, and tan, medium- to thickbedded, medium- to coarse-grained quartzite;interbeds of quartz-pebble conglomerate.Thickness I, I00 to 1,400 feet.
White, gray, pink, and light-green, medium- tocoarse-grained quartzite in upper part; tan,white, maroon, and green quartzite in lowerpart. Thickness 4,000 to 4,400 feet.
Probably very low permeability.Most water movement is throughfractures.
z«ii:III::::E«()wa:Q.
0..::JeoEl'll
.r::OJc
05
Browns HoleFormation
Mutual Formation(400MUTL)
Inkom Formation
White to terra cotta, well-sorted, medium- tofine-grained quartzite with gray-weathering,dense basalt and reworked volcanicconglomerate in lower part. Thickness about400 feet.
Grayish-red, pink, maroon, and pale-purplish,medium- to coarse-grained quartzite. Thickness435 to 1,200 feet.
Purple and drab-olive-green, thin-beddedsiltstone, sandstone, argillite, and quartzite withgray-weathering, basal tuff. Thickness 360 to450 feet.
Probably very low permeability.Most water movement is throughfractures. One well in the MutualFormation flows at a high rate.
11

Table 1. Description of hydrogeologic units-Continued
EQl.c(;j..w
zoct:ii:lD:i:oct:()WII:0.
Formation or deposit
Caddy Canyon Quartzite
Kelley Canyon Formation
Maple Canyon Formation
Formation of Perry Canyon
Formation of Facer Creek
General lithology and thickness
White, tan, gray, green, and purple, medium~
grained quartzite. Thickness 1,500 to 2,500 feet.
Dark~gray to black argillite. Locally, drab~
olive siltstone and thin quartzite at top, pinkish~
gray limestone in middle, and gray~weathering
dolomite at base. Thickness 2,000 feet.
Light~green to greenish~gray, arkosic quartziteand sandstone. Conglomeratic quartzite anddrab~olive argillite in upper part, drab~olive
argillite in lower part, and, locally, basal graylimestone. Thickness about 1,500 feet.
Upper member-Medium~ to dark~gray,
medium~ to fine~grained, graywacke and gray todark~green, micaceous siltstone. Thicknessabout 1,400 feet.Lower member-Gray to black diamictiteconsisting ofpebble~ to boulder~sized, quartziticand granitic clasts in black, medium~ to fine~
grained, sandy matrix. Thickness as much as350 feet.
Green, purple, and black slate and phyllite.Thickness unknown.
Water-bearingcharacteristics1
Hydrogeologic
unit
1 The ranges of permeability are defined in terms of hydraulic conductivity as follows:
Range Hydraulic conductivity, in feet per day
12
Very lowLowModerateHighVery high
Less than 0.50.5 to 55 to 5050 to 500Greater than 500
R.1W.
111°52'30"
I
R. 1 E.
EXPlANATION
--250-- Line of equal thickness ofvalley-fill deposits, in feet Interval 250 feet
........................ Contact of valley-fill depositsand consolidated rock
I3 KILOMETERS
Base from U.S. Geological SurveyOgden. 1:100.000. 1976
Figure 5. Thickness of valley-fill deposits.
oIo
I2
2
R. 1 E. R.2 E.
3 MILES
13

A previously unmapped fault in the valley-filldeposits was determined from results of an aquifer testconducted at the Ogden well field. The fault was projected across the southwest side of Ogden Valley, underPineview Reservoir, and across the narrow promontories jutting into the reservoir (pI. 1).
A large syncline extends into Ogden Valleyfrom south of the study area. The syncline probably isthe area within which the Tertiary sediments weredeposited in Ogden Valley (Eardley, 1944, p. 856). Thesyncline predates the normal faulting that formedOgden Valley.
A series of stacked overthrust plates, includingthe Willard thrust sheet, is exposed in the western partof the study area (Davis, 1985). The structure of theoverthrust plate is very complex and is not fully understood. Precambrian rocks generally have been thrustover Paleozoic rocks. The overthrusting is consideredto predate the deposition of the Wasatch Formation.
The structure in the remainder of the study area isexposed through erosional windows in the relativelyIlat-Iying Wasatch Formation and consists of folds andminor fault features. The Wasatch Formation blanketsmuch of the study area east and south of Ogden Valley.
SURFACE-WATER HYDROLOGY
Surface water and ground water are hydraulicallyconnected in Ogden Valley. Surface-water data andfield observations were used in the analysis of groundwater flow in the valley-fill aquifer system.
Streams
The major streams in the study area are the NorthFork Ogden River, Middle Fork Ogden River, andSouth Fork Ogden River. Their juncture to form theOgden River is in the area now inundated by PineviewReservoir. Other streams that originate in the surrounding mountains and that have substantial discharge areWolf Creek, Geertsen Canyon creek, and Bennett Creek(pI. I). The remaining streams have smaller watershedsand are ephemeral; flow from these streams into OgdenValley generally occurs only from February throughJune.
Locations of selected active (1986) and discontinued gaging stations in the study area are shown onplate 2. Station 10137500 (pI. 2), which is on the SouthFork Ogden River just upstream from Ogden Valleyand a major irrigation diversion, is the only active gag-
14
ing station that measures discharge into Ogden Valley.Wheeler Creek (pI. 1), which also has an active (1986)gaging station, discharges to the Ogden River belowPineview Reservoir dam; thus, it is not part of theinflow to Ogden Valley.
Streamflow characteristics at selected gaging stations are shown in table 2. The South Fork OgdenRiver has the largest drainage area and discharge of allof the streams in the study area. Mean monthly andmean annual discharge for the period of record, excluding water years 1982-86, for selected gaging stations isshown in table 3. Water years 1982-86 were excludedbecause runoff in those years was greater than the meanflow.
The streams and the valley-fill aquifer system arehydraulically connected and exchange water. Many ofthe streams lose water and recharge the valley-fill aquifer system where the streams flow into Ogden Valley.The North Fork Ogden River, Middle Fork OgdenRiver, and South Fork Ogden River gain flow from thevalley-fill aquifer system before entering PineviewReservoir.
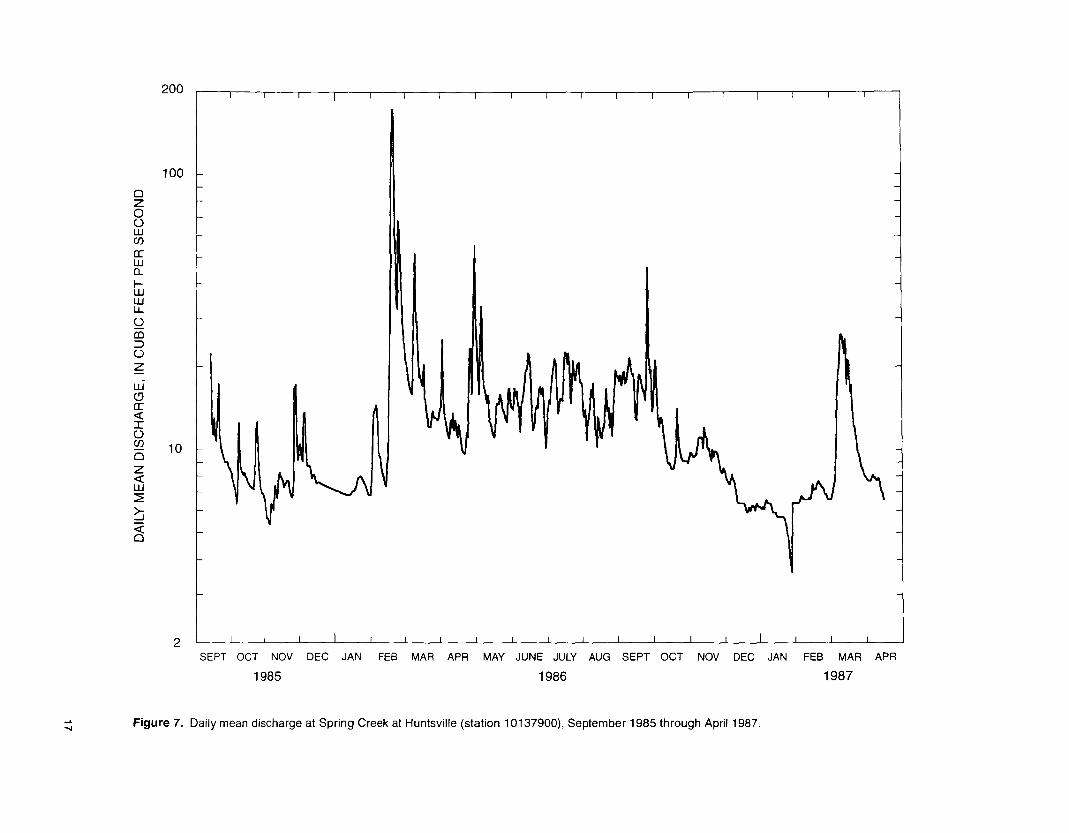
Water that discharges to Spring Creek, whichdrains much of the area in the valley north and east ofHuntsville (fig. 6), originates in the mountains northeast of Huntsville. Flow at the mouth of Spring Creekis perennial (fig. 7) because the creek gains water thatdischarges from the valley-fill deposits east of Huntsville. Discharge at seven sites (fig. 6) in the SpringCreek drainage was measured monthly during November 1984 through June 1986 and plotted in a compositehydrograph (fig. 8).
Discharge at the South Fork Ogden River and atWheeler Creek during 1984-86 is shown in figure 9.The South Fork Ogden River is regulated partly byCausey Reservoir. Flow in Wheeler Creek generally ischaracteristic of flow from a small unregulated stream.
Reservoirs
Two major reservoirs store surface water in thestudy area. Pineview Reservoir on the Ogden River inthe southwestern part of Ogden Valley provides irrigation and municipal water to the Ogden area, powers asmall hydroelectric-power-generation plant downstream, and provides a recreational area in Ogden Valley. Filling of the reservoir began in November 1936,and maximum storage capacity was reached in June1938. The altitude of the full reservoir pool was 4,871feet. The reservoir had a storage capacity of about

Table 2. Streamflow characteristics at selected gaging stations
Station name and number Period ofrecord
(water years)
Drainagearea
(square miles)
Discharge(cubic feet per second)
Maximum Minimum Average
South Fork Ogden River nearHuntsville, Utah (]()]J7500) 1921-86 148.0 1,890 9 118
South Fork Ogden River atHuntsville, Utah (10137600) 1960-65 170.0 1,090 3.2 77.8
North Fork Ogden River near
Eden, Utah (10137680) 1964-74 6.0 156 .8 12.1
North Fork Ogden River nearHuntsville, Utah (10137700) 1960-65 61.4 693 0 35.3
Middle Fork Ogden River aboveirrigation di versions nearHuntsville, Utab (10137780) 1964-74 31.3 744 .4 31.8
Middle Fork Ogden River at
Huntsville, Utah (10137800) 1958-65 32.0 623 0 20.1
Spring Creek at Huntsville,
Utah (10137900) 1958-65 7.2 210 2.6 IDAand 1986
Wheeler Creek near Huntsville,
Utah (10139300) 1959-86 11.1 t600 0 211.2
I Estimated.
2 Streamflow records since 1977 do not include di versions by the city of Ogden.
Table 3. Mean monthly and mean annual discharge for selected gaging stations
Mean monthly discharge(in cubic feet per second)
Station Water Meannumber years Oct Nov Dec Jan Feb Mar Apr May June July Aug Sept annual
discharge
10137500 1922-65 40.2 40.8 42.3 41.3 47.3 797 287 428 144 56.6 42.3 39.1 107
10137500 1966-81 45.3 40.1 39.9 44.4 50.5 97.6 257 446 185 92.2 84.8 60.0 120
10137600 1960-65 7.45 10.8 26.2 26.7 52.8 61.5 259 362 89.5 19.0 10.4 7.66 77.8
10137680 1964-74 388 4.59 4.35 5.53 4.90 11.0 28.7 43.1 22.8 7.87 4.39 3.60 12.1
10137700 1960-65 .03 .03 6.64 16.2 25.2 28.4 149 151 49.5 5.08 1.27 1.83 36.2
10137780 1964-74 2.89 4.14 5.82 8.50 9.90 31.9 100 173 35.9 4.78 1.67 1.78 31.7
10137800 1958-65 20 .28 2.37 1.83 7.50 11.2 97.3 115 14.3 1.08 .17 .50 21.0
10137900 1958-65 6.15 7.21 7.89 6.96 9.40 10.9 13.0 14.6 16.2 9.26 6.81 6.94 9.62
10139300 1959-81 1.34 1.38 1.78 2.65 2.30 7.39 23.6 34.2 26.6 7.10 2.71 1.72 9.40
15

...en
41
111"45'I
R.2 E.Base from U.S. Geological SurveyBrowns Hole, L24,OOO 1964, photorevised 1975Huntsville, L24,OOO 1955, photorevised 1975Snowbasin. L24,OOO 1955, photorevised 1975
*,.4"Ir.V
"1
11130'
EXPlANATION
Approximate surface-water drainage divide
Monthly discharge-measurement site Number is site identification number
T. 6 N.
Figure 6. Location of sites in Spring Creek drainage where discharge was measured monthly.
200
100
0z0()w(f)
a:wa..I-wWLL
gco::J()
Z
w<.9a:«I()(f)
100z«w~
~«0
2SEPT OCT NOV DEC JAN FEB MAR APR MAY JUNE JULY AUG SEPT OCT NOV DEC JAN FEB MAR APR
1985 1986 1987
-...jFigure 7. Daily mean discharge at Spring Creek at Huntsville (station 10137900), September 1985 through April 1987.

..0>
30 I I I I I I I I I I I I I I I t I I
Approximate average discharge of Spring Creek, in cubic feet per second,determined from monthly measurements at site 4
Incremental discharge in Spring Creek drainage, in cubic feet per second,determined from monthly measurements at sites 1 to 3 and 5 to 7
5
o I I =--t=-.I! + ~I I ~ I I I 1--. 'i---"'" ~ I I I~
25
0z0U 20w(f)
a:wa..I-wWLL
U 15co::::>Uzu.iCJa:« 10IU(f)
0
NOV DEC JAN1984
FEB MAR APR MAY JUNE JULY AUG SEPT OCT NOV DEC JAN FEB MAR APR MAY JUNE1985 1986
Figure 8. Discharge determined from monthly measurements at seven sites in the Spring Creek drainage, November 1984 through June 1986.

2,000
South Fork Ogden Rivernear Huntsville, Utah(station 10137500)
r I J I i Ii AAJ! ,j :: ~ IP\ !I \,: £ ill II :i r I 'i ~
i \fh in !I'\ IViJ H \~" , L I I '. I' ,;!
\ ~ Ii ~ \ Ii!i \1 I: v,\ , an! \ r i! ~ , \,= s~ I i c: \~i I'i' i a \.I,. • .. • ,
" ! I ~: 1I.\ ' I i \ I i\i 1ill d, ~ ~ i :\1 i'V \'I f\ ' , l · ,I , 'I : • ;\ • •• •,'" : .. I· :~,'A W\.., I .,,,!oJ" I' ~a:i-i ! ". J ::li~·,J "'!:.h.: "--, . ....., ~:
::i i : :./ Wheeler Creek / ( li i H'i ~hi "Be "oots."•. Utah , !;I \. ! ~I I! (station 10139300) 11 iI 1.1 j I1
10
100
1,000
ozo()wCIJa:w0-fWWLL()
CD:::::>()
zwC)a:«I()CIJoz«w~
~
~
0.1JULY SEPT AUG OCT NOV DEC JAN FEB MAR APR MAY JUNE JULY AUG SEPT OCT NOV DEC JAN FEB MAR APR MAY JUNE JULY AUG SEPT
1984 1985 1986
...CD
Figure 9. Daily mean discharge at the South Fork Ogden River near Huntsville (station 10137500) and at Wheeler Creek near Huntsville(station 10139300), July 1984 through September 1986 (discharge adjusted for diversions by city of Ogden) .

44,000 acre-feet and covered about 1,800 acres whenfi lled. In 1957, the dam at Pineview Reservoir wasraised 30 feet, and storage capacity in the reservoirincreased to 110,200 acre-feet. Pineview Reservoircovered about 2,900 acres when filled. The additional
storage capacity was allocated for flood control, and theWeber Basin Conservancy District gained surfacewater rights to water in that storage (Blaine Johnson,Ogden River Commissioner, oral commun., 1986).Actual storage in the modified reservoir did not reachthe maximum until June 1962. Normal operating fluctuation of the reservoir pool for 1963-81 was about 25feet. The low stage usually occurs in late February orearly March, and the high stage usually occurs in June.
Causey Reservoir is located in a narrow canyoneast of Ogden Valley on the South Fork Ogden Riverabove Beaver Creek. The reservoir provides water forirrigation and for exchange rights for water wells inOgden Valley (Blaine Johnson, Ogden River Commissioner, oral commun., 1986). Filling of the reservoirbegan in January 1966, and maximum storage capacitywas reached in April 1966. Causey Reservoir has astorage capacity of 6,870 acre-feet and covers 195 acreswhen filled.
Irrigation and Other Diversions
In 1925, about 11,150 acres were irrigated inOgden Valley (Browning, 1925). A court decree in1948 indicated that about 10,550 acres were irrigated(Judge John A. Hendricks, Second Judicial District ofthe State of Utah, no. 7487,1948). In the mid-1960's,12,050 irrigated acres were mapped (Haws and others,1970, p. 109). In 1981, the irrigated acreage was about7,050 acres as determined for this study from aerialphotography. This latest value probably represents apermanent decrease in irrigated acreage.
Water in the North Fork Ogden River is divertedat several places. The first major diversion from theNorth Fork Ogden River flows into a storage pond thatfeeds the Liberty Pipeline, which supplies water underpressure to sprinkler irrigation systems in much of thenorthern part of Ogden Valley. The West Ditch (pI. 2)diverts water from the Liberty Pipeline storage pondand delivers water to irrigated land along the northwestern side of the valley. The Eden Canal (pI. 2) divertswater from the North Fork Ogden River, between Liberty and Eden, to irrigated land north of Pineview ReservoIr.
20
The Middle Fork Ogden River (stations10137800 and 10137780; table 3) has relatively littleflow during the irrigation season. The low flow isdiverted through a few ditches to the area northeast ofPineview Reservoir.
Water is diverted from the South Fork OgdenRiver through canals and is used to irrigate much of thesouthern part of Ogden Valley. Water from the SouthFork Ogden River is diverted at three places. The largest diversion, about 85 cubic feet per second, is about0.5 mile downstream from the point where the SouthFork Ogden River flows into Ogden Valley. About 80cubic feet per second of water is diverted by canal to thenorth side of Ogden Valley, and about 5 cubic feet persecond of water is diverted by pipeline to the south sideof Ogden Valley (N.W. Plummer, Regional Director,U.S. Bureau of Reclamation, written commun., 1981).
The canals that divert water to the north side ofOgden Valley del ivel' water to much of the area east andnorth of Huntsville. The largest canal from this diversion, the Mountain Valley (or Ogden Valley) Canal, carries water along the northeast boundary of the valleyand delivers water to the Middle Fork Ogden Riverdrainage and to the area east and south of Eden.
The pipeline that diverts water to the south sideof Ogden Valley supplies the Roman Catholic Monastery southeast of Huntsville with irrigation water foralfalfa and small-grain fields. Water from MonasterySpring [(A-6-2)27dcc-S II in upper Bennett Creek alsois used for irrigation of these fields. Excess water andreturn water from the fields flows into the HuntsvilleSouth Bench Canal (pI. 2), which supplies irrigationwater to the area south of the South Fork Ogden Riverand Pineview Reservoir.
The other two diversions from the South ForkOgden River are minor. About I cubic foot per secondof water is diverted from above the gaging station(10137500; pI. 2) on the South Fork Ogden River, andabout I cubic foot per second of water is divertedbetween the gaging station and the large diversion 0.5mile downstream from where the South Fork OgdenRiver flows into Ogden Valley.
Water from Wolf Creek is diverted at two places.Water from the upstream diversion is delivered to WolfCreek Resort north of Eden for irrigation of the golfcourse and for culinary use. Water from the downstream diversion is used to irrigate fields north andnorthwest of Eden.

Diversions from smaller watersheds and springs,including Chicken Creek, Sheep Creek, Pole Canyon
creek, Hawkins Creek, and Bennett Creek, also areused for irrigation. Ditches and canals that encircle thevalley also capture some of the water that runs off thevalley slopes.
Two pipelines divert water from Pineview Reservoir and Wheeler Creek. The first pipeline deliverswater from Pineview Reservoir for hydroelectricpower generation and irrigation. The hydroelectricpower-generation plant has surface-water rights to allof the yearly natural flow in Ogden Valley, but thedelivery rate of water is limited to 260 cubic feet persecond by the capacity of the pipeline. Between lateApril and early October, water in this pipeline also isdistributed for irrigation outside of Ogden Valley(Blaine Johnson, Ogden River Commissioner, oralcommun., 1986). The second pipeline delivers 15 to 20cubic feet per second of water (the working capacity ofthe Ogden City Water Utilities filtration plant) fromPineview Reservoir and Wheeler Creek to Ogdenbetween May and October (Gary Clark, Ogden CityWater Utilities, oral commun., 1986).
Water Quality
Surface-water samples were collected at 10 locations throughout Ogden Valley and the surroundingarea by Thompson (1983). Streams were sampled earlyand late in the irrigation season. The dissolved-solids
concentration for all samples, except those from SpringCreek, was less than 200 milligrams per liter during thespringtime high flows. Spring Creek derives much ofits flow from ground-water discharge. In August, thedissolved-solids concentrations more than doubledbecause of irrigation losses as the water was reused. Allwater was a calcium bicarbonate type.
Specific conductance and water temperature formany of the streams in Ogden Valley and the surrounding area were measured during base-flow periods(tables 4 and 5). The specific conductance of all samples was less than 400 microsiemens per centimeter,which relates to a dissolved-sol ids concentration of lessthan about 250 milligrams per liter. Data from thelower North Fork Ogden River Basin (sites N II andN 13) and from Liberty Spring Creek (table 4) showwarmer water temperatures that may result fromground-water seepage. Water in Wheeler Creek (table5) has relatively large specific-conductance values,
possibly because Wheeler Creek flows through an area
of the predominantly carbonate terrain.
GROUND-WATER HYDROLOGY OFCONSOLIDATED ROCKS SURROUNDINGOGDEN VALLEY
The lithology and water-bearing characteristicsof the consolidated rocks surrounding Ogden Valley areshown in table I. The consolidated rocks generally aredivided into five characteristic hydrogeologic unitsthe Norwood Tuff, Wasatch Formation, carbonaterocks, clastic rocks, and metasedimentary rocks.
The consolidated rocks surrounding Ogden Valley that transmit and yield substantial quantities ofwater are the Wasatch Formation and carbonate rocks.The Wasatch Formation crops out over much of the areaeast of Ogden Valley (pI. I) and is at depth south of andbeneath parts of Ogden Valley. The carbonate rocks
crop out over a large area in the upper South Fork
Ogden River drainage above Causey Reservoir and insmaller areas west of Liberty; south and northeast of
James Peak; and west, southwest, and southeast ofPineview Reservoir (pI. I). The dissolved-solids concentration of water in the consolidated rocks is less than250 milligrams per liter and the water is a calciumbicarbonate type.
Recharge
Much of the recharge to consolidated rocks in theuplands surrounding Ogden Valley probably originatesfrom snowmelt that infiltrates the Wasatch Formation.The 1931-60 average annual precipitation in the SouthFork Ogden River drainage is about 7.54 billion cubicfeet; the average annual precipitation in the WheelerCreek drainage is about 784 million cubic feet.
Few data are available on recharge from losingstreams or subsurface inflow from adjacent areas. Aseepage run made October 17, 1985, indicated thatWheeler Creek was losing about 0.4 cubic feet per second between the lower part of Snow Basin and theOgden River. Relatively little recharge to the consolidated rocks occurs by subsurface inflow from adjacentground-water systems because much of the area sur
rounding Ogden Valley is topographically higher thanthe adjacent areas.
21

Table 4. Miscellaneous measurements of streamflow, specific conductance, and water temperature during base flow inOgden Valley, February 23 to March 1, 1985
[N I, miscellaneous measurement site on North Fork Ogden River; M I, miscellaneous measurement site on Middle Fork Ogden River; S I,miscellaneous measurement site on South Fork Ogden River; -, no data]
Sitenumber(pI. 2)
Drainage basin and locationof measurement site
Streamflow(cubic feet
per second)
Specificconductance
(microsiemensper centimeterat 25 degrees
Celsius)
Watertemperature
(degreesCelsius)
22
North Fork Ogden River drainage
NI North Fork Ogden River, 200 feet abovediversion gate, sec. I, T. 7 N., R. I W 10.4 115 1.5
N2 Cobble Creek, below road culvert, sec. 7,T. 7 N., R. 1 E .4 91 2.0
N3 North Fork Ogden River, 200 feet above CountyHighway 162 bridge, sec. 7, T. 7 N., R. I E 8.0 115 a
N4 Spring flow, measured alongside County Highway162 under powerlines, sec. 20, T. 7 N., R. I E 1.4 330 5.0
N5 Diversion ditch from Liberty Spring Creek (north ofmain channel), east of road culvert, sec. 19, T. 7 N., R. I E 1.4 315 9.0
N6 Liberty Spring Creek (main channel), upstream ofroad culvert, sec. 19, T. 7 N., R. I E 3.5 290 8.5
N7 Liberty Spring Creek (south channel, flow in winterprimarily from bedrock springs to the south), 400 feetdownstream from road culvert, sec. 19, T. 7 N., R. I E .6 350 3.5
N8 Pine Creek, above County Highway 162 culvert,sec. 28, T. 7 N., R. I E .2 265 2.0
N9 Pole Canyon creek, below County Highway 162culvert, sec. 28, T. 7 N., R. I E .5 205 .5
NIO Liberty Spring Creek, above confluence with NorthFork Ogden River, sec. 28, T. 7 N., R. I E 13.0 325 8.0
Nil North Fork Ogden River above confluence with LibertySpring Creek, sec. 28, T. 7 N., R. I E 73 145 7.5
NI2 Wolf Creek, below County Highway 162 culvert,sec. 28, T. 7 N., R. I E 3.6 275 3.0
NI3 North Fork Ogden River, 100 feet above CountyHighway 162 bridge, sec. 34, T. 7 N., R. 1 E 18.0 260 6.0
Middle Fork Ogden River drainage
MI Middle Fork Ogden River, 200 feet above road bridge,sec. 5, T. 6 N., R. 2 E 8.5 155 0
M2 Middle Fork Ogden River, at discontinued gaging station10137800, below County Highway 166 bridge,
sec.I,T.6N.,R.I E 4.2 170 2.0

Table 4. Miscellaneous measurements of streamflow, specific conductance, and water temperature during base flow inOgden Valley, February 23 to March 1, 1985-Continued
SpecificSite Drainage basin and location Streamflow conductance Water
number of measurement site (cubic feet (microsiemens temperature(pI. 2) per second) per centimeter (degrees
at 25 degrees Celsius)Celsius)
Middle Fork Ogden River drainage-Continued
M3 Small channel north of main Middle Fork Ogden River channel,below County Highway 166 culvert, sec. I, T. 6 N., R. I E 0.2
M4 Geertsen Canyon creek, above County Highway 166bridge, sec. 36, T. 7 N., R. I E 2.8 100 3.0
M5 Small channel west of Geertsen Canyon creek, aboveCounty Highway 166 culvert, sec. 36,T. 7 N., R. I E 2.9 245 0
M6 Second small channel west of Geertsen Canyon creek,in County Highway 166 culvert, sec. 2, T. 6 N., R. I E .1
M7 South branch Dry Hollow Creek, above CountyHighway 166 bridge, sec. 6, T. 6 N., R. 2 E .3
M8 North branch Dry Hollow Creek, 300 feet belowCounty Highway 166 bridge, sec. I, T. 6 N., R. I E .7 230 2.5
M9 Small channel south of Dry Hollow Creek, above CountyHighway 166 bridge, sec. 7, T. 6 N., R. 2 E .4
MID Kelley Canyon creek, 30 feet above road culvert,sec. 9, T. 6 N., R. 2 E .2 335 1.5
MIl Maple Canyon creek, above road culvert, sec. 9,T. 6 N., R. 2 E .5 130 1.5
South Fork Ogden River drainage
SI Spring flow in channel, above County Highway 39culvert, sec. II, T. 6 N., R. 2 E .9 64 3.5
S2 Quarry Hollow creek, above road culvert south ofMonastery, sec. 22, T. 6 N., R. 2 E 1.4 265 .5
S3 Bennett Creek, 300 feet below bridge, sec. 21,T. 6 N., R. 2 E 2.4 270 D
S4 Huntsville South Bench Canal (Bennett Creek), abovediversion structure at Bally Watts Creek confluence,sec. 21, T. 6 N., R. 2 E 8.9 375 3.5
23

Table 5. Miscellaneous measurements of streamflow, specific conductance, and water temperature during base flow,upper Middle Fork Ogden River, October 1984, and Wheeler Creek, October 1985
[--, no dutu]
Drainage basin and locationof measurement site
Streamflow(cubic feetper second)
Specificconductance
(microsiemensper centimeterat 25 degrees
Celsius)
Watertemperature
(degreesCelsius)
Upper Middle Fork Ogden River drainage
Middle Fork Ogden River above first diversion structure, sec. 33, T. 7 N., R. 2 E 4.2
Middle Fork Ogden River at trail crossing, sec. 27, T. 7 N., R. 2 E 3.5
Springflow (originating in sec. 31, T. 8 N., R. 3 E.), sec. 6, T. 7 N., R. 3 E .4
Springflow (originating in sec. 4, T. 7 N. R. 2 E.), sec. 14, T. 7 N., R. 2 E .4
365 6.0
365 7.0
345 8.5
340 7.5
285 10.0
130 9.5
134 10.0
240 11.0
255 12.0
375 4.01.0
Left Fork above confluence with Right Fork, Middle Fork Ogden River,
sec. 14, T. 7 N., R. 2 E .5
Right Fork, Middle Fork Ogden River, upstream of confluence with
springflow, sec. 6, T. 7 N., R. 3 E 1.7
Right Fork, Middle Fork Ogden River, upstream of confluence
with springflow, sec. 30, T. 8 N., R. 3 E 1.4
Right Fork above confluence with Left Fork, Middle Fork Ogden River,
sec. 14, T. 7 N., R. 2 E 2.1
Springflow (originating in sec. 25,
T. 8 N., R. 2 E.), sec. 30, T. 8 N., R. 3 E .1
Wheeler Creek drainage
Wheeler Creek, below marshy area, sec. 29, T. 6 N., R. I E
Middle Fork Wheeler Creek, at road crossing, sec. 28, T. 6 N., R. I E .1
Wheeler Creek above East Fork Wheeler Creek confluence,sec. 22, T. 6 N., R. I E 1.0 395 4.0
East Fork Wheeler Creek above road crossing, sec. 27, T. 6 N., R. I E .2 810 4.5
East Fork Wheeler Creek above Wheeler Creek, sec. 22, T. 6 N., R. I E .1
Wheeler Creek at gaging station 10139300, sec. 16, T. 6 N., R. I E .9 440 9.0
24

Discharge
Average monthly flow and daily minimum flow for upperNorth Fork Ogden River drainage (upstream from station10137680)
Discharge from the consolidated rocks is bystreams, evapotranspiration, springs, subsurface outflow, and wells. Discharge from the consolidated rocksto streams was estimated by analysis of streamflow
records of low-flow conditions in the late fall and winter. Presumably, most of the flows recorded duringlow-flow conditions represent ground-water discharge.In addition, a seepage run was made on the Middle ForkOgden River.
The average monthly flow in the upper NorthFork Ogden River drainage, upstream from station10137680, determined for the base-flow periodNovember through February for water years 1964-74,was about 5 cubic feet per second. Ground-water discharge to the stream, as indicated by the average dailyminimum flow, increased from 3.2 to 4.1 cubic feet persecond from November to February.
Average monthly flow and daily minimum flow for upperMiddle Fork Ogden River drainage (upstream from station10137780)
7.4
4.9
2.8
3.8
Averagedaily
minimum flow(cubic feet
per second)
4.1
8.5
5.8
9.9
Averagemonthly
flow(cubic feet
per second)
November
Month
December
February
January
The average monthly flow in the South Fork
Ogden River drainage, upstream from station10137500 (generally the South Fork Ogden Riverwatershed upstream from Ogden Valley), determined
for the base-flow period November through February
for water years 1922-65 (before Causey Reservoir dam
was constructed), was about 43 cubic feet per second.
Discharge of Causey Spring accounts for about 21
cubic feet per second or nearly 50 percent of the base
flow in the South Fork Ogden Riverdrainage. The base
flow in Beaver Creek, which enters the South Fork
Ogden River downstream from Causey Reservoir, has
never been recorded but probably is about 2 cubic feetper second. Therefore, the maximum possible dis
charge of ground water to the South Fork Ogden River,
upstream from station 10137500, is about 20 cubic feet
per second.
Average Averagemonthly daily
flow minimum flow(cubic feet (cubic feet
per second) per second)
4.6 3.2
4.4 3.3
55 3.5
5.0 4.1Fchmary
Novcmher
Deccmhcr
January
Month
The average monthly flow in the upper MiddleFork Ogden River drainage, upstream from station10137780, determined for the base-flow periodNovember through February for water years 1964-74,increased from 4.1 to 9.9 cubic feet per second.Ground-water discharge to the stream, as indicated bythe average daily minimum flow, increased from 2.8 to7.4 cubic feet per second.
A seepage run made October II, 1984, on theupper Middle Fork Ogden River indicated a gain ofabout 1.4 cubic feet per second between the upstreamreaches of the river and Ogden Valley.
The average monthly gain in flow to the South
Fork Ogden River between Causey Reservoir dam andstation 10137500 was determined from the flow recordscollected at stations 10137300 and 10137500 fromNovember through February for water year 1967. Bea
ver Creek, which is the only substantial source of sur
face-water inflow to the South Fork Ogden River in this
reach, is assumed to consist of only base flow from
November through February. The gain in flow to the
South Fork Ogden River and the base flow of BeaverCreek are the estimated ground-water inflow to the
South Fork Ogden River drainage upstream from
Ogden Valley for water year 1967. The estimated
inflow by month is as follows:
25

The average monthly discharge from the WheelerCreek drainage at station 10139300 (pI. I), determinedfor the base-flow period November through Februaryfor water years 1958-84, increased from about 2.1 cubicfeet per second in November to 5.0 cubic feet per second in February. The average daily minimum flow,which is the best estimate of ground-water discharge tothe stream, fluctuated slightly through the period ofanalysis.
Average monthly flow and daily minimum flow for WheelerCreek (station 10139300)
Estimated ground-waterinflow
(cubic feetper second)
Evapotranspiration and subsurface outflow fromthe bedrock can be estimated by comparing precipitation and streamflow records. The 1931-60 averageannual precipitation in the South Fork Ogden Riverdrainage area above station 10137500 was 7.54 billioncubic feet. The average annual discharge of the SouthFork Ogden River at station 10137500 during 1931-60was 3.33 billion cubic feet. Thus, an annual average of4.21 billion cubic feet (133 cubic feet per second)evapotranspired or recharged the valley-fill aquifer system by underflow in the alluvium of the South ForkOgden River channel. This is an average areal rate ofabout 13.2 inches per year. The same analysis on theWheeler Creek drainage for precipitation from 1931-60and streamflow from 1958-86 yields an average arealrate of about 18.9 inches per year.
The major springs that issue from the consolidated rocks in the study area are Wheeler Spring [(A-6-
Month
November
DecemberJanuary
February
Month
November
December
January
February
Averagemonthly
flow(cubic feetper second)
2.1
2.1
2.7
5.0
7.6
9.510.814.6
Averagedaily
minimum flow(cubic feet
per second)
1.3
1.2
1.1
1.4
1)32acc-S 1], Monastery Spring and its associatedsprings [(A-6-2)27dcc-Sl], Patio Springs [(A-7-1)22caa-S 1], Burnett Spring [(A-7-1 )22dad-S 1], Causey Spring [(A-7-3)23acb-Sl], and Limestone Spring
[(A-8-3)34caa-S 1] (table 6). Carbonate rocks are the
source for Wheeler Spring and Causey Spring. Monas
tery Spring, its associated springs, and Limestone
Spring appear to have their sources in the Wasatch For
mation or possibly the carbonate rocks. Patio Springsprobably issues from the Wasatch Formation. Thewater of Burnett Spring is from the Norwood Tuff butultimately may be derived from the metasedimentaryrocks. Liberty Spring [(A-7-1)19dbc-SIl discharges
from the valley-fill deposits, but the source of the water
probably is subsurface inflow from nearby carbonaterocks (fig. 10).
Innumerable small springs discharge throughoutthe area. All of the community water-supply systems inthe upper drainage area and a number of the municipalwater-supply systems in Ogden Valley derive theirwater from the small springs in consolidated rock.
Springs issuing from the Wasatch Formation irrigate
about 50 acres in the Sheep Herd Creek valley south
east of Huntsville.
Some wells in Ogden Valley also derive waterfrom the consolidated rocks. Wells completed in theWasatch Formation include a flowing well at the WolfCreek Resort north of Eden, a community well west ofthe resort well, a rarely-used community well south
west of Huntsville, and other individual small-yield
wells in the upper South Fork Ogden River drainage.
Ground water in the Wasatch Formation commonly isunder confined conditions, and several wells flow. Onecommunity well and a few domestic wells along themargin and foothills of Ogden Valley yield small quantities of water from the Norwood Tuff. Relatively fewwells in the area surrounding Ogden Valley pump waterfrom the bedrock.
A few wells derive water from the other hydrogeologic units (table 7). Well (B-8-1 )36dcc-l, which is
in the uppermost part of the North Fork Ogden Riverdrainage and yields about 20 gallons per minute, probably is completed in the Mutual Formation of Precambrian age. A few wells south of the South Fork OgdenRiver canyon mouth may be completed in carbonate
rocks.
26

Figure 10. Liberty Springs (arrow) at Liberty, Utah (looking east from hillside onWasatch Range toward Bear River Range).
GROUND-WATER HYDROLOGYOF VALLEY-FILL DEPOSITS INOGDEN VALLEY
The areal extent of the unconsolidated valley-filldeposits in Ogden Valley is about 40 square miles.These deposits are saturated and constitute a majoraquifer system which is referred to as the valley-fillaquifer system in this report. Slopewash and other relatively thin saturated deposits on the mountain slopesalso are part of the valley-fill aquifer system.
Ground-water conditions vary throughout thevalley. In the northern part of Ogden Valley and alongthe margins of the southern part of the valley, theground water is unconfined although, locally, perchedground water may occur above the water table. Nearthe center of the southern part of the valley, two relatively distinct aquifers are separated by an interveningsilty clay layer. Ground water in the lower aquifer isconfined and is pumped intensively in Ogden Valley.Ground water in the upper aquifer is unconfined andfew wells withdraw water from it.
The term "principal aquifer" is used in this reportto refer to the confined aquifer in the center of thesouthern part of the valley as well as the unconfinedparts of the aquifer in the northern part of Ogden Valleyand along the margins of the southern part of the valley.The term "shallow water-table aquifer" refers to theupper unconfined aquifer that overlies the confined partof the principal aquifer in the center of the southern partof the valley. The term "valley-fill aquifer system"refers to the entire ground-water reservoir in the valleyfill deposits (table 1) of Ogden Valley.
Recharge
Precipitation, seepage from streams and canals,excess irrigation water, and subsurface inflow rechargethe valley-fill aquifer system. Direct infiltration fromsnowmelt and seepage from stream channels are themajor sources of recharge during the spring freshet.During the remainder of the year, subsurface inflowfrom bedrock and infiltration of irrigation water probably are the major sources of recharge.
27
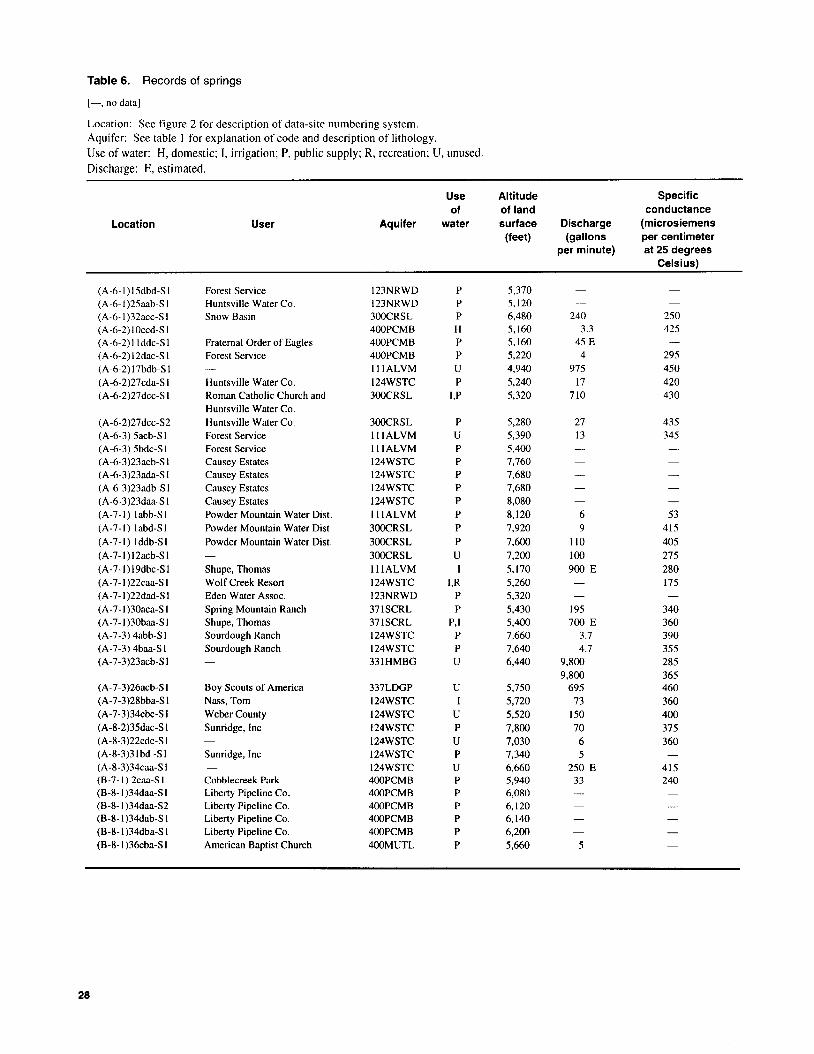
Table 6. Records of springs
[-, no data]
Location: See figure 2 for description of data-site numbering system.
Aquifer: See table I for explanation of code and description of lithology.
Use of water: H, domestic; I, irrigation; P, public supply; R, recreation; U, unused.
Discharge: E, estimated.
Use Altitude Specificof of land conductance
Location User Aquifer water surface Discharge (microsiemens(feet) (gallons per centimeter
per minute) at 25 degreesCelsius)
(A-6-1)15dbd-SI Forest Service 123NRWD P 5,370(A-6-1 )25aab-S I Huntsville Water Co. 123NRWD P 5,120
(A-6-1 )32acc-S I Snow Basin 300cRSL P 6,480 240 250
(A-6-2)IOccd-S I 400PCMB H 5,160 3.3 425
(A-6-2)llddc-S I Fraternal Order of Eagles 400PCMB P 5,160 45 E(A-6-2)12dac-SI Forest Service 400PCMB P 5,220 4 295
(A-6-2) 17bdb-S 1 IIIALVM U 4,940 975 450
(A-6-2)27cda-S I Huntsville Water Co. I24WSTC P 5,240 17 420(A-6-2)27dcc-S I Roman Catholic Church and 300cRSL I,P 5,320 710 430
Huntsville Water Co.(A-6-2)27dcc-S2 Huntsville Water Co. 300cRSL P 5,280 27 435(A-6-3) 5acb-SI Forest Service IIIALVM U 5,390 13 345(A-6-3) 5bdc-SI Forest Service IllALVM P 5,400(A-6-3)23acb-S 1 Causey Estates I24WSTC P 7,760(A-6-3)23ada-S I Causey Estates I24WSTC P 7,680(A-6-3)23adb-S I Causey Estates I24WSTC P 7,680(A-6-3)23daa-S I Causey Estates I24WSTC P 8,080(A-7-1) labb-SI Powder Mountain Water Dist. IllALVM P 8,120 6 53(A-7-1) labd-SI Powder Mountain Water Dist 300cRSL P 7,920 9 415
(A-7-1) Iddb-SI Powder Mountain Water Dis!. 300cRSL P 7,600 110 405
(A-7-1) 12acb-S I 300cRSL U 7,200 100 275(A-7-1) 19dbc-S 1 Shupe, Thomas lllALVM I 5,170 900 E 280(A-7-1)22caa-SI WolfCreek Resort I24WSTC I,R 5,260 175(A-7-1)22dad-SI Eden Water Assoc. 123NRWD P 5,320
(A-7-1)30aca-SI Spring Mountain Ranch 371SCRL P 5,430 195 340(A-7-I )30baa-S I Shupe, Thomas 371SCRL P,I 5,400 700 E 360(A-7-3)4abb-SI Sourdough Ranch I24WSTC P 7,660 3.7 390(A-7-3) 4baa-SI Sourdough Ranch I24WSTC P 7,640 4.7 355(A-7-3)23acb-SI 33IHMBG U 6,440 9,800 285
9,800 365(A-7-3)26acb-S I Boy Scouts of America 337LDGP U 5,750 695 460(A-7-3)28bba-SI Nass, Tom I24WSTC I 5,720 73 360(A-7-3)34cbc-SI Weber County I24WSTC U 5,520 150 400(A-8-2)35dac-S I Sunridge, Inc I24WSTC P 7,800 70 375(A-8-3)22cdc-S I I24WSTC U 7,030 6 360(A-8-3)3Ibd -SI Sunridge, Inc I24WSTC P 7,340 5(A-8-3)34caa-S I I24WSTC U 6,660 250 E 415(B-7-1)2caa-SI Cobblecreek Park 400PCMB P 5,940 33 240(B-8-1 )34daa-S I Liberty Pipeline Co. 400PCMB P 6,080(B-8-1 )34daa-S2 Liberty Pipeline Co. 400PCMB P 6,120(B-8-1 )34dab-S I Liberty Pipeline Co. 400PCMB P 6,140(B-8-1 )34dba-S I Liberty Pipeline Co. 400PCMB P 6,200(B-8-1 )36cba-S I American Baptist Church 400MUTL P 5,660 5
28

29
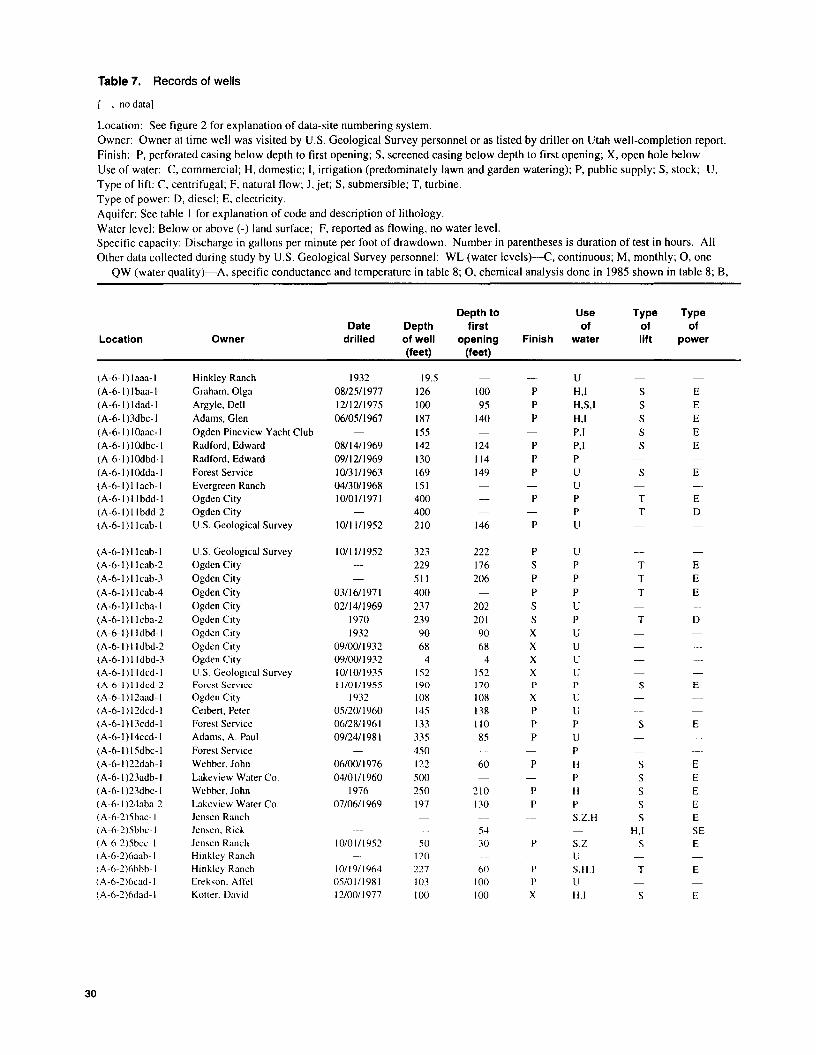
Table 7. Records of wells
[-, no data]
Location: See figure 2 for explanation of data-site numbering system.
Owner: Owner at time well was visited by U.S. Geological Survey personnel or as listed by driller on Utah well-completion report.
Finish: P, perforated casing below depth to first opening; S, screened casing below depth to first opening; X, open hole below
Use of water: C, commercial; H, domestic; I, irrigation (predominately lawn and garden watering); P, public supply; S, stock; U,
Type of lift: C. centrifugal; F, natural flow; J, jet; S, submersible; T, turbine.
Type of power: D, diesel; E, electricity.
Aquifer: See table I for explanation of code and description of lithology.
Water level: Below or above (-) land surface; F, reported as flowing, no water level.Specific capacity: Discharge in gallons per minute per foot of drawdown. Number in parentheses is duration of test in hours. All
Other data collected during study by U.S. Geological Survey personnel: WL (water levels)-C, continuous; M, monthly; 0, one
QW (water quality)-A, specific conductance and temperature in table 8; 0, chemical analysis done in 1985 shown in table 8; B,
Depth to Use Type TypeDate Depth first of of of
Location Owner drilled of well opening Finish water lift power(feet) (feet)
(A-6-1) 1aaa-I Hinkley Ranch 1932 19.5 U(A-6-1)lbaa-1 Graham, Olga 08/25/1977 126 100 P H,I S E(A-6-1) Idad-I Argyle, Dell 12/12/1975 100 95 P H,S,I S E(A-6-1 )3dbc-1 Adams, Glen 06/05/1967 187 140 P H,I S E(A-6-1)lOaac-1 Ogden Pineview Yacht Club 155 P,I S E(A-6-1)IOdbc-1 Radford, Edward 08/14/1969 142 124 P P,I S E(A-6-1) IOdbd-1 Radford, Edward 09/1211969 130 114 P P(A-6-1)IOdda-1 Forest Service 10/31/1963 169 149 P U S E(A-6-1)llacb-1 Evergreen Ranch 04/30/1968 151 U(A-6-1)llbdd-1 Ogden City 10/01/1971 400 P P T E(A-6-1)llbdd-2 Ogden City 400 P T D(A-6-1) Ilcab-I V.S. Geological Survey 10/11/1952 210 146 P V
(A-6-1) Ilcab-I V.S. Geological Survey 10/11/1952 323 222 P V(A-6-1)llcab-2 Ogden City 229 176 S P T E(A-6-1) Ilcab-3 Ogden City 511 206 P P T E(A-6-1) Ilcab-4 Ogden City 03/16/1971 400 P P T E(A-6-l)llcba-1 Ogden City 02/14/1969 237 202 S V(A-6-1)llcba-2 Ogden City 1970 239 201 S P T D(A-6-1)lldbd-1 Ogden City 1932 90 90 X V(A-6-1)lldbd-2 Ogden City 09/00/1932 68 68 X V(A-6-1)1ldbd-3 Ogden City 09/00/1932 4 4 X V(A-6-1)lldcd-1 V.S. Geological Survey 10/10/1935 152 152 X V(A-6- t)ll dcd-2 Forest Scrv ice 1 t/01/1955 190 170 P P S E(A-6-1) 12aad-1 Ogden City 1932 108 108 X V(A-6-1)12dcd-1 Ceibert, Peter OS/20/1960 145 138 P U(A-6-1) 13cdd-1 Forest Service 06/28/1961 133 110 P P S E(A-6-1) 14ccd-1 Adams, A. Paul 09/24/1981 335 85 P V(A-6-1) 15dbc-1 Forest Service 450 P(A-6-1 )22dab-1 Webber, John 06/00/1976 122 60 P H S E(A-6-1 )23adb-1 Lakeview Water Co. 04/01/1960 500 P S E(A-6-1 )23dbc-1 Webber. John 1976 250 210 P H S E(A-6-1 )24aba-2 Lakeview Water Co. 07/06/1969 197 130 P P S E(A-6-2)5bac-1 Jensen Ranch S.Z,H S E(A-6-2l5bbc-1 Jensen. Rick 54 H.I SE(A-6-2)5bcc-1 Jensen Ranch 10/01/1952 50 30 P S.Z S E(A-6-2)6aab-1 Hinkley Ranch 120 U(A-6-2)6bbb-1 Hinkley Ranch 10/19/1964 227 60 P S.H.I T E(A-6-2)6cad-1 Erekson. Affd 05/01/1981 103 100 P U(A-6-2)6dad-1 Kotter. David 12/00/1977 100 100 X H.I S E
30

depth to first opening.
unused; Z, dairy sanitation.
data obtained from Utah well-completion reports unless otherwise specified.
time or random; S, semiannual.
chemical analysis prior to 1985 shown in table 8.
Date SpecificAltitude water Discharge Date capacity Other dataof land Water level (gallons discharge (gallons per available
Aquifer surface level measured per measured minute per foot WL QW Remarks(feet) (feet) minute) of drawdown)
IIIALVM 4,920 S112ALVM 4,921 30 10/03/1977 7 .1(2) M112ALVM 4,933 35 25 .3(2) S a112ALVM 4,960 28 06120/1967 10 06100/1967 S112ALVM 4,925 S112ALVM 4,980 38 09/10/1969 15 15 (12) S These two wells supply water to112ALVM 4,940 30 09/19/1969 20 20 (12) houses on Forest Service land.112ALVM 4,907 32 11/29/1963 M Port Ramp well.112ALVM 4,915 47 05/10/1968 10 .6(2) M112ALVM 4,900 43 12/15/1971 2,500 50 (24) Well 5.112ALVM 4,900 43 2,500 50 (24) Well 6.112ALVM 4,915 M Two wells at same site.
Water-level data for both112ALVM 4,915 250 12111/1952 125 M wells back to 1953.112ALVM 4,895 Well 2.112ALVM 4,910 a Well 3.112ALVM 4,895 43 2,500 50 Well 4.112ALVM 4,905 30 04129/1969 2,500 26 (6) Test well, now plugged.112ALVM 4,910 Weill.112ALVM 4,832 -10.06 09/15/1932 B Well 102, now plugged.112ALVM 4,833 -9.66 09/3111932 B Well 101, now plugged.IIIALVM 4,832 .14 09125/1932 B Well 100, now plugged.112ALVM 4,881 Cemetery well, now plugged.112ALVM 4.915 180 60 (1.5) M B Bluff well.112ALVM 4,880 7.58 0912011932 B Tower well, now plugged.112ALVM 4.920 42 1012111960 8 2.6(4) S112ALVM 4,921 26 07/0111961 60 M Anderson Cove well.123NRWD 5,240 60.3 07/3111984 1.5 <.1(2) a123NRWD 5,439 90 08/01/1985 a123NRWD 5,950 41.3 08118/1984 100 a123NRWD 5,120 4 175 1.7 B Secondary well.123NRWD 5,550 1556 08/1811984 45 a112ALVM 4,930 29 07117/1969 164 2.4(7) S Primary well.
5,110 Provides water 10 dairy farm.IIIALVM 5,020 SIIIALVM 5,000 14 25 10/1611952 4.2IIIALVM 5,010 M112ALVM 4,945 8 02/15/1965 100 05120/1965 .7(2.5) S112ALVM 4,945 18 06/30/1981 15 06/00/1981 3.0(1) SIIIALVM 4,970 30 12/0011977 15 S a
31

Table 7. Records of wells-Continued
Depth to Use Type TypeDate Depth first of of of
Location Owner drilled of well opening Finish water lift power(feet) (feet)
(A-6-2)6dda-1 Montgomery, Norman 01/09/1964 51 36 P S,H,Z S E(A-6-2)7aab-1 Skeen, Joseph 07/16/1968 92 92 X H,I S E(A-6-2)7bbb-1 Newey, Dale 12/23/1957 III 85 P S,Z,H S E(A-6-2)7bbd-1 Casey Acres Subdivision 08/02/1980 110 90 P V(A-6-2)7bbd-2 Casey Acres Subdivision 09/21/1980 130 105 P P E(A-6-2)7bcc- I Quist, Ivan 10/03/1965 102 100 X H,I S E(A-6-2)7cad-1 Clawson, Jack 01/00/1978 120 105 P H,I S E(A-6-2)7dac-1 Ekstrom, Don 8 X V(A-6-2)7ddb-1 McKay, John 05/00/1968 107 H,S,I S E(A-6-2)8ddb-1 Shafer OS/22/1970 160 100 P I,H C E(A-6-2)9cac-1 Green Hill Estates 04/01/1979 240 120 P P S E(A-6-2) 14bab-1 Fraternal Order of Eagles 04/00/1972 257 105 P V(A-6-2) 14bbd-1 Cox, David 07/31/1984 100 88 P H S E(A-6-2)14bcc-1 Hunter, David 06/15/1979 112 100 P H,S,I S E(A-6-2) 15acb-1 Vtah Dept. of Transportation 1973 285 158 P H,I S E(A-6-2) 15cdb-1 Odekirk, Forrest 06/05/1978 98 82 P H,I S E(A-6-2)16ada-1 Weems, S.L. 11/02/1954 242 84 I,H,S T E(A-6-2)16add-1 Field, Joe 03/23/1979 220 172 P H,I S E(A-6-2) 16bad-1 Verhaal, Richard 03/22/1979 101 80 P H,I S E(A-6-2)16bdb-1 Carrick, David 08/24/1984 115 105 P H S E(A-6-2) 16cbd-1 Walker, Hugh 10/20/1976 100 90 P H,I S E(A-6-2)16dad-1 Gay, Larry 10/06/1960 54 54 X H,I,S S E(A-6-2) 17aab-1 Toyn, Robert 11/05/1958 42 37 P H,I,C S E(A-6-2) 17abb-1 Wood, Robert 06/13/1977 100 90 P H,I S E(A-6-2) 17bbb-1 Argyle, Dell 08/08/1956 40 35 P H,S F(A-6-2)l7cca-1 Schade, Marlon 04/25/1970 124 86 P H,I S E(A-6-2)17dac-1 Allen, Lila 05/00/1974 102 H,I S E(A-6-2)17dbd-1 Allen, Garth 40 H,I,S S E(A-6-2) 18bad-1 V.S. Bureau of Reclamation 11/08/1955 155 105 P V(A-6-2)18dad-1 American Legion 11/08/1967 87 87 X C,I,H S E(A-6-2) 18dad-2 Andrews, Raymond 07/01/ I981 103 82 P H,I S E(A-6-2) 18dbb-1 Deatherage, D. 18 18 X U(A-6-2) 19abb-1 Forest Service 06/30/1961 69 26 P P S E(A-6-2) 19bda-1 Wangsgard, William 120 C,H,I S E(A-6-2)I9bdb-1 Peterson, Chris 08/07/1961 90 C,P,I S E(A-6-2)20acd-1 Wangsgard, Clark 06/23/1978 86 66 P V(A-6-2)20bad-1 Froerer Dairy Farm 04/25/1969 86 86 X S,Z,H S E(A-6-2)2Iaab-1 Lowe, John H,I,S S E(A-6-2)21 abc-I Birch, Ralph 09/23/1942 37 V(A-6-2)21 abc-2 Osmond, Dennis 12/26/1979 101 91 P U(A-6-2)2Iacd-1 Kenley, Wayne 07/30/1971 79 79 X H,S S E(A-6-2)21 bbb-I Wangsgard Ranch 12/05/1956 81 72 P S,Z,H S E(A-6-2)2Icbd-1 Messerly, Grant 04/21/1970 105 38 P H,I,S S E(A-6-2)2Iccd-1 Mertz, Brian 06/08/1984 170 155 P H,S,I S E(A-6-2)22bcb-1 Roman Catholic Church 36 H J E(A-6-2)28aaa-1 Russell, Scott 08/00/1976 220 120 P H S E(A-6-2)28aba-1 Stoddard, Dougla~ 07/18/1973 140 P H,I S E(A-6-3)5abb-1 Read, Boyd 11/18/1953 74 66 P P S E(A-7-1)6dda-1 Shaum, Robert 07/10/1972 142 40 P H,S S E(A-7-1)7abc-1 Elliot, Charles 07/12/1973 160 143 X H,I S E(A-7-1)7dba-1 Quist, Farley 08/04/1975 102 80 P H,I S E(A-7-1)7dcb-1 Zwahlen, Carl 07/17/1973 224 H,I S E(A-7-1)7dda-1 Van Alfen, John 12/00/1978 140 100 P H,I S E(A-7-I )8cad-1 Roberts, Emil 01/01/1976 180 S S E(A-7-1)8cbb-1 Nelson, Ralph 06/27/1967 120 57 P I,H,S S E
32

Date SpecificAltitude water Discharge Date capacity Other dataof land Water level (gallons discharge (gallons per available
Aquifer surface level measured per measured minute per foot WL OW Remarks(feet) (feet) minute) of drawdown)
IIIALYM 4,970 24 02/03/1964 60 20 (2.5) Provides water to dairy farm.IllALYM 4,950 26 07/3011968 8 .6(2) SIIIALYM 4,924 45 20 12/3011957 1.3 S Provides water to diary farm.IIIALYM 4,926 20 08/02/1980 500 S112ALYM 4,930 23 10/09/1980 60 1010911980 30 (1)112ALYM 4,922 18 10/2611965 6 S 0112ALYM 4,940 32 01/00/1978 20 01/0011978 SIIIALYM 4,930 S112ALYM 4,920 F 08/02/1968 S 0112ALYM 4,970 15 0511211970 30 2.0(1) M 0123NRWD 5,030 25.3 07/3111984 90 0112ALYM 5,120 7 1010011973 5 10100/1973 <.1(3) SIIIALYM 5,090 38 08/22/1984 15 08/0011984 .5(1) S 0IIIALYM 5,085 35 06/29/1979 30 2.0(1) S112ALYM 5,060 43 08/22/1973 50 .6(24) M 0IIIALYM 5,040 16 0611611978 10 2.0(2) S 0112ALYM 5,025 39 150 12117/1954 1.2112ALYM 5,025 45 08/25/1979 18 .6(1) SIIIALYM 4,990 26 0412511979 10 2.0(2) S 0112ALYM 4,980 20 0912611984 15 1.5(2) SIIIALYM 4,985 22 11115/1976 10 1.0(2) SIIIALYM 5,025 37 10/1811960 5 10/18/1960 .8(2) SIIIALYM 4,970 II S112ALYM 4,955 16 30 SIIIALYM 4,930 -5 08/0911956 20 08/0911956 S A112ALYM 4,940 37 25 05/06/1970 .7(1) S 0112ALYM 4,970 2 06/00/1974 150 06/0011974 S 0IIIALYM 4,970 S112ALYM 4,918 35 60 11128/1955 .8 C B Well on County Highway property.112ALYM 4,940 20 12/02/1967 10 .4(2)112ALYM 4,935 20 09/1811981 10 .7(2) MIIIALYM 4,925 S112ALYM 4,900 07/0411961 60 6.0(1) S AIIIALYM 4,960 S Trappers Inn Restaurant.IIIALYM 4,960 50 09/0111961 5 .6(1) Chris's Gas Station and Bar.112ALYM 4,950 F 07/14/1978 30 07/14/1978 S A112ALYM 4,955 4 05/02/1969 10 3.3(2) Provides water to dairy farm.
5,01D SIIIALYM 5,000 24 09/0011942 M112ALYM 5,000 16 01128/1979 75 1.9(2) M112ALYM 4,990 13 08/06/1971 10 .5(2) S 0112ALYM 4,980 15 25 12/10/1956 2.5 S Provides water to dairy farm.112ALYM 4,990 12 05128/1970 10 .3(2) SIIIALYM 5,040 38 10/04/1984 4 <.1(2) SIIIALYM 5,005 S124WSTC 5,020 F 08/3111976 II 08/3111976 M112ALYM 5,030 2 S 0124WSTC 5,330 -41 11/00/1953 2.3 08115/1985 A Provides water to summer homes.IIIALYM 5,340 12 08/05/1972 7 08/05/1972 .2(2) SIIIALYM 5,320 SlllALYM 5,250 13 09/22/1975 10 1.2(2) M 0123NRWD 5,280 15 08/2111973 SIIIALYM 5,210 10 12100/1978 45 SIIIALYM 5,200 20 0110111976 M 0IIIALYM 5,250 45 07/25/1967 S
33

34
Table 7. Records of wells-Continued
Depth to Use Type TypeDate Depth first of of of
Location Owner drilled of well opening Finish water lift power(feet) (feet)
(A-7-1) 17bcb-1 White, Donald 09/22/1975 120 104 P H,I S E
(A-7-1) 17cba-1 Prier, Peler 1950 300 H,S S E
(A-7-1) ISadb-1 Hawks, Monly 10/09/1 976 116 95 S H,I S E
(A-7-1) 19aad-1 Dawson, Dale 03100/1972 200 122 P H,I,S S E
(A-7-1)19abb-1 West, Bob 06/00/1976 290 no P H,S S E(A-7-1)19acd-1 Finder, Robert 12/02/1971 124 101 P H,S,I S E
(A-7-1)19ddb-1 Anderson, Richard 12/10/1971 140 110 P H(A-7-1 )20bab-1 Hogge, Ronald OS/OO/197 I 127 109 P H,I S E(A-7-1 )20dcd-1 Hadfield, Douglas H,I S E
(A-7-1)2Ibab-1 Hannum, Thomas OS/IS/l976 125 95 P H,I S E(A-7-1)2Ibbc-1 Pletcher 07/15/1969 SI SI X H,I,S S E(A-7-1 )2Icad-1 Burton, Howard 05/0I/l96S 42 34 P H S E(A-7-1)2Iddc-1 Valley Water Users P(A-7-1)22bcd-1 Wolf Creek Resort 09/00/1972 795 U(A-7-1)22cad-1 Wolf Creek Resort 04/30/1982 400 P(A-7-1)27abc-1 Eden Water Assoc. 08/00/1976 300 160 P P S E(A-7-1)27baa-1 Crandall, Ralph 06/25/1963 395 60 P H,S S E(A-7-1)28adb-1 Holmstron, Dave 11/00/1979 240 220 P H,S S E(A-7-1 )28baa-1 Nipko, Tuck 09107/1970 275 255 P H,I S E(A-7-1)28dbb-1 Chambers, Earl 09/16/1970 S9 89 X H,I S E(A-7-1)28dda-1 Malan, A.B. 06/24/1957 75 U(A-7-1)29acc-1 Bealba, Pete 02/00/1977 300 ISO P H,I S E(A-7-1)29ada-l Pilcher, John OS/20/1974 146 146 X H,I S E(A-7-1)29baa-1 Woorlander, Stanley 1916 60 U(A-7-1)29dbc-1 Thatcher, Ben 300 H,I,S S E(A-7-1)29ddc-1 Hensley, Betty OS/24/1971 51S 117 P I S E(A-7-1)30aad-1 Rich, Steve 09/22/1 980 170 160 P H,I S E(A-7-1)32abd-1 Nordic Valley Water Assoc. P(A-7-1)32dba-1 Nordic Valley Water Assoc. 12/09/1966 193 50 P P S E(A-7-1)32dcd-1 Nordic Valley Water Assoc. 06/12/1963 260 40 P P S E(A-7-I)34aca-1 Carver, David 06/24/1982 144 135 P I S E(A-7-1)34bab-1 Johnson, Dave 07/10/1949 75 65 P U(A-7-1 )34cbb-1 Wolf, Charles 08100/1 974 210 H,S,1 S E(A-7-1 )34ccc-1 Ruskin, Harvey 11/00/1 976 160 140 P H S E(A-7-1)34cda-1 Forest Service 07/02/1961 75 53 P U S E(A-7-1)34dbb-1 Laub, John 05/1 9/1 982 120 120 X I S E(A-7-1)35bbb-1 Eden Cemetery 11/14/1981 160 100 P I S E(A-7-1)35cac-1 Vanscoyk, Robert 20 I C E(A-7-1)35cdd-1 Evergreen Ranch 1932 20 U(A-7-1 )36bdd-1 BAR-B Ranch 06/20/1949 95 65 P H,S,I S E(A-7-1 )36dca-1 Whitehead, Wilford 12/01/1975 117 95 P H,I S E(A-7-3) IOcda-1 Furlong, Ramona 06100/1 978 2S3 243 P H S E(A-7-3)2Ibda-1 Shupe, Don 1981 166 146 P H S E(A-7-3)32bbb-1 Neilsen, H. Eugene 10/0911963 214 100 P U(B-7-1)lbab-2 LDS Church 1968 200 P,I S E(B-7-1)ldaa-1 Tydeck, Robert 09/24/1966 130 110 P H,I S E(B-7-1)ldda-1 Carlsen, Dean 07/01/1970 253 230 P H,S,I S E(B-7-1)12bdc-1 Weber County 09/05/1 975 205 145 P P S E(B-8-1 )36cab-1 Cronquist, Curt 06/08/1977 160 100 P H,I S E(B-8-1 )36dcc-1 Dufree Creek Estates 06/00/1976 332 272 P U

Date SpecificAltitude water Date capacity Other dataof land Water level Discharge discharge (gallons per available
Aquifer surface level measured (gallons measured minute per foot WL OW Remarks(feet) (feet) per minute) of drawdown)
IIIALYM 5,180 50 S 0IIIALYM 5,160 67 12/18/1963 35 12/0011963 SIIIALYM 5,240 30 11108/1976 10 11/0811976 SIIIALYM 5,135 14 03/00/1972 20 .2(2) S 0123NRWD 5,240 3.1 07/05/1985 50 06/30/1976 0IIIALYM 5,170 20 12/15/1971 20 12/00/1971 2 (I) S Flows over casing in spring.IIIALYM 5,150 F 01118/1972 36 01118/1972 1.2(2) Flows constantly.IIIALYM 5,120 27 01/00/1972 25 1971 1.7(1) S
5,050 M 0IIIALYM 5,080 10 10 .1(2) SIIIALYM 5,075 18 0711811969 8 .2(2) S 0IIIALYM 5,070 18 10/20/1968 19 1.2(1) M
5,100 Eden Hills subdivision.123NRWD 5,230 3.4 08/07/1984 36 .1 0I24WSTC 5,240 -4 05120/1982 600 05120/1982123NRWD 5,120 26.7 08/04/1984 120 .4(24) 0 Secondary water for Eden.IIIALYM 5,110 40 07/03/1963 8.4 08128/1975 SIIIALYM 5,040 70 11/27/1979 35 SIIIALYM 5,020 42 09/15/1970 15 .5(1) S 0IIIALYM 5,000 24 09125/1970 10 09/00/1970 .5(2) SIIIALYM 4,990 26 20 0712311957 SIIIALYM 5,190 50 02/00/1977 9 02/00/1977 .1(36) SIIIALYM 5,080 4 08/07/1974 10 .2(2) S 0
5,120 SIIIALYM 5,320 SIIIALYM 5,290 50 12/05/1974 50 .3(14) SIIIALYM 5,300 140 15 1.2(1) S
5,440 S Well 3.IIIALYM 5,560 150 1.6(3) Well 2.IIIALYM 5,850 200 1.8(5) Weill.IIIALYM 4,955 20 07/10/1982 25 2.5(1) S 0IIIALYM 4,975 35 S300CRSL 4,930 50 08/0011974 30 S123NRWD 5,230 35.1 08/02/1984 0112ALYM 4,900 F 07/05/1961 70 35 (I) S A112ALYM 4,950 35 0512111982 60 MIIIALYM 4,970 10 11117/1981 35 MIIIALYM 4,935 SIIIALYM 4,935 SIIIALYM 4,945 45 SIIIALYM 4,920 70 12/11/1975 S300CRSL 6,320 240 06112/1978 200124WSTC 5,960 101.4 07/20/1985 5 0I24WSTC 5,800 3 11107/1963 30 .3(20)
5,550 MIIIALYM 5,420 15 10115/1966 4 1011511966 <.1 SIIIALYM 5,410 60 08113/1970 10 <.1 S112ALYM 5,670 145.4 08/03/1984 5 0 Provides water to field school.400MUTL 5,780 77.5 07/18/1985 45 0400MUTL 5,620 33.7 07/18/1985 30 06/30/1976 0 A
35

Little recharge results from rainfall when compared to that from snowmelt. During the summer, anyprecipitation that infiltrates the soil is retained as soilmoisture, and infiltrated water in excess of soil moisture recharges the aquifer. Thomas (1952, p. 94)observed that recharge to the aquifer occurred onlywhen more than 1.5 inches of precipitation fell on moisture-deficient soils.
Field measurements indicate that seepage fromcertain reaches of the North Fork Ogden River, MiddleFork Ogden River, and South Fork Ogden Riverrecharges the valley-fill aquifer system. Seepage also islikely from eight small perennial creeks and from allephemeral creeks when they are flowing.
Measurements on the North Fork Ogden River in1985 indicate seepage from the stream to the valley-fillaquifer system occurs in the upper reaches. Seepage ofabout 2.4 cubic feet per second is indicated by the firsttwo measurements shown in table 4.
On the Middle Fork Ogden River, all flow forNovember through February of water year 1964 waslost between station 10137780 and station 10137800(pI. 2). This loss equalled about 3 cubic feet per second.During the same period in water year 1965, seepage tothe aquifer decreased from 5.1 cubic feet per second inNovember to 1.6 cubic feet per second in February. Anet loss of 4.3 cubic feet per second was indicatedbetween the upper bridge across the Middle ForkOgden River (site Ml) and the lower gaging station(site M2) for late February 1985 (table 4).
Seepage from the South Fork Ogden River to thevalley-fill aquifer system was calculated from measurements made in the summer of 1925 when the water wasreturned to the channel after the streamflow had beendiverted for several weeks (Browning, 1925, p. 17-20).On the second day after flow was restored, the entireflow of about 48 cubic feet per second seeped into thevalley-fill aquifer system within 1 mile. The rate ofseepage decreased downstream.
Typically during the winter, the South ForkOgden River is perennial. During the winter of 193334, the entire flow seeped into the valley-fill aquifersystem; discharge from the South Fork Ogden Riverinto the valley at that time averaged about 35 to 40cubic feet per second (Leggette and Taylor, 1937, p.132-133).
Streamflow records for the South Fork OgdenRiver for November through February indicate that, ingeneral, seepage to the aquifer decreases during those
36
months. Seepage between station 10137500 near thevalley edge and station 10137600 near Pineview Reservoir was calculated for the water years 1960-64.
Discharge and seepage for the South Fork Ogden Riverbetween station 10137500 and station 10137600 fromNovember through February, water years1 1960-64
Average Averagedischarge discharge Seepageat station at station to
Month 10137500 10137600 aquifer(cubic feet (cubic feet (cubic feet
per second) per second) per second)
November 35.3 10.6 24.7
December 32.9 13.1 19.8
January 32.4 16.4 16.0
February 36.9 26.1 10.8
I Data for February 1962 were not included.
Actual seepage from the South Fork Ogden Valley to the valley-fill aquifer system may be greater thanthe calculated seepage values because of ground-waterseepage into the stream channel upstream from station10137600. The discharge values for February 1962were not included in the 1960-64 average discharge calculation because of unusually large tributary inflowsfor this time of year.
Seepage from irrigation canals and ditches to thevalley-fill aquifer system does not appear to be substantial in Ogden Valley. Many of the ditches serve asdrains, particularly around Eden and east of Huntsville.During the summer of 1985, seepage to the aquifer system of about 4.0 cubic feet per second was measured forthe Ogden Valley (or Mountain Valley) Canal from thediversion structure on the South Fork Ogden River tothe tail of the canal reach about 9 miles downstream.The seepage occurred near the canal crossing at theMiddle Fork Ogden River (Herbert and others, 1987, p.7-8).
Water that is diverted from streams and used toirrigate fields also results in recharge. In a typical season, the water is applied to about 7,000 acres from lateApril to early October. Much of the diverted water isconsumptively used or returned to streams, but theexcess irrigation water recharges the aquifer over awide region.
Most of the bedrock bounding the valley-fillaquifer system is not permeable except locally wherefractures and solution channels are present; however,the cumulative subsurface inflow from the bedrock to

Hydraulic Characteristics
much as 6 feet at this site. The depths of completion forthese wells are shown in table 7.
(A-6-1) IOaac-I 3,000 No drawdown(A-6-1)lOdda-l 2,800 Indeterminate 4,900 D 6,300 D
9,900 R
(A-6-l)llacb-1 1,600 No drawdown(A-6-l)llcab-l 125 83,000 530 R 5,600 D
(A-6-l)llcab-3 79,000(A-6-l)llcba-2 475 87,000 4,500 D(A-6-1)lldcd-2 3,050 Indeterminate 5,300 D 5,800 D
6,700 D 6,800 R
(A-6-2)18bad-1 11,300 Indeterminate 30,000 D 38,000 D
The quantity of water an aquifer can storedepends partly on its thickness. The thickness of thevalley-fill deposits (fig. 5) was estimated with a combination of electrical resistivity soundings made in 1986and well-log descriptions. The Norwood Tuff underliesthe valley-fill deposits throughout most of the valleyand has a resistivity that sharply contrasts with that ofthe overlying valley-fill deposits. The valley-fill deposits are more than 750 feet thick along the east-boundingfault zone northeast of Huntsville. The deposits alsoare relatively thick near Liberty where they appear to beunderlain by carbonate rocks.
Aquifer tests of the valley-fill aquifer systemwere conducted during this study because results fromprevious aquifer tests were not available. A long-termaquifer test of the confined part of the principal aquiferwas conducted using wells in the Ogden well field.Well (A-6-1) 1] cab-3 was pumped for 4 days andallowed to recover for 4 days. Water-level measurements were made in the pumped well and in sevenobservation wells during the pumping and recoveryperiods. Three similar transmissivity values wereobtained from the test. Storage coefficient values couldnot be determined because soon after pumping started,boundary effects were observed in the water-levelresponse in the observation wells.
Results from the aquifer test are as follows:
Characteristics obtained from an aquifer test of the confinedpart of principal aquifer, October 3-10, 1985
Distance frompumped wellto boundary
(feet)
Transmissivity(feet
squaredper day)
Distancefrom
pumped well(feet)
Location
[Boundary: D, discharge image; R, recharge image]
the valley-fill aquifer system is large because of thelarge area ofcontact between the bedrock and the valleyfill. Therefore, subsurface inflow is a major source ofrecharge to the valley-fill aquifer system.
The principal aquifer is recharged primarily bydownward movement of water near the valley margins.From the analysis of well hydrographs, Thomas (1945,p. 18-19) determined that snowmelt and part of thespring runoff infiltrated the principal aquifer along thevalley margins and moved toward the center of the valley. Some recharge moving through the principal aquifer is rejected before it reaches the confined part of thesystem; rejected recharge probably discharges tostream channels or recharges the shallow water-tableaquifer that overlies the confined part of the principalaquifer.
Locally near the Ogden well field, water from thePineview Reservoir probably recharges the confinedaquifer. In this area, the vertical hydraulic gradient isdownward because of the drawdown that results frompumping.
Movement
The potentiometric surface of the principal aquifer during June 1985 is shown in figure 11. The direction of ground-water flow generally parallels the landsurface; water flows from the valley margins towardPineview Reservoir in the southern part of the valley.The hydraulic gradient ranges from about 15 feet permile near Pineview Reservoir to about 80 feet per milein the northern part of Ogden Valley.
Vertical head gradients have been detectedthroughout the valley-fill aquifer system. Generally,gradients are downward in the recharge areas andupward in the discharge areas. Near the recharge areaalong the upper South Fork Ogden River, a downwardvertical head gradient in the unconfined part of the principal aquifer is evident by comparing water levels inwells (A-6-2)21 abc-I and 2 (fig. 12). The water levelin the deeper well [(A-6-2)2Iabc-2] is as much as 10feet lower than the water level in the shallower well[(A-6-2)21 abc-I].
A downward vertical head gradient in the confined part of the principal aquifer is evident near theOgden well field by comparing water levels from amultiple-completion well at (A-6-l)llcab-1 (fig. ]3).During the low stage of Pineview Reservoir, the difference in water levels in the shallow and deep wells is as
37

41°22'30"-
111°52'30"
I
R.1 W. R. 1 E.
l .(\ /
i
EXPlANATION
-- 5,000 -- Potentiometric contour ofprincipal aquifer -Shows altitude at which waterlevel would have stood in tightlycased wells, June 1985. Contourinterval, in feet, is variable.Datum is sea level
111°45'
I
1. 7 N.
T.6 N.
Base from U.S. Geological SurveyOgden, 1:100,000, 1976
R.1 E. R.2 E.
3 MILESI
2I
I3 KILOMETERS
I2o
oI
Figure 11. Potentiometric surface of the principal aquifer, June 1985.
38
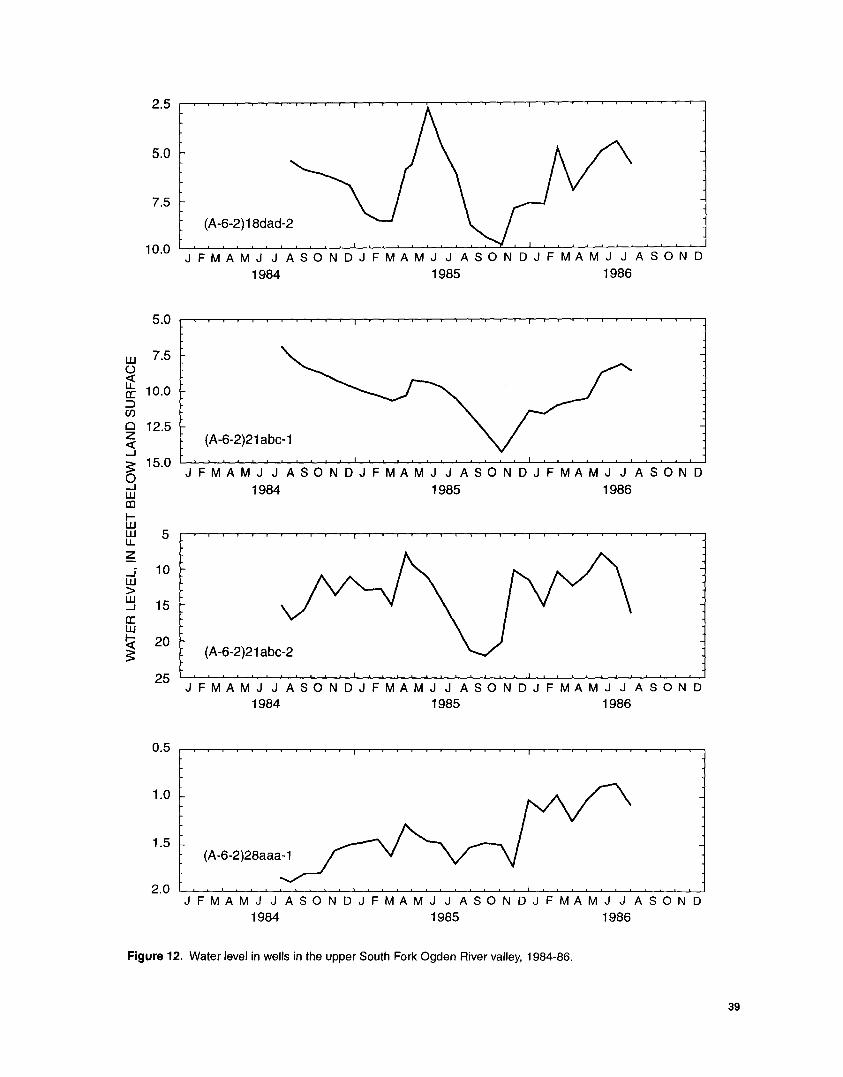
2.5
5.0
7.5
(A-6-2)18dad-2
10.0 J F M A M J J A SON D J F M A M J J A SON D J F MA M J J A SON D1984 1985 1986
(A-6-2)21 abc-1
(A-6-2)21 abc-2
7.5
12.5
:> 15.a L-L--'--'--'---'~--'--'--'---'---'--'---'-"---"--'--'--'--'~--'--'--'---'---'--L--'--"---"--'--'---'--'---'----'--'o JFMAMJJASONDJFMAMJJASONDJFMAMJJASONDu:J 1984 1985 1986CD~Ww 5u.Z....i 10w>~ 15a:wti: 20;::
w()
Lta: 10.0::::>CI)
oz:5
25JFMAMJJASONDJFMAMJJASONDJFMAMJJASOND
1984 1985 1986
0.5
1.0
1.5(A-6-2)28aaa-1
2.0JFMAMJJASONDJFMAMJJASONDJFMAMJJASOND
1984 1985 1986
Figure 12. Water level in wells in the upper South Fork Ogden River valley, 1984-86.
39

4,900
4,890
4,880 - (A-6-1)11acb-1
Deep well(A-6-1 )11 cab-14,870
4,880
4,890
4,870 J F MA M J J A SON 0 J F MA M J J A SON 0 J F MA M J J A SON 0-J~ 1984 1985 1986w-J«w(J)
w6CD«IwWLLZ
..iw
~ 4,860 J F M A M J J A SON 0 J F MA M J J A SON 0 J F MA M J J A SON 0a: 1984 1985 1986w~~
4,900
4,890
4,880(A-6-1 )11 dcd-2
4,870 L.-..L--'--'--'---.J...-l---L.--L.---L-..I--L....-J.--'---'---'--'----'----'----,---,--.L.-.....J---L.--'---'-..I--L........L---'--'--'---.L.-.....J---'---L.--'
JFMAMJJASONDJFMAMJJASONDJFMAMJJASOND1984 1985 1986
PINEVIEW RESERVOIR
FMAMJJASONDJFMAMJJASONDJFMAMJJASOND1984 1985 1986
4,910~t:i-J!:!:!ww
4,900>LL>wzwz--J- -«a..a:w 4,890LLO(f)Q>wwa:> 4,880(,)wQ«(f)CDI-'w«(f)a:
4,870J
Figure 13. Water level in wells near the Ogden well field and Pineview Reservoir, and stage ofPineview Reservoir, 1984-86.
40

Transmissivity values determined from 1-hour aquifer tests
[Transmissivity: First value delermined from early part of aquifer test;
second value from laler part of aquifer test]
(A-6-2) 15acb-l 140; 110 6 33
(A-7-I )8cad-1 40; 15 20 16
(A-7-1)19aad-1 310; 50 14 23
(A-7-I )28baa-1 30; 15 13 8.2
(A-7-1 )34aca-1 20; 480 7 13
Drawdown data were analyzed from the observa
tion wells; recovery data were analyzed from thepumped well. The early-time data, before boundaryeffects occurred, were analyzed with the straight-linesolution to the Theis equation (Lohman, 1972, p. 2327). The apparent transmissivity determined from theobservation wells increased with increased distance
from the pumped well. The apparent increase in trans
missivity indicated that leakage was occurring throughthe confining layer. Thus, the transmissivity of about79,000 feet squared per day determined from thepumped well probably is the most representative valuefor the aquifer.
Location Transmissivity(feet
squaredper day)
Time ofboundary
effect(minutes)
Discharge(gallons
perminute)
The boundary effects that occurred during theaquifer test also were interpreted. The distances to thedischarge image and to the recharge image were estimated with the image-well theory (Lohman, 1972, p.
59-61). An impermeable boundary that coincided withthe concealed fault zone on the west side of the valleyat the mouth of Ogden Canyon (pI. I) was defined. Anadditional impermeable boundary oriented in a northwest direction was defined on the east side of the wellfield. This boundary was interpreted as a previouslyunknown fault (pI. I). The two observation wells thatdid not show any drawdown are on the opposite side ofthe faults from the pumped well. The coincidence offaults with impermeable boundaries indicates that flowthrough the aquifer is retarded by the faults.
Several short-term aquifer tests were conductedon five different wells, each of which was pumped forI hour. The drawdown in each pumped well was analyzed with the straight-line solution to the Theis equation (Lohman, 1972, p. 23-27). All of the short-termaquifer tests apparently were affected by drainage fromthe gravel pack in the well annulus. In the followingtable, the first transmissivity value listed was determined from the early part of the test, and the secondvalue was determined from the later part of the test.The transmissivity values have not been adjusted forpartial penetration and perforated interval of the well.
Specific-capacity values determined from thewell discharge and water-level declines given on welldrillers' reports submitted to the Utah State Engineer'sOffice are shown in table 7. The specific-capacity values ranged from less than 0.1 to 125 gallons per minuteper foot of drawdown.
The confining layer between the principal aquiferand the shallow water-table aquifer in Ogden Valleyextends over an area of about 10 square miles in thesouthern part of Ogden Valley (Leggette and Taylor,1937, pI. 36). Leggette and Taylor (1937, p. 110)described samples of the confining layer as thin layersof dense, sticky, putty-like clay and silt, usually grayish-blue and brown. Lofgren (1955, p. 81) indicatedthat the confining layer commonly is silt and fine sand.Maximum thickness of the layer is about 100 feet; average thickness is about 70 feet (Thomas, 1945, p. 8).The stream channels that were inundated by PineviewReservoir were entrenched about 25 feet into the confining layer.
Laboratory tests on samples of the confininglayer indicated hydraulic-conductivity values of lessthan 0.013 foot per day (Leggette and Taylor, 1937, p.137). Reservoir-bed seepage measurements made inJuly 1986 with a method described by Lee (1977) indicated that vertical hydraulic conductivity ranged from0.01 to 0.04 foot per day. These values are typical forsilt beds and indicate that the layer isa leaky confininglayer.
Along the now-inundated stream channels, theconfining layer is relatively thin, and upward leakage toPineview Reservoir may be substantial. Before the reservoir was constructed, springs and seeps were common in the stream valleys along the contact of theconfining layer and the overlying sand layer comprisingthe shallow water-table aquifer (Leggette and Taylor,1937, p. 136).
The water level in well (A-7-1)34aca-l, completed at a depth of 144 feet, does not seem to beaffected by the presence or absence of water in a nearbycanal. Thus, the confining layer may exist farther norththan is indicated in previous reports, to about 1 mile
41

northwest of Eden in the North Fork Ogden Riverdrainage.
Storage
Historic changes in storage, as indicated by longterm water-level measurements, can be attributed predominately to man-induced changes in the hydrologicregime. The most prominent change is the impoundment of water in Pineview Reservoir. Filling of the reservoir began in 1936, and capacity was reached in1938. In 1957, Pineview Reservoir dam was raised 30feet. Maximum storage capacity in the enlarged reservoir was reached in 1962. These changes mostlyaffected water levels in the confined part of the principal aquifer. The long-term water-level rise in wellsnear the reservoir averaged 10 to 15 feet. Seasonalchanges in water levels typically were 15 to 25 feet(figs. 14, 15, and 16).
In the upper South Fork Ogden River valley,water levels fluctuated a maximum of about 26 feet in1986 (fig. 17). In the North Fork Ogden River valley,water-level fluctuations were as much as 15 feet in 1985(fig. 18). The lowest ground-water levels near themajor stream channels occurred in the late fall asstreamflow continued to be diverted for irrigation(fig. 19).
The water-level rise in the principal aquifer fromlate February to early June 1985 is shown in figure 20.The largest water-level increases in the principal aquifer occurred beneath Pineview Reservoir, in the NorthFork Ogden River valley near Liberty, and east ofHuntsville. The large water-level changes in the confined part of the principal aquifer do not represent largevolume changes because of the small storage coefficient. The storage coefficient of the confined part of theprincipal aquifer is assumed to be 0.0001. The specificyield of the unconfined part of the principal aquifer isassumed to be 0.10. Because of water-level changes inthe spring of 1985, the quantity of water added to storage in the entire unconfined part of the principal aquiferwas about 8,900 acre-feet. The quantity of water addedto storage in the confined part of the principal aquiferduring this same period was about 8.5 acre-feet.
Water levels in the shallow water-table aquifertypically fluctuate 10 to 15 feet during the year (fig. 21).The quantity of water added to storage in the spring of1985 in the shallow water-table aquifer is estimated tobe 4,600 acre-feet.
42
Discharge
Ground-water discharge occurs by seepage tostreams, springs, drains, and Pineview Reservoir; bywell discharge; and by evapotranspiration. Each ofthese is important in the water balance during some partof the year.
Few data are available for the water dischargednaturally from the aquifer to the streams in Ogden Valley. Spring Creek is east of Huntsville along the marginof the confining layer that overlies the principal aquifer,and the creek derives most of its flow from groundwater. The average flow of Spring Creek ranged from7.0 to 9.4 cubic feet per second from Novemberthrough February of water years 1958-65. This flowlikely represents ground-water discharge to the creek.
Observations of streamflow in Bennett Creek byBrowning (1925) indicated that the creek was dry fromJuly until sometime in the late fall. Now, the creekflows perennially, with much of the summer flow probably derived from irrigation return water. A flow of 8.9cubic feet per second was measured in February 1985just upstream from the confluence of Bennett Creekwith Bally Watts Creek (table 4). Part of this flow represents discharge from the Wasatch Formation.
Liberty Springs, (A-7-1) 19dbc-S I (table 6), andLiberty Spring Creek derive most of their flow fromground-water seepage, but long-term discharge has notbeen measured. Liberty Spring Creek was measured inFebruary 1985 just above its confluence with the NorthFork Ogden River. A flow of 13 cubic feet per secondwas measured (table 4).
The original Ogden artesian well field consistedof 46 flowing wells located just north of the juncture ofthe three forks of the Ogden River. The first well wasdrilled in 1914. The artesian well field was inundatedby Pineview Reservoir in 1936 but continued to be useduntil 1970. Because of contamination problems fromiron bacteria entering either the underwater pipeline orthe wells, the artesian well field was abandoned, and sixreplacement wells were drilled on the nearby shore ofthe reservoir. The wells at the new location have to bepumped to yield water. Pumpage from the Ogden wellfield from 1970 to 1985 averaged 10,290 acre-feet peryear or about 14.2 cubic feet per second.
Many wells in Ogden Valley are used for domestic purposes and for stock water. Lately, many newwells have been permitted in Ogden Valley for individual domestic use. Wells also are used by small community systems to provide water to individual housing
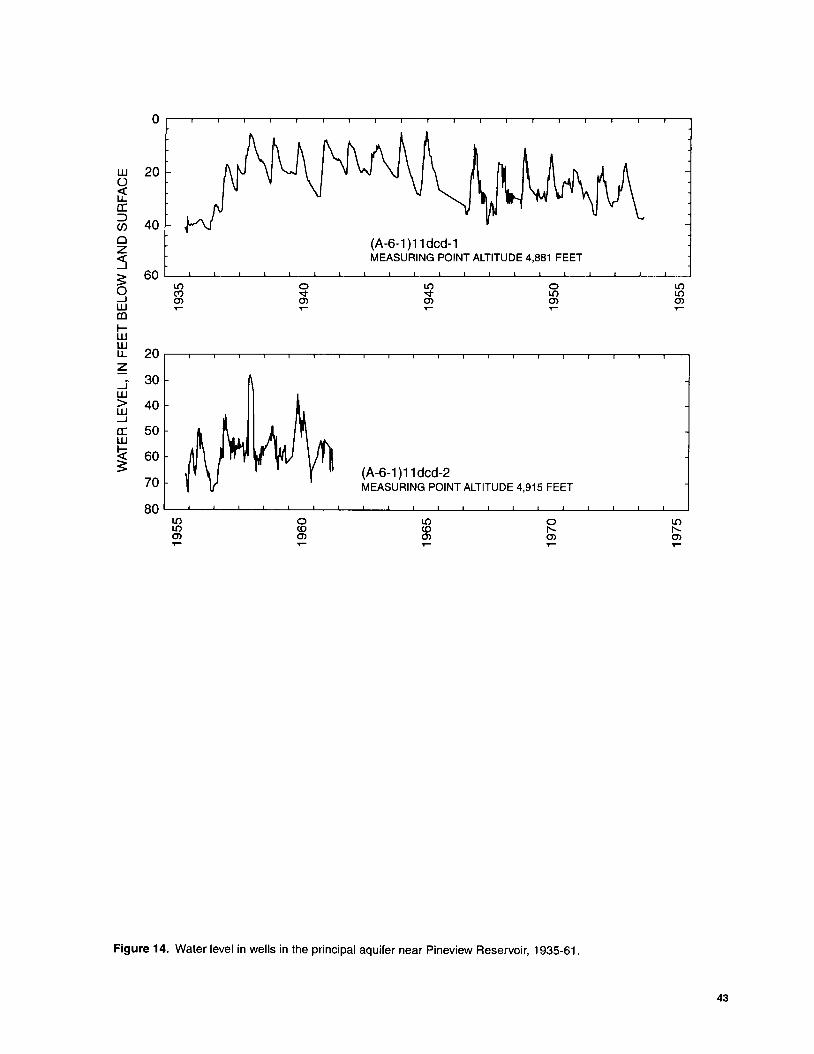
w 200ita:::::>
40Cf)
Cl (A-6-1)11dcd-1z:5 MEASURING POINT ALTITUDE 4,881 FEET
~60
LO 0 LO 0 LO0 (t) "<t "<t LO LO....J 0> 0> 0> 0> 0>W T"" T""(()
I-Ww
20LL
Z
..1 30w> 40w....J
a:: 50w~ 60~ (A-6-1 )11 dcd-2
70 MEASURING POINT ALTITUDE 4,915 FEET
80LO 0 LO 0 LOLO co co t-- t--0> 0> 0> 0> 0>T"" T"" T"" T"" T""
Figure 14. Water level in wells in the principal aquifer near Pineview Reservoir, 1935-61.
43

0
-~UJ(A-6-1 )11 cab-1
.....JOO Shallow well
~.....JLf 25UJUJa:.....J CO ::>a:1-(J)UJUJ O 50~~Z~z<t:_.....J
750 LO 0 LO 0 LO 0LO LO CD CD t-- t-- com m m m m m m.....
+20
- (A-6-1)12aad-1..~ wu:J~:±O +10>0 LfUJ.....J~a:
Land surface.....JUJO::> 0a::COCO(J)UJI-<t:O~t::la::z
-10~U.O<t:z .....J
-200 LO 0 LO 0 LO 0(Y) (Y) ..;t ..;t LO LO com m m m m m m..... ..... ..... ..... .....
(A-6-2)18bad-1
~ NO'~ _
LOcom.....
44
Figure 15. Water level in wells in the principal aquifer near Pineview Reservoir, 1932-84.

4,910
4,900
4,890(A-6-1)1baa-1
....JUJ>UJ....J
«UJenUJ>o11l«tUJUJLLZ
....JUJ>UJ....J
a::UJ
t;:~
4,880 L-..--,-~~~~~---,-----,--L.-.i--,---,----,--,---,--,--,--,--~~-----L~--,--,--------,---,-~-,---"--,,--,---,--J
JFMAMJJASONDJFMAMJJASONDJFMAMJJASOND1984 1985 1986
(A-6-1 )1Odda-1
4,860 J F MA M J J A SON D J F MA M J J A SON D J F MA M J J A SON D1984 1985 1986
4,880(A-6-1 )13cdd-1
4,870 L....L--'-~~~~~---'-----'--'----'---'----'-----'--'---'--'-~-'---'----''---'----l..---'--~~--'-~~-'----'--'-~-J
JFMAMJJASONDJFMAMJJASONDJFMAMJJASOND1984 1985 1986
JFMAMJJASONDJFMAMJJASONDJFMAMJJASOND1984 1985 1986
4,910
~t:i....J!!!UJUJ>LL> 4,900UJZUJz_....J- -«o.a::UJ 4,890LLOenO>UJUJa::> 4,880<!JUJO«enl1lt-UJ«en a:: 4,870
PINEVIEW RESERVOIR
Figure 16. Water level in wells in the principal aquifer, and stage of Pineview Reservoir, 1984-86.
45

20
w() 30LEa:::J(j)
400Z<{ (A-6-2)15acb-1-.J
5: 50JFMAMJJASONDJFMAMJJASON DJFMAMJJASON 00
-.J1984 1985 1986w
enf-ww 0LL
Z
-.J 10w>W-.J 20a:w~ 30~ (A-6-2)15cdb-1
40JFMAMJJASONDJFMAMJJASONDJFMAMJJASON 0
1984 1985 1986
Figure 17. Water level in wells in the upper South Fork Ogden River valley, 1984-86.
46

5
10
15
20 (A-7-1 )8cad-1
(A-7-1 )20dcd-1
25 L---'.--'--'-__"____'___'---'--'--__'__-'----'C---!.--'--~--'--'---'-____'_____'_--'--"'----'____'_----I..--'---'--<------.L--'---'---'--"'----'---'----'-_'
JFMAMJJASONDJFMAMJJASONDJFMAMJJASOND1984 1985 1986
w()
Lta:::::>(J)
ozj
~.--JWcoIWWLL
Z
5
10
.--J 15 l-...L____'_-'--~__"____'___'____'___'__'___'__..l._L......L____'__'_~_'__L_...<___'_____'___'__I.__'_____'____'___'_____'___'___'__L_...<____'_____'___J
~ JFMAMJJASONDJFMAMJJASONDJFMAMJJASOND~ 1984 1985 1986a::w~ 35.0 ,...,-----.--,------r--r-T---.----.---.---.,...--,r-,-----'--'--'-""'---'--'----"'-r-T---.----.--.--,---,r--r----.--,------r--r-T--r----r--;
37.5
40.0
(A-7-1 )34dbb-1
JFMAMJJASONDJFMAMJJASONDJFMAMJJASOND1984 1985 1986
o
-10
(A-7-1 )35bbb-1
JFMAMJ J ASONDJFMAMJ J ASONDJFMAMJ J ASOND1984 1985 1986
Figure 18. Water level in wells in the North Fork Ogden River valley, 1984-86.
47

(A-7-1)7dba-1
7.5
(A-7-1)1 bab-2
7.5
5.0
~-lWco~ww 10.0u..z
~ 10.0 J F M A M J J A SON D J F M A M J J A SON D J F MA M J J A SON D~ 1984 1985 1986::JCJ)
oz 5.0 ,..--,--,---r--r-""---'--'r--T----r-r--.---,--r-T--,-----r--r--r--,--,r--r----r---,--,--r-...---T--r---,--r-""--'--r--T--r--,
::5
.J"w 12.5 l.-.J.---,--",---,---,--",--,---,---'--,---'--..L--L........L--'--'---'--.J--",--,---'---'--L---l..--'---'L.........L--'--'---'---'--"'--'---'---'--l
> JFMAMJJASONDJFMAMJJASONDJFMAMJJASOND~ 1984 1985 1986a:::w~~
5
10
(A-7-1)21cad-1
JFMAMJJASONDJFMAMJJASONDJFMAMJJASOND1984 1985 1986
Figure 19. Water level in wells in the North Fork Ogden River channel, 1984-86.
48

111°52'30" EXPlANATION
41°22'30"-
R.1 W. R.1 E.
41°15'-
l)
--10-- Line of equal water-level riseInterval 5 feet
111°45'
I
T. 7 N.
T.6 N.
R. 1 E. R. 2 E.Base from U.S. Geological SurveyOgden, 1:100,000, 1976
3 MILESI
2
i3 KILOMETERS
I2o
oI
Figure 20. Water-level rise in the principal aquifer from late February to early June 1985.
49
3
6
9
12
15
18 (A-6-1)1aaa-1UJ 21()
J S 0 N Dit J F M A M J J A S 0 N D J F M A M J A
a: 1970 1971::::>(/)
0z 3«...J
s: 60
9...JUJ(0
12f-UJUJ 15LL
z 18 (A-6-2)18dbb-1...iUJ 21> J F M A M J J A S 0 N D J F M A M J J A S 0 N DUJ...J 1970 1971a:UJ
t:cs: 3
6
9
12
15
18 (A-7-1 )35cdd-1
21J F M A M J J A S 0 N D J F M A M J J A S 0 N D
1970 1971
Figure 21. Water level in wells in the shallow water-table aquifer, 1970-71. (Data collected by V. Doyuran.)
50

tracts. There may be as many as 2,000 small-yieldwells in the valley, although it is not known how manyactually are used. The greatest concentration of individual wells is east of Huntsville.
Crops, natural phreatophytes, and other vegetation transpire water. Crops grown in Ogden Valleyinclude alfalfa; spring grains (wheat, barley, oats);com; and grass pasture. Major phreatophytes are cottonwoods, willows, and cattails. Other vegetationincludes big sagebrush, gamble oak, and variousgrasses. The area covered by naturally occurringphreatophytes and subirrigated cropland is about 4,100acres. Of this area, 1,450 acres has more than a 50-percent density of cottonwoods and willows. Cottonwoods, willows, and cattails consume an average of 5.1feet of water per year; grasses and small phreatophytesconsume an average of 2.1 feet of water per year (Fethand others, 1966, p. 69). These rates were determinedfor the East Shore area of Great Salt Lake assuming100-percent density.
The annual consumptive use in Ogden Valley bythe phreatophytic vegetation and subirrigated croplandwas determined using the above rates and assuming100-percent density for grasses and associated plantcommunities and 80-percent density for cottonwoodsand willows. The estimated annual consumptive use isabout 11,500 acre-feet. Doyuran (1972, table 13) estimated annual evapotranspiration by crops and vegetation at 20,000 acre-feet.
Effects of Pineview Reservoir
After its construction in 1936, Pineview Reservoir affected the ground water of Ogden Valley, especially in the confined part of the principal aquifer. Thesouthern part of Ogden Valley was marshy before construction of the dam. All leakage from the principalaquifer was upward to the land surface and either wasconsumed by evapotranspiration or ran off in streamchannels. After the dam was completed, upward leakage from the principal aquifer flowed into the reservoirand was released downstream or evaporated. The natural discharge of ground water from exposures of thevalley-fill deposits in the southern part of Ogden Valleywas captured by Pineview Reservoir. Natural dischargebefore completion of the reservoir was estimated to beless than 5 cubic feet per second (Leggette and Taylor,1937, p. 139). Flowing-well discharge in the area inundated by the reservoir, except for the Ogden well field,
was shut off as a result of a U.S. Bureau ofReclamationplugging program.
Because the area inundated by Pineview Reservoir is completely underlain by the confining layer, theearly perception was that hydraulic connection betweenPineview Reservoir and the confined aquifer did notexist (Leggette and Taylor, 1937, p. 143-144). Theobserved effect of Pineview Reservoir on water levelswas attributed to mechanical loading of the confinedpart of the principal aquifer resulting from the weight ofsurface water in the reservoir. Water levels at the maximum springtime level in well (A-6-1)12aad-lincreased about 14 feet shortly after the initial filling ofthe reservoir in 1938 (fig. 15). Maximum water levelsin well (A-6-2)18bad-l increased about 10 feet after thereservoir filled to its expanded storage capacity in 1962.
It is now thought that loading had an initial effecton the water levels in the principal aquifer and thatupward leakage to Pineview Reservoir from the confined part of the principal aquifer controls ground-waterlevels. Leakage through the confining layer is drivenby the difference in water levels between PineviewReservoir and the confined part of the principal aquifer.A seepage rate to Pineview Reservoir ranging from0.17 to 0.20 foot per day was measured at three sites (pI.2) by use of seepage meters installed underwater on thelakebed in July 1986. The seepage was assumed to bemoving upward through the confining layer in the bottom of Pineview Reservoir.
Most water movement is upward into PineviewReservoir, but some downward leakage may occur nearthe current Ogden well field because water levels in thewells usually are below the stage ofPineview Reservoir(fig. 13).
Water Quality
Selected drinking-water standards set by the U.S.Environmental Protection Agency (USEPA) (1986) forhuman health are:
Dissolved solids concentration should not exceed 250milligrams per liter for chloride and sulfate
Iron should not exceed 300 micro-grams per liter
Manganese should not exceed 50 micro-grams per liter
Nitrate and nitrite should not exceed 10 milli-grams per liter
51

Fluoride
pH
Fecal coliform bacteria
should not exceed 1.4 to 2.4milligrams per liter depending on air temperature
should be between 5.0 to 9.0
should not exceed 1count (orcolony) for every 100milliliters of water
Analyses of water samples from wells in the valley-fill aquifer system are shown in table 8 and analysesfrom springs are shown in table 9. Water quality of thesamples collected in 1985 is diagrammatically shownon plate 2. Few water samples have been collected inOgden Valley by the U.S. Geological Survey since the1950's. In 1971, Doyuran (1972) collected and analyzed water samples. In general, dissolved-solids concentration of water in the valley-fill aquifer system doesnot exceed 350 milligrams per liter, and most of thewater is a calcium-bicarbonate type. Wells that haveother than a calcium bicarbonate type water are (A-62)7ddb-1 and (A-7-1)28baa-1, which have a calciumsodium bicarbonate type water; (A-7-1 )29ada-1, whichhas a calcium-magnesium-bicarbonate type water; and(A-6-2)21acd-l and (A-7-l)8cad-1, which have a calcium-magnesium-sodium-bicarbonate type water.
Generally, ground water in the North Fork OgdenRiver valley is characterized by small dissolved-solidsconcentrations. Slightly more mineralized groundwater is present in the Middle Fork Ogden River andSouth Fork Ogden River valleys. Analyses by Doyuran(1972) generally correspond with this distribution.
The water type shown for each analysis in table 8was determined from values converted from the actualconcentrations of each ion, in milligrams per liter, to avalue in milliequivalents per liter. This conversionmakes all of the ions chemically equivalent by adjusting for different molecular weights and electricalcharges. More than 50 percent of a single cation or asingle anion, in milliequivalents per liter, indIcates predominance of that ion; otherwise, percentages for eachof the predominant cations and anions are addedtogether until the combination is greater than 50 percent.
Analyses for nitrate are shown in tables 8 and 9.Water from one well, (A-6-2)6dad-l, had a nitrate concentration that exceeded the USEPA standards fordrinking water.
Analyses for MBAS (Methylene-Blue ActiveSubstances), which is an indicator of manmade surfactants or sudsing agents, are shown in table 9. Analyses
52
for MBAS were used to determine if ground-waterseepage from the base of hillsides on the north andsouth sides of Huntsville originates, in part, from septictank outflow. The concentration of surfactants inuntreated wastewater would be about 8 to 10 milligrams per liter (Duthie, 1972, p. 341); however, theMBAS values of 0.03 milligrams per liter for seepagesamples indicate that little of the seepage is derivedfrom septic tank outflow.
Water from two wells sampled by Doyuran(1972) had a concentration of nitrate in excess of theUSEPA recommended limit of 10 milligrams per liter.One sample was from a shallow well southeast of Edenand the other was from a well south of Liberty. Waterfrom wells sampled by Doyuran (1972) near well (A-62)6dad-l, which was sampled for this study, had elevated nitrate concentrations but did not exceed 10 milligrams per liter. The large nitrate concentration inwater from the well southeast of Eden could be derivedfrom chemical fertilizer because water from that welldid not show a high coliform count; however, unsatisfactory counts of coliform were found by Doyuran(1972) in water from the well south of Liberty and inwater from the wells near well (A-6-2)6dad-l.
Water that has a pH value of less than 7.0 maycause pipe corrosion and solubility of trace elementsfrom natural sources into the water. Water samplesfrom two wells, (A-7-1)7dba-1 and (A-7-l)17bcb-1,had pH values of less than 7.0, which indicate an areawhere the water recharging the aquifer is slightlyacidic. Larger-than-typical concentrations of sometrace elements may occur in water in this area becausetrace elements have greater solubility at small pH values. However, iron and manganese, the only trace elements analyzed for in this study, were not detected inunusually large concentrations. The concentration ofdissolved iron approaches 300 micrograms per liter intwo wells, (A-6-2)28aba-1 and (A-7-l)7dba-l, but doesnot exceed the USEPA recommended limit.
Because snowmelt recharges the aquifer, the pHof snow in the valley was measured at three locations inJanuary 1985. Cores that were 2 inches in diameter andabout 3 feet long were taken from the snowpack at least500 feet from any road. The snow was melted slowlyin sealed tubes for 2 days before the pH measurementwas taken. The specific conductance of all snowmeltsamples was below detection on the conductance meterwhich had a minimum scale reading of 1.0 microsie- 'men per liter. The pH values of the snowmelt samplesare as follows:

pH values of snowmelt
Sample pH valuelocation (standard
units)
Lat.41°21'27"N., 5.2long. 111° 52' 47" E
Lat. 41° 19' 22" N., 6.7long. 111°49' 38" E
Lat. 41 0 14' 01" N., 6.2long. 111 0 43' 26" E
Generalsite
description
Near well (A-7-1) 7dba-1
Near well (A-7-1 )27baa-1
Near well (A-6-2)28aaa-1
tions. Values in the budget were used for data entry andfor calibration of a ground-water model that simulatedflow in the valley-fill aquifer system. Details of themodel are described later in this report. Values determined on a monthly basis for each component of thewater budget can vary from year to year, so the valuespresented in this report are unique for the indicated timeperiod. The budget values will vary because of climatic conditions such as the time and duration of snowmelt, the summer temperature, and the quantity ofprecipitation.
Recharge
According to Messer and others (1982, fig. 2), thepH value of 5.2 is low for snowmelt in the region. ThispH value was determined for the snowmelt sample collected near well (A-7-1)7dba-1, which yielded thesmallest pH value of all samples from wells (table 8).
The temperature of all ground-water samplesexceeded 7.0 °C, which is about the annual mean airtemperature for Ogden Valley and the temperature towhich shallow ground water usually equilibrates.Ground water from well (A-6-2)16bad-1 had a temperature of 14.0 °c (table 8). This well is in the area whereDoyuran (1972) measured the highest water temperature. The elevated temperatures indicate deep circulation of ground water in the valley-fill aquifer system.Because the highest temperatures are along the projected east-bounding fault zone, it is possible thatupwelling of warm water from the bedrock along thefault is contributing to the elevated water temperaturesin the valley-fill aquifer system.
Iron bacteria in Ogden wells was first recorded in1951, but a sudden worsening of the problem occurredin 1964 (Doyuran, 1972). At that time, the artesian wellfield was located under Pineview Reservoir and wasinaccessible for periodic treatment, so the wells wereplugged and abandoned. Replacement wells weredrilled nearby above the level of the reservoir.
WATER BUDGET FOR THE VALLEY-FILLAQUIFER SYSTEM
A periodic water budget of all recharge to anddischarge from the valley-fill aquifer system was prepared for mid-February 1985 through January 1986(table 10). The time interval was divided into 12 periods that were about 30 days in duration. The budgetprovided estimates of seasonal variations in rechargeand discharge that are large compared to annual varia-
The valley-fill aquifer system is recharged fromvarious sources. Each source was analyzed separatelyto provide detailed analysis of the ground-water-f1owsystem.
Precipitation
Recharge from snowmelt occurs during thespring. In 1985, the snowmelt occurred from late February through early April. It was assumed that 33 percent of the total snowpack recharged the aquifer.
Recharge from rainstorms in 1985 occurred during October to December. Recharge from rainstormswas assumed to occur when the total rainfall in a stormexceeded 1.5 inches, the threshold value determined byThomas (1952, p. 74). It was assumed that 33 percentof the net rainfall recharged the aquifer.
The areal distribution of recharge from snowmeltand rainstorms was based on the contours showing normal annual precipitation (pI. 1). The estimated rates ofrecharge during various periods are shown in table 10.
Irrigation and Irrigation Distribution Losses
Irrigated acreage in Ogden Valley was mappedfrom high-altitude, infrared aerial photographs taken in1981. The mapping was field checked twice in 1985.During the May-July irrigation season, about 7,000acres were irrigated. The irrigated acreage declined toabout 6,400 acres in August when the small grains wereharvested.
All of the irrigation water is derived from surface-water sources and springs, but the method of waterapplication and the consequent recharge potential varysubstantially. Pressurized side-roll and hand-pipesprinkler systems and ditch and field-flooding systemsare used. It is assumed for the preparation of the water
53

Table 8. Chemical analyses of water samples from wells
IuS/em, microsiemens per centimeter at 25 degrees Celsius; "c, degrees Celsius; mg/L, milligrams per liter; Ilg/L, micrograms per liter; -, no data;
Location: See figure 2 for description of data-site numbering system.Sampling method, codes: 4040, submersible pump; 4090, jet pump; 8010, turbine pump.
Flow Solids,rate, Spe- Hard- sum of Magne-
instan- cific Hard- ness, Alka- constit- Calcium, sium, Sodium,Date taneous conduct- pH Temper- ness noncar- Iinity, uents, dis- dis- dis-
of (gallons ance (stand- ature (mg/L bonate lab dis- solved solved solvedLocation sample per (IlS/cm) ard (DC) as (mg/L as (mg/L as solved (mg/L (mg/L (mg/L
minute) units) CaC03 ) CaC03 ) CaC03 ) (mg/L) as Ca) as Mg) as Na)
(A-6-1) Idad-I 09-13-85 6.2 185 7.2 12.0 88 5 83 100 27 5.1 4.0(A-6-1)llcab-3 10-06-85 2,300 320 7.1 9.0 150 20 129 170 43 10 12(A-6-1)lldbd-1 09-17-32 100 150 30 7.3 II(A-6-1)lldbd-2 09-24-32 30 160 210 47 10 14(A-6-1)lldbd-3 10-12-32 250 300 73 17 7.2
(A-6-1)lldcd-2 11-04-55 180 415 7.3 9.0 210 16 230 55 17 6.3(A-6-1)12aad-1 10-12-32 72 210 13 9.5 47
06-17-53 570 7.5 11.0 180 18 320 46 16 49(A-6-1 )23adb-1 04-04-60 5.0 780 9.4 13.5 10 0 500 4.0 <.1 1190
04-06-60 175 760 8.8 0 0 510 <.1 <.1 1195
(A-6-2) 6dad-1 09-03-85 18 540 7.0 10.5 240 75 163 270 69 16 14(A-6-2) 7bcc-1 09-03-85 9.0 390 7.8 12.0 160 9 151 250 46 II 22(A-6-2) 7ddb-1 09-03-85 II 455 7.5 10.5 170 0 181 260 48 II 35(A-6-2) 8ddb-1 09-03-85 16 360 7.1 9.5 180 7 171 200 50 13 7.3(A-6-2)14bbd-1 09-13-85 9.0 435 7.6 9.0 210 25 187 240 57 17 14
(A-6-2)15acb-1 08-21-85 31 470 7.7 12.0 220 27 195 260 61 17 15(A-6-2)15cdb-1 09-04-85 27 340 7.9 8.0 180 10 171 190 51 13 4.8(A-6-2)16bad-1 09-03-85 5.8 440 7.6 14.0 220 28 191 250 63 15 10(A-6-2)17cca-1 08-29-85 7.8 370 7.8 9.0 190 14 176 210 53 14 7.2(A-6-2)17dac-1 09-03-85 9.5 355 7.5 11.0 190 15 173 200 52 14 5.6
(A-6-2)l8bad-1 11-30-55 43 415 7.5 10.0 200 0 240 54 15 <13(A-6-2)2Iacd-1 09-03-85 6.7 590 7.7 10.0 210 34 172 330 53 18 43(A-6-2)28aba-1 09-17-85 14 315 7.1 11.0 150 5 140 180 40 II 8.6(A-7-1) 7dba-1 09-05-85 9.0 140 6.7 11.0 63 II 52 84 18 4.5 3.6(A-7-1) 8cad-1 08-29-85 18 190 7.3 11.0 73 0 73 110 18 6.8 12
(A-7-1)17bcb-1 09-05-85 5.1 155 6.8 10.0 72 12 60 93 21 4.7 3.9(A-7-I)l9aad-1 08-26-85 23 365 7.8 9.0 180 13 170 200 57 9.9 5.4(A-7-1)20dcd-1 09-05-85 4.6 280 7.5 9.0 150 24 123 160 44 8.9 5.4(A-7-1)2Ibbc-1 09-05-85 7.7 245 7.4 9.5 110 12 96 150 32 6.7 9.1(A-7-1)28baa-1 08-20-85 8.2 280 8.3 12.0 90 0 115 200 23 8.0 23
(A-7-1)29ada-1 09-13-85 6.8 240 7.2 11.0 100 6 94 150 24 9.7 13(A-7-1)34aca-1 08-22-85 14 240 7.8 10.0 110 12 94 130 29 8.2 6.9
I Sodium plus potassium.
54

<. constituent concentration less than indicated detectable limits1
Nitro- Nitro-Potas- Chlo- Fluo- Silica, gen, gen, Manga- Sam-sium, Sulfate, ride, ride, dis- Nitrate, N02 +N03 Iron, nese, piingdis- Bicar- Car- dis- dis- dis- solved dis- dis- dis- dis- method, Water
solved bonate bonate solved solved solved (mgIL solved solved solved solved codes type(mg/L (mg/L (mg/L (mgIL (mg/L (mgIL as (mgIL (mg/L (I!g/L (l!gILas K) as HC03 as C03) as 504) as CI) as F) Si02) as N03) as N) as Fe) as MN)
0.9 4.6 3.6 0.1 6.5 0.26 19 <I 4040 Ca-HC03.7 9.4 12 <.1 10 .92 <3 2 8010 Ca-HC03
2.3 130 0 8.7 10 .6 14 1.3 202.0 200 0 2.5 22 1.1 18 <.1 406.0 290 0 17 12 8 27 6.0 20
1.2 230 0 12 12 .1 10 2.7 <104.3 50 7 32 61 .4 4.8 <.1 101.9 200 0 20 72 .2 17 1.1 40
320 57 24 29 42 .6370 18 39 34 38 .4
2.7 17 36 <.1 13 II 100 22 4040 Ca-HC031.6 16 27 .3 32 .66 6 14 4040 Ca-HC031.0 8.0 33 .1 17 .98 5 <I 4040 Ca-Na-HC031.2 8.3 6.9 .1 15 1.10 140 27 4090 Ca-HC031.0 II 22 .1 7.5 .31 <3 7 4040 Ca-HC03
1.3 9.2 30 .1 II .96 8 4 4040 Ca-HC03.9 7.7 6.2 .1 7.2 .27 5 <I 4040 Ca-HC03.9 13 18 <.1 15 1.30 <3 I 4040 Ca-HC03.7 9.0 9.1 <.I 7.4 .43 <3 <I 4040 Ca-HC03
1.2 8.8 7.3 <.1 7.4 .53 4 <I 4040 Ca-HC03
1.0 240 0 6.9 14 <.1 17 2.0 10 1001.8 25 75 .2 II 1.10 10 2 4040 Ca-Mg-Na-HC032.0 II 5.5 .1 19 .13 240 20 4040 Ca-HC031.1 15 3.9 <.1 6.5 .32 210 19 4040 Ca-HC03.9 7.4 II <.1 13 .27 110 4 4040 Ca-Mg-Na-HC03
.6 II 4.5 <.I II .99 21 3 4040 Ca-HC03
.6 8.4 7.7 <.1 9.1 .47 5 12 4040 Ca-HC03
.4 9.9 7.3 <.1 11 1.70 4 <1 4040 Ca-HC031.9 6.3 12 .2 24 .31 18 26 4040 Ca-HC035.2 18 6.5 .7 49 .11 33 7 4040 Ca-Na-HC03
.7 16 8.4 .1 17 .41 17 3 4040 Ca-Mg-HC031.5 8.6 10 .1 12 .97 4 8 4040 Ca-HC03
55

Table 9. Chemical analyses of water samples from springs
[ft3/s, cubic feet per second; "C, degrees Celsius; IlSlcm, microsiemens per centimeter at 25 degrees Celsius; mg/L, milligrams per liter; Ilg/L, micrograms
Location: See figure 2 for description of data-site numbering system.Sampling method codes: 70, dip sample.
Flow Spe- Hard- Alka- Solids,rate, cific Hard- ness, Iinity, sum of
Date instan- conduct- pH Temper- ness noncar- lab constituents,of taneous ance (stand- ature (mglL bonate (mglL dis-
Location Sample (tt3/s) (IlS/cm) ard (DC) as (mgIL as solvedunits) CaC03) CaC03) CaC03) (mglL)
(A-6-2)27dcc-S I 09-17-85 1.6 430 7.5 9.5 220 17 207 240(A-7-1)19dbc-S I 09-11-85 .25 280 7.8 10.0 140 21 123 160(A-7-1)22caa-SI 01-24-85 175 7.2 24.0 58 0 61 100(A-7-1)30aca-SI 09-11-85 350 8.0 7.0 190 21 173 200(A-7-3)23acb-S I 09-17-85 '20 390 8.2 6.5 220 17 201 220
Seepage from unconfinedaquifer southwest ofHuntsville 10-31-85 1.04 445 7.7 12.0 260 10 246 280
Seepage from unconfinedaquifer northwest ofHuntsville 10-31-85 .01 450 8.4 12.0 250 23 232 270
1Estimated value.
budget that the application rate is the same for all irrigation techniques. This rate is estimated to be 1 acrefoot per acre per month. The rate is based on specifications given for the Causey project, which provided irrigation water from Causey Reservoir (N.W. Plummer,Regional Director, U.S. Bureau of Reclamation, oralcommun., 1981). The total delivery rate necessary foran application rate of I acre-foot per acre per month onthe early-season irrigation acreage is 118 cubic feet persecond. The desired delivery rate from August throughSeptember decreased to 107 cubic feet per second.
The delivery rate from May through July 1985was fully met by surface-water flows. The desireddelivery rate from August through September was notmet by surface-water flows during that entire period,but the consumptive-use needs of the crops wereassumed to be fully satisfied. The monthly delivery ratefor 1985 was estimated as the greater of either thedesired delivery rate for the acreage irrigated or theaverage monthly surface-water flow into Ogden Valley,as determined from a proportion of the South ForkOgden River streamflow.
Not all of the water diverted for irrigation is lostto crop-consumptive use. Part of the water is lost to
56
evaporation from canals or ditches, part runs out the tailend of the ditches into Pineview Reservoir, part infiltrates the soil and recharges the aquifer directly beneaththe canals or ditches, and the remainder infiltrates thesoil beneath irrigated acreage and recharges the valleyfill aquifer system.
For this study, it was assumed that 5 percent ofthe delivered water was lost to evaporation and 10 percent ultimately flowed into Pineview Reservoir and outof Ogden Valley. Crop consumptive use in Ogden Valley was determined by G.B. Pyper (U.S. GeologicalSurvey, oral commun., 1986) with a method thataccounted for crop type and acreage, daylight hours, airtemperature, and precipitation.
Seepage to the aquifer from irrigation canals(irrigation distribution losses) is small and variesthroughout the irrigation season. Some canals did notreceive water throughout the season; other canals continued to receive water after the irrigation season wasover. Water from the Mountain Valley (or Ogden Valley) Canal did not flow past the Middle Fork OgdenRiver until sometime in June; in the summer, the measured net loss was 4.0 cubic feet per second (Herbertand others, 1987). The West Ditch lost 0.8 cubic feet

per liter; <, constituent concentration less than indicated detectable limit]
Nitro- Methy-Magne- Potas- Chlo- Fluo- gen, Manga- lene
Calcium, slum, Sodium, sium, Sulfate, ride, ride, Silica, N02 +N03, Iron, nese, blue Sam-dis- dis- dis- dis- dis- dis- dis- dis- dis- dis- dis- active piing
solved solved solved solved solved solved solved solved solved solved solved sub- method,(mgfL (mgfL (mg/L (mg/L (mg/L (mg/L (mg/L (mg/L as (mg/L (~gfL (~gfL stance codesas Ca) as Mg) as Na) as K) as 504) as CI) as F) 5i02) as N) as Fe) as Mn) (mgfL)
60 18 7.7 1.3 8.9 9.4 <0.1 10 0.65 <3 <I 7041 10 3.1 .7 16 4.9 .6 6.7 .32 6 <1 7014 5.5 12 2.1 10 9.8 .2 13 .17 7043 20 4.6 .7 15 4.0 .1 7.5 .23 12 3 7064 15 2.6 .8 9.4 2.9 <.1 6.0 .84 <3 <1 70
76
74
16
17
7.0
7.4
5.4
3.9
1.0
9.8
6.1
8.2
.2
.1
12
11
.54
.26
.03
.03
70
70
water recharging the aquifer was determined for eachmonth of irrigation in 1985 as follows:
118 -(0.15)(118) -12.5 = 87.8118 -(0.15)(118) -40.7 =59.6118 -(0.15)(118) -65.5 = 34.8101 -(0.15)(101) -46.6 =39.3
79 -(0.15)(79) - 8.9 = 58.3
per second, but was dry after the first of August. Theupper Eden Canal lost 1.2 cubic feet per second, andWolf Creek Ditch lost 0.4 cubic feet per second. TheHuntsville South Bench Canal and the Eden Canaldiverted water for livestock until sometime in November. Other canals and ditches showed minor losses.
The quantity of irrigation water recharging theaquifer in 1985 was estimated with the following equation:
Month
MayJuneJulyAugustSeptember
DR L CCR IR
(75 percent)(50 percent)(30 percent)(40 percent)(75 percent)
IR = DR -L -CCR (1)
where IR = the quantity of irrigation waterrecharging the aquifer, in cubic feetper second;
DR = the quantity of delivered water, incubic feet per second;
L = loss of delivered water, in cubic feetper second, by evaporation and canalflow into Pineview Reservoir; and
CCR = crop consumptive use, in cubic feetper second.
The quantity of irrigation water recharging theaquifer and the approximate percentage of delivered
Losing Streams
Miscellaneous measurements made in Februaryand March 1985 (table 4) can be used to identifyreaches where recharge takes place and the quantity offlow that recharges the aquifer system from streamsduring the winter months. In the first reach of the NorthFork Ogden River, about 2.4 cubic feet per secondseeped to the aquifer; in the second reach of the NorthFork Ogden River, about 7.6 cubic feet per secondseeped to the aquifer. Although the last measured reachof North Fork Ogden River indicates a net gain from theaquifer, it was estimated that the upper part of this reachactually loses about 2 cubic feet per second to the aqui-
57

Table 10. Water budget for the valley-fill aquifer system, mid-February 1985 through January 1986
[Values are in cubic feet per second]
Winter Mid-February Mid·March Mid-April May
1985 to mid-March to mid-April to May
(period 1) (period 2) (period 3) (period 4)
Estimated recharge
Precipitation 0 9 120 0 0Irrigation 0 0 0 0 88Irrigation distribution losses 0 0 0 0 6Losing streams 67 69 140 140 105Subsurface inflow 48 48 48 48 72
Total 115 126 308 188 271
Estimated discharge
Gaining streams 48 48 93 93 93Springs and drains 22 27 32 29 51Ogden well field 15.0 14.4 15.4 18.4 13.9Other wells .1 .1 .1 .1 .3Evapotranspiration 0 0 0 1 13Pineview Reservoir 45 45 60 78 88
Total 130.1 134.5 200.5 219.5 259.2
Estimated recharge from minor perennial streams during latewinter 1985
Spring snowmelt on the hillsides surroundingOgden Valley was assumed to temporarily increaseflow in the minor perennial streams. Some channelsthat were dry all winter also had flow during the snowmelt period. Spring snowmelt increases the potentialfor increased recharge during the early spring. It wasestimated that recharge from flow in minor perennialstreams doubled during the snowmelt period. Startingin June, all minor streams except Geertsen Canyon
fer. In the measured reach of the Middle Fork OgdenRiver, about 4.3 cubic feet per second seeped to the
aquifer. Recharge from the South Fork Ogden River
was estimated at 46 cubic feet per second (Browning,
1925, p. 17-20).
Starting in May, diversions from streams into
canals decreased water depths in the stream channels;the estimated recharge to the aquifer system was 25 percent less than the pre-diversion value. The North ForkOgden River above the first diversion structure was
estimated to lose 4 cubic feet per second to the aquifer,
but the flow was entirely diverted at the first diversion
structure. Flow in the Middle Fork Ogden River wasentirely diverted in June. Flow in the South ForkOgden River exceeded the capacity of the diversionstructure in June, and water flowed down the entirereach of the stream channel. It was estimated that about46 cubic feet per second from the South Fork Ogden
River recharged the aquifer during June 1985.
Estimated recharge from the remaining perennial
streams during the winter months is as follows:
58
Stream
Bally Watts Creek
Maple-Kelley Canyon creek
WolfCreek
Pole Canyon Creek
Sheep Creek
Cold Canyon Creek
Cobble Creek
Geertsen Canyon creek
Recharge(cubic feet
per second)
0.5
.71.0
.5
1.0
.5
.5
.5
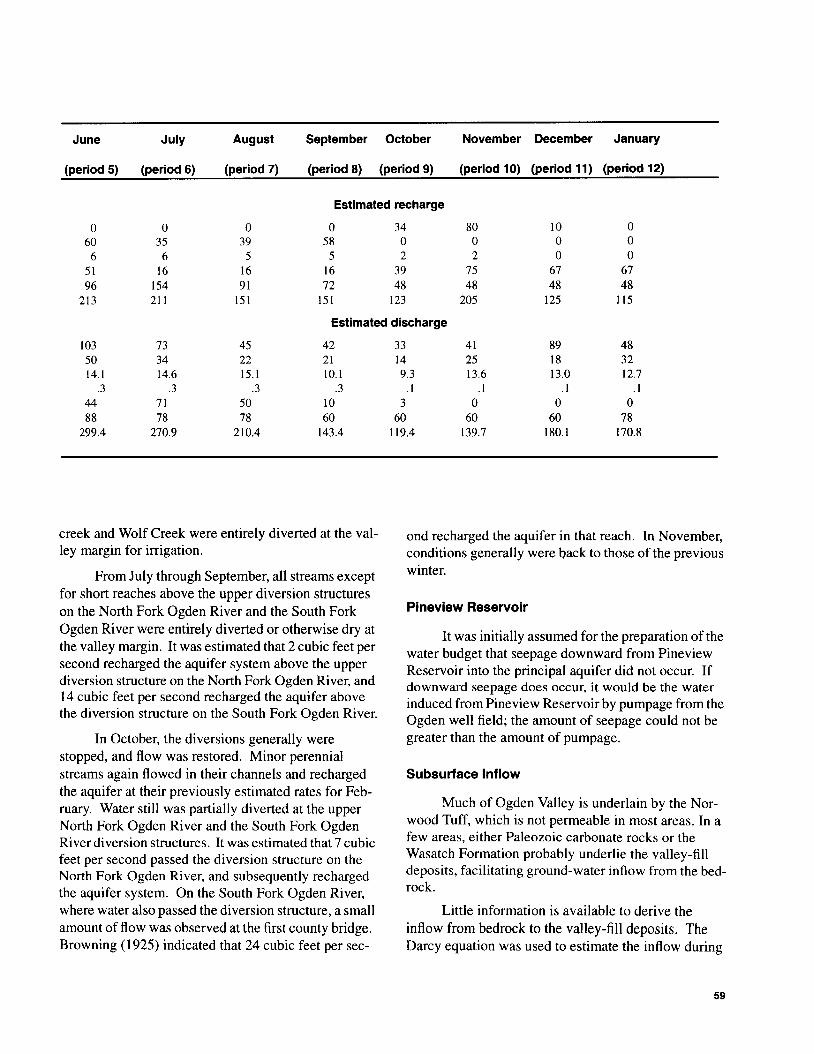
June July August September October November December January
(period 5) (period 6) (period 7) (period 8) (period 9) (period 10) (period 11) (period 12)
Estimated recharge
0 0 0 0 34 80 10 060 35 39 58 0 0 0 06 6 5 5 2 2 0 0
51 16 16 16 39 75 67 6796 154 91 72 48 48 48 48
213 211 151 151 123 205 125 115
Estimated discharge
103 73 45 42 33 41 89 4850 34 22 21 14 25 18 3214.1 14.6 15.1 10.1 9.3 13.6 13.0 12.7
.3 .3 .3 .3 .1 .1 .1 .144 71 50 10 3 0 0 088 78 78 60 60 60 60 78
299.4 270.9 210.4 143.4 119.4 139.7 180.1 170.8
creek and Wolf Creek were entirely diverted at the valley margin for irrigation.
From July through September, all streams exceptfor short reaches above the upper diversion structureson the North Fork Ogden River and the South ForkOgden River were entirely diverted or otherwise dry atthe valley margin. It was estimated that 2 cubic feet persecond recharged the aquifer system above the upperdiversion structure on the North Fork Ogden River, and14 cubic feet per second recharged the aquifer abovethe diversion structure on the South Fork Ogden River.
In October, the diversions generally werestopped, and flow was restored. Minor perennialstreams again flowed in their channels and rechargedthe aquifer at their previously estimated rates for February. Water still was partially diverted at the upperNorth Fork Ogden River and the South Fork OgdenRiver diversion structures. It was estimated that 7 cubicfeet per second passed the diversion structure on theNorth Fork Ogden River, and subsequently rechargedthe aquifer system. On the South Fork Ogden River,where water also passed the diversion structure, a smallamount of flow was observed at the first county bridge.Browning (1925) indicated that 24 cubic feet per sec-
ond recharged the aquifer in that reach. In November,conditions generally were back to those of the previouswinter.
Pineview Reservoir
It was initially assumed for the preparation of thewater budget that seepage downward from PineviewReservoir into the principal aquifer did not occur. Ifdownward seepage does occur, it would be the waterinduced from Pineview Reservoir by pumpage from theOgden well field; the amount of seepage could not begreater than the amount of pumpage.
Subsurface Inflow
Much of Ogden Valley is underlain by the Norwood Tuff, which is not permeable in most areas. In afew areas, either Paleozoic carbonate rocks or theWasatch Formation probably underlie the valley-filldeposits, facilitating ground-water inflow from the bedrock.
Little information is available to derive theinflow from bedrock to the valley-fill deposits. TheDarcy equation was used to estimate the inflow during
59

Average monthly rate of flow of Burnett Spring[(A-7-1)22dad-S1] for May through September 1985
The variability in subsurface inflow from the bedrock(table 10) was estimated from the changes in flow ofBurnett Spring.
where Q = discharge,
K = hydraulic conductivity,
I = hydraulic gradient, and
A = cross-sectional area through whichflow occurs;
subsurface inflow when snowmelt was not contributingto the ground-water system was about 48 cubic feet persecond.
stable conditions for the winter when snowmelt was notoccurring. It was assumed that all inflow from the bedrock occurred along the vaHey perimeter, which isabout 208,000 feet long. The hydraulic conductivity ofthe bedrock was estimated to be I foot per day. Wheninfiltration of snowmelt was not occurring, the averagehydraulic gradient was estimated to be 0.2 foot per day,and the average saturated thickness ofthe bedrock-flowsystem contributing to the valley-fill deposits was 100feet. Using the Darcy equation,
Q=KIA
Discharge
Gaining Streams
The valley-fill aquifer system loses waterbecause of various types of discharge. Each type of discharge was analyzed separately to provide detailedanalysis of the ground-water-flow system.
Miscellaneous measurements made in February1985 (table 4) indicate discharge from the valley-fillaquifer system to a number of stream channels. Manyof the gaining reaches are located in the southern part ofOgden Valley. The reach of the North Fork OgdenRiver above site NIl gained about 7.3 cubic feet persecond. The next downstream reach on the North ForkOgden River gained 3.9 cubic feet per second afteraccounting for a possible loss of 2 cubic feet per secondin the upper part of the reach. Bennett Creek showed again of about 5.1 cubic feet per second.
The remaining gaining reaches are along themajor stream channels upstream from Pineview Reservoir. From existing gaging station records, it was estimated that the North Fork Ogden River gained 6 cubicfeet per second in the unmeasured reach just abovePineview Reservoir, the Middle Fork Ogden Rivergained an estimated 4.5 cubic feet per second, GeertsenCanyon creek gained an estimated 1.5 cubic feet persecond, and the South Fork Ogden River gained an estimated 19 cubic feet per second. These gains wereassumed constant from February through mid-March.
From mid-March through May, it was assumedthat discharge from the valley-fill aquifer system to thedownstream reaches of the streams increased. Discharge to all the streams, except Bennett Creek, wasestimated to have doubled compared to the dischargeduring winter conditions. Bennett Creek mostly drainswater from the Wasatch Formation during mid-Marchthrough May, and flow is steady.
Discharge from the aquifer system to the streamsdecreases from June through October as shown in table10. Declining water levels in wells in the southern partof the valley also indicate that discharge from the aquifers is declining. Flow in the North Fork Ogden Riverdownstream from the springs is estimated to havedecreased by 5 cubic feet per second. Flow in BennettCreek doubled from seepage of irrigation water appliedover much of its drainage in the valley. Discharge fromthe aquifer system to Geertsen Canyon creek isassumed to remain fairly constant.
71
98
154
89
74
Average monthly rateof spring flow
(gallons per minute)Month
May
June
July
August
September
Subsurface inflow from the bedrock to OgdenValley increases dramatically because of snowmeltinfiltration in the area surrounding the valley. BurnettSpring [(A-7-1)22dad-SI], which supplies Eden withmuch of its municipal water, discharges from the valleyfill, but the actual source of the water is thought to bethe underlying bedrock of Norwood Tuff or metasedimentary rocks. The average rate of spring flow in 1985,before snowmelt occurred, was 48 gallons per minute(National Water Use Data System, Division of WaterRights, Utah Department of Natural Resources, writtencommun., 1986). For May through September, theaverage monthly rate of spring flow was as follows:
60

Evapotranspiration
of increased natural recharge in the spring and reducedground-water discharge to the reservoir because of theincreased stage of the reservoir. The water-level risesuggests that additional pumpage from the Ogden Citywell field is feasible because an increase in naturalrecharge and in the stage of Pineview Reservoir have agreater effect on water levels than an increase in pumpage.
About 11,500 acre-feet of water is consumedannually by natural vegetation and subirrigated cropland. In order to adjust this annual rate for the monthlyconditions that occurred in 1985, the proportional ratesof monthly crop consumption were determined by G.E.Pyper (U.S. Geological Survey, written commun.,1986). The monthly proportion of annual evapotranspiration, the monthly evapotranspiration, and theevapotranspiration rates determined by monthly cropconsumption for 1985' and adjusted for variable cli
matic conditions are as follows:
Monthly proportion of annual evapotranspiration, monthlyevapotranspiration, and evapotranspiration rates for 1985
Total pumpage from other wells was small whencompared to pumpage from the Ogden well field (table10). Pumpage from wells in the smaller public systemswas obtained from the National Water-Use Data System (Division of Water Rights, Utah Department ofNatural Resources, written commun., 1986). Pumpagefrom the unmeasured community systems was estimated on a per-user basis. Pumpage from each of theremaining wells, which are used for domestic purposesor stock watering, was estimated as I acre-foot per year.Very few wells are used exclusively for stock watering(table 7). Half of the annual total water pumped fromthese wells was assumed to be used during Maythrough September because of the increase in lawn andgarden watering.
1.013.544.4
71.550.2
9.72.9
193.2
Evapotranspiration
rate(cubic feet
per second)
58805
2,6454,2552,990
575172
11,500
0.005.07.23
.37
.26
.05
.0151.000
Monthly Monthlyproportion evapo-of annual transpiration
evapotranspiration (acre-feet)Month
Total
Late AprilMay
June
July
AugustSeptemberOctober
From August to November, discharge to streamswas reduced further. Discharge to the lower reach ofthe North Fork Ogden River is estimated to havedecreased another 5 cubic feet per second. Flow inBennett Creek decreased to about 5 cubic feet per second after seepage of irrigation water ceased. Dischargeto Geertsen Canyon creek remained fairly constant asestimated during this study.
In December, increases in flow recorded at thegaging stations were estimated to equal gains made bythe streams in the southern part of the valley. Dischargeto Bennett Creek and Geertsen Canyon creek stayedfairly constant from the previous period.
Wells
Springs and Drains
Springs and drains in Ogden Valley consist ofperennial springs and spring-fed reaches of streamchannels including Liberty Springs, Liberty SpringCreek, Bailey Spring, Spring Creek, small seeps thatemerge in the draws near the edge of the confininglayer, and seeps that occur in the area periodically inundated by Pineview Reservoir.
Measurements made in February 1985 (table 4)and estimates of the reservoir seeps give a total discharge from springs and drains of about 22 cubic feetper second. The total discharge by springs and drainsfor Ogden Valley during each water-budget period wasdetermined by the proportion that Spring Creek differed from its base-flow rate during the winter (table10).
The average monthly pumpage rate of the Ogdenwell field fluctuated during 1985 as shown in table 10.The fluctuation for a 5-day interval is shown in figure22. Pumpage is erratic but generally increases in thespring when water demand increases in Ogden. Thepumpage stabilizes when the filtration plant opens forthe summer and starts treating water diverted fromPineview Reservoir. Pumpage decreases in the fallwhen water demand begins to decline. The filtrationplant usually continues to treat reservoir water until lateOctober.
Hydrographs for water-level altitudes in a wellcompleted in the confined part of the principal aquifernear the Pineview Reservoir and for the stage of Pineview Reservoir are shown in figure 22. The water levelin the well rose during increased pumpage from theOgden well field. The rise resulted from a combination
61
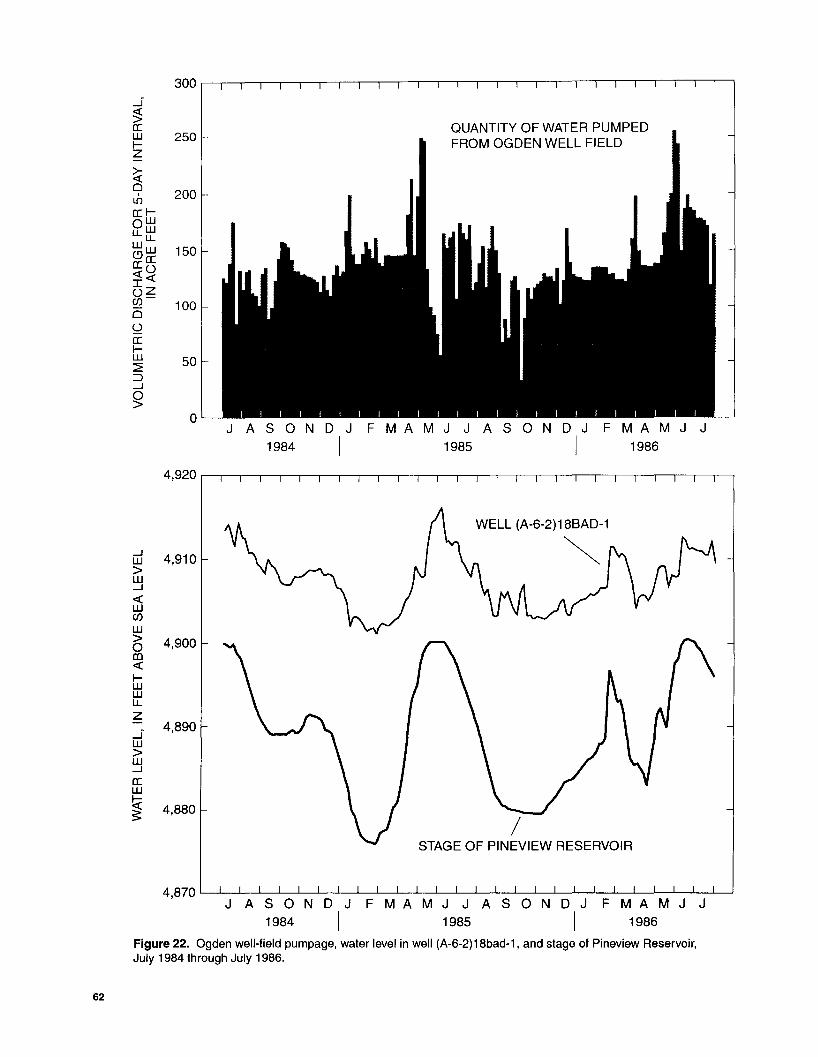
300....J-
~QUANTITY OF WATER PUMPEDa::
W 250 FROM OGDEN WELL FIELDI-z
~0
200,L[)
a:: I-OWu. UJ
u.Ww 150<9 a::a:: U««IU~(J) 1000Ua::I-W 50:::2:::J....J0>
0M A MJ A S 0 N D J F M A M J J A SON D J F J J
1984 I 1985 I 1986
4,920
WELL (A-6-2)18BAD-1
....J4,910 ~W
>UJ....J
«UJ(J)
UJ> 4,9000co«I-WWu.z..i
4,890W>W....J
a::W
~ 4,880~ /
STAGE OF PINEVIEW RESERVOIR
4,870 L...-..L.-..l.---'-------'--------'------'-----'----I.-----''-----J...--..L.-..l.---'-------'--------'------'-----'----I.-----''--'---'-----'-------'--------'------'-----'----J
J ASOND J FMAMJ J ASONDJ FMAMJ J1984 I 1985 I 1986
Figure 22. Ogden well-field pumpage, water level in well (A-6-2)18bad-1, and stage of Pineview Reservoir,July 1984 through July 1986.
62

Subsurface Outflow
Pineview Reservoir
Outflow from the valley-fill aquifer system to thebedrock surrounding Ogden Valley is unlikely. It ispossible that water drains into the carbonate rocks or
North Fork Ogden River 16.5Middle Fork Ogden River 35.0South Fork Ogden River 19.2Lower area (southwestern part of reservoir 16.0
exclusive of the three arms)Total 86.7
SIMULATION OF GROUND-WATER FLOWIN THE VALLEY-FILL AQUIFER SYSTEM
the Wasatch Formation where the Norwood Tuff isabsent. It also is possible that water drains into permeable bedrock 3.5 miles west of Liberty and 5 milessouth of Huntsville. Because of the lack of evidence·ofany outflow, it was presumed to be negligible.
The valley-fill aquifer system in Ogden Valleywas simulated using two layers (fig. 23). The upperlayer, layer I, represented the shallow water-table aquifer and was active only in the southern part of the valleyabove the confining layer. Layer I was not simulated inthe area perennially inundated by Pineview Reservoirbecause the bottom of the reservoir is incised into theconfining layer. The lower layer, layer 2, representedthe principal aquifer and was active throughout the simulated area. Layer 2 was simulated with an option inthe computer model (McDonald and Harbaugh, 1984,p. 151) that allows the use of either the storage-coefficient value or specific-yield value. If the water level is
Model Design and Assumptions
A finite-difference, three-dimensional computermodel was used to simulate ground-water flow in thevalley-fill aquifer system of Ogden Valley. The computer program used was developed by McDonald andHarbaugh (1984). Most of the data used for calibrationof the steady-state and transient model simulations arepresented in previous sections of this report.
The computer-model simulation was done inorder to improve understanding of the hydrology of thevalley-fill aquifer system, including the areal distribution and range in values of the hydraulic properties.Few data on the subsurface geology have been collected and analyzed other than data for the now-abandoned Ogden artesian well field and vicinity.Adjustments to the initial hydraulic-property values ofthe aquifer system during calibration were made on thebasis of flow rates to and from streams and PineviewReservoir and the agreement between measured andcomputed ground-water levels.
Two hypothetical changes to the water budgetwere simlflated to observe the resulting effects onstreamflow and ground-water levels. A I-year droughtand withdrawals from three additional wells were simulated to estimate the magnitude and distribution of theeffects from such conditions.
Upward seepage(cubic feet per second)
Upward seepage(cubic feet per second)
Reservoirarm
Reservoirarm
The quantity of seepage for spring and fall reservoir levels of 4,876; 4,880; 4,890; and 4,900 feet wasestimated by integrating seepage rates over the area ofthe reservoir. The quantity of possible downward seepage was not subtracted from these estimates (table to).
The quantity of seepage during the winter wasestimated using the same seepage rates for a smallerarea of the reservoir. The quantity of seepage to Pineview Reservoir during the winter was estimated to be45.5 cubic feet per second.
Estimated seepage to Pineview Reservoir during winter
North Fork Ogden River 9.0Middle Fork Ogden River 14.0South Fork Ogden River 14.4Lower area (southwestern part of reservoir 8.0
exclusive of the three arms)Total 45.4
Upward seepage through the lakebed was measured in July 1986 when the stage of Pineview Reservoir was slightly below its maximum of 4,900 feet. Aseepage-measurement site was located in each of the"arms" of Pineview Reservoir (pI. 2). The total amountof seepage was estimated by integrating the seepagerates at the measurement sites over the entire reservoirarea. The total amount of seepage to Pineview Reservoir from the principal aquifer at the time of the seepage measurements was estimated to be 86.7 cubic feetper second.
Estimated seepage to Pineview Reservoir, July 1986
63

~
Southwest Northeast---CONSTANT
FLUXINFLOW
..- Ground-water flow direction
OUTSprings, drains, stream
gains, wells, andevapotranspiration
a n c e~
LAYER 2 (Principal aquifer)
....-
Q)u~~:::J~l/) ·5Uo
"i:: etSQ>-oE Q)
.2.§- cc 0~ u~o
~~~ I
FLUX " "%"'"" ""OUTFLOW~ NOF,gl{1l
Figure 23. Schematic section of the two-layer ground-water flow model simulating the aquifer system in Ogden Valley.

above the top of layer 2, the storage-coefficient value isused. If the water level is below the top of layer 2, thespecific-yield value is used. Flow between layer 1 andlayer 2 through the confining layer was simulated usingvalues of vertical hydraulic conductivity of the confining layer divided by the average thickness of the confining layer (vertical conductance) (McDonald andHarbaugh, 1984, p. 151). In this case, vertical conductance of the aquifer material does not slow verticalground-water movement, compared to the confininglayer, and thus, can be ignored.
A block-centered grid with variable spacing wasused to divide a map of the valley-fill aquifer systeminto discrete cells (fig. 24). The grid spacing wassmaller on the west side of the model grid to allowaccurate location of hydrologic boundaries andstresses. The grid consists of 59 rows and 23 columns.The rows are spaced 1,340 feet apart. The columns arespaced from 1,320 to 1,340 feet apart on the west sideof the grid and from 1,540 to 1,640 feet apart on the eastside of the grid. Of the 1,357 total cells in each layer inthe grid, 782 cells in layer 2 are active and 139 cells inlayer 1 are active.
Model Boundary Conditions
The entire model area was surrounded by constant-flux cells. The active cells at the periphery of themodel represented consolidated rock and valley fill thatis mainly slopewash with a relatively small hydraulicconductivity along the edge of the valley. Recharge atmost of the periphery cells simulated subsurface inflowfrom the bedrock to layer 2, the principal aquifer.
Subsurface inflow was estimated to be generallysmall. It is larger where the valley fill is underlain bypermeable carbonate rock or faults that transmit waterin consolidated rock.
Initially, the simulated subsurface inflow was 48cubic feet per second distributed uniformly to the constant-flux cells. The inflow was kept relatively constantbut was redistributed until simulated water levels weresimilar to measured water levels in the aquifers. Thehydraulic conductivity of the cells at the periphery,which represent the thin valley fill and underlying consolidated rock, generally was kept to a value that produced a transmissivity of less than 200 feet squared perday. The two constant-flux cells located at PineviewReservoir simulated discharge from the ground-waterflow system to the south end of Pineview Reservoir.
The general-head-boundary feature of the model(McDonald and Harbaugh, 1984, p. 343-369) was usedto simulate variable leakage between the confined partof the principal aquifer and Pineview Reservoir. General-head-boundary cells were specified in layer 2 todelineate the area inundated by Pineview Reservoirduring each stress period. General-head-boundary cellswere added or removed during successive stress periods as the area inundated by Pineview Reservoirexpanded or contracted. Layer I was kept active in thearea not perennially inundated by Pineview Reservoir,but it did not account for much storage in the aquifer.
The top boundary of the model was the watertable surface in layer I, or layer 2 where layer 1 wasabsent; and the bottom boundary was a no-flow boundary (fig. 23) representing the Norwood Tuff in most ofthe valley underlying layer 2. Water-table conditionsexisted throughout layer 1 and in layer 2 where layer Iwas not simulated, except in the area that was perennially inundated by Pineview Reservoir. In the part of themodel where layer 1 was active, flow between the twolayers was controlled by a verticalleakance value thatsimulated the hydraulic characteristics of the confininglayer.
Streams
The North Fork Ogden River, Middle ForkOgden River, and South Fork Ogden River were simulated by river cells. Because of the substantial changesthat occur in flow of streams in Ogden Valley, the stageheight and distribution of active streams sometimeschange abruptly. Data used in the simulation todescribe these changes were based on field observations of streams throughout the valley.
In their upper reaches, an unsaturated zone separated many streams from the unconfined part of theprincipal aquifer. When the streambed was above thewater level in the aquifer, simulated leakage from theriver cell was directly proportional to the streambedconductance (McDonald and Harbaugh, 1984, p. 214).The use of river cells enabled a precise quantity of leakage to be allowed from those river cells, and leakagewas used as a calibration tool to adjust simulated waterlevels. The quantity of leakage was not varied if it hadbeen determined either by seepage runs made in February 1985 or by analysis of other previously collecteddata.
Canals and ditches that were not surrounded byirrigated fields also were simulated by river cells.
65

EXPlANATION
Active cell in layers 1 and 2
Inactive cell in layers 1 and 2
Active cell in layer 2,inactive cell in layer 1
Active cell in layer 2, inactivecell in layer 1 Pineview Reservoir
(-) Model boundary steady-state discharge
• Node representing observation well
W Model boundary steady-staterecharge - Approximate rechargerate, in cubic feet per second,multiplied by 10-1
LJ
•
R.1 E.
3 MILESI
2
I3 KILOMETERS
I2
oIo
41"15'-
111"52'30'
I
R.1W. R.1 E.
Base from U.S. Geological SurveyOgden, 1:100,000, 1976
Figure 24. Model grid, areal distribution of active cells, and boundary steady-state recharge and discharge for the modelof the ground-water system in Ogden Valley.
66

Recharge from canals and ditches was considered minimal when compared to recharge from irrigated fields.
Drains
Drain cells were used in the model to simulateoutflow from the aquifer to drains, but they did notallow flow from drains to the aquifer. Thus, the draincells also can be used to simulate streams that areperennially gaining as well as simulating irrigationdrains. Liberty Spring Creek and most of Spring Creekwere simulated by drain cells. Most ofthe flow ofthesecreeks originates from ground-water discharge withinOgden Valley. Drain cells also were used to simulateirrigation drains and small seeps that were near Pineview Reservoir in the low-lying areas, when the seepswere not inundated by the reservoir. The lower reachesof some irrigation ditches probably drain some groundwater during the irrigation season; however, theaffected reaches were not identified, and this drainagewas not incorporated into the model.
Wells
Nearly all of the ground water pumped in OgdenValley is from the Ogden well field located on thesouthern tip of the promontory between the North ForkOgden River and the Middle Fork Ogden River arms ofPineview Reservoir. The measured discharge for eachof the periods simulated by the model was used as therate for that water-budget period (table 10).
Discharge from wells for the three known community systems and all other known domestic and stockwells also was simulated, although the total withdrawalwas minimal compared to the withdrawal from theOgden well field. Withdrawals by the Nordic Valleysystem were measured; withdrawals by the Eden Hillsand Lakeview systems, in addition to the domestic andstock wells, were estimated by per capita and seasonaluse. All other community water systems and individualusers obtain their water from sources other than wells inthe valley-fill aquifer system, and their use was notincorporated into the model.
Evapotranspiration
Evapotranspiration was simulated throughout theuppermost active model layer, although the rate wasadjusted for several factors. The maximum possibleevapotranspiration rate was adjusted for the proportional density of mapped phreatophytes in each cell andthe proportional monthly consumptive use. An evapo-
transpiration rate of 3 feet per year was determined byG.E. Pyper (U.S. Geological Survey, written commun.,1986). The model program also adjusted the evapotranspiration rate according to the depth of the watertable below land surface. The rate was reduced by astraight-line proportion to an extinction depth of thewater table, which was specified as 30 feet below landsurface.
Areal Recharge
Recharge from precipitation was assumed tooccur in March and April from infiltration of snowmeltand from October into December before the first lastingsnowpack. A total of 33 percent of the precipitationduring each period was recharged to the ground-waterflow system. All precipitation bound up in snow accumulation from December into March was rechargedduring March and April. Precipitation was distributedthroughout the valley as shown by the U.S. WeatherBureau (1963) map of average annual distribution.
Recharge from irrigated fields was determined byseveral factors. The mapped irrigated acreage was usedto determine the proportional area of irrigated fields tothe total area that would be in each model cell. The rateof water recharging the ground-water-flow system wasdetermined by the delivery rate of surface water minusthe losses by evaporation, canals, and crop-consumptive use. These two factors were combined to determine an adjusted recharge rate from irrigated fieldsduring each period. The recharge rate varied from 30 to75 percent of the available surface-water supply.
Recharge from septic systems occurs throughoutthe valley. The only substantial recharge from septicsystems is at Huntsville. An average recharge rate of0.2 cubic foot per second from septic systems wasdivided among seven cells representing the Huntsvillearea.
Hydraulic Properties
The ground-water-flow system in Ogden Valleyis controlled partly by the hydraulic characteristics ofthe aquifers. The estimated values of these characteristics were included in the model data and adjusted during model calibration.
Hydraulic conductivity
A uniform hydraulic-conductivity value, thevalue determined from the aquifer test of the Ogdenwell field, was used initially for most of the cells in the
67

computer model. Modifications of the hydraulic-conductivity distribution were made during calibration.Hydraulic-conductivity values were adjusted concurrently with changes in the boundary recharge until thecalculated transmissivity values of the cells at theperiphery, which represent a veneer of slope-washdeposits and bedrock comprised of either NorwoodTuff or carbonate rocks, were less than 200 feet squaredper day.
Hydraulic-conductivity values were changed toadjust the rate that stresses were propagated through thesystem in order to generally match water-level altitudesat observation wells during steady-state simulation andto match water-level changes during the transient simulation. The resulting hydraulic-conductivity valuesfor layer 2 ranged from less than 1 foot per day in theareas around the margin of the valley to slightly greaterthan 300 feet per day in the area east of Huntsville (fig.25). The range of hydraulic-conductivity values forlayer 1 was less than 10 to 50 feet per day (fig. 26). Themodel simulation was relatively sensitive to differenthydraulic-conductivity distributions, particularly nearrecharge or discharge areas.
The hydraulic-conductivity values and the saturated thickness were used to calculate transmissivityvalues for the principal aquifer. On the basis of drillers'logs and a surface-water resistivity survey, the saturatedthickness of layer 1 (shallow unconfined aquifer) wasgenerally less than 90 feet. Saturated thickness of layer2 (principal aquifer) ranged from about 100 feet nearthe valley margins to about 700 feet in the area east ofHuntsville. Saturated thickness and hydraulic-conductivity values used in the model were initially extrapolated from only a few data points. During modelcalibration, these values were adjusted, within reasonable limits, to allow simulated heads to more closelymatch measured water levels. Transmissivity valuesranged from 20 to 230,000 feet squared per day. Thelargest transmissivity values were assigned to the areanorth of the South Fork Ogden River channel east ofHuntsville. Other areas of relatively large transmissivity values were beneath Pineview Reservoir and nearLiberty. The transmissivity values in the main valleyand near Liberty typically were equal to or greater than50,000 feet squared per day; however, the transmissivity values in the area near Eden that separates the Liberty area from the main valley typically were less than500 feet squared per day.
68
Storage coefficient
A constant storage-coefficient value of 1 x 10⁻⁴
was used during the calibration process for the areaswhere the principal aquifer was confined. A constantspecific-yield value of 0.10 was used for the areaswhere water-table conditions prevailed.
Vertical hydraulic conductivity
Vertical hydraulic-conductivity values are a measure of the ability of ground water to flow in a verticaldirection. The principal aquifer was separated from theshallow water-table aquifer by a leaky confining layer,and a vertical hydraulic-conductivity value wasassigned to each active cell in layer 1 to control theexchange of water between layer I and layer 2.
Data obtained from reservoir-bed seepage experiments enabled a vertical hydraulic-conductivity valueto be estimated for each of three seepage-measurementsites (pI. 2). Because the values differed slightly at eachof the sites, different values of vertical hydraulic conductivity were used for the three arms of Pineview Reservoir. The vertical hydraulic-conductivity values usedfor the transient simulation were 0.04 foot per day inthe North Fork Ogden River arm, 0.03 foot per day inthe Middle Fork Ogden River arm, and 0.01 foot perday in the South Fork Ogden River arm. These valuesare about three to four orders of magnitude less than thehorizontal hydraulic-conductivity values of the principal aquifer in the area. Each vertical conductivity valuewas divided by 70 ft [the average thickness of the confining layer according to Thomas (1945)] to determinethe model value "VCONT" (McDonald and Harbaugh,1984, p. 151), which allows for the simulation of verticalleakance of water through a confining layer.
Model simulation was fairly sensitive to differences in vertical hydraulic conductivity. A decrease invertical hydraulic-conductivity values caused anincrease in hydraulic head in layer 2, an increase in discharge to the river and drain reaches just upstream fromPineview Reservoir, and a decrease in discharge fromlayer 2 to the reservoir.
Initial Conditions
Actual pre-development steady-state conditionsare unknown. For the purposes of this investigation andcomputer simulation, it was assumed that the groundwater-flow system was in a steady-state condition during the low-flow period in mid- to late-February 1985.The water levels in the principal aquifer, the stage of

EXPlANATIONHydraulic conductivity,
in feet per day
c=J Ot05
11 Mlil! ,~ 5 to 50
• 50 to 100
fiftfjH 100 to 200
• Greater than 200
D Inactive cell
R.1 E.
3 MILESI
2I
\
I3 KILOMETERS
I2
oIo
111 0 52'30"
I
Base from U.S. Geological SurveyOgden, 1:100,000. 1976
R.1W.
Figure 25. Distribution of hydraulic-conductivity values for layer 2 (principal aquifer) of computer model for Ogden Valley.
69

EXPLANATIONHydraulic conductivity,
in feet per day
30 to 50
Inactive cell
10 to 15
o to 10
15 to 30•EfJ!JJ.:: .'" .::::::::
~
CJ
R.1 E.
2 3 MILESI
I3 KILOMETERS
I2
°I°
111"52'30"
I
R.1W.
Base from U.S. Geological SurveyOgden, 1:100,000, 1976
Figure 26. Distribution of hydraulic-conductivity values for layer 1 (shallow water-table aquifer) of computer model for Ogden Valley.
70

Pineview Reservoir, and the pumpage from the Ogdenwell field had been fairly steady for about a month (fig.22). The surface-water inflow to Ogden Valley alsowas steady during February 1985 (fig. 9). Flow in theSouth Fork Ogden River remained fairly stable forabout a month, although flow during February was substantially greater than that earlier in the winter.Wheeler Creek, a smaller, unregulated watershed,showed very little change in flow during the sameperiod.
This assumption of steady state may introducesome error into the simulated water-level changes for1985-86. The steady-state assumption was checked byrunning the transient-state model simulating uniformFebruary 1985 conditions for a 12-month period. Thissimulation indicated that simulated water levels continued to change slightly throughout the 12-month simulation, but that these changes are, for the most part,negligible (less than 1 foot). Users ofthe model shouldbe aware of the potential source of error when simulating periods of many years.
Model Calibration and Simulation
Simplifications and assumptions are needed toapproximate a complex three-dimensional flow systemusing a digital model. The discretization of hydraulicproperties over space and surface-water changes overtime attenuated changes in simulated water levels andflow rates that, in actuality, were large though shortlived. Errors resulting from lack of knowledge aboutthe flow system, discretization, and simplification ofthe hydraulics of the flow system for modeling can benoticed by comparing model-generated values ofwater-level altitude, water-level change, or flow ratewith measured values. Nevertheless, the model integrates the complex parts of the flow system and provides insight into the behavior of the system underobserved and hypothetical conditions.
Because of the interdependence of variablesinvolved in the ground-water-f1ow model, calibration isan iterative process whereby one hydraulic variable isrevised while holding the other variables constant.During calibration of the hydraulic properties, a stepby-step process was used to obtain acceptable values ofwater-level altitude, water-level change, and flow rate.
Steady-State Calibration
Distribution of recharge by subsurface inflowfrom the bedrock was the first adjustment made in the
model data. Next, flow rates to and from the majorstream channels were adjusted by iteratively adjustingthe streambed conductance values (McDonald and Harbaugh, 1984, p. 209-217) and the hydraulic conductivity of the underlying aquifer. Last, the water-levelaltitudes in observation wells were simulated to matchmeasured water-level altitudes to within one-half of thecontour interval from the 7.5-minute topographic mapsof the area near the well. These calibration criteria wereflexible in areas that had relatively large hydraulic gradients.
A steady-state calibration was obtained; but, during transient calibration, minor changes in hydraulicconductivity were made that caused changes in waterlevels or in discharge. The steady-state simulation wasrun each time a change in hydraulic properties wasmade while calibrating the transient simulation. Thiswas done in order to provide an initial potentiometricsurface that was in equilibrium with the hydraulic properties that were in place at the beginning of the transientsimulation. The steady-state simulation resulting fromthis iterative process is described in the following sections.
Water levels
Water levels in 72 observation wells measuredfrom mid-to late February 1985 (table 11) were used tocalibrate the steady-state model. The error, the difference between the measured and simulated water levels,ranged from -34 feet to 24 feet. The sum of the differences for all 72 water levels was 4 feet. The simulatedwater levels were lower than the measured or interpolated water levels in cells in the North Fork OgdenRiver drainage around Eden, in an area south of theMiddle Fork Ogden River, and in an area south of theupper reach of the South Fork Ogden River. The simulated water levels were higher than the measured orinterpolated water levels in cells in the area near Huntsville.
Gains and losses in streams and drains
Steady-state calibration was accomplished partlyby comparing the measured and computed gains instreamflow for which data were available. Flow dataeither were obtained from Browning (1925) or arelisted in table 3. The computed gains were within 50percent of the measured gains for nearly all the reaches.
A few reaches could not be simulated reasonablyby the model. The losses measured in the uppermost
71

72

Table 11. Water level in selected observation wells duringFebruary and June 1985 and May 1986-Continued
(A-7-1)35cdd-1 6.3 13.1(A-7-1 )36bdd-1 13.1 9.4 4.6(A-7-1)36dca-1 4.5 4.5(B-7-1)lbab-2 8.2 6.8 6.2(B-7-1)ldaa-1 22.2 21.9(B-7-1)ldda-1 70.9 69.5 69.8
Welllocation
Water level, in feet belowor above (-) land surface
February 19-28, June 3-1, May 21-31,1985 1985 1986
shallow depths to the water table in the recharge areas,the relatively large seasonal changes in water levels,and the lack of areally distributed historical data, a transient simulation period of about 1 year was chosen.The simulation represented hydrologic conditions fromFebruary 15, 1985, to January 31,1986. The 12 stressperiods represent intervals between water-level measurements, which were made about once a month atobservation wells. The climatic conditions during thesimulation period were near normal, although precipitation during the previous water year had been much inexcess of normal.
reaches of the North Fork Ogden River and the SouthFork Ogden River and the gains measured in the lowestreach ofthe North Fork Ogden River and at Liberty andBailey Springs southwest of Liberty were not accurately simulated because of the interaction of groundwater in the consolidated rock and the valley fill, whichwas not properly accounted for in the model. The simulated distribution of ground-water seepage to the individual channels of Spring Creek was inaccurate, but thetotal quantity of seepage to Spring Creek was closelysimulated.
Water budget
The steady-state water budget developed bymodel simulation (table 12) was reasonably similar tothe water budget developed by extrapolation of the collected data (table 10). Although simulated flow fromPineview Reservoir to the confined aquifer near theOgden well field was included in the simulated waterbudget, the calculated water budget did not include thiscomponent of recharge.
The steady-state water budget indicated thatabout 115 cubic feet per second of water is recharged toand discharged from the valley-fill aquifer system.Losing streams accounted for more than one-half of therecharge. Subsurface inflow from the consolidatedrocks accounted for most of the remaining recharge.The major components of discharge are gainingstreams, springs and drains, and Pineview Reservoir.The Ogden well field accounts for the remainder of thesimulated discharge during steady state.
Transient Simulation
Because of the small areal extent and relativelylarge transmissivity of the valley-fill aquifer system, the
Water-level changes in observation wells werethe only reliable data available with which to calibratethe transient simulation. Water levels in 101 observation wells were measured in June 1985 and compared tothe simulated water levels at that time. Monthly waterlevel measurements at 22 observation wells were usedduring each stress period to calibrate the transient simulation.
During the transient simulation period, surfacewater data that indicated seepage to streams were available only for Spring Creek. Data describing seepage toSpring Creek during the snowmelt and irrigation seasons could not be used to calibrate the transient modelbecause some of the flow in Spring Creek was derivedfrom sources other than ground-water seepage. Observations of the current conditions of the river channelswere made at the same time the observation-well measurements were made. These observations were used toqualitatively adjust the model for the transient simulation of the ephemeral streams.
In general, calibration of the transient simulationwas accomplished by adjusting the hydraulic-conductivity values of the underlying aquifer and the conductance of the streambed. Some adjustment of the riverstage, within reasonable limits, was made in order toadjust the ground-water recharge from streams or thedischarge to streams.
Water-level changes
Simulated water-level changes in cells that represent observation-well sites were compared to measuredwater-level changes in each observation well. The simulated and measured water-level changes for selectedwells are shown in figures 27 and 28. The simulatedwater-level changes were similar to the measuredwater-level changes.
73

Table 12. Simulated water budget for the valley-fill aquifer system, mid-February 1985 through January 1986
[Values are in cubic feet per second, except as indicated]
Winter 1985 Mid-February Mid-March Mid-April May(steady to mid-March to mid-April to May
state) (period 1) (period 2) (period 3) (period 4)
Simulated recharge
Precipitation and irrigation 0 16 119 0 76
Losing streams and irrigation distribution losses 67 80 116 142 123
Pineview Reservoir 2 2 3 12 6
Subsurface inflow 46 46 46 46 68
Total 115 144 284 200 273
Simulated discharge
Gaining streams 47 50 60 46 63
Springs and drains 28 29 39 35 42
Wells 15.1 14.5 15.5 18.5 14.2
Evapotranspiration 0 0 I 4 21
Pineview Reservoir 25 23 34 19 33
Total 115.1 116.5 149.5 122.5 173.2
Simulated change in storage, in acre-feet. (Negative values indicate decrease in storage.)
Periodic
Cumulative
1,600
1,600
9,800
11,400
2,500
13,900
7,900
21,800
An areal distribution of simulated water-levelchanges was compared to a map of measured waterlevel changes. The simulated water-level changesthrough stress period 4, mid-February through May1985, are shown in figure 29. Overall, these simulatedwater-level changes (fig. 29) compare favorably withthe measured water-level changes shown in figure 20.The measured water-level change map was developedfrom about 72 data points, and contours were interpolated where data were lacking. Some of the differencesbetween simulated and measured water-level changesmay result from interpolation of measured water-levelchanges where few data were available. In each of theobservation wells, the simulated water-level changegenerally was within 50 percent of the total measuredwater-level change during the period of the study.
Spring Creek drainage
Simulated discharge to the channels of SpringCreek from layer I is shown in table 13. The approximate measured discharge for the same periods (fig. 8)also is shown. Although the data sets were compared,they were not used in calibrations.
74
The simulated and measured discharge values aresimilar. The differences in values and trends may resultin part because the model does not simulate the storageof ground water in the confining layer.
Water budget
The water budget determined for the transientsimulation is shown in table 12. The comparison of thesimulated values and the independently determinedvalues is reasonably good. The areal recharge, subsurface inflow, discharge from wells, and subsurface outflow were entered directly into the model data set.Interchange between the aquifer and streams, drains,and Pineview Reservoir and discharge by evapotranspiration were computed by the model.
Several discrepancies between the simulated andindependently determined values can be used to yieldinformation on certain aspects of the hydrology of thevalley-fill aquifer system. More water probablyrecharges the aquifer system from the irrigation canalsand ditches (particularly during July and thereafter)than was recognized by the seepage measurements.
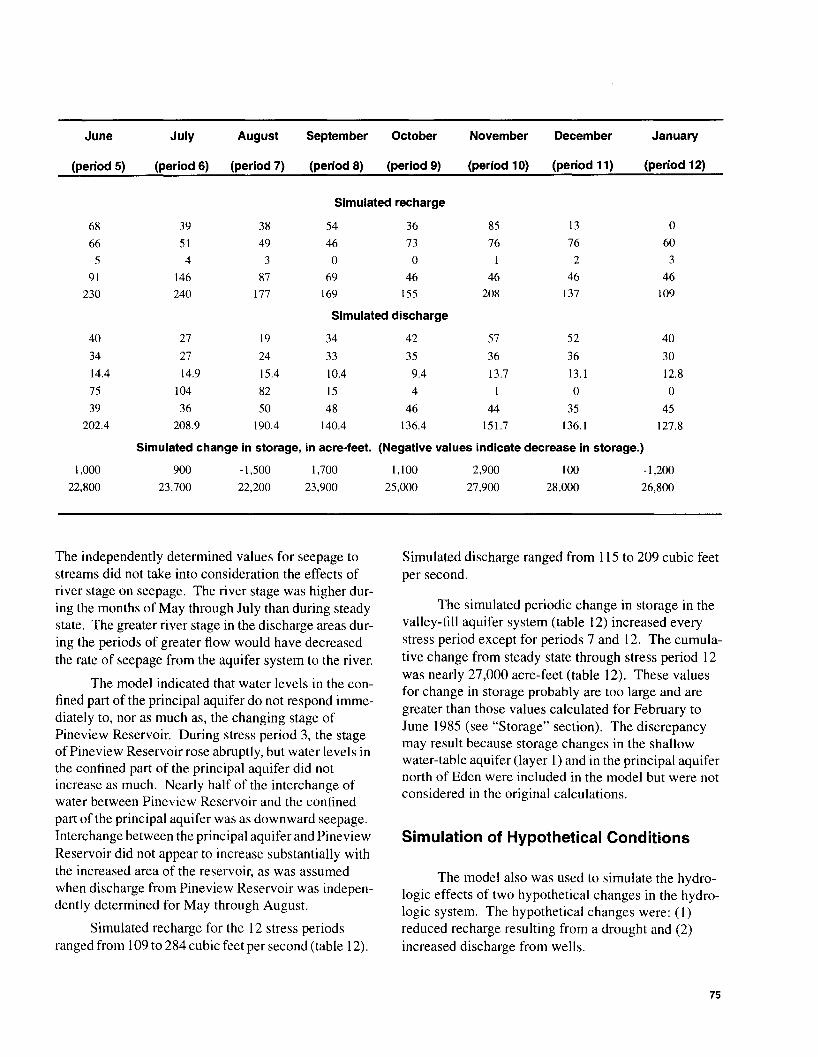
June July August September October November December January
(period 5) (period 6) (period 7) (period 8) (period 9) (period 10) (period 11) (period 12)
Simulated recharge
68 39 38 54 36 85 13 0
66 51 49 46 73 76 76 60
5 4 3 0 0 1 2 3
91 146 87 69 46 46 46 46
230 240 177 169 155 208 137 109
Simulated discharge
40 27 19 34 42 57 52 40
34 27 24 33 35 36 36 30
14.4 14.9 15.4 10.4 9.4 13.7 13.1 12.8
75 104 82 15 4 1 0 0
39 36 50 48 46 44 35 45
202.4 208.9 190.4 140.4 136.4 151.7 136.1 127.8
Simulated change in storage, in acre-feet. (Negative values indicate decrease in storage.)
1,000 900 -1,500 1,700 1,100 2,900 100 -1,200
22,800 23,700 22,200 23,900 25,000 27,900 28,000 26,800
The independently determined values for seepage tostreams did not take into consideration the effects ofriver stage on seepage. The river stage was higher during the months of May through July than during steadystate. The greater river stage in the discharge areas during the periods of greater flow would have decreasedthe rate of seepage from the aquifer system to the river.
The model indicated that water levels in the confined part of the principal aquifer do not respond immediately to, nor as much as, the changing stage ofPineview Reservoir. During stress period 3, the stageof Pineview Reservoir rose abruptly, but water levels inthe confined part of the principal aquifer did notincrease as much. Nearly half of the interchange ofwater between Pineview Reservoir and the confinedpart of the principal aquifer was as downward seepage.Interchange between the principal aquifer and PineviewReservoir did not appear to increase substantially withthe increased area of the reservoir, as was assumedwhen discharge from Pineview Reservoir was independently determined for May through August.
Simulated recharge for the 12 stress periodsranged from 109 to 284 cubicfeet per second (table 12).
Simulated discharge ranged from 115 to 209 cubic feetper second.
The simulated periodic change in storage in thevalley-fill aquifer system (table 12) increased everystress period except for periods 7 and 12. The cumulative change from steady state through stress period 12was nearly 27,000 acre-feet (table 12). These valuesfor change in storage probably are too large and aregreater than those values calculated for February toJune 1985 (see "Storage" section). The discrepancymay result because storage changes in the shallowwater-table aquifer (layer 1) and in the principal aquifernorth of Eden were included in the model but were notconsidered in the original calculations.
Simulation of Hypothetical Conditions
The model also was used to simulate the hydrologic effects of two hypothetical changes in the hydrologic system. The hypothetical changes were: (I)reduced recharge resulting from a drought and (2)increased discharge from wells.
75

JAN
1986
DEC
IMAY JUNE JULY AUG SEPT OCT NOV
1985APR
(A-7-1)21cad-1
..........A...4" '.. '.", ........ .
•••• •••••• Simulated. ..... \ .. ,..................
MAR
+10
-lW
+5>WI-w<!Jw--;lzwa:«Ll.WIZ
0I-:()-
~
-5
+10 r-T------,--,-----,,---,----,---r-----,----.---r-------,---,--,
oj 4 ........••.> WI- 0 ....~..-. '.w<!JW .--;lzw ."a: « Ll. ". Simulated _.' •• ' •wI Z ...... \ •••••
~ () - -10 (A.7-1 )8cad.1 ~ •••••••••••
-20 L....L__--'-_----J'---_--'-__.1--_---'-__--I.-_----J'---_--l....__-'---_--'-__--'----'
MAR APR MAY JUNE JULY AUG SEPT OCT NOV
1985
DEC
IJAN
1986
JAN1986
DEC
I
Simulated\ ...
..&-.- ..... -..,..'
'1'..
..........'.
·lL.'.
'"...............
'"
..............
MAY JUNE JULY AUG SEPT OCT NOV1985
APRMAR
+5
-lW>WI-w<!Jw--;lzw 0a:«Ll.WIZI-::()-
~
-5
Figure 27. Simulated and measured water-level change for three observation wells in the upper North ForkOgden River valley, 1985-86.
76

+20 r-r----.-------,-----.-------,-----.-------,--,-------.--,-------.----,--,
Measured
\....••••• Simulated ........
'. \ .. '... '" •• , .AI'"...........
..................' .....~....._-...... "'\'"
(A-6-2)15acb-1
+10
-10 L-.J...__--'---_----JL.-_--'--__-'--_--'-__--'---_----JL.-_--'--__-'--_--'-__--'-----'
MAR APR MAY JUNE JULY AUG SEPT OCT NOV
1985
DEC
IJAN
1986
+15
....J +10LlJ>LlJ-1-LlJ(9LlJ-,lZLlJ +51l:«Ll..LlJIZ1-;0-
~ 0
-5MAR APR MAY JUNE JULY AUG SEPT OCT NOV
1985DEC
IJAN
1986
JAN
1986
DEC
I
••••••• Simu\ed~ ~ _ ~ ...........
MAY JUNE JULY AUG SEPT OCT NOV
1985
APRMAR
+40
....J +30LlJ>WI- +20LlJC)LlJ-,lZLlJ .It.,.",...1l:«Ll..
+10LlJIZ .'1-;0- .:
~* ...... -
0(A-6-1)11cab-1
-10
Figure 28. Simulated and measured water-level change for three observation wells in the south part ofOgden Valley, 1985-86.
77

EXPlANATIONWater-level change, in feet
5 to 10
-5 to 5
10 to 15
Negative values indicate declines;Positive values indicate rises
15 to 20
Inactive cell
Greater than 20
••rIIlJIIlIj":::...:·0 ••••
::::::::.
•CJ
R.1 E.
3 MILESI
2
I3 KILOMETERS
I2
oIa
41°15'-
111°52'30'
I
R.1W.
Base from U.S. Geological SurveyOgden, 1:100,000,1976
Figure 29. Simulated water-level change in the principal aquifer, mid-February through May 1985.
78

Table 13. Simulated and measured discharge to Spring Creek
Stress period
I23456789
101112
Monthly period
Mid-February to mid-MarchMid-March to mid-AprilMid-April to May
May
JuneJulyAugustSeptemberOctoberNovemberDecemberJanuaryMean discharge
Simulated discharge(cubic feet per second)
10.815.415.521.4
16.610.79.0
11.112.312.612.412.013.3
Measured discharge(cubic feet per second)
II1712152016II87789
11.8
Drought
Ogden Valley has experienced several droughts,but little information is available on the hydrologiceffects of drought over a wide area of the valley. Therefore, computer simulation of a drought year, with conditions si milar to those during 1977, was made with thehydraulic properties used in the transient calibration.Fewer active river reaches in the recharge area, lowerriver stages, lower Pineview Reservoir stages, lessrecharge from bedrock, and lower rates of arealrecharge from precipitation and irrigation wereincluded in the model data based on probable conditions. Data collected in 1977 were used to help conceptualize the probable conditions.
The water budget and water levels for the 198586 simulation period were compared to the water budget and water levels of the simulated drought period toobserve water-level declines and storage changes.Water levels for the simulated drought period werelower than those for the 1985-86 simulation period anddid not show as much seasonal fluctuation (fig. 30).Water levels near Pineview Reservoir and in the SouthFork Ogden River drainage east of Huntsville showedthe greatest declines from 1985-86 levels. The greatestdeclines for the simulated drought occurred during thespring and early summer months.
Water budgets for the 1985-86 simulation periodand the simulated drought period showed some substantial differences. Overall storage losses during thesimulated drought occurred during stress periods 5through 7 (June-August). The most substantial storage
increases occurred during stress periods 2 (mid-Marchto mid-April) and 10 (November). Considerably lesswater was exchanged between the confined part of theprincipal aquifer and Pineview Reservoir during thesimulated drought period. Recharge from streamflowdiminished, most likely because fewer stream reacheswere active in the recharge areas, and the river stageswere not as high. During the simulated drought, totalrecharge varied from 113 to 204 cubic feet per second,and total discharge varied from 103 to 173 cubic feetper second.
Increased Discharge from Wells
Withdrawals from three additional wells, eachdischarging at a rate of I cubic foot per second, alsowere simulated. The simulated wells were locatednorthwest of Liberty, northwest of Eden, and east ofHuntsville. All three wells derived their water fromlayer 2; the Eden and Huntsville wells were in the confined part of the principal aquifer, and the Liberty wellwas in the unconfined part of the principal aquifer.
The simulation of additional discharge and theoriginal 1985-86 simulation were compared using thewater levels in observation wells, the storage changes,and the overall water budget. The water levels in observation wells did not change noticeably, indicating thatvery little of the additional water came from storage inthe aquifer. The rate of increase in storage in the aquifer declined by about I cubic foot per second duringstress periods 5 through 8, as indicated by the waterbudget.
79

JAN1986
DEC
I
1985-86
/
MAY JUNE JULY AUG SEPT OCT NOV1985
APRMAR
............ '. ..... 'lI!It... Drought.' ....... '. /," "',16.,
••••••• • •••• 4r ~
(A-6-1)11cab-1 ··-· ·A········ ...
+30
....J +20LU> LU"I-LU(!)LU-,lZLU +10a:«LLLUIZ1-:0-
~ 0
-10
JAN
1986
DEC
IMAY JUNE JULY AUG SEPT OCT NOV
1985
APRMAR
+-----4...... .......... Drought........ "., /
••••••6-. A.......... .' a
(A-6-2)15acb-1 _. 'A"" - .A·····
+20
....J +10LU>WI-LU(!)LU-,lZLU 0a:«LLLUIZ1-:0-
~ -10
-20
+10 r---------------------------------,
....JLU .> LU" I- 0 4---*"-' ...LU (!) LU ••••-,lZLU .......ffi ~ ~ 6- DroughtI-:()- -10 •••••• ..\. /~ . ·······.A ······.\
(A-7-1)7dba-1-20 L-L__---'-__L.-_-"-__-'--_---'-__---'-__L.-_-"-__-'-----_---'-__-'---'
MAR APR MAY JUNE JULY AUG SEPT OCT NOV
1985
DEC
IJAN
1986
Figure 30. Water·level change in wells in Ogden Valley for 1985-86 simulation and for drought simulation.
80

The two water budgets were compared for eachstress period even though the total quantity of change inthe water budget during each stress period could notexceed the total additional well discharge of 3 cubicfeet per second. Evapotranspiration was slightlyaffected. Reduced seepage to Pineview Reservoir during the later stress periods probably was caused bypumping of the simulated Eden well. Pumping of thesimulated Huntsville well appeared to divert water thatwould have discharged to Spring Creek and to drains inthe immediate area. Pumpage of the simulated Libertyand Eden wel1s caused reduced ground-water storageand reduced discharge to streams. The simulated Liberty well likely induces streamflow from the North ForkOgden River channel to recharge the aquifer; the simulated Eden well probably intercepts water that normallydischarges to the North Fork Ogden River channel.
NEED FOR FURTHER REFINEMENT OFTHE COMPUTER SIMULATION
The computer simulation presented in this reportaccomplished the purpose of estimating the probablerange in values and distribution of hydraulic propertiesand provided an estimate of the rates of the variousrecharge and discharge components of the aquifer system. The available data are not adequate to accuratelysimulate ground-water flow in the hydrologic systemover a lengthy period of time and for changing hydrologic conditions.
The ground-water-f1ow model could not accurately define the surface-water influence on the groundwater system. More data on surface-water conditionsare needed. Better definition of river and drain seepage,improved timing and location of dry reaches in the riverchannels, and a better definition of the distribution andrate of leakage to Pineview Reservoir are needed.
The observation-wel1 network established forthis study was adequate for the monthly observations ofmost substantial water-level changes but not for severalareas of probable large water-level changes. Therefore,additional observation wells are needed in many areas,such as near Liberty.
Subsurface inflow, probably one of the largestcontributors of recharge to the ground-water system,was not and probably cannot be measured. Better definition of the distribution of recharge, particularly theseasonal change in rate, is needed.
The discretization of streams into cells led toproblems with calibration using water levels in obser-
vation wells. In the model, some wells were in the samecell as a river reach. When the river reach went dry,water levels in wells from these river cells declinedmore than could be expected realistically. The use of amore detailed grid in a finite-difference model or afinite-element model probably would minimize thisproblem.
SUMMARY AND CONCLUSIONS
The area surrounding Ogden Val1ey is consolidated rock. The consolidated rocks that transmit andyield the most water in the area are the carbonate rocksand the Wasatch Formation. Infiltration of snowmelt,mostly on the widespread Wasatch Formation, is thepredominant source of recharge. Discharge from consolidated rocks is by streams, evapotranspiration,springs, subsurface outflow, and wells.
The unconsolidated valley-fill deposits in OgdenValley are more than 750 feet thick and comprise thevalley-fill aquifer system. The valley-fill aquifer system includes a principal aquifer with confined andunconfined parts and a shallow water-table aquifer thatoverlies the confined part of the principal aquifer and isseparated from it by a silty clay layer.
Ground-water movement in the valley-fill aquifersystem is from the area along the margins of the valleytoward Pineview Reservoir in the southern part of theval1ey. The vertical head gradients are downward in therecharge areas and upward in the discharge areas.Upward movement of water occurs from the confinedpart of the principal aquifer through the confining bedto Pineview Reservoir and Spring Creek.
A water budget for the valley-fill aquifer systemwas estimated for mid-February 1985 through January1986. Because of the substantial seasonal variation inhydrologic conditions resulting from climatic variations, the budget presented is unique for that timeperiod. In general, the water-budget indicates that themajority of recharge is from irrigation, losing streams,and subsurface inflow. Precipitation and irrigation distribution losses are relatively minor contributors torecharge. Discharge is to streams, springs, drains,wells, evapotranspiration, and Pineview Reservoir.
The range and distribution of hydraulic properties were clarified using a combination of field and laboratory data. An aquifer test completed for this studyindicated that a transmissivity value of about 79,000feet squared per day was the most representative valuefor the confined part of the principal aquifer. Hydrau-
81

lie-conductivity values from laboratory tests were less
than 0.013 foot per day for the confining layer. Vertical
hydraulic conductivity of the confining layer ranged
from 0.0 I to 0.04 foot per day according to reservoir
bed seepage measurements.
Water in the valley-fill aquifer system has a dis
solved-solids concentration that does not exceed 350
milligrams per liter, and most of the water is a calcium
bicarbonate type. The water is slightly more mineral
ized in the Middle Fork Ogden River and South Fork
Ogden River valleys. Relative to the general water
qual ity in the valley, nitrate, pH, and water temperature
were slightly anomalous in localized areas.
A three-dimensional, finite-difference computermodel was used to simulate ground-water flow in the
valley-fill aquifer system and thus, enable a better
understanding of the system. Two hypothetical changes
in the aquifer system, a I-year drought and withdrawals
from 3 additional wells, were simulated to estimate the
effects of these changes on streamflow and ground
water levels.
Drought conditions similar to those during 1977
were simulated to estimate the hydrologic effects of
drought on Ogden Valley. Water levels in the principal
aquifer were lower for the simulated drought period
than for the 1985-86 simulation period and did not
show as much seasonal fluctuation. Interchange of
water between the confined part of the principal aquifer
and Pineview Reservoir during the simulated drought
period was reduced.
Withdrawals from three additional wells also
were simulated, and water levels in observation wells
did not change noticeably, indicating very little addi
tional water came from storage. Reduced seepage to
Pineview Reservoir and reduced discharge to streams
also were noted.
In order to simulate ground-water flow for vary
ing hydrologic conditions, more data need to be col
lected on surface-water conditions. More wells are
needed in several areas in order to add control points for
water-level measurements. Additional observation
wells in the Liberty area, in particular, would provide
useful control data.
82
REFERENCES CITED
Avery, Charles, 1986, Bedrock aquifers of eastern SanJuan County, Utah: Utah Department of Natural Resources Technical Publication No. 86,114 p.
---1987, Chemistry of thermal-water and estimated reservoir temperatures in southeasternIdaho, north-central Utah, and southwesternWyoming: 1987 Wyoming Geological Association Guidebook, p. 347-353.
Browning, H.W., 1925, Report on a hydrographic survey of the Ogden River system during theirrigation season of 1925: Unpublished manuscript on file in offices of the U.S. GeologicalSurvey and the Utah State Engineer.
Bureau of the Census, 1982, 1980 Census of population, number of inhabitants, Utah: U.S.Department of Commerce, v. I, chap. A, pt. 46,30 p.
Crittenden, M.D., Jr., 1972, Geologic map of theBrowns Hole quadrangle, Weber County,Utah: U.S. Geological Survey Geologic Quadrangle Map 968, scale I :24,000, I sheet.
Crittenden, M.D., Jr., and Sorensen, M.C., 1985a, Geologic map of the Mantua quadrangle and part ofthe Willard quadrangle, Box Elder, Weber, andCache Counties, Utah: U.S. Geological SurveyMiscellaneous Investigations Series 1-1605,scale I :24,000, I sheet.
---I 985b, Geologic map of the North Ogden quadrangle and part of the Ogden and Plain Cityquadrangles, Box Elder and Weber Counties,Utah: U.S. Geological Survey MiscellaneousInvestigations Series 1-1606, scale I :24,000, Isheet.
Davis, FD., 1985, Geology of the northern WasatchFront: Utah Geological and Mineral SurveyMap 53-A, scale I: 100,000, 2 sheets.
Doyuran, Vedat, 1972, Geology and ground-waterresources of Ogden Valley, Utah: UnpublishedPh.D. thesis, University of Utah, 134 p.
Duthie, J .R., 1972, Detergent developments and theirimpact on water quality, in Allen, H.E., andKramer, J.R., eds., Nutrients in natural water:New York, John Wiley and Sons, Inc., 457 p.
Eardley, A.J., 1944, Geology of the north-centralWasatch Mountains, Utah: Geological Societyof America Bulletin, v. 55, p. 819-894.

Farnsworth, RK., Thompson, E.S., and Peck, E.L.,1982, Evaporation atlas for the contiguous 48United States: National Oceanic and Atmospheric Administration, National WeatherService Technical Report 33, 26 p.
Fenneman, N.M., 1931, Physiography of the westernUnited States: New York, McGraw-Hill,534 p.
Feth, J.H., Barker, D.A., Moore, L.G., Brown, R.I., andVeirs, C.E., 1966, Lake Bonneville: Geologyand hydrology of the Weber Delta District,including Ogden, Utah: U.S. Geological Survey Professional Paper 518, 76 p.
Fortier, Samuel, 1897, Preliminary report on seepagewater and the underflow of rivers: Utah Agricultural College Experimental Station Bulletin38,35 p.
Haws, F.W., Jeppson, RW., Huber, A.L., 1970, Hydrologic inventory of the Weber River study unit:Utah Water Research Laboratory Report PRWG40-6, Utah State University, 131 p.
Herbert, L.R, Croff, RW., Clark, D.W., and Avery,Charles, 1987, Seepage studies of the WeberRiver and the Davis-Weber and Ogden ValleyCanals, Davis and Weber Counties, Utah,1985: Utah Department of Natural ResourcesTechnical Publication No. 90, 53 p.
Lee, D.R, 1977, A device for measuring seepage fluxin lakes and estuaries: Limnology and Oceanography, v. 22, No.1, p. 140-147.
Leggette, RM., and Taylor, G.H., 1937, Geology andground-water resources of Ogden Valley,Utah: U.S. Geological Survey Water-SupplyPaper 796-D, p. D99-D161.
Lofgren, B.E., 1955, Resume of the Tertiary and Quaternary stratigraphy of Ogden Valley, Utah, inEardley, A.I., ed., Tertiary and Quaternarygeology of the eastern Bonneville Basin: UtahGeological Society Guidebook No. 10,p.70-84.
Lohman, S.W., 1972, Ground-water hydraulics: U.S.Geological Survey Professional Paper 708,70 p.
McDonald, M.G., and Harbaugh, A.W., 1984, A modular three-dimensional finite-differenceground-water flow model: U.S. GeologicalSurvey Open-File Report 83-875, 528 p.
Messer, U., Slezak, Lloyd, and Liff, c.1., 1982, Potential for acid snowmelt in the WasatchMountains: Water Quality Series UWRLlQ82/06, Utah Water Research Laboratory, UtahState University, 37 p.
Mullens, T.E., 1969, Geologic map ofthe Causey DamQuadrangle, Weber County, Utah: U.S. Geological Survey Geologic Quadrangle Map 790,scale 1:24,000, 1 sheet.
Sorensen, M.e., and Crittenden, M.D., Jr., 1979, Geologic map of the Huntsville quadrangle, WeberCounty, Utah: U.S. Geological Survey Geologic Quadrangle Map 1503, scale 1:24,000, 1sheet.
Stewart, S.W., 1958, Gravity survey of Ogden Valleyin the Wasatch Mountains, north-central Utah:Transactions of the American GeophysicalUnion, v. 39, No.6, p. 1151-1157.
Stiff, H.A., Jr., 1951, The interpretation of chemicalwater analysis by means of patterns: Journal ofPetroleum Technology, v. 3, No. 10, p. 15-17.
Stokes, W.L., ed., 1963, Geologic map of Utah: University of Utah, scale 1:250,000, 4 sheets.
Thomas, RE., 1945, The Ogden Valley artesian reservoir, Weber County, Utah: Utah Departmentof Natural Resources Technical PublicationNo.2, 37 p.
---1952, Ogden Valley, Weber County, in Thomas, H.E., Nelson, W.B., Lofgren, B.E. andButler, RG., eds., Status of development ofselected ground-water basins in Utah: UtahDepartment of Natural Resources TechnicalPublication No.7, p. 88-96.
---1963, A water budget for the artesian aquifer inOgden Valley, Weber County, Utah, in Bentall, Ray, compiler, Methods of collecting andinterpreting ground-water data: U.S. Geological Survey Water-Supply Paper 1544-H, p.H63-H97.
Thompson, K.R., 1983, Reconnaissance of the qualityof surface water in the Weber River basin,Utah: Utah Department of Natural ResourcesTechnical Publication No. 76, 74 p.
U.S. Environmental Protection Agency, 1986, Qualitycriteria for water 1986: Office of Water, Regulations and Standards, U.S. EnvironmentalProtection Agency.
83

u.s. National Oceanic and Atmospheric Administration, 1982, Monthly normals of temperature,precipitation, and heating and cooling degreedays 1951-80, Utah: U.S. National Oceanicand Atmospheric Administration Climatography of the United States No. 81 (Utah), 14 p.
U.S. Weather Bureau, 1963, Normal annual and MaySeptember precipitation (1931-60) for the Stateof Utah: Map of Utah, scale 1:500,000, 1sheet.
84

~~~It!~UTAH
The Utah Department of Natural Resources receives federal aid and prohibits discrimination on the basis of race,color, sex, age, national origin or disability. For informationor complaints regarding discrimination, contact the ExecutiveDirector, Utah Department of Natural Resources, 1636 WestNorth Temple '316, Salt Lake City, UT 84116·3193 or Officeof Equal Opportunity, US Department of the Interior, Wash-ington, DC 20240. 300 12/94
'0 Printed with vegetable oil ink.


Related Documents


![[hydrology] groundwater hydrology - david k. todd (2005).pdf](https://static.cupdf.com/doc/110x72/577c77961a28abe0548cb0b1/hydrology-groundwater-hydrology-david-k-todd-2005pdf.jpg)