Groundwater Flow and Contaminant Transport Modeling of A Fractured Bedrock Aquifer with Solution Channels at a Southeastern Pennsylvania Superfund Site Henry Y. He Environmental Resources Management Andrew H. Thalheimer, P.E. Environmental Resources Management Abstract As part of the remedial investigation for a southeastern Pennsylvania Superfund site, a large-scale regional groundwater flow model and a contaminant transport model were developed to understand the complex fractured bedrock flow dynamics in a limestone and dolomite valley. The model was subsequently used during the Feasibility Study to evaluate alternatives and verify the acceptability of the United States Environmental Protection Agency’s Proposed Remedy. The modeling incorporates the anisotropic characteristics of the fractured bedrock flow, heterogeneous transmissivity areas of various geological regions, and large-scale pumping by nearby quarries and public water supplies. The model predicts that the lithium-impacted groundwater at the facility drains into a deep, southerly-dipping geological fault acting like a solution channel that flows east along the northern edge of the property and discharges to a surface stream approximately 1.5 miles away from the site. Residential wells and a public water supply well drew water from this solution channel prior to its discharge into a high-quality trout fishing stream that ultimately flows through a national park. The model-predicted exit location of the solution channel and effluent concentrations were consistent with field observations and testing that were conducted by an independent party. The models were applied to simulate groundwater flow dynamics and constituent distributions under various remedial alternatives, including pump and treat, capping, barrier wall, pumping and reinjection, and excavation. Ultimately, the model was instrumental in identifying a cost-effective remedial solution for the site. INTRODUCTION The former Cyprus Foote Mineral Facility (Facility), located in Chester County, Pennsylvania, is a closed facility that was used for the production of lithium chemicals and the processing of a variety of mineral ores. The facility was built adjacent to two abandoned dolomite/limestone quarries; i.e., the North and South Quarries. Most of the process wastes was placed into the South Quarry. The Facility is situated within the Chester Valley, a carbonate formation that runs east-west and is flanked by elevated igneous rock to the north and schist rock to the south. The valley is well known for its solution channel flow conditions that add more complexity to the complicated fractured bedrock flow conditions. Prior to modeling, the Remedial Investigation (RI) and existing monitoring well network had identified several areas that were impacted by, among other constituents of concern (COCs), lithium. The investigation also identified that groundwater at the Facility flows into a linear fractured bedrock fault zone, similar to a solution channel, which is oriented east-west along the northern property boundary. Since the Facility is situated near an apparent watershed divide of the East and West Valley Creeks, it was not clear where the COCs impacted water might migrate after entering the fault zone. At this stage of the project, groundwater modeling started to be applied. During the course of the remedial investigation (RI) and subsequent feasibility studies, various modeling efforts were conducted to help the project team understand the complex hydrogeologic situations and develop cost-effective remedial alternatives. 895

Welcome message from author
This document is posted to help you gain knowledge. Please leave a comment to let me know what you think about it! Share it to your friends and learn new things together.
Transcript

Groundwater Flow and Contaminant Transport Modeling of A Fractured Bedrock Aquifer with Solution Channels at a Southeastern Pennsylvania Superfund Site
Henry Y. He
Environmental Resources Management
Andrew H. Thalheimer, P.E. Environmental Resources Management
Abstract As part of the remedial investigation for a southeastern Pennsylvania Superfund site, a large-scale regional groundwater flow model and a contaminant transport model were developed to understand the complex fractured bedrock flow dynamics in a limestone and dolomite valley. The model was subsequently used during the Feasibility Study to evaluate alternatives and verify the acceptability of the United States Environmental Protection Agency’s Proposed Remedy. The modeling incorporates the anisotropic characteristics of the fractured bedrock flow, heterogeneous transmissivity areas of various geological regions, and large-scale pumping by nearby quarries and public water supplies. The model predicts that the lithium-impacted groundwater at the facility drains into a deep, southerly-dipping geological fault acting like a solution channel that flows east along the northern edge of the property and discharges to a surface stream approximately 1.5 miles away from the site. Residential wells and a public water supply well drew water from this solution channel prior to its discharge into a high-quality trout fishing stream that ultimately flows through a national park. The model-predicted exit location of the solution channel and effluent concentrations were consistent with field observations and testing that were conducted by an independent party. The models were applied to simulate groundwater flow dynamics and constituent distributions under various remedial alternatives, including pump and treat, capping, barrier wall, pumping and reinjection, and excavation. Ultimately, the model was instrumental in identifying a cost-effective remedial solution for the site. INTRODUCTION The former Cyprus Foote Mineral Facility (Facility), located in Chester County, Pennsylvania, is a closed facility that was used for the production of lithium chemicals and the processing of a variety of mineral ores. The facility was built adjacent to two abandoned dolomite/limestone quarries; i.e., the North and South Quarries. Most of the process wastes was placed into the South Quarry. The Facility is situated within the Chester Valley, a carbonate formation that runs east-west and is flanked by elevated igneous rock to the north and schist rock to the south. The valley is well known for its solution channel flow conditions that add more complexity to the complicated fractured bedrock flow conditions. Prior to modeling, the Remedial Investigation (RI) and existing monitoring well network had identified several areas that were impacted by, among other constituents of concern (COCs), lithium. The investigation also identified that groundwater at the Facility flows into a linear fractured bedrock fault zone, similar to a solution channel, which is oriented east-west along the northern property boundary. Since the Facility is situated near an apparent watershed divide of the East and West Valley Creeks, it was not clear where the COCs impacted water might migrate after entering the fault zone. At this stage of the project, groundwater modeling started to be applied. During the course of the remedial investigation (RI) and subsequent feasibility studies, various modeling efforts were conducted to help the project team understand the complex hydrogeologic situations and develop cost-effective remedial alternatives.
895

The main objectives of the groundwater modeling efforts are to:
• identify groundwater flow patterns on- and off-site under current conditions; • assess the current on- and off-site lithium concentration and distribution;
• evaluate future groundwater flow patterns under various remedial scenarios; and • estimate future on- and off-facility lithium concentrations and distribution, following implementation
of the various remedial alternatives. MODELING APPROACH In order to test various solution channel scenarios, a large-scale regional groundwater flow model was necessary. The outer boundaries of the regional model were several watersheds away from the areas of concern. Imperfections along the outer model boundary are offset by data provided by other stream segments over the extended distance and have little impact on the facility area. The regional model provides more realistic conditions along the boundary of any local-scale model developed within the regional model and, therefore, is able to provide more reliable results than small models developed solely for the site area. This is because the regional model creates a reliable framework to test various solution channel scenarios without being affected by the errors inherent in the arbitrary assignment of boundary conditions to a strictly site-area model. The regional model, taking advantage of the regional water balance, establishes a unique relationship between the regional infiltration rate and the regional aquifer transmissivities. Aquifer tests normally yield transmissivity values in a wide range (often over several orders of magnitudes) in the fractured bedrock environment. Effective remedial measure evaluation requires an aquifer transmissivity accuracy far greater than that provide by traditional aquifer tests. The infiltration contributes to the baseflow portion of the surface stream flows that are measured by the United States Geological Survey (USGS) and can be estimated reliably. A regional model based on reliable infiltration rates is, therefore, inherently more reliable than a site-area model that relies on aquifer transmissivity values, which are unreliable in the fractured bedrock environment. This modeling was based on concepts that were developed by simplifying the observed geological and hydrogeological conditions. As the project evolved, the model was revised as appropriate to address site-specific criteria. GROUNDWATER FLOW MODEL Conceptual Model The first step in developing the groundwater flow model was the development of a conceptual model of the hydrogeologic system in the vicinity of the Facility using regional and site-specific geologic, hydrogeologic, and climatic information as derived from the RI. The conceptual regional groundwater flow model was developed as a two-dimensional groundwater flow system with a uniform regional infiltration and regions of different and anisotropic aquifer transmissivities. The aquifer water levels are controlled and constrained by surrounding surface water bodies connected with the aquifer, by the solution channel within the fault zone, and by regional pumping. Model Selection The size of the regional model is approximately 500 times greater than the facility area. In order to cover such an extensive area and retain high resolution in the vicinity of the Facility, the analytic element model (AEM)
896

was used. The AEM theory was developed by O. Strack (1989). For many applications, the AEM model is more accurate and efficient than traditional numerical models of finite-difference or finite-element models. AEM can provide unlimited resolution over infinitely large flow domains, while simulating complex hydrogeological features, such as areas of heterogeneity in hydraulic conductivity and/or aquifer thickness, porosity, multi-layers or stratifications, and confined/unconfined or transitional aquifers. Application of the finite-element or finite-element models in regional-scale modeling would forfeit the ability to render high-resolution outputs within the local area. AEM models with high resolution provide much more accurate results than conventional numerical models in large-hydraulic-stress situations that are a part of common remedial systems such as pumping, injection, trench, slurry wall and low permeability barriers. For this effort, the computer groundwater flow model TWODAN (Fitts, 1997) (a commercially available AEM ground water model) was used. Model Setup and Calibration The entire regional model covers an approximate 55,000- by 30,000-foot area with the Facility, located in the center of the modeled area. The total size of the Facility is actually only 0.2% of the modeled area. Regional hydrogeologic data such as stream locations, geologic boundaries, and infiltration rate for the model were collected from various USGS, Pennsylvania Department Environmental Protection (PADEP), and other local reports. The model was also developed based on findings and data derived from the RI for the Facility. These data were compiled, digitized, and transformed into a consistent format and geographic system. The groundwater flow model included the following analytic elements:
• Surface streams, with connections to the aquifer that serve as groundwater discharge or recharge areas (and therefore natural boundaries), were simulated by the model’s constant-head linesinks. The locations of these streams were obtained from USGS quadrangle maps;
• The model’s heterogeneity feature was applied to simulate the regions or areas with various aquifer
transmissivities. The locations of these geological areas were derived from the Geologic Quadrangle Map of Pennsylvania (Socolow, 1978);
• Existing and potential withdrawals from remedial recovery wells; Cedar Hollow and Catanach
Quarries; and public water supply wells were simulated as discharge-specified wells in the model. Other wells present beyond the immediate vicinity of the Facility (southwest and upgradient) were not included because of their small groundwater withdrawals relative to the other withdrawals considered;
• Regional infiltration was simulated by the model's uniform infiltration feature. A long-term regional
average annual infiltration rate of 10 inches per year was derived from USGS data (Durlin, 1999); and
• Local infiltration from the North and South Quarries at the Facility was simulated by the model’s recharge feature.
The constructed model was calibrated using deep water level data collected on 9 January 1999. Pre-set model calibration criteria, based on the residual (difference) between observed and modeled water levels, were:
• The average of the residuals should be less that 2% of observed water level variations; and • The standard deviation of the residuals should be less than 10% of observed water level variations.
During the course of the model calibration, various solution channel scenarios were tested. Among them, the hypothesis that the geologic fault identified by the USGS (Socolow, 1978) acts as a solution channel was best supported by the observed data. Conceptually, the fault zone between the Chickies and Ledger Formations provides an easier path for groundwater to escape to the nearby stream and allowed major solution channels or planes to be developed along this fault line. The precise fault line location and the water levels along the fault
897

line were developed in the model calibration process so that the modeled water levels correlated very closely with the observed water levels. The model-calibrated fault line location is presented in Figure 1. The modeled average of the residuals was 0.01 feet, which equals 0.08% of the natural water level variation of 18 feet at the Facility and satisfies the 2% criterion set above. The standard deviation of the residuals was 1.08 feet, which is 6.01% of the natural water level variation, as compared to the 10% criterion set above. The constructed model surpassed the predetermined calibration criteria and was appropriate for further simulations. In addition, the model was calibrated with the regional water level data collected by USGS (Sloto, 1984). The model was developed on a transformed domain in order to compensate for anisotropic aquifer transmissivities of the fractured bedrock formations as described by Strack (1989). The normal flow domain was transformed by reducing the dimension along the principal anisotropy direction by the square route of the anisotropy ratio. Groundwater flow became isotropic on the transformed flow domain. Model input and calibration parameters are presented in Table 1. Model input parameters described here and in the table are referenced in the transformed modeling domain. LITHIUM TRANSPORT MODELING The lithium transport model was developed to simulate groundwater lithium concentrations and distributions under current and future conditions. The model approximated future conditions under various proposed remedial scenarios, and estimated cleanup times required for groundwater to reach the groundwater cleanup goals. Lithium is currently present primarily in fill within the South Quarry and in select areas of concern in the plant area. Due to consistent long-term annual infiltration rates (that directly affect the amount of lithium that dissolves into ground water), the solubility of lithium, and the mass of lithium in the source areas (which have been in the South Quarry and the other Administrative Order of Consent areas for many years), the lithium plumes at the Facility were expected, and shown through observed data, to have reached steady state. Thus, the long-term plume extent and concentration should no longer increase with time. These steady-state lithium concentrations were used to calculate the lithium source loading in the model. The lithium transport model for the Facility was constructed using the solute transport model WinTran (J. Rumbaugh, 1995). The flow portion of WinTran is based on the AEM theory, similar to that used in TWODAN; the transport portion of the model is a classic finite-element model. The WinTran model simulates the typical contaminant transport mechanisms, such as advection, dispersion, retardation, diffusion, dilution, and degradation. Coupled with the AEM’s infinitely fine resolution, WinTran can generate (via floating grids) much more refined solutions for simulations of remedial systems that demand more local-scale outputs. The transport models were developed based on the groundwater flow model described in the previous section. Groundwater flow modeling input and calibration parameters were retained in the transport modeling. The transport models were set up to simulate the entire lithium plume transport period, starting approximately 5 decades ago until 1997, when analytical data were collected during the RI. The model was calibrated using the lithium plume distribution from the RI data. The model calibration processes adjusted the source mass loading in the model until the modeled downgradient area concentrations matched the observed concentrations. The input and calibration parameters for the lithium transport model are also presented in Table 1. The simulated current lithium distribution in groundwater is presented in Figure 2.
898
MODEL SIMULATIONS The groundwater flow and lithium transport models were used to simulate groundwater flow patterns under various proposed remedial alternatives. Current Groundwater Flow Conditions Figure 1 presents the modeled groundwater contours under current conditions. The figure-depicted area is only 6% of the entire regional model coverage. Modeling indicates that groundwater generally flows from the elevated northern and southern banks of the Chester Valley to the East and West Valley Creeks at the center of the valley under natural conditions. Pumping from the Cedar Hollow and Catanach Quarries, located over three miles northeast of the Facility, has a significant impact on regional groundwater flow patterns but does not exert influence on the groundwater flow conditions at the Facility. The Facility is located far enough for the quarries’ pumping impact to be negligible. Modeling indicates that the fault zone along the northern boundary of the Facility functions as an underground upgradient extension of the East Valley Creek. The fault zone receives groundwater discharge from both sides of the fault line. The water within the fault zone flows eastwards, and eventually discharges to the East Valley Creek. The flow rate along the fault zone increases gradually eastwards as accumulating groundwater discharges along the fault line. The groundwater flow model is able to calculate the flow rate within the fault zone at any location along the fault line. Modeling concluded that the fault zone functions as a gaining stream under natural conditions. There are, however, several wells pumping along the fault line. Pumping can cause the fault zone to lose water to these wells. The largest pumping by far is from a water supply well located approximately one mile east of the Facility. Figure 1 presents groundwater flow lines to this water supply well. This well has been historically impacted with lithium. The modeling indicates that this well receives a considerable portion of water from the fault zone area and thus has intercepted groundwater, impacted with lithium, from the Facility. Other nearby residential wells may also pull water and its associated lithium from the fault zone. The modeling indicates that groundwater at the Facility flows north and discharges directly to the fault zone along the northern boundary of the Facility. The long-term average flows of water into the fault zone from the Facility are approximately 280 gallons per minute (gpm), based on the model’s calculation. The average groundwater travel time from the southern boundary to the fault zone is approximately seven years. The South Quarry at the Facility is a man-made depression area that collects storm water runoff from the nearby property as well as precipitation within the quarry. This quarry occasionally has a standing water condition that is perched by the fill material within the quarry. This perched water joins with the underlying bedrock aquifer groundwater and eventually discharges to the fault zone north of the quarry. Lithium Distribution in Groundwater The constructed lithium transport model was used to simulate temporal lithium concentration trends at various locations and lithium distribution at various past and future times. This transport model simulated lithium concentrations in the area between the lithium sources and the fault line near the Facility, and to calculate the lithium mass loading to the fault zone. The lithium concentrations in the fault zone were calculated as described in a following section. Figure 2 presents the modeled lithium distribution in groundwater under steady state. The modeling results match the observed lithium concentration distribution developed from the RI data. The model-calculated total lithium mass loading to the aquifer at the Facility is approximately 28 pounds per day. Consistent with previous observations and conclusions in the RI data, 93% of this mass loading is contributed by the South Quarry and the former Building No. 17 Pads Storage Area. Other lithium source areas include the Former Solvent Burn Area and Chromite Storage Area, which contribute less than 7% of the overall lithium mass loading to the fault zone.
899

Fault Zone Lithium Concentrations along Fault Line The lithium concentrations in the fault zone were calculated based on both the regional groundwater flow model and the facility lithium transport model. The groundwater flow model generates the fault-zone flow rates along the fault line; the transport model calculates the total amount of lithium mass contributed to the fault zone. The fault-zone lithium concentration at a given point along the fault line is the accumulated upstream mass loading of lithium divided by the accumulated discharge from upstream. The calculated lithium concentrations at select downgradient locations along the fault line are presented in Figure 3. The model indicates that the current highest lithium concentration along the fault line is approximately 4,000 micrograms per liter (ug/l). The modeled fault line ends approximately 8,000 feet east from the facility boundary. At the end of the fault line, water and lithium within the fault zone seep out and discharge to a segment of East Valley Creek. The model-predicted lithium concentration at the exit of the fault line is approximately 2,000 ug/l. Simulations of Remedial Scenarios The groundwater flow and lithium transport models were used to simulate the groundwater flow and lithium distributions at future times under various proposed remedial scenarios for the purpose of evaluating the effectiveness of the proposed remedy and estimate the groundwater cleanup times. The effect on groundwater flow and lithium concentration of seven different remedial alternatives were simulated using the models, including and/ or combining:
• capping of the South Quarry, • waste consolidation,
• barrier wall around the South Quarry,
• recovery wells,
• injection wells, and
• excavation.
Because of the high resolution of the AEM model (i.e., high-resolution images of groundwater flow and the lithium distribution associated with the proposed remedial components can be examined in great detail), the project team was able to develop a cost-effective remedial solution. Based in part on the modeling evaluation of each potential remedial alternative, the United States Environmental Protection Agency (USEPA) identified and recommended a proposed remedy in 2003 that consists of affected soil consolidation and capping of the quarries. The proposed remedy will address elevated lithium levels in ground water in a period of approximately 13 years. MODEL VERIFICATION Following the development of the ground water flow and lithium transport models (in early 2000), USEPA requested the project team to incorporate previous surface water data from East Valley Creek in the model. On March 14, 2000, USEPA forwarded a PADEP letter (Schubert, 1998) that indicated that, while collecting surface stream quality data in 1998, PADEP discovered two seeps along the stream bank of the East Valley Creek: one on the south side and one on north side of the creek. The letter included a hand-sketched map (Figure 4) of the seep locations. Figure 4 indicates that these two seeps are located within proximity of the modeled fault line discharge zone to the East Valley Creek. The sample analysis results indicate that water from the Seep 1 on the facility side of the stream bank had 1,880 ug/l of lithium. The observed lithium
900

concentration at Seep 2, on the opposite side of the stream bank, is 1,220 ug/l and is considered to be partially diluted by the fault zone discharge from the watershed on the opposite side of the stream. This information indicates that the observed seeps are located within the modeled fault discharge area to the East Valley Creek. Figure 4 presents the modeled fault zone line overlapped with the hand-sketched map by PADEP. The distances of these seeps are less than 40 feet from the modeled fault line, less than 0.5% of the distance from the Facility, at over 8,000 feet away. The observed lithium concentration of 1,880 ug/l at Seep 1 on the Facility side is remarkably similar to the model predicted value of 1,999 ug/l, despite the general perception that modeling can provide only orders-of-magnitude answers, especially in a fracture bedrock environment. PADEP’s coincident stream sampling trip confirmed that the lithium has traveled through the fault line and discharged into the East Valley Creek. The observed fault zone exit location and exit concentration of lithium are close to the model’s predictions. CONCLUSIONS The modeling for this project concluded that the lithium plumes at the Facility travel north, enter into a fault zone along the northern property border, and then travel east along the fault line to discharge into a segment of the East Valley Creek approximately 8,000 feet east of the Facility. The lithium plumes are at steady state. The highest lithium concentration along the fault line is approximately 4,000 ug/l. The lithium concentration at the fault line exit to the East Valley Creek is approximately 2,000 ug/l. These conclusions were verified by independent field observation and testing. This project demonstrated that regional groundwater flow modeling using analytic element models in fractured bedrock environments were a key supplement to the existing facility investigation, contributing a good understanding of complex groundwater flow and contaminant transport dynamics and producing more reliable results than those obtainable using traditional investigation methods or conventional modeling technologies along. In addition, the model was very useful in evaluating the effects of various remedial measures on groundwater flow and lithium transport. REFERENCES Durlin, R.R. and W.P. Schaffstall, 1999, Water Resources Data, Pennsylvania, Water Year 1998: USGS Water-Data Report PA-98-1, Vol.
1, Delaware River Basin. Fitts, C.R., 1997, TWODAN User’s Manual: Version 5. Freeze, R.A. and J.A. Cherry, 1979, Groundwater: Prentice-Hall, Inc., Englewood Cliffs, New Jersey. Rumbaugh, J., 1995, Guide to Using WinTran. Schubert, S., 1998, Letter to Dr. Alex Presley. Sloto, R.A., 1984, Water-table contour map of the carbonate rocks of eastern Chester County, Pennsylvania: U.S. Geological Survey
Open File Report 84-235. Sloto, R.A., 1990, Geohydrology and simulation of ground-water flow in the carbonate rocks of the Valley Creek basin, eastern Chester
County, Pennsylvania: U.S. Geological Survey Water Resources Investigations Report 89-4169, 60p. Socolow, A.A., 1978, Geologic Quadrangle Maps of Pennsylvania, Malvern: Commonwealth of Pennsylvania Department of
Environmental Resources. Strack, O.D., 1989, Groundwater Mechanics: Prentice-Hall, Inc., Englewood Cliffs, New Jersey.
901
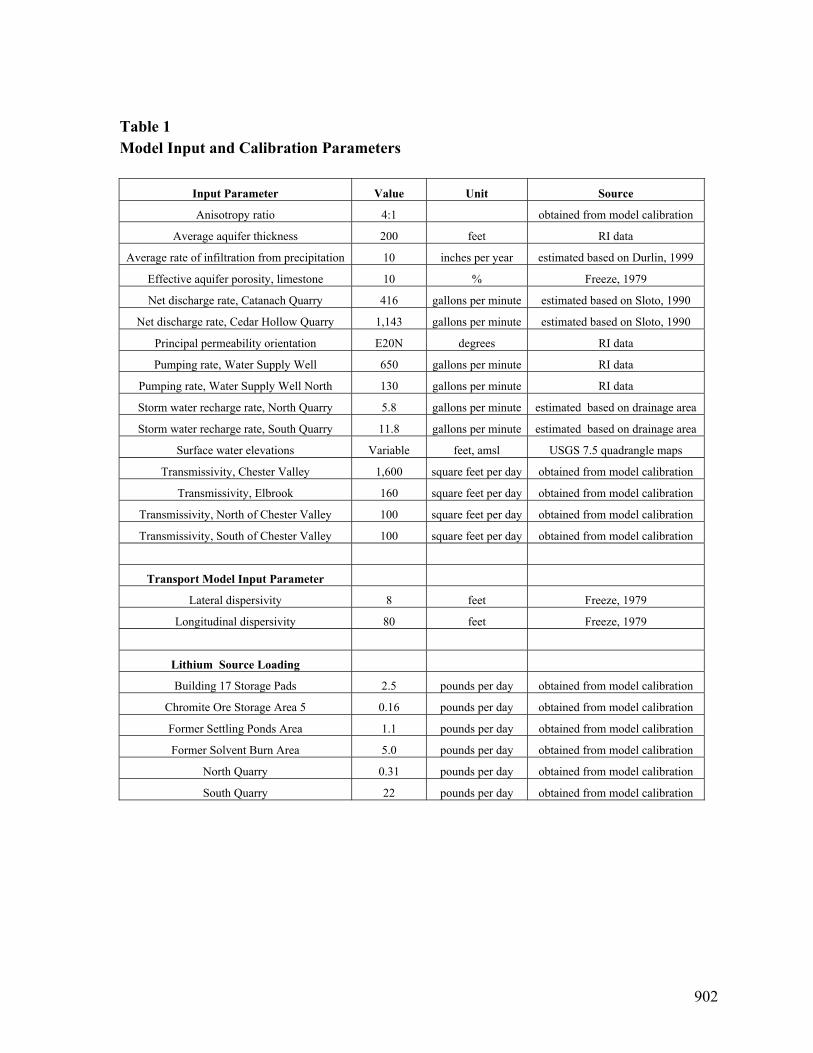
Table 1 Model Input and Calibration Parameters
Input Parameter Value Unit Source Anisotropy ratio 4:1 obtained from model calibration
Average aquifer thickness 200 feet RI data Average rate of infiltration from precipitation 10 inches per year estimated based on Durlin, 1999
Effective aquifer porosity, limestone 10 % Freeze, 1979 Net discharge rate, Catanach Quarry 416 gallons per minute estimated based on Sloto, 1990
Net discharge rate, Cedar Hollow Quarry 1,143 gallons per minute estimated based on Sloto, 1990 Principal permeability orientation E20N degrees RI data Pumping rate, Water Supply Well 650 gallons per minute RI data
Pumping rate, Water Supply Well North 130 gallons per minute RI data Storm water recharge rate, North Quarry 5.8 gallons per minute estimated based on drainage area Storm water recharge rate, South Quarry 11.8 gallons per minute estimated based on drainage area
Surface water elevations Variable feet, amsl USGS 7.5 quadrangle maps Transmissivity, Chester Valley 1,600 square feet per day obtained from model calibration
Transmissivity, Elbrook 160 square feet per day obtained from model calibration Transmissivity, North of Chester Valley 100 square feet per day obtained from model calibration Transmissivity, South of Chester Valley 100 square feet per day obtained from model calibration
Transport Model Input Parameter
Lateral dispersivity 8 feet Freeze, 1979 Longitudinal dispersivity 80 feet Freeze, 1979
Lithium Source Loading Building 17 Storage Pads 2.5 pounds per day obtained from model calibration
Chromite Ore Storage Area 5 0.16 pounds per day obtained from model calibration Former Settling Ponds Area 1.1 pounds per day obtained from model calibration Former Solvent Burn Area 5.0 pounds per day obtained from model calibration
North Quarry 0.31 pounds per day obtained from model calibration South Quarry 22 pounds per day obtained from model calibration
902

Water Supply Well
Former Settling Pond
Former Solvent Burn AreaBldg 17 Storage Pads
Chromite Ore 5
North Quarry
Modeled Fault Line
US 202
Swedesford Rd
N Bacton Hill Rd
Phoe
nixvil
le Pik
e
Planebrook Rd
US 20
2
South Quarry
East Valley Creek
Route 30
LegendWellSurface streamModeled groundwater contour, feet amslModeled groundwater flowline,5-year travel time between ticks
Route 401
Church Rd
Figure 1. Modeled Groundwater Contours and Flowlines
300
350
400
350400
Facility
903

Water Supply Well
Former Settling Pond
ormer Solvent Burn AreaBldg 17 Storage Pads
Chromite Ore 5
North Quarry
Modeled Fault Line
US 202
Swedesford Rd
N Bacton Hill Rd
Phoe
nixvil
le Pik
e
Planebrook Rd
US 20
2
South Quarry
East Valley Creek
Route 30
LegendWellSurface streamModeled lithium concentrationisocontour, ug/l
Route 401
Church Rd
Figure 2. Modeled Current Lithium Distribution in Groundwater
1,000 100
10
FFacility
904

See Figure 4
3964
3477
3906
2974
2575
2420
2262
2106
1999
Modeled Fault Line
1500
Figure 3. Modeled Lithium Concentration along Fault Line
LegendWellSurface streamModeled fault line locationModeled fault lineModeled lithium concentration, ug/l
3263
US 202
North Quarry
South Quarry
ForFo r Solvent Burn Ar rme
ea
Facility mer Settling Pond Bldg 17 Storage Pads
Chromite Ore 5
Water Supply Well
905

Modeled Fault Line Exit
Figure 4. Modeled Fault Line Exit and PADEP’s Hand Sketch of Field Observation (Close-up View of Figure 3)
906

Biographical Sketches Henry Y. He Environmental Resources Management 350 Eagleview Boulevard, Suite 200 Exton, PA 19341-1155 (610) 524-3626 (office) (610) 524-7796 (fax) [email protected] Mr. He is a Senior Scientist with Environmental Resources Management. Mr. He holds a Master of Science Degree in Civil Engineering and 18 years of professional experience in groundwater flow and contaminant transport modeling throughout the United States and internationally. Mr. He has developed over 200 models for environmental engineering, water resources management, and geotechnical engineering sites. Andrew H. Thalheimer, P.E. Environmental Resources Management 350 Eagleview Boulevard, Suite 200 Exton, PA 19341-1155 (610) 524-3453 (office) (610) 524-7796 (fax) [email protected] Mr. Thalheimer is a Senior Project Manager with Environmental Resources Management, Inc. Mr. Thalheimer is a Professional Engineer with over 15 years of professional experience in environmental investigation and remediation. He holds a Bachelor's of Science in Civil Engineering and an MBA.
907
Related Documents