Original article Wildl. Biol. 17: 389-403 (2011) DOI: 10.2981/11-004 Ó Wildlife Biology, NKV www.wildlifebiology.com Resource selection by sympatric free-ranging dairy cattle and brown bears Ursus arctos Sam M.J.G. Steyaert, Ole-Gunnar Støen, Marcus Elfstro¨ m, Jens Karlsson, Ron Van Lammeren, Jan Bokdam, Andreas Zedrosser, Sven Brunberg & Jon E. Swenson Livestock depredation is an important factor that contributes to low public acceptance of large carnivores, and it is often used as an incentive to reduce large carnivore populations. In central Sweden, brown bears Ursus arctos coexist with a traditional cattle husbandry system that allows daytime free-ranging of dairy cattle. Despite a growing brown bear population, depredation on cattle remained stable during the last decade and is among the lowest rates reported worldwide. Nevertheless, major stakeholders argue for a substantial reduction in brown bear numbers, among other reasons, to safeguard the traditional husbandry system. Based on satellite tracking data, we assessed and correlated the resource selection of nine brown bears that were sympatric with six daytime free-ranging cattle herds during the free- ranging season (i.e. June-August) in 2008. We found a significant and negative relationship between resource selection of brown bears and free-ranging cattle during the study period, mainly because of inverse relationships between the species towards vegetation density and human-related infrastructure, such as forest roads, buildings and settlements. We predict that the probability of an encounter between these species, given that there is no directed predation, is highest in dense vegetation patches close to the human habitation-related variables. Because of the low reported depredation rates and the apparent habitat segregation between the species, our results provide no support for the argument to reduce brown bear numbers to safeguard the traditional cattle herding system. Key words: brown bear, cattle, coexistence, depredation, human-wildlife conflict, resource selection, Ursus arctos Please note that supplementary information including Appendices SI - SIV mentioned in this article is available in the online version of this article, which can be viewed at www.wildlifebiology.com Sam M.J.G. Steyaert, Institute of Wildlife Biology and Game Management, University of Natural Resources and Life Sciences, Gregor Mendelstrasse 33, A-1180, Vienna, Austria - e-mail: [email protected] Ole-Gunnar Støen, Department of Ecology and Natural Resource Management, Norwegian University of Life Sciences, Post Box 5003, NO-1432 A ˚ s, Norway, and Department of Wildlife, Fish and Environmental Studies, Swedish University of Agricultural Sciences, SE-90183 Umea ˚, Sweden - e-mail: [email protected] Marcus Elfstro ¨m, Department of Ecology and Natural Resource Management, Norwegian University of Life Sciences, Post Box 5003, NO-1432 A ˚ s, Norway - e-mail: [email protected] Jens Karlsson, Swedish Wildlife Damage Center, Swedish University of Agricultural Sciences, SE-73091 Ryd- darhyttan, Sweden - e-mail: [email protected] Ron Van Lammeren, Laboratory of Geo-Information Science and Remote Sensing, Wageningen University and Research Institute, Droevendaalsesteeg 3, NL-6708PB, Wageningen, the Netherlands - e-mail: [email protected] Jan Bokdam, Nature Conservation and Plant Ecology Group,Wageningen University and Research Institute, Droevendaalsesteeg 3, NL-6708PB, Wageningen, the Netherlands - e-mail: [email protected] Andreas Zedrosser, Department of Ecology and Natural Resource Management, Norwegian University of Life Sciences, Post Box 5003, NO-1432 A ˚ s, Norway, and Institute of Wildlife Biology and Game Management, University of Natural Resources and Life Sciences, Gregor Mendelstrasse 33, A-1180, Vienna, Austria. - e-mail: [email protected] Sven Brunberg, Scandinavian Brown Bear Project, Tacka ˚sen 2, SE-79498 Orsa, Sweden - e-mail: [email protected] Jon E. Swenson, Department of Ecology and Natural Resource Management, Norwegian University of Life Sciences, Post Box 5003, NO-1432 A ˚ s, Norway, and Norwegian Institute for Nature Research, Tungasletta 2, NO-7485 Trondheim, Norway - e-mail: [email protected] Corresponding author: Sam M.J.G. Steyaert Ó WILDLIFE BIOLOGY 17:4 (2011) 389

Welcome message from author
This document is posted to help you gain knowledge. Please leave a comment to let me know what you think about it! Share it to your friends and learn new things together.
Transcript
Original articleWildl. Biol. 17: 389-403 (2011)
DOI: 10.2981/11-004
� Wildlife Biology, NKV
www.wildlifebiology.com
Resource selection by sympatric free-ranging dairy cattle and brown
bears Ursus arctos
Sam M.J.G. Steyaert, Ole-Gunnar Støen, Marcus Elfstrom, Jens Karlsson, Ron Van Lammeren,
Jan Bokdam, Andreas Zedrosser, Sven Brunberg & Jon E. Swenson
Livestock depredation is an important factor that contributes to low public acceptance of large carnivores, and it isoften used as an incentive to reduce large carnivore populations. In central Sweden, brown bears Ursus arctos coexist
with a traditional cattle husbandry system that allows daytime free-ranging of dairy cattle. Despite a growing brownbear population, depredation on cattle remained stable during the last decade and is among the lowest rates reportedworldwide. Nevertheless, major stakeholders argue for a substantial reduction in brown bear numbers, among other
reasons, to safeguard the traditional husbandry system. Based on satellite tracking data, we assessed and correlated theresource selection of nine brown bears that were sympatric with six daytime free-ranging cattle herds during the free-ranging season (i.e. June-August) in 2008. We found a significant and negative relationship between resource selectionof brown bears and free-ranging cattle during the study period, mainly because of inverse relationships between the
species towards vegetation density and human-related infrastructure, such as forest roads, buildings and settlements.We predict that the probability of an encounter between these species, given that there is no directed predation, ishighest in dense vegetation patches close to the human habitation-related variables. Because of the low reported
depredation rates and the apparent habitat segregation between the species, our results provide no support for theargument to reduce brown bear numbers to safeguard the traditional cattle herding system.
Key words: brown bear, cattle, coexistence, depredation, human-wildlife conflict, resource selection, Ursus arctos
Please note that supplementary information including Appendices SI - SIV mentioned in this article is available in the
online version of this article, which can be viewed at www.wildlifebiology.com
Sam M.J.G. Steyaert, Institute of Wildlife Biology and Game Management, University of Natural Resources and LifeSciences, Gregor Mendelstrasse 33, A-1180, Vienna, Austria - e-mail: [email protected] Støen, Department of Ecology and Natural Resource Management, Norwegian University of Life Sciences,
Post Box 5003, NO-1432 As, Norway, and Department of Wildlife, Fish and Environmental Studies, SwedishUniversity of Agricultural Sciences, SE-90183 Umea, Sweden - e-mail: [email protected] Elfstrom, Department of Ecology and Natural Resource Management, Norwegian University of Life Sciences,Post Box 5003, NO-1432 As, Norway - e-mail: [email protected]
Jens Karlsson, Swedish Wildlife Damage Center, Swedish University of Agricultural Sciences, SE-73091 Ryd-darhyttan, Sweden - e-mail: [email protected] Van Lammeren, Laboratory of Geo-Information Science and Remote Sensing,Wageningen University and Research
Institute, Droevendaalsesteeg 3, NL-6708PB, Wageningen, the Netherlands - e-mail: [email protected] Bokdam, Nature Conservation and Plant Ecology Group,Wageningen University and Research Institute,Droevendaalsesteeg 3, NL-6708PB, Wageningen, the Netherlands - e-mail: [email protected]
Andreas Zedrosser, Department of Ecology and Natural Resource Management, Norwegian University of Life Sciences,Post Box 5003, NO-1432 As, Norway, and Institute of Wildlife Biology and Game Management, University of NaturalResources and Life Sciences, Gregor Mendelstrasse 33, A-1180, Vienna, Austria. - e-mail: [email protected]
Sven Brunberg, Scandinavian Brown Bear Project, Tackasen 2, SE-79498 Orsa, Sweden - e-mail: [email protected] E. Swenson, Department of Ecology and Natural Resource Management, Norwegian University of Life Sciences,Post Box 5003, NO-1432 As, Norway, and Norwegian Institute for Nature Research, Tungasletta 2, NO-7485Trondheim, Norway - e-mail: [email protected]
Corresponding author: Sam M.J.G. Steyaert
� WILDLIFE BIOLOGY 17:4 (2011) 389
Received 16 January 2011, accepted 20 June 2011
Associate Editor: Simon Chamaille-Jammes
Minimising conflicts betweenwildlife andhumans isessential for the conservation of wildlife andbiodiversity in general (Berger 2006, Rondinini &Boitani 2007, Zabel &Holm-Muller 2008). Human-wildlife coexistence is becoming increasingly chal-lenging on a global scale because of humanencroachment on wildlife habitat, which may leadto an increase of conflicts (Rajpurohit 1999, Wood-roffe et al. 2005, Nellemann et al. 2007). Theseconflicts may lead to legal and illegal persecution,often specifically targeting large carnivores, toprevent them from killing livestock, other wildlifeor people (Boitani 2000, Swenson et al. 2000,Woodroffe et al. 2005). For example, populationsof wolves Canis lupus and brown bearsUrsus arctosare often under severe human pressure, despite thecurrent more enlightened management practicesthat have lead to an increase in the species in severalareas (Boitani 2000, Swenson et al. 2000).
The brown bear is a carnivore with a mainlyomnivorous diet (Pasitschniak-Arts 1993); howev-er, it commonly preys upon livestock throughout itsdistribution range (Servheen et al. 1999, Swenson etal. 2000), e.g. in Scandinavia (Zimmermann et al.2003, Swenson & Andren 2005), Spain (Kaczensky1999), USA (Murie 1948, Knight & Judd 1983),Canada (Horstman & Gunson 1982), Russia(Vaisefeld & Chestin 1993), Turkey (Can & Togan2004) and the Indian Himalaya (Chauhan 2003).Knight & Judd (1983) and Linnel et al. (1999)suggested that brownbears generally donot activelyprey upon livestock, but may do so given theopportunity. For example, brown bears causesevere damage to free-ranging unattended sheepOvis spp. in Norway, although such damage isconsiderably less severe in neighbouring Sweden,despite a larger bear population, because sheep arekept in enclosures close to farms and damagecompensation is connected to prevention measures(Swenson & Andren 2005).
Human persecution led to the functional extinc-tion of brown bears in Sweden in the 1930s(Swenson et al. 1995). However, the populationhas recovered since then and consisted of anestimated 3,298 (2,968-3,667) individuals in 2008(Kindberg et al. 2011). Despite the growing brownbear population (Kindberg et al. 2011), depredationnumbers have remained stable during the lastdecade (Karlsson et al. 2006, Viltskadecenter
2010), and thus, they do not reflect the general bearpopulation trend. However, livestock may also beaffected indirectly by an increased carnivore pres-ence. Indirect effects may be related to increasedstress levels and may lead to e.g. decreased milkproduction, decreased mass gain, difficulties tohandle livestock (Murie 1948, Zimmermann et al.2003) aswell as shifting grazing routines and habitatuse (Brown et al. 1999, Ripple & Beschta 2004,Kluever et al. 2009).Summer pasture farming was common in Sweden
in the past. Farmersmoved their livestock to grazinggrounds in forested areas outside the villages duringspring and summer, because the pastures nearvillages were used to grow hay to feed livestockduring winter (Larsson 2009). Young family mem-bers usually accompanied the livestock to thesummer feeding grounds to move them to suitablegrazing areas as well as to protect them fromdepredation (Larsson 2009). Typically, livestockwere moved to pens or barns during the night(Larsson 2009). Nowadays, only ca 200 summerfarms remain in use in Sweden (Anon. 2007);most ofthem in the the distribution range of brown bears. Ofthese summer farms, 80%havedairy cattle (Elfstrom2005), which commonly range free and unattendedduringdaytime.Becausedairy cattle aremilkedeveryday, they are pennedovernight for this purpose.Alsocattle used for beef production are often pennedovernight, among other reasons because Swedishanimal welfare laws stipulate that animals must havedaily supervision (Anon. 2010). InDalarna in south-central Sweden, bear-related cattle mortality ac-counts for , 0.0007% of the free-ranging cattlepopulation (calculated from data in Lidberg 2009).However, . 30% of the summer-pasture farmersclaimed that they had experienced disturbances,which might have been caused only by the presenceof large carnivores (Elfstrom 2005, Lidberg 2009).Livestock depredations and potential stress in
livestock caused by bear presence may lead toincome loss. These arguments, among others, areoften used by major stakeholders to reduce bearnumbers (Ericsson et al. 2010), partly to preserve thetradition of summer pasture farming in Sweden(Wanstrom & Dahlin 2008, Sjolander-Lindqvist2009, Weberyd & von Essen 2009, Sjolander-Lindqvist et al. 2010).In our study, we attempt to evaluate the potential
390 � WILDLIFE BIOLOGY 17:4 (2011)
effect of bear presence and bear habitat use on
grazing habitat selection of dairy cattle by compar-
ing and assessing the relationship between the
resource selection of sympatric brown bears and
semi free-ranging dairy cattle. In addition, we assess
the importance of several environmental variables
that may determine the relative probability of an
encounter between the species.
Material and methods
Study area
Our study was conducted in the county of Dalarna,
south-central Sweden (618N, 158E).More than 80%
of the area consists of intensively managed boreal
forest, with Norway spruce Picea abies, Scots pine
Pinus sylvestris, lodgepole pine P. contorta and the
birch species silver birch Betula pendula and downy
birch B. pubescens as dominating tree species
(Friebe et al. 2001, Moe et al. 2007). The turnover
rate of the managed forest is 90-100 years, and
, 60% of the forest is older than 35 years (Swenson
et al. 1999). The prevailing logging system resulted
in a patchy forest landscape of relatively small
stands of different age-cohorts (median patch size;
22,500 m2; Moe et al. 2007). The remaining 20% of
the area is mainly covered by bogs or lakes. The
forest floor is dominated by lichens, heatherCalluna
vulgaris and the berry-bearing species bilberry
Vaccinium myrtillis, cowberry V. vitis-idaea and
crowberry Empetrum hermaphroditum. Elevations
in the gently undulating terrain range from 200 to
700 m a.s.l. (Moe et al. 2007). Daily average
temperature range from a minimum of -78C in
January to a maximum of 158C in July, and snow
cover lasts from lateOctober to earlyMay. The area
is sparsely populated and contains a few scattered
small settlements, but has a dense network of gravel
roads (0.3 km/km2; Nellemann et al. 2007). The
population density of brown bear was estimated to
be around30 individuals/1,000km2 (Bellemain et al.
2005). In spring, moose Alces alces carrion and
moose calves form an important source of protein
for brown bears in our study area (Dahle et al. 1998,
Swenson et al. 2007). The summer brown bear diet
consists mainly of ants Formica spp. and Campo-
notus herculeanus, forbs andmoose, and the autumn
diet consists primarily of bilberry, cowberry and
crowberry (Dahle & Swenson 2003). In the county
of Dalarna, about 1,500 free-ranging cattle are
distributed over 74 summer pasture farms, whichcorresponds to ca 20 cattle/farm (Lidberg 2009).
Study design
We studied resource selection of free-ranging cattleon six of the seven active summer farms in our studyarea. These farms kept their cattle inside pens
during the night. No disturbance or depredationhad been reported on three of the studied farms,whereas three farms claimed to have experienced
disturbance caused by large carnivores. None of thefarms had lost cattle to carnivore depredation;however, one cowwas injured by a bear on one farm
in 2006. Our own field observations, as well aspersonal communications with the cattle farmers,assured us that the herds travelled as one and almost
never split up.We therefore equipped one cow in theherd of each farm with a Global Positioning System
-Global System for Mobile communication (GPS-GSM) collar to represent herd movements (TeleviltTellusTM GPS collars). We replaced five of these
collars with Vectronic Aerospace GPS-plus collarsbecause of their performance (the average fix ratewas 38.2%, ranging between 4.6 and 78.5%) at the
onset of the study. Herd sizes per farm were four,five, 12, 20, 23 and 28 and comprised adult cows.The GPS collars were programmed to transmit one
location every 30 minutes. Vectronic GPS-pluscollars had an average fix rate of 95.7%. The fixrate per diurnal interval varied between 93.1 and
97.4%, and did not show a diurnal trend. Wemonitored the cattle herds from 14 June to 22August 2008, i.e. the period when the cattle were
ranging free and unattended between 05:00 and20:30. The radio-locations were downloaded viaGSM and imported into a Geographical Informa-
tion System (GIS) for further analysis (ArcGIS 9.3and the ET Geowizards 9.9 extension).We discard-
ed all cattle locations before 05:00 and after 20:30hours and all locations within a 25-m range aroundeach summer farm, to avoid including locations
from when the cattle were either not free-ranging oron the farm. Using the remaining locations (N ¼2,518), we estimated a 95% contour kernel density
home range for each herd, defined as the ’cattlerange’. We sampled resource use and availabilitywithin each cattle range. Cattle locations were
assigned as ’use’, and an equal number of randomlydrawn locations were used to represent availability.
We captured and equipped 39 brown bears withGPS-GSM collars (Vectronic Aerospace GPS-plus)
� WILDLIFE BIOLOGY 17:4 (2011) 391
in 2008, using aerial darting with an immobilisationdrug from a helicopter (for a detailed description,see Arnemo & Fahlman 2007). The collars wereprogrammed to obtain one position/30 minutes.The cattle range was frequented by nine GPS-marked brown bears during the study period andwere therefore selected for our study. Five of thebears were males (four, six, 10 and 17 years old, andone of unknown age, but obviously . 3 years oldbased on its weight at the capture in spring). Theremaining four females, of which the oldest hadthree yearlings, were three, five, nine and 14 years ofage. We used all data from these bears that wereobtained during 1 June - 31 August, except for theperiod 15 - 31 July. Resource use and availabilitywere sampled within the 95% kernel densityestimate home range of each individual bear. BearGPS locations represented ’use’, and an equalnumber of randomly drawn points represented re-source availability. Sample size of used locations perbear varied between 3,698 and 5,072 data points.
There is a pronounced seasonal shift in bear dietin our study area. Ungulates, forbs and insectscontribute 98% to the estimated dietary energycontent (EDEC) during June and July. Berries onlycontribute with 1-2% to the EDEC during thatperiod (Dahle et al. 1998).However, duringAugust-October, berries contribute up to 81% to the EDEC(Dahle et al. 1998). Because this pronounced sea-sonal dietary shift affects brown bear behaviour andhabitat selection (Dahle & Swenson 2003), wedivided the location data for both bears and cattleinto two seasons, based on berry availability (i.e.pre-berry season: before 1 July; berry season: after16 July; Dahle & Swenson 2003).
We distinguished diurnal intervals pragmatically,based on Rees & Hutson (1983), who reported thatfree-ranging cattle foraged mainly during morningsand evenings and rested and ruminated at midday.Moe et al. (2007) reported that the main activityperiod of bears was during early mornings and lateevenings. Thus, we divided the diurnal period intofive intervals; early morning (00:00-04:59), morning(05:00-09:59), midday (10:00-14:59), evening(15:00-20:59) and late evening (21:00-23:59).
Model variables
We selected variables tomodel resource selection bybrown bears and free-ranging cattle based on aliterature review and field experience. The variableswere derived from three source layers, i.e. a digitalelevation model (DEM, National Land Survey of
Sweden, available at: www.lantmateriet.se), topo-graphical maps (National Land Survey of Sweden,available at: www.lantmateriet.se) and IRSP6-LISS3 satellite imagery (images captured on 2 and7 June 2007). We processed the satellite images withErdas Imagine 9.1 (Leica Geosystems) software orderived data from the DEM and topographicalmaps using ArcGIS 9.2 (ESRI 2007).We used the DEM to obtain data on slope
steepness and terrain ruggedness. We calculated theterrain ruggedness index (TRI) for each 503 50 mraster cell based on the index developed by Riley etal. (1999), as a function of the variation in altitude(r) for each cell relative to its eight neighbouringcells, the maximum observed altitude in the studyarea (rx) and the relative variety in classes of slopeaspect (A, 458 classes (1-8)), steepness (S, 58 classes(1-9)) and curvature (C, from maximum upwardconcave to maximum upward convex (1-6); Equa-tion 1). We standardised the resulting TRI valuesbetween 0 and 1 by dividing each pixel value by themaximum observed TRI value (TRIx) and binnedvalues in quartiles. We created a second ruggednessvariable (TRI1000) to assess the importance ofterrain ruggedness on resource selection by cattleand brown bears on a larger spatial scale, bycalculating the average TRI value for each 503 50m cell, based on all its neighbouring cells within a1,000-m radius with a moving window approach.
TRI ¼ffiffiffiffiffiffiffiffiffiffiffiffiffiffiffi
ðr=rxÞp
� ½ðS � C � AÞ=ðSþ Cþ AÞ�TRIx
ð1Þ:
Because an up-to-date land cover classificationcovering the study area was not available, weclassified IRSP6-LISS3 satellite imagery with asupervised maximum likelihood classifier afterimage referencing and atmospherical correction.The spatial resolution of IRSP6-LISS3 imagery is23.5 m (ISRO 2008). We collected ground-truth totrain the classification during fieldwork in springand summer 2008 (N¼ 395). Ground-truth of nondynamic land use classes, such as water bodies andhabitation was derived from topographical maps(N¼75).We distinguished the following land-coverclasses: bog, young dense forest, young open forest,older forest, water and other open land. The overalluser’s accuracy of the classified images was 87%.We validated the classification from 498 groundcontrol points obtained in 2007, of which 77%wereidentified correctly.The NDVI is a spectral vegetation index that
indicates net primary above-groundproduction and
392 � WILDLIFE BIOLOGY 17:4 (2011)
is used as a proxy for vegetation density (Osborne et
al. 2001, Pettorelli et al. 2005). The index is based on
contrasting reflectance by vegetation of red and
near infrared electromagnetic energy (Gamon et al.
1995) and was derived from the IRSP6-LISS3
satellite imagery. Each pixel returns a value between
-1 and 1. Negative values indicate vegetation ab-
sence, and high pixel values correspond to dense
vegetation cover (Chen & Brutsaert 1998).
We derived raster data (25325m) on the distance
(in m) to settlements, buildings, forest roads (gravel
roads), trails, creeks and open water from the
topographical maps. None of the variables were
correlated (Pearson correlation coefficient . 0.6),
and therefore, all were included for statistical
modelling. A summary of the model variables is
presented in Table 1.
Statistical models
Wemodelled resource selection by brown bears and
cattle herds with generalised linear mixed models
(GLMMs) of the binomial family with the Laplace
approximation using the statistical programming
language and environment R 2.10.1 (R Develop-
ment Core Team 2009) and the ’lme4’ package
(Bates & Maechler 2010). We followed Manly’s
design type III (Manly et al. 2002), in which each
individual study unit (i.e. individual GPS - marked
cows and bears) remains identifiable. We used
logistic regression with the binomial use and
availability data as the response variable, and a set
of model variables (e.g. NDVI, land cover, terrain
ruggedness; see Table 1) as explanatory variables.
We included individual bear or farm as random
effects in our models to account for structured
errors caused by repeated measurements (Pinheiro
& Bates 2000, McCulloch & Searle 2001). We
modelled resource selection for each defined diurnal
interval and season. We randomly assigned each
record into a training or a validation data setwith an
equal probability. We fitted the brown bear and
cattle training data for each diurnal interval and
season with four a priori defined candidate models
(Table 2), following the information theory ap-
proach (Burnham & Anderson 2002). We used
Akaike’s Information Criteria (AIC), Akaike’s
difference (DAIC) and Akaike’s weights (AICw) to
assess model parsimony for each candidate model
(Akaike 1973, Anderson 2008). To ensure compa-
rability, we modelled the validation data sets
according to the most parsimonious candidate
model obtained by their corresponding training
data set. We created resource selection maps (253
25 m cell size) for each selected training and
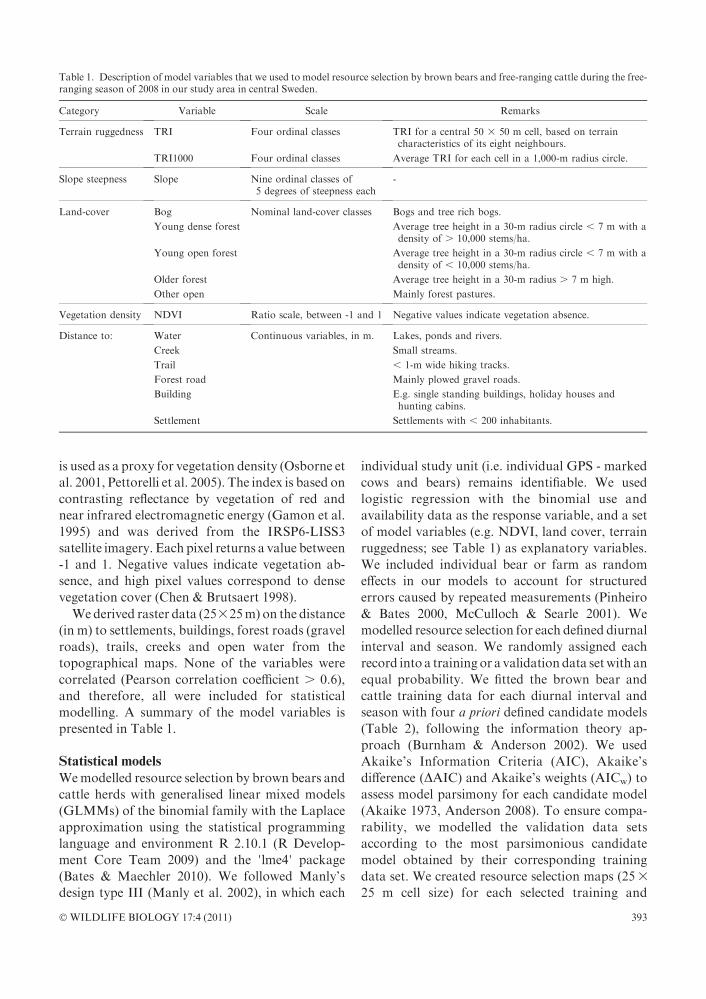
Table 1. Description of model variables that we used to model resource selection by brown bears and free-ranging cattle during the free-ranging season of 2008 in our study area in central Sweden.
Category Variable Scale Remarks
Terrain ruggedness TRI Four ordinal classes TRI for a central 50 3 50 m cell, based on terraincharacteristics of its eight neighbours.
TRI1000 Four ordinal classes Average TRI for each cell in a 1,000-m radius circle.
Slope steepness Slope Nine ordinal classes of5 degrees of steepness each
-
Land-cover Bog Nominal land-cover classes Bogs and tree rich bogs.
Young dense forest Average tree height in a 30-m radius circle , 7 m with adensity of . 10,000 stems/ha.
Young open forest Average tree height in a 30-m radius circle , 7 m with adensity of , 10,000 stems/ha.
Older forest Average tree height in a 30-m radius . 7 m high.
Other open Mainly forest pastures.
Vegetation density NDVI Ratio scale, between -1 and 1 Negative values indicate vegetation absence.
Distance to: Water Continuous variables, in m. Lakes, ponds and rivers.
Creek Small streams.
Trail , 1-m wide hiking tracks.
Forest road Mainly plowed gravel roads.
Building E.g. single standing buildings, holiday houses andhunting cabins.
Settlement Settlements with , 200 inhabitants.
� WILDLIFE BIOLOGY 17:4 (2011) 393

validation data set by plotting parameter estimatesof fixed effect variables in a GIS, yielding pixelvalues representing the relative probability that thepixelwill be usedby a cattle herd andbear during thesame time interval. We standardised resourceselection values between 0 and 1 and classified pixelvalues into 256 bins (the maximum number of binspossible in ArcGIS 9.2). We extracted binned pixelvalues for all training and validation data sets from5,504 randomly drawn points (2 points/ha) in thecattle range, after masking water bodies, the cattlesummer farms, and immediately adjacent grass-lands. We then assessed model validation using aSpearman Rho correlation test for each trainingdata set and its corresponding validation data set.
Spatial autocorrelation is a general property ofecological variables (Legendre 1993), and it mayinflate Type I errors in statistical tests. We used aBonferroni correction to adjust the 95% confidenceintervals for each parameter estimate in eachmodel,to remain conservative in our conclusions. Weconsidered the responses of cattle and bears to agiven variable as significant when its Bonferronicorrected confidence interval did not contain 0.
Weassessed the relationship between the resourceselection of brown bears and cattle using Pearsoncorrelation tests, after accounting for spatialautocorrelation in the bear and cattle resourceselection maps (Legendre 1993). We determined thelevel of spatial autocorrelation in each resourceselection map using exponentially fit semivario-grams and used the semivariogram range as thethreshold distance to reach spatial independencybetween map locations. We used the ’automap’package in R to assess spatial autocorrelation(Hiemstra et al. 2009, R Development Core Team2009). The semivariogram range of the strongestautocorrelated resource selection map was 1,345.4m (Appendix SI). We used this distance as theminimum distance between points (N ¼ 165) that
were randomly drawn within the 95% kernel homerange of all bear positions. For each point, we thenextracted cattle and bear resource selection valuesand applied a Pearson correlation test betweencattle and brown bear resource selection values foreach diurnal interval and season.We assessed the relative encounter risk between
brown bears and cattle by multiplying the resourceselection maps of both species for each appropriatediurnal interval per season. We standardised thepixel values of the resulting relative encounter riskprobabilitymaps and classified them in 256bins.Wedrew 5,504 random points (2 points/ha) over thecattle range, and extracted the relative encounterrisk values for each point. We fitted generalisedlinear models (GLMs) of the Poisson family foreach diurnal interval per season, with relativeencounter risk values as the response variable.Initially, we included all model variables in Table1 in the model structure as explanatory variables.We determined the most parsimonious models witha stepwise AIC procedure. We assessed modelvalidation with a leave-one-out cross validationprocedure, yielding an estimate for the predictionerror for each selected model. We calculated this asthe mean squared error between the predicted andthe observed values of all iterations in the validationprocess, using the ’stats’ package in R (R Develop-ment Core Team 2009).
Results
Resource selection
Model selectionThe all-inclusive candidate model during all diurnalintervals per season was selected as the mostparsimonious for both brown bear and cattle (Table3). The lowest Akaike’s weight (0.701) was for cattleduring mornings in the berry season (see Table 3).
Table 2. A priori defined candidate models with binary response variables (UA) that we used to model resource selection by brown bearsand free-ranging cattle during the free-ranging season of 2008 in our study area in central Sweden.
Model type Abbreviations Model formulation
All inclusive ALL UA Individual ID þ Bog þ Young open þ Young dense þ Older þ Other openþ NDVI þ Creek þ Water þ Building þ Settlement þ Trail þ Forest road þTRI þ TRI1000 þ Slope
Land cover LC UA Individual ID þ Bog þ Young open þ Young dense þ Older þ Other open
Human infrastructure HI UA Individual ID þ Building þ Settlement þ Trail þ Forest road
Expert EX UA Individual ID þ Bog þ Young open þ Young dense þ Older þ Other openþ NDVI þ Water þ Settlement þ Trail þ Forest road þ TRI
394 � WILDLIFE BIOLOGY 17:4 (2011)
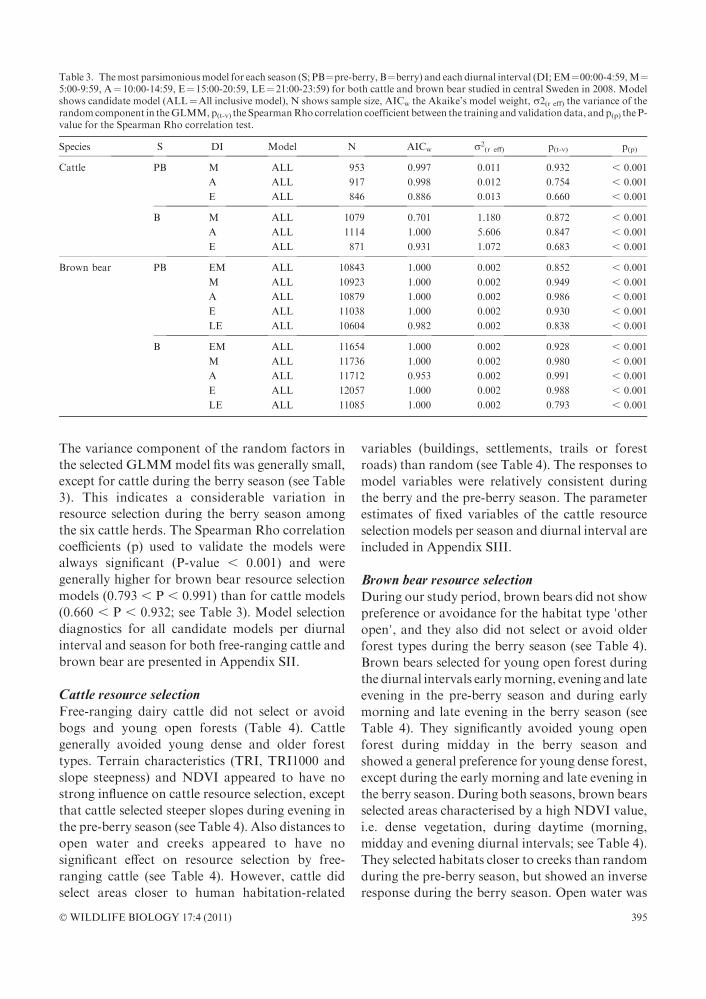
The variance component of the random factors in
the selected GLMMmodel fits was generally small,
except for cattle during the berry season (see Table
3). This indicates a considerable variation in
resource selection during the berry season among
the six cattle herds. The Spearman Rho correlation
coefficients (p) used to validate the models were
always significant (P-value , 0.001) and were
generally higher for brown bear resource selection
models (0.793 , P , 0.991) than for cattle models
(0.660 , P , 0.932; see Table 3). Model selection
diagnostics for all candidate models per diurnal
interval and season for both free-ranging cattle and
brown bear are presented in Appendix SII.
Cattle resource selectionFree-ranging dairy cattle did not select or avoid
bogs and young open forests (Table 4). Cattle
generally avoided young dense and older forest
types. Terrain characteristics (TRI, TRI1000 and
slope steepness) and NDVI appeared to have no
strong influence on cattle resource selection, except
that cattle selected steeper slopes during evening in
the pre-berry season (see Table 4). Also distances to
open water and creeks appeared to have no
significant effect on resource selection by free-
ranging cattle (see Table 4). However, cattle did
select areas closer to human habitation-related
variables (buildings, settlements, trails or forest
roads) than random (see Table 4). The responses to
model variables were relatively consistent during
the berry and the pre-berry season. The parameter
estimates of fixed variables of the cattle resource
selection models per season and diurnal interval are
included in Appendix SIII.
Brown bear resource selectionDuring our study period, brown bears did not show
preference or avoidance for the habitat type ’otheropen’, and they also did not select or avoid older
forest types during the berry season (see Table 4).
Brown bears selected for young open forest during
the diurnal intervals earlymorning, evening and late
evening in the pre-berry season and during early
morning and late evening in the berry season (see
Table 4). They significantly avoided young open
forest during midday in the berry season and
showed a general preference for young dense forest,
except during the early morning and late evening in
the berry season. During both seasons, brown bears
selected areas characterised by a high NDVI value,
i.e. dense vegetation, during daytime (morning,
midday and evening diurnal intervals; see Table 4).
They selected habitats closer to creeks than random
during the pre-berry season, but showed an inverse
response during the berry season. Open water was
Table 3. Themost parsimoniousmodel for each season (S; PB¼pre-berry, B¼berry) and each diurnal interval (DI; EM¼00:00-4:59,M¼5:00-9:59, A¼10:00-14:59, E¼15:00-20:59, LE¼21:00-23:59) for both cattle and brown bear studied in central Sweden in 2008. Modelshows candidate model (ALL¼All inclusive model), N shows sample size, AICw the Akaike’s model weight, r2(r eff) the variance of therandomcomponent in theGLMM,p(t-v) the SpearmanRho correlation coefficient between the training and validation data, andp(p) the P-value for the Spearman Rho correlation test.
Species S DI Model N AICw r2(r eff) p(t-v) p(p)
Cattle PB M ALL 953 0.997 0.011 0.932 , 0.001
A ALL 917 0.998 0.012 0.754 , 0.001
E ALL 846 0.886 0.013 0.660 , 0.001
B M ALL 1079 0.701 1.180 0.872 , 0.001
A ALL 1114 1.000 5.606 0.847 , 0.001
E ALL 871 0.931 1.072 0.683 , 0.001
Brown bear PB EM ALL 10843 1.000 0.002 0.852 , 0.001
M ALL 10923 1.000 0.002 0.949 , 0.001
A ALL 10879 1.000 0.002 0.986 , 0.001
E ALL 11038 1.000 0.002 0.930 , 0.001
LE ALL 10604 0.982 0.002 0.838 , 0.001
B EM ALL 11654 1.000 0.002 0.928 , 0.001
M ALL 11736 1.000 0.002 0.980 , 0.001
A ALL 11712 0.953 0.002 0.991 , 0.001
E ALL 12057 1.000 0.002 0.988 , 0.001
LE ALL 11085 1.000 0.002 0.793 , 0.001
� WILDLIFE BIOLOGY 17:4 (2011) 395

avoided during the morning in the pre-berry season
and all diurnal intervals except midday during the
berry season. Of the human habitation-related
variables, brown bears tended to avoid settlements
during midday and evening in the pre-berry season.
During the berry season, however, human habita-
tion-related variables were avoided generally,main-
ly during daytime (morning, midday and evening;
see Table 4). Brown bears only selected for less
rugged terrain in the berry season during midday.
On a larger scale, more rugged terrain was selected
(TRI1000) during early morning, evening and late
evening during both the pre-berry and berry season
(see Table 4). Brown bears generally selected steeper
slopes during both seasons and their responses
during both seasons were less consistent than in
cattle resource selection. Human habitation ap-
peared to be more determinative in brown bear
resource selection during the berry season. The
parameter estimates of fixed variables of the brown
bear resource selection models per season and
diurnal interval are given in Appendix SIII.
Relationship between brown bear-cattle resourceselectionThe Pearson correlation tests revealed significantand negative relationships between cattle and
brown bear resource selection.During the pre-berry
season, the correlation coefficients (C) were lower
(N¼165, morning: C¼-0.390, t¼-5.413, P, 0.001;
afternoon: C ¼ -0.314, t ¼ -4.223, P , 0.001 and
evening: C ¼ -0.335, t ¼ -4.541, P , 0.001), than
during the berry season (N ¼ 165, morning: C ¼-0.462, t¼ -6.659, P , 0.001; afternoon: C¼ -0.562,
t¼ -8.694, P , 0.001 and evening: C¼ -0.435, t¼-6.174, P , 0.001).
Brown bear-free-ranging cattle encounter risk
Model selectionThe stepwise AIC selection procedure of GLMs
predicting encounter risk varied in the selection of
variables included in the most parsimonious model.
The habitat types ’bog’, ’young dense forest’, ’olderforest’ and ’other open’ were always included, as
were the NDVI, distance to creek and distance to
open water variables (Table 5). Distances to trails,
settlements and forest roads, and slope steepness
were included for all diurnal intervals in the pre-
berry season, but not in the berry season (see Table
5). The ’young open forest’ habitat type, terrain
ruggedness and distance to buildings were included
as model variables in all diurnal intervals during the
berry season, but not in the pre-berry season (see
Table 4. Bonferroni-corrected responses by free-ranging cattle and brown bears to the model variables of the most parsimonious modelfor the pre-berry and the berry season of 2008, in central Sweden during the diurnal intervals (EM¼00:00-4:59, M¼5:00-9:59, A¼10:00-14:59, E¼15:00-20:59, LE¼21:00-23:59). ’-’ indicates a negative significant effect, ’þ’ indicates a positive significant effect, and 0’s indicateno significant effect. We changed the sign of the responses to the variables ’Creek’, ’Water’, ’Building’, ’Settlement’, ’Track’ and ’Forestroad’ for interpretation purposes. They can now be interpreted as attractant (þ) and avoidant (-).
Variable
Cattle Brown bear
Pre-berry Berry Pre-berry Berry
M A E M A E EM M A E LE EM M A E LE
Bog 0 0 0 0 0 0 0 - - - 0 0 - - - 0
Young open 0 0 0 0 0 0 þ 0 0 þ þ þ 0 - 0 þYoung dense - 0 0 - - 0 þ þ þ þ þ 0 þ þ þ 0
Older - - 0 - - - - 0 - - 0 0 0 0 0 0
Other open 0 þ þ þ þ 0 0 0 0 0 0 0 0 0 0 0
NDVI 0 0 0 0 0 0 0 þ þ þ 0 0 þ þ þ 0
Creek 0 0 0 0 0 0 þ þ þ þ 0 - - 0 - -
Water 0 0 0 0 0 0 0 - 0 0 0 - - 0 - -
Building þ þ 0 0 þ 0 0 0 0 0 0 0 - - - 0
Settlement þ þ þ þ 0 0 0 0 - - 0 0 0 - 0 0
Trail þ 0 0 þ þ þ 0 0 0 0 0 - - - - 0
Forest road 0 þ 0 þ 0 þ 0 0 0 0 0 0 - - - 0
TRI 0 0 0 0 0 0 0 0 0 0 0 0 0 - 0 0
TRI1000 0 0 0 0 0 0 þ 0 0 þ 0 þ 0 0 0 þSlope 0 0 þ 0 0 0 þ þ þ þ 0 þ þ 0 þ 0
396 � WILDLIFE BIOLOGY 17:4 (2011)

Table 5). Parameter estimates with their confidence
intervals for each encounter risk model are present-
ed in Appendix SIV.We considered the estimates of
the prediction errors of the leave-one-out cross
validation to be small (0.113-0.209), especially when
considering themeasurement scale (0-255; see Table
5).
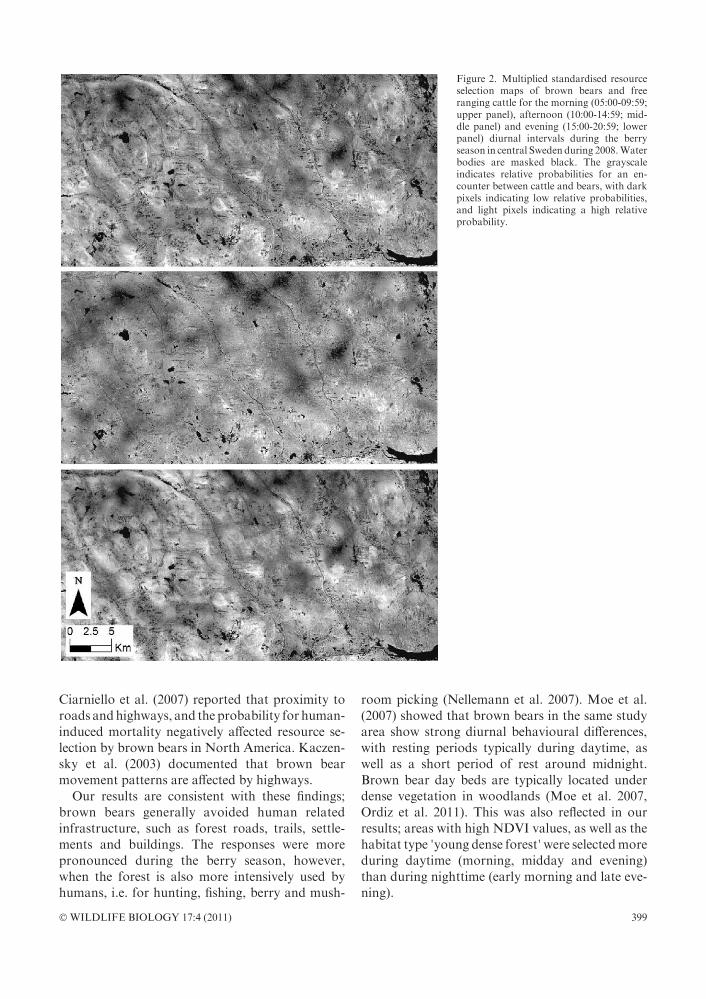
Relative encounter risk modelsWe multiplied resource selection maps of brown
bears and cattle, as a measure of resource selection
similarity of relative encounter risk (Figs. 1 and 2).
The risk for a brown bear-free-ranging cattle
encounter was significantly and negatively affected
by the habitat types ’bog’, ’older forest’ and ’otheropen landscapes’, and significantly and positively
affected by ’young dense forest’ during all diurnal
intervals in both seasons (Table 6). NDVI did not
appear to affect encounter risk during morning in
the pre-berry season, but during all other diurnal
intervals in both seasons, we found a positive effect
ofNDVIon encounter risk (see Table 6).During the
pre-berry season, encounter risk increased with a
decreasing distance to creeks. During the berry
season, this relationship was inverse during morn-
ing and evening, and encounter risk increased with
an increasing distance from creeks (see Table 6).
Except for themorning during the pre-berry season,
encounter risk increased with an increasing distance
from open water such as lakes and rivers. The
general tendency was that encounter risk increased
with decreased distances to human habitation
(buildings, settlements, trails and forest roads).
Forest roads, however, were not included in the
most parsimonious models during the berry season,
indicating that they had no profound effect on
encounter risk during that season. We observed no
clear trends for the effects of terrain ruggedness, on
local or larger scales (TRI1000). Slope steepness,
however, positively affected encounter risk during
midday and evening in the pre-berry season, and
duringmorning and evening in the berry season (see
Table 6).
Discussion
Cattle resource selection
Cattle responses towards the model variables were
relatively consistent during our study period. In
general, cattle resource selection was higher in
proximity to human habitation-related variables
(settlements, buildings, forest roads and trails) and
in the habitat type ’other open’, which comprised
mostly forest pastures. Cattle avoided older forest
and young dense forest. Young open forest and
bogs did not contribute significantly to resource
selection by cattle, probably because these habitat
types do not provide sufficient suitable food for
cattle. Cattle are preferential grazers (Putman
1986), preferring green lush vegetation (Guevara
et al. 1996). This explains the selection for the
habitat class ’other open’, as well as their preferredproximity to forest roads and trails. Pratt et al.
(1986) and Putman (1986) showed that roadside
verges were the most preferred habitat type for
cattle in New Forest, United Kingdom. Roadside
verges are considered important grazing grounds
Table 5. Model formulationof themost parsimonious brownbear-free-ranging cattle encounter riskmodels after a stepwiseAIC selectionprocedure during the pre-berry and the berry season of 2008 in central Sweden. The models were made for each diurnal interval (DI; M¼5:00-9:59, A¼10:00-14:59 and E¼15:00-20:59). D indicates the leave-one-out cross validation estimates of the predictor errors.
DI D Model formulation
Pre-berry M 0.113 Risk ; Bog þ Young dense þ Young open þ Older þ Other open þ NDVI þ Creek þWater þ Building þ Settlement þ Trail þ Forest road
A 0.122 Risk ; Bog þ Young dense þ Older þ Other open þ NDVI þ Creek þ Water þ Buildingþ Settlement þ Trail þ Forest road þ Slope þ TRI þ TRI1000
E 0.117 Risk ; Bog þ Young dense þ Young open þ Older þ Other open þ NDVI þ Creek þWater þ Settlement þ Trail þ Forest road þ Slope þ TRI þ TRI1000
Berry M 0.209 Risk ; Bog þ Young dense þ Young open þ Older þ Other open þ NDVI þ Creek þWater þ Building þ Settlement þ Slope þ TRI þ TRI1000
A 0.171 Risk ; Bog þ Young dense þ Young open þ Older þ Other open þ NDVI þ Creek þWater þ Building þ Trail þ TRI
E 0.192 Risk ; Bog þ Young dense þ Young open þ Older þ Other open þ NDVI þ Creek þWater þ Building þ Settlement þ Trail þ Slope þ TRI þ TRI1000
� WILDLIFE BIOLOGY 17:4 (2011) 397

also in forested parts of Scandinavia, because few
other habitats with high quality foods are available
and the area of forest meadows and pastures have
declined (Anon. 2009). Roath & Krueger (1982)
report on the intensive use of logging roads and
trails by free-ranging cattle in Oregon, USA. They
ascribed this to the use of roads for travel to their
preferred grazing grounds, as well as, but of minor
importance, a grazing habitat itself. Cattle showed
avoidance of young dense forest, a habitat type that
is generally selected by brown bears. In large
predator-free areas, such as the New Forest, United
Kingdom, and the Wolfhezerheide, the Nether-
lands, woodlands are selected by cattle as resting
habitats (Pratt et al. 1986, Bokdam et al. 2003).
Brown bear resource selection
Many studies report on the avoidance of human-
related infrastructure by brown bears. Nelleman et
al. (2007) showed that brown bears in our study area
avoid tourist resorts and villages, and select for
areas that are more rugged, remote and presumably
less disturbed. Also during the critical winter
denning period, brown bears in this area select den
sites in steeper terrain and farther from roads with
higher disturbance potential (Elfstrom et al. 2008).
Figure 1. Multiplied standardised resourceselection maps of brown bears and freeranging cattle for the morning (05:00-09:59;upper panel), afternoon (10:00-14:59; mid-dle panel) and evening (15:00-20:59; lowerpanel) diurnal intervals during the pre-berryseason in central Sweden during 2008.Waterbodies are masked black. The grayscaleindicates relative probabilities for an en-counter between cattle and bears, with darkpixels indicating low relative probabilities,and light pixels indicating a high relativeprobability.
398 � WILDLIFE BIOLOGY 17:4 (2011)
Ciarniello et al. (2007) reported that proximity toroads andhighways, and the probability for human-induced mortality negatively affected resource se-lection by brown bears in North America. Kaczen-sky et al. (2003) documented that brown bearmovement patterns are affected by highways.
Our results are consistent with these findings;brown bears generally avoided human relatedinfrastructure, such as forest roads, trails, settle-ments and buildings. The responses were morepronounced during the berry season, however,when the forest is also more intensively used byhumans, i.e. for hunting, fishing, berry and mush-
room picking (Nellemann et al. 2007). Moe et al.(2007) showed that brown bears in the same studyarea show strong diurnal behavioural differences,with resting periods typically during daytime, aswell as a short period of rest around midnight.Brown bear day beds are typically located underdense vegetation in woodlands (Moe et al. 2007,Ordiz et al. 2011). This was also reflected in ourresults; areas with high NDVI values, as well as thehabitat type ’young dense forest’were selectedmoreduring daytime (morning, midday and evening)than during nighttime (early morning and late eve-ning).
Figure 2. Multiplied standardised resourceselection maps of brown bears and freeranging cattle for the morning (05:00-09:59;upper panel), afternoon (10:00-14:59; mid-dle panel) and evening (15:00-20:59; lowerpanel) diurnal intervals during the berryseason in central Sweden during 2008.Waterbodies are masked black. The grayscaleindicates relative probabilities for an en-counter between cattle and bears, with darkpixels indicating low relative probabilities,and light pixels indicating a high relativeprobability.
� WILDLIFE BIOLOGY 17:4 (2011) 399

Relationship between cattle and bear resource
selection
Our results show a significant negative relationshipbetween resource selection by brown bears and semifree-ranging cattle. This implies that brown bearsavoid areas that are intensively used by cattle andvice versa. The inverse responses to human habita-tion-related infrastructure and dense vegetationmost likely explain this difference. However, wecould not determine whether this negative relation-ship was caused by different foraging requirementsor predator avoidance of the dairy cattle.
We documented a low relative risk of encountersbetween brown bears and semi free-ranging cattle inthe study area. This does not necessarily imply thatpredation does not occur. For example, Bastille-Rousseau et al. (2010) document that Americanblack bears Ursus americanus in Canada apply anopportunistic predation strategy. Black bears didnot select for areas with a high probability toencounter the calves of caribou Rangifer tarandusand moose Alces alces, which are both importantfood items for black bears. They did, however, havea relatively high probability of encountering calves
through frequent movements between preferredhabitat patches (Bastille-Rousseau et al. 2010). Inour study area, bear-induced cattle mortality waslow (, 0.0007% of the semi free-ranging cattlepopulation during 2000-2006), and cattle is insig-nificant in the brown bear diet in our study area.This suggests that bears in our study area do notactively prey upon cattle during day-time, and thatthe relative probability for an encounter is areflection of the resource selection of both bearsand free-ranging cattle.Pratt et al. (1986) and Putman (1986) reported
that cattle are less active at night, and select denservegetated patches to rest and ruminate. Brownbears are more active at night (Moe et al. 2007).Kaczensky (1999) mentioned higher rates of live-stock depredation by large carnivores at night. Thissuggests that potential opportunistic predation bybrown bears may be more pronounced at night.Since free-ranging cattle in Sweden are pennedovernight, potential opportunistic nighttime preda-tion on cattle by brown bears is largely prevented.
Management implications
Brown bears in our study area are mainly activeduring crepuscular and nighttime hours and restduring most of the day (Moe et al. 2007). Becausethe cattle husbandry system allows only daytimefree-ranging of cattle, there is a mismatch betweenthe two species’ activity patterns, which likelyreduces the relative probability of an encounterbetween the two species.The ultimate causes (e.g. predator avoidance,
activity budgets and intrinsic behaviour) of theobserved differences in resource selection betweenthe two species remain unknown. Thus, we cannotrule out that cattle avoid bears, and therefore trade-off between safety and optimal resource selection,which may reduce the cattle’s fitness. Additionalresearch on this topic is therefore required.Various authors (e.g. Horstman & Gunson 1982,
Linnell et al. 1999, Goldstein et al. 2006) report thatdepredation by bears occurs incidentally; and whenrepeated, likely involves the same individual. Ourresults suggest that, with the current dairy cattlehusbandry system, direct interactions betweenbears and dairy cattle are low, which is also reflectedin the low depredation rate. Our results do notsupport the claim that a reduction of the bearpopulationwould help support the summer farming
Table 6. Effects of model variables on the encounter risk betweenbrown bears and free-ranging cattle in the pre-berry and the berryseason of 2008 in central Sweden, during diurnal intervals ofdaytime free-ranging of cattle (M¼5:00-9:59, A¼10:00-14:59, E¼15:00-20:59). ’þ’, ’-’ and 0 indicate Bonferroni corrected significantpositive, negative and no significant effects, respectively. Signs ofthe parameter estimates of the variables ’Creek’, ’Water’,’Building’, ’Settlement’, ’Trail’ and ’Forest road’ were changedfor interpretation purposes. ’NI’ indicates variables that were notincluded in the most parsimonious model.
Variable
Pre-berry season Berry season
M A E M A E
Bog - - - - - -
Young open - NI þ - - 0
Young dense þ þ þ þ þ þOlder - - - - - -
Other open - - - - - -
NDVI 0 þ þ þ þ þCreek þ þ þ - 0 -
Water 0 - - - - -
Building þ þ NI 0 þ -
Settlement þ þ þ þ NI þTrail þ 0 þ NI þ þForest road þ þ þ NI NI NI
TRI NI 0 0 0 - þTRI1000 NI 0 þ 0 NI þSlope 0 þ þ þ NI þ
400 � WILDLIFE BIOLOGY 17:4 (2011)

system. However, with our approach, we cannot
evaluate indirect effects in dairy cattle by bears.
Therefore, research on secondary effects such as e.g.
stress-induced reduction of the milk-yield and
occurrence of mastitis would be required.
Acknowledgements - the Scandinavian Brown Bear Re-search Project is funded by the Swedish EnvironmentalProtection Agency, Norwegian Directorate for NatureManagement, Swedish Association for Hunting andWildlife Management, WWF Sweden and the ResearchCouncil of Norway. For this project, financial supportwas alsoprovidedby theSwedishWildlifeDamageCenterand the Program Adaptive Management of Fish andWildlife. Sam Steyaert was supported by the AustrianScience Fund, project P20182-B17. We are grateful to allvolunteers and students that were involved in data col-lection. This is scientific paper no. 122 from the Scan-dinavian Brown Bear Research Project.
References
Akaike, H. 1973: Information theory and an extension of
the maximum likelihood principle. - In: Petrov, B.N. &
Caski, F. (Eds.); Proceedings of the second international
symposium on information theory, Budapest, Hungary,
pp. 267-281.
Anderson, D.R. 2008: Model based inference in the life
sciences, a primer on evidence. - Springer, New York,
New York, USA, 184 pp.
Anonymous 2007: Rovdjuren och deras forvaltning. - SOU
2007: 89, 680 pp. (In Swedish).
Anonymous 2009:Analys av vaglandskapet iDalarnas lan -
med prioriterade omraden for drift och underhall. -
Vagverket Region Mitt, 2009:93, 72 pp. (In Swedish).
Anonymous 2010: Statens jordbruksverks foreskrifter och
allmanna rad om djurhallning inom lantbruket m.m. -
SJVFS 2010:15, 15 pp. (In Swedish).
Arnemo, J.M. & Fahlman, A. 2007: Biomedical protocols
for free-ranging brown bears, gray wolves, wolverines
and lynx. - Norwegian School of Veterinary Science,
Tromsø, Norway, 18 pp.
Bastille-Rousseau, G, Fortin, D., Dussault, C., Courtois,
R. & Ouellet, J-P. 2010: Foraging strategies by omni-
vores: are black bears actively searching for ungulate
neonates or are they simply opportunistic predators? -
Ecography 34(4): 588-596.
Bates, D.M. & Maechler, M. 2010: lme4: Linear mixed-
effects models using S4 classes. - R package version
0.999375-37, 29 pp. Available at: http://CRAN.
R-project.org/package¼lme4 (Last accessed on 13 Sep-
tember 2011).
Bellemain, E., Swenson, J.E., Tallmon, D., Brunberg, S. &
Taberlet, P. 2005: Estimating population size of elusive
animals with DNA from hunter-collected feces: four
methods for brown bears. - Conservation Biology 19(1):
150-161.
Berger, K.M. 2006: Carnivore-livestock conflicts: effects of
subsidized predator control and economic correlates on
the sheep industry. - Conservation Biology 20(3): 751-
761.
Boitani, L. 2000:Action plan for the conservation ofwolves
inEurope (Canis lupus).Conventionon theConservation
of European Wildlife and Natural Habitats (Bern
Convention). - Nature and environment #113, Council
of Europe Publishing, 84 pp.
Bokdam, J., Gleichman, M.J., Van Wieren, S.E. & Wallis-
DeVries,M.F. 2003: Free-ranging cattle as opportunistic
exploiters of a successional woodland-grassland-heath-
land mosaic. - In: Bokdam, J. (Eds.); Nature Conserva-
tion andGrazingManagement. PhD thesis,Wageningen
University, the Netherlands, 224 pp.
Brown, J.S., Laundre, J.W. & Gurung, M. 1999: The
ecology of fear: optimal foraging, game theory, and
trophic interactions. - Journal of Mammalogy 80: 385-
399.
Burnham, K.P. & Anderson, D.R. 2002: Model selection
and multimodel inference: a practical information-
theoretic approach. 2nd edition. - Springer-Verlag,
New York, New York, USA, 488 pp.
Can, A.E. & Togan, A.N. 2004: Status and management of
brown bears in Turkey. - Ursus 15(1): 48-53.
Chauhan, N.P.S. 2003: Human casualties and livestock
depredation by black and brown bears in the Indian
Himalaya, 1989-98. - Ursus 14(1): 84-87.
Chen, D. & Brutsaert, W. 1998: Satellite-sensed distribu-
tion and spatial patterns of vegetation parameters over a
tallgrass prairie. - Journal of the Atmospheric Sciences
55(7): 1225-1238.
Ciarniello, L.M., Boyce, M.S., Heard, C.D. & Seip, R.D.
2007: Components of grizzly bear habitat selection:
density, habitats, roads, and mortality risk. - Journal of
Wildlife Management 71(5): 1446-1457.
Dahle, B., Sørensen, O.J., Wedul, E.H., Swenson, J.E. &
Sandegren, F. 1998: The diet of brown bearsUrsus arctos
in central Scandinavia: effects of access to free-ranging
domestic sheep Ovis aries. - Wildlife Biology 4(3): 147-
158.
Dahle, B. & Swenson, J.E. 2003: Family breakup in brown
bears: are young forced to leave? - Journal of Mammal-
ogy 84(2): 536-540.
Elfstrom, M. 2005: Regional forvaltningsplan for stora
rovdjur i Dalarnas lan. - Report 2005:13, 67 pp. (In
Swedish).
Elfstrom, M., Swenson, J.E. & Ball, J.P. 2008: Selection of
denning habitats by Scandinavian brown bears Ursus
arctos. - Wildlife Biology 14(2): 176-187.
Ericsson, G., Sandstrom, C., Kindberg, J. & Støen, O-G.
2010: Om svenskars radsla for stora rovdjur, alg och
vildsvin. - Rapport 2010:1, 15 pp. (In Swedish).
ESRI 2007: ArcGIS Desktop: Release 9.2. - Redlands,
� WILDLIFE BIOLOGY 17:4 (2011) 401
California, Environmental System Research Institute,
USA.
Friebe, A., Swenson, J.E. & Sandegren, F. 2001: Denning
chronology of female brown bears in central Sweden. -
Ursus 12: 37-45.
Gamon, J.A., Field, C.B., Goulden, M.L., Griffin, K.L.,
Hartley, A.E., Joel, G., Penuelas, J. &Valentini, R. 1995:
Relationships between NDVI, canopy structure, and
photosynthesis in three Californian vegetation types. -
Ecological Applications 5(1): 28-41.
Goldstein, I., Paisley, S., Wallace, R., Jorgenson, J.P.,
Cuesta, F. & Castellanos, A. 2006: Andean bear-
livestock conflicts: a review. - Ursus 17(1): 8-15.
Guevara, J.C., Stasi, C.R. & Estevez, O.R. 1996: Seasonal
specific selectivity by cattle on rangeland in the Monte
Desert of Mendoze, Argentina. - Journal of Arid
Environments 34: 125-132.
Hiemstra, P.H., Pebesma, E.J., Twenhofel, C.J.W. &
Heuvelink, G.B.M. 2009: Real-time automatic interpo-
lation of ambient gamma dose rates from the Dutch
Radioactivity Monitoring Network. - Computers &
Geosciences 35(8): 1711-1721.
Horstman, L.P.&Gunson, J.R. 1982: Black bear predation
on livestock in Alberta. - Wildlife Society Bulletin 10(1):
34-39.
Hussain, S. 2003:The status of the snow leopard inPakistan
and its conflict with local farmers. - Oryx 37(01): 26-33.
ISRO 2008: Available at: http://www.isro.org/satellites/
irs-p6resourcesat-1.aspx. (Last accessed on 17 Novem-
ber 2010).
Kaczensky, P. 1999: Large carnivore depredation on
livestock in Europe. - Ursus 11: 59-71.
Kaczensky, P., Knauer, F., Krze, B., Jonozovic, M.,
Adamic, M. & Gossow, H. 2003: The impact of high
speed, high volume traffic axes on brown bears in
Slovenia. - Biological Conservation 111(2): 191-204.
Karlsson, J., Svensson, L., Jaxgard, P., Levin,M., Angsteg,
I. & Johansson, O. 2006: Rovdjur, hundar och man-
niskor. - PM till rovdjursutredningen, Viltskadecenter,
74 pp. (In Swedish).
Kindberg, J., Swenson, J.E., Ericsson, G., Bellemain, E.,
Miquel, C. & Taberlet, P. 2011: Estimating population
size and trends of the Swedish brown bear Ursus arctos
population. - Wildlife Biology 17(2): 114-123.
Kluever, B.M., Howery, L.D., Breck, S.W. & Bergman,
D.L. 2009: Predator and heterospecific stimuli alter
behaviour in cattle. - Behavioural Processes 81(1): 85-91.
Knight, R.R. & Judd, S.L. 1983: Grizzly Bears That Kill
Livestock. - In: Zager, P. (Ed.); Bears: Their Biology and
Management. Proceedings of the international associa-
tion for bear research and management 5: 186-190.
Larsson, J. 2009: Fabodvasendet 1550-1920. - PhD thesis,
Sveriges Lantbruksuniversitet, 416 pp. (In Swedish).
Legendre, P. 1993: Spatial Autocorrelation: trouble or new
paradigm? - Ecology 74(6): 1659-1673.
Lidberg, J. 2009: Slutrapport fran projektet fabodbete &
rovdjur i Dalarna. - Falun: Miljovardsenheten, Lans-
styrelsen Dalarnas lan, Sweden, 46 pp. (In Swedish).
Linnell, J.C.D., Odden, J., Smith, M.E., Aanes, R. &
Swenson, J.E. 1999: Large carnivores that kill livestock:
do ’problem individuals’ really exist? - Wildlife Society
Bulletin 27: 698-705.
Manly, B.,McDonald, L., Thomas, D.L., McDonald, T.L.
& Erickson, W.P. 2002: Resource selection by animals:
statistical design and analysis for field studies. - Kluwer
Academic publishers, Dordrecht, the Netherlands, 240
pp.
McCulloch, C.E. & Searle, S.R. 2001: Generalized, Linear
and Mixed Models. - Wiley series in probability and
statistics, John Wiley & Sons, Inc., New York, New
York, USA, 358 pp.
Moe, T.F., Kindberg, J., Jansson, I. & Swenson, J.E. 2007:
Importance of diel behaviour when studying habitat
selection: examples from female Scandinavian brown
bears (Ursus arctos). - Canadian Journal of Zoology
85(4): 518-525.
Murie, A. 1948: Cattle on Grizzly Bear Range. - Journal of
Wildlife Management 12(1): 57-72.
Nellemann, C., Støen, O-G., Kindberg, J., Swenson, J.E.,
Vistnes, I., Ericsson, G., Katajisto, J., Kaltenborn, B.P.,
Martin, J. &Ordiz, A. 2007: Terrain use by an expanding
brown bear population in relation to age, recreational
resorts and human settlements. - Biological Conserva-
tion 138(1-2): 157-165.
Ordiz, A., Støen, O-G., Delibes, M. & Swenson, J.E. 2011:
Predators or prey? Spatio-temporal discrimination of
human-derived risk by brown bears. - Oecologia 166(1):
59-67.
Osborne, P.E., Alonso, J.C. & Bryant, R.G. 2001:
Modelling landscape-scale habitat use using GIS and
remote sensing: a case study with great bustards. -
Journal of Applied Ecology 38: 458-471.
Pasitschniak-Arts, M. 1993: Ursus arctos. - Mammalian
Species 439: 1-10.
Pettorelli, N., Vik, J.O., Mysterud, A., Gaillard, J.A.,
Tucker, C.J. & Stenseth, N.C. 2005: Using the satellite-
derived NDVI to assess ecological responses to environ-
mental change. - Trends in Ecology & Evolution 20(9):
503-510.
Pinheiro, J.C. & Bates, D.M. 2000: Mixed-Effects Models
in S and S-PLUS. - Springer-Verlag, New York, New
York, USA, 528 pp.
Pratt, R.M., Putman, R.J., Ekins, J.R. & Edwards, P.J.
1986: Use of habitat by free-ranging cattle and ponies in
the New Forest, Southern England. - Journal of Applied
Ecology 23: 539-557.
Putman, R.J. 1986: Grazing in temperate ecosystems: large
herbivores and the ecology of New Forest. - Croom
Helm, London, UK, 224 pp.
R Development Core Team 2009: R: A language and
environment for statistical computing. - R Foundation
for Statistical Computing, Vienna, Austria. Available at:
402 � WILDLIFE BIOLOGY 17:4 (2011)
http://www.R-project.org/ (Last accessed on 20 Novem-
ber 2010).
Rajpurohit, K.S. 1999: Child Lifting: Wolves in Hazari-
bagh, India. - Ambio 28(2): 162-166.
Rees, H.V. & Hutson, G.D. 1983: The behaviour of free-
ranging cattle on an alpine range in Australia. - Journal
of Range Management 36(6): 740-743.
Riley, S.J., DeGloria, S.D. & Elliot, R. 1999: A terrain
ruggedness index that quantifies topographic heteroge-
neity. - Intermountain Journal of Sciences 5(1-4): 23-27.
Ripple,W.J. & Beschta, R.L. 2004:Wolves and the ecology
of fear: can predation risk structure ecosystems? -
BioScience 54(8): 755-766.
Roath, L.R. & Krueger, W.C. 1982: Cattle grazing and
behaviour on a forested range. - Journal of Range
Management (35): 332-338.
Rondinini, C. & Boitani, L. 2007: Systematic conservation
planning and the cost of tackling conservation conflicts
with large carnivores in Italy. - Conservation Biology
21(6): 1455-1462.
Servheen, C., Herrero, S. & Bernie, P. 1999: Bears: status
survey and conservation action plan. - IUCN/SSC Bear
and Polar Bear Specialist Groups, IUCN, Gland,
Switzerland and Cambridge, UK, 309 pp.
Sjolander-Lindqvist, A. 2009: Social-natural landscape
reorganised: Swedish forest-edge farmers and wolf
recovery. - Conservation and Society 7: 130-140.
Sjolander-Lindqvist, A., Karlsson, M. & Cinque, S. 2010:
Att jaga varg en studie av 2010 ars licensjakt i Sverige. -
CEFOS Rapport 2010:2, Goteborgs universitet, 64 pp.
(In Swedish).
Swenson, J.E. & Andren, H. 2005: A Tale of Two
Countries: Large Carnivore Depredations and Compen-
sation Schemes in Sweden andNorway. - In: Woodroffe,
R., Thirgood, S. & Rabinowitz, A. (Eds.); People and
Wildlife: Conflict or Co-existence? Cambridge Universi-
ty Press, Cambridge, UK, pp. 323-339.
Swenson, J.E., Dahle, B., Busk, H., Opseth, O.L.E.,
Johansen, T., Søderberg, A., Wallin, K. & Cederlund,
G. 2007: Predation on moose calves by European brown
bears. - Journal of Wildlife Management 71(6): 1993-
1997.
Swenson, J.E., Gertsl, N., Dahle, B. & Zedrosser, A. 2000:
Action plan for the conservation of the brown bear in
Europe (Ursus arctos). -Convention on theConservation
of Wildlife and Natural Habitats (Bern Convention),
Nature and Environment # 114. Council of Europe
Publishing, 69 pp.
Swenson, J.E., Sandegren, F., Søderberg, A., Heim, M.,
Sørensen, O.J., Bjarvall, A., Franzen, R., Wikan, S. &
Wabakken, P. 1999: Interactions between brown bears
and humans in Scandinavia. - Biosphere Conservation
2(1): 1-9.
Swenson, J.E., Wabakken, P., Sandegren, F., Bjarvall, A.,
Franzen, R. & Søderberg, A. 1995: The near extinction
and recovery of brownbears in Scandinavia in relation to
the bear management policies of Norway and Sweden. -
Wildlife Biology 1(1): 11-25.
Vaisefeld, M.A. & Chestin, I.E. 1993: Bears: brown bear,
polar bear, Asian black bear. Distribution, ecology, use
and protection. - Nauka, Moscow, 530 pp. (In Russian
with English summaries).
Viltskadecenter 2010: Viltskadestatistik 2009. Skador av
fredat vilt pa tamdjur, hundar och groda. - Viltskade-
center, Grimsø, Sweden, 26 pp. (In Swedish).
Wanstrom, P. & Dahlin, K. 2008: Jagarnas Riksforbunds
yttrande over betankandet SOU 2007: 89 Rovdjuren och
deras forvaltning, - Available at: http://www.sweden.
gov.se/content/1/c6/10/51/23/5a67e25c.pdf.
Weberyd, H. & von Essen, H. 2009: Forslag till avlysnings-
jakt efter bjorn 2009, 8 pp. (In Swedish).
Woodroffe, R., Thirgood, S. & Rabinowitz, A. 2005:
People and Wildlife: Conflict or Co-existence? - Cam-
bridge University Press, Cambridge, UK, 516 pp.
Zabel, A. & Holm-Muller, K. 2008: Conservation perfor-
mance payments for carnivore conservation in Sweden. -
Conservation Biology 22(2): 247-251.
Zimmermann, B., Wabakken, P. & Dotterer, M. 2003:
Brown bear-livestock conflicts in a bear conservation
zone in Norway: are cattle a good alternative to sheep? -
Ursus 14(1): 72-83.
� WILDLIFE BIOLOGY 17:4 (2011) 403
Related Documents