Ground motions during the 1994 Northridge earthquake W.D. Liam Finn, Carlos E. Ventura, and Norman D. Schuster Abstract: The seismological background of the Northridge earthquake on a blind thrust fault is presented. The extensive data base of recorded ground motion provided the opportunity to review the effectiveness of some widely used attenuation relations for peak horizontal acceleration and pseudo-spectral velocity. Large pulses of velocity and displacement were noted in some records and the potential implications of these for tall buildings are noted. Some major damage centres coincided with alluvial basins. Generation of surface waves within the basins during the main shock contributed to increased amplification and duration. Surface waves were detected at the site of the collapse of the 1-10 interchange and in the damaged area of Sherman Oaks using aftershock data. Cedar Hill seismographic station in Tarzana recorded the highest accelerations of the earthquake, much higher than motions at nearby stations. These are currently attributed to topographic effects of the hill on which the station is located. Aftershock data from two major arrays found that the low amplitude motions were magnified significantly at the crest of the hill compared to motions at the base. Key words: earthquake, thrust fault, ground motion attenuation, fault fling, surface waves, basin effects, topographic effects. RCsurnC : Le cadre sismologique du tremblement de terre de Northridge, qui s'est produit sur une faille chevauchante, est prCsentC. La base de donnees exhaustives relatives aux mouvements du sol enregistrks durant le sCisme, a permis d'examiner l'efficacitk de certaines Cquations d'amortissement utilisCes B grande Cchelle dans le calcul de l'accC1Cration horizontale maximale et de la vitesse pseudospectrale. D'importantes impulsions de vitesse et de dkplacement ont CtC observCes dans certains rapports de sCisme et leurs consCquences possibles pour les bdtiments en hauteur sont discutCes. Certains principaux centres de dommages correspondent B des bassins d'alluvions. La production d'ondes superficielles B I'interieur des bassins durant le choc principal a contribuC B accroitre l'amplification et la duree. Des ondes superficielles ont CtC dCtectCes au lieu d'effondrement de 1'Cchangeur 1-10 ainsi que dans la zone sinistree de Sherman Oaks B l'aide des donnCes de rCplique sismique. La station sismographique de Cedar Hill, B Tarzana, a enregistre les plus fortes accClCrations du tremblement de terre, beaucoup plus ClevCes que les mouvements enregistrCs aux stations plus rapprochCes. Cette situation est attribuable aux effets topographiques de la colline sur laquelle la station est situCe. Les donnees de replique sismique provenant de deux importantes stations complexes indiquent que les mouvements de faible amplitude ont CtC caractCrisCs par une plus grande amplification au sommet de la colline qu'au pied de celle-ci. Mots clis : tremblement de terre, faille chevauchante, amortissement des mouvements du sol, ondes superficielles, effets de bassin, effets topographiques. [Traduit par la rCdaction] Introduction The California Northridge earthquake, Mw = 6.7, occurred on January 17, 1994, at 4:30 a.m. Pacific Standard Time. The epicentre was located about 30 km west-northwest of downtown Los Angeles. The earthquake is the largest of the Received June 21, 1994. Revised manuscript accepted January 5, 1995. W.D.L. Finn, C.E. Ventura, and N.D. Schuster. Department of Civil Engineering, The University of British Columbia, 2324 Main Mall, Vancouver, BC V6T 124, Canada. Written discussion of this paper is welcomed and will be received by the Editor until August 3 1, 1995 (address inside front cover). significant earthquakes that have occurred in the area since the 197 1 San Fernando earthquake, which was also of magni- tude Mw = 6.7. However, the Northridge earthquake was much more damaging because its epicentre was located in a densely populated area and very strong ground motions were generated. A powerful impression of the overall seismic threat to Los Angeles is given by Fig. 1 (EERI 1994), which shows that potential source zones of major earthquakes blanket metropolitan Los Angeles and the surrounding cities. Signifi- cant historical earthquakes that have occurred at these sources are Long Beach 1933, San Fernando 1971, Whittier 1987, and Northridge 1994. The Northridge earthquake triggered a very large number of strong motion instruments throughout southern California, providing the most extensive strong motion data for any earthquake to date. These data will be reviewed here with Can. J. Civ. Eng. 22: 300-315 (1995). Printed in Canada 1 Imprimt au Canada Can. J. Civ. Eng. Downloaded from www.nrcresearchpress.com by China University of Science and Technology on 06/06/13 For personal use only.

Welcome message from author
This document is posted to help you gain knowledge. Please leave a comment to let me know what you think about it! Share it to your friends and learn new things together.
Transcript
Ground motions during the 1994 Northridge earthquake
W.D. Liam Finn, Carlos E. Ventura, and Norman D. Schuster
Abstract: The seismological background of the Northridge earthquake on a blind thrust fault is presented. The extensive data base of recorded ground motion provided the opportunity to review the effectiveness of some widely used attenuation relations for peak horizontal acceleration and pseudo-spectral velocity. Large pulses of velocity and displacement were noted in some records and the potential implications of these for tall buildings are noted. Some major damage centres coincided with alluvial basins. Generation of surface waves within the basins during the main shock contributed to increased amplification and duration. Surface waves were detected at the site of the collapse of the 1-10 interchange and in the damaged area of Sherman Oaks using aftershock data. Cedar Hill seismographic station in Tarzana recorded the highest accelerations of the earthquake, much higher than motions at nearby stations. These are currently attributed to topographic effects of the hill on which the station is located. Aftershock data from two major arrays found that the low amplitude motions were magnified significantly at the crest of the hill compared to motions at the base.
Key words: earthquake, thrust fault, ground motion attenuation, fault fling, surface waves, basin effects, topographic effects.
RCsurnC : Le cadre sismologique du tremblement de terre de Northridge, qui s'est produit sur une faille chevauchante, est prCsentC. La base de donnees exhaustives relatives aux mouvements du sol enregistrks durant le sCisme, a permis d'examiner l'efficacitk de certaines Cquations d'amortissement utilisCes B grande Cchelle dans le calcul de l'accC1Cration horizontale maximale et de la vitesse pseudospectrale. D'importantes impulsions de vitesse et de dkplacement ont CtC observCes dans certains rapports de sCisme et leurs consCquences possibles pour les bdtiments en hauteur sont discutCes. Certains principaux centres de dommages correspondent B des bassins d'alluvions. La production d'ondes superficielles B I'interieur des bassins durant le choc principal a contribuC B accroitre l'amplification et la duree. Des ondes superficielles ont CtC dCtectCes au lieu d'effondrement de 1'Cchangeur 1-10 ainsi que dans la zone sinistree de Sherman Oaks B l'aide des donnCes de rCplique sismique. La station sismographique de Cedar Hill, B Tarzana, a enregistre les plus fortes accClCrations du tremblement de terre, beaucoup plus ClevCes que les mouvements enregistrCs aux stations plus rapprochCes. Cette situation est attribuable aux effets topographiques de la colline sur laquelle la station est situCe. Les donnees de replique sismique provenant de deux importantes stations complexes indiquent que les mouvements de faible amplitude ont CtC caractCrisCs par une plus grande amplification au sommet de la colline qu'au pied de celle-ci.
Mots clis : tremblement de terre, faille chevauchante, amortissement des mouvements du sol, ondes superficielles, effets de bassin, effets topographiques. [Traduit par la rCdaction]
Introduction
The California Northridge earthquake, Mw = 6.7, occurred on January 17, 1994, at 4:30 a.m. Pacific Standard Time. The epicentre was located about 30 km west-northwest of downtown Los Angeles. The earthquake is the largest of the
Received June 21, 1994. Revised manuscript accepted January 5, 1995.
W.D.L. Finn, C.E. Ventura, and N.D. Schuster. Department of Civil Engineering, The University of British Columbia, 2324 Main Mall, Vancouver, BC V6T 124, Canada.
Written discussion of this paper is welcomed and will be received by the Editor until August 3 1, 1995 (address inside front cover).
significant earthquakes that have occurred in the area since the 197 1 San Fernando earthquake, which was also of magni- tude Mw = 6.7. However, the Northridge earthquake was much more damaging because its epicentre was located in a densely populated area and very strong ground motions were generated. A powerful impression of the overall seismic threat to Los Angeles is given by Fig. 1 (EERI 1994), which shows that potential source zones of major earthquakes blanket metropolitan Los Angeles and the surrounding cities. Signifi- cant historical earthquakes that have occurred at these sources are Long Beach 1933, San Fernando 1971, Whittier 1987, and Northridge 1994.
The Northridge earthquake triggered a very large number of strong motion instruments throughout southern California, providing the most extensive strong motion data for any earthquake to date. These data will be reviewed here with
Can. J. Civ. Eng. 22: 300-315 (1995). Printed in Canada 1 Imprimt au Canada
Can
. J. C
iv. E
ng. D
ownl
oade
d fr
om w
ww
.nrc
rese
arch
pres
s.co
m b
y C
hina
Uni
vers
ity o
f Sc
ienc
e an
d T
echn
olog
y on
06/
06/1
3Fo
r pe
rson
al u
se o
nly.
particular emphasis on ground motion attenuation, topo- graphical and basin effects, and response spectra. Much of the data are still unprocessed and therefore detailed studies of many important sites are not yet possible.
The seismological background to the earthquake will be described briefly first. Then the contours of peak accelera- tion for the epicentral region will be presented and some recent attenuation studies will be reviewed. Average normal- ized response spectra will be presented for rock and alluvial sites using the limited number of records that have already been processed. Spectra for a number of sites which showed very high accelerations such as Santa Monica City Hall Grounds, Sylmar, and Newhall will be discussed individually. Special topics such as topographic and basin effects on recorded motions and soil-structure interaction effects are also treated below.
Seismological background
The coordinates of the epicentre of the Northridge earthquake are 34.209"N and 118.541 OW. Scientists at the California Institute of Technology assigned a local magnitude, ML, of 6.4 and a moment magnitude, Mw, of 6.7 to the earthquake. The National Earthquake Information Center (NEIC) assigned a surface wave magnitude, Ms, of 6.8 (Shakal et al. 1994). The earthquake occurred at a focal depth of 19 km on a fault striking N60°W and dipping towards the south at an angle of 35" -45" (Shakal et al. 1994). The south dipping fault plane is consistent with south dipping planes known from oil explo-
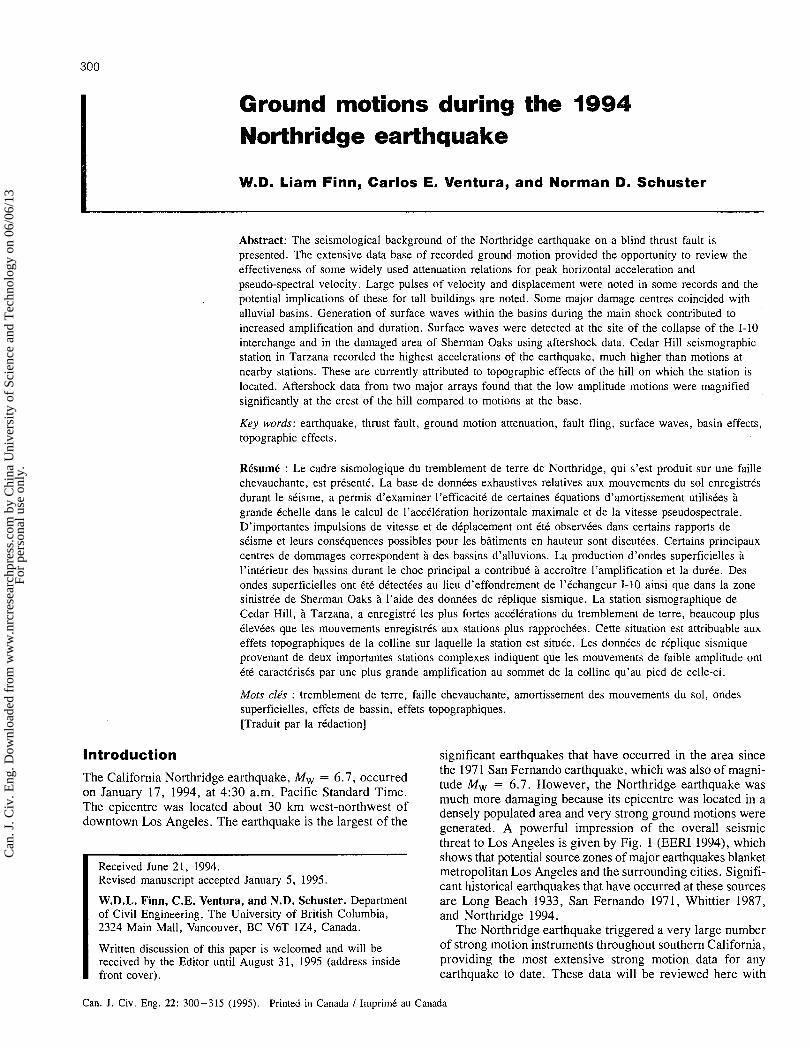
Fig. 2. Preliminary cross section of Northridge fault (after Ando and Irikura 1994).
San Gabriel Mountains
S Santa Monica Mountains
ration in the northern San Fernando Valley. These faults may be part of the Oakridge fault system (CSL 1994). A simpli- fied cross section of the fault region is shown in Fig. 2 (Ando and Irikura 1994). The section illustrates the key structural aspects of the event. At that time, estimates of the focal depth were about 18 km.
Thio and Kanamori (1994) studied the complexity of the source using P and S waves and concluded that there were three subevents with intervals of 2 s between them. They occurred successively at depths of 19, 17, and 13 km. The upward propagation of the subevents is consistent with the distribution of aftershocks which are shallower and to the north of the main shock. Thio and Kanamori (1994) suggested a slip of about 2 m on the fault.
Can
. J. C
iv. E
ng. D
ownl
oade
d fr
om w
ww
.nrc
rese
arch
pres
s.co
m b
y C
hina
Uni
vers
ity o
f Sc
ienc
e an
d T
echn
olog
y on
06/
06/1
3Fo
r pe
rson
al u
se o
nly.
302 Can. J. Civ. Eng. Vol. 22, 1995
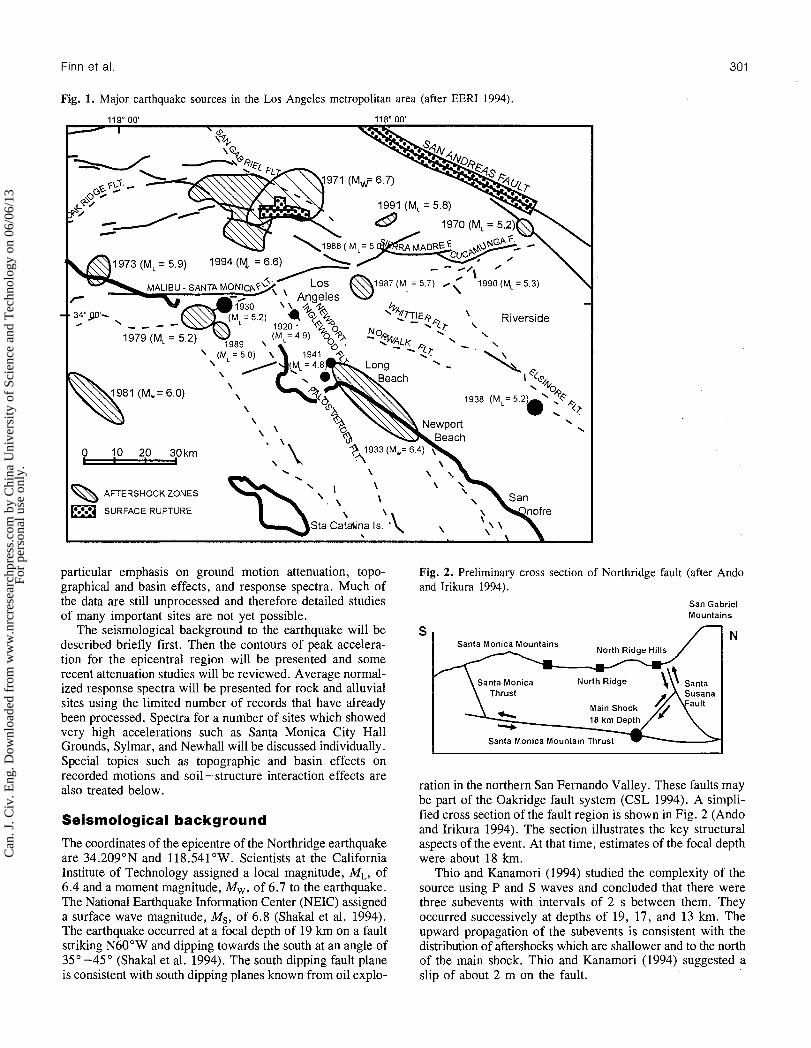
Fig. 3. Distribution of aftershocks in the failure zone (after USC, USGS, and SCEC 1994).
nta Susana Mtns
Potrero Canvon
Castaic Junction
Santa Monica Mtns San Fernando Valley Santa Susana Mtns Castaic Junction
The aftershock zone extends 30 km east -west, from San Fernando to Santa Susana, and from Northridge in the south to the Santa Clara Valley in the north (CSL and USGS 1994). As shown in Fig. 3, aftershocks occurred on the main rup- ture surface (CSL, USGS, and SCEC 1994). Some aftershocks are reported to have occurred on the 1971 San Fernando rupture surface.
The aftershocks of the Northridge earthquake followed the normal pattern for California aftershock sequences. The largest aftershock had a magnitude ML = 6.0 and five aftershocks had magnitudes in the range 5.0 < ML < 5.7 (Trifunac et al. 1994). Both the magnitude distribution and the decay rate were as expected. Generally, the rate of decay is inversely proportional to the time, so that at day N after the earth- quake, the expected number of aftershocks is 1/N times the number of aftershocks on the first day (EERI 1994).
The thrust mechanism of the earthquake is consistent with the north-south compressive deformations of the Transverse Ranges caused by the big bend in the San Andreas fault in the region. The rupture propagated upwards from the focus towards the northeast. Shakal et al. (1994) inferred that the rupture stopped 5 km below the surface. The lack of a sur- face break is consistent with well data from the northern San Fernando Valley which shows that the south dipping faults there have not moved at or near the surface in half a million years (CSL 1994). It is also consistent with the distribution of aftershocks on the cross section shown in Fig. 3 (CSL, USGS, and SCEC 1994).
The Northridge earthquake occurred on a blind thrust fault. In the last 10 years, a number of major earthquakes have occurred on buried faults in the U.S.A. In California, no surface fault was associated with the following recent earth- quakes (Stein 1994):
1983, M = 6.5, Coalinga, eastern margin of the Cali- fornia Coast Ranges; 1985, M = 6.0, Kettelman Hills, eastern margin of the Coast Ranges:
1987, M = 6.0, Whittier Narrows, Los Angeles basin; 1992, M = 6.0, Sierra Madre, San Gabriel Mountains; 1992, M = 7.0, Cape Mendocino shock, Mendocino Triple Junction.
These earthquakes involved slips on buried faults at depths below young folding. Stein (1994) generalized from these data that folds develop sporadically during earthquakes on the buried faults rather than by slow progressive deforma- tion. This implies that active folds must now be included in the list of potential earthquake sources. As pointed out by Jackson (1994), the estimation of seismic hazard should reflect the results of regional deformation studies in addition to surface fault mapping.
Ground motions: unprocessed
There are three main sources of data on the ground motions associated with the Northridge earthquake. (1) California Strong Motion Instrumentation Program
(CSMIP) stations. These stations are maintained by the CSMIP of the California Division of Mines and Geology (CDMG).
(2) National Strong Motion Program (NSMP) stations. This network is a cooperative effort between the U.S. Geolog- ical Survey (USGS) and other parties in southern Cali- fornia, including the following: ( i ) U.S. Army Corps of Engineers (AE); (ii) Metropolitan Water District of Southern California (MWD); (iii) U.S. Department of Veteran Affairs (VA); (iv) Individual Building Owners (CODE); and (v) U.S. Department of Energy (DOE).
(3) Los Angeles Strong Motion Accelerograph Network (LASMAN). The array consists of about 80 ground response stations maintained by the University of Southern California (USC).
Many records from the Northridge earthquake were recorded on digital instruments. Digital records permit a more accurate determination of ground velocity and displace-
Can
. J. C
iv. E
ng. D
ownl
oade
d fr
om w
ww
.nrc
rese
arch
pres
s.co
m b
y C
hina
Uni
vers
ity o
f Sc
ienc
e an
d T
echn
olog
y on
06/
06/1
3Fo
r pe
rson
al u
se o
nly.
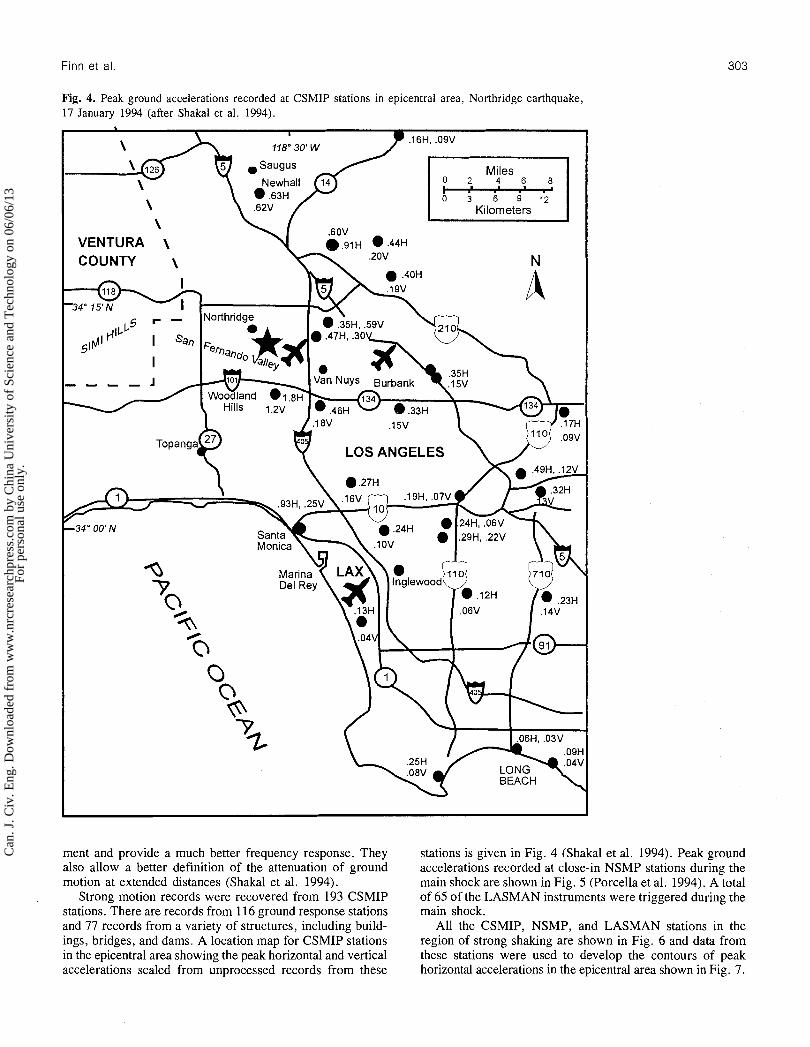
Fig. 4. Peak ground accelerations recorded at CSMIP stations in epicentral area, Northridge earthquake, 17 January 1994 (after Shakal et al. 1994).
VENTURA \ COUNTY \
LOS ANGELES
ment and provide a much better frequency response. They also allow a better definition of the attenuation of ground motion at extended distances (Shakal et al. 1994).
Strong motion records were recovered from 193 CSMIP stations. There are records from 116 ground response stations and 77 records from a variety of structures, including build- ings, bridges, and dams. A location map for CSMIP stations in the epicentral area showing the peak horizontal and vertical accelerations scaled from unprocessed records from these
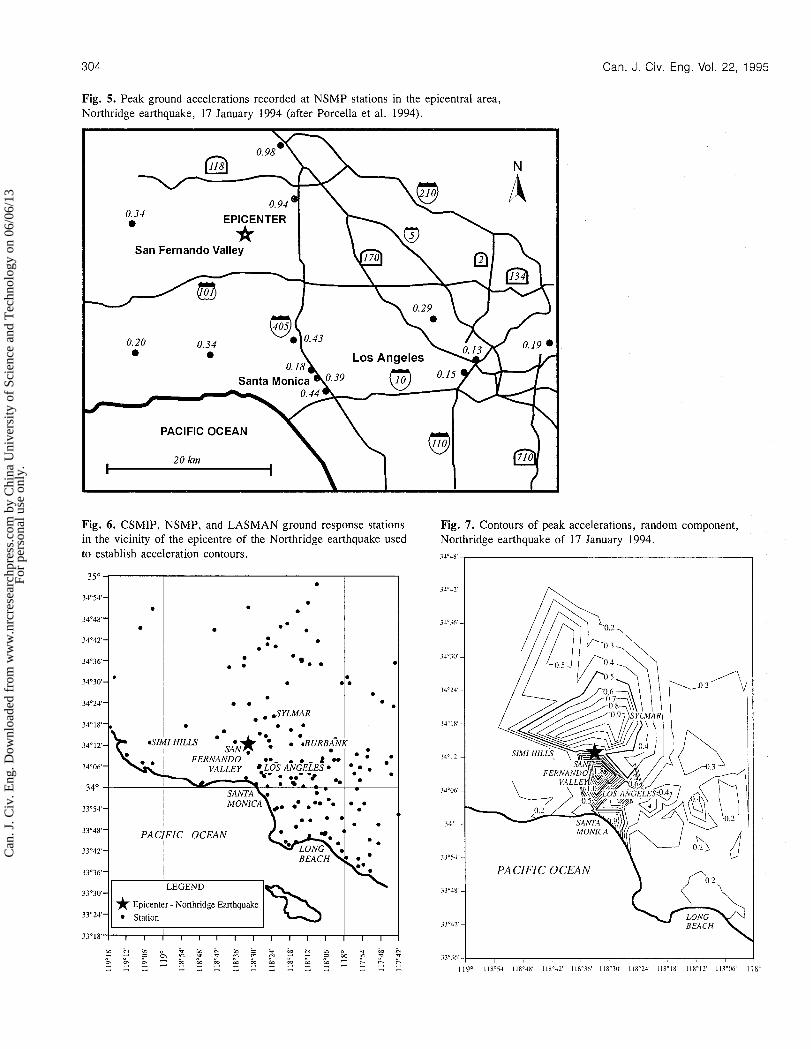
stations is given in Fig. 4 (Shakal et al. 1994). Peak ground accelerations recorded at close-in NSMP stations during the main shock are shown in Fig. 5 (Porcella et al. 1994). A total of 65 of the 1,ASMAN instruments were triggered during the main shock.
All the CSMIP, NSMP, and LASMAN stations in the region of strong shaking are shown in Fig. 6 and data froin these stations were used to develop the contours of peak horizontal accelerations in the epicentral area shown in Fig. 7.
Can
. J. C
iv. E
ng. D
ownl
oade
d fr
om w
ww
.nrc
rese
arch
pres
s.co
m b
y C
hina
Uni
vers
ity o
f Sc
ienc
e an
d T
echn
olog
y on
06/
06/1
3Fo
r pe
rson
al u
se o
nly.
Can. J. Civ. Eng. Vol. 22, 1995
Fig. 5. Peak ground accelerations recorded at NSMP stations in the epicentral area, Northridge earthquake, 17 January 1994 (after Porcella et al. 1994).
San Fernando Valley
PACIFIC OCEAN
Fig. 6. CSMIP, NSMP, and LASMAN ground response stations in the vicinity of the epicentre of the Northridge earthquake used to establish acceleration contours.
* Epicenter - Northridge Earthquake
34'24'-
34"18'-.
34'12'-
34'06'-
34"
Fig. 7. Contours of peak accelerations, random component, Northridge earthquake of 17 January 1994.
.SIMI
. .SYLMAR
* . * HILLS
VALLEY Z'ob A ~ E L E S ;* . - 8 ** s.,
SANTA \. I
-
Can
. J. C
iv. E
ng. D
ownl
oade
d fr
om w
ww
.nrc
rese
arch
pres
s.co
m b
y C
hina
Uni
vers
ity o
f Sc
ienc
e an
d T
echn
olog
y on
06/
06/1
3Fo
r pe
rson
al u
se o
nly.
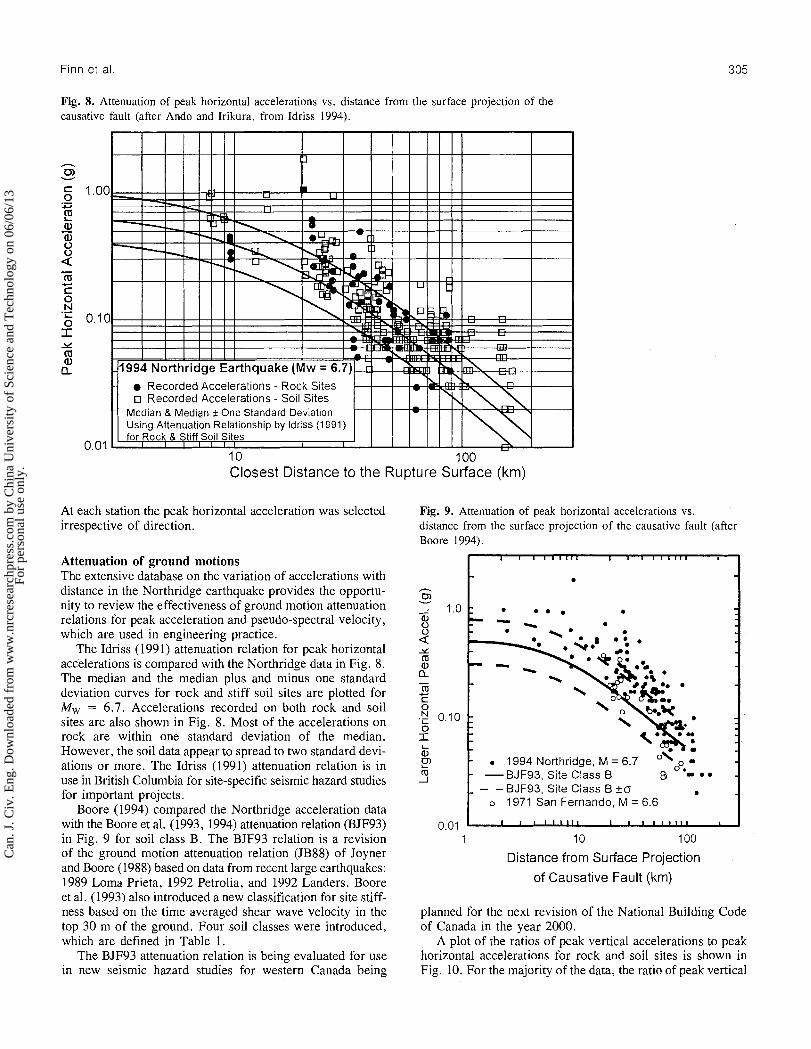
Fig. 8. Attenuation of peak horizontal accelerations vs. distance from the surface projection of the causative fault (after Ando and Irikura, from Idriss 1994).
.oo
. I 0
Recorded Accelerations - Rock Sites
.O1 10 100 Closest Distance to the Rupture Surface (km)
At each station the peak horizontal acceleration was selected Fig. 9. Attenuation of peak horizontal accelerations vs. irrespective of direction. distance from the surface projection of the causative fault (after
Boore 1994).
Attenuation of ground motions The extensive database on the variation of accelerations with distance in the Northridge earthquake provides the opportu- nity to review the effectiveness of ground motion attenuation relations for peak acceleration and pseudo-spectral velocity, which are used in engineering practice.
The Idriss (1991) attenuation relation for peak horizontal accelerations is compared with the Northridge data in Fig. 8. The median and the median plus and minus one standard deviation curves for rock and stiff soil sites are plotted for Mw = 6.7. Accelerations recorded on both rock and soil sites are also shown in Fig. 8. Most of the accelerations on rock are within one standard deviation of the median. However, the soil data appear to spread to two standard devi- ations or more. The Idriss (1991) attenuation relation is in use in British Columbia for site-specific seismic hazard studies for important projects.
Boore (1994) compared the Northridge acceleration data with the Boore et al. (1993, 1994) attenuation relation (BJF93) in Fig. 9 for soil class B. The BJF93 relation is a revision of the ground motion attenuation relation (JB88) of Joyner and Boore (1988) based on data from recent large earthquakes: 1989 Loma Prieta, 1992 Petrolia, and 1992 Landers. Boore et al. (1993) also introduced a new classification for site stiff- ness based on the time averaged shear wave velocity in the top 30 m of the ground. Four soil classes were introduced, which are defined in Table 1.
The BJF93 attenuation relation is being evaluated for use in new seismic hazard studies for western Canada being
0.01 1 10 100
Distance from Surface Projection
I 1 l 1 l l I l 1 I I I 1 1 1 1 1 1
- -
0 . - - II
-
- - - BJF93, Site Class B f o o 1971 S a n Fernando, M = 6.6
I I 1 1 1 1 1 1 1 I 1 1 1 1 1 1 1 1 1
of Causative Fault (km)
planned for the next revision of the National Building Code of Canada in the year 2000.
A plot of the ratios of peak vertical accelerations to peak horizontal accelerations for rock and soil sites is shown in Fig. 10. For the majority of the data, the ratio of peak vertical
Can
. J. C
iv. E
ng. D
ownl
oade
d fr
om w
ww
.nrc
rese
arch
pres
s.co
m b
y C
hina
Uni
vers
ity o
f Sc
ienc
e an
d T
echn
olog
y on
06/
06/1
3Fo
r pe
rson
al u
se o
nly.
Can. J. Civ. Eng. Vol. 22, 1995
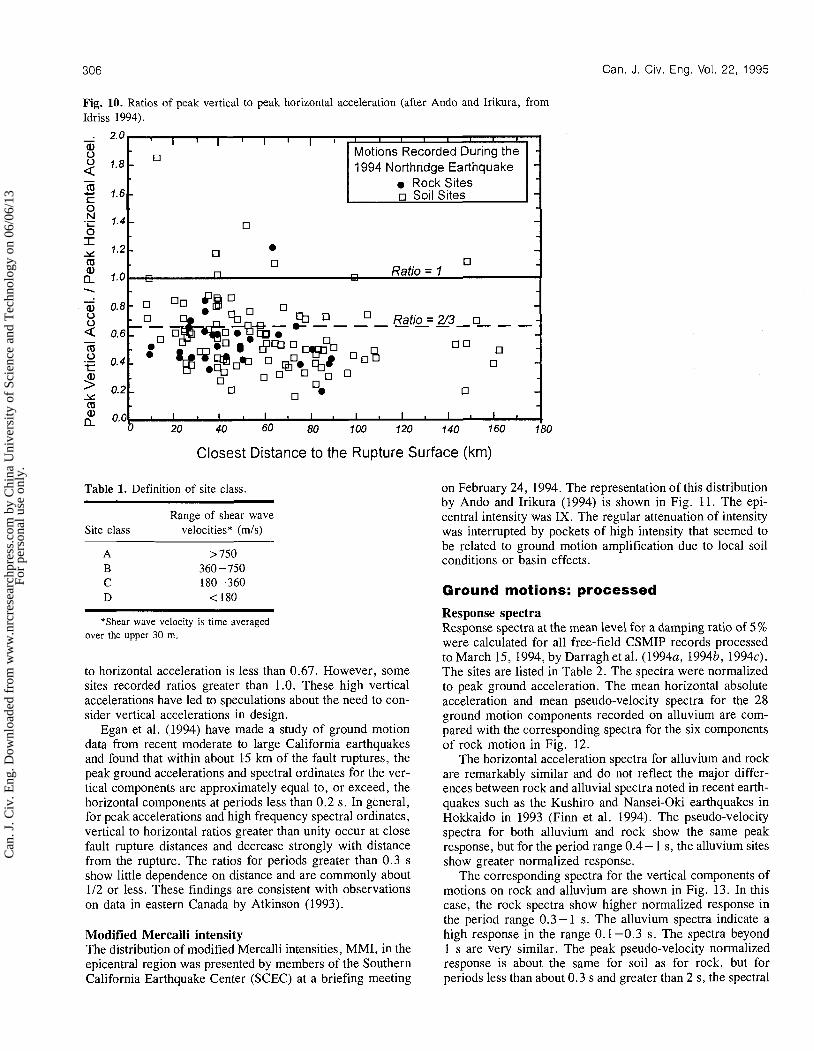
Fig. 10. Ratios of peak vertical to peak horizontal acceleration (after Ando and Irikura, from Idriss 1994).
2.0 I ' I ' I ' I ' " " " " - I Motions Recorded During the 1 1 . 8 I 1994 Northridge ~ a r t h ~ u s k e I 1
Rock Sites Soil Sites
1.2 - - 1.0. =: n r, Ratio = I -
Closest Distance to the Rupture Surface (km)
Table 1. Definition of site class.
Range of shear wave Site class velocities* (mls)
*Shear wave velocity is time averaged over the upper 30 m.
to horizontal acceleration is less than 0.67. However, some sites recorded ratios greater than 1 .O. These high vertical accelerations have led to speculations about the need to con- sider vertical accelerations in design.
Egan et al. (1994) have made a study of ground motion data from recent moderate to large California earthquakes and found that within about 15 km of the fault ruptures, the peak ground accelerations and spectral ordinates for the ver- tical components are approximately equal to, or exceed, the horizontal components at periods less than 0.2 s. In general, for peak accelerations and high frequency spectral ordinates, vertical to horizontal ratios greater than unity occur at close fault rupture distances and decrease strongly with distance from the rupture. The ratios for periods greater than 0.3 s show little dependence on distance and are commonly about 112 or less. These findings are consistent with observations on data in eastern Canada by Atkinson (1993).
Modified Mercalli intensity The distribution of modified Mercalli intensities, MMI, in the epicentral region was presented by members of the Southern California Earthquake Center (SCEC) at a briefing meeting
on February 24, 1994. The representation of this distribution by Ando and Irikura (1994) is shown in Fig. 11. The epi- central intensity was IX. The regular attenuation of intensity was interrupted by pockets of high intensity that seemed to be related to ground motion amplification due to local soil conditions or basin effects.
Ground motions: processed
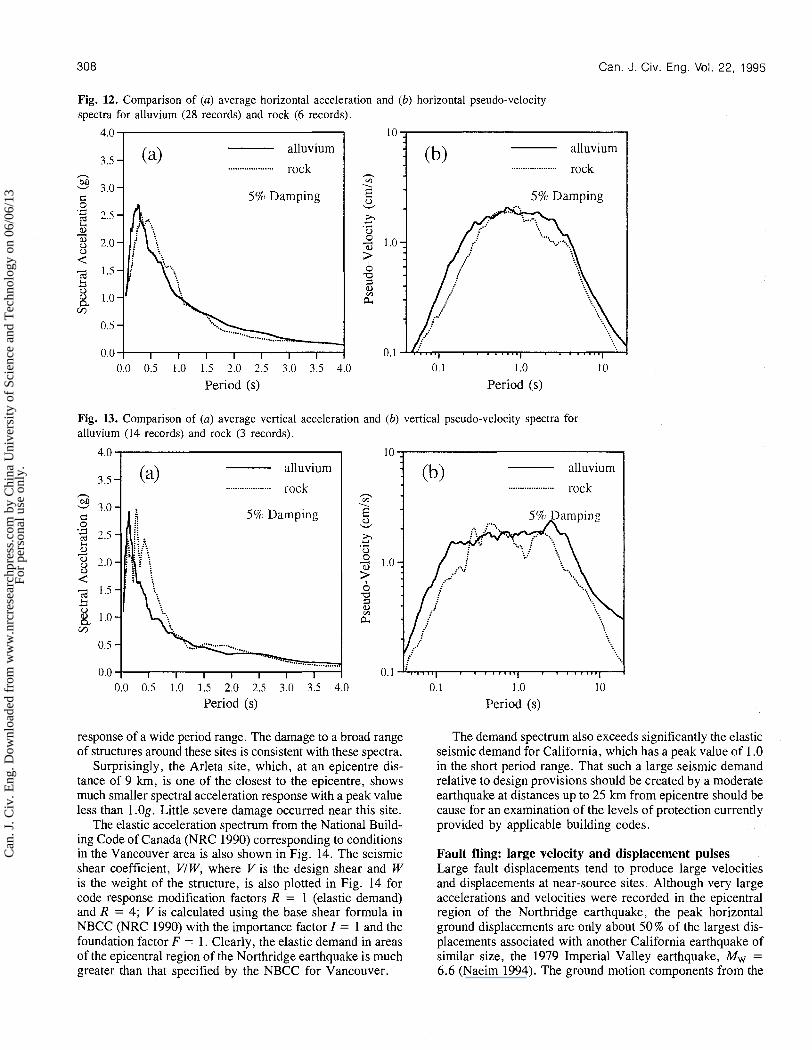
Response spectra Response spectra at the mean level for a damping ratio of 5 % were calculated for all free-field CSMIP records processed to March 15, 1994, by Darragh et al. (1994a, 19946, 1994~). The sites are listed in Table 2. The spectra were normalized to peak ground acceleration. The mean horizontal absolute acceleration and mean pseudo-velocity spectra for the 28 ground motion components recorded on alluvium are com- pared with the corresponding spectra for the six components of rock motion in Fig. 12.
The horizontal acceleration spectra for alluvium and rock are remarkably similar and do not reflect the major differ- ences between rock and alluvial spectra noted in recent earth- quakes such as the Kushiro and Nansei-Oki earthquakes in Hokkaido in 1993 (Finn et al. 1994). The pseudo-velocity spectra for both alluvium and rock show the same peak response, but for the period range 0.4 - 1 s, the alluvium sites show greater normalized response.
The corresponding spectra for the vertical components of motions on rock and alluvium are shown in Fig. 13. In this case, the rock spectra show higher normalized response in the period range 0.3 - 1 s. The alluvium spectra indicate a high response in the range 0.1-0.3 s. The spectra beyond 1 s are very similar. The peak pseudo-velocity normalized response is about the same for soil as for rock, but for periods less than about 0.3 s and greater than 2 s, the spectral
Can
. J. C
iv. E
ng. D
ownl
oade
d fr
om w
ww
.nrc
rese
arch
pres
s.co
m b
y C
hina
Uni
vers
ity o
f Sc
ienc
e an
d T
echn
olog
y on
06/
06/1
3Fo
r pe
rson
al u
se o
nly.
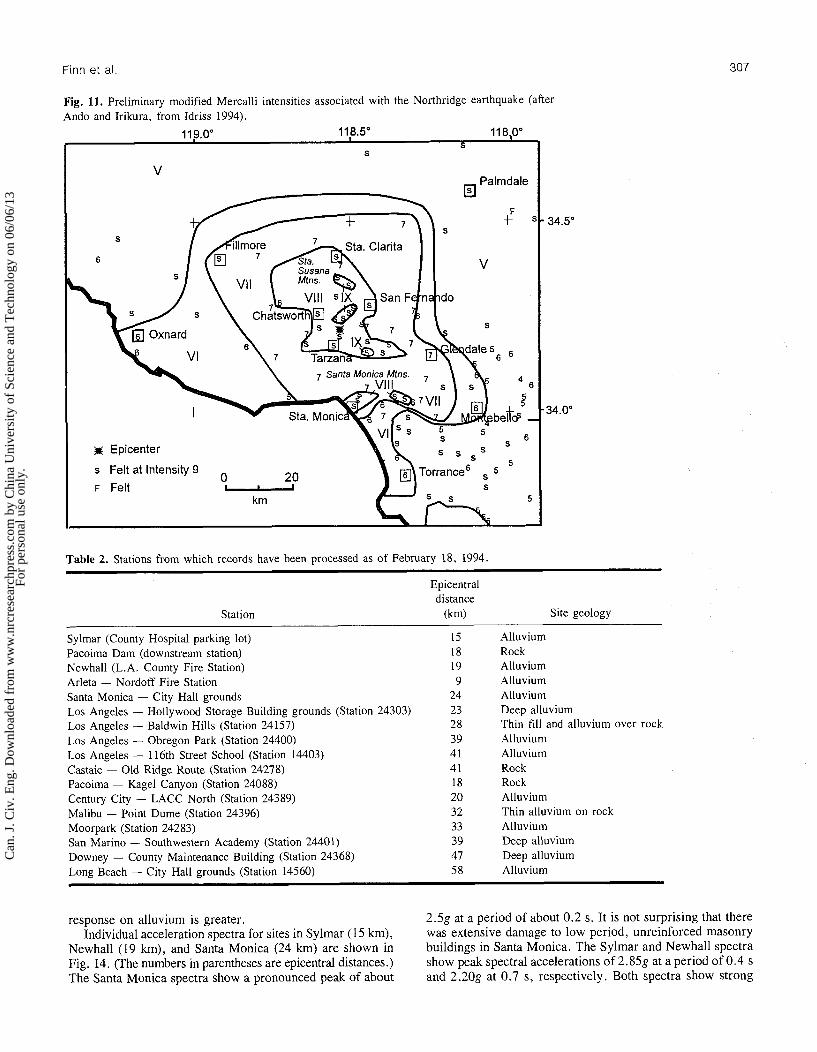
Table 2. Stations from which records have been processed as of February 18, 1994.
Station
Epicentral distance
(km) Site geology
Sylmar (County Hospital parking lot) 15 Pacoima Dam (downstream station) 18 Newhall (L.A. County Fire Station) 19 Arleta - Nordoff Fire Station 9 Santa Monica - City Hall grounds 24 Los Angeles - Hollywood Storage Building grounds (Station 24303) 23 Los Angeles - Baldwin Hills (Station 24157) 28 Los Angeles - Obregon Park (Station 24400) 39 Los Angeles - 116th Street School (Station 14403) 41 Castaic - Old Ridge Route (Station 24278) 41 Pacoima - Kagel Canyon (Station 24088) 18 Century City - LACC North (Station 24389) 20 Malibu - Point Dume (Station 24396) 32 Moorpark (Station 24283) 33 San Marino - Southwestern Academy (Station 24401) 39 Downey - County Maintenance Building (Station 24368) 47 Long Beach - City Hall grounds (Station 14560) 5 8
Alluvium Rock Alluvium Alluvium Alluvium Deep alluvium Thin fill and alluvium over rock Alluvium Alluvium Rock Rock Alluvium Thin alluvium on rock Alluvium Deep alluvium Deep alluvium Alluvium
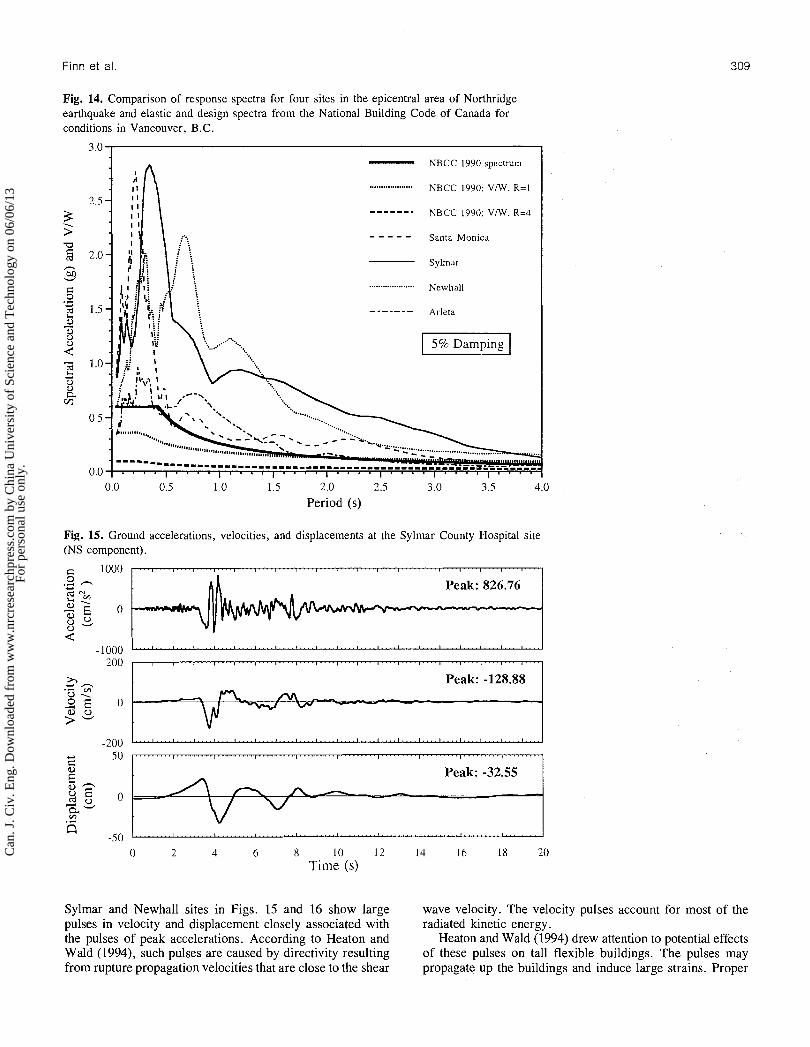
response on alluvium is greater. 2.5g at a period of about 0.2 s. It is not surprising that there Individual acceleration spectra for sites in Sylmar ( I5 km), was extensive damage to low period, unreinforced masonry
Newhall (19 km), and Santa Monica (24 km) are shown in buildings in Santa Monica. The Sylmar and Newhall spectra Fig. 14. (The numbers in parentheses are epicentral distances.) show peak spectral accelerations of 2.85g at a period of 0.4 s The Santa Monica spectra show a pronounced peak of about and 2.20g at 0.7 s, respectively. Both spectra show strong
Can
. J. C
iv. E
ng. D
ownl
oade
d fr
om w
ww
.nrc
rese
arch
pres
s.co
m b
y C
hina
Uni
vers
ity o
f Sc
ienc
e an
d T
echn
olog
y on
06/
06/1
3Fo
r pe
rson
al u
se o
nly.
Can. J. Civ. Eng. Vol. 22, 1995
Fig. 12. Comparison of (a) average horizontal acceleration and (b) horizontal pseudo-velocity spectra for alluvium (28 records) and rock (6 records).
4.0 I 10 -I
: (b) alluvium
.................... rock
5% Damping
3.5 - h
M 3.0-
c
0.0 0.5 1.0 1.5 2.0 2.5 3.0 3.5 4.0 0.1 1 .O 10
Period (s) Period (s)
(a) alluvium .................... rock
5%) Damping
Fig. 13. Comparison of (a) average vertical acceleration and (b) vertical pseudo-velocity spectra for alluvium (14 records) and rock (3 records).
0.0 I I I I I I I
(a) alluvium 3.5 - ....................
n rock
5%) Damping
.........
0.0 I I I I I I I
0.0 0.5 1.0 1.5 2.0 2.5 3.0 3.5 4.0
Period (s)
response of a wide period range. The damage to a broad range of structures around these sites is consistent with these spectra.
Surprisingly, the Arleta site, which, at an epicentre dis- tance of 9 h, is one of the closest to the epicentre, shows much smaller spectral acceleration response with a peak value less than 1.0g. Little severe damage occurred near this site.
The elastic acceleration spectrum from the National Build- ing Code of Canada (NRC 1990) corresponding to conditions in the Vancouver area is also shown in Fig. 14. The seismic shear coefficient, VIW, where V is the design shear and W is the weight of the structure, is also plotted in Fig. 14 for code response modification factors R = 1 (elastic demand) and R = 4; V is calculated using the base shear formula in NBCC (NRC 1990) with the importance factor I = 1 and the foundation factor F = 1. Clearly, the elastic demand in areas of the epicentral region of the Northridge earthquake is much greater than that specified by the NBCC for Vancouver.
i (b) alluvium
.................... rock
I ' ' ' ' ""I ' ' ' " " I
0.1 1 .o 10
Period (s)
The demand spectrum also exceeds significantly the elastic seismic demand for California, which has a peak value of 1.0 in the short period range. That such a large seismic demand relative to design provisions should be created by a moderate earthquake at distances up to 25 h from epicentre should be cause for an examination of the levels of protection currently provided by applicable building codes.
Fault fling: large velocity and displacement pulses Large fault displacements tend to produce large velocities and displacements at near-source sites. Although very large accelerations and velocities were recorded in the epicentral region of the Northridge earthquake, the peak horizontal ground displacements are only about 50% of the largest dis- placements associated with another California earthquake of similar size, the 1979 Imperial Valley earthquake, Mw = 6.6 (Naeim 1994). The ground motion components from the
Can
. J. C
iv. E
ng. D
ownl
oade
d fr
om w
ww
.nrc
rese
arch
pres
s.co
m b
y C
hina
Uni
vers
ity o
f Sc
ienc
e an
d T
echn
olog
y on
06/
06/1
3Fo
r pe
rson
al u
se o
nly.
Finn et al.
Fig. 14. Comparison of response spectra for four sites in the epicentral area of Northridge earthquake and elastic and design spectra from the National Building Code of Canada for conditions in Vancouver, B.C.
3.0 - NBCC 1990 spectrum
,,.,,,,,.,,.,,~,,., NBCC 1990; VIW, K=l
------. NBCC 1990; VIW, K=4
- - - - - Santa Monica
. . . . . . . . . . . . . . . . . . . . Newhall
------- Arleta
0.0 0.5 1 .O 1 .S 2.0 2.5 3 .O 3.5 4.0
Period (s)
Fig. 15. Ground accelerations, velocities, and displacements at the Sylmar County Hospital site (NS component).
c 1000 . . . r . . . - l . - . . - - . . . I . . - r . . . I . . 7 - L L T I I I
.s? n a Peak: 826.76 e Nv, 2 2 0 g 2. d
-1000 . . . . . . . . . . . . . . . . . . . . . . . . . . . . . . . . . . . . . . . . . . . . . . . . . . . . . . . . . . . . . . . . . . . . . . . . . . . . . .
200
Peak: -128.88
8 1 0 Time (s)
Peak: -32.55 5 Sylmar and Newhall sites in Figs. 15 and 16 show large wave velocity. The velocity pulses account for most of the pulses in velocity and displacement closely associated with radiated kinetic energy. the pulses of peak accelerations. According to Heaton and Heaton and Wald (1994) drew attention to potential effects Wald (1994), such pulses are caused by directivity resulting of these pulses on tall flexible buildings. The pulses may from rupture propagation velocities that are close to the shear propagate up the buildings and induce large strains. Proper
Can
. J. C
iv. E
ng. D
ownl
oade
d fr
om w
ww
.nrc
rese
arch
pres
s.co
m b
y C
hina
Uni
vers
ity o
f Sc
ienc
e an
d T
echn
olog
y on
06/
06/1
3Fo
r pe
rson
al u
se o
nly.
Can. J. Civ. Eng. Vol. 22, 1995
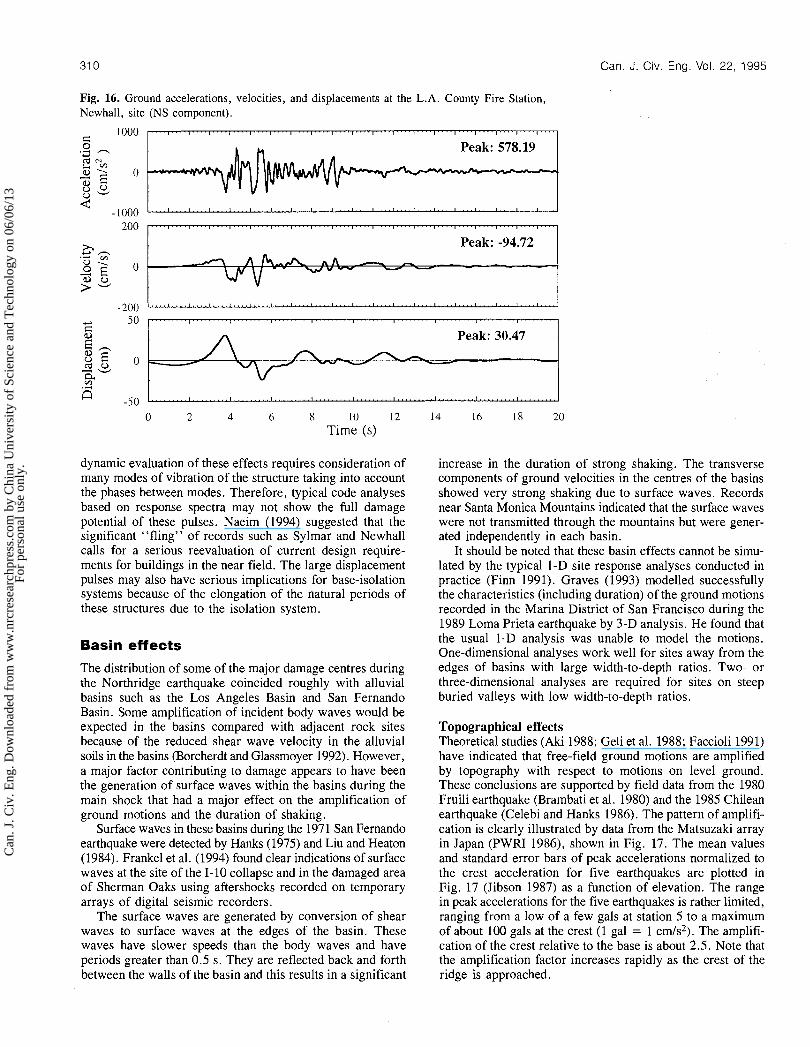
Fig. 16. Ground accelerations, velocities, and displacements at the L.A. County Fire Station, Newhall, site (NS component).
C 1000
0 '3 " 1 ' '
Peak: 578.19
I . _ . . ~ . . . . I . . . . I . . . . I . . . . I . _ _ _ I . l . . . . l ~ . . . l . . _ . . I . . . . I . . . . I . . . I A
Peak: -94.72 e I I I ' I I . I L ' -
Peak: 30.47 A 7
I . . . . . . . . I I I . . I . . . . . I . . I _ L Y . . I . . . . . . . . . I . . . . . . I . . l I . . 1 . . . . 1 1 . . . . . . . 1 . . . . . . . . . . .
0 2 4 6 8 10 12 14 16 18 20 Time (s)
dynamic evaluation of these effects requires consideration of many modes of vibration of the structure taking into account the phases between modes. Therefore, typical code analyses based on response spectra may not show the full damage potential of these pulses. Naeim (1994) suggested that the significant "fling" of records such as Sylmar and Newhall calls for a serious reevaluation of current design require- ments for buildings in the near field. The large displacement pulses may also have serious implications for base-isolation systems because of the elongation of the natural periods of these structures due to the isolation system.
Basin effects
The distribution of some of the major damage centres during the Northridge earthquake coincided roughly with alluvial basins such as the Los Angeles Basin and San Fernando Basin. Some amplification of incident body waves would be expected in the basins compared with adjacent rock sites because of the reduced shear wave velocity in the alluvial soils in the basins (Borcherdt and Glassmoyer 1992). However, a major factor contributing to damage appears to have been the generation of surface waves within the basins during the main shock that had a major effect on the amplification of ground motions and the duration of shaking.
Surface waves in these basins during the 197 1 San Fernando earthquake were detected by Hanks (1975) and Liu and Heaton (1984). Frankel et al. (1994) found clear indications of surface waves at the site of the 1-10 collapse and in the damaged area of Sherman Oaks using aftershocks recorded on temporary arrays of digital seismic recorders.
The surface waves are generated by conversion of shear waves to surface waves at the edges of the basin. These waves have slower speeds than the body waves and have periods greater than 0.5 s. They are reflected back and forth between the walls of the basin and this results in a significant
increase in the duration of strong shaking. The transverse components of ground velocities in the centres of the basins showed very strong shaking due to surface waves. Records near Santa Monica Mountains indicated that the surface waves were not transmitted through the mountains but were gener- ated independently in each basin.
It should be noted that these basin effects cannot be simu- lated by the typical I-D site response analyses conducted in practice (Finn 199 1). Graves (1993) modelled successfully the characteristics (including duration) of the ground motions recorded in the Marina District of San Francisco during the 1989 Loma Prieta earthquake by 3-D analysis. He found that the usual 1-D analysis was unable to model the motions. One-dimensional analyses work well for sites away from the edges of basins with large width-to-depth ratios. Two- or three-dimensional analyses are required for sites on steep buried valleys with low width-to-depth ratios.
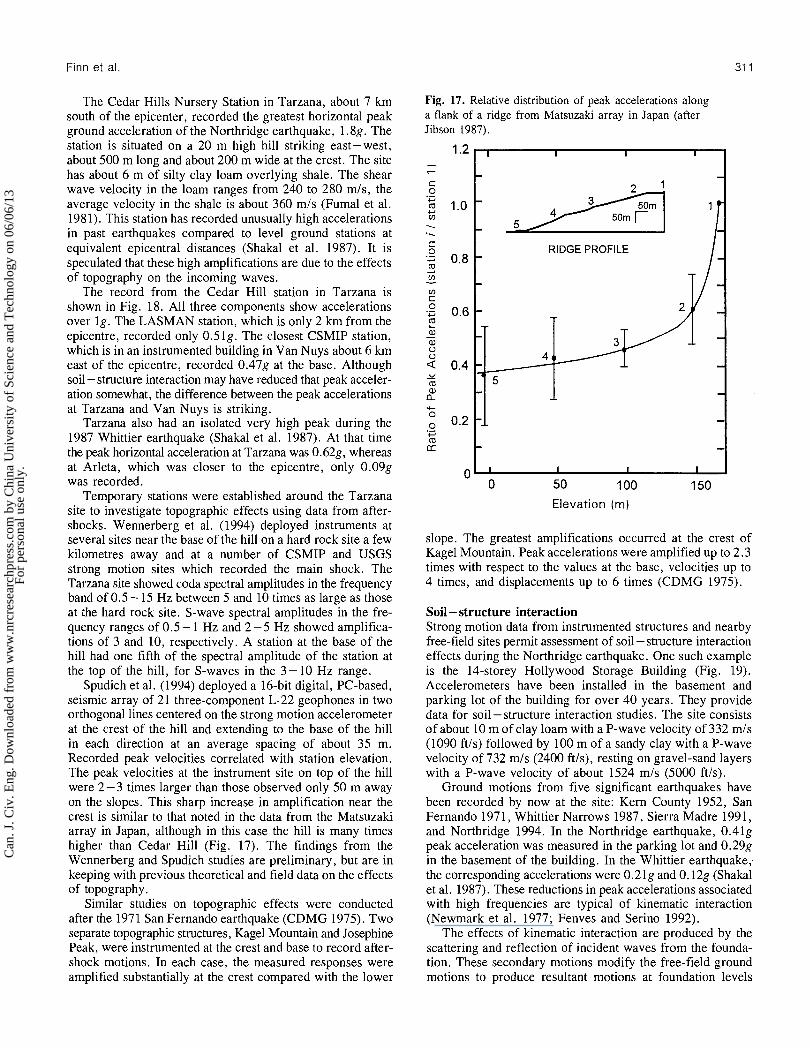
Topographical effects Theoretical studies (Aki 1988; Geli et al. 1988; Faccioli 1991) have indicated that free-field ground motions are amplified by topography with respect to motions on level ground. These conclusions are supported by field data from the 1980 Fruili earthquake (Brambati et al. 1980) and the 1985 Chilean earthquake (Celebi and Hanks 1986). The pattern of amplifi- cation is clearly illustrated by data from the Matsuzaki array in Japan (PWRI 1986), shown in Fig. 17. The mean values and standard error bars of peak accelerations normalized to the crest acceleration for five earthquakes are plotted in Fig. 17 (Jibson 1987) as a function of elevation. The range in peak accelerations for the five earthquakes is rather limited, ranging from a low of a few gals at station 5 to a maximum of about 100 gals at the crest (1 gal = 1 cm/s2). The amplifi- cation of the crest relative to the base is about 2.5. Note that the amplification factor increases rapidly as the crest of the ridge is approached.
Can
. J. C
iv. E
ng. D
ownl
oade
d fr
om w
ww
.nrc
rese
arch
pres
s.co
m b
y C
hina
Uni
vers
ity o
f Sc
ienc
e an
d T
echn
olog
y on
06/
06/1
3Fo
r pe
rson
al u
se o
nly.
Finn et al .
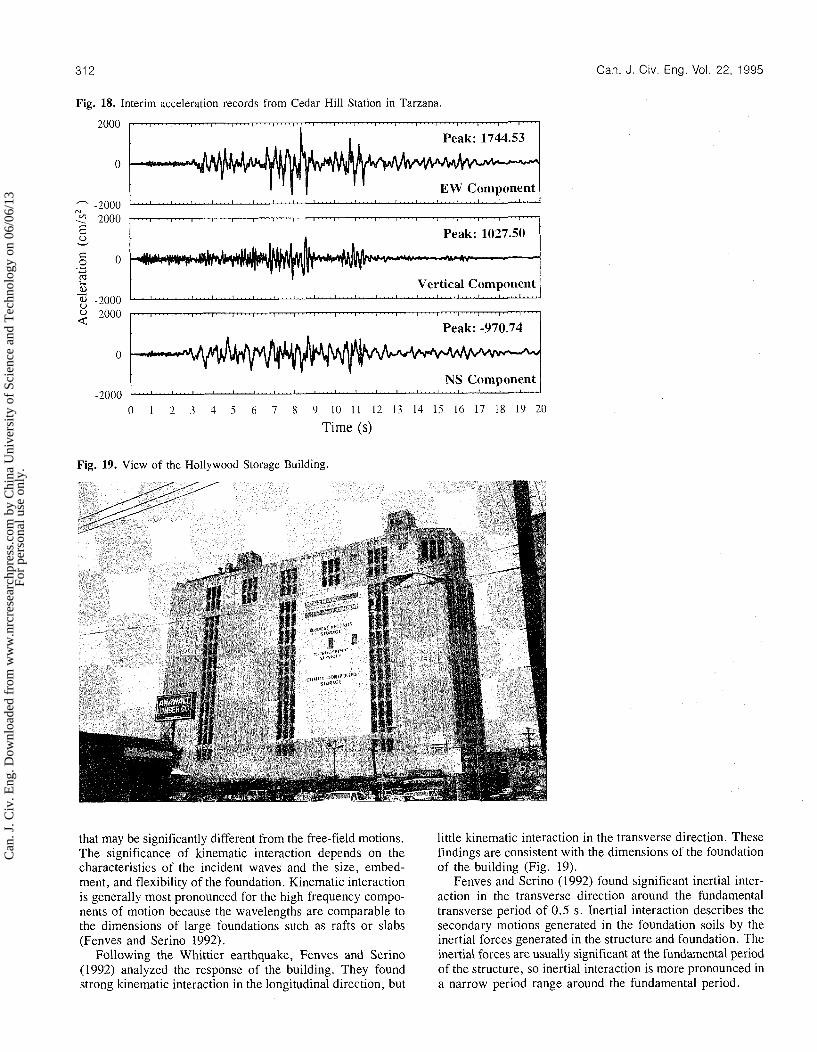
The Cedar Hills Nursery Station in Tarzana, about 7 krn south of the epicenter, recorded the greatest horizontal peak ground acceleration of the Northridge earthquake, 1.8g. The station is situated on a 20 m high hill striking east-west, about 500 m long and about 200 m wide at the crest. The site has about 6 m of silty clay loam overlying shale. The shear wave velocity in the loam ranges from 240 to 280 m/s, the average velocity in the shale is about 360 m/s (Fumal et al. 1981). This station has recorded unusually high accelerations in past earthquakes compared to level ground stations at equivalent epicentral distances (Shakal et al. 1987). It is speculated that these high amplifications are due to the effects of topography on the incoming waves.
The record from the Cedar Hill station in Tarzana is shown in Fig. 18. All three components show accelerations over lg. The LASMAN station, which is only 2 km from the epicentre, recorded only 0.51g. The closest CSMIP station, which is in an instrumented building in Van Nuys about 6 km east of the epicentre, recorded 0.47g at the base. Although soil - structure interaction may have reduced that peak acceler- ation somewhat, the difference between the peak accelerations at Tarzana and Van Nuys is striking.
Tarzana also had an isolated very high peak during the 1987 Whittier earthquake (Shakal et al. 1987). At that time the peak horizontal acceleration at Tarzana was 0.62g, whereas at Arleta, which was closer to the epicentre, only 0.09g was recorded.
Temporary stations were established around the Tarzana site to investigate topographic effects using data from after- shocks. Wennerberg et al. (1994) deployed instruments at several sites near the base of the hill on a hard rock site a few kilometres away and at a number of CSMIP and USGS strong motion sites which recorded the main shock. The Tarzana site showed coda spectral amplitudes in the frequency band of 0.5 - 15 Hz between 5 and 10 times as large as those at the hard rock site. S-wave spectral amplitudes in the fre- quency ranges of 0.5- 1 Hz and 2-5 Hz showed amplifica- tions of 3 and 10, respectively. A station at the base of the hill had one fifth of the spectral amplitude of the station at the top of the hill, for S-waves in the 3-10 Hz range.
Spudich et al. (1994) deployed a 16-bit digital, PC-based, seismic array of 21 three-component L-22 geophones in two orthogonal lines centered on the strong motion accelerometer at the crest of the hill and extending to the base of the hill in each direction at an average spacing of about 35 m. Recorded peak velocities correlated with station elevation. The peak velocities at the instrument site on top of the hill were 2-3 times larger than those observed only 50 m away on the slopes. This sharp increase in amplification near the crest is similar to that noted in the data from the Matsuzaki array in Japan, although in this case the hill is many times higher than Cedar Hill (Fig. 17). The findings from the Wennerberg and Spudich studies are preliminary, but are in keeping with previous theoretical and field data on the effects of topography.
Similar studies on topographic effects were conducted after the 1971 San Fernando earthquake (CDMG 1975). Two separate topographic structures, Kagel Mountain and Josephine Peak, were instrumented at the crest and base to record after- shock motions. In each case, the measured responses were amplified substantially at the crest compared with the lower
Fig. 17. Relative distribution of peak accelerations along a flank of a ridge from Matsuzaki array in Japan (after Jibson 1987).
I I I I
- -
RIDGE PROFILE - - - - - -
- - - - - - - - -
Elevation (m)
slope. The greatest amplifications occurred at the crest of Kagel Mountain. Peak accelerations were amplified up to 2.3 times with respect to the values at the base, velocities up to 4 times, and displacements up to 6 times (CDMG 1975).
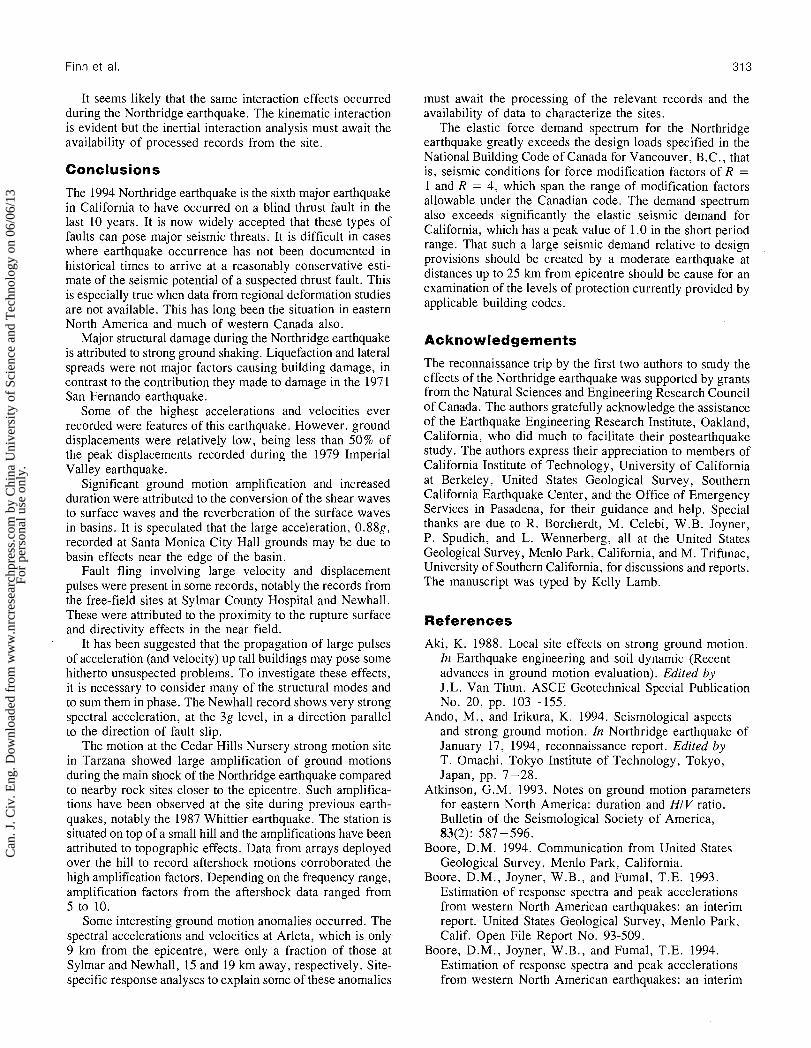
Soil - structure interaction Strong motion data from instrumented structures and nearby free-field sites permit assessment of soil -structure interaction effects during the Northridge earthquake. One such example is the 14-storey Hollywood Storage Building (Fig. 19). Accelerometers have been installed in the basement and parking lot of the building for over 40 years. They provide data for soil-structure interaction studies. The site consists of about 10 m of clay loam with a P-wave velocity of 332 m/s (1090 fils) followed by 100 m of a sandy clay with a P-wave velocity of 732 m/s (2400 fils), resting on gravel-sand layers with a P-wave velocity of about 1524 m/s (5000 fils).
Ground motions from five significant earthquakes have been recorded by now at the site: Kern County 1952, San Fernando 197 1, Whittier Narrows 1987, Sierra Madre 199 1, and Northridge 1994. In the Northridge earthquake, 0.41g peak acceleration was measured in the parking lot and 0.29g in the basement of the building. In the Whittier earthquake, the corresponding accelerations were 0.213 and 0.12g (Shakal et al. 1987). These reductions in peak accelerations associated with high frequencies are typical of kinematic interaction (Newmark et al. 1977; Fenves and Serino 1992).
The effects of kinematic interaction are produced by the scattering and reflection of incident waves from the founda- tion. These secondary motions modify the free-field ground motions to produce resultant motions at foundation levels
Can
. J. C
iv. E
ng. D
ownl
oade
d fr
om w
ww
.nrc
rese
arch
pres
s.co
m b
y C
hina
Uni
vers
ity o
f Sc
ienc
e an
d T
echn
olog
y on
06/
06/1
3Fo
r pe
rson
al u
se o
nly.
Can. J . Civ. Eng. Vol. 22, 1995
Fig. 18. Interim acceleration records from Cedar Hill Station in Tarzana
2000 . . . . l . . . . l . . . . ! ~ . . . t . . . . b . . . ~ ~ . . . . ~ . . . . ~ . . . . ~ . . . . ~ - . . ~ . . . . ~ . . . . f i . . ~ ~ 1 ~ ~ ~ . 1 . . ~ ~ t . . . ~ l ~ .
I I Peak: 1744.53
r r U V
0 . - Y
E a Vertical Component
2000 ! I I -
Peak: -970.74
0 1 2 3 4 5 6 7 8 4 10 1 1 12 13 14 15 16 17 18 19 20
Time (s)
Fig. 19. View of the Hollywood Storage Building.
that may be significantly different from the free-field motions. The significance of kinematic interaction depends on the characteristics of the incident waves and the size, embed- ment, and flexibility of the foundation. Kinematic interaction is generally most pronounced for the high frequency compo- nents of motion because the wavelengths are comparable to the dimensions of large foundations such as rafts or slabs (Fenves and Serino 1992).
Following the Whittier earthquake, Fenves and Serino (1992) analyzed the response of the building. They found strong kinematic interaction in the longitudinal direction, but
little kinematic interaction in the transverse direction. These findings are consistent with the dimensions of the foundation of the building (Fig. 19).
Fenves and Serino (1992) found significant inertial inter- action in the transverse direction around the fundamental transverse period of 0.5 s. Inertial interaction describes the secondary motions generated in the foundation soils by the inertial forces generated in the structure and foundation. The inertial forces are usually significant at the fundamental period of the structure, so inertial interaction is more pronounced in a narrow period range around the fundamental period.
Can
. J. C
iv. E
ng. D
ownl
oade
d fr
om w
ww
.nrc
rese
arch
pres
s.co
m b
y C
hina
Uni
vers
ity o
f Sc
ienc
e an
d T
echn
olog
y on
06/
06/1
3Fo
r pe
rson
al u
se o
nly.
It seems likely that the same interaction effects occurred during the Northridge earthquake. The kinematic interaction is evident but the inertial interaction analysis must await the availability of processed records from the site.
Conclusions
The 1994 Northridge earthquake is the sixth major earthquake in California to have occurred on a blind thrust fault in the last 10 years. It is now widely accepted that these types of faults can pose major seismic threats. It is difficult in cases where earthquake occurrence has not been documented in historical times to arrive at a reasonably conservative esti- mate of the seismic potential of a suspected thrust fault. This is especially true when data from regional deformation studies are not available. This has long been the situation in eastern North America and much of western Canada also.
Major structural damage during the Northridge earthquake is attributed to strong ground shaking. Liquefaction and lateral spreads were not major factors causing building damage, in contrast to the contribution they made to damage in the 1971 San Fernando earthquake.
Some of the highest accelerations and velocities ever recorded were features of this earthquake. However, ground displacements were relatively low, being less than 50% of the peak displacements recorded during the 1979 Imperial Valley earthquake.
Significant ground motion amplification and increased duration were attributed to the conversion of the shear waves to surface waves and the reverberation of the surface waves in basins. It is speculated that the large acceleration, 0.88g, recorded at Santa Monica City Hall grounds may be due to basin effects near the edge of the basin.
Fault fling involving large velocity and displacement pulses were present in some records, notably the records from the free-field sites at Sylmar County Hospital and Newhall. These were attributed to the proximity to the rupture surface and directivity effects in the near field.
It has been suggested that the propagation of large pulses of acceleration (and velocity) up tall buildings may pose some hitherto unsuspected problems. To investigate these effects, it is necessary to consider many of the structural modes and to sum them in phase. The Newhall record shows very strong spectral acceleration, at the 3g level, in a direction parallel to the direction of fault slip.
The motion at the Cedar Hills Nursery strong motion site in Tarzana showed large amplification of ground motions during the main shock of the Northridge earthquake compared to nearby rock sites closer to the epicentre. Such amplifica- tions have been observed at the site during previous earth- quakes, notably the 1987 Whittier earthquake. The station is situated on top of a small hill and the amplifications have been attributed to topographic effects. Data from arrays deployed over the hill to record aftershock motions corroborated the high amplification factors. Depending on the frequency range, amplification factors from the aftershock data ranged from 5 to 10.
Some interesting ground motion anomalies occurred. The spectral accelerations and velocities at Arleta, which is only 9 km from the epicentre, were only a fraction of those at Sylmar and Newhall, 15 and 19 km away, respectively. Site- specific response analyses to explain some of these anomalies
must await the processing of the relevant records and the availability of data to characterize the sites.
The elastic force demand spectrum for the Northridge earthquake greatly exceeds the design loads specified in the National Building Code of Canada for Vancouver, B.C., that is, seismic conditions for force modification factors of R = 1 and R = 4, which span the range of modification factors allowable under the Canadian code. The demand spectrum also exceeds significantly the elastic seismic demand for California, which has a peak value of 1.0 in the short period range. That such a large seismic demand relative to design provisions should be created by a moderate earthquake at distances up to 25 km from epicentre should be cause for an examination of the levels of protection currently provided by applicable building codes.
Acknowledgements
The reconnaissance trip by the first two authors to study the effects of the Northridge earthquake was supported by grants from the Natural Sciences and Engineering Research Council of Canada. The authors gratefully acknowledge the assistance of the Earthquake Engineering Research Institute, Oakland, California, who did much to facilitate their postearthquake study. The authors express their appreciation to members of California Institute of Technology, University of California at Berkeley, United States Geological Survey, Southern California Earthquake Center, and the Office of Emergency Services in Pasadena, for their guidance and help. Special thanks are due to R. Borcherdt, M. Celebi, W.B. Joyner, P. Spudich, and L. Wennerberg, all at the United States Geological Survey, Menlo Park, California, and M. Trifunac, University of Southern California, for discussions and reports. The manuscript was typed by Kelly Lamb.
References
Aki, K. 1988. Local site effects on strong ground motion. In Earthquake engineering and soil dynamic (Recent advances in ground motion evaluation). Edited by J.L. Van Thun. ASCE Geotechnical Special Publication No. 20, pp. 103-155.
Ando, M. , and Irikura, K. 1994. Seismological aspects and strong ground motion. In Northridge earthquake of January 17, 1994, reconnaissance report. Edited by T . Omachi. Tokyo Institute of Technology, Tokyo, Japan, pp. 7-28.
Atkinson, G.M. 1993. Notes on ground motion parameters for eastern North America: duration and HIV ratio. Bulletin of the Seismological Society of America, 83(2): 587 -596.
Boore, D.M. 1994. Communication from United States Geological Survey, Menlo Park, California.
Boore, D.M., Joyner, W .B., and Fumal, T.E. 1993. Estimation of response spectra and peak accelerations from western North American earthquakes: an interim report. United States Geological Survey, Menlo Park, Calif. Open File Report No. 93-509.
Boore, D.M., Joyner, W.B., and Fumal, T.E. 1994. Estimation of response spectra and peak accelerations from western North American earthquakes: an interim
Can
. J. C
iv. E
ng. D
ownl
oade
d fr
om w
ww
.nrc
rese
arch
pres
s.co
m b
y C
hina
Uni
vers
ity o
f Sc
ienc
e an
d T
echn
olog
y on
06/
06/1
3Fo
r pe
rson
al u
se o
nly.
Can. J. Civ. Eng. Vol. 22, 1995
report - part 2. United States Geological Survey, Menlo Park, Calif., Open File Report No. 94-127.
Borcherdt, R.D., and Glassmoyer, G. 1992. On the characteristics of local geology and their influence on ground motions generated by the Loma Prieta earthquake in the San Francisco Bay Region, California. Bulletin of the Seismological Society of America, 82: 603 -64 1.
Brambati, E., Faccioli, E., Carulli, E., Culchi, F., Onofri, R., Stefanini, R., and Uloigrai, F. 1980. Studio de Microzonizzacione Sismica Dell'are do Tarento (Fruili). Edito da Regione Autonoma Fruili-Venezia, Giulia.
CDMG. 1975. San Fernando, California earthquake of February 9, 1971. Edited by Gordon B. Oakeshott. California Division of Mines and Geology, Bulletin 196.
Celebi, M., and Hanks, T. 1986. Unique site response conditions of two major earthquakes of 1985: Chile and Mexico. Proceedings, International Symposium of Engineering Geology Problems in Seismic Areas, Vol. IV, Bari, Italy.
CSL. 1994. The Northridge earthquake of January 17, 1994, Magnitude 6.6. Short report for information from California Institute of Technology Seismological Laboratory and United States Geological Survey, issued by California Institute of Technology.
CSL and USGS. 1994. Aftershocks of the magnitude 6.6 Northridge, California earthquake of January 17, 1994; updated to 4:00 p.m., January 20, 1994. Report by California Institute of Technology and United States Geological Survey.
CSL, USGS, and SCEC. 1994. Aftershocks of the magnitude 6.6 Northridge California earthquake of January 17, 1994; updated to 4:00 p.m., January 2 1, 1994. Report by California Institute of Technology, United States Geological Survey, and Southern California Earthquake Center.
Darragh, R., Cao, T., Cramer, C., Huang, M., and Shakal, A. 1994a. Processed CSMIP strong motion records from the Northridge, California earthquake of January 17, 1994, Release No. 1. California Department of Conservation, Division of Mines and Geology, Office of Strong Motion Studies, Sacramento, Calif., Report No. OSMS 94-06B, February 7.
Darragh, R., Cao, T., Huang, M., and Shakal, A. 19946. Processed CSMIP strong motion records from the Northridge, California earthquake of January 17, 1994, Release No. 2. California Department of Conservation, Division of Mines and Geology, Office of Strong Motion Studies, Sacramento, Calif., Report No. OSMS 94-08B, February 24.
Darragh, R., Cao, T., Cramer, C., Graizer, V., Huang, M., and Shakal, A. 1994c. Processed CSMIP strong motion records from the Northridge, California earthquake of January 17, 1994, Release No. 3. California Department of Conservation, Division of Mines and Geology, Office of Strong Motion Studies, Sacramento, Calif., Report No. OSMS 94-09B, March 15.
EERI. 1994. Northridge earthquake, January 17, 1994 - preliminary reconaissance report. Edited by John F. Hall.
Earthquake Engineering Research Institute, Oakland, Calif., Report No. 94-01.
Egan, J.A., Makdisi, F.I., and Rosidi, D. 1994. Near-field vertical ground motions from the 17 January 1994 Northridge earthquake; were they unusual? Program Abstracts, Annual Meeting, Seismological Society of America, April 5 -7, Pasadena, Calif.
Faccioli, E. 1991. Seismic amplification in the presence of geological and topographic irregularities. Proceedings, 2nd International Conference on Recent Advances in Geotechnical Earthquake Engineering and Soil Dynamics, St. Louis, Mo., Vol. 11, pp. 1779- 1797.
Fenves, G.L., and Serino, G. 1992. Evaluation of soil-structure interaction in buildings during earthquakes. California Department of Conservation, Division of Mines and Geology, Office of Strong Motion Studies, Sacramento, Calif., Data Utilization Report CSMIPl92-01, June.
Finn, W .D. L. 199 1. Geotechnical engineering aspects of microzonation. Proceedings, Fourth International Conference on Seismic Zonation, Earthquake Engineering Research Institute, Stanford, Calif., Vol. 1, pp. 199-259.
Finn, W.D.L., Iai, S., and Matsunaga, Y. 1994. Effect of site conditions on ground motions. Proceedings, 10th European Conference on Earthquake Engineering, Vienna, Austria.
Frankel, A,, Meremonte, M., Cranswick, E., Carver, D., Worley, D., Odum, J. , and Williams, R. 1994. Observations from Northridge aftershocks recorded by seismometers deployed in the San Fernando Valley and at the Interstate-10 collapse. Program Abstracts, Annual Meeting, Seismological Society of America, April 5-7, Pasadena, Calif.
Fumal, T.E., Gibbs, J.F., and Roth, E.F. 198 1. In-situ measurements of seismic velocity at 19 locations in the Los Angeles, California region. United States Geological Survey, Menlo Park, Calif., Open File Report No. 81-399.
Geli, L., Bard, P.Y., and Jullien, B. 1988. The effect of topography on earthquake ground motion: a review and new results. Bulletin of the Seismological Society of America, 78(1): 42-63.
Graves, R.W. 1993. Modelling three-dimensional site response effects in the Marina District basin, San Francisco, California. Bulletin of the Seismological Society of America, 83: 1042 - 1062.
Hanks, T.C. 1975. Strong ground motion of the San Fernando California earthquake: ground displacements. Bulletin of the Seismological Society of America, 65: 193 -225.
Heaton, T.H., and Wald, D.J. 1994. Ground motion estimates from a magnitude 7, blind thrust earthquake under Los Angeles. Proceedings, Joint Symposium on Living with Earthquakes in Southern California, Seismological Society of America and Earthquake Engineering Research Institute, Pasadena, Calif., April.
Idriss, I.M. 199 1. Selection of earthquake ground motions at rock sites. Report prepared for the Structures Division, Building and Fire Research Laboratory, National Institute of Standards and Technology,
Can
. J. C
iv. E
ng. D
ownl
oade
d fr
om w
ww
.nrc
rese
arch
pres
s.co
m b
y C
hina
Uni
vers
ity o
f Sc
ienc
e an
d T
echn
olog
y on
06/
06/1
3Fo
r pe
rson
al u
se o
nly.
Department of Civil Engineering, University of California, Davis, Calif.
Jackson, D.D. 1994. The 1994 Northridge earthquake and future seismic hazards in southern California. Program Abstracts, 89th Annual Meeting, Seismological Society of America, April 5-7, Pasadena, Calif.
Jibson, R. 1987. Summary of research on the effects of topographic amplification of earthquake shaking on slope stability. United States Geological Survey, Menlo Park, Calif., Open File Report No. 87-268.
Joyner, W .B., and Boore, D.M. 198 1. Peak acceleration and velocity from strong-motion records including records from the 1979 Imperial Valley, California, earthquake. Bulletin of the Seismological Society of America, 71: 201 1-2038.
Joyner, W.B., and Boore, D.M. 1988. Measurement, characterization, and prediction of strong ground motion in recent advances in the ground motion evaluation. Proceedings of Earthquake Engineering and Soil Dynamics 11. Edited by Lawrence Von Thun. Geotechnical Special Publication No. 20, American Society of Civil Engineers, June 27-30, pp. 43- 102.
Liu, H.L., and Heaton, T.H. 1984. Array analysis of the ground velocities and acceleration from the 1971 San Fernando, California, earthquake. Bulletin of the Seismological Society of America, 74: 1951 - 1968.
Naeim, F. 1994. Northridge earthquake ground motions: implications for tall buildings. Proceedings, 3rd Conference on Tall Buildings in Seismic Regions, Los Angeles, Calif., May.
Newmark, N.M., Hall, W.J., and Morgan, J.R. 1977. Comparison of building response and free field motion in earthquakes. Proceedings, 6th World Conference on Earthquake Engineering, New Delhi, India, Vol. 11, pp. 972-978.
NRC. 1990. National building code of Canada. Associate Committee on the National Building Code, National Research Council of Canada, Ottawa, Ont.
Porcella, R., Etheredge, E., Maley, R.P., and Acosta, A. 1994. Accelerograms recorded at USGS national strong motion network stations, during the Ms = 6.6 Northridge, California earthquake of January 17, 1994. United States Geological Survey, Department of Interior, Open File Report No. 94- 14 1.
PWRI. 1986. Dense instrument array observation of strong earthquake motion. Ministry of Construction, Tsukuba, Japan.
Shakal, A., Huang, M.J., Ventura, C.E., Parke, D.L., Cao, T.Q., Sherburne, R.W., and Blazquez, R. 1987.
CSMIP strong motion records from the Whittier, California earthquake of October 1, 1987. California Department of Conservation, Division of Mines and Geology, Office of Strong Motion Studies, Sacramento, Calif., Report No. OSMS 87-05, October.
Shakal, A., Huang, M.J., Darragh, R., Cao, T., Sherburne, R., Malhotra, P., Cramer, C., Sydnor, R., Graizer, V., Maldonado, G., Petersen, C., and Wampole, J. 1994. CSMIP strong motion records from the Northridge, California earthquake of January 17, 1994. California Department of Conservation, Division of Mines and Geology, Office of Strong Motion Studies, Sacramento, Calif., Report No. OSMS 94-07, February.
Spudich, P., Harlow, D., Lee, W.H.K., Rogers, J., and White, R. 1994. Strong site effects observed at the Tarzana accelerograph site using aftershocks of the 1994 Northridge, California earthquake: implications for microzonation. Program Abstracts, Annual Meeting, Seismological Society of America, April 5 -7, Pasadena, Calif.
Stein, R.S. 1994. Earthquake hazards after Northridge: blind faith in surface faults no more. In Living with earthquakes in southern California. Summary Proceedings, Joint Symposium, Seismological Society of America and Earthquake Engineering Research Institute, Pasadena, Calif., April 7.
Thio, H.K., and Kanamori, H. 1994. Source complexity of the 1994 Northridge earthquake. Program Abstracts, Annual Meeting, Seismological Society of America, April 5 -7, Pasadena, Calif.
Todorovska, M.I., Trifunac, M.D., and Ivanovic, S.S. 1994. Second preliminary report on distribution of peak ground motions during the Northridge, California earthquake of January 17, 1994. University of Southern California, Los Angeles, Calif., February 1.
Trifunac, M.D., Todorovska, M.I., and Ivanovic, S.S. 1994. A note on distribution of uncorrected peak ground accelerations during the Northridge, California, earthquake of 17 January 1994. Soil Dynamics and Earthquake Engineering, 13: 187 - 196.
Wennerberg, L., Borcherdt, R.D., Meuller, C., Dietel, C., Sembera, E., Westerlund, R., and Hough, S. 1994. Aftershock observations suggestive of large, linear site amplification at the Cedar Hill Nursery Accelerograph Station, Tarzana, California. Program Abstracts, 89th Annual Meeting, Seismological Society of America, April 5 -7, Pasadena, Calif.
Can
. J. C
iv. E
ng. D
ownl
oade
d fr
om w
ww
.nrc
rese
arch
pres
s.co
m b
y C
hina
Uni
vers
ity o
f Sc
ienc
e an
d T
echn
olog
y on
06/
06/1
3Fo
r pe
rson
al u
se o
nly.
Related Documents