261 © Agricultural and Food Science in Finland Manuscript received May 2001 AGRICULTURAL AND FOOD SCIENCE IN FINLAND Vol. 10 (2001): 261–276. Ground beetle (Coleoptera, Carabidae) diversity in Finnish arable land Juha Helenius Department of Applied Biology, PO Box 27, FIN-00014 University of Helsinki, Finland, e-mail: [email protected] Jarmo K. Holopainen MTT Agrifood Research Finland, Plant Production Research, Plant Protection, FIN-31600 Jokioinen, Finland. Current address: Department of Ecology and Environmental Science, University of Kuopio, PO Box 1627, FIN-70211 Kuopio, Finland Erja Huusela-Veistola MTT Agrifood Research Finland, Plant Production Research, Plant Protection, FIN-31600 Jokioinen, Finland Sirpa Kurppa MTT Agrifood Research Finland, Plant Production Research, Plant Protection, FIN-31600 Jokioinen, Finland. Current address: MTT Agrifood Research Finland, Environmental Research, FIN-31600 Jokioinen, Finland Pia Pokki, Anna-Liisa Varis Department of Applied Biology, PO Box 27, FIN-00014 University of Helsinki, Finland Carabid data compiled from six independent studies, consisting of 97 799 individuals trapped by pitfalls from Finnish agricultural fields and identified to 111 species were analyzed. Shannon-Wiener H’ diversity index was typically around 2.5 and expected species number rarefied to 600 trapped individuals was typically around 30 species. The five most abundant species accounted for 42% of the total catch, and the thirty most abundant species made up 98% of the total catch. Percentage similarities among the assemblages by PS-index were from 16% to 48%. In comparison to published data about carabid diversity in boreal forests, which form the dominating habitat matrix in which Finnish farmland is embedded as relatively small patches, arable fields harbor more species rich assemblages, with more even rank-abundance distributions but variable species composition. Impor- tance of landscape (regional) level, instead of spatial level of crop fields, in understanding carabid diversity in farmland is discussed. Inclusion of carabids into monitoring schemes of agro-biodiversi- ty at landscape level is suggested. Key words: Carabid fauna, agricultural fields, species richness, evenness, similarity, agro-biodiversi- ty, monitoring

Welcome message from author
This document is posted to help you gain knowledge. Please leave a comment to let me know what you think about it! Share it to your friends and learn new things together.
Transcript

261
A G R I C U L T U R A L A N D F O O D S C I E N C E I N F I N L A N D
Vol. 10 (2001): 261–276.
© Agricultural and Food Science in FinlandManuscript received May 2001
A G R I C U L T U R A L A N D F O O D S C I E N C E I N F I N L A N D
Vol. 10 (2001): 261–276.
Ground beetle (Coleoptera, Carabidae) diversityin Finnish arable land
Juha HeleniusDepartment of Applied Biology, PO Box 27, FIN-00014 University of Helsinki, Finland,
e-mail: [email protected]
Jarmo K. HolopainenMTT Agrifood Research Finland, Plant Production Research, Plant Protection, FIN-31600 Jokioinen, Finland.
Current address: Department of Ecology and Environmental Science, University of Kuopio, PO Box 1627,FIN-70211 Kuopio, Finland
Erja Huusela-VeistolaMTT Agrifood Research Finland, Plant Production Research, Plant Protection, FIN-31600 Jokioinen, Finland
Sirpa KurppaMTT Agrifood Research Finland, Plant Production Research, Plant Protection, FIN-31600 Jokioinen, Finland.
Current address: MTT Agrifood Research Finland, Environmental Research, FIN-31600 Jokioinen, Finland
Pia Pokki, Anna-Liisa VarisDepartment of Applied Biology, PO Box 27, FIN-00014 University of Helsinki, Finland
Carabid data compiled from six independent studies, consisting of 97 799 individuals trapped bypitfalls from Finnish agricultural fields and identified to 111 species were analyzed. Shannon-WienerH’ diversity index was typically around 2.5 and expected species number rarefied to 600 trappedindividuals was typically around 30 species. The five most abundant species accounted for 42% ofthe total catch, and the thirty most abundant species made up 98% of the total catch. Percentagesimilarities among the assemblages by PS-index were from 16% to 48%. In comparison to publisheddata about carabid diversity in boreal forests, which form the dominating habitat matrix in whichFinnish farmland is embedded as relatively small patches, arable fields harbor more species richassemblages, with more even rank-abundance distributions but variable species composition. Impor-tance of landscape (regional) level, instead of spatial level of crop fields, in understanding carabiddiversity in farmland is discussed. Inclusion of carabids into monitoring schemes of agro-biodiversi-ty at landscape level is suggested.
Key words: Carabid fauna, agricultural fields, species richness, evenness, similarity, agro-biodiversi-ty, monitoring
262
A G R I C U L T U R A L A N D F O O D S C I E N C E I N F I N L A N D
Helenius, J. et al. Ground beetle diversity
Introduction
Ground beetles (Coleoptera, Carabidae) areground dwelling, polyphagous or predatory in-sects, abundant in many kinds of terrestrial hab-itats. The larvae are subterranean predators.Carabids may be collected in large numbers us-ing pitfall traps, and due to their abundance andspecies richness (more than 40 000 species de-scribed) they are popular objects of study. Theyare abundant in agricultural fields all over theworld and may be important natural enemies ofagricultural pests. Thiele (1977) investigated thecarabids associated with European agriculturalcrops. For Fennoscandia and Denmark, a com-prehensive key for identification, with short de-scriptions of biology, is available from Lindroth(1985, 1986). Our aim is not to present a reviewof the extensive literature of agro-carabidology.Among many excellent reviews, see e.g. Löveiand Sunderland (1996), or Kromp (1999).
In 1956, Wishart et al. estimated that preda-tory beetles destroyed 70% of cabbage root flyeggs, and Hughes (1959) confirmed that cara-bids were mainly responsible for this. Potts andVickerman (1974) suggested that polyphagouspredators such as carabids (but also some rovebeetles (Staphylinidae) and many spiders) areimportant predators of aphids in cereal ecosys-tems. In decades following these reports, appliedresearch into the role of carabids in agroecosys-tems has proliferated. Kromp (1999) concludeshis review on this aspect by asking for more stud-ies that would quantify predation and pest con-trol in open-field conditions, and emphasizingthat carabids are only one component in the nat-ural enemy complexes in crop fields. Most ofthe studies from which our data originates wereoriginally motivated by the beneficial role ofcarabids.
In Finland, Varis and colleagues initiatedagro-carabidology by studying egg predation oncabbage root flies (Varis 1982), and abundanceand seasonal occurrence of adult carabids insome crops in southern Finland (Varis et al.1984). She and her students then continued with
studies on various applied aspects: studies ontrapping methods (Holopainen and Varis 1986,Holopainen 1992), on predation of root flies(Varis 1989) and cereal aphids (Helenius 1990,Holopainen and Helenius 1992), on abundanceand reproduction (Helenius et al. 1995, Helenius1995), and on pollution effects (Holopainen etal. 1995) in agroecosystems. Vasarainen andKurppa (1996) and Huusela-Veistola (1996,2000) continued with studies into effects of cul-tivation techniques and pesticide use on carabids.All these studies serve in describing carabid di-versity, but Kinnunen (1999, see also Kinnunenet al. 1996, Kinnunen and Tiainen 1999, Kin-nunen et al. 2001) was the first who focused intounderstanding the patterns, especially in relationto spatial scales, in communities of carabids inFinnish farmland.
Apart from what is listed above, we do notknow of other studies that would deal with di-versity of carabids in agricultural fields in Fin-land. As only 9% of the land cover is in agricul-tural use, and practically all the rest is under for-est cover, Finnish biologists have traditionallyfocused into forest systems. However, Kin-nunen’s (1999) work now provides a landmarkfor further studies on community ecological as-pects of carabid diversity in agricultural land inFinland.
In this report we do not aim into a communi-ty ecological analysis. The basic idea of thisstudy was to pull together our various pitfall dataon carabids in many regions and over a 17 yearstime span in Finnish agroecosystems, in orderto provide a reference for future surveys of spe-cies diversity (along the lines of Duelli et al.1999). We believe that such reference, even ifunperfected in many respects, may be useful es-pecially for future studies monitoring biodiver-sity and agroecosystem change in Finland.

263
A G R I C U L T U R A L A N D F O O D S C I E N C E I N F I N L A N D
Vol. 10 (2001): 261–276.
Material and methods
Study areas, data sets and trappingmethods
All data were from pitfall trapping studies. Al-together 23 subsets of data from 1978 until 1994were used, and the pooled (total) number of pit-fall samples was 21344. These studies covereda geographic area ranging from the Southwestto the Northeast of Finland (Table 1, Fig. 1).
Regional range is from hemiboreal to southernboreal phytogeographical zones (Ahti et al.1968) and from 1.25 to 0.95 k°C DD above 5°Cin the length of the thermal growing season.
Pitfall traps varied moderately in design (Ta-ble 2). All studies used circular cups, in whichthe diameter range was 80 to 100 mm. The mostcommon collecting fluid was water with deter-gent and sometimes NaCl as preservative add-ed. In one study, ethylene glycol, and in anoth-er, formalin solution was used. A lid to shadethe trap was sometimes used (Table 2). Traps
Table 1. Data sets and study sites (from North to South, see also Fig. 1). Windows of Day Degrees are indicated, and thetotal catch of carabids given, for the sub-sets of the data.
Data set Author Year Trapping period DD range1 Total numberof specimens
Siilinjärvi Holopainen 1991 4 June – 20 August 74.3 – 876.9 8722
Outokumpu Pokki 1990 9 May – 20 July 76.3 – 580.6 30621991 15 May – 21 July 20.2 – 556.7 23151993 12 May – 1 July 87.7 – 375.0 10571994 18 May – 39 June 66.0 – 322.2 726Total . 20.2 – 580.6 7160
Jokioinen Kurppa 1991 31 May – 24 September 66.7 –1087.5 24421992 5 May – 26 August 18.8 –1106.9 36661993 7 May – 1 September 102.2 –1076.2 30181994 6 May – 25 August 51.0 –1047.3 1534Total . 18.8 –1106.9 10660
SW Finland Huusela-Veistola 1991 17 June – 5 July 81.9 – 510.9 11860
Viikki-I Helenius 1983 26 May – 21 July 132.3 – 792.4 56751984 18 May – 20 July 58.3 – 757.4 37031985 30 May – 5 September 66.5 –1160.3 11021986 29 May – 7 August 189.4 –1040.7 25951988 13 May – 22 September 52.3 –1533.8 28121989 23 May – 19 June 152.6 – 394.5 5551990 9 May – 16 September 144.1 –1320.9 113461991 13 May – 4 August 40.7 – 807.7 8551Total . 40.7 –1533.8 36339
Viikki-II Varis 1978 17 May – 14 September 29.4 –1195.5 83481979 10 May – 12 September 8.1 –1362.4 91701982 31 May – 20 August 134.0 – 982.7 56331984 11 June – 26 July 359.4 – 815.1 5701985 2 June – 27 July 160.6 – 715.8 997Total . 8.1 –1362.4 24718
Total . . . 99459
1 Range of Day Degrees accumulated from the start to end of the trapping period, obtained from the nearest meteorologicalstation as accumulation of degrees above 5°C from the onset of the thermal growing season.

264
A G R I C U L T U R A L A N D F O O D S C I E N C E I N F I N L A N D
Helenius, J. et al. Ground beetle diversity
were emptied at intervals of two days to twoweeks. Trapping effort is expressed as the totalnumber of trap-days cumulated from the onsetto the emptying of the last trap for each of thedata sets (Table 2).
The Siilinjärvi data (63°03’ N, 27°39’ E) arefrom the study by Holopainen et al. (1995) whoconducted pitfall trapping from 15 spring bar-ley fields and one oat field in the Siilinjärvimunicipality. The original aim in this study wasto relate carabid diversity to soil properties andto foliar fluoride content. Holopainen (1992)described details of the trapping method, and anindependent analysis of species diversity wasgiven by Holopainen et al. (1995).
The 1990–1991 subset of Outokumpu dataare from an unpublished M.Sc. study by Pokki(Pia Pokki, unpublished MSc thesis, Universityof Helsinki 1992), which aimed to describe thelocal diversity of carabids in arable land. Pit-
fall trapping was conducted in 8 spring barleyfields in the neighboring municipalities of Ou-tokumpu (3 fields; 62°42’ N, 29°05’ E), Liperi(2 fields; 62°36’ N, 29°14’ E), Joensuu (one field;62°36’ N, 29°34’ E), and Kontiolahti (2 fields,62°45’ N, 29°49’ E). In each field, three trap sta-tions of two traps 2 m apart were established at30 m intervals. The 1993–1994 subset of Outo-kumpu data is from an unpublished study byPokki and Helenius, in which the effect on cara-bid activity-density of undersowing with cloveror ryegrass was investigated. Trapping was con-ducted in spring barley fields in Outokumpu(4 fields) and in Liperi (4 fields). The trappingmethod was the same as for the 1990–1991 Ou-tokumpu data.
The Jokioinen data are from a study by Kurp-pa and Vasarainen (Vasarainen and Kurppa1996), in which activity densities of carabidswere compared between various crop rotationsand between organic and conventional produc-tion. All the data are from Yöni-farm in Jokioi-nen (60°48’ N, 23°28’ E), from 14 fields. In thesefields, according to the crop rotation scheme, thecrops were spring barley (either with or withoutnext year’s ley undersown), winter rye, an oat-pea mixture (traditional ‘mixed cereal’), ley,open fallow, or a weedy field uncultivated sincethe late 1980s. In the middle of each field, fivepitfall traps in 10 m intervals were emptied eve-ry two weeks.
The SW-Finland data are from an unpub-lished study by Kurppa and Huusela-Veistola. Inthis study, 127 arable farms in around South andSouthwest of Finland were sampled, and pitfalltrapping conducted in cereal fields on 43 farms,in sugar beet fields on 49 farms, and in springrape fields on 35 farms (Fig. 1). Each field wassampled by 10 traps. These were in two sets offive traps, each of the five at 10 m intervals in arow. The traps were run for a two week period.The trapping periods were set to weeks 23 to 25in cereal fields, 25 to 27 in sugar beet fields andto weeks 26 to 28 in spring rape fields.
The Viikki-I data are from studies on epigealpredators (Helenius 1990) in spring-sown cere-al or seed legume crops on Viikki Experimental
Fig. 1. Map of sampling locations for the six data sets ofthe study.

265
A G R I C U L T U R A L A N D F O O D S C I E N C E I N F I N L A N D
Vol. 10 (2001): 261–276.
Farm (60°13’ N, 25°02’ E) in Helsinki. For sum-maries see Helenius (1991a). In the 1983 exper-iment, the crops were oats, an oat-faba bean mix-ture and faba bean alone, in which pitfall trap-ping was conducted in 8 plots, with 16 traps perplot. Half of the traps were operated within 5 m× 5 m enclosures, enclosed by steel strip 200 mmhigh, buried 50 mm into the soil (see Helenius1990). In the 1984 experiment, the crops werealso monocrops or mixtures of oats and fababean. Pitfall trapping was conducted in 24 plots,one trap per plot. One half of the traps were op-erated within egress-only plots, and the other halfwithin plots surrounded by ingress-only trench-es (ca. 8 cm deep trenches, Helenius 1990).
In the 1985 experiment, the crops were oatsand an oat-faba bean mixture. Trapping was con-ducted in 12 plots, 2 traps per plot. A quarter of
the traps were in open plots, another quarter inplots enclosed by an egress-only trench (trench-es as in 1984) for the whole period, a furtherquarter in plots enclosed by egress-only trench-es until June 24, and the rest in plots trenchedafter June 24. In the 1986 experiment, the cropswere oats and an oat-faba bean mixture, and thetrapping was conducted in 12 plots, 2 traps perplot as in 1985. Half of the traps were operatedwithin isolators 57 cm in diameter, 30 cm high,buried 20 cm deep into the soil, covered with aninsect net (see Helenius 1991b for descriptionand for some results from oats).
In the 1988 to 1991 experiment, one hectareof spring barley, as a monocrop or undersownwith ryegrass or clover (1988 to 1991), or springwheat, was used for studying the possibility ofenhancement of carabids by undersowing in ce-
Table 2. Details of pitfall trapping.
Data set Year Effort Diameter Collecting fluid Lid on trap(trap-days) (mm)
Siilinjärvi 1991 1155 90 water+detergent AluminiumOutokumpu 1990 3108 100 water+detergent+salt no
1991 2814 “ “ “1993 2016 “ “ “1994 1692 “ “ “
Jokioinen 1991 5060 “ water+detergent+salt Plastic foil1992 6335 “ “ “1993 6055 “ “ “1994 5590 “ “ “
SW Finland 1991 17780 95 “ “
Viikki-I 1983 8064 80 water+detergent no1984 1608 “ “ “1985 720 68 50% ethylene glycol “1986 1680 80 water+detergent no1988 4848 100 “ “1989 800 “ water+detergent+salt no1990 3808 “ “ no1991 1664 “ “ no
Viikki-II 1978 7680 80 dry / 2% formalin+det. Plastic foil1979 4000 “ “ “1982 2916 “ water+detergent no1984 1104 “ “ “1985 1320 “ “ “
Total 91817 trap days
266
A G R I C U L T U R A L A N D F O O D S C I E N C E I N F I N L A N D
Helenius, J. et al. Ground beetle diversity
reals (Holopainen and Helenius 1992, Heleniusand Tolonen 1994, Helenius 1995, Helenius etal. 1995). Altogether, 48 traps in 1988, 32 trapsin 1989 (half of which were within plots of 2 m× 3 m enclosed by plastic sheet, 10 cm high,buried 2 cm into the soil), and 32 traps in 1990and 1991 were operated.
The Viikki-II data of 1978 and 1979 are froma faunistic study by Varis et al. (1984) and byHolopainen and Varis (1986). One cabbage field,one sugar beet field, and one timothy field inViikki Experimental Farm were included. Eachfield was sampled by 64 traps (4 × 16 trap set)in 1978 and by 32 traps (4 × 8 trap set) in 1979.Every fourth trap was filled with a formalinmedium; otherwise dry traps were used. Thetraps were emptied every two to four days. Halfof the traps were operated inside 10 m × 10 mplots (16 traps per plot in 1978 and 8 traps perplot in 1979) surrounded by 35 cm high and15 cm deep plastic barriers in order to restrictthe movement of carabids into and from the plots(for details, see Varis et al. 1984, and Holopain-en and Varis 1986).
The Viikki-II data of 1982, 1984 and 1985are from studies by Varis and Tolonen (unpub-lished M.Sc. thesis by Timo Tolonen, Universi-ty of Helsinki 1990), in which carabids werestudied as predators of cabbage root flies inViikki Experimental Farm. The crops weremonocropped white cabbage or white cabbageundersown with subterranean clover. The cara-bids were trapped in 1982 in 6 plots, and in theother years in 4 plots by 6 traps per plot. In 1984and 1985 half of the traps were within enclo-sures of steel strips 10 cm high, 5 cm deep intosoil.
Identification of speciesIdentification keys by Lindroth (1985, 1986)were used, and the nomenclature follows theenumeration by Silfverberg (1992). Only adultspecimens were included. The members of theresearch teams did taxonomic work. Coleopteraspecialists were consulted in a few unclear cas-
es. For the Jokioinen data, specimens of the ge-nus Amara were not identified to species level,and for the SW Finland data, only A. aulica,A. eurynota and A. plebeja were identified to spe-cies level. Authors of the scientific names of thespecies are given in Appendix 1.
Meteorological dataCumulative day degrees (DD, in °C above 5°C)were calculated as thermal windows of trapping(Table 1). By definition (Finnish Meteorologi-cal Institute) the accumulation of DD starts inspring as the mean daily temperature at 2 mheight above ground is permanently above 5°C,and the snow cover is less than 50%. We usedthe standard DD statistics from the Finnish Me-teorological Institute. The DD data for each pit-fall study was obtained from a meteorologicalstation closest to the site. The stations do notmeasure heat sums at ground level, which wouldbe more directly interpreted as conditions expe-rienced by the carabids. However, the thermalwindows are better related to phenology ofpoikilotherms than calendar dates, especially forcomparison of sites latitudinally far from eachother (e.g. snow melts a month later in the mostnorthern sites than in the most southern sites).
Data analysisThe data are from several independent studies,with variable pitfall trapping methods, in varia-ble crops and 14 variable growing seasons inseveral widely distributed locations. Each ofthese factors is confounded with all or many ofthe other factors. From the first to the last study,a period of 17 years is covered. No assumptionsare made concerning possible trends in diversi-ty during this time. As a consequence of thisheterogeneity, the data are used only to obtainan overall picture of the diversity of ground bee-tles in Finnish arable land, rather than to attemptto deepen our understanding about their ecolo-gy and function in agroecosystems.

267
A G R I C U L T U R A L A N D F O O D S C I E N C E I N F I N L A N D
Vol. 10 (2001): 261–276.
Ranks of the species abundances were cal-culated as means over the relative (%) catchesin the six data sets. Among the top 30 species inrank abundance, rank frequencies were com-pared. These were calculated as ranks in the in-cidence, or occurrence in the samples of thepooled data. For further comparison, abundanceranks based on total catch of the species in thepooled data were also calculated. Estimate ofGamma (γ) diversity is the total number of spe-cies caught (S).
Shannon-Wiener H’ (see Southwood 1978)was used as a robust and general Alpha (α) di-versity index for the local assemblages represent-ed by the six sets of data:
(1) H’ = Σpilnp
i,
where pi is N
i/N (N stands for total catch of in-
dividuals) for species i. H’ was calculated inthree different ways, first with Amara-specimensidentified to species level, then with Amara ex-cluded, and finally, with Amara sp. at genus lev-el. The last two allowed calculation of the indexalso for the Jokioinen and the SW Finland datasets. Interpretation of H’ in this study must bedone bearing in mind that the ‘local assemblage’refers to ground beetle communities sampled ineach of the individual studies. Thus, due to pool-ing in each of the data sets, H’s do not refer toecologically meaningful entities (which wouldbe assemblages, or communities, at the sametime in the same site). Evenness associated toH’, was calculated as J’ (= H’/lnS).
Rarefaction (Simberloff 1978, see also Kou-ki and Haila 1985, Duelli et al. 1999) was usedto further study the structure of the assemblages:this method models how species are accumulat-ed with increasing number of individuals caughtin the trapping. For any sample size (n) smallerthan the original sample N (n < N), the expectednumber of species E(S
n) is calculated as:
where Ni is the number of individuals of species
i in the original sample. It should be noted thatneither rarefaction curves nor H’ use identitiesof species: in an extreme case, two samples rar-efied to the same number of individuals mayhave the same number of species, but none ofthe same species. Similarly, two samples mayhave the same H’, without sharing the same spe-cies.
For comparison of similarities between thedifferent data sets at the level of species’ identi-ties, two Beta (β) diversity indices were calcu-lated (Wolda 1981). Jaccard index is indicativeof similarity of the species lists only, ignoringthe evenness component. Thus, this index is sen-sitive to species numbers, to the chance event ofgetting a high number of low frequency speciesin the catch:
(3) Cj = j/(a + b–j)
where j is the number of species common to thetwo samples, and a and b are respectively thetotal number of species in each sample (South-wood 1978). The other index, Czekanowski-Sø-rensen-Renkonen’s (subsequently referred to asRenkonen’s index) percentage similarity PS isnot dependent on species numbers, being sensi-tive to the evenness component of α-diversity:
(4) PS = Σ min(p1i, p
2i)
where pi is the proportion of the species i in the
total catch in data sets 1 and 2 (Wolda 1981).For all the diversity indices, Viikki I data weresorted to exclude samples from the plots in whichbeetle movement had been experimentally ma-nipulated, giving 62 species from a catch of31934 specimens in this sub sample. This pre-caution reduced the estimated value of H’, forexample, by only 0.01 to 0.02 units.
Cj and PS were also calculated from sub-setsof data within the same thermal window of DD-range 20.2–580.6°C, set by the narrowest win-dow of the data sets, that of Outokumpu. Thiswas done in order to allow phenologically morerealistic comparison than the comparisons be-
E(Sn) = Σ 1–
S
i =1
N – Ni
n( )N
n( ){ }(2)

268
A G R I C U L T U R A L A N D F O O D S C I E N C E I N F I N L A N D
Helenius, J. et al. Ground beetle diversity
tween the original data sets with variable trap-ping times and variable thermal periods.
Results
Altogether, 111 species of Carabidae were iden-tified from the total of 97799 specimens deter-mined to species level, in the total catch of 99459beetles (Table 3, Appendix 1). This gives an av-erage catch rate of 1.08 ground beetles per trapday.
Order of H’ values were not sensitive to theinclusion or exclusion of Amara sp. at the genuslevel. The values of H’ ranged from 2.32 to 2.97in the three data sets with all species identified(Table 3). The highest alpha-diversity H’, butwith relatively low evenness J’ values, were fromcabbage and sugar beet crops of Viikki II data(Table 3).
Number of species in the data sets rangedfrom 45 to 82. As a cautious, conservative ruleof thumb (in judging from the rarefactioncurves), Finnish crop fields typically harbor cara-bid communities of at least 30 to 40 species.Rarefied to sample size of 600 individuals
(which is sufficiently small sample to includeall our data sets), expected species number wasin every case over 20 species (Fig. 2). Expectedspecies number at 600 individuals in northern(Outokumpu) barley crops was 31 and 32 spe-cies, 5 and 9 species more than in southern (Viik-ki) barley crops in 1990 and 1991, respectively(Table 4, Fig. 2a–b). With this sampling effort,highest expected species number was found fromViikki cabbage and sugar beet (Fig. 2c) crops in1978 and 1979 (Table 4).
The five most abundant species accounted for41.96% of the total catch in the pooled data
Table 3. Number of Carabidae species, number of identified specimens, total catch, α-diversity index H’, and evennessindex (J’). Because for two of the data sets (Jokioinen and SW Finland), no data of Amara at species level were available, H’and J’ are calculated in three versions: first, with Amara species included, then by excluding the genus, and last, by includ-ing the genus. (The data sets are in approximate order from North to South: Siilinjärvi-Outokumpu-Jokioinen-SW Finland-Viikki I-Viikki II.)
Summary statistics Data set Total
Sii Out Jok S-W Fi Viik-I Viik-II
Number of species 45 51 n.a. n.a. 65 82 111(excluding Amara species) (33) (39) (27) (39) (47) (61) (84)No. of specimens identified to species 8722 7160 9844 11453 35908 24712 97799Total catch 8722 7160 10660 11860 36339 24718 99459
Shannon-Wiener H’ (and J’ for row 1.)1. with Amara identified 2.32 2.67 n.a. n.a. 2.53 2.97 .
(evenness J’) (0.34) (0.37) n.a. n.a. (0.31) (0.33)2. with Amara excluded 2.28 2.57 2.41 2.59 2.40 2.77 .3. with Amara at genus level 2.30 2.62 2.53 2.67 2.49 2.78 .
Table 4. Expected number of species E(S) of carabids rare-fied to sample size of 600 individuals. Examples from north-ern and southern spring cereal fields, and southern row cropfields. (SD standard deviation)
Sub-set of data field crop E(S) SD
Outokumpu 1990 barley 30.6 2.12Outokumpu 1991 barley 32.2 2.11Viikki I 1990 barley 25.6 1.78Viikki I 1991 barley 23.2 1.86Viikki II 1978 cabbage 34.8 1.84Viikki II 1979 cabbage 33.9 2.12Viikki II 1978 sugar beet 37.7 1.82Viikki II 1979 sugar beet 29.2 1.15

269
A G R I C U L T U R A L A N D F O O D S C I E N C E I N F I N L A N D
Vol. 10 (2001): 261–276.
Fig. 2. Expected (rarefied) species number against number of individuals caught in pitfalls in Outokumpu and Viikki Ispring barley crops (solid line 1990, dashed line 1991), and in Viikki II sugar beet (solid line 1978, dashed line 1979). (Themiddle line is the mean, and the upper and lower lines are + and – SD, respectively).

270
A G R I C U L T U R A L A N D F O O D S C I E N C E I N F I N L A N D
Helenius, J. et al. Ground beetle diversity
(Fig. 3). These were, in terms of means of therelative catch over the data sets, in rank orderPterostichus melanarius, Clivina fossor, Bembid-ion guttula, Patrobus atrorufus, and Pterostichuscupreus (Table 5). Trechus secalis and T. discusranked among the top five in abundance in thepooled data, but not quite in terms of mean rela-tive abundance. They were numerous in the largedata set (high total catch) of Viikki I. These spe-cies were all included in the list of only 17 spe-cies that were shared by all the data sets. The 17species (numbered 1–10, 12–15, 19–21, 23 inTable 5) were also among the thirty most abun-dant species. Among the top 30 species, two spe-cies were present in the two northern data setsonly. These were Carabus cancellatus and Agon-um muelleri. Another two species were missingfrom both northern data sets: these were Trechusmicros and Acupalpus meridianus. Top 30 spe-cies made up 97.86% of the total catch (Table 5,Fig. 3).
The most frequently collected species wasC. fossor (Table 5), which was found in 11.7%of samples of the pooled data. The ranks in fre-
quencies roughly followed the ranks in meanrelative abundance (Fig. 4). Notably more fre-quent than numerous, i.e. common but not abun-dant species within the top 30 were Harpalusrufipes and T. micros. Among the numerous butnot as frequent species were P. atrorufus, P. cu-preus, P. niger, B. bruxellense, B. gilvipes, Agon-um muelleri and P. crenatus, in order of rank inabundance (Fig. 4).
Percentage similarities (PS) of the speciesassemblages ranged from 48.4% between the twoViikki data sets, to only 16.4% between thenorthern Siilinjärvi data from cereals and thevery southern (coastal) Viikki II data includingrow crops. Jaccard’s Cj of similarity betweenspecies lists varied less, and ranged from 0.39between the previous two data sets, to 0.55 be-tween the two northern sets from cereals, name-ly Siilinjärvi and Outokumpu. Notably, as for PS,Cj was also high between the two Viikki datasets (Table 6). Positive correlation between Cjand PS was weak (R2 = 0.54, P = 0.095). Pheno-logically more realistic comparison (subsets ofdata from the same early season thermal win-
Fig. 3. Relative abundance (% in catch), as mean of the proportions of total catches in pitfalls over the six data sets, againstrank in the mean relative abundance. (Thirty most abundant species. Error bars: SE).

271
A G R I C U L T U R A L A N D F O O D S C I E N C E I N F I N L A N D
Vol. 10 (2001): 261–276.
Table 5. Thirty most abundant species numbered in rank order of mean relative pitfall catch calculated over the data sets(first two columns, see also Fig. 3). Ranks in the data sets (in approximate order from north to south) Siilinjärvi-Outo-kumpu-Jokioinen-SW Finland-Viikki I-Viikki II, and mean over these ranks (nc stands for ‘not caught’, i.e. absent from thedata set) (middle columns). Species’ share in the total catch (pooled data) and rank in this share (two columns next to the lastcolumn). Ranks in frequency (presence-absence) in pitfall samples at level of the pooled data (last column). Note: Amarasp. at genus level, due to incomplete data of species in two of the subsets of data (Jokioinen and SW Finland).
Top 30 species in rank order of Abundance ranks in Total catch: Ranks inmean relative abundance the data sets mean rank % rank frequency
1. Pterostichus melanarius 2-4-3-2-1-10 3.7 13.38 1. 3.2. Clivina fossor 6-1-11-1-3-2 4.0 12.64 2. 1.3. Bembidion guttula 11-6-2-4-4-36 10.5 6.74 5. 4.4. Patrobus atrorufus 1-7-14-3-14-12 8.5 4.90 7. 11.5. Pterostichus cupreus 4-5-1-7-22-46 14.2 4.30 10. 15.6. Bembidion quadrimaculatum 15-3-9-6-10-7 8.3 4.84 8. 7.7. Trechus secalis 14-22-8-5-5-3 9.5 7.27 3. 5.8. Amara sp.* 16-11-5-10-7-1 8.3 6.61 6. 2.9. Pterostichus niger 3-21-6-9-15-22 12.7 3.23 12. 16.
10. Trechus discus 8-20-19-13-2-19 13.5 7.10 4. 8.11. Bembidion bruxellense 5-2-nc-14-29-24 . 1.65 16. 20.12. Harpalus rufipes 23-18-13-11-6-6 12.3 4.56 9. 6.13. Bembidion properans 28-12-21-21-8-4 15.7 4.08 11. 10.14. Trechus quadristriatus 21-34-7-15-9-8 15.7 2.82 14. 9.15. Bembidion lampros 17-10-15-8-16-9 12.5 2.04 15. 13.16. Calathus melanocephalus 27-28-nc-23-13-5 . 2.88 13. 12.17. Bembidion gilvipes nc-24-4-18-nc-41 . 1.08 20. 25.18. Carabus cancellatus 7-9-nc-nc-nc-nc . 0.63 23. 22.19. Harpalus affinis 25-17-17-12-17-13 16.8 1.15 18. 18.20. Loricera pilicornis 13-13-12-20-18-16 15.3 0.84 21. 19.21. Synuchus vivalis 10-30-24-17-11-18 18.3 1.39 17. 17.22. Dyschirius globosus nc-8-26-24-25-35 . 0.38 25. 23.23. Pterostichus strenuus 19-15-10-16-35-30 20.8 0.45 24. 24.24. Trechus micros nc-nc-22-19-12-17 . 1.12 19. 14.25. Agonum muelleri 9-16-nc-nc-nc-nc . 0.30 28. 34.26. Calathus erratus nc-35-28-28-19-11 . 0.70 22. 21.27. Asaphidion flavipes 30-14-nc-27-29-46 . 0.14 35. 28.28. Pterostichus crenatus 12-19-nc-25-26-46 . 0.16 31. 35.29. Acupalpus meridianus nc-nc-nc-34-24-14 . 0.35 26. 30.30. Carabus granulatus 24-30-15-nc-38-41 . 0.14 34. 29.Total 97.86%
* of which the most abundant:Amara bifrons 42.79A. apricaria 9.18A. plebeja 5.17A. communis 3.96A. aulica 3.64A. municipalis 2.69In all from total of Amara sp. 67.42%

272
A G R I C U L T U R A L A N D F O O D S C I E N C E I N F I N L A N D
Helenius, J. et al. Ground beetle diversity
dow defined by DD sums) increased PS valuesby a mean of 4.6%-units (SD 0.85), and Cj val-ues by 0.04 (SD 0.03) (Table 6), but did notchange the order in the comparison.
Discussion
For a reliable diversity estimate, sampling shouldaccess all species equally and in proportion oftheir population densities. Pitfall trapping meas-
ures a combination of density and activity of theindividuals, and even trappability may vary be-tween species and be sensitive to slight modifi-cations of the trap design (see e.g. Greenslade1964, Holopainen 1992, Sundarland et al. 1995).On the other hand, pitfall trapping is cheap andeffective in collecting large numbers over shortperiods of time. Most importantly, pitfall trap-ping is by far the most frequently used methodin even ecological studies of ground beetles(Kromp 1999), its shortcomings are known, andin many cases, activity density is exactly whatis needed, especially for studies concerning func-
Fig. 4. Rank in frequency (occurrence or incidence in samples) against rank in mean relative abundance ofthe thirty most abundant species in the pooled data. (Species’ order as in Fig. 3, and in Table 5.)
Table 6. Similarity (beta-diversity) indices of Jaccard (Cj: above the diagonal) and Renkonen (PS-%: be-low the diagonal) for the data sets (including only the sets for which all the specimens, including Amarasp., were identified to species level). For a phenologically adjusted comparison, index values are alsogiven for early season sub-sets of data set by Outokumpu day-degree (DD) window (in parentheses: in-cluding catches at DD range 20.2–580.6)
Data set: Siilinjärvi Outokumpu Viikki I Viikki II
Siilinjärvi ------------- 0.55 0.40 0.39Outokumpu 44.3 ------------- 0.44 (0.45) 0.39 (0.46)Viikki I 35.7 44.2 (48.2) ------------- 0.54 (0.58)Viikki II 16.4 33.7 (39.1) 48.4 (52.7) -------------

273
A G R I C U L T U R A L A N D F O O D S C I E N C E I N F I N L A N D
Vol. 10 (2001): 261–276.
tional diversity of this family. In estimating spi-der diversity by four different methods, Codding-ton et al. (1996) found that each method collect-ed clearly different set of species. Future stud-ies of carabid diversity would benefit from sucha comparison of sampling methods. Here, wediscuss our results keeping in mind that the esti-mates are specific to pitfall sampling.
Our estimate of regional (or Gamma) diver-sity of farmland carabids in Finland was 111species. Six more species would be added froma total pitfall sample of 36675 beetles from farm-land around Lammi Biological Station in south-ern Finland in 1991–1996, analyzed by Kinnunenet al. (1996, 2001), and Kinnunen and Tiainen(1999). The 117 species is 40% of carabid spe-cies found in Finland, including forests and allother habitats (Lindroth 1985, 1986).
The alpha-diversities calculated from ourdata (from pooled samples) do not refer to gen-uine local communities in one place and time.However, the H’ values may be used as roughindices of richness and evenness of the assem-blages sampled. We present these in order to al-low comparison to possible further monitoringstudies, which may conveniently be based onmeta-analysis of several data sets, as in thisstudy.
Using rarefaction, we came up with an esti-mate of at least 30 to 40 species in an ordinaryagricultural field in Finland. This would includeall species from the early season ones (adultoverwinterers) to late season ones (larval over-winterers). Duelli et al. (1999), using sophisti-cated extrapolation from rarefaction curves, re-port estimates of 37.9 ± 5.6 (SD) and 43.1 ± 6.8species in winter wheat and maize in Switzer-land. They sampled by funnel-type pitfalls,which are more efficient than cup type ones(Obrist and Duelli 1996). Their estimates as wellas the rarefaction curves they present are remark-ably close to the ones we report here. We con-sider these estimates being conservative ratherthan liberal. Exhaustive sampling would resultin higher estimates: Kinnunen et al. (Heidi Kin-nunen, Seppo Rekolainen and MaximillianPosch, manuscript: see Kinnunen 1999) trapped
18724 carabid beetles with 900 pitfalls in 45 daysin a one hectare plot within a bare fallow field,and caught 60 species.
Boreal coniferous forests dominate Finnishlandscapes. Fields are embedded in the taiga. Incomparison to rarefaction curves for carabidbeetle assemblages in the southern Finnish taiga,provided by Niemelä et al. (1990), the curvesfor the assemblages in the agricultural fields in-dicate more species rich and more even commu-nities. For a sample of 100 individuals from aforest community, ca. 10 species were found(Niemelä et al. 1990), whereas in our samplesfrom agricultural land, the same effort wouldyield twice as many species. Rarefied speciesnumber for 600 individuals ranged from 16.6 ±0.5 species to 20.6 ± 0.6 species in forests(Niemelä et al. 1990), again almost only half ofthe values in our data. Why should agriculturalfields have higher diversity than successionallymature, relatively stable and undisturbed forests?Although the analysis is outside the scope of thispaper, we suggest the contemporary disturbance(non-equilibrium) theory to be applicable. It ex-plains how richness may peak at intermediatelevel of disturbance frequency (Bagon et al.1996, p. 813–827, 908–912 and references there-in. See also Pachepsky et al. 2001). Agriculturalfields are not in a succession and they are pre-dictable habitats. Although ‘disturbed’, the dis-turbance pattern is rather stable irrespective ofcrop rotation (‘same procedure as last year’, con-cerning ploughing, sowing etc.).
Percentage similarities measured by Renko-nen PS among the data sets were in every caselower (always less than 50%) than those report-ed from forest communities (usually 50% orhigher: Niemelä et al. 1990). Assemblages aremore variable in fields than in forests. This is inagreement with Kinnunen (1999, p. 10), whoconcludes: “In forests (…) communities of near-by sites were very similar. The fields instead seemto support less predictable communities.” Again,the disturbance theory provides a way to under-stand the pattern.
Communities of carabids in surrounding for-est patches provide a source of immigrants into

274
A G R I C U L T U R A L A N D F O O D S C I E N C E I N F I N L A N D
Helenius, J. et al. Ground beetle diversity
fields. 24 (70.6%) of the 34 species found byNiemelä et al. (1990) were also included in ourlist. Effect of drawing from a same regional poolmay best (and in agreement with disturbancetheory and the patch-dynamics concept) explainwhy relatively high similarity (by both Cj andPS) was associated with regional closeness (thetwo northern data sets, vs. the two southern datasets), rather than to same or similar (as a habi-tat) agricultural crops. Our data are only indica-tive in this respect, but in full agreement withKinnunen et al. (2001) who found that carabidcommunities varied significantly among patch-es of farmland but not between fields of differ-ent crops within the patches. This and formerlypublished research strongly suggest that it is thelandscape level of spatial hierarchy at whichcarabids form communities, and at field or croplevel, patterns are less clear and the carabidsappear as random assemblages (Thiele 1977,Burel 1989, Burel and Baudry 1995, Östman etal. 2001, see also Kromp 1999, Kinnunen 1999).
Carabids are a species rich family in farm-land. Their activity-densities are high through-out growing season. As generalists they are not
dependent on any pest species as prey: they arealways present in the fields, and may contributeto natural control of pests as a buffer against in-vaders. Economic significance of the groupwould become obvious only if carabids weremissing from the crop fields (see Helenius 1990for a result of ca. 20% yield reduction in oats,following only partial removal of carabids).
Because of their diversity and potential roleas beneficials, we suggest including carabids intomonitoring of biodiversity in agroecosystems. Indesigning such schemes, we suggest landscapelevel sampling frames, rather than randomlychoosing individual fields for sampling. Pitfallsampling has an advantage of being much used,which eases comparisons to earlier studies.
Acknowledgements. We would like to thank Virpi Vornefor collating the data and Lauri Jauhiainen for program-ming for the rarefaction. Also, our thanks are due to ArjaVasarainen, Timo Tolonen, Ilpo Mannerkoski, Ilpo Rutanenand many others who helped collect the raw material andin compiling the data. The study was financed by publicgrants from the Academy of Finland, by Ministry of Agri-culture and Forestry, and by a private grant to Juha Hele-nius from the Finnish Entomological Society.
References
Ahti, T., Hämet-Ahti, L. & Jalas, J. 1968. Vegetation zonesand their sections in northwestern Europe. AnnalesBotanici Fennici 5: 169–211.
Bagon, M., Harper, J.L. & Townsend, C.R. 1996. Ecology.Individuals, populations and communities. 3rd Ed.Blackwell Science, Oxford. 1068 p.
Burel, F. 1989. Landscape structure effects on carabidbeetles spatial patterns in western France. Land-scape Ecology 2: 215–226.
– & Baudry, J. 1995. Species biodiversity in changingagricultural landscapes: a case study in the Paysd’Auge France. Agriculture, Ecosystems and Environ-ment 55: 193–200.
Coddington, J.A., Young, L.H. & Coyle, F.A. 1996. Esti-mating spider species richness in a southern Appa-lachian cove hardwood forest. The Journal of Arach-nology 24: 111–128.
Duelli, P. Obrist, M.K. & Schmatz, D.R. 1999. Biodiversityevaluation in agricultural landscapes: above groundinsects. Agriculture, Ecosystems and Environment 74:33–64.
Greenslade, P.J.M. 1964. Pitfall trapping as a method forstudying populations of Carabidae (Coleoptera). Jour-nal of Animal Ecology 33: 301–310.
Helenius, J. 1990. Effect of epigeal predators on infesta-tion by the aphid Rhopalosiphum padi and on grainyield of oats in monocrops and mixed intercrops.Entomologia experimentalis et applicata 54: 225–236.
– 1991a. Insect numbers and pest damage in intercropsvs. monocrops: concepts and evidence from a sys-tem of faba bean, oats and Rhopalosiphum padi(Homoptera, Aphididae). Journal of Sustainable Ag-riculture 1: 57–80.
– 1991b. Integrated control of Rhopalosiphum padi, andthe role of epigeal predators in Finland. IOBC / WPRSBulletin 14: 123–130.
– 1995. Rate and local scale spatial pattern of adultemergence of the generalist predator Bembidion gut-tula in an agricultural field. Acta Jutlandica 70, 2: 101–111.
–, Holopainen, J., Muhojoki, M., Pokki, P., Tolonen, T. &Venäläinen, A. 1995. Effect of undersowing and green

275
A G R I C U L T U R A L A N D F O O D S C I E N C E I N F I N L A N D
Vol. 10 (2001): 261–276.
manuring on abundance of ground beetles (Coleop-tera, Carabidae) in cereals. Acta Zoologica Fennica1996: 156–159.
– & Tolonen, T. 1994. Enhancement of generalis aphidpredators in cereals: effect of green manuring on re-cruitment of ground beetles (Col., Carabidae). IOBC/ WPRS Bulletin 17: 201–210.
Holopainen, J.K. 1992. Catch and sex ratio of Carabidae(Coleoptera) in pitfall traps filled with ethylene glycolor water. Pedobiologia 36: 257–261.
–, Bergman, T., Hautala, E.L. & Oksanen, J. 1995. Theground beetle fauna (Coleoptera: Carabidae) in rela-tion to properties and foliar fluoride content in springcereals. Pedobiologia 39: 193–206.
– & Helenius, J. 1992. Gut contents of ground beetles(Col., Carabidae), and activity of these and otherepigeal predators during an outbreak of Rhopal-osiphum padi (Hom., Aphididae). Acta AgriculturaeScandinavica 42: 57–61.
– & Varis, A.-L. 1986. Effects of mechanical barrier andformalin preservative on pitfall catches of carabidbeetles (Coleoptera, Carabidae) in arable fields. Jour-nal of Applied Entomology 102: 440–445.
Hughes, R.D. 1959. The natural mortality of Erioischiabrassicae (Bouché) (Diptera, Anthomyiidae) duringthe egg stage of the first generation. Journal of Ani-mal Ecology 28: 343–357.
Huusela-Veistola, E. 1996. Effects of pesticide use andcultivation techniques on ground beetles (Col., Cara-bidae) in cereal fields. Annales Zoologici Fennici 33:197–205.
– 2000. Effects of pesticide use and perennial grassstrips on arthropod fauna in northern field ecosys-tems. Annales Universitatis Turkuensis Ser. AII Tom.130. 95 p.
Kinnunen, H. 1999. In search of spatial scale – Carabidbeetle communities in agricultural landscapes. A PhDdissertation, Department of Ecology and Systemat-ics, University of Helsinki. Helsinki.
–, Järveläinen, K., Pakkala, T. & Tiainen, J. 1996. Theeffects of isolation on the occurrence of farmlandcarabids in a fragmented landscape. Annales Zoo-logici Fennici 33: 165–171.
– & Tiainen, J. 1999. Carabid distribution in a farmlandmosaic: the effect of patch type and location. Annal-es Zoologici Fennici 36: 149–158.
–, Tiainen, J. & Tukia, H. 2001. Farmland carabid beetlecommunities at multiple levels of spatial scales. Ec-ography 24: 189–197.
Kouki, J. & Haila, Y. 1985. Lajimäärä, näytekoko ja rare-faktio – lajimäärän vertailun ongelma. Luonnon Tut-kija 89: 156–159.
Kromp, B. 1999. Carabid beetles in sustainable agricul-ture: a review on pest control efficacy, cultivation im-pacts and enhancement. Agriculture, Ecosystemsand Environment 74: 187–228.
Lindroth, C.H. 1985. The Carabidae (Coleoptera) of Fen-noscandia and Denmark. Fauna Entomologica Scan-dinavica 15, 1. 225 p.
– 1986. The Carabidae (Coleoptera) of Fennoscandiaand Denmark. Fauna Entomologica Scandinavica 15,2. 497 p.
Lövei, G.L. & Sunderland, K.D. 1996. Ecology and be-haviour of ground beetles (Coleoptera: Carabidae).Annual Review of Entomology 41: 231–256.
Niemelä, J., Haila, Y., Halme, E., Pajunen, T. & Punttila,P. 1990. Diversity variation in carabid beetle assem-blages in the southern Finnish taiga. Pedobiologia34: 1–10.
Obrist, M.K. & Duelli, P. 1996. Trapping efficiency of fun-nel- and cup-traps for epigeal arthropods. Mitteilun-gen den Schweizerischen Entomologischen Ge-schellshaft 69: 361–369.
Östman, Ö., Ekbom, B., Bengtsson, J. & Weibull, A.-C.2001. Landscape complexity and farming practiceinfluence the condition of polyphagous carabid bee-tles. Ecological Applications 11: 480–488.
Pachepsky, E., Crawford, J.W., Brown, J.L. & Squire, G.2001. Towards a general theory of biodiversity. Na-ture 410: 923–926.
Potts, G.R. & Vickerman, G.P. 1974. Studies on the cere-al ecosystem. Advances in Ecological Research 8:107–197.
Silfverberg, H. 1992. Enumeratio Coleopterorum Fenno-scandiae, Daniae et Baltiae. Helsinki, Helsingin Hyön-teisvaihtoyhdistys.
Simberloff, D. 1978. Use of rarefaction and related meth-ods in ecology. In: Dickson, K.L. et al. (eds.). Biolog-ical Data in Water Pollution Assessment: Quantita-tive and Statistical Aanalyses. ASTM STP 652, Amer-ican Society for Testing and Materials, p. 150–165.
Southwood, T.R.E. 1978. Ecological methods. Chapmanand Hall. London, New York. 524 p.
Sunderland, K.D., De Snoo, G.R., Dinter, A., Hance, T.,Helenius, J., Jepson, P., Kromp, B., Lys, J.-A.,Samu, F., Sotherton, N.W., Toft, S. & Ulber, B. 1995.Density estimation for invertebrate predators in agr-oecosystems. Acta Jutlandica 70, 2: 133–162.
Thiele, H.-U. 1977. Carabid beetles in their environments.Springer Verlag, Berlin. 396 p.
Varis, A.-L. 1982. Insekticidernas effect på carabidpreda-torerna av kålflugor. Integrerad bekämpning I grön-saker på friland med särskild hänblick på skadedjur,NJF Seminarium nr. 31. p. 25.
– 1989. Cabbage field Carabidae (Coleoptera) and theirrole as natural enemies of Delia radicum and D. flo-ralis (Diptera, Anthomyiidae). Acta EntomologicaFennica 53: 61–63.
–, Holopainen, J.K. & Koponen, M. 1984. Abundanceand seasonal occurrence of adult Carabidae (Cole-optera) in cabbage, sugar beet and timothy fields insouthern Finland. Zeitschrift für angewandte Ento-mologie 98: 62–73.
Vasarainen, A. & Kurppa, S. 1996. Vegetation and cara-bid fauna affected by conventional and biologicalcultivation. In: Proceedings of the 20th InternationalCongress of Entomology, Firenze, Italy, 25–31 Au-gust 1996. p. 661.
Wishart, G., Doane, F.J. & Maybee, G.E. 1956. Notes onbeetles as predators of eggs of Hylemya brassicae(Bouché) (Diptera, Anthomyiidae). Canadian Ento-mologist 88: 634–639.
Wolda, H. 1981. Similarity indices, sample size and di-versity. Oecologia 50: 296–302.

276
A G R I C U L T U R A L A N D F O O D S C I E N C E I N F I N L A N D
Helenius, J. et al. Ground beetle diversity
SELOSTUSMaakiitäjäisten lajimonimuotoisuus suomalaisilla peltoviljelmillä
Juha Helenius, Jarmo K. Holopainen, Erja Huusela-Veistola, Sirpa Kurppa, Pia Pokki ja Anna-Liisa VarisHelsingin yliopisto ja MTT (Maa- ja elintarviketalouden tutkimuskeskus)
Maakiitäjäisten lajimonimuotoisuutta suomalaisillapeltoviljelmillä selvitettiin kuudesta toisistaan riip-pumattomasta tutkimuksesta, joista vanhin oli vuo-delta 1978 ja uusin vuodelta 1994. Kuoppa-ansapyyn-nillä koottu aineisto käsitti 97 799 maakiitäjäisyksi-löä, jotka määritettiin 111 lajiin. Shannonin-Wienerindiversiteetti-indeksin H’ arvo oli tyypillisesti noin2,5. Kuudensadan yksilön otoskokoon rarefoitu, odo-tettavissa oleva lajimäärä yksittäiseltä peltolohkoltaoli noin 30 lajia. Viisi runsainta lajia muodostivat42 % ja 30 runsainta lajia 98 % koko yksilömääräs-tä. Lajimäärän ja runsaussuhteet huomioon ottavaRenkosen prosentuaalisen samankaltaisuuden indek-si PS sai arvoja 16 % samankaltaisuudesta aina 48 %samankaltaisuuteen osa-aineistojen välillä. Samaltamaantieteelliseltä alueelta pyydetyt aineistot olivatkasvustotyypistä riippumatta samankaltaisempia kuineri alueilta pyydetyt aineistot.
Suomessa pellot ovat tyypillisesti ainakin osittainmetsien ympäröimiä. Verrattuna metsälajistosta jul-kaistuihin tietoihin, peltomaiden maakiitäjäisyhteisötovat lajirikkaampia, ja niissä lajien väliset runsaus-suhteet ovat tasaisempia kuin metsien maakiitäjäis-yhteisöissä. Tarkastelemme tätä yhteisöekologisenhäiriöteorian valossa, jonka mukaan yhteisöjen laji-diversiteetit ovat korkeimmillaan kohtuullisesti (kes-kinkertaisen usein) häirityissä elinympäristöissä.
Tuloksemme korostavat viljelyalueen (alue-eko-logisen tason) merkitystä lohkotason tai viljelykas-vilajin sijasta, pyrittäessä ymmärtämään viljelymai-den maakiitäjäisdiversiteetin vaihtelua paikasta toi-seen. Ehdotamme, että maakiitäjäislajistot otetaanmukaan maatalousympäristön biodiversiteetin seuran-taan, ja että seuranta näiden osalta järjestettäisiin vil-jelyalueiden mittakaavassa.

277
A G R I C U L T U R A L A N D F O O D S C I E N C E I N F I N L A N D
Vol. 10 (2001): 261–276.
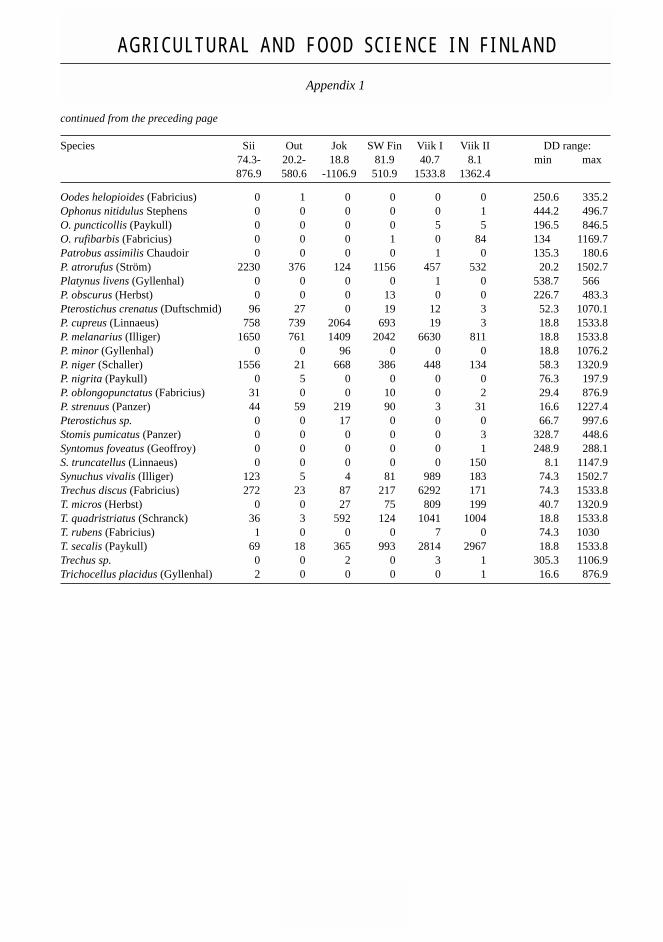
Species of Carabidae and their total catch using pitfall-traps. Thermal window of Day Degrees (DD. above 5°C) of trapping,as well as DD range in which the species was trapped. The DD range gives an indication of thermal activity range, but isartificially limited by the period of pitfall trapping (see also Table 1). (Note: ‘0’ denotes not caught, ‘–’ denotes not identi-fied).
Species Sii Out Jok SW Fin Viik I Viik II DD range:74.3- 20.2- 18.8 81.9 40.7 8.1 min max876.9 580.6 -1106.9 510.9 1533.8 1362.4
Acupalpus meridianus (Linnaeus) 0 0 0 6 14 332 66.5 849.3A. parvulus (Sturm) 0 0 0 0 5 28 87.4 529.9Agonum fuliginosum (Panzer) 41 0 0 0 0 3 74.3 876.9A. gracile Sturm 0 0 0 13 0 0 231.5 483.3A. micans Nicolai 1 0 0 0 0 0 74.3 876.9A. muelleri (Herbst) 245 53 0 0 0 0 32.7 876.9A. piceum (Linnaeus) 0 9 0 0 0 0 69 400.7A. sexpunctatum (Linnaeus) 47 16 0 0 0 0 74.3 876.9Amara aenea (Degeer) 5 7 – – 0 9 74.3 1007.3A. apricaria (Paykull) 3 14 – – 480 106 56.6 1320.9A. aulica (Panzer) 3 4 – 5 73 154 74.3 1160.3A. bifrons (Gyllenhal) 14 8 – – 236 2554 8.1 1257.1A. brunnea (Gyllenhal) 0 0 – – 0 1 970.8 1028.4A. communis (Panzer) 3 21 – – 3 233 8.1 1127A. consularis (Duftschmid) 0 0 – – 29 50 168.3 1238A. convexiuscula (Marsham) 0 0 – – 0 16 413.5 1040.2A. curta Dejean 0 1 – – 3 0 85.6 807.7A. cursitans Zimmermann 0 0 – – 0 1 1136.6 1169.7A. equestris (Duftschmid) 0 0 – – 7 2 168.3 965.1A. eurynota (Panzer) 1 0 – 23 115 33 61.6 1320.9A. famelica Zimmermann 2 2 – – 20 0 74.3 883.1A. familiaris (Duftschmid) 0 17 – – 7 3 88 715.4A. fulva (Müller) 0 0 – – 8 110 134 1195.5A. gebleri Dejean 0 1 – – 0 0 231.2 313.5A. ingenua (Duftschmid) 0 0 – – 2 172 193.9 1227.4A. littorea Thomson 0 0 – – 0 1 1136.6 1169.7A. lunicollis Schiödte 0 8 – – 1 2 102.2 764A. majuscula (Chaudoir) 0 0 – – 7 39 115.8 1205.4A. montivaga Sturm 0 0 – – 1 2 58.3 444A. municipalis (Duftschmid) 0 0 – – 1 176 328.7 1257.1A. nitida Sturm 1 0 – – 0 0 74.3 876.9A. ovata (Fabricius) 2 0 – – 1 2 74.3 876.9A. plebeja (Gyllenhal) 23 101 – 9 207 0 35.9 1257.1A. quenseli (Schönherr) 1 0 – – 0 0 74.3 876.9A. similata (Gyllenhal) 2 6 – – 0 5 35.9 952Amara sp. 0 0 745 293 371 5 18.8 1533.8Anchomenus dorsalis (Pontoppidan) 0 0 0 1 53 132 58.3 1197.8Anisodactylus binotatus (Fabricius) 0 1 0 0 0 0 313.5 400.7Asaphidion flavipes (Linnaeus) 1 110 0 18 6 3 20.2 876.9A. pallipes (Duftschmid) 0 12 0 0 1 162 135.1 1040.2Badister bullatus (Schrank) 0 0 0 0 0 1 328.7 358.5B. lacertosus Sturm 0 0 0 0 1 0 152.6 206.9Bembidion biguttatum (Fabricius) 0 0 0 2 0 0 287.1 472.8B. bruxellense Wesmaël 390 928 0 202 6 111 20.2 970.8B. femoratum Sturm 6 0 0 0 0 75 74.3 1147.9
continued on the next page
A G R I C U L T U R A L A N D F O O D S C I E N C E I N F I N L A N D
Appendix 1

278
A G R I C U L T U R A L A N D F O O D S C I E N C E I N F I N L A N D
Helenius, J. et al. Ground beetle diversity
continued from the preceding page
Species Sii Out Jok SW Fin Viik I Viik II DD range:74.3- 20.2- 18.8 81.9 40.7 8.1 min max876.9 580.6 -1106.9 510.9 1533.8 1362.4
B. gilvipes Sturm 0 12 976 79 0 5 18.8 1106.9B. guttula (Fabricius) 112 668 1938 1019 2957 11 18.8 1320.9B. lampros (Herbst) 53 227 121 393 363 874 8.1 1533.8B. nigricorne Gyllenhal 0 0 0 0 3 0 180.6 395.8B. properans (Stephens) 2 131 38 57 1217 2614 16.6 1533.8B. quadrimaculatum (Linnaeus) 61 876 341 964 1011 1561 8.1 1533.8B. tetracolum Say 0 0 0 0 0 2 18.8 934.3Bembidion sp. 0 0 6 0 54 0 728.6 1227.4Bradycellus caucasicus Chaudoir 0 1 0 0 0 4 45.7 1195.5B. harpalinus (Audinet-Serville) 0 0 0 0 0 3 1169.7 1227.4Broscus cephalotes (Linnaeus) 0 0 0 0 2 38 187.4 1147.9Calathus ambiguus (Paykull) 0 0 0 0 1 309 271.8 1197.8C. erratus (Sahlberg) 0 2 1 16 97 579 26 1227.4C. melanocephalus (Linnaeus) 4 7 0 33 808 2017 26 1533.8C. micropterus (Duftschmid) 0 0 0 0 4 0 443.7 715.4Carabus cancellatus Illiger 355 270 0 0 0 0 20.2 876.9C. granulatus Linnaeus 10 5 121 0 2 5 18.8 1106.9C. hortensis Linnaeus 0 0 0 0 1 1 830.5 1007.3C. nemoralis Müller 0 0 2 19 8 47 52.3 1362.4C. violaceus Linnaeus 0 0 0 0 1 0 810.9 934.3Carabus sp. 0 0 2 44 0 0 51 663.6Clivina fossor (Linnaeus) 366 1073 202 2073 5819 3041 8.1 1533.8Cychrus caraboides (Linnaeus) 0 0 0 0 1 2 248.9 1177.3Dicheirotrichus rufithorax (Sahlberg) 0 0 0 0 0 7 231.4 911.5Dromius sigma (Rossi) 0 0 3 4 0 5 26 483.5Dyschirius globosus (Herbst) 0 316 2 32 13 13 20.2 799.8D. politus (Dejean) 0 0 0 0 0 3 134 483.5D. thoracicus (Rossi) 0 7 0 0 0 0 83.9 400.7Dyschirius sp. 0 0 41 0 0 0 18.8 1106.9Elaphrus riparius (Linnaeus) 1 12 0 0 0 1 74.3 876.9Elaphrus sp. 0 0 0 5 0 0 95.2 455.1Harpalus affinis (Schrank) 8 36 102 219 253 522 29.4 1320.9H. latus (Linnaeus) 0 5 68 57 4 10 18.8 1047.3H. luteicornis (Duftschmid) 0 0 0 0 1 0 87.4 127.2H. quadripunctatus Dejean 1 0 0 0 3 15 74.3 1195.5H. rufipes (Degeer) 19 28 133 243 2245 1866 52.3 1533.8H. tardus (Panzer) 0 0 0 0 0 6 66.7 586.5Harpalus sp. + Ophonus sp. 0 0 2 28 2 0 187.4 716.3Lebia chlorocephala (Hoffmannsegg) 0 1 0 1 0 0 273.2 523.8Leistus ferrugineus (Linnaeus) 0 0 0 0 0 6 735.7 1227.4L. terminatus (Hellwig) 0 1 5 0 16 27 145 1320.9Leistus sp. 0 0 0 0 1 0 715.4 792.4Loricera pilicornis (Fabricius) 71 125 136 74 210 224 16.6 1320.9Microlestes minutulus (Goeze) 0 0 0 9 53 17 133.5 846.5Notiophilus aquaticus (Linnaeus) 0 0 0 0 0 74 16.6 1301.2N. palustris (Duftschmid) 0 0 0 4 0 1 231.5 1227.4Notiophilus sp. 0 0 1 0 0 0 1 663.6 822.6Olisthopus rotundatus (Paykull) 0 0 0 15 0 0 95.2 232
continued on the next page
A G R I C U L T U R A L A N D F O O D S C I E N C E I N F I N L A N D
Appendix 1
279
A G R I C U L T U R A L A N D F O O D S C I E N C E I N F I N L A N D
Vol. 10 (2001): 261–276.
continued from the preceding page
Species Sii Out Jok SW Fin Viik I Viik II DD range:74.3- 20.2- 18.8 81.9 40.7 8.1 min max876.9 580.6 -1106.9 510.9 1533.8 1362.4
Oodes helopioides (Fabricius) 0 1 0 0 0 0 250.6 335.2Ophonus nitidulus Stephens 0 0 0 0 0 1 444.2 496.7O. puncticollis (Paykull) 0 0 0 0 5 5 196.5 846.5O. rufibarbis (Fabricius) 0 0 0 1 0 84 134 1169.7Patrobus assimilis Chaudoir 0 0 0 0 1 0 135.3 180.6P. atrorufus (Ström) 2230 376 124 1156 457 532 20.2 1502.7Platynus livens (Gyllenhal) 0 0 0 0 1 0 538.7 566P. obscurus (Herbst) 0 0 0 13 0 0 226.7 483.3Pterostichus crenatus (Duftschmid) 96 27 0 19 12 3 52.3 1070.1P. cupreus (Linnaeus) 758 739 2064 693 19 3 18.8 1533.8P. melanarius (Illiger) 1650 761 1409 2042 6630 811 18.8 1533.8P. minor (Gyllenhal) 0 0 96 0 0 0 18.8 1076.2P. niger (Schaller) 1556 21 668 386 448 134 58.3 1320.9P. nigrita (Paykull) 0 5 0 0 0 0 76.3 197.9P. oblongopunctatus (Fabricius) 31 0 0 10 0 2 29.4 876.9P. strenuus (Panzer) 44 59 219 90 3 31 16.6 1227.4Pterostichus sp. 0 0 17 0 0 0 66.7 997.6Stomis pumicatus (Panzer) 0 0 0 0 0 3 328.7 448.6Syntomus foveatus (Geoffroy) 0 0 0 0 0 1 248.9 288.1S. truncatellus (Linnaeus) 0 0 0 0 0 150 8.1 1147.9Synuchus vivalis (Illiger) 123 5 4 81 989 183 74.3 1502.7Trechus discus (Fabricius) 272 23 87 217 6292 171 74.3 1533.8T. micros (Herbst) 0 0 27 75 809 199 40.7 1320.9T. quadristriatus (Schranck) 36 3 592 124 1041 1004 18.8 1533.8T. rubens (Fabricius) 1 0 0 0 7 0 74.3 1030T. secalis (Paykull) 69 18 365 993 2814 2967 18.8 1533.8Trechus sp. 0 0 2 0 3 1 305.3 1106.9Trichocellus placidus (Gyllenhal) 2 0 0 0 0 1 16.6 876.9
A G R I C U L T U R A L A N D F O O D S C I E N C E I N F I N L A N D
Appendix 1
Related Documents