Ground-based simulation for the effects of space plasma on spacecraft Yehia A. Abdel-Aziz a,b,⇑ Afaf M. Abd El-Hameed a a National Research Institute of Astronomy and Geophysics (NRIAG), Helwan, Cairo, Egypt b Mathematics Dept., Faculty of Science, Hail University, Saudi Arabia Received 26 September 2011; received in revised form 17 July 2012; accepted 24 July 2012 Available online 6 August 2012 Abstract Plasma ground tests introduced some kind of facilities to study spacecraft interaction with ionospheric plasmas at NRIAG. In this paper, the description of design and performance of our ground based simulation plasma in low earth orbit (LEO) are presented. Dif- ferent types of solar arrays and samples of spacecraft’s surface materials have been tested in the vacuum chamber under the effects of the generated plasma. Diagnostic tools are used to measure arc current, and record the variations in the potential. The obtained data is used to study the correlation between external parameters (discharge voltage plasma density, additional capacitance and resistance, bias volt- age: etc.). Moreover, we analyze the characteristics of some processes such as plasma waveform, surface charging and potentials, and pulse width arc current and amplitude. Argon gas is used to generate plasma for simulating the plasma properties. The application of this plasma flowing gives the threshold in voltage and current at which potential the current is cut off in the connector. The effect of the plasma on an aluminum thin layer and a solar cell sample which are used on spacecraft surfaces is studied. Ó 2012 COSPAR. Published by Elsevier Ltd. All rights reserved. Keywords: Spacecraft charging; Plasma simulation; Argon plasma; Sample test; Laboratory experiments 1. Introduction Spacecraft charging reside in all three charging environ- ments, i.e. low earth orbit (LEO), the radiation belts, and geostationary and geosynchronous orbits (GEO). In all regimes, a spacecraft will electrically charge to balance incoming ambient ion and electron currents, typically charging negative in order to collect enough of the less mobile ions. The ionospheric plasma is one of the main constituents in the atmosphere at low earth orbit. Interac- tion between LEO–like plasma and spacecraft require more attention. The charging behavior of a spacecraft is con- trolled mainly by ram/wake effects, the electrical grounding configuration of the solar arrays, and the exposure of high voltage surfaces to the ambient plasma. Most of the adverse effects caused by spacecraft charging in LEO (i.e. sputtering, contamination, arcing, degradation, and break ponds) depend on the charging level or the floating poten- tial of the spacecraft (Agrawal, 1986). During a geomag- netic sub storm the spacecraft is immersed in very energetic plasma. This environment has been shown to charge spacecraft surfaces to the extent that electrostatic discharges occur. The charging behavior during a sub storm is controlled mainly by the plasma characteristics, the properties of the materials comprising the spacecraft outer surface, and sun/shade effects as in Tahara and Mas- uyama (2006). Many authors have shown that, there are a number of negative effects and hazards due to the interac- tion of spacecraft with space plasma. Hazards, such as contaminations, arcing, and breaking of chemical bonds reduce the efficiency of electronic devices. Similarly, accu- mulation of electrical charges leads to the variation in the potentials which affect the body of the satellite and the con- nectors of the solar panels of the spacecraft (see, Tahara and Masuyama, 2006). 0273-1177/$36.00 Ó 2012 COSPAR. Published by Elsevier Ltd. All rights reserved. http://dx.doi.org/10.1016/j.asr.2012.07.026 ⇑ Corresponding author. Address: National Research Institute of Astronomy and Geophysics (NRIAG), Space Research Lab., Elmarssed St., Helwan, Cairo, Egypt. Fax: +20 225548020. E-mail address: [email protected] (Y.A. Abdel-Aziz). www.elsevier.com/locate/asr Available online at www.sciencedirect.com Advances in Space Research 51 (2013) 133–142

Welcome message from author
This document is posted to help you gain knowledge. Please leave a comment to let me know what you think about it! Share it to your friends and learn new things together.
Transcript
Available online at www.sciencedirect.com
www.elsevier.com/locate/asr
Advances in Space Research 51 (2013) 133–142
Ground-based simulation for the effects of space plasma on spacecraft
Yehia A. Abdel-Aziz a,b,⇑ Afaf M. Abd El-Hameed a
a National Research Institute of Astronomy and Geophysics (NRIAG), Helwan, Cairo, Egyptb Mathematics Dept., Faculty of Science, Hail University, Saudi Arabia
Received 26 September 2011; received in revised form 17 July 2012; accepted 24 July 2012Available online 6 August 2012
Abstract
Plasma ground tests introduced some kind of facilities to study spacecraft interaction with ionospheric plasmas at NRIAG. In thispaper, the description of design and performance of our ground based simulation plasma in low earth orbit (LEO) are presented. Dif-ferent types of solar arrays and samples of spacecraft’s surface materials have been tested in the vacuum chamber under the effects of thegenerated plasma. Diagnostic tools are used to measure arc current, and record the variations in the potential. The obtained data is usedto study the correlation between external parameters (discharge voltage plasma density, additional capacitance and resistance, bias volt-age: etc.). Moreover, we analyze the characteristics of some processes such as plasma waveform, surface charging and potentials, andpulse width arc current and amplitude. Argon gas is used to generate plasma for simulating the plasma properties. The applicationof this plasma flowing gives the threshold in voltage and current at which potential the current is cut off in the connector. The effectof the plasma on an aluminum thin layer and a solar cell sample which are used on spacecraft surfaces is studied.� 2012 COSPAR. Published by Elsevier Ltd. All rights reserved.
Keywords: Spacecraft charging; Plasma simulation; Argon plasma; Sample test; Laboratory experiments
1. Introduction
Spacecraft charging reside in all three charging environ-ments, i.e. low earth orbit (LEO), the radiation belts, andgeostationary and geosynchronous orbits (GEO). In allregimes, a spacecraft will electrically charge to balanceincoming ambient ion and electron currents, typicallycharging negative in order to collect enough of the lessmobile ions. The ionospheric plasma is one of the mainconstituents in the atmosphere at low earth orbit. Interac-tion between LEO–like plasma and spacecraft require moreattention. The charging behavior of a spacecraft is con-trolled mainly by ram/wake effects, the electrical groundingconfiguration of the solar arrays, and the exposure of highvoltage surfaces to the ambient plasma. Most of the
0273-1177/$36.00 � 2012 COSPAR. Published by Elsevier Ltd. All rights rese
http://dx.doi.org/10.1016/j.asr.2012.07.026
⇑ Corresponding author. Address: National Research Institute ofAstronomy and Geophysics (NRIAG), Space Research Lab., ElmarssedSt., Helwan, Cairo, Egypt. Fax: +20 225548020.
E-mail address: [email protected] (Y.A. Abdel-Aziz).
adverse effects caused by spacecraft charging in LEO (i.e.sputtering, contamination, arcing, degradation, and breakponds) depend on the charging level or the floating poten-tial of the spacecraft (Agrawal, 1986). During a geomag-netic sub storm the spacecraft is immersed in veryenergetic plasma. This environment has been shown tocharge spacecraft surfaces to the extent that electrostaticdischarges occur. The charging behavior during a substorm is controlled mainly by the plasma characteristics,the properties of the materials comprising the spacecraftouter surface, and sun/shade effects as in Tahara and Mas-uyama (2006). Many authors have shown that, there are anumber of negative effects and hazards due to the interac-tion of spacecraft with space plasma. Hazards, such ascontaminations, arcing, and breaking of chemical bondsreduce the efficiency of electronic devices. Similarly, accu-mulation of electrical charges leads to the variation in thepotentials which affect the body of the satellite and the con-nectors of the solar panels of the spacecraft (see, Taharaand Masuyama, 2006).
rved.
134 Y.A. Abdel-Aziz, A.M. Abd El-Hameed / Advances in Space Research 51 (2013) 133–142
The interaction between the plasma environment andspacecraft may leads to operational problems and failuresof satellites especially in LEO and PEO. It also interfereswith data transmission and optical detectors. Also, theultraviolet radiation, resulting from solar radiation andhigh-energy particles, leads to the accumulation of electri-cal charges on the surfaces of the spacecraft. The spacecraftcharging can affect the electrical equilibrium of spacecraft,which may affect the performance of remote sensing instru-mentations. In this case, the Maxwell’s equations are usedto study the distribution of charging and energetic particlesflowing on the surfaces of spacecraft as in Vayner et al.(2004) and Hastings et al. (1992).
The present work concerns the understanding of theunderlying cause for the charging and discharging inspacecraft surfaces interacting with the space plasmaenvironment.
Laboratory ground tests are carried out in our Institute(NRIAG, Egypt) to study space plasma simulation and itseffect on some samples of solar arrays and material thatmay be used on spacecraft surfaces. Moreover we shallintroduce an applicable model to spacecraft system design-ers particularly the composition of the outer surface mate-rials. Discharging and arcing processes which results fromplasma generation are discussed in detail.
Cooling system
Sample test
Plasma flow
Vacuum Chamber
Current Probe
0.6 meters
Probe circuit
Window 2
Rotary Diffusion Pump
• • • • • • •• • •
Schematic diagram of
Fig. 1. Diagram of the experimental set up. S
2. Experiment set-up
2.1. Space plasma unit
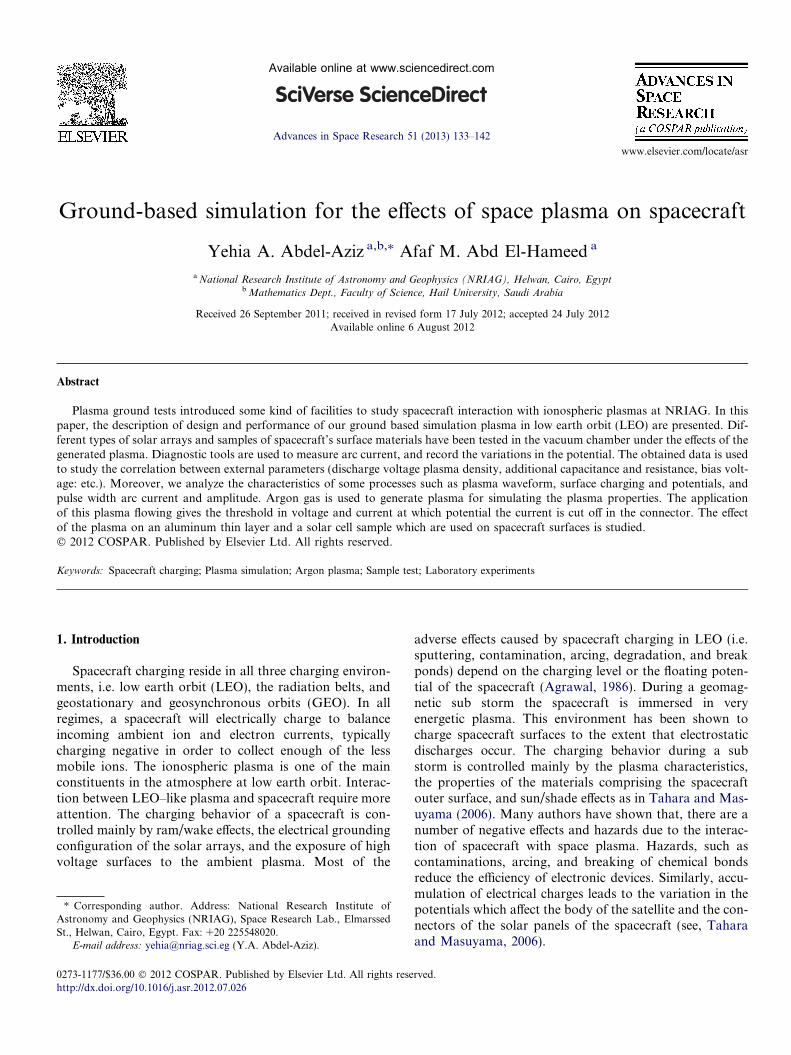
Laboratory experiments are carried out to characterizean electrostatic discharging/arcing current waveform withdifferent background pressures and charging environmentsto identify the importance of the test setup. The waveformstrongly depended on the background pressure. The differ-ence of pressures can affect the result of the solar cell deg-radation test. To do this, recently, space-plasma unit isdeveloped to study ground-based simulation plasma envi-ronment at various geocentric distances.
2.2. Experimental set up
Fig. 1 shows a schematic representation of the experi-mental setup. All of our tests were done in National SpacePlasma Interactions Unit (N-SPI-U) at the NRIAGNational Research Institute of Astronomy and Geophys-ics, Helwan, Egypt and this is the first time to install suchexperiment in Egypt for the Egyptian space program. Thisground unit is useful to study the simulation of spaceplasma environment in LEO and its interaction on space-craft systems and subsystems. N-SPI-U consists of
Plasma source
Sample circuit
Teflon holder
pump
Gas Flow meter
Gas Tube
Window 1
tsuahxE
experimental setup
pace plasma unit constructed at NRIAG.
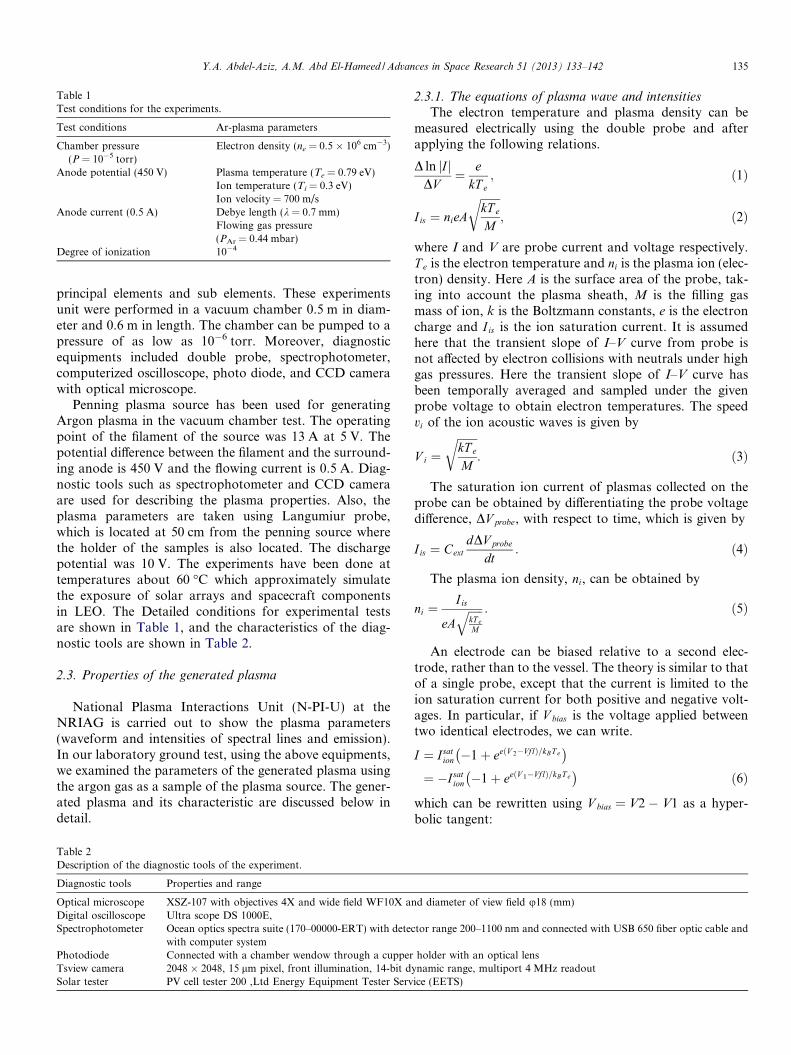
Table 1Test conditions for the experiments.
Test conditions Ar-plasma parameters
Chamber pressure(P = 10�5 torr)
Electron density (ne = 0.5 � 106 cm�3)
Anode potential (450 V) Plasma temperature (Te = 0.79 eV)Ion temperature (Ti = 0.3 eV)Ion velocity = 700 m/s
Anode current (0.5 A) Debye length (k = 0.7 mm)Flowing gas pressure(PAr = 0.44 mbar)
Degree of ionization 10�4
Y.A. Abdel-Aziz, A.M. Abd El-Hameed / Advances in Space Research 51 (2013) 133–142 135
principal elements and sub elements. These experimentsunit were performed in a vacuum chamber 0.5 m in diam-eter and 0.6 m in length. The chamber can be pumped to apressure of as low as 10�6 torr. Moreover, diagnosticequipments included double probe, spectrophotometer,computerized oscilloscope, photo diode, and CCD camerawith optical microscope.
Penning plasma source has been used for generatingArgon plasma in the vacuum chamber test. The operatingpoint of the filament of the source was 13 A at 5 V. Thepotential difference between the filament and the surround-ing anode is 450 V and the flowing current is 0.5 A. Diag-nostic tools such as spectrophotometer and CCD cameraare used for describing the plasma properties. Also, theplasma parameters are taken using Langumiur probe,which is located at 50 cm from the penning source wherethe holder of the samples is also located. The dischargepotential was 10 V. The experiments have been done attemperatures about 60 �C which approximately simulatethe exposure of solar arrays and spacecraft componentsin LEO. The Detailed conditions for experimental testsare shown in Table 1, and the characteristics of the diag-nostic tools are shown in Table 2.
2.3. Properties of the generated plasma
National Plasma Interactions Unit (N-PI-U) at theNRIAG is carried out to show the plasma parameters(waveform and intensities of spectral lines and emission).In our laboratory ground test, using the above equipments,we examined the parameters of the generated plasma usingthe argon gas as a sample of the plasma source. The gener-ated plasma and its characteristic are discussed below indetail.
Table 2Description of the diagnostic tools of the experiment.
Diagnostic tools Properties and range
Optical microscope XSZ-107 with objectives 4X and wide field WF10X aDigital oscilloscope Ultra scope DS 1000E,Spectrophotometer Ocean optics spectra suite (170–00000-ERT) with detec
with computer systemPhotodiode Connected with a chamber wendow through a cupperTsview camera 2048 � 2048, 15 lm pixel, front illumination, 14-bit dSolar tester PV cell tester 200 ,Ltd Energy Equipment Tester Serv
2.3.1. The equations of plasma wave and intensities
The electron temperature and plasma density can bemeasured electrically using the double probe and afterapplying the following relations.
D ln jI jDV
¼ ekT e
; ð1Þ
I is ¼ nieA
ffiffiffiffiffiffiffikT e
M
r; ð2Þ
where I and V are probe current and voltage respectively.T e is the electron temperature and ni is the plasma ion (elec-tron) density. Here A is the surface area of the probe, tak-ing into account the plasma sheath, M is the filling gasmass of ion, k is the Boltzmann constants, e is the electroncharge and I is is the ion saturation current. It is assumedhere that the transient slope of I–V curve from probe isnot affected by electron collisions with neutrals under highgas pressures. Here the transient slope of I–V curve hasbeen temporally averaged and sampled under the givenprobe voltage to obtain electron temperatures. The speedvi of the ion acoustic waves is given by
V i ¼ffiffiffiffiffiffiffikT e
M
r: ð3Þ
The saturation ion current of plasmas collected on theprobe can be obtained by differentiating the probe voltagedifference, DV probe, with respect to time, which is given by
I is ¼ CextdDV probe
dt: ð4Þ
The plasma ion density, ni, can be obtained by
ni ¼I is
eAffiffiffiffiffikT eM
q : ð5Þ
An electrode can be biased relative to a second elec-trode, rather than to the vessel. The theory is similar to thatof a single probe, except that the current is limited to theion saturation current for both positive and negative volt-ages. In particular, if V bias is the voltage applied betweentwo identical electrodes, we can write.
I ¼ Isation �1þ eeðV 2�VflÞ=kBT e� �
¼ �Isation �1þ eeðV 1�VflÞ=kBT e� �
ð6Þ
which can be rewritten using V bias = V2 � V1 as a hyper-bolic tangent:
nd diameter of view field u18 (mm)
tor range 200–1100 nm and connected with USB 650 fiber optic cable and
holder with an optical lensynamic range, multiport 4 MHz readoutice (EETS)
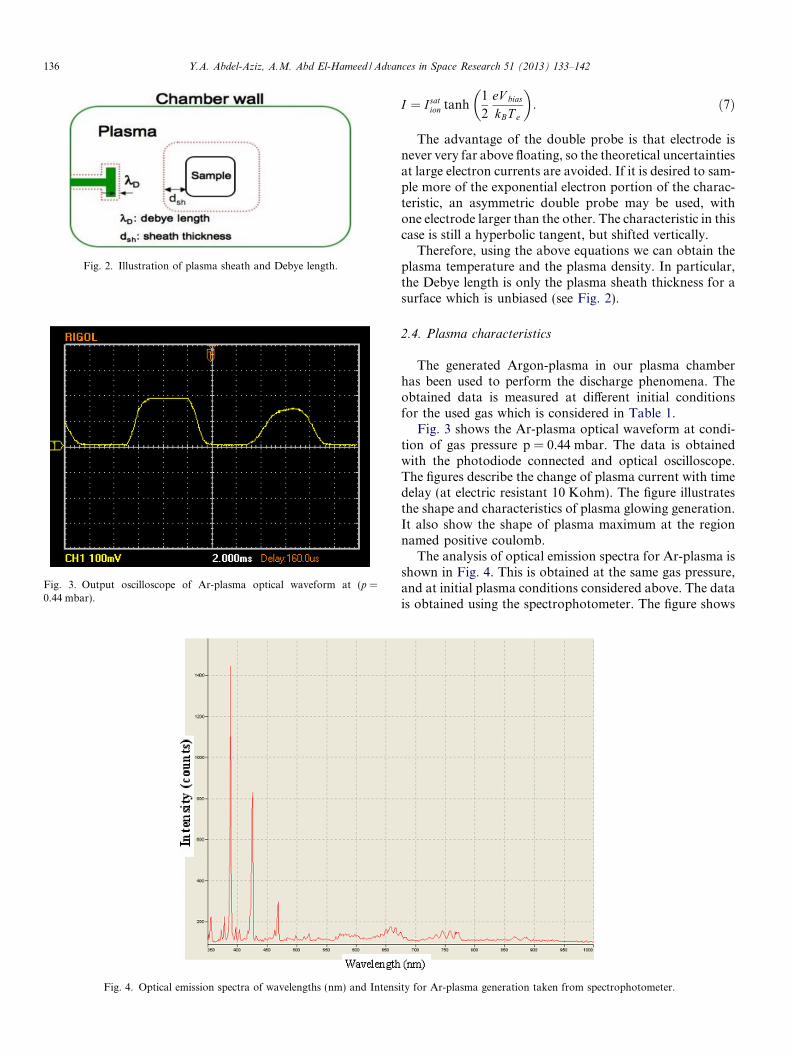
Fig. 2. Illustration of plasma sheath and Debye length.
Fig. 3. Output oscilloscope of Ar-plasma optical waveform at (p =0.44 mbar).
Fig. 4. Optical emission spectra of wavelengths (nm) and Intens
136 Y.A. Abdel-Aziz, A.M. Abd El-Hameed / Advances in Space Research 51 (2013) 133–142
I ¼ Isation tanh
1
2
eV bias
kBT e
� �: ð7Þ
The advantage of the double probe is that electrode isnever very far above floating, so the theoretical uncertaintiesat large electron currents are avoided. If it is desired to sam-ple more of the exponential electron portion of the charac-teristic, an asymmetric double probe may be used, withone electrode larger than the other. The characteristic in thiscase is still a hyperbolic tangent, but shifted vertically.
Therefore, using the above equations we can obtain theplasma temperature and the plasma density. In particular,the Debye length is only the plasma sheath thickness for asurface which is unbiased (see Fig. 2).
2.4. Plasma characteristics
The generated Argon-plasma in our plasma chamberhas been used to perform the discharge phenomena. Theobtained data is measured at different initial conditionsfor the used gas which is considered in Table 1.
Fig. 3 shows the Ar-plasma optical waveform at condi-tion of gas pressure p = 0.44 mbar. The data is obtainedwith the photodiode connected and optical oscilloscope.The figures describe the change of plasma current with timedelay (at electric resistant 10 Kohm). The figure illustratesthe shape and characteristics of plasma glowing generation.It also show the shape of plasma maximum at the regionnamed positive coulomb.
The analysis of optical emission spectra for Ar-plasma isshown in Fig. 4. This is obtained at the same gas pressure,and at initial plasma conditions considered above. The datais obtained using the spectrophotometer. The figure shows
ity for Ar-plasma generation taken from spectrophotometer.
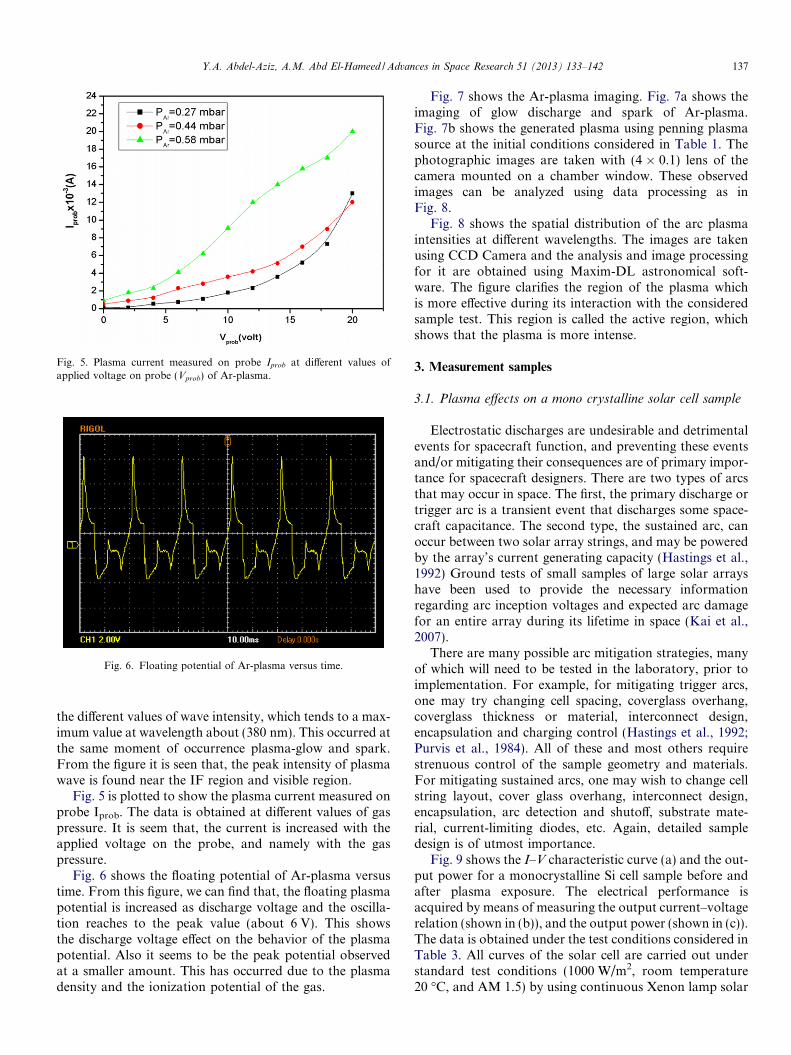
Fig. 5. Plasma current measured on probe Iprob at different values ofapplied voltage on probe (Vprob) of Ar-plasma.
Fig. 6. Floating potential of Ar-plasma versus time.
Y.A. Abdel-Aziz, A.M. Abd El-Hameed / Advances in Space Research 51 (2013) 133–142 137
the different values of wave intensity, which tends to a max-imum value at wavelength about (380 nm). This occurred atthe same moment of occurrence plasma-glow and spark.From the figure it is seen that, the peak intensity of plasmawave is found near the IF region and visible region.
Fig. 5 is plotted to show the plasma current measured onprobe Iprob. The data is obtained at different values of gaspressure. It is seem that, the current is increased with theapplied voltage on the probe, and namely with the gaspressure.
Fig. 6 shows the floating potential of Ar-plasma versustime. From this figure, we can find that, the floating plasmapotential is increased as discharge voltage and the oscilla-tion reaches to the peak value (about 6 V). This showsthe discharge voltage effect on the behavior of the plasmapotential. Also it seems to be the peak potential observedat a smaller amount. This has occurred due to the plasmadensity and the ionization potential of the gas.
Fig. 7 shows the Ar-plasma imaging. Fig. 7a shows theimaging of glow discharge and spark of Ar-plasma.Fig. 7b shows the generated plasma using penning plasmasource at the initial conditions considered in Table 1. Thephotographic images are taken with (4 � 0.1) lens of thecamera mounted on a chamber window. These observedimages can be analyzed using data processing as inFig. 8.
Fig. 8 shows the spatial distribution of the arc plasmaintensities at different wavelengths. The images are takenusing CCD Camera and the analysis and image processingfor it are obtained using Maxim-DL astronomical soft-ware. The figure clarifies the region of the plasma whichis more effective during its interaction with the consideredsample test. This region is called the active region, whichshows that the plasma is more intense.
3. Measurement samples
3.1. Plasma effects on a mono crystalline solar cell sample
Electrostatic discharges are undesirable and detrimentalevents for spacecraft function, and preventing these eventsand/or mitigating their consequences are of primary impor-tance for spacecraft designers. There are two types of arcsthat may occur in space. The first, the primary discharge ortrigger arc is a transient event that discharges some space-craft capacitance. The second type, the sustained arc, canoccur between two solar array strings, and may be poweredby the array’s current generating capacity (Hastings et al.,1992) Ground tests of small samples of large solar arrayshave been used to provide the necessary informationregarding arc inception voltages and expected arc damagefor an entire array during its lifetime in space (Kai et al.,2007).
There are many possible arc mitigation strategies, manyof which will need to be tested in the laboratory, prior toimplementation. For example, for mitigating trigger arcs,one may try changing cell spacing, coverglass overhang,coverglass thickness or material, interconnect design,encapsulation and charging control (Hastings et al., 1992;Purvis et al., 1984). All of these and most others requirestrenuous control of the sample geometry and materials.For mitigating sustained arcs, one may wish to change cellstring layout, cover glass overhang, interconnect design,encapsulation, arc detection and shutoff, substrate mate-rial, current-limiting diodes, etc. Again, detailed sampledesign is of utmost importance.
Fig. 9 shows the I–V characteristic curve (a) and the out-put power for a monocrystalline Si cell sample before andafter plasma exposure. The electrical performance isacquired by means of measuring the output current–voltagerelation (shown in (b)), and the output power (shown in (c)).The data is obtained under the test conditions considered inTable 3. All curves of the solar cell are carried out understandard test conditions (1000 W/m2, room temperature20 �C, and AM 1.5) by using continuous Xenon lamp solar
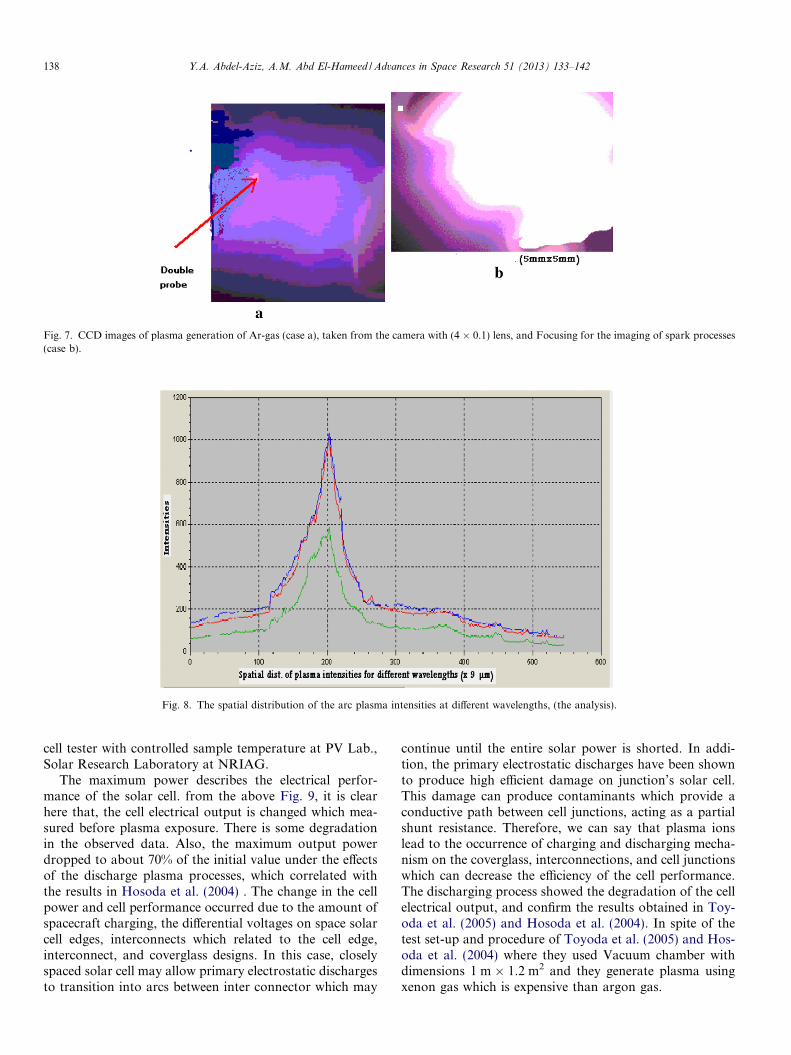
Fig. 7. CCD images of plasma generation of Ar-gas (case a), taken from the camera with (4 � 0.1) lens, and Focusing for the imaging of spark processes(case b).
Fig. 8. The spatial distribution of the arc plasma intensities at different wavelengths, (the analysis).
138 Y.A. Abdel-Aziz, A.M. Abd El-Hameed / Advances in Space Research 51 (2013) 133–142
cell tester with controlled sample temperature at PV Lab.,Solar Research Laboratory at NRIAG.
The maximum power describes the electrical perfor-mance of the solar cell. from the above Fig. 9, it is clearhere that, the cell electrical output is changed which mea-sured before plasma exposure. There is some degradationin the observed data. Also, the maximum output powerdropped to about 70% of the initial value under the effectsof the discharge plasma processes, which correlated withthe results in Hosoda et al. (2004) . The change in the cellpower and cell performance occurred due to the amount ofspacecraft charging, the differential voltages on space solarcell edges, interconnects which related to the cell edge,interconnect, and coverglass designs. In this case, closelyspaced solar cell may allow primary electrostatic dischargesto transition into arcs between inter connector which may
continue until the entire solar power is shorted. In addi-tion, the primary electrostatic discharges have been shownto produce high efficient damage on junction’s solar cell.This damage can produce contaminants which provide aconductive path between cell junctions, acting as a partialshunt resistance. Therefore, we can say that plasma ionslead to the occurrence of charging and discharging mecha-nism on the coverglass, interconnections, and cell junctionswhich can decrease the efficiency of the cell performance.The discharging process showed the degradation of the cellelectrical output, and confirm the results obtained in Toy-oda et al. (2005) and Hosoda et al. (2004). In spite of thetest set-up and procedure of Toyoda et al. (2005) and Hos-oda et al. (2004) where they used Vacuum chamber withdimensions 1 m � 1.2 m2 and they generate plasma usingxenon gas which is expensive than argon gas.
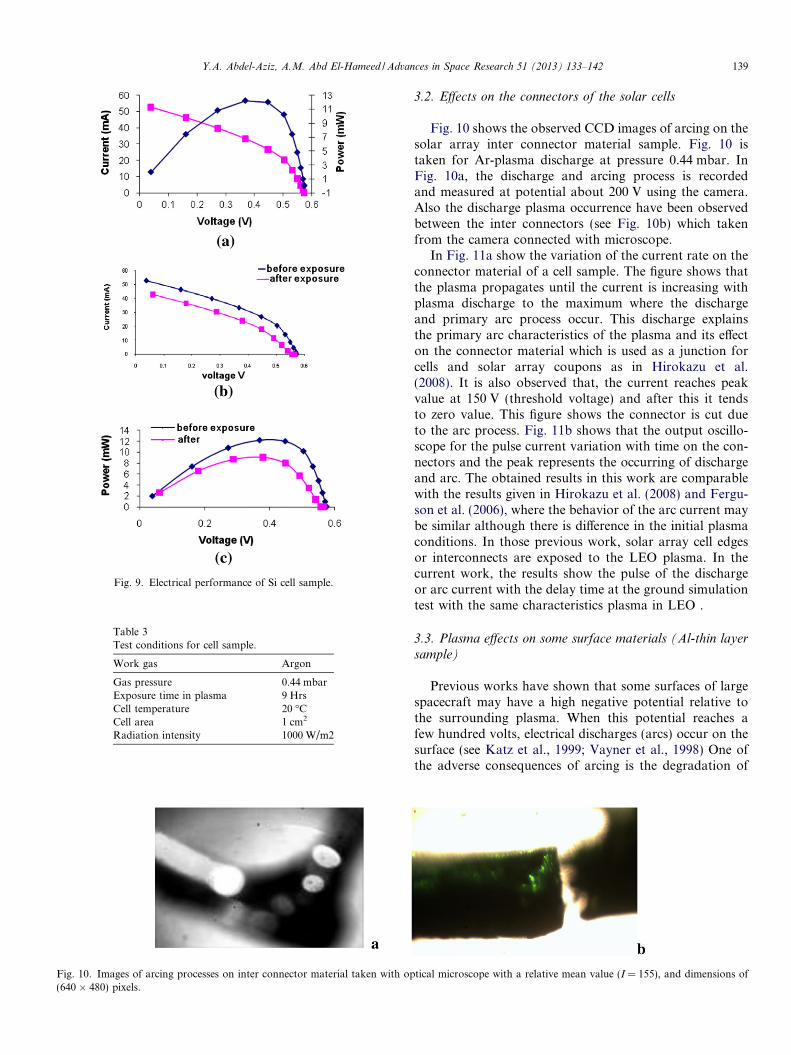
Fig. 10. Images of arcing processes on inter connector material taken with op(640 � 480) pixels.
Fig. 9. Electrical performance of Si cell sample.
Table 3Test conditions for cell sample.
Work gas Argon
Gas pressure 0.44 mbarExposure time in plasma 9 HrsCell temperature 20 �CCell area 1 cm2
Radiation intensity 1000 W/m2
Y.A. Abdel-Aziz, A.M. Abd El-Hameed / Advances in Space Research 51 (2013) 133–142 139
3.2. Effects on the connectors of the solar cells
Fig. 10 shows the observed CCD images of arcing on thesolar array inter connector material sample. Fig. 10 istaken for Ar-plasma discharge at pressure 0.44 mbar. InFig. 10a, the discharge and arcing process is recordedand measured at potential about 200 V using the camera.Also the discharge plasma occurrence have been observedbetween the inter connectors (see Fig. 10b) which takenfrom the camera connected with microscope.
In Fig. 11a show the variation of the current rate on theconnector material of a cell sample. The figure shows thatthe plasma propagates until the current is increasing withplasma discharge to the maximum where the dischargeand primary arc process occur. This discharge explainsthe primary arc characteristics of the plasma and its effecton the connector material which is used as a junction forcells and solar array coupons as in Hirokazu et al.(2008). It is also observed that, the current reaches peakvalue at 150 V (threshold voltage) and after this it tendsto zero value. This figure shows the connector is cut dueto the arc process. Fig. 11b shows that the output oscillo-scope for the pulse current variation with time on the con-nectors and the peak represents the occurring of dischargeand arc. The obtained results in this work are comparablewith the results given in Hirokazu et al. (2008) and Fergu-son et al. (2006), where the behavior of the arc current maybe similar although there is difference in the initial plasmaconditions. In those previous work, solar array cell edgesor interconnects are exposed to the LEO plasma. In thecurrent work, the results show the pulse of the dischargeor arc current with the delay time at the ground simulationtest with the same characteristics plasma in LEO .
3.3. Plasma effects on some surface materials (Al-thin layer
sample)
Previous works have shown that some surfaces of largespacecraft may have a high negative potential relative tothe surrounding plasma. When this potential reaches afew hundred volts, electrical discharges (arcs) occur on thesurface (see Katz et al., 1999; Vayner et al., 1998) One ofthe adverse consequences of arcing is the degradation of
tical microscope with a relative mean value (I = 155), and dimensions of
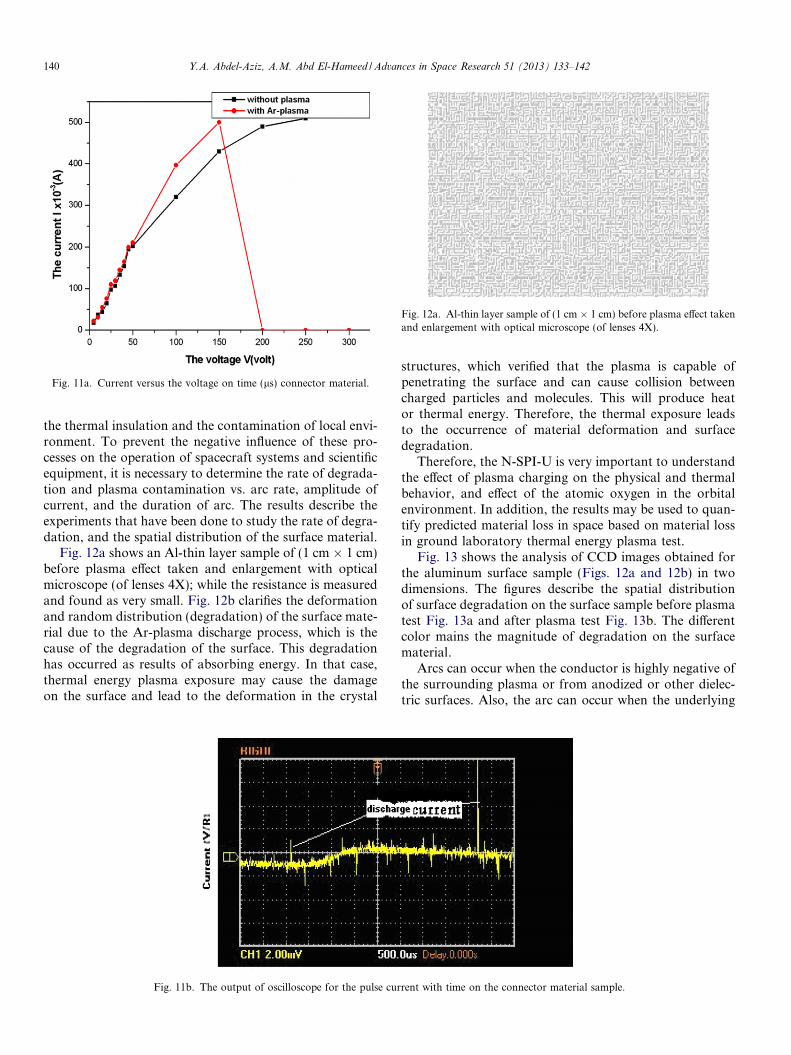
Fig. 11a. Current versus the voltage on time (ls) connector material.
Fig. 12a. Al-thin layer sample of (1 cm � 1 cm) before plasma effect takenand enlargement with optical microscope (of lenses 4X).
140 Y.A. Abdel-Aziz, A.M. Abd El-Hameed / Advances in Space Research 51 (2013) 133–142
the thermal insulation and the contamination of local envi-ronment. To prevent the negative influence of these pro-cesses on the operation of spacecraft systems and scientificequipment, it is necessary to determine the rate of degrada-tion and plasma contamination vs. arc rate, amplitude ofcurrent, and the duration of arc. The results describe theexperiments that have been done to study the rate of degra-dation, and the spatial distribution of the surface material.
Fig. 12a shows an Al-thin layer sample of (1 cm � 1 cm)before plasma effect taken and enlargement with opticalmicroscope (of lenses 4X); while the resistance is measuredand found as very small. Fig. 12b clarifies the deformationand random distribution (degradation) of the surface mate-rial due to the Ar-plasma discharge process, which is thecause of the degradation of the surface. This degradationhas occurred as results of absorbing energy. In that case,thermal energy plasma exposure may cause the damageon the surface and lead to the deformation in the crystal
Fig. 11b. The output of oscilloscope for the pulse cur
structures, which verified that the plasma is capable ofpenetrating the surface and can cause collision betweencharged particles and molecules. This will produce heator thermal energy. Therefore, the thermal exposure leadsto the occurrence of material deformation and surfacedegradation.
Therefore, the N-SPI-U is very important to understandthe effect of plasma charging on the physical and thermalbehavior, and effect of the atomic oxygen in the orbitalenvironment. In addition, the results may be used to quan-tify predicted material loss in space based on material lossin ground laboratory thermal energy plasma test.
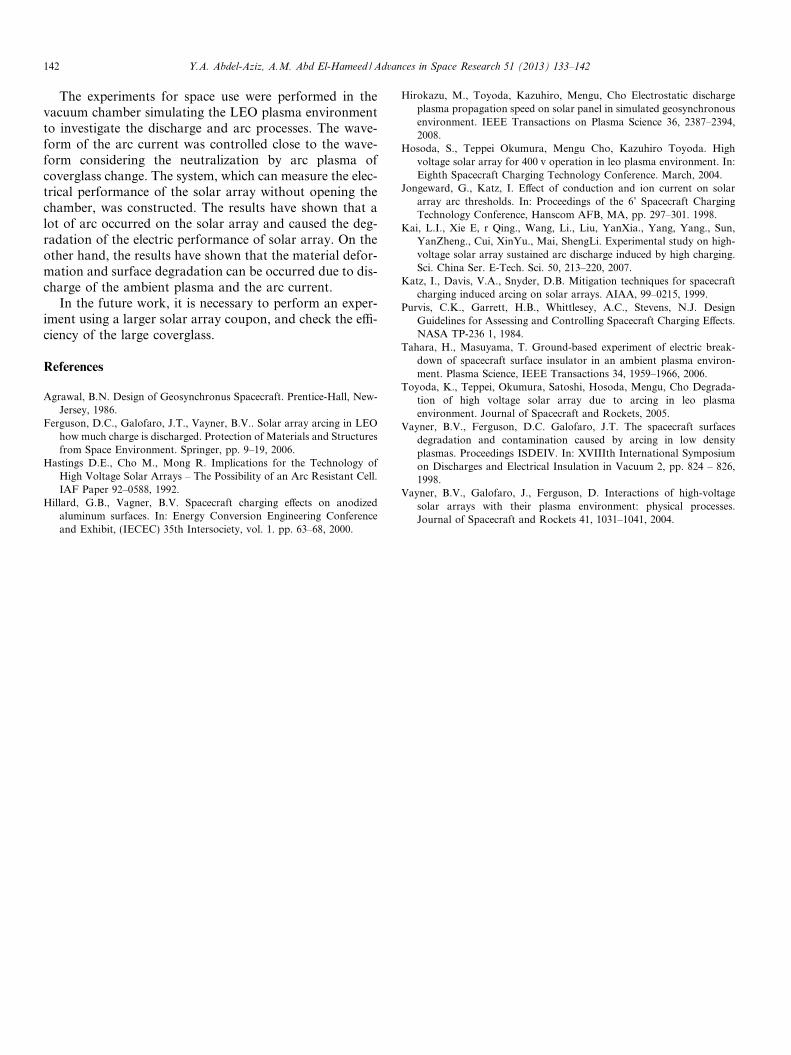
Fig. 13 shows the analysis of CCD images obtained forthe aluminum surface sample (Figs. 12a and 12b) in twodimensions. The figures describe the spatial distributionof surface degradation on the surface sample before plasmatest Fig. 13a and after plasma test Fig. 13b. The differentcolor mains the magnitude of degradation on the surfacematerial.
Arcs can occur when the conductor is highly negative ofthe surrounding plasma or from anodized or other dielec-tric surfaces. Also, the arc can occur when the underlying
rent with time on the connector material sample.
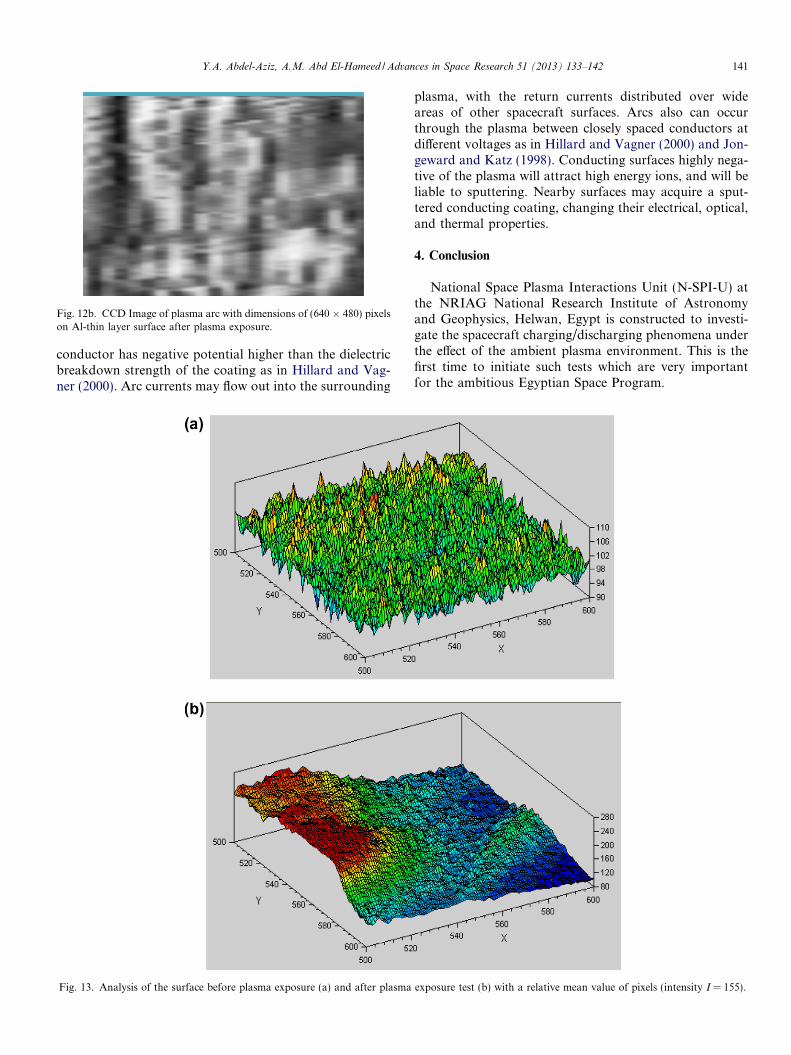
Fig. 12b. CCD Image of plasma arc with dimensions of (640 � 480) pixelson Al-thin layer surface after plasma exposure.
Y.A. Abdel-Aziz, A.M. Abd El-Hameed / Advances in Space Research 51 (2013) 133–142 141
conductor has negative potential higher than the dielectricbreakdown strength of the coating as in Hillard and Vag-ner (2000). Arc currents may flow out into the surrounding
Fig. 13. Analysis of the surface before plasma exposure (a) and after plasma
plasma, with the return currents distributed over wideareas of other spacecraft surfaces. Arcs also can occurthrough the plasma between closely spaced conductors atdifferent voltages as in Hillard and Vagner (2000) and Jon-geward and Katz (1998). Conducting surfaces highly nega-tive of the plasma will attract high energy ions, and will beliable to sputtering. Nearby surfaces may acquire a sput-tered conducting coating, changing their electrical, optical,and thermal properties.
4. Conclusion
National Space Plasma Interactions Unit (N-SPI-U) atthe NRIAG National Research Institute of Astronomyand Geophysics, Helwan, Egypt is constructed to investi-gate the spacecraft charging/discharging phenomena underthe effect of the ambient plasma environment. This is thefirst time to initiate such tests which are very importantfor the ambitious Egyptian Space Program.
exposure test (b) with a relative mean value of pixels (intensity I = 155).
142 Y.A. Abdel-Aziz, A.M. Abd El-Hameed / Advances in Space Research 51 (2013) 133–142
The experiments for space use were performed in thevacuum chamber simulating the LEO plasma environmentto investigate the discharge and arc processes. The wave-form of the arc current was controlled close to the wave-form considering the neutralization by arc plasma ofcoverglass change. The system, which can measure the elec-trical performance of the solar array without opening thechamber, was constructed. The results have shown that alot of arc occurred on the solar array and caused the deg-radation of the electric performance of solar array. On theother hand, the results have shown that the material defor-mation and surface degradation can be occurred due to dis-charge of the ambient plasma and the arc current.
In the future work, it is necessary to perform an exper-iment using a larger solar array coupon, and check the effi-ciency of the large coverglass.
References
Agrawal, B.N. Design of Geosynchronus Spacecraft. Prentice-Hall, New-Jersey, 1986.
Ferguson, D.C., Galofaro, J.T., Vayner, B.V.. Solar array arcing in LEOhow much charge is discharged. Protection of Materials and Structuresfrom Space Environment. Springer, pp. 9–19, 2006.
Hastings D.E., Cho M., Mong R. Implications for the Technology ofHigh Voltage Solar Arrays – The Possibility of an Arc Resistant Cell.IAF Paper 92–0588, 1992.
Hillard, G.B., Vagner, B.V. Spacecraft charging effects on anodizedaluminum surfaces. In: Energy Conversion Engineering Conferenceand Exhibit, (IECEC) 35th Intersociety, vol. 1. pp. 63–68, 2000.
Hirokazu, M., Toyoda, Kazuhiro, Mengu, Cho Electrostatic dischargeplasma propagation speed on solar panel in simulated geosynchronousenvironment. IEEE Transactions on Plasma Science 36, 2387–2394,2008.
Hosoda, S., Teppei Okumura, Mengu Cho, Kazuhiro Toyoda. Highvoltage solar array for 400 v operation in leo plasma environment. In:Eighth Spacecraft Charging Technology Conference. March, 2004.
Jongeward, G., Katz, I. Effect of conduction and ion current on solararray arc thresholds. In: Proceedings of the 6’ Spacecraft ChargingTechnology Conference, Hanscom AFB, MA, pp. 297–301. 1998.
Kai, L.I., Xie E, r Qing., Wang, Li., Liu, YanXia., Yang, Yang., Sun,YanZheng., Cui, XinYu., Mai, ShengLi. Experimental study on high-voltage solar array sustained arc discharge induced by high charging.Sci. China Ser. E-Tech. Sci. 50, 213–220, 2007.
Katz, I., Davis, V.A., Snyder, D.B. Mitigation techniques for spacecraftcharging induced arcing on solar arrays. AIAA, 99–0215, 1999.
Purvis, C.K., Garrett, H.B., Whittlesey, A.C., Stevens, N.J. DesignGuidelines for Assessing and Controlling Spacecraft Charging Effects.NASA TP-236 1, 1984.
Tahara, H., Masuyama, T. Ground-based experiment of electric break-down of spacecraft surface insulator in an ambient plasma environ-ment. Plasma Science, IEEE Transactions 34, 1959–1966, 2006.
Toyoda, K., Teppei, Okumura, Satoshi, Hosoda, Mengu, Cho Degrada-tion of high voltage solar array due to arcing in leo plasmaenvironment. Journal of Spacecraft and Rockets, 2005.
Vayner, B.V., Ferguson, D.C. Galofaro, J.T. The spacecraft surfacesdegradation and contamination caused by arcing in low densityplasmas. Proceedings ISDEIV. In: XVIIIth International Symposiumon Discharges and Electrical Insulation in Vacuum 2, pp. 824 – 826,1998.
Vayner, B.V., Galofaro, J., Ferguson, D. Interactions of high-voltagesolar arrays with their plasma environment: physical processes.Journal of Spacecraft and Rockets 41, 1031–1041, 2004.
Related Documents