Annales Geophysicae (2002) 20: 781–794 c European Geophysical Society 2002 Annales Geophysicae Ground-based observations of the auroral zone and polar cap ionospheric responses to dayside transient reconnection J. A. Davies 1 , T. K. Yeoman 1 , I. J. Rae 1, * , S. E. Milan 1 , M. Lester 1 , M. Lockwood 2 , and A. McWilliams 1 1 Department of Physics and Astronomy, University of Leicester, Leicester, UK 2 Rutherford Appleton Laboratory, Oxfordshire, UK/Department of Physics and Astronomy, Southampton University, Southampton, UK * now at Department of Physics, University of Alberta, Edmonton, Alberta, Canada Received: 20 December 2001 – Accepted: 19 February 2002 Abstract. Observations from the EISCAT VHF incoherent scatter radar system in northern Norway, during a run of the common programme CP-4, reveal a series of poleward- propagating F-region electron density enhancements in the pre-noon sector on 23 November 1999. These plasma density features, which are observed under conditions of a strongly southward interplanetary magnetic field, exhibit a recurrence rate of under 10 min and appear to emanate from the vicin- ity of the open/closed field-line boundary from where they travel into the polar cap; this is suggestive of their being an ionospheric response to transient reconnection at the day- side magnetopause (flux transfer events). Simultaneous with the density structures detected by the VHF radar, poleward- moving radar auroral forms (PMRAFs) are observed by the Finland HF coherent scatter radar. It is thought that PM- RAFs, which are commonly observed near local noon by HF radars, are also related to flux transfer events, although the specific mechanism for the generation of the field-aligned ir- regularities within such features is not well understood. The HF observations suggest, that for much of their existence, the PMRAFs trace fossil signatures of transient reconnection rather than revealing the footprint of active reconnection it- self; this is evidenced not least by the fact that the PMRAFs become narrower in spectral width as they evolve away from the region of more classical, broad cusp scatter in which they originate. Interpretation of the HF observations with refer- ence to the plasma parameters diagnosed by the incoherent scatter radar suggests that as the PMRAFs migrate away from the reconnection site and across the polar cap, entrained in the ambient antisunward flow, the irregularities therein are generated by the presence of gradients in the electron density, with these gradients having been formed through structuring of the ionosphere in the cusp region in response to transient reconnection. Correspondence to: J. A. Davies ([email protected]) Key words. Magnetospheric physics (magnetosphere-iono- sphere interaction) – ionosphere (ionospheric irregularities; plasma density and temperature) 1 Introduction The first observational evidence for impulsive, transient re- connection at the dayside magnetopause was presented by Haerendel et al. (1978), based on HEOS-2 satellite measure- ments, and Russell and Elphic (1978; 1979), using obser- vations from the ISEE-1 and -2 spacecraft. The latter au- thors coined the term flux transfer event (FTE) to describe an individual reconnection pulse. Subsequent investigation of spacecraft observations near the magnetopause has revealed that FTEs – generally identified by a characteristic bipolar signature in the boundary-normal component of the magnetic field, accompanied by an increase in the total field magnitude – occur most commonly under conditions when the Z com- ponent of the magnetic field measured in the interplanetary medium is southward (e.g. Rijnbeek et al., 1984; Kuo et al., 1995; Kawano and Russell, 1997) and have a mean recur- rence rate of 7 to 8 min (Rijnbeek et al., 1984; Lockwood and Wild, 1993; Kuo et al., 1995). Even though there is substantial evidence supporting the idea that FTEs are the signature of transient reconnection, there is still consider- able debate concerning the relative contributions of bursty and quasi-steady state reconnection to dayside coupling of the interplanetary and terrestrial magnetic fields. Signatures of reconnection at the magnetopause map into spatially confined regions of the dayside ionosphere. It was, however, several years after their initial identification by spacecraft before such ground-based signatures of FTEs were reported, the first being by van Eyken et al. (1984) and Goertz et al. (1985). Since this early work, a multi-

Welcome message from author
This document is posted to help you gain knowledge. Please leave a comment to let me know what you think about it! Share it to your friends and learn new things together.
Transcript
Annales Geophysicae (2002) 20: 781–794c© European Geophysical Society 2002Annales
Geophysicae
Ground-based observations of the auroral zone and polar capionospheric responses to dayside transient reconnection
J. A. Davies1, T. K. Yeoman1, I. J. Rae1, *, S. E. Milan1, M. Lester1, M. Lockwood2, and A. McWilliams1
1Department of Physics and Astronomy, University of Leicester, Leicester, UK2Rutherford Appleton Laboratory, Oxfordshire, UK/Department of Physics and Astronomy, Southampton University,Southampton, UK* now at Department of Physics, University of Alberta, Edmonton, Alberta, Canada
Received: 20 December 2001 – Accepted: 19 February 2002
Abstract. Observations from the EISCAT VHF incoherentscatter radar system in northern Norway, during a run ofthe common programme CP-4, reveal a series of poleward-propagating F-region electron density enhancements in thepre-noon sector on 23 November 1999. These plasma densityfeatures, which are observed under conditions of a stronglysouthward interplanetary magnetic field, exhibit a recurrencerate of under 10 min and appear to emanate from the vicin-ity of the open/closed field-line boundary from where theytravel into the polar cap; this is suggestive of their beingan ionospheric response to transient reconnection at the day-side magnetopause (flux transfer events). Simultaneous withthe density structures detected by the VHF radar, poleward-moving radar auroral forms (PMRAFs) are observed by theFinland HF coherent scatter radar. It is thought that PM-RAFs, which are commonly observed near local noon by HFradars, are also related to flux transfer events, although thespecific mechanism for the generation of the field-aligned ir-regularities within such features is not well understood. TheHF observations suggest, that for much of their existence,the PMRAFs trace fossil signatures of transient reconnectionrather than revealing the footprint of active reconnection it-self; this is evidenced not least by the fact that the PMRAFsbecome narrower in spectral width as they evolve away fromthe region of more classical, broad cusp scatter in which theyoriginate. Interpretation of the HF observations with refer-ence to the plasma parameters diagnosed by the incoherentscatter radar suggests that as the PMRAFs migrate away fromthe reconnection site and across the polar cap, entrained inthe ambient antisunward flow, the irregularities therein aregenerated by the presence of gradients in the electron density,with these gradients having been formed through structuringof the ionosphere in the cusp region in response to transientreconnection.
Correspondence to:J. A. Davies ([email protected])
Key words. Magnetospheric physics (magnetosphere-iono-sphere interaction) – ionosphere (ionospheric irregularities;plasma density and temperature)
1 Introduction
The first observational evidence for impulsive, transient re-connection at the dayside magnetopause was presented byHaerendel et al. (1978), based on HEOS-2 satellite measure-ments, and Russell and Elphic (1978; 1979), using obser-vations from the ISEE-1 and -2 spacecraft. The latter au-thors coined the term flux transfer event (FTE) to describe anindividual reconnection pulse. Subsequent investigation ofspacecraft observations near the magnetopause has revealedthat FTEs – generally identified by a characteristic bipolarsignature in the boundary-normal component of the magneticfield, accompanied by an increase in the total field magnitude– occur most commonly under conditions when theZ com-ponent of the magnetic field measured in the interplanetarymedium is southward (e.g. Rijnbeek et al., 1984; Kuo et al.,1995; Kawano and Russell, 1997) and have a mean recur-rence rate of 7 to 8 min (Rijnbeek et al., 1984; Lockwoodand Wild, 1993; Kuo et al., 1995). Even though there issubstantial evidence supporting the idea that FTEs are thesignature of transient reconnection, there is still consider-able debate concerning the relative contributions of burstyand quasi-steady state reconnection to dayside coupling ofthe interplanetary and terrestrial magnetic fields.
Signatures of reconnection at the magnetopause map intospatially confined regions of the dayside ionosphere. Itwas, however, several years after their initial identificationby spacecraft before such ground-based signatures of FTEswere reported, the first being by van Eyken et al. (1984)and Goertz et al. (1985). Since this early work, a multi-
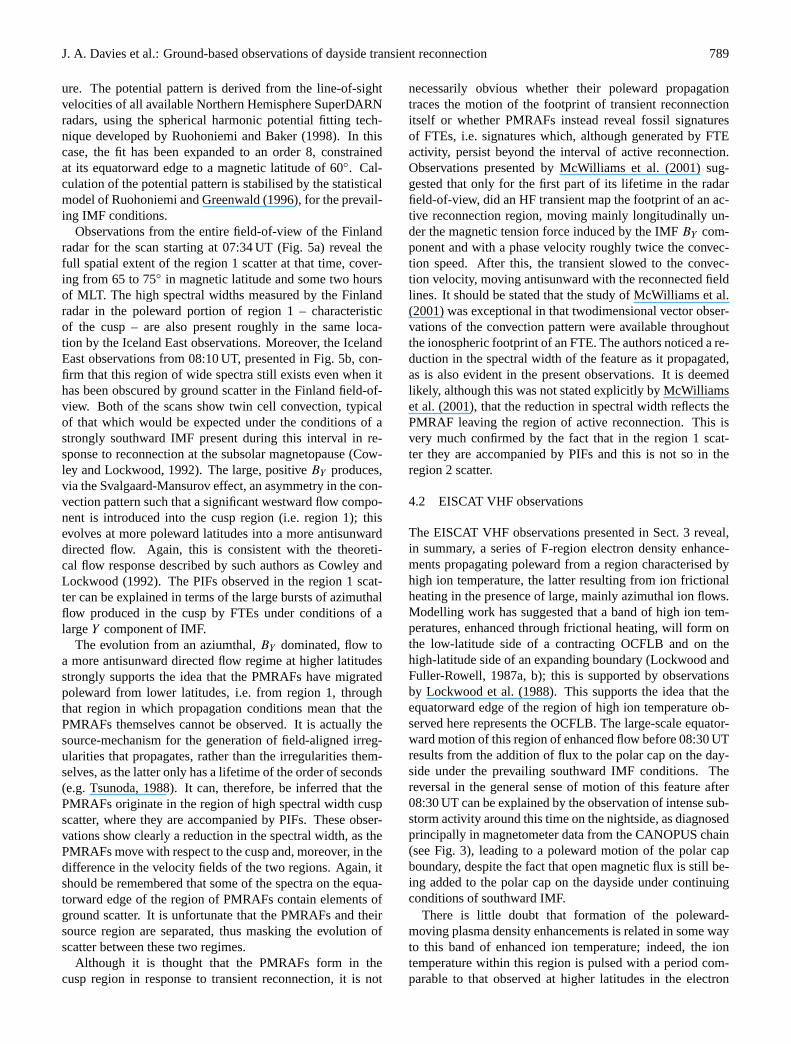
782 J. A. Davies et al.: Ground-based observations of dayside transient reconnection
711
60°N
70°N
70°N
0°E 15°E 30°E 45°E
Hankasalmi
Tromso
VHF 1 VHF 2
Geographic
60°N
70°N
70°N
0°E 15°E 30°E 45°E
Pykkvibaer Tromso
VHF 1 VHF 2
Geographic
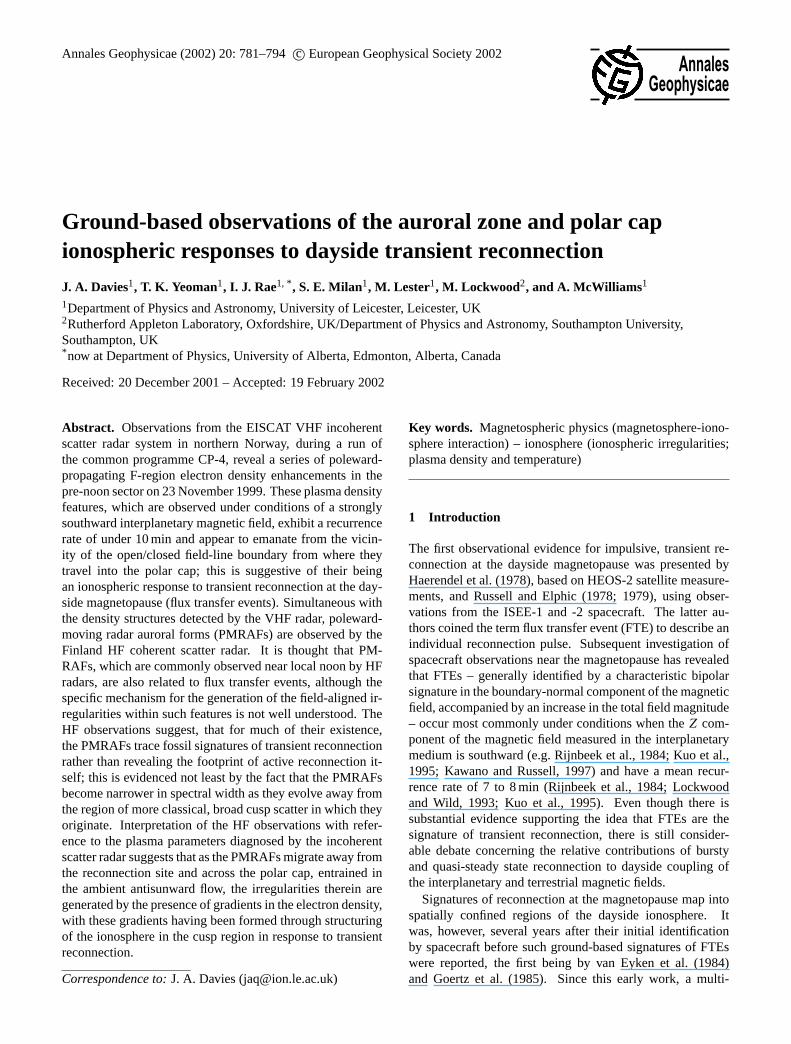
Fig. 1. Map depicting the fields-of-view of the CUTLASS Finlandand Iceland East radars. Beams 7 and 11 of the Finland radar areindicated explicitly, as solid lines. In addition, the two beams ofthe EISCAT VHF radar are illustrated as thick broken lines. Thesmall filled circle and the cross within a circle represent the posi-tions of the magnetic and geographic poles, respectively, whereaslarger filled circles indicate the locations of the radars themselves.
tude of further observations of the ground-based signaturesof impulsive reconnection have been published. These in-clude many observations by the HF coherent scatter radarsof the Super Dual Auroral Radar Network (SuperDARN)of dayside transients, which generally exhibit an antisun-ward motion. Dependant on their exact characteristics, andcrucially, the parameter in which they are identified, theseionospheric transients have been termed flow channel events(FCEs) (Pinnock et al., 1993; 1995; Neudegg et al., 1999;2000), pulsed ionospheric flows (PIFs) (Provan et al., 1998;Provan and Yeoman, 1999; McWilliams et al., 2000) orpoleward-moving radar auroral forms (PMRAFs) (Wild etal., 2001). However, it has become increasingly evident thatthese three so-called forms of dayside transients are in factvery much related, and in some cases actually describe thesame phenomena; this is discussed by Wild et al. (2001)and in more detail later in the present paper. Such day-side transients observed by HF radar have been found to ex-hibit a repetition rate comparable to that of FTEs observedat the magnetopause (Provan et al., 1998; McWilliams et al.,2000) and have been observed in conjunction with cusp ionsteps detected by low altitude spacecraft by Yeoman et al.(1997) and optical signatures termed poleward-moving auro-ral forms (PMAFs) (Milan et al., 1999; 2000); both cusp ionsteps (e.g. Lockwood and Smith, 1992; 1994) and PMAFs(e.g. Sandholt et al., 1992; Fasel, 1995) are also acknowl-edged signatures of FTEs. Although it is thought that thesedayside HF transients are indeed a radar signature of impul-sive reconnection, only Neudegg et al. (1999; 2000) and Wildet al. (2001) have demonstrated this definitively. Neudegg
et al. (1999; 2000) present such transients observed in con-junction with the characteristic magnetic signatures of FTEsdetected conjugately at the magnetopause by the Equator-Sspacecraft, while Wild et al. (2001) report their observationin association with conjugate magnetopause signatures de-tected by the recently launched Cluster satellites.
At F-region altitudes, HF coherent scatter is from field-aligned irregularities created by either the gradient drift insta-bility or the current convective instability; a comprehensivedescription of these instability mechanisms is documented byTsunoda (1988) and references therein. The gradient drift orE×B instability is generated in the presence of a gradient inelectron density in a direction perpendicular to the magneticfield directionB, with an applied electric fieldE with a com-ponent along that gradient. The current convective instabilityis similar in nature to the gradient drift instability but growsin the presence of a field-aligned current. It is well knownthat the motion of F-region irregularities is determined bythe ambient plasma convection (see Davies et al., 2000, andreferences therein).
The instability mechanism responsible for the generationof irregularities within the HF transients observed on the day-side in response to FTEs, and hence, their exact relationshipto the processes of particle precipitation and electric fieldmodification arising in the cusp region due to reconnection atthe magnetopause, is not well understood. Yet this is criticalin unlocking the full potential of ionospheric measurementsas diagnostics of magnetospheric processes. In the currentwork, EISCAT VHF observations of plasma conditions in thevicinity of such HF features, the latter detected by the CUT-LASS Finland radar of the SuperDARN network, providesan ideal opportunity to help resolve this question.
2 Experimental arrangement
An extended run of the EISCAT VHF common programme-4 (CP-4) mode commenced at 10:00 universal time (UT)on 22 November 1999 and continued until 16:00 UT on24 November 1999. In CP-4, the VHF incoherent scatterradar at Tromsø in northern Norway (e.g. Rishbeth and vanEyken, 1993) is operated in a split-beam mode with onebeam (beam 2) directed along the radar boresight, which cor-responds to a geographic azimuth of 359.5◦, and the other(beam 1) phased 14.5◦ west to an azimuth of 345.0◦; bothbeams are at an elevation of 30◦. Long pulse and powerprofile codes are transmitted, the former providing estimatesof plasma concentration, ion and electron temperatures andline-of-sight ion velocity over 20 gates along each beam,with a total altitude coverage of some 280 to 1050 km. Thepower profile pulse scheme yields raw electron density mea-surements at a range resolution of 4.5 km, over 83 gates from80 to 280 km altitude. Observations from both the long pulseand power profile codes from the November 1999 run of CP-4 have been analysed at a temporal resolution of 10 s.
During the CP-4 run, both the Finland and Iceland Eastradars of the CUTLASS HF coherent scatter system, situated
J. A. Davies et al.: Ground-based observations of dayside transient reconnection 783
-2
0
2
4
6
8
10
Bx
(GS
M)
-2
0
2
4
6
8
10
By
(GS
M)
0700 0730 0800 0830 0900 0930
UT
-10
-8
-6
-4
-2
0
2
Bz
(GS
M)
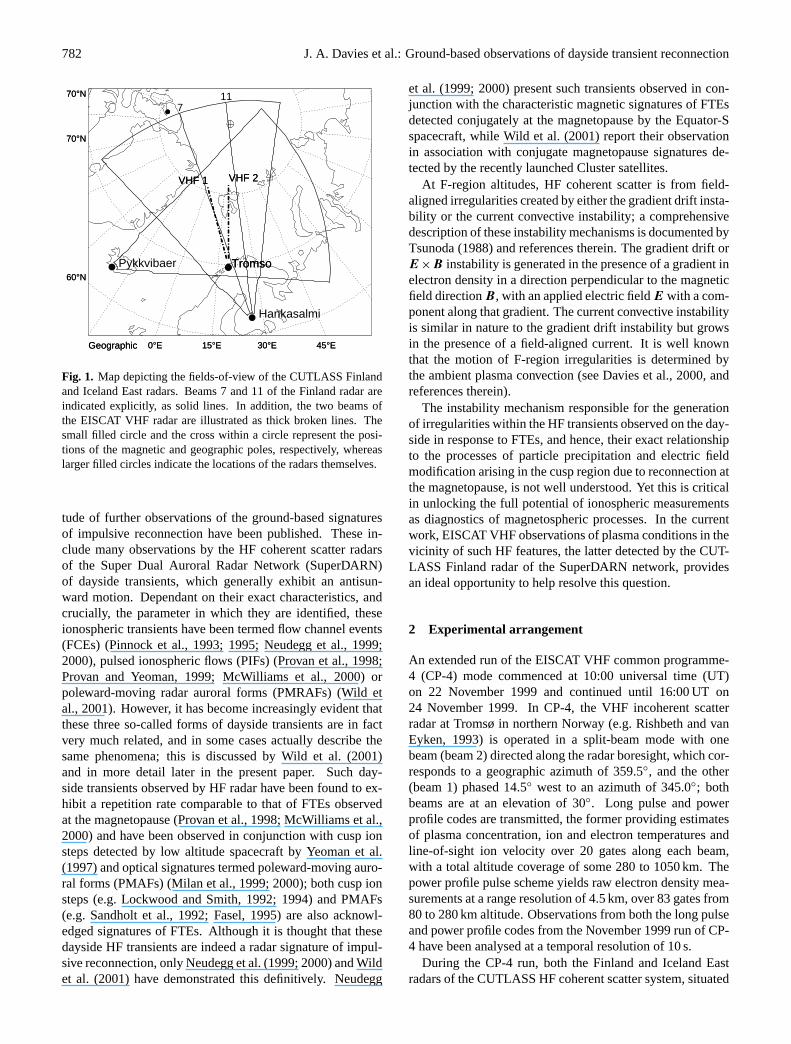
Fig. 2. Interplanetary magnetic field (IMF) observations from theACE and Wind spacecraft, between 06:45 and 09:45 UT on 23November 1999. Panels, from the top, illustrate theX, Y andZ
components of the IMF in geocentric solar magnetic (GSM) co-ordinates for both the ACE (thick line) and Wind spacecraft (thinline). Data are corrected to account for the time delay from thespacecraft to the subsolar point, as discussed in the text. Magneticfield values are in nanoTeslas (nT).
at Hankasalmi in Finland and Pykkvibaer in Iceland, respec-tively, were operating in the standard mode (e.g. Milan et al.,1997). This mode involves sounding sequentially on all 16beams (numbered clockwise 0 to 15), with a dwell time oneach beam of 7 s, giving a full scan of backscatter with an az-imuthal coverage of over 50◦ every 2 min. Seventy-five rangegates of length 45 km (numbered 0 to 74) are sampled alongeach beam, with the range of the first gate from the radaritself being 180 km. Transmission of a multi-pulse scheme,comprising seven sub-pulses, allows for the power and spec-tral width of the returned signal – backscattered from thefield-aligned irregularities of decametre order wavelength towhich the radars are sensitive – to be estimated by a func-tional fit to the decorrelation of the auto-correlation function(ACF) within each range cell. The line-of-sight Doppler ve-locity of the irregularities is determined by a least-squares fitto the phase of the complex value of the ACF.
Figure 1 presents a map depicting the fields-of-view of theCUTLASS Finland and Iceland East radars; beams 7 and 11of the CUTLASS Finland are indicated explicitly. Also il-lustrated by thick broken lines are the two beams of the EIS-CAT VHF radar, from the lowest range gate of power pro-file observation to the uppermost long pulse gate. The largefilled circles represent the locations of the radars themselves;the cross within a circle denotes the geographic pole and themagnetic pole is indicated by the small filled circle.
3 Observations
3.1 Spacecraft observations of the IMF
Figure 2 presents observations of the interplanetary magneticfield (IMF) from the magnetic field instruments onboard theWind and ACE spacecraft, lagged to represent the interval06:45 to 09:45 UT on 23 November 1999 at the subsolarmagnetopause. The three panels of this figure illustrate, fromthe top, theX, Y and Z components of the interplanetarymagnetic field, in nT, in geocentric solar magnetic (GSM) co-ordinates from both the ACE (thick line) and Wind spacecraft(thin line). The time resolution of the magnetic field datafrom ACE is 16 s and from Wind, near 90 s. ACE remainssituated in the vicinity of the Lagrangian (L1) libration point,some 220 Earth radii (RE) upstream of the Earth, while dur-ing the interval presented the Wind satellite travelled fromanX, Y , Z position in GSM coordinates of (−11.0,−62.7,28.6RE) to the position (−10.3,−59.9, 33.9RE); this placesWind well outside the predicted location of the bowshock.As noted previously, observations have been lagged to ac-count for the time taken by the solar wind, with embeddedIMF, observed at the spacecraft to impinge upon the subso-lar magnetopause, following the work of Khan and Cowley(1999). A time delay of 53 min has been applied to the mag-netometer observations from the ACE satellite; for Wind,however, the corresponding delay is less than one minute.Observations from the two spacecraft become highly consis-tent once appropriate time delays are applied.
From 06:45 to 07:10 UT, theZ component of the IMF(BZ) increases rapidly in a southward (negative) directionfrom near zero to a value of around−7 nT.BZ remains con-sistently at this level until 08:30 UT, before reducing slowlyto −5 nT over the remainder of the interval. TheY compo-nent of the IMF (BY ,) is continuously duskward (positive)throughout the interval of interest, decreasing from its initialvalue of 8 nT to 3 nT at 07:10 UT before gradually increasingback to its original level. TheX component of the IMF (BX)is initially directed towards the Earth (negative) but with avalue of only around−1 nT. Subsequent to a reversal some5 min later,BX remains directed away from the Earth (pos-itive), with a typical value of 4 nT. Although not shown, thesolar wind dynamic pressure derived from the plasma experi-ments onboard these two spacecraft are also highly consistentduring this interval, both revealing a fairly constant pressureof some 2 nPa throughout.
784 J. A. Davies et al.: Ground-based observations of dayside transient reconnection
0
15
30
45
60
75R
ange
gat
e
0
15
30
45
60
75R
ange
gat
e
1
2
Beam 7
0
15
30
45
60
75
Ran
ge g
ate
0
15
30
45
60
75
Ran
ge g
ate
0700 0730 0800 0830 0900 0930
UT
0
15
30
45
60
75
Ran
ge g
ate
0700 0730 0800 0830 0900 0930
UT
0
15
30
45
60
75
Ran
ge g
ate
1
2
Beam 11
0700 0730 0800 0830 0900 0930
UT
0700 0730 0800 0830 0900 0930
UT
0369121518212427 P
ower (dB
)
-800-700-600-500-400-300-200-1000 V
elocity (ms
-1)
GroundScatter
0255075100125150175200225 W
idth (ms
-1)
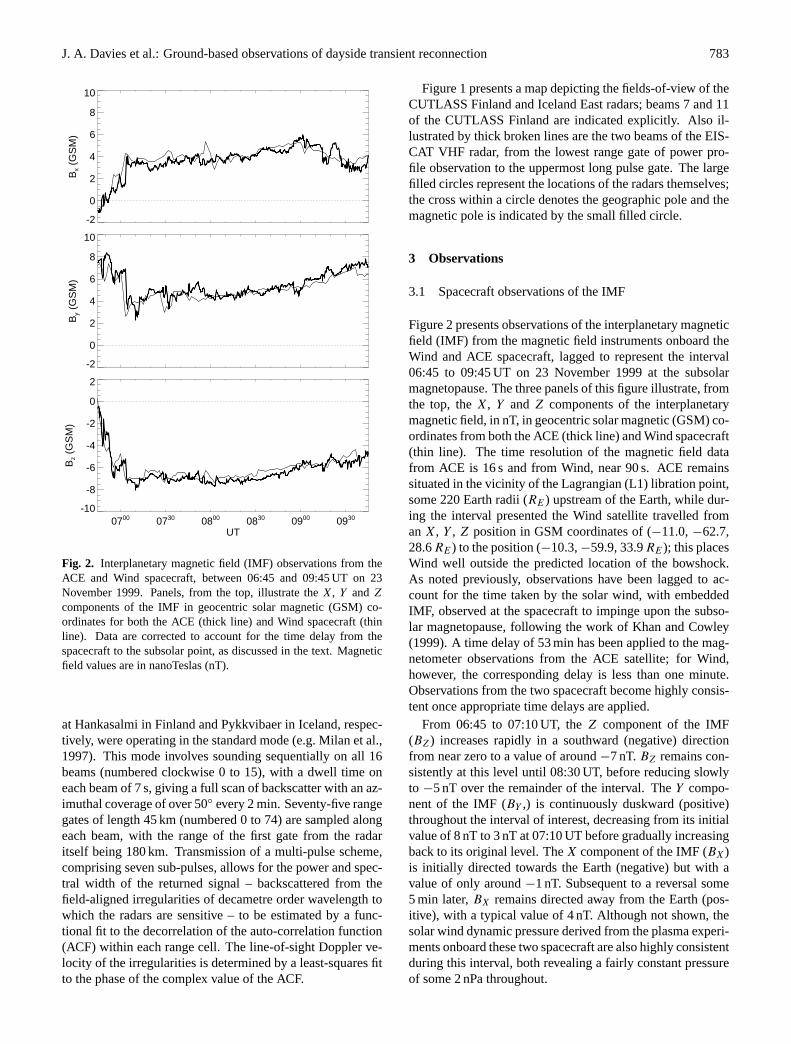
Fig. 3. Observations from beam 7 (left-hand panels) and beam 11 (right-hand panels) of the CUTLASS Finland radar from 06:45 to 09:45 UTon 23 November 1999. For each beam, backscattered power (upper panel), line-of-sight irregularity drift velocity (central panel) and spectralwidth (lower panel) are presented as a function of range gate; positive drift velocities are those directed towards the radar.
Such a strongly southward orientation of the IMF wouldbe expected to facilitate reconnection, be it impulsive orcontinuous, near the subsolar magnetopause, driving twin-cell convection of the high-latitude plasma (see Cowley andLockwood, 1992, and references therein). The magnetictension force exerted on the newly open field lines by thelarge duskward component of the IMF – the well-knownSvalgaard-Mansurov effect (Svalgaard, 1973) – would belikely to produce an asymmetry in the convection patternsuch that a significant dawnward azimuthal flow componentis introduced into the otherwise antisunward flow on the day-side (e.g. Cowley and Lockwood, 1992).
3.2 CUTLASS HF observations
Figure 3 presents CUTLASS Finland HF radar observationsfrom beam 7 (left-hand panels) and beam 11 (right-hand pan-els) during the interval 06:45 to 09:45 UT on 23 November1999; beams 7 and 11 of the Finland radar are marked ex-plicitly on the map illustrated in Fig. 1. For each beam,backscattered power (upper panel), line-of-sight irregularitydrift velocity (central panel) and spectral width (lower panel)are presented as a function of range gate. Positive and nega-tive velocities represent motion of irregularities towards andaway from the radar, respectively, although a suitable scalehas been adopted to reflect the fact that the vast majority ofvelocities observed by the Finland radar within this interval
are actually away from the radar. The velocities of returnsattributed to ground scatter, identified through a combinationof narrow spectral width and low Doppler velocity, are indi-cated in grey. The magnetic latitude coverage of the obser-vations shown is approximately 60 to 90◦ and 60 to 84◦ forbeams 7 and 11, respectively. It should be noted that AltitudeAdjusted Corrected Geomagnetic (AACGM) coordinates areused throughout (Baker and Wing, 1989).
There are two main regions of ionospheric scatter, whichhave been marked 1 and 2 on the upper panels of Fig. 3,which present the backscattered power observations. The re-gion of scatter marked region 1 is evident on both beam 7and beam 11 from approx. 07:00 to 08:00 UT and betweenrange gates 15 and 60. After an initial rapid expansion alongthe beams, the region of scatter tends to move towards theradar. Examination of observations from the entire field-of-view of the Finland radar shows the development of a re-gion of HF scatter, initially in the easternmost beams, whichthen expands westward to cover an extensive portion of theradar field-of-view; this accounts for scatter being observedon beam 11, some 10 minutes earlier than it is seen on themore westward beam 7. The region of ionospheric scatterthen contracts and is replaced by ground scatter. The irreg-ularities within region 1 appear subdivided, roughly accord-ing to latitude, into two distinct populations, with the morepoleward scatter characterised by high and variable line-of-sight drift velocities and wide spectra, and that at lower lati-
J. A. Davies et al.: Ground-based observations of dayside transient reconnection 785
70
72
74
76
78
80
Mag
netic
Lat
itude
70
72
74
76
78
80
Mag
netic
Lat
itude
70
72
74
76
78
80
Mag
netic
Lat
itude
70
72
74
76
78
80
Mag
netic
Lat
itude
0
10
20
30
40
50
60
70
80
90
Electron D
ensity (x1010 m
-3)
70
72
74
76
78
80
Mag
netic
Lat
itude
70
72
74
76
78
80
Mag
netic
Lat
itude
1300
1500
1700
1900
2100
2300
2500
2700
2900
3100 Ion Tem
perature (K)
0700 0730 0800 0830 0900 0930
UT
-800
-600
-400
-200
0
200
X (
nT)
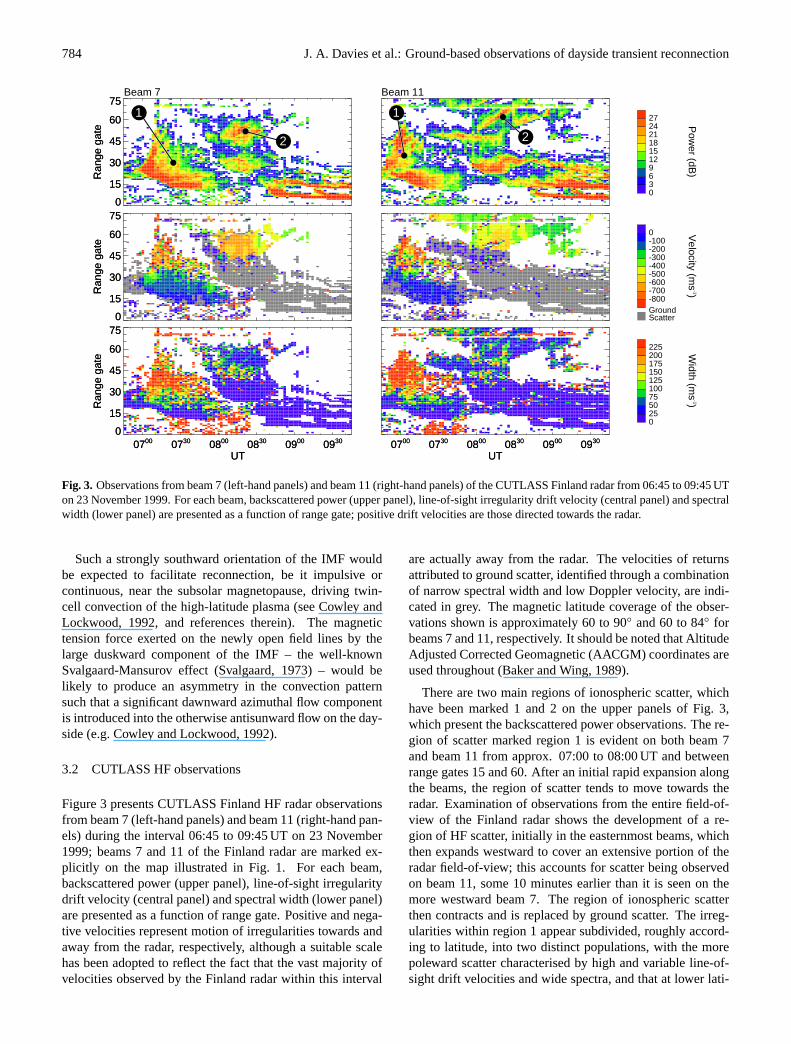
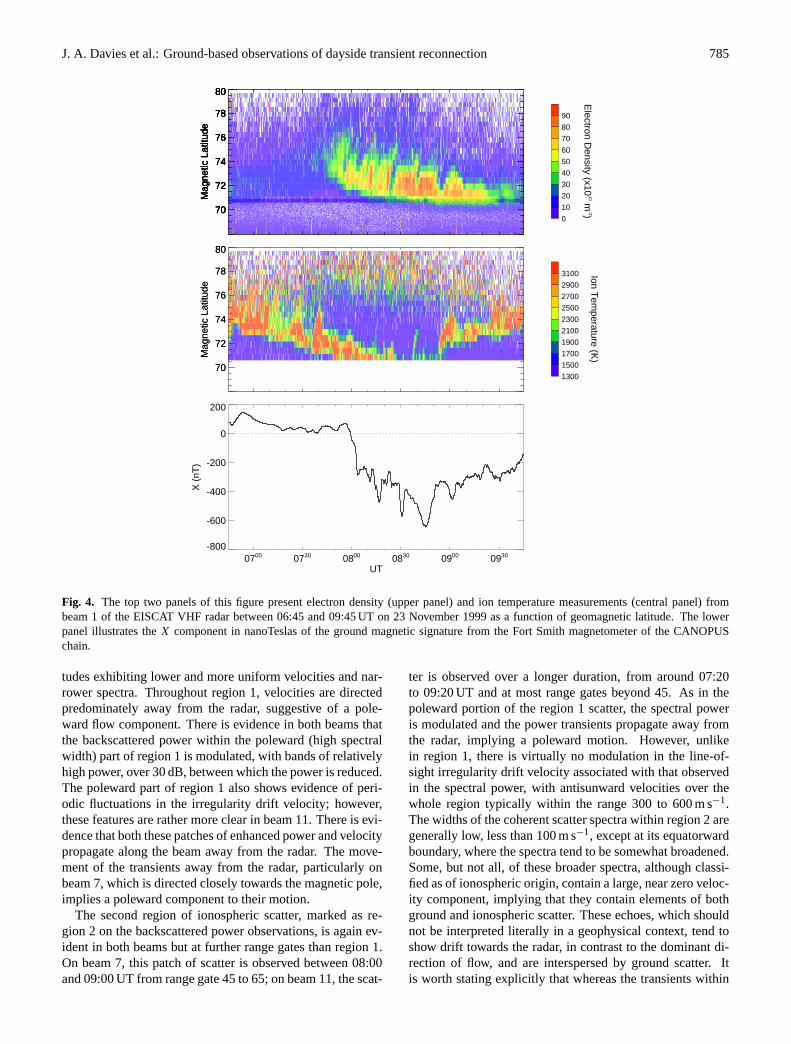
Fig. 4. The top two panels of this figure present electron density (upper panel) and ion temperature measurements (central panel) frombeam 1 of the EISCAT VHF radar between 06:45 and 09:45 UT on 23 November 1999 as a function of geomagnetic latitude. The lowerpanel illustrates theX component in nanoTeslas of the ground magnetic signature from the Fort Smith magnetometer of the CANOPUSchain.
tudes exhibiting lower and more uniform velocities and nar-rower spectra. Throughout region 1, velocities are directedpredominately away from the radar, suggestive of a pole-ward flow component. There is evidence in both beams thatthe backscattered power within the poleward (high spectralwidth) part of region 1 is modulated, with bands of relativelyhigh power, over 30 dB, between which the power is reduced.The poleward part of region 1 also shows evidence of peri-odic fluctuations in the irregularity drift velocity; however,these features are rather more clear in beam 11. There is evi-dence that both these patches of enhanced power and velocitypropagate along the beam away from the radar. The move-ment of the transients away from the radar, particularly onbeam 7, which is directed closely towards the magnetic pole,implies a poleward component to their motion.
The second region of ionospheric scatter, marked as re-gion 2 on the backscattered power observations, is again ev-ident in both beams but at further range gates than region 1.On beam 7, this patch of scatter is observed between 08:00and 09:00 UT from range gate 45 to 65; on beam 11, the scat-
ter is observed over a longer duration, from around 07:20to 09:20 UT and at most range gates beyond 45. As in thepoleward portion of the region 1 scatter, the spectral poweris modulated and the power transients propagate away fromthe radar, implying a poleward motion. However, unlikein region 1, there is virtually no modulation in the line-of-sight irregularity drift velocity associated with that observedin the spectral power, with antisunward velocities over thewhole region typically within the range 300 to 600 m s−1.The widths of the coherent scatter spectra within region 2 aregenerally low, less than 100 m s−1, except at its equatorwardboundary, where the spectra tend to be somewhat broadened.Some, but not all, of these broader spectra, although classi-fied as of ionospheric origin, contain a large, near zero veloc-ity component, implying that they contain elements of bothground and ionospheric scatter. These echoes, which shouldnot be interpreted literally in a geophysical context, tend toshow drift towards the radar, in contrast to the dominant di-rection of flow, and are interspersed by ground scatter. Itis worth stating explicitly that whereas the transients within
786 J. A. Davies et al.: Ground-based observations of dayside transient reconnection
region 2 are associated with narrow spectral widths, this isin marked contrast to the high spectral width scatter in thepoleward portion of region 1 where transients are observed.
3.3 EISCAT VHF observations
Observations from beam 1 of the EISCAT VHF radar dur-ing the interval 06:45 to 09:45 UT on 23 November 1999 arepresented in the two uppermost panels of Fig. 4. The toppanel of this figure illustrates electron density measurementsas a function of AACGM latitude; electron densities below70.5◦ magnetic latitude – equivalent to 280 km altitude – arederived from the power profile, whereas densities above thislatitude are provided by the long pulse scheme. The centralpanel presents long pulse estimates of ion temperature, againfrom beam 1 of the VHF radar.
After 07:45 UT, a series of enhancements in F-region elec-tron density are observed by the EISCAT VHF radar, prop-agating away from the radar, thus poleward. The electrondensity within these features exhibits up to a tenfold increaseover that outside, and the lowest latitude at which successivefeatures are observed tends to migrate equatorwards. Thedensity within the features does, however, tend to reducemarkedly as they propagate to higher latitudes, although thequality of the observations can be seen to deteriorate withincreasing range from the radar as the signal-to-noise ratioreduces. It must be remembered that an increase in latitudealso implies an increase in altitude, so this does not necessar-ily indicate the limit of their extent, perhaps revealing insteadtheir vertical structure. It is, in fact, demonstrated later thatthese features do propagate far poleward of where they ceaseto be observed by the VHF radar. Although observationsfrom beam 1 of the EISCAT VHF radar are presented, as thisbeam is aligned in azimuth approximately along beam 7 ofthe CUTLASS Finland radar, similar structure is also evidentin the boresight beam, beam 2. Although the same featurecan be unambiguously identified in both beams, it appearsseveral minutes earlier in a given range gate on beam 2, sug-gesting a westward component to its motion.
The F-region electron density structures appear to emanatefrom the poleward edge of a moving band of elevated F-region ion temperature, the latter revealed by the VHF longpulse observations and within which there is a significant de-gree of structuring. The region of elevated ion temperatureprogresses equatorward until near 08:30 UT, when only itspoleward edge is visible in the VHF observations. Just priorto 09:00 UT, the region of enhanced ion temperatures sud-denly reappears in the radar field-of-view, and then proceedsin a poleward direction over the remainder of the interval;this will be discussed in Sect. 4.2. Such enhanced ion temper-atures are a consequence of ion frictional heating, resultingfrom differential flow between the ion and neutral popula-tions in the ionospheric F-region (e.g. Schunk et al., 1975; St-Maurice and Schunk, 1979; St-Maurice and Hanson, 1982).At high-latitudes, such relative velocity is most commonlygenerated by enhancements in the ion flow in response toan imposed electric field; the ion velocity responds on far
shorter time scales than the neutral flow, although the pre-vailing sense of the neutral drift will influence the extent offrictional heating (St-Maurice and Hanson, 1982; Davies etal., 1997; 1999). That the band of high F-region ion temper-ature corresponds to a region of substantially enhanced ve-locity is confirmed by invoking a beam swinging technique,combining the line-of-sight ion velocities from correspond-ing magnetic latitudes along both beams of the VHF radar(not shown). Of course it should be remembered that thistechnique requires the vector velocity to be constant betweenthe two beams and if this is not the case, spurious flows maybe introduced, particularly in circumstances such as thesewhere a large flow shear exists (Lockwood et al., 1988). Nev-ertheless, the beam swung plasma velocities in this case re-veal that the enhanced ion temperatures correspond to largewestward flows, which are, in fact, consistent with observa-tions presented in Sect. 4.1.
3.4 CANOPUS magnetometer observations
Although reconnection at the magnetopause is a primary in-fluence on the dayside ionosphere, this is not to say thatnightside processes have no effect on the dayside. The ef-fect of substorm processes on the present observations arediscussed later in Sect. 4.2, specifically with reference tothe interpretation of the EISCAT observations. To this end,magnetometer observations from the nightside are presentedhere. The lower panel of Fig. 4 illustrates theX (north-south)component, in nanoTeslas, of the ground magnetic signa-ture from the Fort Smith magnetometer of the CANOPUSchain. For presentational purposes, the diurnal mean hasbeen subtracted from the absolute values of this componentof the magnetic field. The Fort Smith magnetometer stationis situated at a magnetic latitude of 67.8◦ N and at−55.76◦ Emagnetic longitude. Near 08:00 UT, which corresponds toa magnetic local time (MLT) of roughly 24:00 MLT, thereis a marked negative perturbation in theX component ofthe ground magnetic field, by some 400 nT. This is associ-ated with an enhancement in the westward electrojet cur-rent at the onset of the substorm expansion phase, and fol-lows some 90 min during which no activity was observedon the nightside. Following the first expansion phase on-set, there is evidence of further substorm activations. Ex-amination of theX andZ (vertical) components from all ofthe CANOPUS stations reveals that the maximum enhance-ment in the substorm-associated westward electrojet currentoccurs at around 22:30 MLT near 70◦ magnetic latitude. Thiscorresponds to a location slightly poleward and westward ofthe Fort Smith magnetometer station, from which data areshown.
4 Discussion
4.1 CUTLASS HF observations
The region of HF ionospheric scatter marked as region 1in Fig. 3 (see Sect. 3.2) is considered first. It is suggested
J. A. Davies et al.: Ground-based observations of dayside transient reconnection 787
that the poleward portion of this region of scatter, which asmentioned previously displays high but variable drift veloc-ities and wide spectra, corresponds to the footprint of ac-tive magnetic reconnection at the dayside magnetopause, i.e.the ionospheric projection of the cusp. A predisposition forhigh spectral width HF backscatter within the cusp region hasbeen demonstrated by authors, including Baker et al. (1990;1995), Pinnock et al. (1995) and Andre et al. (1999; 2000a;2000b); in fact, as discussed by Baker et al. (1995), theobservation of strong velocity turbulence in the cusp is notunique to HF radars, since it has also been revealed by low-orbiting satellites. The reason for this is not yet entirelyclear, although Andre et al. (1999; 2000a) have proposedthat wide HF spectra in the cusp may be due to the effectof a time-varying electric field in the 0.1 to 5.0 Hz (Pc1/Pc2)wave band. Alternative mechanisms for the broadening ofcusp spectra, dependent on the presence of small-scale spa-tial structures within the flow pattern, have also been sug-gested (Schiffler et al., 1997; Andre et al., 2000b; Huber andSofko, 2000). Irrespective of the precise physical mecha-nism responsible for the spectral broadening, the widths ofthe spectra identified here as resulting from cusp scatter, typ-ically between 200 and 400 m s−1, are found to be broadlyconsistent with those reported by such authors as Baker etal. (1995) and Pinnock et al. (1995), although as detailedby Baker et al. (1995), the concept of spectral width is lessmeaningful in the cusp region as the spectra tend to be com-prised of multiple components. Assuming the region of widespectra to be representative of the cusp, the region of scat-ter directly equatorward of this – characterised by narrowerspectral width ionospheric scatter with lower and more uni-form irregularity drift velocities – will map to closed fieldlines, with the boundary between the two regimes signify-ing the open-closed field-line boundary (OCFLB). Previousauthors have identified this boundary between high and lowspectral width HF scatter on the dayside as providing a rea-sonable proxy for the OCFLB (e.g. Baker et al., 1995; Milanet al. 1999; Milan and Lester 2001; Moen et al. 2001).
The poleward-propagating enhanced backscatter powerfeatures within the poleward part of region 1 and the region 2scatter (see Sect. 3.2), and the poleward-moving velocity fea-tures observed within the former region only, are reminiscentof a number of previous observations of dayside transients byHF radars, which have been suggested to be the signatures ofFTEs at the magnetopause. However, it is important hereto attempt to clarify the nomenclature that has been used inprevious publications for dayside transients observed by HFradars, and to justify the terminology adopted in this paper.As noted in the Introduction, three terms to describe suchfeatures are in current usage: flow channel events (FECs)(Pinnock et al., 1993, 1995; Neudegg et al., 1999, 2000),pulsed ionospheric flows (PIFs) (Provan et al., 1998; Provanand Yeoman, 1999; McWilliams et al., 2000) and poleward-moving radar auroral forms (PMRAFs) (Wild et al., 2001).FCEs and PIFs, as their names suggest, describe bursts ofenhanced flow in a background of slower-moving plasma.The flow within these features exhibits an enhanced pole-
ward component and in the majority of the cases, the featuresthemselves are seen to progress in an antisunward direction.The difference between these two terms is simply that FCEswere identified by their spatial characteristics, whereas PIFswere identified from their temporal evolution. It is unfortu-nate that in some publications, the term PIF has been used todescribe a discrete poleward-propagating region of high ve-locity backscatter, such that adjacent PIFs are separated by aregion in which there is an absence of HF scatter denoting areturned power lower than the noise level. In the case of suchHF radar observations, it is impossible to determine whetherthe flow is itself pulsed or the pulsing is merely in the obser-vations. In fact, this ambiguity was part of the reason for theintroduction of the term PMRAF, which simply describes apoleward-moving transient observed in backscattered power.
The present observations are unlike many of those previ-ously published in which each transient tends to comprisean isolated region of scatter. In this case, the backscatterpower between each transient is reduced, but not to such anextent that the scatter is completely lost. The cusp scatter ofregion 1 shows poleward-moving structures in both the re-turned power and the line-of-sight irregularity drift velocity;the former is consistent with what has been termed PMRAFsand the latter, PIFs. In the region 2 scatter, there is no evi-dence of pulsing in the flow such that only PMRAFs are ob-served within this region. Although the individual transientsare not very well defined, due to relatively low temporal res-olution of observations along a single beam (120 s), their re-currence rate appears to be of the order of 10 min, a figurethat is similar in all beams over which the region 2 scatter isobserved. This value concurs well with previous studies ofHF transients (Provan et al., 1998; McWilliams et al., 2000)and, indeed, the repetition rate of FTEs observed at the mag-netopause (Rijnbeek et al., 1984; Lockwood and Wild, 1993;Kuo et al., 1995). Their occurrence, under conditions of asouthward oriented IMF, is also consistent with previouslydocumented studies of HF transients (e.g. McWilliams et al.,2000) and FTEs (e.g. Rijnbeek et al., 1984; Kuo et al., 1995;Kawano and Russell, 1997).
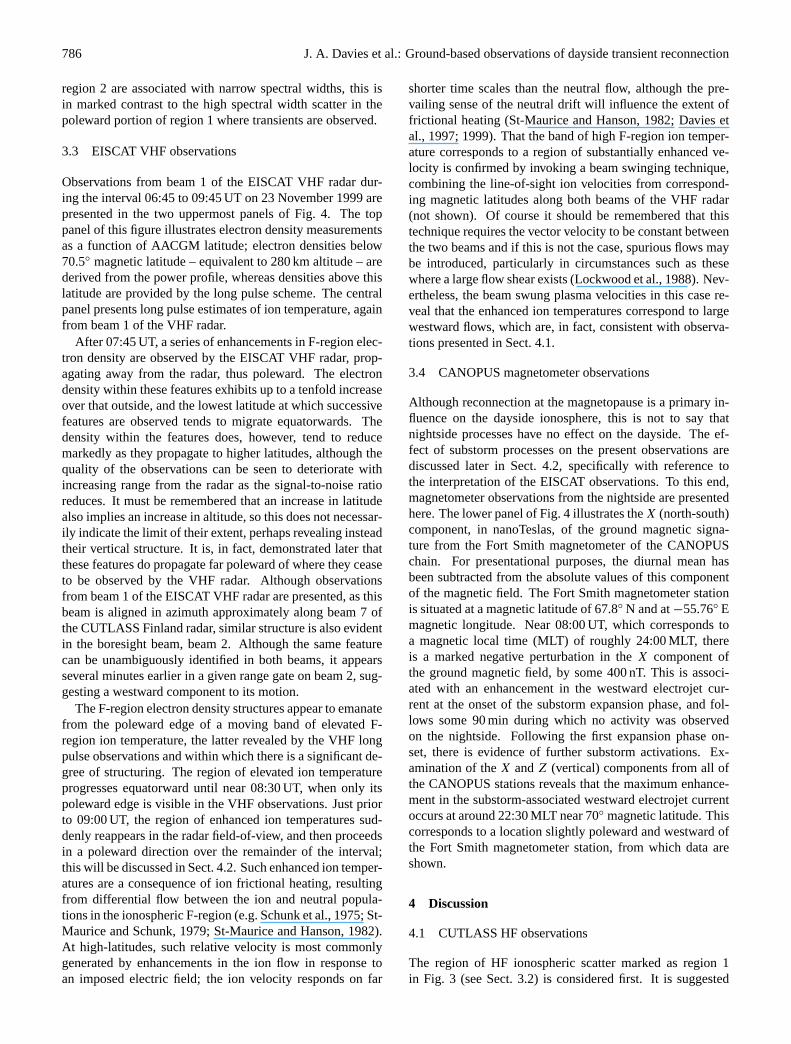
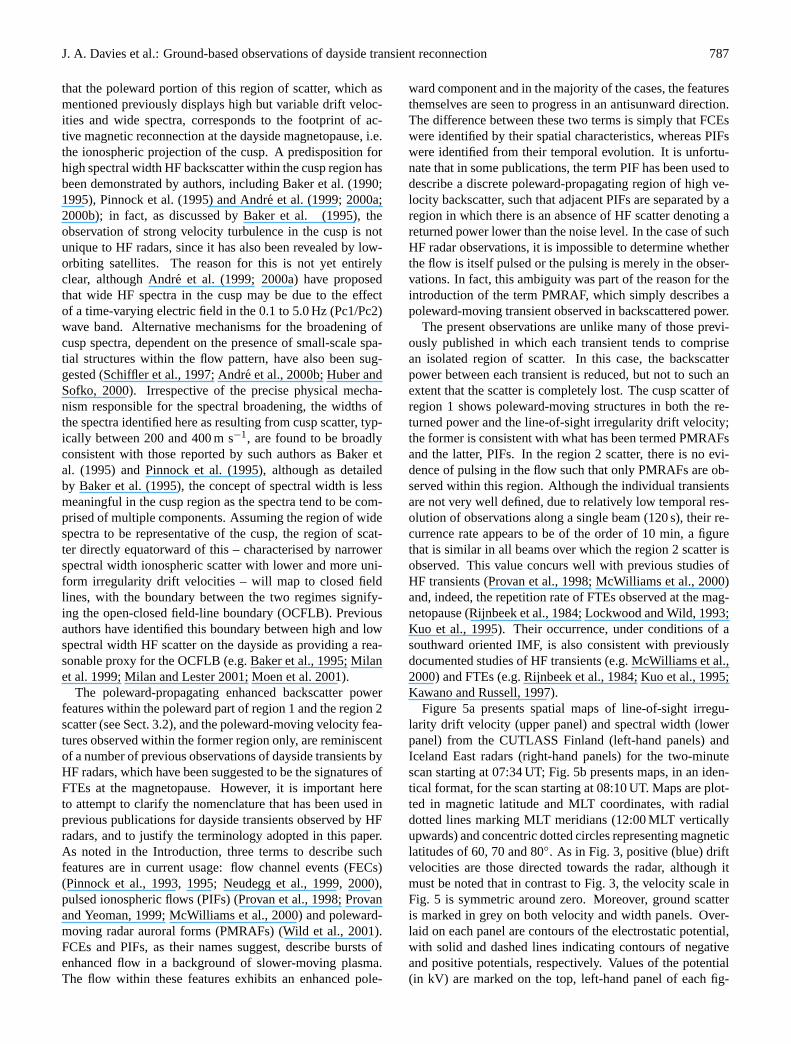
Figure 5a presents spatial maps of line-of-sight irregu-larity drift velocity (upper panel) and spectral width (lowerpanel) from the CUTLASS Finland (left-hand panels) andIceland East radars (right-hand panels) for the two-minutescan starting at 07:34 UT; Fig. 5b presents maps, in an iden-tical format, for the scan starting at 08:10 UT. Maps are plot-ted in magnetic latitude and MLT coordinates, with radialdotted lines marking MLT meridians (12:00 MLT verticallyupwards) and concentric dotted circles representing magneticlatitudes of 60, 70 and 80◦. As in Fig. 3, positive (blue) driftvelocities are those directed towards the radar, although itmust be noted that in contrast to Fig. 3, the velocity scale inFig. 5 is symmetric around zero. Moreover, ground scatteris marked in grey on both velocity and width panels. Over-laid on each panel are contours of the electrostatic potential,with solid and dashed lines indicating contours of negativeand positive potentials, respectively. Values of the potential(in kV) are marked on the top, left-hand panel of each fig-
788 J. A. Davies et al.: Ground-based observations of dayside transient reconnection
(a)
Finland Iceland East
0734-0736 UT
-800
-600
-400
-200
0
200
400
600
800
Velocity (m
s-1)
GroundScatter
0
25
50
75
100
125
150
175
200
225
Width (m
s-1)
GroundScatter
-3
-9
-15-21-27-33-39
3
9
15
(b)
Finland Iceland East
0810-0812 UT
-800
-600
-400
-200
0
200
400
600
800
Velocity (m
s-1)
GroundScatter
0
25
50
75
100
125
150
175
200
225
Width (m
s-1)
GroundScatter
-3
-9
-15-21-27-33-39
3
9
Fig. 5. (a)The left- and right-hand panels of this figure illustrate spatial maps of line-of-sight irregularity drift velocity (upper panel) andspectral width (lower panel) from the CUTLASS Finland and Iceland East radars, respectively, for the scan starting at 07:34 UT. Maps areplotted in magnetic latitude and magnetic local time (MLT) coordinates; radial dotted lines indicate MLT meridians, with 12 MLT verticallyupwards, while concentric dotted circles represent magnetic latitudes of 60, 70 and 80◦. Positive drift velocities are those directed towardsthe radar. Overlaid on each panel are contours of the electrostatic potential, derived using the technique developed by Ruohoniemi and Baker(1998) as discussed in the text, with solid and dashed lines indicating negative and positive potentials, respectively.(b) As for Fig. (a), forthe scan starting at 08:10 UT.
J. A. Davies et al.: Ground-based observations of dayside transient reconnection 789
ure. The potential pattern is derived from the line-of-sightvelocities of all available Northern Hemisphere SuperDARNradars, using the spherical harmonic potential fitting tech-nique developed by Ruohoniemi and Baker (1998). In thiscase, the fit has been expanded to an order 8, constrainedat its equatorward edge to a magnetic latitude of 60◦. Cal-culation of the potential pattern is stabilised by the statisticalmodel of Ruohoniemi and Greenwald (1996), for the prevail-ing IMF conditions.
Observations from the entire field-of-view of the Finlandradar for the scan starting at 07:34 UT (Fig. 5a) reveal thefull spatial extent of the region 1 scatter at that time, cover-ing from 65 to 75◦ in magnetic latitude and some two hoursof MLT. The high spectral widths measured by the Finlandradar in the poleward portion of region 1 – characteristicof the cusp – are also present roughly in the same loca-tion by the Iceland East observations. Moreover, the IcelandEast observations from 08:10 UT, presented in Fig. 5b, con-firm that this region of wide spectra still exists even when ithas been obscured by ground scatter in the Finland field-of-view. Both of the scans show twin cell convection, typicalof that which would be expected under the conditions of astrongly southward IMF present during this interval in re-sponse to reconnection at the subsolar magnetopause (Cow-ley and Lockwood, 1992). The large, positiveBY produces,via the Svalgaard-Mansurov effect, an asymmetry in the con-vection pattern such that a significant westward flow compo-nent is introduced into the cusp region (i.e. region 1); thisevolves at more poleward latitudes into a more antisunwarddirected flow. Again, this is consistent with the theoreti-cal flow response described by such authors as Cowley andLockwood (1992). The PIFs observed in the region 1 scat-ter can be explained in terms of the large bursts of azimuthalflow produced in the cusp by FTEs under conditions of alargeY component of IMF.
The evolution from an aziumthal,BY dominated, flow toa more antisunward directed flow regime at higher latitudesstrongly supports the idea that the PMRAFs have migratedpoleward from lower latitudes, i.e. from region 1, throughthat region in which propagation conditions mean that thePMRAFs themselves cannot be observed. It is actually thesource-mechanism for the generation of field-aligned irreg-ularities that propagates, rather than the irregularities them-selves, as the latter only has a lifetime of the order of seconds(e.g. Tsunoda, 1988). It can, therefore, be inferred that thePMRAFs originate in the region of high spectral width cuspscatter, where they are accompanied by PIFs. These obser-vations show clearly a reduction in the spectral width, as thePMRAFs move with respect to the cusp and, moreover, in thedifference in the velocity fields of the two regions. Again, itshould be remembered that some of the spectra on the equa-torward edge of the region of PMRAFs contain elements ofground scatter. It is unfortunate that the PMRAFs and theirsource region are separated, thus masking the evolution ofscatter between these two regimes.
Although it is thought that the PMRAFs form in thecusp region in response to transient reconnection, it is not
necessarily obvious whether their poleward propagationtraces the motion of the footprint of transient reconnectionitself or whether PMRAFs instead reveal fossil signaturesof FTEs, i.e. signatures which, although generated by FTEactivity, persist beyond the interval of active reconnection.Observations presented by McWilliams et al. (2001) sug-gested that only for the first part of its lifetime in the radarfield-of-view, did an HF transient map the footprint of an ac-tive reconnection region, moving mainly longitudinally un-der the magnetic tension force induced by the IMFBY com-ponent and with a phase velocity roughly twice the convec-tion speed. After this, the transient slowed to the convec-tion velocity, moving antisunward with the reconnected fieldlines. It should be stated that the study of McWilliams et al.(2001) was exceptional in that twodimensional vector obser-vations of the convection pattern were available throughoutthe ionospheric footprint of an FTE. The authors noticed a re-duction in the spectral width of the feature as it propagated,as is also evident in the present observations. It is deemedlikely, although this was not stated explicitly by McWilliamset al. (2001), that the reduction in spectral width reflects thePMRAF leaving the region of active reconnection. This isvery much confirmed by the fact that in the region 1 scat-ter they are accompanied by PIFs and this is not so in theregion 2 scatter.
4.2 EISCAT VHF observations
The EISCAT VHF observations presented in Sect. 3 reveal,in summary, a series of F-region electron density enhance-ments propagating poleward from a region characterised byhigh ion temperature, the latter resulting from ion frictionalheating in the presence of large, mainly azimuthal ion flows.Modelling work has suggested that a band of high ion tem-peratures, enhanced through frictional heating, will form onthe low-latitude side of a contracting OCFLB and on thehigh-latitude side of an expanding boundary (Lockwood andFuller-Rowell, 1987a, b); this is supported by observationsby Lockwood et al. (1988). This supports the idea that theequatorward edge of the region of high ion temperature ob-served here represents the OCFLB. The large-scale equator-ward motion of this region of enhanced flow before 08:30 UTresults from the addition of flux to the polar cap on the day-side under the prevailing southward IMF conditions. Thereversal in the general sense of motion of this feature after08:30 UT can be explained by the observation of intense sub-storm activity around this time on the nightside, as diagnosedprincipally in magnetometer data from the CANOPUS chain(see Fig. 3), leading to a poleward motion of the polar capboundary, despite the fact that open magnetic flux is still be-ing added to the polar cap on the dayside under continuingconditions of southward IMF.
There is little doubt that formation of the poleward-moving plasma density enhancements is related in some wayto this band of enhanced ion temperature; indeed, the iontemperature within this region is pulsed with a period com-parable to that observed at higher latitudes in the electron
790 J. A. Davies et al.: Ground-based observations of dayside transient reconnection
0700 0730 0800 0830 0900 0930
UT
70
72
74
76
78
80
Mag
netic
Lat
itude
0700 0730 0800 0830 0900 0930
UT
70
72
74
76
78
80
Mag
netic
Lat
itude
Ion Temperature
Electron Density
4000 K
75x1010 m-3
70
72
74
76
78
80
Mag
netic
Lat
itude
70
72
74
76
78
80
Mag
netic
Lat
itude
0
25
50
75
100
125
150
175
200
225
Width (m
s-1)
Ionospheric
scat only
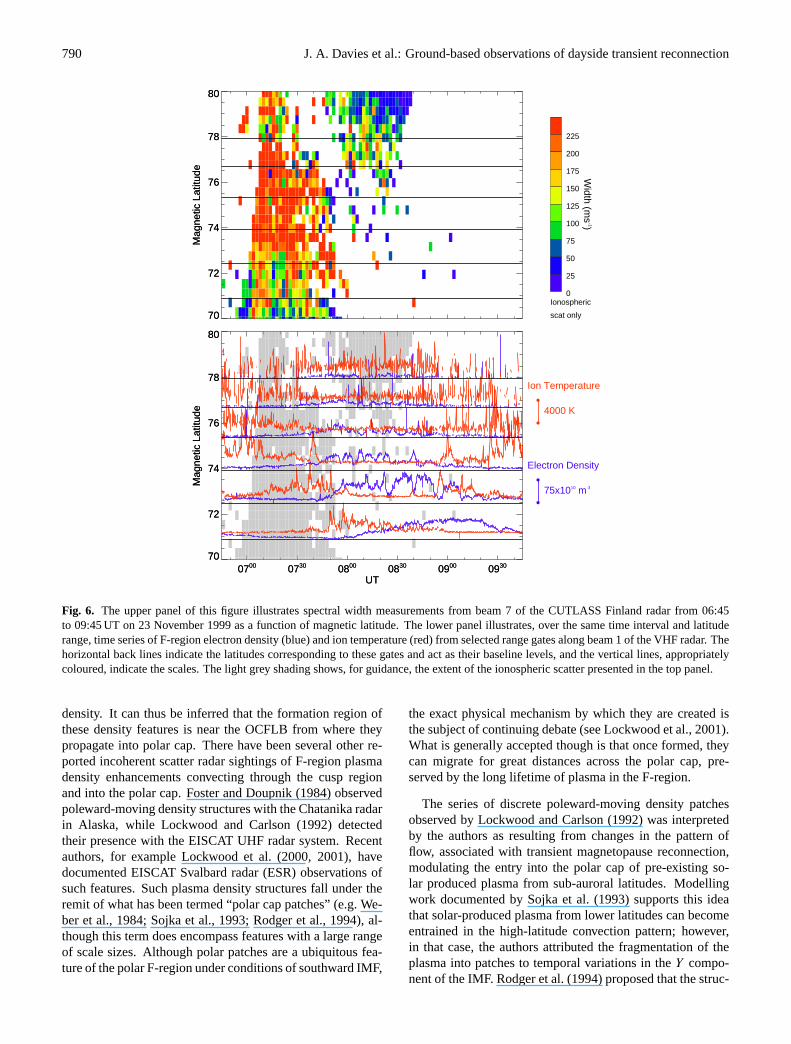
Fig. 6. The upper panel of this figure illustrates spectral width measurements from beam 7 of the CUTLASS Finland radar from 06:45to 09:45 UT on 23 November 1999 as a function of magnetic latitude. The lower panel illustrates, over the same time interval and latituderange, time series of F-region electron density (blue) and ion temperature (red) from selected range gates along beam 1 of the VHF radar. Thehorizontal back lines indicate the latitudes corresponding to these gates and act as their baseline levels, and the vertical lines, appropriatelycoloured, indicate the scales. The light grey shading shows, for guidance, the extent of the ionospheric scatter presented in the top panel.
density. It can thus be inferred that the formation region ofthese density features is near the OCFLB from where theypropagate into polar cap. There have been several other re-ported incoherent scatter radar sightings of F-region plasmadensity enhancements convecting through the cusp regionand into the polar cap. Foster and Doupnik (1984) observedpoleward-moving density structures with the Chatanika radarin Alaska, while Lockwood and Carlson (1992) detectedtheir presence with the EISCAT UHF radar system. Recentauthors, for example Lockwood et al. (2000, 2001), havedocumented EISCAT Svalbard radar (ESR) observations ofsuch features. Such plasma density structures fall under theremit of what has been termed “polar cap patches” (e.g. We-ber et al., 1984; Sojka et al., 1993; Rodger et al., 1994), al-though this term does encompass features with a large rangeof scale sizes. Although polar patches are a ubiquitous fea-ture of the polar F-region under conditions of southward IMF,
the exact physical mechanism by which they are created isthe subject of continuing debate (see Lockwood et al., 2001).What is generally accepted though is that once formed, theycan migrate for great distances across the polar cap, pre-served by the long lifetime of plasma in the F-region.
The series of discrete poleward-moving density patchesobserved by Lockwood and Carlson (1992) was interpretedby the authors as resulting from changes in the pattern offlow, associated with transient magnetopause reconnection,modulating the entry into the polar cap of pre-existing so-lar produced plasma from sub-auroral latitudes. Modellingwork documented by Sojka et al. (1993) supports this ideathat solar-produced plasma from lower latitudes can becomeentrained in the high-latitude convection pattern; however,in that case, the authors attributed the fragmentation of theplasma into patches to temporal variations in theY compo-nent of the IMF. Rodger et al. (1994) proposed that the struc-
J. A. Davies et al.: Ground-based observations of dayside transient reconnection 791
0
3
6
9
12
15
18
21
24
27
Pow
er (dB)
Ionospheric
scat only
0
10
20
30
40
50
60
70
80
90
Electron D
ensity (x1010 m
-3)
0700 0730 0800 0830 0900 0930
UT
69
71
73
75
77
79
81
83
85
87
Mag
netic
Lat
itude
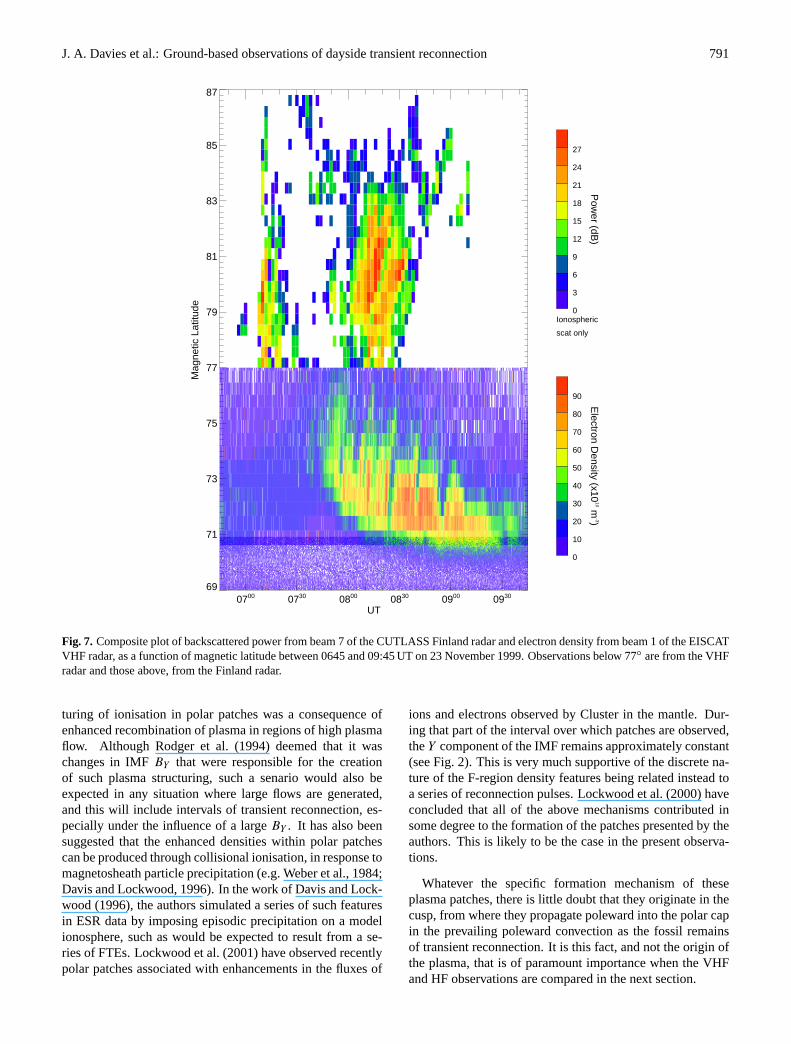
Fig. 7. Composite plot of backscattered power from beam 7 of the CUTLASS Finland radar and electron density from beam 1 of the EISCATVHF radar, as a function of magnetic latitude between 0645 and 09:45 UT on 23 November 1999. Observations below 77◦ are from the VHFradar and those above, from the Finland radar.
turing of ionisation in polar patches was a consequence ofenhanced recombination of plasma in regions of high plasmaflow. Although Rodger et al. (1994) deemed that it waschanges in IMFBY that were responsible for the creationof such plasma structuring, such a senario would also beexpected in any situation where large flows are generated,and this will include intervals of transient reconnection, es-pecially under the influence of a largeBY . It has also beensuggested that the enhanced densities within polar patchescan be produced through collisional ionisation, in response tomagnetosheath particle precipitation (e.g. Weber et al., 1984;Davis and Lockwood, 1996). In the work of Davis and Lock-wood (1996), the authors simulated a series of such featuresin ESR data by imposing episodic precipitation on a modelionosphere, such as would be expected to result from a se-ries of FTEs. Lockwood et al. (2001) have observed recentlypolar patches associated with enhancements in the fluxes of
ions and electrons observed by Cluster in the mantle. Dur-ing that part of the interval over which patches are observed,theY component of the IMF remains approximately constant(see Fig. 2). This is very much supportive of the discrete na-ture of the F-region density features being related instead toa series of reconnection pulses. Lockwood et al. (2000) haveconcluded that all of the above mechanisms contributed insome degree to the formation of the patches presented by theauthors. This is likely to be the case in the present observa-tions.
Whatever the specific formation mechanism of theseplasma patches, there is little doubt that they originate in thecusp, from where they propagate poleward into the polar capin the prevailing poleward convection as the fossil remainsof transient reconnection. It is this fact, and not the origin ofthe plasma, that is of paramount importance when the VHFand HF observations are compared in the next section.
792 J. A. Davies et al.: Ground-based observations of dayside transient reconnection
4.3 Comparison of the CUTLASS and EISCAT observa-tions
In this section, the CUTLASS Finland HF coherent scatterobservations are compared to the incoherent scatter obser-vations from the EISCAT VHF radar. The upper panel ofFig. 6 illustrates spectral width measurements from beam 7of the CUTLASS Finland radar from 06:45 to 09:00 UT on23 November 1999, as a function of magnetic latitude from70 to 80◦; any HF returns identified as ground scatter, byvirtue of their velocity and spectral width, have been ex-cluded. The lower panel of this figure illustrates over thesame time interval and latitude range time series of longpulse estimates of F-region electron density (blue) and iontemperature (red) from selected range gates along beam 1of the VHF radar. The horizontal black lines indicate thelatitudes corresponding to these gates and act as their base-line levels, and the appropriately coloured vertical lines atthe side indicate the scales. The light grey shading shows,for guidance, the extent of the ionospheric scatter presentedin the top panel.
The upper panel of this figure shows clearly the markeddifference between the spectral width of the irregularitieswithin the PMRAFs themselves (of which only the equa-torward portion is shown) and the region of broad spectraidentified as the cusp, from where they were demonstratedto originate (see Sect. 4.1). The lower panel reveals that thehigh spectral width scatter observed by the HF radar is co-located with the region of high and variable ion temperaturesand thus flows, both of which are consistent with this be-ing the footprint of active reconnection. There are regionsof intense frictional heating where there is an absence ofscatter, but due to the nature of HF propagation a lack ofscatter in a given range gate does not necessarily imply any-thing about the characteristics of the irregularities therein. Itis heartening to find that the region of lower spectral widthand, therefore, less turbulent scatter, which lies equatorwardof this cusp scatter and has been proposed to correspond toclosed field lines, does indeed correspond to a region of morequiescent plasma conditions.
Like Fig. 3, Fig. 6 shows the distinct change in the plasmadirectly poleward of the cusp region. This region of highand variable flows is replaced by a regime of more quiescentconditions but with the presence of the plasma patches. Thislatter region is unfortunately masked in the HF data by anabsence of ionospheric scatter. In order to reveal the rela-tionship between the PMRAFS and prevailing conditions inthe ionospheric plasma, the data are presented in the formatof Fig. 7. Figure 7 presents a composite plot of backscat-tered power from beam 7 of the CUTLASS Finland radarand electron density from beam 1 of the EISCAT VHF radarbetween 06:45 and 09:00 UT on 23 November 1999. Thedata are plotted from 69 to 87◦ magnetic latitude, with thoseobservations below 77◦ being electron density from the in-coherent scatter radar and those above, backscattered powerfrom its coherent counterpart. As in the previous figure, onlyHF observations identified as originating from ionospheric
scatter are included. As in Fig. 4, electron densities below70.5◦ magnetic latitude are derived from the power profile,whereas densities above this latitude are provided by the longpulse scheme.
There is only limited latitudinal overlap between the tran-sients observed in HF and VHF data, with the transients ob-served by the HF radar lying poleward of those observed byEISCAT. However, as noted previously, it can be inferredthat the PMRAFs have migrated poleward, and have, there-fore, passed through the region in which the F-region elec-tron density patches are observed by the VHF radar. Thereduction in the electron density within the patches as theymove to the further ranges is assumed to be an altitude effectrather than indicating the limit of their poleward extent. It isknown that the formation of irregularities in the HF backscat-ter features via the gradient drift requires an electron densitygradient. Therefore, it is highly probable that the regions ofantisunward-propagating enhanced F-region electron densityobserved by the EISCAT VHF radar, continue to propagatepoleward for many hundreds of kilometres beyond that re-gion which can be probed by the VHF radar and it is the gra-dients on the trailing edge of these features which create thefield-aligned irregularities within the PMRAFs observed bythe Finland radar. By viewing the combined EISCAT VHFand CUTLASS Finland HF radar observations in this way,the motion of these patches of enhanced F-region plasmadensity, which originate in the vicinity of the cusp, can betracked over a distance of some 1700 km, equivalent to 15◦
of latitude. This provides, of course, only a lower limit totheir potential lifetime and it is not inconceivable that, giventhe long recombination times in the polar F-region, the am-bient antisunward flow can transport these features well intothe nightside.
5 Summary
EISCAT VHF observations have revealed a series of F-region electron density enhancements, travelling antisun-ward through the polar cap, under conditions of a stronglysouthward IMF. These observations were associated withPMRAFs detected by the CUTLASS Finland HF radar. SuchPMRAFs, commonly observed by HF radars near noon, aregenerally interpreted as the radar signature of flux trans-fer events. However, the precise physical mechanism forthe generation of field-aligned irregularities within such fea-tures, and hence, their exact relationship to the particle pre-cipitation and large electric fields which arise in the cuspin response to magnetopause reconnection, is not well de-termined. This work provides compelling evidence thatthese poleward-propagating HF backscatter features are mostlikely formed in electron density gradients produced bystructuring of the ionosphere within the cusp region. ThePMRAFs become narrow in spectral width as they evolveaway from more classical cusp scatter from which they em-anate; in the cusp scatter they are accompanied by PIFs. It isconcluded that over much of their lifetime, when they are in
J. A. Davies et al.: Ground-based observations of dayside transient reconnection 793
fact in the polar cap, the PMRAFs trace fossil signatures oftransient reconnection rather than revealing the footprint ofactive reconnection itself.
Acknowledgements.The authors are indebted to the director andstaff of EISCAT for operating the facility and supplying the dataand to the EISCAT group at the Rutherford Appleton Labora-tory for maintenance of the analysis software and assistance there-with. EISCAT is an international facility funded collaboratively bythe research councils of Finland (SA), France (CNRS), the Fed-eral Republic of Germany (MPG), Japan (NIPR), Norway (NAVF),Sweden (NFR) and the United Kingdom (PPARC). CUTLASS isfunded jointly by PPARC (Grant number PPA/R/R/1997/00256),the Swedish Institute for Space Physics, Uppsala, and the FinnishMeteorological Institute, Helsinki. The authors acknowledge theprincipal investigators R. Lepping and N. Ness for enabling use ofthe Wind and ACE MFI key parameter data, respectively. Thanksare also due to the Canadian Space Agency for providing theCANOPUS magnetometer data. J. A. Davies and S. E. Milan aresupported on PPARC grant number PPA/G/O/1999/00181. I. J. Raeis supported by the Natural Sciences and Engineering Council ofCanada (NSERC). K. A. McWilliams is funded by the Associationof Commonwealth Universities of the British Council.
The Editor in Chief thanks F. Sedgemore-Schulthess for his helpin evaluating this paper.
References
Andre, R., Pinnock, M., and Rodger, A. S.: On the autocorrelationfunction observed in the ionospheric cusp, Geophys. Res. Lett.,26, 3353–3356, 1999.
Andre, R., Pinnock, M., and Rodger, A. S.: Identification of thelow-altitude cusp by Super Dual Auroral Radar Network radars:a physical explanation for the empirically derived signature, J.Geophys. Res., 105, 27 081–27 093, 2000a.
Andre, R., Pinnock, M., Villain, J.-P., and Hanuise, C.: On thefactor conditioning the Doppler spectral width determined fromSuperDARN HF radars, Int. J. Geomag. Aeronomy, 2, 77–86,2000b.
Baker, K. B. and Wing, S.: A new magnetic coordinate system forconjugate studies at high latitudes, J. Geophys. Res., 94, 9139–9143, 1989.
Baker, K. B., Greenwald, R. A., Ruohoniemi, J. M., Dudeney, J. R.,Pinnock, M., Newell, P. T., Greenspan, M. E., and Meng, C.-I.: Simultaneous HF-radar and DMSP observations of the cusp,Geophys. Res. Lett., 17, 1869–1872, 1990.
Baker, K. B., Dudeney, J. R., Greenwald, R. A., Pinnock, M.,Newell, P. T., Rodger, A. S., Mattin, N., and Meng, C.-I.: HFradar signatures of the cusp and low-latitude boundary layer, J.Geophys. Res., 100, 7671–7695, 1995.
Cowley, S. W. H. and Lockwood, M.: Excitation and decay of so-lar wind-driven flows in the magnetosphere-ionosphere system,Ann. Geophysicae, 10, 103–115, 1992.
Davies, J. A., Lester, M., and McCrea, I. W.: A statistical study ofion frictional heating observed by EISCAT, Ann. Geophysicae,15, 1399–1411, 1997.
Davies, J. A., Lester, M., and McCrea, I. W.: Solar and seasonal de-pendence of ion frictional heating, Ann. Geophysicae, 17, 682–691, 1999.
Davies, J. A., Yeoman, T. K., Rae, I. J., Milan, S. E., Lester, M.,McWilliams, K. A., and Lockwood, M.: A comparison of F-
region ion velocity observations from the EISCAT Svalbard andVHF radars with irregularity drift velocity measurements fromthe CUTLASS Finland HF radar, Ann. Geophysicae, 18, 589–594, 2000.
Davis, C. J. and Lockwood, M.: Predicted signatures of pulse recon-nection in ESR data, Ann. Geophysicae, 14, 1246–1256, 1996.
Fasel, G. J.: Dayside poleward moving auroral forms: a statisticalstudy, J. Geophys. Res., 100, 11 891–11 905, 1995.
Foster, J. C. and Doupnik, J. R.: Plasma convection in the vicinityof the cleft, J. Geophys. Res., 89, 9107–9113, 1984.
Goertz, C. K., Nielsen, E., Korth, A., Glaßmeier, K.-H., Haldoupis,C., Hoeg, P., and Hayward, D.: Observations of a possible sig-nature of flux transfer events, J. Geophys. Res., 90, 4069–4078,1985.
Haerendel, G., Paschmann, G., Sckopke, N., Rosenbauer, H., andHedgecock, P. C.: The frontside boundary layer of the magne-topause and the problem of reconnection, J. Geophys. Res., 83,3195–3216, 1978.
Huber, M. and Sofko, G. J.: Small-scale vortices in the high-latitudeF-region, J. Geophys. Res., 105, 20 885–20 897, 2000.
Kawano, H. and Russell, C. T.: Survey of flux transfer events ob-served with the ISEE 1 spacecraft: dependence on the interplan-etary magnetic field, J. Geophys. Rev, 102, 11 307–11 313, 1997.
Khan, H. and Cowley, S. W. H.: Observations of the response timeof high-latitude ionospheric convection to variations in the in-terplanetary magnetic field using EISCAT and IMP-8 data, Ann.Geophysicae, 17, 1306–1335, 1999.
Kuo, H., Russell, C. T., and Lee, G.: Statistical studies of flux trans-fer events, J. Geophys. Res., 100, 3513–3519, 1995.
Lockwood, M. and Fuller-Rowell, T. J.: The modelled occurrenceof non-thermal plasma in the ionospheric F-region and the possi-ble consequences for ion outflows into the magnetosphere, Geo-phys. Res. Lett., 14, 371–374, 1987a.
Lockwood, M. and Fuller-Rowell, T. J.: Correction to “The mod-elled occurrence of non-thermal plasma in the ionospheric F-region and the possible consequences for ion outflows into themagnetosphere”, Geophys. Res. Lett., 14, 581–581, 1987b.
Lockwood, M., Cowley, S. W. H., Todd, H., Willis, D. M., andClauer, C. R.: Ion flows and heating at a contracting polar-capboundary, Planet. Space Sci., 11, 1229–1253, 1988.
Lockwood, M. and Carlson, H. C.: Production of polar cap electrondensity patches by transient magnetopause reconnection, Geo-phys. Res. Lett., 19, 1731–1734, 1992.
Lockwood, M. and Smith, M. F.: The variation of reconnection rateat the dayside magnetopause and cusp ion precipitation, J. Geo-phys. Res., 97, 14 841–14 847, 1992.
Lockwood, M. and Wild, M. N.: On the quasi-periodic nature ofmagnetopause flux transfer events, J. Geophys. Res., 98, 5935–5940, 1993.
Lockwood, M. and Smith, M. F.: Low- and mid-altitude cusp parti-cle signatures for general magnetopause reconnection rate varia-tions, 1. Theory, J. Geophys. Res., 99, 8531–8553, 1994.
Lockwood, M., McCrea, I. W., Milan, S. E., Moen, J., Cerisier,J.-C., and Thorolfsson, A.: Plasma structure within poleward-moving cusp/cleft auroral transients: EISCAT Svalbard radar ob-servations and an explanation in terms of large local time extentof events, Ann. Geophysicae, 18, 1027–1042, 2000.
Lockwood, M., Opgenoorth, H., van Eyken, A. P., et al.: Coor-dinated Cluster, ground-based instrumentation and low-altitudesatellite observations of transient poleward-moving events in theionosphere and in the tail lobe, Ann. Geophysicae, 19, 1589–1612, 2001.
794 J. A. Davies et al.: Ground-based observations of dayside transient reconnection
McWilliams, K. A., Yeoman, T. K., and Provan, G.: A statisticalsurvey of dayside pulsed ionospheric flows as seen by the CUT-LASS Finland HF radar, Ann. Geophysicae, 18, 445–453, 2000.
McWilliams, K. A., Yeoman, T. K., and Cowley, S. W. H.: Two-dimensional electric field measurements in the ionospheric foot-print of a flux transfer event, Ann. Geophysicae, 18, 1584–1598,2001.
Milan, S. E. and Lester, M.: Interhemispheric differences in the HFradar signature of the cusp region: a review through the studyof a case example, Adv. Polar Upper Atmos. Res., 15, 159–177,2001.
Milan, S. E., Yeoman, T. K., Lester, M., Thomas, E. C., and Jones,T. B.: Initial backscatter occurrence statistics from the CUT-LASS HF radars, Ann. Geophysicae, 15, 703–718, 1997.
Milan, S. E., Lester, M., Cowley, S. W. H., Moen, J., Sandholt,P. E., and Owen, C.: Meridian-scanning photometer, coherentHF radar and magnetometer observations of the cusp: a casestudy, Ann. Geophysicae, 17, 159–172, 1999.
Milan, S. E., Lester, M., Cowley, S. W. H., and Brittnacher, M.:Convection and auroral response to a southward turning of theIMF: Polar UVI, CUTLASS and IMAGE signatures of transientmagnetic flux transfer at the magnetopause, J. Geophys. Res.,105, 15 741–15 755, 2000.
Moen, J., Carlson, H. C., Milan, S. E., Shumilov, N., Lybekk, B.,Sandholt, P. E., and Lester, M.: On the collocation between day-side activity and coherent HF backscatter, Ann. Geophysicae, 18,1531–1549, 2001.
Neudegg D. A., Yeoman, T. K. Cowley, S. W. H., Provan, G.,Haerendel, G., Baumjohann, W., Auster, U., Fornacon, K.-H.,Georgescu, E., and Owen, C. J.: A flux transfer event observedat the magnetopause by the Equator-S spacecraft and in the iono-sphere by the CUTLASS HF radar, Ann. Geophysicae, 17, 707–711, 1999.
Neudegg D. A., Cowley, S. W. H., Milan, S. E., Yeoman, T. K.,Lester, M., Provan, G., Haerendel, G., Baumjohann, W., Niku-towski, B., Buchner, J., Auster, U., Fornacon, K. H., andGeorgescu, E.: A survey of magnetopause FTEs and associatedflow bursts in the ionopshere, Ann. Geophysicae, 18, 416–435,2000.
Pinnock, M., Rodger, A. S., Dudeney, J. R., Baker, K. B., Green-wald, R. A., and Greenspan, M.: Observations of an enhancedconvection channel in the cusp ionosphere, J. Geophys. Res., 98,3767–3776, 1993.
Pinnock, M., Rodger, A. S., Dudeney, J. R., Rich, F., and Baker,K. B.: High spatial and temporal resolution observations of theionospheric cusps, Ann. Geophysicae, 13, 9190–925, 1995.
Provan, G. and Yeoman, T. K.: Statistical observations of the MLT,latitude and size of pulsed ionospheric flows with the CUTLASSFinland radar, Ann. Geophysicae, 17, 855–867, 1999.
Provan, G., Yeoman, T. K., and Milan, S. E.: CUTLASS Finlandradar observations of the ionospheric signatures of flux transferevents and the resulting plasma flows, Ann. Geophysicae, 16,1411–1422, 1998.
Rijnbeek, R. P., Cowley, S. W. H., Southwood, D. J., and Russell,C. T.: A survey of dayside flux transfer events observed by theISEE-1 and -2 magnetometers, J. Geophys. Res., 89, 786–800,1984.
Rishbeth, H. and van Eyken, A. P.: EISCAT: early history and thefirst ten years of operation, J. Atmos. Terr. Phys., 55, 525–542,1993.
Rodger, A. S., Pinnock, M., Dudeney. J. R., Baker, K. B., andGreenwald, R. A.: A new mechansim for polar patch formation,J. Geophys. Res., 99, 6425–6436, 1994.
Ruohoniemi, J. M. and Baker, K. B.: Large-scale imaging of high-latitude convection with Super Dual Auroral Radar Network HFradar observations, J. Geophys. Res., 103, 20 797–20 811, 1998.
Ruohoniemi, J. M. and Greenwald, R. A.: Statistical patterns ofhigh-latitude convection obtained from the Goose Bay HF radarobservations, J. Geophys. Res., 101, 21 743–21 63, 1996.
Russell, C. T. and Elphic, R. C.: Initial ISEE magnetometer re-sults: magnetopause observations, Space Science Review, 22,681–715, 1978.
Russell, C. T. and Elphic, R. C.: ISEE observations of flux transferevents at the dayside magnetopause, Geophys. Res. Lett., 6, 33–36, 1979.
Sandholt, P. E., Moen, J., and Opsvik, D.: Periodic auroral eventsat the midday polar cap boundary; implications for solar wind-magnetosphere coupling, Geophys. Res. Lett., 19, 1223–1226,1992.
Schiffler, A., Sofko, G., Newell, P. T., and Greenwald, R.: Map-ping the outer LLBL with SuperDARN double-peaked spectra,Geophys. Res. Lett., 24, 3149–3152, 1997.
Schunk, R. W., Raitt, W. J., and Banks, P. M.: Effect of electricfields on the daytime high-latitude E- and F-regions, J. Geophys.Res., 80, 3121–3130, 1975.
Sojka, J. J., Bowline, M. D., Schunk, R. W., Decker, D. T., Val-ladares, C. E., Sheehan, R., Anderson, D. N., and Heelis, R. A.:Modelling polar cap F-region patches using time varying convec-tion, Geophys. Res. Lett., 20, 1783–1786, 1993.
St-Maurice, J.-P. and Hanson, W. B.: Ion frictional heating at highlatitudes and its possible use for an in situ determination of neu-tral thermospheric winds and temperatures, J. Geophys. Res., 87,7580–7602, 1982.
St-Maurice, J.-P. and Schunk, R. W.: Ion velocity distributions inthe high-latitude ionosphere, Rev. Geophys. Space Phys., 17, 99–134, 1979.
Svalgaard, L.: Polar cap magnetic variations and their relationshipwith the interplanetary magnetic sector structure, J. Geophys.Res., 78, 2064–2078, 1973.
Tsunoda, R. T.: High-latitude F-region irregularities: a review andsynthesis, Rev. Geophys., 26, 719–760, 1988.
van Eyken, A. P., Risbeth, H., Willis, D. M., and Cowley, S. W. H.:Initial observations of plasma convection at invariant latitudes of70–77◦, J. Atmos. Terr. Phys., 46, 635–641, 1984.
Weber, E. J., Buchau, J., Moore, J. G., Sharber, J. R., Livingston,R. C., Winningham, J. D., and Reinisch, B. W.: F-layer ioniza-tion patches in the polar cap, J. Geophys. Res., 89, 1683–1694,1984.
Wild, J. A., Cowley, S. W. H., Davies, J. A., Khan, H., Lester, M.,Milan, S. E., Provan, G., Yeoman, T. K., Balogh, A., Dunlop,M. W., Fornacon, K.-H., and Georgescu, E.: First simultaneousobservations of flux transfer events at the high-latitude magne-topause by the Cluster spacecraft and pulsed radar signatures inthe conjugate ionosphere by the CUTLASS and EISCAT radars,Ann. Geophysicae, 19, 1491–1508, 2001.
Yeoman, T. K., Lester, M., Cowley, S. W. H., Milan, S. E., Moen,J., and Sandholt, P. E.: Simultaneous observations of the cuspin optical, DMSP and HF radar data, Geophys. Res. Lett., 24,2251–2254, 1997.
Related Documents