Ground-based detection of G star superflares with NGTS Jackman, J. A. G., Wheatley, P. J., Pugh, C. E., Gänsicke, B. T., Gillen, E., Broomhall, A-M., ... West, R. G. (2018). Ground-based detection of G star superflares with NGTS. Monthly Notices of the Royal Astronomical Society, 1-12. DOI: 10.1093/mnras/sty897 Published in: Monthly Notices of the Royal Astronomical Society Document Version: Peer reviewed version Queen's University Belfast - Research Portal: Link to publication record in Queen's University Belfast Research Portal Publisher rights Copyright 2018 Oxford University Press. This work is made available online in accordance with the publisher’s policies. Please refer to any applicable terms of use of the publisher. General rights Copyright for the publications made accessible via the Queen's University Belfast Research Portal is retained by the author(s) and / or other copyright owners and it is a condition of accessing these publications that users recognise and abide by the legal requirements associated with these rights. Take down policy The Research Portal is Queen's institutional repository that provides access to Queen's research output. Every effort has been made to ensure that content in the Research Portal does not infringe any person's rights, or applicable UK laws. If you discover content in the Research Portal that you believe breaches copyright or violates any law, please contact [email protected]. Download date:13. Jul. 2018

Welcome message from author
This document is posted to help you gain knowledge. Please leave a comment to let me know what you think about it! Share it to your friends and learn new things together.
Transcript

Ground-based detection of G star superflares with NGTS
Jackman, J. A. G., Wheatley, P. J., Pugh, C. E., Gänsicke, B. T., Gillen, E., Broomhall, A-M., ... West, R. G.(2018). Ground-based detection of G star superflares with NGTS. Monthly Notices of the Royal AstronomicalSociety, 1-12. DOI: 10.1093/mnras/sty897
Published in:Monthly Notices of the Royal Astronomical Society
Document Version:Peer reviewed version
Queen's University Belfast - Research Portal:Link to publication record in Queen's University Belfast Research Portal
Publisher rightsCopyright 2018 Oxford University Press. This work is made available online in accordance with the publisher’s policies. Please refer to anyapplicable terms of use of the publisher.
General rightsCopyright for the publications made accessible via the Queen's University Belfast Research Portal is retained by the author(s) and / or othercopyright owners and it is a condition of accessing these publications that users recognise and abide by the legal requirements associatedwith these rights.
Take down policyThe Research Portal is Queen's institutional repository that provides access to Queen's research output. Every effort has been made toensure that content in the Research Portal does not infringe any person's rights, or applicable UK laws. If you discover content in theResearch Portal that you believe breaches copyright or violates any law, please contact [email protected].
Download date:13. Jul. 2018

G star superflares with NGTS 1
Ground-based detection of G star superflares with NGTS
James A. G. Jackman,1,2? Peter J. Wheatley,1,2† Chloe E. Pugh,1,2
Boris T. Gansicke,1,2 Edward Gillen,3 Anne-Marie Broomhall,1,2,4 David J. Armstrong,1,2
Matthew R. Burleigh,5 Alexander Chaushev,5 Philipp Eigmuller,6 Anders Erikson,6
Michael R. Goad,5 Andrew Grange,5 Maximilian N. Gunther,3 James S. Jenkins,7,8
James McCormac,1,2 Liam Raynard,5 Andrew P. G. Thompson,9 Stephane Udry,10
Simon Walker,1 Christopher A. Watson,9 Richard G. West1,21Dept. of Physics, University of Warwick, Gibbet Hill Road, Coventry CV4 7AL, UK2Centre for Exoplanets and Habitability, University of Warwick, Gibbet Hill Road, Coventry CV4 7AL, UK3Astrophysics Group, Cavendish Laboratory, J.J. Thomson Avenue, Cambridge CB3 0HE, UK4Institute of Advanced Studies, University of Warwick, Coventry CV4 7HS, UK5Department of Physics and Astronomy, Leicester Institute for Space and Earth Observation, University of Leicester, LE1 7RH, UK6Institute of Planetary Research, German Aerospace Center, Rutherfordstrasse 2, 12489 Berlin, Germany7Departamento de Astronomia, Universidad de Chile, Casilla 36-D, Santiago, Chile8 Centro de Astrofısica y Tecnologıas Afines (CATA), Casilla 36-D, Santiago, Chile.9Astrophysics Research Centre, School of Mathematics and Physics, Queen’s University Belfast, BT7 1NN, Belfast, UK10Observatoire Astronomique de l’Universite de Geneve, 51 Ch. des Maillettes, 1290 Versoix, Switzerland
Accepted XXX. Received YYY; in original form ZZZ
ABSTRACTWe present high cadence detections of two superflares from a bright G8 star (V = 11.56) withthe Next Generation Transit Survey (NGTS). We improve upon previous superflare detections byresolving the flare rise and peak, allowing us to fit a solar flare inspired model without the need forarbitrary break points between rise and decay. Our data also enables us to identify substructure inthe flares. From changing starspot modulation in the NGTS data we detect a stellar rotation periodof 59 hours, along with evidence for differential rotation. We combine this rotation period with theobserved ROSAT X-ray flux to determine that the star’s X-ray activity is saturated. We calculatethe flare bolometric energies as 5.4+0.8
−0.7 × 1034and 2.6+0.4−0.3 × 1034erg and compare our detections with
G star superflares detected in the Kepler survey. We find our main flare to be one of the largestamplitude superflares detected from a bright G star. With energies more than 100 times greaterthan the Carrington event, our flare detections demonstrate the role that ground-based instrumentssuch as NGTS can have in assessing the habitability of Earth-like exoplanets, particularly in the eraof PLATO.
Key words: stars: activity – stars: flare – stars: individual: NGTS J030834.9-211322– stars: rotation
1 INTRODUCTION
Stellar flares are explosive phenomena caused by reconnec-tion events in a star’s magnetic field (e.g. Benz & Gudel2010). When previously observed from the ground, they havebeen synonymous with active M stars, which flare regularlyand brightly compared to their quiescent flux. Yet it is wellknown that the Sun shows regular flaring behaviour, withflares being detected over a wide range of energies. These
? E-mail: [email protected]† E-mail: [email protected]
range from 1023 erg for “nanoflares” (Parnell & Jupp 2000)up to approximately 1032 erg for the largest occurrences suchas the Carrington event (Carrington 1859; Hodgson 1859;Tsurutani et al. 2003). Observations of solar type stars,mainly with Kepler, have shown that much more energetic“superflares” of bolometric energies 1033 to 1036 erg are alsopossible (e.g. Shibayama et al. 2013).
The discovery of Earth sized exoplanets in the hab-itable zones of their host stars (e.g. TRAPPIST-1 andProxima Centauri: Gillon et al. 2017; Anglada-Escude et al.2016) has given renewed importance to these superflares,in particular their effects on exoplanet habitability (e.g.
Downloaded from https://academic.oup.com/mnras/advance-article-abstract/doi/10.1093/mnras/sty897/4967002by Library,Queen's University,Belfast useron 11 April 2018

2 J. A. G. Jackman et al.
Lingam & Loeb 2017). Previous studies have found that theincrease in UV radiation associated with flares can resultin ozone depletion (Segura et al. 2010), changes to atmo-spheric composition (Venot et al. 2016) and even biologicaldamage (e.g. Estrela & Valio 2017). These effects are rela-tively well studied for M dwarf hosts, however it is expectedthat in future PLATO (Rauer et al. 2014) will reveal habit-able zone planets around K and G stars. Compared to flaresfrom later-type counterparts, detections of superflares fromG stars are relatively rare. To date, no G star superflareshave been detected with a CCD detector from the ground,although several have been seen either visually, in photogra-phy or with vidicon detectors (Schaefer 1989; Schaefer et al.2000).
In recent years, observations with the Kepler satellite(Borucki et al. 2010) have captured greater numbers of su-perflare events from G-type stars. These have been fromboth the long (30 minutes) and short (1 minute) cadencemodes. In the long cadence mode, Maehara et al. (2012)and Shibayama et al. (2013) found 365 and 1547 superflaresfrom 148 and 279 G-type stars respectively. In the 1-minuteshort cadence mode, 187 superflares from 23 solar-type starswere found by Maehara et al. (2015). From these detections,the statistical properties of superflares on G-type stars wereconsidered, with Maehara et al. (2012) and Shibayama et al.(2013) finding a power law distribution of occurrence rateagainst energy of superflares that is comparable to solarflares, and with Maehara et al. (2015) identifying a corre-lation between the e-folding flare duration (time from flareamplitude peak to 1/e of its initial value) and the bolometricflare energy.
Candelaresi et al. (2014) also studied the occurrencerate of superflares from G dwarfs, as well as K and M dwarfs.They found the occurrence rate of superflares decreased withstellar effective temperature, and also peaked at a Rossbynumber of 0.1 (where Rossby number is the ratio of rotationperiod and convective turnover time). A Rossby number of0.1 also corresponds to the rotation rate at which the X-rayemission of active stars saturates at 0.1 percent of the bolo-metric luminosity (e.g Pizzolato et al. 2003; Wright et al.2011).
Previous studies have shown there may be a possiblemaximum limit on the energy that can be output by aG star superflare. Wu et al. (2015) identified a saturationvalue of around 2 × 1037 erg, using stars in the sample ofMaehara et al. (2012) that displayed periodic modulation.Similar saturation behaviour was detected by Davenport(2016) from their sample of 4041 flaring stars, for examplefrom the flaring G dwarf KIC 11551430. Davenport (2016)also found evidence for a weak correlation between flare lu-minosity and rotation period.
While these detections have shown the statistical prop-erties of these white light flares, their temporal morphologyand its link to solar flare morphology has not been investi-gated. This is due to undersampling of the flare rise and peakfrom previous stellar flare surveys (mainly Kepler), particu-larly for shorter duration events. High cadence (< 1 minute)data are required in order to compare observed solar flaresand stellar superflares.
In this paper we present the first ground based CCD de-tections of superflares from a G type star. These are some ofthe most well resolved superflares to date, with a higher ca-
Property Value Reference
RANGTS 03:08:34.9DecNGTS -21:13:22
RANGTS (Deg) 47.14557
DecNGTS (Deg) -21.22284W4 8.773 4
W3 9.699 4
W2 9.731 4W1 9.699 4
Ks 9.768 1
H 9.865 1J 10.216 1
i′ 11.174 3
r ′ 11.356 3g′ 11.899 3
Gaia G 11.354 2V 11.562 3
B 12.291 3
NUV 16.943 5FUV 20.666 5
ROSAT X-ray Count Rate (ct/s) 0.042 6
µRA −1.2 ± 1.1 7µDEC −6.2 ± 1.1 7
Table 1. Properties of NGTS J0308-2113. Coordinates are givenin the J2000 system. References are as follows, 1. Skrutskie et al.
(2006), 2. Gaia Collaboration et al. (2016), 3. Henden & Munari
(2014), 4.Cutri & et al. (2014), 5. Martin et al. (2005), 6.Boller et al. (2016) , 7. Zacharias et al. (2017) NUV , FUV , i′,
r ′, g’ are AB magnitudes. Proper motions are in mas/yr.
dence than all Kepler measurements and most ground basedobservations. We present our measurements of the stellarand flare parameters and make comparisons with previouslydetected G star flares. We also present our modelling of eachflare using a solar inspired general flare model.
2 OBSERVATIONS
The data presented in this paper were collected with theNext Generation Transit Survey (NGTS; Wheatley et al.2017) over 80 nights between 2015 November 4th and 2016February 25th. The two flares in this paper were detectedon the nights of the 2015 December 17th and 2016 January3rd. NGTS is a ground based transiting exoplanet survey,operating at Paranal. It has 12, 20 cm f/2.8, optical tele-scopes, each with a 520-890nm bandpass and exposure timesof 10 seconds. Each single camera has a field of view of '8 deg2. NGTS is designed to monitor bright (I≤16) K andM stars in the search for exoplanet transits (Wheatley et al.2017). Unlike Kepler, NGTS observes without a set targetlist, meaning that all stars in our field of view that are brightenough can be studied. Each NGTS field is observed inten-sively whenever visible, and 3–4 fields are observed per tele-scope each year. With a total instantaneous field of view of96 deg2, and 10 s exposures, it is evident that NGTS is wellsuited to measure flare statistical distributions along withtemporal morphology.
Downloaded from https://academic.oup.com/mnras/advance-article-abstract/doi/10.1093/mnras/sty897/4967002by Library,Queen's University,Belfast useron 11 April 2018
G star superflares with NGTS 3
0.02
0.00
0.02
0.04
0.06
0.08
Fra
ctio
nal
Flu
x
0.03 0.00 0.03 0.060.02
0.00
0.02
0.04
0.06
0.08
0.2 0.0 0.2 0.4 0.6 0.8 1.0 1.2
Time Since Flare Start (Hours)
0.030.020.010.000.010.020.03
Resi
du
als
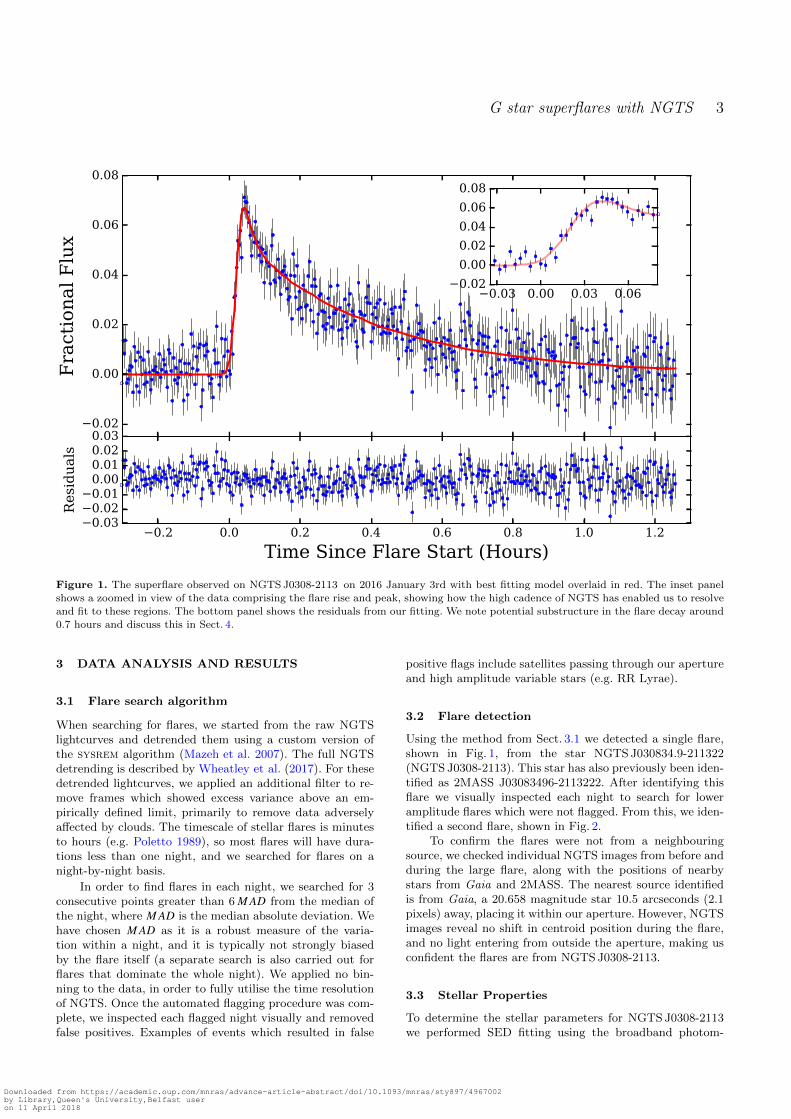
Figure 1. The superflare observed on NGTS J0308-2113 on 2016 January 3rd with best fitting model overlaid in red. The inset panelshows a zoomed in view of the data comprising the flare rise and peak, showing how the high cadence of NGTS has enabled us to resolve
and fit to these regions. The bottom panel shows the residuals from our fitting. We note potential substructure in the flare decay around
0.7 hours and discuss this in Sect. 4.
3 DATA ANALYSIS AND RESULTS
3.1 Flare search algorithm
When searching for flares, we started from the raw NGTSlightcurves and detrended them using a custom version ofthe sysrem algorithm (Mazeh et al. 2007). The full NGTSdetrending is described by Wheatley et al. (2017). For thesedetrended lightcurves, we applied an additional filter to re-move frames which showed excess variance above an em-pirically defined limit, primarily to remove data adverselyaffected by clouds. The timescale of stellar flares is minutesto hours (e.g. Poletto 1989), so most flares will have dura-tions less than one night, and we searched for flares on anight-by-night basis.
In order to find flares in each night, we searched for 3consecutive points greater than 6 M AD from the median ofthe night, where M AD is the median absolute deviation. Wehave chosen M AD as it is a robust measure of the varia-tion within a night, and it is typically not strongly biasedby the flare itself (a separate search is also carried out forflares that dominate the whole night). We applied no bin-ning to the data, in order to fully utilise the time resolutionof NGTS. Once the automated flagging procedure was com-plete, we inspected each flagged night visually and removedfalse positives. Examples of events which resulted in false
positive flags include satellites passing through our apertureand high amplitude variable stars (e.g. RR Lyrae).
3.2 Flare detection
Using the method from Sect. 3.1 we detected a single flare,shown in Fig. 1, from the star NGTS J030834.9-211322(NGTS J0308-2113). This star has also previously been iden-tified as 2MASS J03083496-2113222. After identifying thisflare we visually inspected each night to search for loweramplitude flares which were not flagged. From this, we iden-tified a second flare, shown in Fig. 2.
To confirm the flares were not from a neighbouringsource, we checked individual NGTS images from before andduring the large flare, along with the positions of nearbystars from Gaia and 2MASS. The nearest source identifiedis from Gaia, a 20.658 magnitude star 10.5 arcseconds (2.1pixels) away, placing it within our aperture. However, NGTSimages reveal no shift in centroid position during the flare,and no light entering from outside the aperture, making usconfident the flares are from NGTS J0308-2113.
3.3 Stellar Properties
To determine the stellar parameters for NGTS J0308-2113we performed SED fitting using the broadband photom-
Downloaded from https://academic.oup.com/mnras/advance-article-abstract/doi/10.1093/mnras/sty897/4967002by Library,Queen's University,Belfast useron 11 April 2018
4 J. A. G. Jackman et al.
etry listed in Tab. 1. These photometric values were ob-tained as part of the standard NGTS cross-matchingpipeline (Wheatley et al. 2017). We use the SED mod-elling method described in Gillen et al. (2017), with the BT-SETTL and PHOENIX v2 model atmospheres. The SED fitis shown in Fig. 3. We see no IR-excess that might indi-cate NGTS J0308-2113 is a pre-main sequence star. Fromthe SED fit we determine the effective temperature Teff =
5458 +108−85 K. We then use the information presented in Ta-
ble 5 of Pecaut & Mamajek (2013) to identify the spectraltype as G8. As a check on the spectral type we can also usethe stellar colours with Tables 3 and 4 of Covey et al. (2007),which confirm the G8 spectral type. To determine the stel-lar radius, we assume the star is main sequence and usethe empirical radius-temperature relation from equation 8of Boyajian et al. (2012, 2017), determined from mass-radiuscalculations for 33 stars of spectral type between G5V andM5.5V. We calculate our stellar radius as 0.81 ± 0.04 R�.To estimate the uncertainty on the radius we use the me-dian absolute deviation of 0.031 R� from the Boyajian et al.(2012) fit and combine it with the upper error for our stellartemperature.
To check this source was not a giant star we com-pared the reduced proper motion, HJ against J − H colour(e.g. Gould & Morgan 2003). Using the proper motion val-ues from Tab. 1, we calculate HJ= -0.78 and J − H=0.35. We use the criteria for dwarf/giant classification fromCollier Cameron et al. (2007) to rule out the possibility thisstar is a giant.
We also note that this star was detected in X-rays withROSAT. The detection of X-rays from this source is a signof an active stellar corona (Boller et al. 2016).
3.4 Stellar Rotation
The NGTS lightcurve of NGTS J0308-2113 shows periodicflux variations, which we attribute to starspots movingacross the visible disc of the star. We use this behaviourto determine the rotation period of the star, using a Lomb-Scargle periodgram. To do this, we use the astropy packageLombScargle (Astropy Collaboration et al. 2013) and testfor 20000 periods spaced between 13 seconds and 80 days.We mask the flares from our lightcurve when performingthis analysis. Our periodogram for the whole time series ofNGTS J0308-2113 is shown in Fig. 4, from which the periodof the main peak is 59.09±0.01 hours (0.41 d−1). We calcu-late the uncertainty on this period by fitting a sine wave tothe data. Using the analysis from Baluev (2008) we deter-mine the false alarm probability (FAP) of this peak to benegligible, a result of the high amount of data. We also notea second peak at 40 hours, which we found to be an aliasby performing an identical Lomb Scargle analysis on a sinewave of period 59 hours with the same time sampling as ourlightcurve.
This short spin period implies that NGTS J0308-2113must be a relatively young star, most likely less than ∼600Myr old, through comparing to the observed spin-age re-lations of open clusters (e.g. Sadeghi Ardestani et al. 2017;Douglas et al. 2017; Stauffer et al. 2016).
The amplitude of the observed spin modulation evolveswith time. We split the lightcurve into three regions ofactivity, corresponding to an initial active portion, a sec-
0.02
0.01
0.00
0.01
0.02
Fra
ctio
nal
Flu
x0.0 0.5 1.0 1.5 2.0
Time Since Flare Start (Hours)
0.020.010.000.01
Resi
du
als
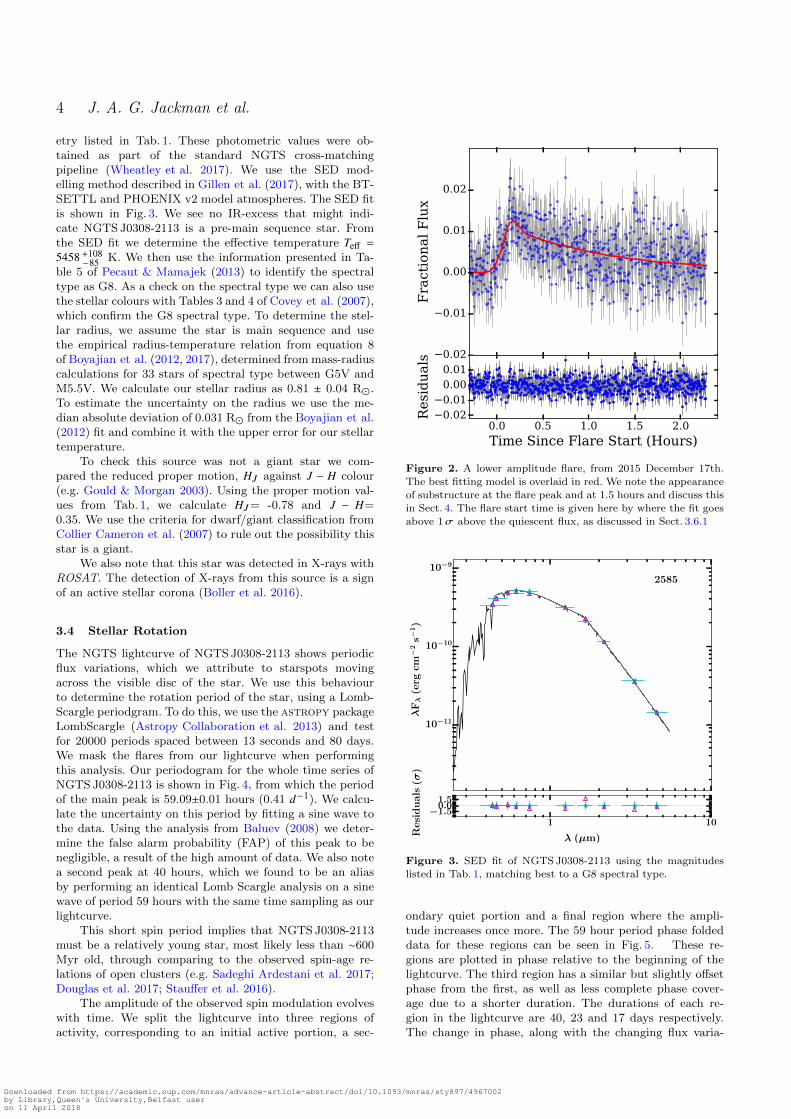
Figure 2. A lower amplitude flare, from 2015 December 17th.The best fitting model is overlaid in red. We note the appearance
of substructure at the flare peak and at 1.5 hours and discuss this
in Sect. 4. The flare start time is given here by where the fit goesabove 1σ above the quiescent flux, as discussed in Sect. 3.6.1
10−11
10−10
10−9
2585
1 10
λ (µm)
−1.50.01.5
λFλ
(erg
cm−
2s−
1)
Resi
du
als
(σ)
Figure 3. SED fit of NGTS J0308-2113 using the magnitudes
listed in Tab. 1, matching best to a G8 spectral type.
ondary quiet portion and a final region where the ampli-tude increases once more. The 59 hour period phase foldeddata for these regions can be seen in Fig. 5. These re-gions are plotted in phase relative to the beginning of thelightcurve. The third region has a similar but slightly offsetphase from the first, as well as less complete phase cover-age due to a shorter duration. The durations of each re-gion in the lightcurve are 40, 23 and 17 days respectively.The change in phase, along with the changing flux varia-
Downloaded from https://academic.oup.com/mnras/advance-article-abstract/doi/10.1093/mnras/sty897/4967002by Library,Queen's University,Belfast useron 11 April 2018

G star superflares with NGTS 5
0.0 0.5 1.0 1.5 2.0Frequency (1/day)
0.0
0.1
0.2
0.3
0.4
0.5
0.6
Pow
er
Figure 4. Lomb-Scargle periodogram for our full lightcurve. Here
we show frequencies between 0 and 2 day−1. Note the 1 day aliasof the peak groups. The largest peak corresponds to our detected
59 hour period.
Figure 5. Phase folded data for the three regions of flux variation.
Top is the initial active portion, middle is the quiet region andbottom is the following increase in activity. Overlaid in red is the
sinusoidal fit for a 59 hour period. The black lines indicate thelocation of the small flare (top section) and the large flare (middlesection).
tion, can be explained by the decay of the original set ofstar spots and the formation of new ones. Starspot lifetimeshave been studied by Bradshaw & Hartigan (2014) and formain sequence stars are on month timescales. One example isCoRoT-2, which has a starspot evolution timescale of 31±15days (Silva-Valio & Lanza 2011). Consequently we attributeour changing lightcurve modulation to starspot evolution.
We also searched for periodic signals separately in thethree light curve regions. The three Lomb-Scargle peri-odograms are presented in Fig. 6. In the second, quiet, periodof the light curve we see no evidence for periodic modulation.Calculating the modulation period of the third region givesa significantly longer rotation period of 60.87±0.04 hours(0.39 d−1). This offset period suggests that the star exhibits
0.00.10.20.30.40.50.60.70.8
Pow
er
0.00.10.20.30.40.50.60.70.8
Pow
er
0.0 0.5 1.0 1.5 2.0Frequency (1/day)
0.00.10.20.30.40.50.60.70.8
Pow
er
Figure 6. Lomb-Scargle periodograms for each section shown in
Fig. 5. Note the lack of a period detection in the quiescent region.
differential rotation and that the new set of starspots areformed at a different latitude to the original active region.
We also check where each flare occurs in phase, to searchfor any relation to the location of the active region. Thesmaller flare occurs towards the end of the first region, closeto maximum optical brightness, while the larger flare occursin the second, quiet region at similar rotation phase (seeFig. 5). For the smaller flare, this is opposite in phase to thedominant active region. Neither flare seems to be located ata rotation phase where a large star spot group is obviouslyvisible, and we discuss this further in Sect. 4.
3.5 X-ray Activity
As noted in Sect. 3.3, NGTS J0308-2113 has been detectedin X-rays with ROSAT. The detection was made duringthe ROSAT all sky survey, and we adopt count ratesand hardness ratios from the 2RXS catalog (Boller et al.2016). The ROSAT PSPC count rate was 0.042 ± 0.018 s−1
and the hardness ratios in the standard ROSAT bandswere HR1=1.000 ± 0.325 and HR2=−0.428 ± 0.243. The HR1value indicates that the source was detected only in theROSAT hard X-ray band (0.5–2.0 keV) and not in the softband (0.1–0.4 keV).
The ROSAT PSPC count rate of NGTS J0308-2113corresponds to a 0.1–2.4 keV energy flux of 5.7 ×10⁻¹³ erg s−1cm−2, using energy flux conversion factors de-termined for coronal sources by Fleming et al. (1995). Thisflux conversion uses the HR1 hardness ratio to account ofthe characteristic temperature of corona, and it has beenapplied to large samples of stars from the ROSAT all skysurvey by Schmitt et al. (1995) and Huensch et al. (1998).
This X-ray flux corresponds to a 0.1–2.4 keV X-ray lu-minosity of LX = 1.7 × 1030 erg s−1 assuming a distance toNGTS J0308-2113 of 156 pc that we estimate using the ap-parent V magnitude and the expected absolute V magnitudefor a G8V star (Gray & Corbally 2009). Using the values forTeff and R∗ from Sect. 3.3 we find the bolometric luminos-ity of the star to be LBol = 1.8 × 1033 erg s−1 and hencelog LX /LBol = −3.1, which corresponds to saturated X-rayemission (Pizzolato et al. 2003; Wright et al. 2011).
Downloaded from https://academic.oup.com/mnras/advance-article-abstract/doi/10.1093/mnras/sty897/4967002by Library,Queen's University,Belfast useron 11 April 2018

6 J. A. G. Jackman et al.
Combining this X-ray luminosity with our measure-ment of the stellar rotation period (Sect. 3.4), we canplace NGTS J0308-2113 on the rotation-activity relationof Wright et al. (2011). This is shown in Fig. 7 whereNGTS J0308-2113 can be seen to reside close to the breakpoint between saturated X-ray emission and the power lawdecrease in activity to slower rotation. The Rossby numberof 0.18 was calculated using our rotation period and the rela-tion for convective turnover time from Wright et al. (2011).
Using the relation between the X-ray surface fluxand average coronal temperature from Johnstone & Gudel(2015) we estimate an average coronal temperature of10 MK. This is similar to the coronal temperature of 7.5 MKpredicted from the rotation period using the relation byTelleschi et al. (2005).
The lack of detection of NGTS J0308-2113 in theROSAT soft band, as well as its relatively large distance,suggests that it may be subject to stronger interstellar ab-sorption than the sample of stars used to determine theflux conversion factors of Fleming et al. (1995). We there-fore double checked our flux estimation using webpimms.1
We assumed a characteristic coronal temperature of 7.5 MKand an interstellar column density equal to the total Galac-tic columnn the direction of NGTS J0308-2113, which isNH = 2×1020 cm−2 (Dickey & Lockman 1990; Kalberla et al.2005). The measured ROSAT PSPC count rate then corre-sponds to an unabsorbed 0.1–2.4 keV energy flux of 4.9 ×10⁻¹³ erg cm−2 s−1, which is within 20 percent of our cal-culation using the flux conversion factors of Fleming et al.(1995).
3.6 Flare Modelling
We model our flares following a similar method toGryciuk et al. (2017), who fitted solar flares in soft X-rays.For both flares, we use the convolution of a Gaussian witha double exponential. A Gaussian is used to account for theheating in the flare rise, which has been found to be appro-priate for solar flares (e.g. Aschwanden et al. 1998). A dou-ble exponential is used for the decay, accounting for thermaland non-thermal cooling processes, which has been used pre-viously for the decay of stellar flares (e.g. Davenport et al.2014). A convolution of these Gaussian and exponentialfunctions is then analogous to the heating and cooling pro-cesses occurring during the flare (Gryciuk et al. 2017). Withthis physically motivated model we can utilise the high ca-dence of NGTS, in particular the flare rise which in the pasthas been fit using a polynomial or disregarded due to a lackof data points (e.g. Davenport et al. 2014; Pugh et al. 2016).
Before performing fitting, we inspected the fulllightcurve and noted that several nights exhibited behaviourconsistent with atmospheric extinction. We identified thistrend by using the full lightcurve to fit for a first order at-mospheric extinction term. This trend was then removedfrom the lightcurve, including the nights showing our flares.The nights before and after each flare were used to check thequality of this fit and were found to have the atmosphericextinction successfully removed. We also account for the flux
1 https://heasarc.gsfc.nasa.gov/cgi-bin/Tools/w3pimms/w3pimms.pl
Property Large Small
Energy (erg) 5.4+0.8−0.7 × 1034 2.6+0.4
−0.3 × 1034
Fit Amplitude (per cent) 6.9 1.2
Full Duration (min) 55 N/Ae-folding duration (min) 16 55.5
Scale time (min) 11 42
Flare rise (min) 2.5 >7.4
Table 2. Properties of each superflare detected from
NGTS J0308-2113.
modulation effects from starspots. To do this we use the pre-ceding two and subsequent two nights and fit a sinusoid atthe calculated 59 hour stellar rotation period. With this si-nusoid we are able to remove any gradient due to rotationfrom the night. This is required most for the smaller flare,which sits in the first, more active region of the lightcurve(Sect. 3.4).
For both flares we perform fitting using anMCMC analysis with the python package emcee(Foreman-Mackey et al. 2013), using 500 walkers for2000 steps and discarding the first 500 as a burn-in. Duringmodelling we have increased our error bars to accountfor scintillation using the modified Young’s approximationwith the empirical coefficient for Paranal (Young 1967;Osborn et al. 2015). The best fitting models for the twoflares are overlaid on Figs. 1 & 2. The best fitting parameterspresented in Tab. 2.
3.6.1 Flare Amplitude and Duration
To determine the amplitude of each flare we use the maxi-mum value of our fit. For the larger flare this gives a frac-tional amplitude of 6.9 per cent. For the smaller flare, usingthe value from the fit gives a fractional amplitude of 1.2 percent. Inspecting Fig. 2, there appears to be impulsive sub-structure at the flare peak, which is not accounted for in ourmodel. Taking the average of the five data points around thepeak gives an peak amplitude of 2.0±0.3 per cent.
To obtain a measure of the full duration of the flare, weagain make use of our fit. We define the start and end of theflare as the points where the model rises and then falls morethan 1σ above the background flux level, as in Gryciuk et al.(2017). Here σ is determined from the quiescent flux beforethe flare. From this, we determine the flare duration of thelarger flare to be 55 minutes. Due to the decreased amplitudeto error ratio of the smaller flare, we do not calculate the fullflare duration using this method. However, we also calculatethe flare duration with two additional methods - using itse-folding timescale (as performed in Shibayama et al. 2013)and its scale time (the duration where the flare is above halfthe maximum flux value). Again, we use our fit for these. Forthe large and small flare, we calculate the e-folding timescaleas 16 and 55.5 minutes respectively, and the scale time as 11and 42 minutes respectively. With our fit we can also calcu-late the timescale of the flare rise, using the time from theflare start to the peak of the model. Using this, we calculatethe flare rise time as 2.5 minutes for the larger flare. If weuse the 1σ start limit for the smaller flare, we estimate theflare rise as at least 7.4 minutes.
Downloaded from https://academic.oup.com/mnras/advance-article-abstract/doi/10.1093/mnras/sty897/4967002by Library,Queen's University,Belfast useron 11 April 2018

G star superflares with NGTS 7
10-1 100 101 102
Rotation Period (Days)
8
7
6
5
4
3
2
Log
Lx/L
bol
10-3 10-2 10-1 100 101
Ro
8
7
6
5
4
3
2
Log
Lx/L
bol
Figure 7. Left: Stellar X-ray to bolometric luminosity ratio vs rotation period for NGTS J0308-2113 with the data from Wright et al.
(2011). Right: Same, but for Rossby number. We have also overlaid the power law fit from Wright et al. (2011), with β=-2.18.
NGTS J0308-2113 is shown here with a red star.
3.7 Flare Energy
The method used to calculate the flare energy is based onthat described by Shibayama et al. (2013), and makes theassumption that the flare and star act as blackbody radia-tors, with the flare having a blackbody spectrum of temper-ature 9000 ± 500 K in order to estimate the flare luminos-ity. Using the stellar effective temperature and radius fromSect. 3.3, we calculate the bolometric energy of the largerand smaller flare to be 5.4+0.8
−0.7 × 1034 erg and 2.6+0.4−0.3 × 1034
erg respectively. It is striking that the smaller flare is only afactor two less energetic despite having an amplitude aroundsix times lower. Comparing to the Carrington event energyof ≈ 1032 ergs (Tsurutani et al. 2003), we can see that eachflare had a bolometric energy several hundred times greaterthan this.
From a total of 422 hours of observation for this star,we have detected two flares. We can use this measurementto estimate the flaring rate for flares above 2.6+0.4
−0.3 × 1034
erg as approximately 40 per year.
4 DISCUSSION
4.1 Flare Properties
We have detected two superflares from the G starNGTS J0308-2113 with high-cadence NGTS optical photom-etry. These are the first ground-based CCD detections of su-perflares from a G star. Our NGTS observations have muchhigher cadence than the Kepler flare detections, allowing usto resolve the flare rise and substructure.
The larger flare is shown in Fig. 1 and was calculatedto have a bolometric energy of 5.4+0.8
−0.7 × 1034erg and a frac-tional amplitude of 6.9 per cent. Due to the increased time
resolution of our measurements compared to almost all pre-vious superflare detections, we have been able to fit this flarewith a physically-motivated model that includes a Gaus-sian pulse to describe the impulsive flare rise (as employedpreviously for solar flares). For the decay, our data requiretwo exponential components. Separate impulsive and grad-ual decay components been seen previously in some stel-lar flares, and attributed to decay of blackbody-like emis-sion and chromospheric emission respectively (Hawley et al.2014; Kowalski et al. 2013). We can also see that this flaredisplays a flattening around the peak, or a “roll-over”. Sim-ilar flare peak behaviour has been seen by Kowalski et al.(2011) from ULTRACAM observations of the dM3.5e starEQ Peg A. This behaviour is captured in the fitted modelas a result of the observed combination of Gaussian heatingand exponential cooling. Further, we can identify smallerpeaks in the decay of the flare, located at approximately0.7 and 1.0 hour after the flare start in Fig. 1. Structure,or “bumps”, such as this have been previously identified inflare decays with Kepler (e.g Balona et al. 2015).
Our model has also been used to fit the smaller flareof NGTS J0308-2113, shown in Fig. 2. This flare has a muchlower relative amplitude of just 1.2 per cent, making it thelowest-amplitude G star flare to have been detected fromthe ground. Despite its low amplitude, this smaller flare hasa much slower rise and longer duration than the larger flare(by factors of 3–4) so that it has a high total energy of2.6+0.4−0.3 × 1034erg, which is only a factor 2 lower than the
larger flare. When fitting this smaller flare it became ap-parent that there was additional structure at the flare peak.This can be seen in the residuals of Fig. 2, as a small spikelasting approximately one minute. This is a sign of an ad-ditional heating pulse at the end of the initial flare rise. Inthis flare we also detect subtructure around 1.5 hours after
Downloaded from https://academic.oup.com/mnras/advance-article-abstract/doi/10.1093/mnras/sty897/4967002by Library,Queen's University,Belfast useron 11 April 2018
8 J. A. G. Jackman et al.
the flare start (visible in the residuals). The amplitude ofthe peak at this time is approximately 1 per cent, whichis comparable with the amplitude of the main flare. Con-sidering the timing of this substructure relative to the mainflare peak, it is likely an example of sympathetic flaring (e.g.Moon et al. 2002).
One advantage of our flare model, combining a Gaus-sian heating pulse with exponential cooling, is that it avoidsan arbitary discontinuity between the end of the rise andthe beginning of the decay. This has generally not been thecase with previous stellar flare models, which have tendedto include an instantaneous transition between functionsdescribing the rise and decay (e.g. Davenport et al. 2014).Our model also provides a well-defined measure of the risetimescale, allowing for studies of how the flare rise timechanges between flares. In this case we see the lower am-plitude flare rising much more slowly than the high ampli-tude example. This highlights how wide-field high-cadencesurveys such as NGTS can contribute to the quantitativecharacterisation of stellar flares.
4.2 Starspots and Flare Phases
Our analysis of the NGTS light curve of NGTS J0308-2113revealed a 59.09±0.01 h periodic modulation that we inter-pret the changing visibility of starspots on the stellar rota-tion period (Sect. 3.4). The initial set of starspots appear todecay during the observations, and no spin modulation isdetected for an interval of around 23 d. Periodic modulationbegins again towards the end of the NGTS observations, andat a slightly longer period, suggesting that the star exhibitsdifferential rotation and that new starspots have emerged ata different latitude.
Checking where the flares occur in rotation phase re-veals that the smallest flare occurs in antiphase to thedominant starspot group, while the larger flare occurs dur-ing the quiescent interval of the lightcurve (at a similarspin phase to the first flare). These flare timings are per-haps surprising, as we might expect to see superflares whenlarge active regions are present and visible. Instead, our re-sults suggest that the observed superflares do not emergefrom the dominant active regions on the stellar surface.Such behaviour is not unprecedented, as observations ofthe M dwarfs AD Leo and GJ 1243 showed no correla-tion between stellar flare occurrence and rotational phase(Hunt-Walker et al. 2012; Hawley et al. 2014). A similar re-sult was found for the K dwarf KIC 5110407, with all but thetwo strongest flares showing no correlation with the mostactive regions (Roettenbacher et al. 2013). In these cases itwas suggested that the dominant active region might be lo-cated at the pole, such that it is always in view and flarescan be seen at any spin phase. An alternative is that themajority of flares originate from smaller spot groups thatdo not cause the dominant flux modulation.
4.3 Comparison with Kepler
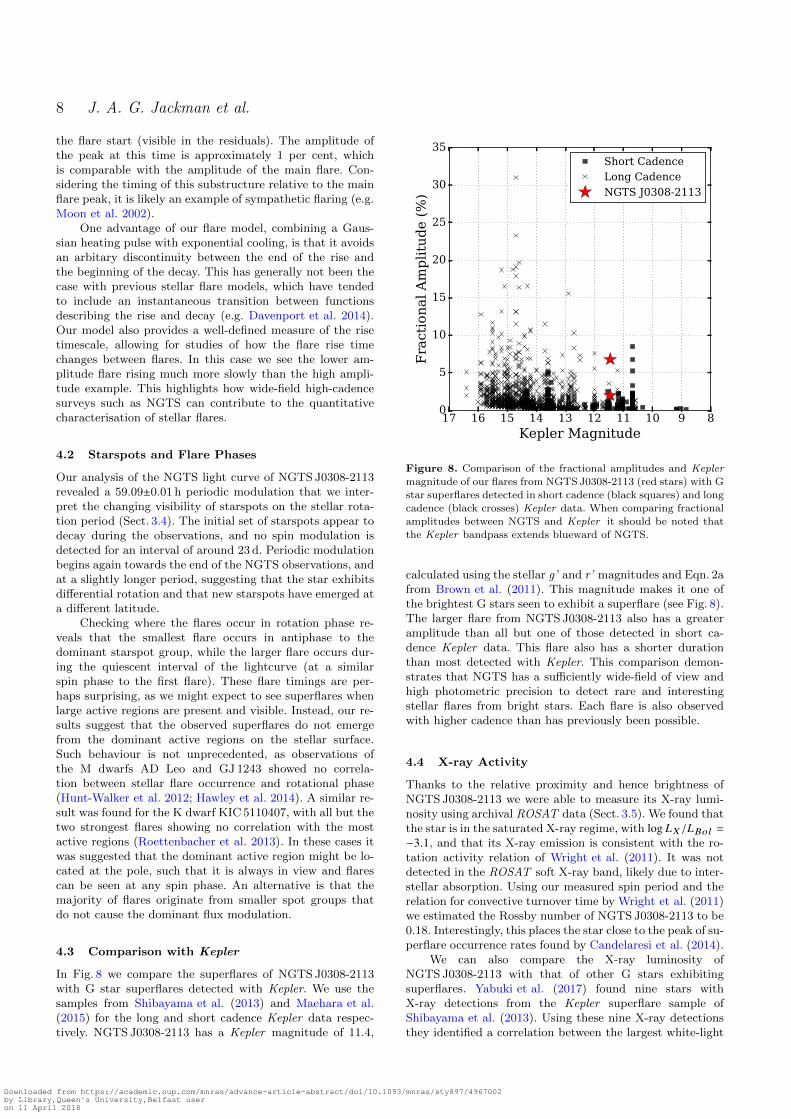
In Fig. 8 we compare the superflares of NGTS J0308-2113with G star superflares detected with Kepler. We use thesamples from Shibayama et al. (2013) and Maehara et al.(2015) for the long and short cadence Kepler data respec-tively. NGTS J0308-2113 has a Kepler magnitude of 11.4,
891011121314151617Kepler Magnitude
0
5
10
15
20
25
30
35
Fra
ctio
nal
Am
pli
tud
e (
%)
Short CadenceLong CadenceNGTS J0308-2113
Figure 8. Comparison of the fractional amplitudes and Keplermagnitude of our flares from NGTS J0308-2113 (red stars) with G
star superflares detected in short cadence (black squares) and long
cadence (black crosses) Kepler data. When comparing fractionalamplitudes between NGTS and Kepler it should be noted that
the Kepler bandpass extends blueward of NGTS.
calculated using the stellar g’ and r’ magnitudes and Eqn. 2afrom Brown et al. (2011). This magnitude makes it one ofthe brightest G stars seen to exhibit a superflare (see Fig. 8).The larger flare from NGTS J0308-2113 also has a greateramplitude than all but one of those detected in short ca-dence Kepler data. This flare also has a shorter durationthan most detected with Kepler. This comparison demon-strates that NGTS has a sufficiently wide-field of view andhigh photometric precision to detect rare and interestingstellar flares from bright stars. Each flare is also observedwith higher cadence than has previously been possible.
4.4 X-ray Activity
Thanks to the relative proximity and hence brightness ofNGTS J0308-2113 we were able to measure its X-ray lumi-nosity using archival ROSAT data (Sect. 3.5). We found thatthe star is in the saturated X-ray regime, with log LX /LBol =
−3.1, and that its X-ray emission is consistent with the ro-tation activity relation of Wright et al. (2011). It was notdetected in the ROSAT soft X-ray band, likely due to inter-stellar absorption. Using our measured spin period and therelation for convective turnover time by Wright et al. (2011)we estimated the Rossby number of NGTS J0308-2113 to be0.18. Interestingly, this places the star close to the peak of su-perflare occurrence rates found by Candelaresi et al. (2014).
We can also compare the X-ray luminosity ofNGTS J0308-2113 with that of other G stars exhibitingsuperflares. Yabuki et al. (2017) found nine stars withX-ray detections from the Kepler superflare sample ofShibayama et al. (2013). Using these nine X-ray detectionsthey identified a correlation between the largest white-light
Downloaded from https://academic.oup.com/mnras/advance-article-abstract/doi/10.1093/mnras/sty897/4967002by Library,Queen's University,Belfast useron 11 April 2018

G star superflares with NGTS 9
flare energies (estimated from Kepler data) and quiescentLX with
EBol ∝ L1.2±0.3
0.4X
. (1)
Based on this relation, we would expect NGTS J0308-2113to exhibit flares of energies up to approximately 8× 1035 erg.This is around 13 times greater than the energy of our largerflare, suggesting NGTS J0308-2113 sometimes exhibits evenmore energetic flares than the examples we have detectedwith NGTS.
4.4.1 Maximum Flare Energy
An alternative method to estimate the potential maximumflare energy is to use the starspot activity. This is done usingequation (1) from Shibata et al. (2013),
E f lare ≈ 7 × 1032(erg)( f
0.1
) ( B103G
)2 ( Aspot
3 × 1019cm2
)3/2(2)
where f , B and Aspot are the fraction of magnetic en-ergy that can be released as flare energy and the mag-netic field strength and area of the starspot respectively.We estimate the starspot area from the lightcurve modu-lation normalised by the average brightness, following themethod of Notsu et al. (2013). We use the region of great-est brightness variation to estimate the area, obtaining avalue equivalent to 0.04 of the visible stellar surface. We as-sume f =0.1 (Aschwanden et al. 2014) and B=1000 - 3000G(typical comparison values for solar-type stars e.g. Solanki2003; Maehara et al. 2015) and calculate E f lare = 0.9−8.5×1035erg. This estimated value is the same order of magnitudeas that calculated from the X-ray data, predicting a flare ofgreater energy than our largest event.
4.5 Implications For Exoplanet Habitability
Understanding the properties of superflares from G starsis important when considering the habitability of Earth-like exoplanets, including those expected to be detectedwith PLATO (Rauer et al. 2014). Stellar flares are knownto be associated with intense ultraviolet radiation (e.g.Stelzer et al. 2006; Tsang et al. 2012), which can re-duce levels of atmospheric ozone (e.g. Lingam & Loeb2017) and damage the DNA of biological organisms (e.g.Castenholz & Garcia-Pichel 2012). Associated X-ray andextreme-ultraviolet radiation can also erode the planetaryatmosphere and drive water loss. Stellar flares are also as-sociated with Coronal Mass Ejections (CMEs), and whileplanetary magnetospheres may protect against the quiescentstellar wind, CMEs can act to compress the magnetosphereand expose the planetary atmosphere to further erosion anddessication (e.g. Kay et al. 2016; Lammer et al. 2007).
The detections of superflares presented in this paperdemonstrate that wide-field ground-based surveys such asNGTS are capable of characterising the rates and energiesof superflares from G-type stars, despite their relatively lowfractional amplitude. Since flare detections with ground-based telescopes can be made and announced in real time itmay also be possible to trigger immediate follow up of super-flares with larger narrow-field telescopes while the flares arestill in progress. This has not been possible to date due to the
unpredictable nature of superflares and inevitable delays indownlinking and processing data from space telescopes suchas Kepler. Real-time follow up of NGTS flares might thenprovide the multi-wavelength observations needed to assessthe impact of superflares on potentially habitable exoplanetatmospheres.
5 CONCLUSIONS
In this work we have presented the detection of two su-perflares from the G8 star NGTS J030834.9-211322 usingNGTS. These are the first G star superflares detected fromthe ground using a CCD, and they are among the highest ca-dence measurements of any superflares to date. We fit bothflares with a model that incorporates a Gaussian heatingpulse, as seen previously in solar flares, and exponential de-cay on two timescales. The model fit provides the amplitude,energy and duration of each flare, and we find the two flareshave similar total energies despite their different amplitudesand durations. The larger flare has an unusually high ampli-tude and short duration for a G star superflare. Our modelalso allows us to measure the timescale of the flare rise, aninterval that has been undersampled in previous studies, andwe find the longer duration flare has a slower rise. We havealso detected substructure in both flares.
The stellar rotation period of NGTS J0308-2113 wasmeasured to be 59 hours, and we found evidence for differen-tial rotation. The X-ray luminosity of the star was calculatedto be 1.7 × 1030 erg s−1, with log LX /LBol = −3.1 implyingsaturated X-ray emission, as expected for a G8 star withsuch a short spin perod. The Rossby number of 0.18 placesNGTS J0308-2113 close to the peak of the occurence ratedistribution implied by previous flare detections.
Our results highlight the potential for wide-field ground-based surveys such as NGTS to determine the rates, energiesand morphologies of superflares from G stars, despite themodest white-light amplitudes of such flares. Further detec-tions and real-time multi-wavelength follow up will be im-portant in assessing the habitability of Earth-like exoplanetsaround G stars, including those to be found with PLATO.
ACKNOWLEDGEMENTS
This research is based on data collected under the NGTSproject at the ESO La Silla Paranal Observatory. The NGTSfacility is funded by a consortium of institutes consistingof the University of Warwick, the University of Leicester,Queen’s University Belfast, the University of Geneva, theDeutsches Zentrum fur Luft- und Raumfahrt e.V. (DLR; un-der the ‘Großinvestition GI-NGTS’), the University of Cam-bridge, together with the UK Science and Technology Fa-cilities Council (STFC; project reference ST/M001962/1).JAGJ is supported by an STFC studentship. PJW, DJAand RGW are supported by STFC consolidated grantST/P000495/1. AMB acknowledges the support of the In-stitute of Advanced Study, University of Warwick and isalso supported by STFC consolidated grant ST/P000320/1.JSJ acknowledges support by Fondecyt grant 1161218 andpartial support by CATA-Basal (PB06, CONICYT). MNGis supported by STFC award reference 1490409 as well as
Downloaded from https://academic.oup.com/mnras/advance-article-abstract/doi/10.1093/mnras/sty897/4967002by Library,Queen's University,Belfast useron 11 April 2018

10 J. A. G. Jackman et al.
the Isaac Newton Studentship. CEP acknowledges supportfrom the European Research Council under the SeismoSunResearch Project No. 321141. The research leading to theseresults has received funding from the European ResearchCouncil under the European Union’s Seventh FrameworkProgramme (FP/2007–2013) / ERC Grant Agreement n.320964 (WDTracer).
Downloaded from https://academic.oup.com/mnras/advance-article-abstract/doi/10.1093/mnras/sty897/4967002by Library,Queen's University,Belfast useron 11 April 2018
G star superflares with NGTS 11
REFERENCES
Anglada-Escude G., et al., 2016, Nature, 536, 437
Aschwanden M. J., Dennis B. R., Benz A. O., 1998, ApJ, 497, 972
Aschwanden M. J., Xu Y., Jing J., 2014, ApJ, 797, 50
Astropy Collaboration et al., 2013, A&A, 558, A33
Balona L. A., Broomhall A.-M., Kosovichev A., Nakariakov V. M., Pugh C. E., Van Doorsselaere T., 2015, MNRAS, 450, 956
Baluev R. V., 2008, MNRAS, 385, 1279
Benz A. O., Gudel M., 2010, ARA&A, 48, 241
Boller T., Freyberg M. J., Trumper J., Haberl F., Voges W., Nandra K., 2016, A&A, 588, A103
Borucki W. J., et al., 2010, Science, 327, 977
Boyajian T. S., et al., 2012, ApJ, 757, 112
Boyajian T. S., et al., 2017, ApJ, 845, 178
Bradshaw S. J., Hartigan P., 2014, ApJ, 795, 79
Brown T. M., Latham D. W., Everett M. E., Esquerdo G. A., 2011, AJ, 142, 112
Candelaresi S., Hillier A., Maehara H., Brandenburg A., Shibata K., 2014, ApJ, 792, 67
Carrington R. C., 1859, MNRAS, 20, 13
Castenholz R. W., Garcia-Pichel F., 2012, in , Ecology of Cyanobacteria II. Springer, pp 481–499
Collier Cameron A., et al., 2007, MNRAS, 380, 1230
Covey K. R., et al., 2007, AJ, 134, 2398
Cutri R. M., et al. 2014, VizieR Online Data Catalog, 2328
Davenport J. R. A., 2016, ApJ, 829, 23
Davenport J. R. A., et al., 2014, ApJ, 797, 122
Dickey J. M., Lockman F. J., 1990, ARA&A, 28, 215
Douglas S. T., Agueros M. A., Covey K. R., Kraus A., 2017, ApJ, 842, 83
Estrela R., Valio A., 2017, preprint, (arXiv:1708.05400)
Fleming T. A., Molendi S., Maccacaro T., Wolter A., 1995, ApJS, 99, 701
Foreman-Mackey D., Hogg D. W., Lang D., Goodman J., 2013, PASP, 125, 306
Gaia Collaboration et al., 2016, A&A, 595, A2
Gillen E., Hillenbrand L. A., David T. J., Aigrain S., Rebull L., Stauffer J., Cody A. M., Queloz D., 2017, preprint, (arXiv:1706.03084)
Gillon M., et al., 2017, Nature, 542, 456
Gould A., Morgan C. W., 2003, ApJ, 585, 1056
Gray R. O., Corbally J. C., 2009, Stellar Spectral Classification
Gryciuk M., Siarkowski M., Sylwester J., Gburek S., Podgorski P., Kepa A., Sylwester B., Mrozek T., 2017, Sol. Phys., 292, 77
Hawley S. L., Davenport J. R. A., Kowalski A. F., Wisniewski J. P., Hebb L., Deitrick R., Hilton E. J., 2014, ApJ, 797, 121
Henden A., Munari U., 2014, Contributions of the Astronomical Observatory Skalnate Pleso, 43, 518
Hodgson R., 1859, MNRAS, 20, 15
Huensch M., Schmitt J. H. M. M., Voges W., 1998, A&AS, 132, 155
Hunt-Walker N. M., Hilton E. J., Kowalski A. F., Hawley S. L., Matthews J. M., 2012, PASP, 124, 545
Johnstone C. P., Gudel M., 2015, A&A, 578, A129
Kalberla P. M. W., Burton W. B., Hartmann D., Arnal E. M., Bajaja E., Morras R., Poppel W. G. L., 2005, A&A, 440, 775
Kay C., Opher M., Kornbleuth M., 2016, ApJ, 826, 195
Kowalski A. F., Mathioudakis M., Hawley S. L., Hilton E. J., Dhillon V. S., Marsh T. R., Copperwheat C. M., 2011, in Johns-Krull C.,
Browning M. K., West A. A., eds, Astronomical Society of the Pacific Conference Series Vol. 448, 16th Cambridge Workshop on Cool
Stars, Stellar Systems, and the Sun. p. 1157 (arXiv:1103.0822)
Kowalski A. F., Hawley S. L., Wisniewski J. P., Osten R. A., Hilton E. J., Holtzman J. A., Schmidt S. J., Davenport J. R. A., 2013,ApJS, 207, 15
Lammer H., et al., 2007, Astrobiology, 7, 185
Lingam M., Loeb A., 2017, preprint, (arXiv:1708.04241)
Maehara H., et al., 2012, Nature, 485, 478
Maehara H., Shibayama T., Notsu Y., Notsu S., Honda S., Nogami D., Shibata K., 2015, Earth, Planets, and Space, 67, 59
Martin D. C., et al., 2005, ApJ, 619, L1
Mazeh T., Tamuz O., Zucker S., 2007, in Afonso C., Weldrake D., Henning T., eds, Astronomical Society of the Pacific Conference SeriesVol. 366, Transiting Extrapolar Planets Workshop. p. 119 (arXiv:astro-ph/0612418)
Moon Y.-J., Choe G. S., Park Y. D., Wang H., Gallagher P. T., Chae J., Yun H. S., Goode P. R., 2002, ApJ, 574, 434
Notsu Y., et al., 2013, ApJ, 771, 127
Osborn J., Fohring D., Dhillon V. S., Wilson R. W., 2015, MNRAS, 452, 1707
Parnell C. E., Jupp P. E., 2000, ApJ, 529, 554
Pecaut M. J., Mamajek E. E., 2013, ApJS, 208, 9
Pizzolato N., Maggio A., Micela G., Sciortino S., Ventura P., 2003, A&A, 397, 147
Poletto G., 1989, Sol. Phys., 121, 313
Pugh C. E., Armstrong D. J., Nakariakov V. M., Broomhall A.-M., 2016, MNRAS, 459, 3659
Rauer H., et al., 2014, Experimental Astronomy, 38, 249
Roettenbacher R. M., Monnier J. D., Harmon R. O., Barclay T., Still M., 2013, ApJ, 767, 60
Sadeghi Ardestani L., Guillot T., Morel P., 2017, MNRAS, 472, 2590
Schaefer B. E., 1989, ApJ, 337, 927
Schaefer B. E., King J. R., Deliyannis C. P., 2000, ApJ, 529, 1026
Schmitt J. H. M. M., Fleming T. A., Giampapa M. S., 1995, ApJ, 450, 392
Downloaded from https://academic.oup.com/mnras/advance-article-abstract/doi/10.1093/mnras/sty897/4967002by Library,Queen's University,Belfast useron 11 April 2018

12 J. A. G. Jackman et al.
Segura A., Walkowicz L. M., Meadows V., Kasting J., Hawley S., 2010, Astrobiology, 10, 751
Shibata K., et al., 2013, PASJ, 65, 49
Shibayama T., et al., 2013, ApJS, 209, 5Silva-Valio A., Lanza A. F., 2011, A&A, 529, A36
Skrutskie M. F., et al., 2006, AJ, 131, 1163
Solanki S. K., 2003, A&ARv, 11, 153Stauffer J., et al., 2016, AJ, 152, 115
Stelzer B., Schmitt J. H. M. M., Micela G., Liefke C., 2006, A&A, 460, L35Telleschi A., Gudel M., Briggs K., Audard M., Ness J.-U., Skinner S. L., 2005, ApJ, 622, 653
Tsang B. T. H., Pun C. S. J., Di Stefano R., Li K. L., Kong A. K. H., 2012, ApJ, 754, 107
Tsurutani B. T., Gonzalez W. D., Lakhina G. S., Alex S., 2003, Journal of Geophysical Research: Space Physics, 108, n/aVenot O., Rocchetto M., Carl S., Roshni Hashim A., Decin L., 2016, ApJ, 830, 77
Wheatley P. J., et al., 2017, preprint, (arXiv:1710.11100)
Wright N. J., Drake J. J., Mamajek E. E., Henry G. W., 2011, ApJ, 743, 48Wu C.-J., Ip W.-H., Huang L.-C., 2015, ApJ, 798, 92
Yabuki K., Tsuboi Y., Sasaki R., Sugawara Y., Katsuda S., Maehara H., 2017, in Serino M., Shidatsu
M., Iwakiri W., Mihara T., eds, 7 years of MAXI: monitoring X-ray Transients, held 5-7 Decem-ber 2016 at RIKEN. Online at <A href=“https://indico2.riken.jp/indico/conferenceDisplay.py?confId=2357”>
https://indico2.riken.jp/indico/conferenceDisplay.py?confId=2357</A>, p.187. p. 187
Young A. T., 1967, AJ, 72, 747Zacharias N., Finch C., Frouard J., 2017, AJ, 153, 166
Downloaded from https://academic.oup.com/mnras/advance-article-abstract/doi/10.1093/mnras/sty897/4967002by Library,Queen's University,Belfast useron 11 April 2018
Related Documents