Statistical release P0441 Gross Domestic Product Annual estimates 1993 - 1999 Third quarter 2000 Co-operation between Statistics South Africa (Stats SA), the citizens of the country, the private sector and government institutions is essential for a successful statistical system. Without continued co-operation and goodwill, the timely release of relevant and reliable official statistics will not be possible. Stats SA publishes approximately three hundred different releases each year. It is not economically viable to produce them in more than one of South Africa’s eleven official languages. Since the releases are used extensively, not only locally, but also by international economic and social- scientific communities, Stats SA releases are published in English only. Embargo: 11:30 Date: 27 November 2000

Welcome message from author
This document is posted to help you gain knowledge. Please leave a comment to let me know what you think about it! Share it to your friends and learn new things together.
Transcript

Statistical release
P0441
Gross Domestic Product Annual estimates 1993 - 1999
Third quarter 2000
Co-operation between Statistics South Africa (Stats SA), the citizens of the country, the private sector and government institutions is essential for a successful statistical system. Without continued co-operation and goodwill, the timely release of relevant and reliable official statistics will not be possible. Stats SA publishes approximately three hundred different releases each year. It is not economically viable to produce them in more than one of South Africa’s eleven official languages. Since the releases are used extensively, not only locally, but also by international economic and social-scientific communities, Stats SA releases are published in English only.
Embargo: 11:30 Date: 27 November 2000

CONTENTS
Key findings.............................................................................................................................1
Methodological notes...............................................................................................................8
Notes......................................................................................................................................15
Quarter ly tables
Table 1 Quarterly gross domestic product by industry at constant 1995 prices........................16
Table 2 Percentage change in the quarterly gross domestic product by industry at constant 1995 prices...........................................................................18
Table 3 Seasonally adjusted and annualised quarterly gross domestic product by industry at constant 1995 prices...........................................................................20
Table 4 Annualised percentage change in the seasonally adjusted quarterly gross domestic product by industry at constant 1995 prices .......................................22
Table 5 Quarterly gross domestic product by industry at current prices..................................24
Table 6 Quarterly compensation of employees........................................................................26
Table 7 Quarterly gross operating surplus and net other taxes on production ..........................28
Annual tables
Table 8 Annual gross domestic product by industry at current prices..................................... 30
Table 9 Percentage contribution to the annual gross domestic product by industry
at current prices....................................................................................................... 31
Table 10 Annual gross domestic product by industry at constant 1995 prices .......................... 32
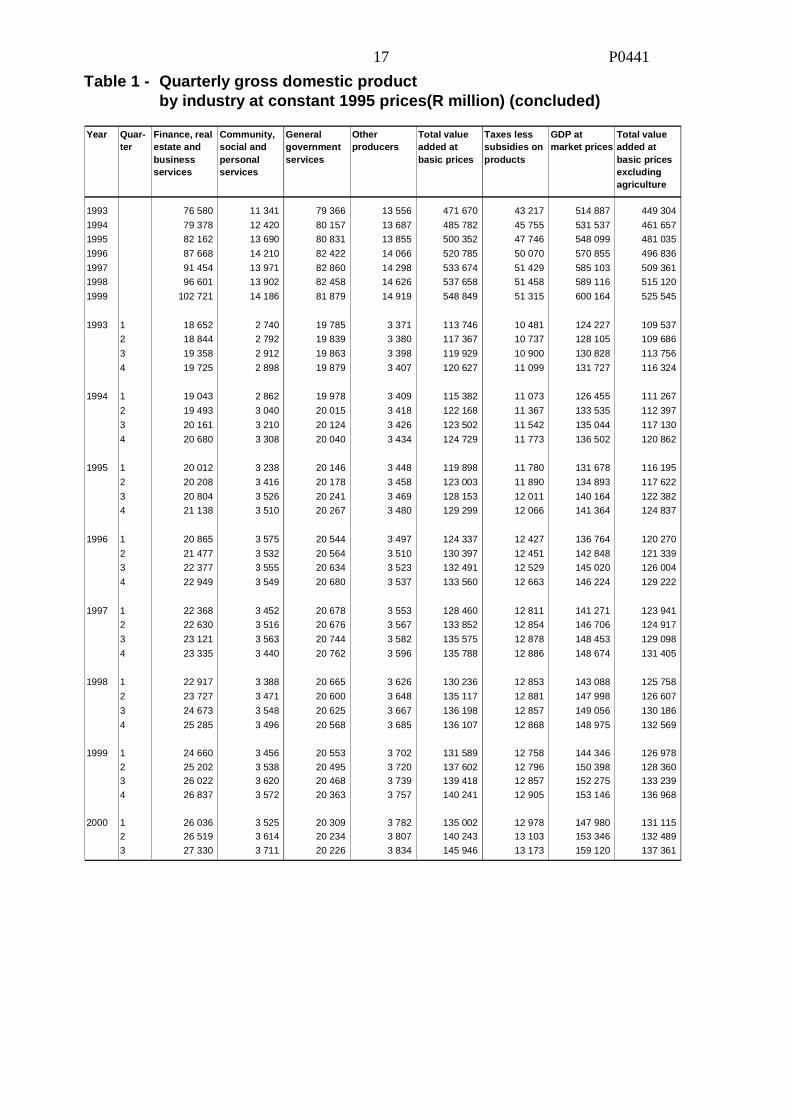
Table 11 Percentage change in the annual gross domestic product by industry at constant 1995 prices ............................................................................................ 33
Table 12 Annual production accounts by industry at current prices......................................... 34
Table 13 Annual production accounts by industry at constant 1995 prices............................... 36
Table 14 Annual volume index numbers by industry ............................................................... 37
Table 15 Annual implied deflators by industry ........................................................................ 37
Additional information
Explanatory notes.................................................................................................... 38
Classification of industries....................................................................................... 40
Statistical sources and methods................................................................................ 44
Glossary.................................................................................................................. 49
For more information ........................................................................................................... 53

P0441 1
KEY FINDINGS
Real GDP at market pr ices increases by 3,8% dur ing the third quarter of 2000
According to the latest preliminary indicators, the seasonally adjusted real GDP at market prices for the third quarter of 2000 increased by an annualised rate of 3,8 percent compared with the second quarter of 2000, following real annualised economic growth rates of 2,0 (revised from 0,8) and 2,8 (revised from 1,6) percent in the first and second quarters of 2000 compared with the fourth quarter of 1999 and the first quarter of 2000 respectively. The revised real annualised growth rates for the four quarters of 1999 were 2,0 percent, 2,6 percent, 3,6 percent and 4,2 percent respectively (cf. table 4). These quarterly figures have been revised as part of Stats SA’s annual independent compilation and revision of the GDP estimates for each quarter in the period 1998 to 2000.
The seasonally adjusted real value added at basic prices for all industries – which is equal to GDP minus taxes on products plus subsidies on products –increased by an annualised rate of 3,9 percent during the third quarter of 2000 compared with the second quarter of 2000, following annualised increases of 1,9 (revised from 0,7) and 2,8 (revised from 1,6) percent in the first and second quarters of 2000 compared with the fourth quarter of 1999 and the first quarter of 2000 respectively (cf. figure 1 and table 4).
The seasonally adjusted real value added by the non-agricultural industries (excluding the impact of the volatile agriculture industry) increased by 2,4 (revised from 1,7), 2,6 (revised from 1,8) and 3,1 percent during the first second and third quarters of 2000, compared with the fourth quarter of 1999 and the first and second quarters of 2000 respectively (cf. figure 1 and table 4).
The unadjusted real GDP at market prices increased by 2,5 percent, 2,0 percent and 4,5 percent during the first, second and third quarters of 2000 compared with the first, second and third quarters of 1999 respectively (cf. table 2). The unadjusted real GDP at market prices for the first nine months of 2000 increased by 3,0 percent compared with the first nine months of 1999.
Figure 1 - Annualised growth rate in the seasonally adjusted real value added at basic pr ices
Source: Stats SA
-1,0
0,0
1,0
2,0
3,0
4,0
5,0
6,0
7,0
8,0
96/1 96/2 96/3 96/4 97/1 97/2 97/3 97/4 98/1 98/2 98/3 98/4 99/1 99/2 99/3 99/4 00/1 00/2 00/3
Quarter
%
Non-agricultural industries All industries

P0441 2
Revised annual estimates for 1998, 1999 and all quarters since the first quarter of 1998 Prior to June 1999, Stats SA only compiled quarterly national accounts and the annual estimates of GDP were derived as the sum of the GDP for the four quarters of the specific year. Stats SA implemented the 1993 System of National Accounts in June 1999 in conjunction with the revision, benchmarking and re-basing (to 1995 levels) of the national accounts. Stats SA revises, benchmarks and re-bases the GDP estimates on a periodic (5-yearly) basis. This is done in order to, inter alia, recalculate the relative weights of industries in the constant price estimates of GDP and to incorporate new data sources and activities that have been identified since the previous benchmarking exercise. With the implementation of the 1993 System of National Accounts, Stats SA for the first time compiled and introduced independent annual national accounts estimates for the period 1993 to 1998 which were published on June 1999. At that stage Stats SA stated that in future independent annual national accounts estimates will be compiled for the latest two years and be published in November of each year. The purpose of independent annual estimates is to benchmark the level of GDP-estimates for the specific year by incorporating new data that was not yet available when the quarterly estimates were compiled. The annual revision of GDP estimates through the independently compiled national accounts should be seen as part of the periodic benchmarking process, as it will assist in smoothing the effect of changing the level-estimates of GDP periodically. According to the revision policy of Stats SA regarding the compilation of National Accounts for South Africa, annual and quarterly national accounts estimates are revised annually when independent annual national accounts estimates for the latest two years and the latest ten quarters are compiled using more comprehensive economic and socio-economic information, e.g. annual reports and financial statements of enterprises and results of household surveys, which became available since the previous independent annual estimates were published. These sources are generally speaking, more reliable than the sources used for the quarterly estimates. Therefore, revisions made to the annual value added of an industry, impact on the quarterly value added of an industry of that year, as well as value added estimates of the following quarters of that specific industry. Hence, the annual GDP estimates for the latest two years (1998 to 1999) and the quarterly estimates of all ten quarters since the first quarter of 1998 were revised and published on Monday, 27 November 2000 by Stats SA. These estimates are the result of independently compiled annual national accounts, using additional sources containing more comprehensive data than in the case of quarterly GDP estimates. The revised growth rate in the real GDP at market prices for 1998 is 0,7 percent compared to the previous estimate of 0,6 percent. The real economic growth rate for 1999 has been revised to 1,9 percent compared to the previous estimate of 1,2 percent. As expected, the benchmarking of 1998 did not indicate noticeable changes as it was also benchmarked and published on 22 November 1999.

P0441 3
The revision (through benchmarking) of annual estimates of GDP has a direct influence on the quarterly growth patterns of the specific years. Not only are the levels of the annual estimates adjusted, but new data sources indicate different growth patterns throughout the years as well. Revised methodology for estimates of the agr iculture industry The agricultural industry comprises the agriculture-, forestry- and fishing industries. Apart from the annual revisions, Stats SA has revised the methodology used to estimate the quarter ly value added by the agriculture industry to be consistent with the methodology used for compiling the independent annual estimates of value added by the agriculture industry. The revision of the methodology used in the estimation of the quarterly value added by the agriculture industry has been considered since the implementation of the 1993 System of National Accounts (SNA93) in June 1999. The SNA93 gives broad guidelines relating to the methodology that needs to be followed in the estimation of quarterly value added. Various alternatives were researched and discussed with stakeholders, most notably the South African Reserve Bank, the National Department of Agriculture and an inter-regional advisor from the United Nations during a workshop earlier this year. It was then decided to change the methodology used to estimate the quarterly value added by the agriculture industry. In estimating the quarterly value added by the agriculture industry, the output of the agriculture industry is now consistently allocated to the period when crops are harvested and animals are slaughtered etc., while previously a combination of methods was applied. The introduction of the new methodology resulted in revised quarterly distributions of value added by the agriculture industry as from 1993. The seasonally adjusted estimates of value added by the agriculture industry were revised only from 1997 in order to create a seamless link to the latest revised annual estimates of total value added from 1998 onwards. The change in the methodology only influences the quarterly distribution of value added of the agriculture industry and not the annual estimates of the value added by the agriculture industry. However, Stats SA has revised the annual estimates of the value added by the agriculture industry due to new and additional data that was received from the National Department of Agriculture regarding 1998 and 1999. The revised information received led to revisions of the real value added by the agriculture industry for 1997 from 3,0 percent to 2,4 percent and for 1998 from –3,6 percent to – 8,0 percent. The revised information led to revisions of the real value added by the agr iculture-, forestry- and fishing industries (agricultural industry) for 1997 from 2,3 percent to 1,5 percent, for 1998 from –3,1 percent to – 7,3 percent and for 1999 from 4,3 percent to 3,4 percent.

P0441 4
Real value added by industry
Table A shows the contribution of the different industries, and taxes less subsidies on products, to the annualised percentage change in the seasonally adjusted real GDP for the seven quarters from the first quarter of 1999 onwards. The impact of an industry on the change in real GDP depends on two factors: the increase or decrease in the real value added of the industry and its relative size measured as its share of GDP in the previous quarter. Thus, the 3,8 percent annualised increase in the seasonally adjusted real GDP during the third quarter of 2000 was mainly due to increases in the real value added by agriculture, forestry and fishing (0,9 of a percentage point), finance, real estate and business services (0,8 of a percentage point), manufacturing (0,7 of a percentage point), wholesale and retail trade, hotels and restaurants (0,7 of a percentage point), and transport and communication (0,6 of a percentage point) industries. The contributions to the increase in real GDP by all other industries were either lower than the aforementioned, or negative, e.g. mining and quarrying (-0,1 of a percentage point) and general government services (-0,2 of a percentage point) industries (cf. table A last column).
Table A - Contr ibutions of the percentage change in real value added by industr ies to annualised percentage change in seasonally adjusted real GDP
Industry Weights
2000 Q31/
(percent)
Q1 Q2 Q3 Q4 Q1 Q2 Q3 Q1 Q2 Q3 Q4 Q1 Q2 Q3
Agriculture, forestry and fishing
3,8 6,6 2,6 4,5 6,4 -8,6 7,5 24,1 0,2 0,1 0,2 0,2 -0,4 0,3 0,9
Mining and quarrying 5,6 0,1 0,0 -0,9 -0,2 -2,8 -3,6 -2,6 0,0 0,0 -0,1 0,0 -0,2 -0,2 -0,1
Manufacturing 18,1 0,1 0,7 4,6 6,0 2,7 2,2 3,7 0,0 0,1 0,8 1,1 0,5 0,4 0,7
Electricity and water 3,3 -3,5 4,4 9,7 12,1 0,2 2,4 1,8 -0,1 0,1 0,3 0,4 0,0 0,1 0,1
Construction 2,6 -5,2 -5,4 -4,3 -3,5 -0,7 1,5 2,5 -0,2 -0,2 -0,1 -0,1 0,0 0,0 0,1
Wholesale and retail trade, hotels and restaurants
12,6 5,1 5,3 4,8 4,4 5,6 6,0 5,3 0,6 0,6 0,6 0,5 0,7 0,7 0,7
Transport and communication
10,0 6,2 10,2 9,4 5,7 5,2 6,5 5,8 0,6 1,0 0,9 0,6 0,5 0,6 0,6
Finance, real estate and business services
17,4 5,1 4,9 5,3 9,1 3,1 3,4 4,6 0,9 0,8 0,9 1,5 0,5 0,6 0,8
Community, social and personal services
2,4 3,0 1,6 1,9 2,6 1,9 2,2 3,2 0,1 0,0 0,0 0,1 0,0 0,1 0,1
General government services
13,3 -0,1 -0,6 -1,4 -2,1 -0,5 -0,9 -1,2 0,0 -0,1 -0,2 -0,3 -0,1 -0,1 -0,2
Other producers 2,5 1,9 2,0 2,0 2,0 2,6 2,7 2,8 0,0 0,0 0,1 0,1 0,1 0,1 0,1
Total value added 91,5 2,4 2,9 3,7 4,4 1,9 2,8 3,9 2,1 2,6 3,4 4,1 1,7 2,6 3,5
Taxes less subsidies on products
8,5 -1,7 -0,4 1,8 1,7 2,8 2,7 3,5 -0,2 0,0 0,2 0,1 0,2 0,2 0,3
GDP at market prices 100,0 2,0 2,6 3,6 4,2 2,0 2,8 3,8 2,0 2,6 3,6 4,2 2,0 2,8 3,8
1999 20001999
Contributions to the seasonallyadjusted annualised changes in
real GDP (percentage points)2/
Seasonally adjusted real
annualised change from the
previous quarter (percent)
2000
1/ The weight of each industry for the third quarter of 2000 is the share of its seasonally adjusted real value added of the seasonally adjusted GDP for the second quarter 2000. Similarly, the weight of taxes less subsidies on products is the share of its seasonally adjusted value of the seasonally adjusted GDP for the second quarter 2000.
2/ The contribution is calculated by multiplying the percentage change of each industry (and taxes less subsidies on products) with its share of GDP in the previous quarter (i.e. its weight).
P0441 5
The annual real value added by the agriculture, forestry and fishing industry decreased by 7,3 percent in 1998 compared to the previously estimated decrease of 3,1 percent, while increased by 3,4 percent in 1999 compared to the previously estimated increase of 4,3 percent.
The seasonally adjusted real value added by the agriculture, forestry and fishing industry increased at an annualised rate of 24,1 percent during the third quarter of 2000 compared with the second quarter of 2000, following an annualised decrease of 8,6 percent in the first quarter of 2000 compared with the fourth quarter of 1999 and an annualised increase of 7,5 percent in the second quarter of 2000 compared with the first quarter of 2000. (If these rates were not annualised, the rate of change would have been –2,2 percent, 1,8 percent and 5,5 percent for the first three quarters of 2000 respectively.) The annualised increase reflected during the third quarter of 2000 was mainly due the late harvest of field crops due to the effects of extreme weather conditions which occurred during the first quarter of 2000 e.g. high rainfall and floods. The unadjusted real value added by agriculture, forestry and fishing during the first nine months of 2000 increased by 1,0 percent compared with the first nine months of 1999.
The revised estimate of the annual real value added by the mining and quarrying industry indicates a decrease of 0,8 percent for 1998 compared to the decrease of 0,5 percent previously estimated. The revised annual decrease in the real value added by this industry for 1999 remained unchanged at 1,0 percent.
The mining and quarrying industry continued its downward trend during the first three quarters of 2000. This industry reflected annualised decreases in the seasonally adjusted real value added of 2,8 percent, 3,6 percent and 2,6 percent during the first, second and third quarters of 2000 compared with the fourth quarter of 1999 and the first and second quarters of 2000 respectively. These annualised decreases in the seasonally adjusted real value added were mainly due to decreases in the production of coal, gold and other metal ores. The unadjusted real value added by the mining and quarrying industry during the first nine months of 2000 decreased by 1,7 percent compared with the first nine months of 1999.
The real value added by the manufacturing industry reflects an annual decrease of 1,6 percent for 1998 compared to the previously estimated annual decrease of 1,8 percent. The real value added by the manufacturing industry for 1999 continued to decrease in 1999 by 0,2 percent compared to the previously estimated increase of 0,2 percent.
The seasonally adjusted real value added by the manufacturing industry increased by an annualised rate of 3,7 percent during the third quarter of 2000 compared with the second quarter of 2000, following annualised increases of 2,7 percent and 2,2 percent during the first and second quarters of 2000 compared with the fourth quarter of 1999 and the first quarter of 2000 respectively. The annualised increase during the third quarter of 2000 was mainly due to increases reflected in the seasonally adjusted real value added by the petroleum products, chemicals and chemical products, rubber and plastic products and transport equipment industries. The unadjusted real value added by the manufacturing industry during the first nine months of 2000 increased by 3,6 percent compared with the first nine months of 1999.

P0441 6
The annual real value added by the electricity and water industry increased by 0,6 percent in 1998 compared to the previously estimated increase of 1,2 percent. The revised estimates of the real value added by the electricity and water industry reflects an annual increase of 1,9 percent for 1999 which is higher than the previously estimated annual increase of 0,1 percent.
The electricity and water industry reflected annualised increases in the seasonally adjusted real value added of 0,2 percent, 2,4 percent and 1,8 percent during the first, second and third quarters of 2000 compared with the fourth quarter of 1999 and the first and the second quarters of 2000 respectively. The annualised increase reflected during the third quarter of 2000 was mainly due to increased production of electricity. The unadjusted real value added by the electricity and water industry during the first nine months of 2000 increased by 5,4 percent compared with the corresponding period of 1999.
The revised annual increase in the real value added by the construction industry for 1998 remained unchanged at 1,2 percent. The real value added by the construction industry reflects an annual decrease of 3,8 percent for 1999 compared to the previously estimated decrease of 1,6 percent.
The seasonally adjusted real value added by the construction industry increased at an annualised rate of 2,5 percent during the third quarter of 2000 compared with the second quarter of 2000. This increase is the second consecutive positive growth rate reflected for this industry. The unadjusted real value added by the construction industry during the first nine months of 2000 decreased by 1,8 percent compared with the first nine months of 1999.
The revised annual decreases in the real value added by the wholesale and retail trade, hotels and restaurants industry for 1998 remained unchanged at 1,4 percent. The real value added by the wholesale and retail trade, hotels and restaurants industry indicates an annual increase of 1,3 percent for 1999 which is higher than the 0,0 percent previously estimated.
The positive growth rates in the seasonally adjusted real value added by the wholesale and retail trade, hotels and restaurants industry were sustained during the first three quarters of 2000. The annualised increases during the first, second and third quarters of 2000 were 5,6 percent, 6,0 percent and 5,3 percent reflected by this industry compared with the fourth quarter of 1999 and the first and second quarters of 2000 respectively. The annualised increase of 5,3 percent during the third quarter of 2000 was mainly due to increases reflected in the seasonally adjusted real value added by the wholesale and motor trade industries. The unadjusted real value added by wholesale and retail trade, hotels and restaurants during the first nine months of 2000 increased by 5,1 percent compared with the first nine months of 1999.
The annual real value added of the transport and communication industry increased by 7,0 percent in 1998 and 7,6 percent in 1999 compared to the previously estimated annual increases of 8,1 percent and 6,6 percent, respectively.
The seasonally adjusted real value added by the transport and communication industry increased at an annualised rate of 5,8 percent during the third quarter of 2000 compared with the second quarter of 2000, following annualised increases of 5,2 percent and 6,5 percent in the first and second quarters of 2000 respectively. The annualised increase reflected by this industry during the third quarter of 2000 was mainly due to increased activities related to land transport as well as communication services. The unadjusted real value added by the transport and communication industry during the first nine months of 2000 increased by 6,7 percent compared with the first nine months of 1999.

P0441 7
The annual real value added of the finance, real estate and business services industry increased by 5,6 percent in 1998 and 6,3 percent in 1999 compared to the previously estimated annual increases of 3,6 percent and 3,0 percent respectively.
The real value added in the finance, real estate and business services industry increased by seasonally adjusted annualised rates of 3,1 percent, 3,4 percent and 4,6 percent during the first, second and third quarters of 2000 compared with the fourth quarter of 1999 and the first and second quarters of 2000 respectively. The annualised increase in the third quarter of 2000 was mainly due to increased activities in financial intermediation and real estate. The unadjusted real value added by the finance, real estate and business services industry during the first nine months of 2000 increased by 5,3 percent compared with the first nine months of 1999.
The annual real value added of the community, social and personal services industry decreased by 0,5 percent in 1998 and increased by 2,0 percent in 1999 compared to the previously estimated annual increases of 1,0 percent and 3,2 percent respectively.
The real value added by the community, social and personal services industry increased by a seasonally adjusted annualised rate of 3,2 percent during the third quarter of 2000 compared with the second quarter of 2000, following annualised increases of 1,9 percent and 2,2 percent in the first and second quarters of 2000 respectively. The unadjusted real value added of the community, social and personal services industry during the first nine months of 2000 increased by 2,2 percent compared with the first nine months of 1999.
The annual decreases in the real value added by the general government services sector for 1998 and 1999 remained unchanged at 0,5 and 0,7 percent respectively.
Finally, the seasonally adjusted real value added of the general government services sector reflected an annualised decrease of 1,2 percent during the third quarter of 2000 compared with the second quarter of 2000, following annualised decreases of 0,5 percent and 0,9 percent during the first and second quarters of 2000 respectively. The unadjusted real value added of the general government services sector during the first nine months of 2000 decreased by 1,2 percent compared with the first nine months of 1999.
pp P Lehohla Statistician-General: Statistics South Afr ica

P0441 8
METHODOLOGICAL NOTES
Introduction This statistical release contains annual and quarterly estimates of the GDP for the years 1993 to 1999 and the first three quarters of 2000, calculated from the produc-tion side whereby GDP is derived through the sum of values added of different economic activities or industries. Stats SA is responsible for compiling the produc-tion side of the national accounts, while the SARB is responsible for compiling the expenditure side of the national accounts, as well as income and savings and the balance of payments. The SARB will release their estimates on December 6, 2000.
The results of the quarterly value added and GDP estimates are presented in tables 1 to 7, while the results of the annual value added and GDP estimates are presented in tables 8 to 15. The annual estimates contain more detail than the quarterly estimates regarding the detail of industries.
Tables 1 to 2 Table 1 and 2 show values added by industry at constant 1995 basic prices, in Rand million and as percentage changes from the same quarter in the previous year. Table 2 also includes the percentage increase in the first three quarters in 2000 added together compared to the corresponding quarters in 1999.
Tables 3 to 4 Table 3 and 4 contain seasonally adjusted and annualised values added at constant 1995 basic prices by industry, in Rand million and as annualised percentage changes from the previous quarter. Seasonal adjustment is a method for removing the estimated effects of normal seasonal variation from the quarterly estimates. Although seasonality is an integral part of the quarterly data it may represent an impediment to effective analysis of the business cycle. However, irregular fluctuations because of events such as strikes can still make it difficult to interpret seasonally adjusted data. The annualised values added are equal to the seasonally quarterly data multiplied by four, while the annualised growth rates are derived by raising the change in a given quarter from the previous quarter to the power of four. The intent of annualisation is to indicate what the real growth would be if the present growth rate were to be sustained for a year.
Tables 5 to 7 Tables 5 to 7 present quarterly estimates at current prices of values added by industry and GDP (table 5) and of compensation of employees (table 6) and gross operating surplus and net other taxes on production (table 7) by industry. Seasonally adjusted values added at current prices are available on request.
Tables 8 to 9 Tables 8 and 9 show values added at current basic prices for detailed industries in Rand million and as percentages of the total value added of all industries. The latter is the preferred measurement of the relative contributions by the different industries to GDP. The measurement of the contribution to GDP entails the contribution of productive activities.
Tables 10 to 11 Tables 10 and 11 present values added at constant 1995 basic prices for detailed industries, in Rand million and as annual percentage changes. The stronger annual real growth of the tertiary industries compared to the primary and secondary industries is illustrated in figure 2.

P0441 9
Figure 2 - Annual real growth in the pr imary, secondary and ter tiary industr ies - (1993=100)
Table 12 Table 12 contains production accounts at current prices for aggregate industries. The total – the production account for the sum of all industries – does not add up to GDP at market prices. Taxes on products must be added and subsidies on products deducted as presented in table 8. The production account can serve to illustrate the derivation of values added by both the production and income method. It reflects the following identities:
Output at basic prices – Intermediate consumption = Gross value added at basic prices – Other taxes on production + Other subsidies = Value added at factor cost – Compensation of employees = Gross operating surplus/mixed income
Value added and operating surplus are derived gross of consumption of fixed capital. Consumption of fixed capital is a cost of production reflecting the wear and tear of capital assets used in the production process.
According to the production method, data on output and intermediate consumption are used to derive value added. In practice, estimates must in many cases rely on single indicators for output and the estimate of intermediate consumption must rely on assumptions that can be checked when, for instance, results from an intermittent economic survey or census become available.
The components of value added are other taxes on production, other subsidies (a negative item), compensation of employees and operating surplus/mixed income. The latter two makes up value added at factor cost. According to the income method, data on the components of value added are compiled and added up. By its nature, it is difficult to get reliable data on operating surplus/mixed income, which in important respects differ from the concept of profit in business accounting. To a certain extent, the income method is used as a complement to the production method, notably for mining and manufacturing, relying on the financial statistics of Stats SA.
Source: Stats SA
90
95
100
105
110
115
120
125
1993 1994 1995 1996 1997 1998 1999
Year
Primary industries Secondary industries Tertiary industries

P0441 10
The concept of mixed income indicates that working proprietors and self-employed persons do not, by definition, receive wages and salaries. The surplus of their activities – the residual after deducting all costs from their income – must provide for both a remuneration for their labour and a return on their capital. Hence, the term mixed income does not appear in table 12 for general government services and other producers. There are no self-employed persons in these activities.
Table 13 Table 13 contains production accounts at constant 1995 prices for aggregate industries. In order to measure a transaction at constant prices, it must be possible, at least in principle, to factor it into a price and a volume component and keep the former component constant. This can be done either by using price indices for deflation of the current prices or volume indicators in order to extrapolate the base year value. Note that the volume component must reflect both changes in quantity and quality.
The variables that define value added in the production approach – output and intermediate consumption – can both be factored into a price and volume component. Value added at constant prices is defined as the difference between the two and cannot in itself be factored into price and volume components. Ideally, value added at constant prices should be derived by estimating output and intermediate consumption at constant prices separately, the double deflation method. Frequently, however, single indicators have to be used in practice. Value added at constant prices is then normally derived by using an output indicator. The components of value added – with the exception of compensation of employees – cannot be factored into price and volume components.
Table 14 Table 14 indicates an alternative way of presenting value added and GDP estimates at constant prices, i.e. as index numbers by industry with the base year (1995) equal to 100.
Table 15 Table 15 presents annual implied deflators for the main industries. The implied deflator is equal to the value added at current prices divided by the value added at constant prices. The GDP-deflator is sometimes used as an alternative measure of inflation. For comparison, table B includes the GDP-deflator, the consumer price index (CPI) and the production price index (PPI).
Table B - GDP-deflator , consumer and production pr ice index - (1995 = 100)
1993 1994 1995 1996 1997 1998 1999
GDP-deflator 82,8 90,7 100,0 108,3 116,9 124,8 132,6
CPI 84,5 92,0 100,0 107,4 116,6 124,7 131,1
PPI 83,2 90,5 100,0 108,5 117,3 122,5 128,5

P0441 11
METHODOLOGY USED TO COMPILE QUARTERLY ESTIMATES FOR THE AGRICULTURE INDUSTRY
Introduction In the revised national accounts presented in June 1999, the estimates the value added by the agriculture industry were also affected. The recommendations of the 1993 SNA regarding the methodology to be used to estimate the value added by the agriculture industry were considered but not strictly implemented. Other countries e.g. Australia also deviate to some extent from the recommendations of the 1993 SNA regarding the methodology used to estimate the value added by the agriculture industry. The reasons are similar to those presented below for South Africa. In particular it is difficult to implement the 1993 SNA recommendations to estimate the value added by the agriculture industry quarterly, and there is no complete international consensus on the most appropriate methodology to follow. Furthermore, agricultural production fluctuates with occasional sharp increases or decreases due to weather conditions. This makes the seasonally adjusted estimates of the real value added by the agriculture industry very sensitive to the choice of methodology.
Due to constraints in June 1999, it was not possible to pay the necessary attention to the quarterly estimates of the value added by the agriculture industry or, in other words, to design the best possible methodology for the quarterly distribution of the annual estimates of this industry. Therefore, Stats SA decided to review the quarterly estimates of the value added by the agriculture industry in order to make them more consistent with the definitions adopted for compiling the annual estimates. Furthermore, it was also important to review the seasonal adjustments methodology. This review has resulted in revised quarterly distributions of the value added of agriculture industry for all years since 1993, while the seasonally adjusted real value added estimates were revised only from 1997 in order to create a seamless link to the latest revised annual estimates of total value added from 1998 onwards.
The following paragraphs discuss the definitions and concepts relevant for estimating the value added by the agriculture industry, the data sources and the methods devised in the review.
Concepts/definitions The contribution of the an industry to the gross domestic product (GDP) is measured by its value added defined and calculated through the production approach as -
Output Less: Intermediate consumption.
Value added includes -
compensation of employees; taxes on production minus subsidies; and operating surplus/mixed income (derived as a balancing item).

P0441 12
Output - in the agriculture industry - is the value of crops, fruits, vegetables and livestock produced for the market or for own final consumption. It also includes construction work carried out by the agricultural establishment itself, e.g. fencing. The output estimates are compiled separately for detailed products classified according to five main headings -
field crops; horticulture (fruits and vegetables); animal products; changes in livestock inventories; own construction.
For many products of agriculture, the process of production extends over a number of quarters or even years for certain products. The growth of crops, fruits, vegetables and livestock, which is managed and controlled, constitutes a process of production. Therefore, the value of the output produced in each period should be measured as work-in-progress (changes in inventories), and the value of the harvested crops, fruits and vegetables, slaughtered animals, etc., should be distributed over the period of production as an increase in work-in-progress. The 1993 SNA prescribes that this should be done by distributing the value of harvested crops, etc., in proportion to the costs (intermediate consumption and labour costs) incurred in each period. For example, the period of production for maize starts with the planting during the fourth quarter and ends the following year with the harvest in the second and third quarter. The harvest of maize in 1999 should be recorded as work-in-progress in the fourth quarter of 1998 and the first, second and third quarters of 1999. Hence, the harvest of maize in 1999 would partly be recorded as output in 1998.
Intermediate consumption consists of the value of goods and services that are used as inputs in the production process of agriculture. It excludes the use of fixed assets. A general criterion is that goods with an economic life span of more than one year should be treated as fixed assets. Intermediate consumption should be recorded in the year and quarter when it is actually used, not when it is purchased. Compensation of employees is the total remuneration payable by an enterprise to permanent and casual employees for work done by them during the accounting period. It includes wages and salaries in cash, wages and salaries in kind, and employers’ social contributions (if any). Remuneration in kind is of particular importance in the agriculture industry of South Africa. In contrast to employees, workers who are the sole or joint owners of the unincorporated enterprise where they work are classified as self-employed. Workers engaged in production for own final consumption and unpaid family workers are also classified in this category. The remuneration for the labour of these categories of workers should be included in mixed income, the balancing item calculated as a residual.
Taxes on production include motor vehicle licenses, assessment rates and the land tax levied in the Western Cape. A similar tax is considered for introduction countrywide.
Subsidies comprise support from government to producers. The agricultural subsidies that existed previously have largely been dismantled and the annual amounts are decreasing.

P0441 13
Practice in SA Stats SA, in agreement with SARB, did not adopt the recommendations of the 1993 SNA regarding estimating the quarterly output of the agriculture industry. In the annual estimates, output is allocated to the year when the crops are harvested, the animals slaughtered, etc. This method has now also been implemented in the quarterly estimates. It has resulted in time series that are lumpier than the previous estimates. This lumpiness is the valid and necessary result of the output concept adopted in conjunction with the inherent limitations of breaking up an annual process into quarters. Any mathematical smoothing of this lumpiness would be artificial and will remove the estimates from the original data. Smoothing should instead be achieved by appropriate seasonal adjustment techniques.
The reasons for not adopting the recommendations of the 1993 SNA are the following:
• Lack of reliable and comprehensive data on the quarterly distribution of costs for different agricultural products. Although it is possible to estimate quarterly output for the various agricultural products separately, intermediate consumption and compensation of employees are estimated only for the total agriculture industry and not per agriculture product. An alternative – actually applied by other countries – would be to distribute the value of the harvests evenly over the period from planting to harvesting it (the “divide-by-four” method).
• Difficulties related to estimating the harvest in advance. Estimates of work-in-progress would require forecasts of harvests at an early stage. Thus, substantial revisions of preliminary annual estimates would be a likely consequence of the recommendation of the 1993 SNA.
• Unlike other producers, farmers do not usually record their own work-in-progress. This can be explained by uncertainty in what the final output will be; the farmers themselves react to this uncertainty by behaving as the work-in-progress were not output – and thus not generating income. Hence, estimates of work-in-progress may not help in understanding economic developments.
Sources/methods The estimates are done by Stats SA regarding the value added by the agriculture industry, based on estimates from the National Department of Agriculture (NDA) (cf. statistical sources and methods, page 44).
Quarterly data collected by the NDA consists mainly of the volume of agricultural products delivered to marketing organisations, payments made by these organisations to producers and prices received by producers. Thus, these quarterly data refer to gross income rather than value of output. However, the NDA estimates the quarterly distributions of the harvest of field crops and fruit. For vegetables and animal products the quarterly gross income data are taken as approximations of output.
The NDA provides separate estimates of annual output. These annual estimates sets a restriction to the quarterly estimates in that the latter must be adjusted to agree with the annual totals.
The NDA compiles quarterly data regarding intermediate consumption and wages and salaries.

P0441 14
Estimates at constant prices of the value added by the agriculture industry are made through using double deflation, i.e. output and intermediate consumption are each deflated by separate price indices. This is the case for both the annual and quarterly estimates although less detail are used in the latter.
Seasonal adjustment Seasonal adjustment intends to remove the effects of regular seasonal fluctuations – caused by weather, habits, legislation, etc. – from time series so that changes in trends and business cycles can be more clearly recognised. A seasonally adjusted time series still includes irregular variations. Stats SA applies a method known as X11. However, this method, tested with different options, produces erratic time series for the agriculture industry with occasional huge changes from one quarter to another. It can be argued that the irregular component is frequently too big for a meaningful seasonal adjustment of the value added by the agriculture industry. Furthermore, the production of many agricultural products is an annual process and, as stated above, there are inherent limitations in breaking this up into quarters. Instead of seasonal adjustment of a lumpy quarterly time series, Stats SA has chosen to use a numerical smoothing technique for constructing synthetic quarterly data based on past trends in annual data.

P0441 15
Notes
Forthcoming issues
Issue
Fourth quarter of 2000 First quarter of 2001 Second quarter of 2001 Annual estimates 1993-2000 and the third quarter of 2001
Expected date of publication
27 February 2001 29 May 2001 28 August 2001 27 November 2001
Changes in the next issue
The statistical release containing the GDP estimates for the fourth quarter of 2000, which will be published on Tuesday, 27 February 2001, will only include the quarterly estimates as from 1993 onwards and not the full set of annual and quarterly accounts as published in this statistical release.
Please note that the GDP estimates will in future be published on the last Tuesday of the second month following the end of the relevant quarter.

P0441 16
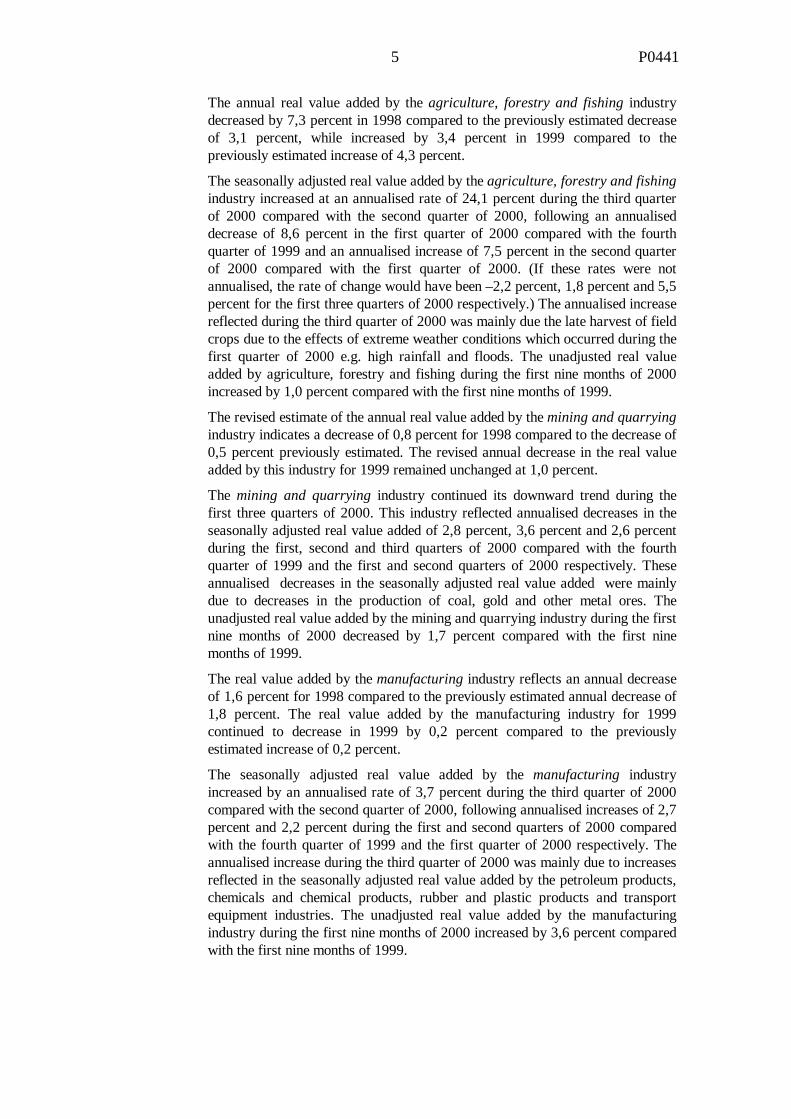
Table 1 - Quarterly gross domestic product by industry at constant 1995 prices (R million)
Year Quar-ter
Agriculture, forestry and fishing
Mining and quarrying
Manu-facturing
Electricity and water
Construction Wholesale and retail trade; hotels and restaurants
Transport and com-munication
1993 22 366 35 782 97 114 16 133 14 804 66 121 38 507
1994 24 125 35 946 99 706 17 069 15 233 67 780 40 281
1995 19 317 34 830 106 180 17 408 15 774 71 768 44 538
1996 23 949 34 542 107 648 18 403 16 092 74 416 47 368
1997 24 314 35 118 110 248 19 206 16 571 74 749 50 885
1998 22 538 34 845 108 447 19 316 16 778 73 704 54 442
1999 23 305 34 499 108 283 19 688 16 136 74 675 58 558
1993 1 4 210 8 790 23 427 3 929 3 770 15 587 9 487
2 7 681 8 921 23 380 4 041 3 799 15 472 9 218
3 6 172 9 048 25 051 4 158 3 708 16 446 9 816
4 4 303 9 023 25 256 4 006 3 528 18 617 9 986
1994 1 4 115 8 869 23 568 4 147 3 802 15 800 9 788
2 9 771 8 935 23 793 4 298 3 878 15 925 9 603
3 6 373 9 086 25 753 4 411 3 819 16 800 10 339
4 3 867 9 056 26 592 4 212 3 735 19 254 10 550
1995 1 3 703 8 706 25 348 4 313 3 970 16 394 10 619
2 5 381 8 646 25 833 4 397 4 024 16 818 10 644
3 5 771 8 779 27 661 4 469 3 979 17 937 11 518
4 4 462 8 699 27 338 4 229 3 800 20 619 11 757
1996 1 4 067 8 602 25 917 4 446 4 047 17 330 11 448
2 9 058 8 543 26 118 4 560 4 095 17 600 11 339
3 6 487 8 699 27 770 4 747 4 060 18 454 12 186
4 4 338 8 698 27 843 4 650 3 890 21 031 12 395
1997 1 4 519 8 566 26 633 4 741 4 160 17 704 12 086
2 8 935 8 736 26 757 4 863 4 213 17 819 12 139
3 6 476 8 922 28 477 4 859 4 181 18 493 13 156
4 4 383 8 893 28 382 4 743 4 018 20 732 13 503
1998 1 4 478 8 718 26 799 4 753 4 259 17 604 13 029
2 8 510 8 704 26 529 4 891 4 303 17 711 13 025
3 6 013 8 728 27 622 4 878 4 230 18 217 13 998
4 3 538 8 696 27 497 4 795 3 985 20 172 14 391
1999 1 4 611 8 540 26 092 4 708 4 161 17 260 13 8452 9 242 8 600 26 062 4 892 4 135 17 720 13 995
3 6 178 8 685 27 868 5 016 4 038 18 597 15 186
4 3 273 8 674 28 260 5 072 3 801 21 099 15 532
2000 1 3 887 8 457 26 996 5 008 4 015 18 101 14 886
2 7 754 8 439 27 057 5 184 4 062 18 641 14 932
3 8 586 8 480 28 870 5 219 4 038 19 578 16 074
P0441 17
Table 1 - Quarterly gross domestic product by industry at constant 1995 prices(R million) (concluded)
Year Quar-ter
Finance, real estate and business services
Community, social and personal services
General government services
Other producers
Total value added at basic prices
Taxes less subsidies on products
GDP at market prices
Total value added at basic prices excluding agriculture
1993 76 580 11 341 79 366 13 556 471 670 43 217 514 887 449 304
1994 79 378 12 420 80 157 13 687 485 782 45 755 531 537 461 657
1995 82 162 13 690 80 831 13 855 500 352 47 746 548 099 481 035
1996 87 668 14 210 82 422 14 066 520 785 50 070 570 855 496 836
1997 91 454 13 971 82 860 14 298 533 674 51 429 585 103 509 361
1998 96 601 13 902 82 458 14 626 537 658 51 458 589 116 515 120
1999 102 721 14 186 81 879 14 919 548 849 51 315 600 164 525 545
1993 1 18 652 2 740 19 785 3 371 113 746 10 481 124 227 109 537
2 18 844 2 792 19 839 3 380 117 367 10 737 128 105 109 686
3 19 358 2 912 19 863 3 398 119 929 10 900 130 828 113 756
4 19 725 2 898 19 879 3 407 120 627 11 099 131 727 116 324
1994 1 19 043 2 862 19 978 3 409 115 382 11 073 126 455 111 267
2 19 493 3 040 20 015 3 418 122 168 11 367 133 535 112 397
3 20 161 3 210 20 124 3 426 123 502 11 542 135 044 117 130
4 20 680 3 308 20 040 3 434 124 729 11 773 136 502 120 862
1995 1 20 012 3 238 20 146 3 448 119 898 11 780 131 678 116 195
2 20 208 3 416 20 178 3 458 123 003 11 890 134 893 117 622
3 20 804 3 526 20 241 3 469 128 153 12 011 140 164 122 382
4 21 138 3 510 20 267 3 480 129 299 12 066 141 364 124 837
1996 1 20 865 3 575 20 544 3 497 124 337 12 427 136 764 120 270
2 21 477 3 532 20 564 3 510 130 397 12 451 142 848 121 339
3 22 377 3 555 20 634 3 523 132 491 12 529 145 020 126 004
4 22 949 3 549 20 680 3 537 133 560 12 663 146 224 129 222
1997 1 22 368 3 452 20 678 3 553 128 460 12 811 141 271 123 941
2 22 630 3 516 20 676 3 567 133 852 12 854 146 706 124 917
3 23 121 3 563 20 744 3 582 135 575 12 878 148 453 129 098
4 23 335 3 440 20 762 3 596 135 788 12 886 148 674 131 405
1998 1 22 917 3 388 20 665 3 626 130 236 12 853 143 088 125 758
2 23 727 3 471 20 600 3 648 135 117 12 881 147 998 126 607
3 24 673 3 548 20 625 3 667 136 198 12 857 149 056 130 186
4 25 285 3 496 20 568 3 685 136 107 12 868 148 975 132 569
1999 1 24 660 3 456 20 553 3 702 131 589 12 758 144 346 126 978
2 25 202 3 538 20 495 3 720 137 602 12 796 150 398 128 3603 26 022 3 620 20 468 3 739 139 418 12 857 152 275 133 239
4 26 837 3 572 20 363 3 757 140 241 12 905 153 146 136 968
2000 1 26 036 3 525 20 309 3 782 135 002 12 978 147 980 131 1152 26 519 3 614 20 234 3 807 140 243 13 103 153 346 132 489
3 27 330 3 711 20 226 3 834 145 946 13 173 159 120 137 361

P0441 18
Table 2 - Percentage change in the quarterly gross domestic product by industry at constant 1995 prices
Year1/ Quar-
ter2/
Agriculture, forestry and fishing
Mining and quarrying
Manu-facturing
Electricity and water
Construction Wholesale and retail trade; hotels and restaurants
Transport and com-munication
1994 7,9 0,5 2,7 5,8 2,9 2,5 4,6
1995 -19,9 -3,1 6,5 2,0 3,6 5,9 10,6
1996 24,0 -0,8 1,4 5,7 2,0 3,7 6,4
1997 1,5 1,7 2,4 4,4 3,0 0,4 7,4
1998 -7,3 -0,8 -1,6 0,6 1,2 -1,4 7,0
1999 3,4 -1,0 -0,2 1,9 -3,8 1,3 7,6
1994 1 -2,3 0,9 0,6 5,6 0,8 1,4 3,2
2 27,2 0,2 1,8 6,4 2,1 2,9 4,2
3 3,2 0,4 2,8 6,1 3,0 2,2 5,3
4 -10,1 0,4 5,3 5,1 5,9 3,4 5,6
1995 1 -10,0 -1,8 7,6 4,0 4,4 3,8 8,5
2 -44,9 -3,2 8,6 2,3 3,8 5,6 10,8
3 -9,4 -3,4 7,4 1,3 4,2 6,8 11,4
4 15,4 -3,9 2,8 0,4 1,8 7,1 11,4
1996 1 9,8 -1,2 2,2 3,1 1,9 5,7 7,8
2 68,3 -1,2 1,1 3,7 1,8 4,7 6,5
3 12,4 -0,9 0,4 6,2 2,0 2,9 5,8
4 -2,8 0,0 1,8 10,0 2,3 2,0 5,4
1997 1 11,1 -0,4 2,8 6,6 2,8 2,2 5,6
2 -1,4 2,3 2,4 6,6 2,9 1,2 7,1
3 -0,2 2,6 2,5 2,4 3,0 0,2 8,0
4 1,0 2,2 1,9 2,0 3,3 -1,4 8,9
1998 1 -0,9 1,8 0,6 0,2 2,4 -0,6 7,8
2 -4,8 -0,4 -0,9 0,6 2,1 -0,6 7,3
3 -7,2 -2,2 -3,0 0,4 1,2 -1,5 6,4
4 -19,3 -2,2 -3,1 1,1 -0,8 -2,7 6,6
1999 1 3,0 -2,0 -2,6 -0,9 -2,3 -2,0 6,3
2 8,6 -1,2 -1,8 0,0 -3,9 0,0 7,4
3 2,8 -0,5 0,9 2,8 -4,5 2,1 8,5
4 -7,5 -0,3 2,8 5,8 -4,6 4,6 7,9
2000 1 -15,7 -1,0 3,5 6,4 -3,5 4,9 7,5
2 -16,1 -1,9 3,8 6,0 -1,8 5,2 6,7
3 39,0 -2,4 3,6 4,1 0,0 5,3 5,8
1-33/1,0 -1,7 3,6 5,4 -1,8 5,1 6,7
1/ The percentage change is the growth rate from the previous year.
2/ The percentage change is the growth rate for a given quarter compared with the same quarter in the previous year.
3/ The percengate change is the growth rate for the first nine months of the year compared with the first nine months
of the previous year.

P0441 19
Table 2 - Percentage change in the quarterly gross domestic product by industry at constant 1995 prices (concluded)
Year1/ Quar-
ter2/
Finance, real estate and business services
Community, social and personal services
General government services
Other producers
Total value added at basic prices
Taxes less subsidies on products
GDP at market prices
Total value added at basic prices excluding agriculture
1994 3,7 9,5 1,0 1,0 3,0 5,9 3,2 2,7
1995 3,5 10,2 0,8 1,2 3,0 4,4 3,1 4,2
1996 6,7 3,8 2,0 1,5 4,1 4,9 4,2 3,3
1997 4,3 -1,7 0,5 1,6 2,5 2,7 2,5 2,5
1998 5,6 -0,5 -0,5 2,3 0,7 0,1 0,7 1,1
1999 6,3 2,0 -0,7 2,0 2,1 -0,3 1,9 2,0
1994 1 2,1 4,5 1,0 1,1 1,4 5,7 1,8 1,6
2 3,4 8,9 0,9 1,1 4,1 5,9 4,2 2,5
3 4,2 10,2 1,3 0,8 3,0 5,9 3,2 3,0
4 4,8 14,2 0,8 0,8 3,4 6,1 3,6 3,9
1995 1 5,1 13,2 0,8 1,1 3,9 6,4 4,1 4,4
2 3,7 12,4 0,8 1,2 0,7 4,6 1,0 4,6
3 3,2 9,8 0,6 1,3 3,8 4,1 3,8 4,5
4 2,2 6,1 1,1 1,3 3,7 2,5 3,6 3,3
1996 1 4,3 10,4 2,0 1,4 3,7 5,5 3,9 3,5
2 6,3 3,4 1,9 1,5 6,0 4,7 5,9 3,2
3 7,6 0,8 1,9 1,6 3,4 4,3 3,5 3,0
4 8,6 1,1 2,0 1,6 3,3 5,0 3,4 3,5
1997 1 7,2 -3,4 0,7 1,6 3,3 3,1 3,3 3,1
2 5,4 -0,4 0,5 1,6 2,6 3,2 2,7 2,9
3 3,3 0,2 0,5 1,7 2,3 2,8 2,4 2,5
4 1,7 -3,1 0,4 1,7 1,7 1,8 1,7 1,7
1998 1 2,5 -1,9 -0,1 2,1 1,4 0,3 1,3 1,5
2 4,8 -1,3 -0,4 2,3 0,9 0,2 0,9 1,4
3 6,7 -0,4 -0,6 2,4 0,5 -0,2 0,4 0,8
4 8,4 1,6 -0,9 2,5 0,2 -0,1 0,2 0,9
1999 1 7,6 2,0 -0,5 2,1 1,0 -0,7 0,9 1,0
2 6,2 2,0 -0,5 2,0 1,8 -0,7 1,6 1,4
3 5,5 2,0 -0,8 2,0 2,4 0,0 2,2 2,3
4 6,1 2,2 -1,0 2,0 3,0 0,3 2,8 3,3
2000 1 5,6 2,0 -1,2 2,1 2,6 1,7 2,5 3,3
2 5,2 2,1 -1,3 2,3 1,9 2,4 2,0 3,2
3 5,0 2,5 -1,2 2,5 4,7 2,5 4,5 3,1
1-33/5,3 2,2 -1,2 2,3 3,1 2,2 3,0 3,2
1/ The percentage change is the growth rate from the previous year.
2/ The percentage change is the growth rate for a given quarter compared with the same quarter in the previous year.
3/ The percengate change is the growth rate for the first nine months of the year compared with the first nine months of the previous year.

P0441 20
Table 3 - Seasonally adjusted and annualised quarterly gross domestic product by industry at constant 1995 prices (R million)
Year Quar-ter
Agriculture, forestry and fishing
Mining and quarrying
Manu-facturing
Electricity and water
Construction Wholesale and retail trade; hotels and restaurants
Transport and com-munication
1993 22 366 35 782 97 114 16 133 14 804 66 121 38 507
1994 24 125 35 946 99 706 17 069 15 233 67 780 40 281
1995 19 317 34 830 106 180 17 408 15 774 71 768 44 538
1996 23 949 34 542 107 648 18 403 16 092 74 416 47 368
1997 24 314 35 118 110 248 19 206 16 571 74 749 50 885
1998 22 538 34 845 108 447 19 316 16 778 73 704 54 442
1999 23 305 34 499 108 283 19 688 16 136 74 675 58 558
1993 1 15 964 35 572 96 534 15 751 15 044 65 824 38 150
2 20 564 35 708 96 506 16 002 14 869 65 860 38 314
3 25 440 35 800 97 654 16 274 14 681 66 221 38 538
4 27 496 36 048 97 762 16 505 14 622 66 579 39 026
1994 1 23 432 35 928 97 674 16 732 15 008 66 916 39 467
2 23 532 35 808 98 314 17 072 15 115 67 666 40 039
3 23 980 35 976 100 102 17 208 15 292 67 846 40 495
4 25 556 36 072 102 734 17 264 15 517 68 692 41 123
1995 1 22 836 35 184 104 734 17 425 15 689 69 748 42 596
2 19 324 34 736 106 694 17 569 15 705 71 087 44 244
3 17 552 34 716 107 114 17 369 15 819 72 334 45 336
4 17 556 34 684 106 178 17 269 15 883 73 903 45 976
1996 1 20 732 34 673 106 694 17 741 15 910 73 653 46 337
2 24 048 34 593 107 770 18 038 16 076 74 595 46 865
3 25 400 34 445 107 914 18 661 16 171 74 552 47 785
4 25 616 34 461 108 214 19 172 16 211 74 864 48 485
1997 1 24 357 34 543 109 558 19 196 16 372 74 733 49 198
2 24 623 35 030 110 574 19 247 16 544 74 980 50 288
3 24 447 35 416 110 444 19 143 16 646 74 743 51 435
4 23 828 35 482 110 415 19 238 16 722 74 541 52 619
1998 1 22 991 35 273 110 094 19 303 16 804 74 703 53 205
2 22 338 34 968 109 148 19 366 16 858 74 215 54 024
3 22 212 34 608 107 421 19 264 16 797 73 479 54 737
4 22 612 34 535 107 126 19 331 16 650 72 419 55 803
1999 1 22 974 34 542 107 140 19 162 16 429 73 330 56 642
2 23 123 34 539 107 321 19 369 16 204 74 275 58 040
3 23 379 34 465 108 537 19 823 16 026 75 142 59 359
4 23 742 34 450 110 131 20 398 15 884 75 954 60 187
2000 1 23 213 34 203 110 853 20 406 15 857 76 989 60 959
2 23 639 33 889 111 461 20 529 15 918 78 111 61 925
3 24 949 33 664 112 478 20 621 16 017 79 123 62 806

P0441 21
Table 3 - Seasonally adjusted and annualised quarterly gross domestic product by industry at constant 1995 prices (R million) (concluded)
Year Quar-ter
Finance, real estate and business services
Community, social and personal services
General government services
Other producers
Total value added at basic prices
Taxes less subsidies on products
GDP at market prices
Total value added at basic prices excluding agriculture
1993 76 580 11 341 79 366 13 556 471 670 43 217 514 887 449 304
1994 79 378 12 420 80 157 13 687 485 782 45 755 531 537 461 657
1995 82 162 13 690 80 831 13 855 500 352 47 746 548 099 481 035
1996 87 668 14 210 82 422 14 066 520 785 50 070 570 855 496 836
1997 91 454 13 971 82 860 14 298 533 674 51 429 585 103 509 361
1998 96 601 13 902 82 458 14 626 537 658 51 458 589 116 515 120
1999 102 721 14 186 81 879 14 919 548 849 51 315 600 164 525 545
1993 1 76 388 11 293 79 411 13 528 463 459 42 621 506 080 447 495
2 76 576 11 329 79 412 13 544 468 684 42 947 511 631 448 120
3 76 632 11 357 79 436 13 564 475 597 43 398 518 995 450 157
4 76 724 11 385 79 205 13 588 478 940 43 900 522 840 451 444
1994 1 77 689 11 745 79 596 13 616 477 803 44 293 522 096 454 371
2 78 970 12 190 79 935 13 656 482 297 45 463 527 760 458 765
3 79 982 12 634 80 302 13 708 487 525 46 170 533 695 463 545
4 80 871 13 111 80 795 13 768 495 503 47 097 542 600 469 947
1995 1 81 337 13 356 80 734 13 804 497 443 47 121 544 564 474 607
2 81 837 13 585 80 807 13 840 499 428 47 554 546 982 480 104
3 82 509 13 809 80 865 13 876 501 299 48 044 549 343 483 747
4 82 965 14 010 80 922 13 900 503 246 48 265 551 511 485 690
1996 1 84 644 14 117 81 623 13 960 510 084 48 907 558 991 489 352
2 86 609 14 177 82 241 14 036 519 048 50 006 569 054 495 000
3 88 685 14 245 82 736 14 108 524 702 50 416 575 118 499 302
4 90 738 14 301 83 088 14 160 529 310 50 951 580 261 503 694
1997 1 91 092 14 173 83 100 14 201 530 523 51 236 581 759 506 166
2 91 408 14 057 82 947 14 267 533 966 51 420 585 386 509 343
3 91 536 13 909 82 762 14 332 534 811 51 511 586 322 510 364
4 91 784 13 745 82 631 14 390 535 395 51 549 586 944 511 568
1998 1 93 436 13 820 82 659 14 506 536 792 51 564 588 356 513 802
2 95 870 13 873 82 570 14 591 537 821 51 537 589 358 515 483
3 97 783 13 933 82 361 14 669 537 263 51 327 588 590 515 051
4 99 319 13 984 82 242 14 739 538 760 51 404 590 164 516 148
1999 1 100 573 14 088 82 217 14 808 541 905 51 182 593 087 518 931
2 101 795 14 145 82 103 14 881 545 794 51 133 596 927 522 671
3 103 124 14 210 81 818 14 955 550 837 51 367 602 204 527 458
4 105 393 14 302 81 378 15 030 556 848 51 582 608 430 533 106
2000 1 106 191 14 368 81 276 15 126 559 442 51 938 611 380 536 229
2 107 095 14 447 81 099 15 228 563 340 52 290 615 630 539 701
3 108 311 14 563 80 856 15 335 568 724 52 740 621 464 543 775

P0441 22
Table 4 - Annualised percentage change in the seasonally adjusted quarterly gross domestic product by industry at constant 1995 prices
Year1/ Quar-
ter2/
Agriculture, forestry and fishing
Mining and quarrying
Manu-facturing
Electricity and water
Construction Wholesale and retail trade; hotels and restaurants
Transport and com-munication
1994 7,9 0,5 2,7 5,8 2,9 2,5 4,6
1995 -19,9 -3,1 6,5 2,0 3,6 5,9 10,6
1996 24,0 -0,8 1,4 5,7 2,0 3,7 6,4
1997 1,5 1,7 2,4 4,4 3,0 0,4 7,4
1998 -7,3 -0,8 -1,6 0,6 1,2 -1,4 7,0
1999 3,4 -1,0 -0,2 1,9 -3,8 1,3 7,6
1993 2 175,3 1,5 -0,1 6,5 -4,6 0,2 1,7
3 134,2 1,0 4,8 7,0 -5,0 2,2 2,4
4 36,5 2,8 0,4 5,8 -1,6 2,2 5,2
1994 1 -47,3 -1,3 -0,4 5,6 11,0 2,0 4,6
2 1,7 -1,3 2,6 8,4 2,9 4,6 5,9
3 7,8 1,9 7,5 3,2 4,8 1,1 4,6
4 29,0 1,1 10,9 1,3 6,0 5,1 6,3
1995 1 -36,2 -9,5 8,0 3,8 4,5 6,3 15,1
2 -48,7 -5,0 7,7 3,3 0,4 7,9 16,4
3 -31,9 -0,2 1,6 -4,5 2,9 7,2 10,2
4 0,1 -0,4 -3,4 -2,3 1,6 9,0 5,8
1996 1 94,5 -0,1 2,0 11,4 0,7 -1,3 3,2
2 81,0 -0,9 4,1 6,9 4,2 5,2 4,6
3 24,5 -1,7 0,5 14,5 2,4 -0,2 8,1
4 3,4 0,2 1,1 11,4 1,0 1,7 6,0
1997 1 -18,3 1,0 5,1 0,5 4,0 -0,7 6,0
2 4,5 5,8 3,8 1,1 4,3 1,3 9,2
3 -2,8 4,5 -0,5 -2,1 2,5 -1,3 9,4
4 -9,8 0,8 -0,1 2,0 1,9 -1,1 9,5
1998 1 -13,3 -2,3 -1,2 1,4 2,0 0,9 4,5
2 -10,9 -3,4 -3,4 1,3 1,3 -2,6 6,3
3 -2,2 -4,1 -6,2 -2,1 -1,4 -3,9 5,4
4 7,4 -0,8 -1,1 1,4 -3,4 -5,6 8,0
1999 1 6,6 0,1 0,1 -3,5 -5,2 5,1 6,2
2 2,6 0,0 0,7 4,4 -5,4 5,3 10,2
3 4,5 -0,9 4,6 9,7 -4,3 4,8 9,4
4 6,4 -0,2 6,0 12,1 -3,5 4,4 5,7
2000 1 -8,6 -2,8 2,7 0,2 -0,7 5,6 5,2
2 7,5 -3,6 2,2 2,4 1,5 6,0 6,5
3 24,1 -2,6 3,7 1,8 2,5 5,3 5,8
1/ The percentage change is the growth rate from the previous year.
2/ The annualised percentage change is the growth rate for a given quarter from the previous quarter and compounded to an annual rate.

P0441 23
Table 4 - Annualised percentage change in the seasonally adjusted quarterly gross domestic product by industry at constant 1995 prices (concluded)
Year1/ Quar-
ter2/
Finance, real estate and business services
Community, social and personal services
General government services
Other producers
Total value added at basic prices
Taxes less subsidies on products
GDP at market prices
Total value added at basic prices excluding agriculture
1994 3,7 9,5 1,0 1,0 3,0 5,9 3,2 2,7
1995 3,5 10,2 0,8 1,2 3,0 4,4 3,1 4,2
1996 6,7 3,8 2,0 1,5 4,1 4,9 4,2 3,3
1997 4,3 -1,7 0,5 1,6 2,5 2,7 2,5 2,5
1998 5,6 -0,5 -0,5 2,3 0,7 0,1 0,7 1,1
1999 6,3 2,0 -0,7 2,0 2,1 -0,3 1,9 2,0
1993 2 1,0 1,3 0,0 0,5 4,6 3,1 4,5 0,6
3 0,3 1,0 0,1 0,6 6,0 4,3 5,9 1,8
4 0,5 1,0 -1,2 0,7 2,8 4,7 3,0 1,1
1994 1 5,1 13,3 2,0 0,8 -0,9 3,6 -0,6 2,6
2 6,8 16,0 1,7 1,2 3,8 11,0 4,4 3,9
3 5,2 15,4 1,8 1,5 4,4 6,4 4,6 4,2
4 4,5 16,0 2,5 1,8 6,7 8,3 6,8 5,6
1995 1 2,3 7,7 -0,3 1,1 1,6 0,2 1,5 4,0
2 2,5 7,0 0,4 1,0 1,6 3,7 1,8 4,7
3 3,3 6,8 0,3 1,0 1,5 4,2 1,7 3,1
4 2,2 6,0 0,3 0,7 1,6 1,9 1,6 1,6
1996 1 8,3 3,1 3,5 1,7 5,5 5,4 5,5 3,1
2 9,6 1,7 3,1 2,2 7,2 9,3 7,4 4,7
3 9,9 1,9 2,4 2,1 4,4 3,3 4,3 3,5
4 9,6 1,6 1,7 1,5 3,6 4,3 3,6 3,6
1997 1 1,6 -3,5 0,1 1,2 0,9 2,3 1,0 2,0
2 1,4 -3,2 -0,7 1,9 2,6 1,4 2,5 2,5
3 0,6 -4,1 -0,9 1,8 0,6 0,7 0,6 0,8
4 1,1 -4,6 -0,6 1,6 0,4 0,3 0,4 0,9
1998 1 7,4 2,2 0,1 3,3 1,0 0,1 1,0 1,8
2 10,8 1,5 -0,4 2,4 0,8 -0,2 0,7 1,3
3 8,2 1,8 -1,0 2,1 -0,4 -1,6 -0,5 -0,3
4 6,4 1,5 -0,6 1,9 1,1 0,6 1,1 0,9
1999 1 5,1 3,0 -0,1 1,9 2,4 -1,7 2,0 2,2
2 4,9 1,6 -0,6 2,0 2,9 -0,4 2,6 2,9
3 5,3 1,9 -1,4 2,0 3,7 1,8 3,6 3,7
4 9,1 2,6 -2,1 2,0 4,4 1,7 4,2 4,4
2000 1 3,1 1,9 -0,5 2,6 1,9 2,8 2,0 2,4
2 3,4 2,2 -0,9 2,7 2,8 2,7 2,8 2,6
3 4,6 3,2 -1,2 2,8 3,9 3,5 3,8 3,1
1/ The percentage change is the growth rate from the previous year.
2/ The annualised percentage change is the growth rate for a given quarter from the previous quarter and compounded to an annual rate.

P0441 24
Table 5 - Quarterly gross domestic product by industry at current prices (R million)
Year Quar-ter
Agriculture, forestry and fishing
Mining and quarrying
Manu-facturing
Electricity and water
Construction Wholesale and retail trade; hotels and restaurants
Transport and com-munication
1993 16 284 30 052 82 642 13 930 12 318 56 468 33 972
1994 20 252 32 111 92 068 15 975 13 797 62 474 38 296
1995 19 317 34 830 106 180 17 408 15 774 71 768 44 538
1996 23 721 38 768 114 127 18 128 17 631 79 463 51 787
1997 25 325 40 524 124 604 20 387 19 386 85 858 57 765
1998 24 452 43 445 129 057 20 965 20 682 89 222 63 498
1999 24 555 44 186 135 952 21 408 21 263 95 159 71 340
1993 1 2 818 6 684 19 346 3 329 3 015 13 279 8 221
2 5 506 7 621 19 802 3 471 3 133 13 108 8 091
3 4 429 8 101 21 539 3 706 2 998 13 977 8 711
4 3 530 7 646 21 955 3 423 3 172 16 104 8 950
1994 1 3 381 7 572 21 418 3 586 3 547 14 580 9 865
2 7 083 8 372 21 893 3 941 3 534 14 432 9 382
3 5 440 8 466 24 125 4 358 3 321 15 431 9 480
4 4 349 7 701 24 632 4 090 3 394 18 032 9 569
1995 1 3 842 7 929 24 312 4 177 3 929 16 512 9 987
2 5 526 8 888 25 513 4 345 4 046 16 711 10 672
3 5 569 9 385 27 939 4 619 3 867 17 804 11 624
4 4 380 8 628 28 415 4 268 3 931 20 741 12 256
1996 1 4 070 8 868 26 831 4 314 4 497 18 662 12 210
2 8 701 10 061 27 628 4 528 4 546 18 507 12 404
3 6 256 10 339 29 558 4 851 4 255 19 514 13 304
4 4 693 9 500 30 110 4 435 4 333 22 780 13 869
1997 1 4 942 9 517 29 218 4 714 4 798 20 014 13 505
2 9 406 10 358 30 703 5 215 4 897 20 414 14 004
3 6 441 10 726 32 240 5 395 4 881 21 277 15 014
4 4 536 9 923 32 443 5 062 4 810 24 154 15 242
1998 1 5 288 9 487 30 936 4 946 5 111 20 866 14 511
2 9 014 11 143 31 571 5 447 5 241 21 582 15 532
3 6 404 11 830 33 217 5 455 5 222 22 069 16 331
4 3 747 10 985 33 333 5 116 5 108 24 705 17 125
1999 1 4 858 10 225 31 816 4 895 5 357 21 783 16 240
2 9 619 11 201 32 659 5 392 5 367 22 447 17 360
3 6 528 11 461 35 312 5 923 5 329 23 574 18 446
4 3 550 11 300 36 165 5 198 5 210 27 355 19 295
2000 1 4 371 11 878 34 602 5 287 5 505 23 632 18 172
2 8 485 13 430 35 608 5 818 5 524 24 462 19 478
3 9 003 13 016 38 827 6 210 5 616 25 780 20 673

P0441 25
Table 5 - Quarterly gross domestic product by industry at current prices (R million) (concluded)
Year Quar-ter
Finance, real estate and business services
Community, social and personal services
General government services
Other producers
Total value added at basic prices
Taxes less subsidies on products
GDP at market prices
1993 62 861 9 435 62 375 10 505 390 841 35 291 426 132
1994 70 491 11 349 71 278 12 054 440 144 41 974 482 119
1995 82 162 13 690 80 831 13 855 500 353 47 746 548 099
1996 94 116 15 368 97 196 15 671 565 976 52 438 618 415
1997 109 601 17 374 106 792 17 803 625 420 58 326 683 746
1998 123 369 19 093 116 443 20 154 670 381 64 700 735 082
1999 141 928 21 119 123 809 22 527 723 247 72 329 795 576
1993 1 15 037 2 208 14 571 2 504 91 010 6 805 97 815
2 15 422 2 316 15 520 2 578 96 569 8 149 104 718
3 16 061 2 458 15 894 2 671 100 546 10 001 110 547
4 16 342 2 453 16 390 2 751 102 715 10 336 113 051
1994 1 17 027 2 667 16 963 2 880 103 486 10 281 113 767
2 17 297 2 783 17 660 2 967 109 343 9 339 118 682
3 17 919 2 952 18 058 3 061 112 612 9 644 122 255
4 18 248 2 947 18 597 3 145 114 703 12 711 127 414
1995 1 19 826 3 220 19 773 3 299 116 805 12 013 128 818
2 20 264 3 371 20 105 3 409 122 850 11 229 134 078
3 20 957 3 564 20 340 3 532 129 199 12 211 141 410
4 21 115 3 536 20 614 3 615 131 500 12 294 143 794
1996 1 22 506 3 607 22 431 3 721 131 718 12 898 144 616
2 23 325 3 800 24 864 3 854 142 217 12 308 154 525
3 24 070 3 994 24 921 3 996 145 060 13 800 158 860
4 24 214 3 967 24 980 4 100 146 981 13 432 160 414
1997 1 25 868 4 091 25 172 4 263 146 102 14 520 160 623
2 27 224 4 296 26 411 4 388 157 317 13 067 170 384
3 28 091 4 512 27 156 4 522 160 255 14 969 175 224
4 28 418 4 474 28 053 4 630 161 745 15 770 177 515
1998 1 29 925 4 553 28 575 4 776 158 974 16 033 175 007
2 30 905 4 715 29 021 4 911 169 083 15 107 184 190
3 31 752 4 962 29 258 5 146 171 644 16 455 188 099
4 30 788 4 864 29 589 5 321 170 680 17 104 187 785
1999 1 34 641 5 010 30 467 5 452 170 745 18 166 188 911
2 34 826 5 156 30 855 5 560 180 441 15 940 196 382
3 35 924 5 550 31 084 5 685 184 814 18 531 203 346
4 36 538 5 403 31 403 5 830 187 246 19 691 206 938
2000 1 38 526 5 548 31 901 5 968 185 391 19 828 205 219
2 39 608 5 758 32 105 6 165 196 440 17 876 214 316
3 41 310 6 193 32 695 6 261 205 585 20 575 226 160

P0441 26
Table 6 - Quarterly compensation of employees (R million)
Year Quar-ter
Agriculture, forestry and fishing
Mining and quarrying
Manu-facturing
Electricity and water
Construction Wholesale and retail trade; hotels and restaurants
Transport and com-munication
1993 5 069 15 827 46 111 3 906 9 577 29 174 17 811
1994 5 680 16 516 50 761 4 317 9 954 31 373 19 364
1995 6 406 18 452 56 484 4 943 10 909 35 343 22 275
1996 6 908 19 969 59 965 5 811 11 414 38 417 25 338
1997 7 419 22 061 63 532 6 355 11 995 42 132 27 479
1998 7 911 22 622 70 678 6 910 13 073 45 067 30 696
1999 8 387 23 203 74 404 7 741 13 269 48 243 32 288
1993 1 1 232 3 927 11 000 874 2 291 6 707 4 160
2 1 312 3 889 10 666 963 2 344 6 979 4 381
3 1 307 4 017 11 345 1 013 2 340 7 096 4 508
4 1 217 3 994 13 100 1 056 2 602 8 393 4 762
1994 1 1 377 3 983 11 844 942 2 423 7 199 4 534
2 1 476 3 984 11 626 1 066 2 426 7 424 4 761
3 1 469 4 212 12 683 1 123 2 414 7 737 4 918
4 1 358 4 337 14 608 1 185 2 691 9 013 5 152
1995 1 1 550 4 314 13 123 1 086 2 600 7 998 5 046
2 1 667 4 392 13 157 1 222 2 675 8 433 5 525
3 1 660 4 712 14 055 1 285 2 680 8 756 5 678
4 1 528 5 034 16 148 1 350 2 954 10 155 6 026
1996 1 1 672 4 880 14 274 1 280 2 727 9 157 5 880
2 1 798 4 780 14 142 1 428 2 769 9 137 6 287
3 1 790 5 002 15 031 1 507 2 830 9 415 6 398
4 1 648 5 307 16 518 1 596 3 088 10 708 6 773
1997 1 1 795 5 364 14 916 1 409 2 801 9 771 6 586
2 1 932 5 254 15 179 1 574 2 926 10 000 6 742
3 1 923 5 554 15 851 1 640 2 983 10 400 6 884
4 1 769 5 889 17 586 1 732 3 285 11 962 7 266
1998 1 1 914 5 654 16 468 1 524 3 036 10 412 7 225
2 2 060 5 475 16 873 1 701 3 179 10 397 7 663
3 2 051 5 583 17 477 1 781 3 260 11 118 7 710
4 1 887 5 909 19 859 1 905 3 598 13 140 8 098
1999 1 2 082 5 663 17 583 1 813 3 209 11 052 7 632
2 2 220 5 650 17 967 1 850 3 232 11 781 8 012
3 2 138 5 763 18 330 1 873 3 251 11 949 8 144
4 1 946 6 126 20 524 2 205 3 577 13 461 8 501
2000 1 2 140 5 947 18 424 1 975 3 224 11 697 8 110
2 2 328 5 943 18 910 2 017 3 234 12 436 8 570
3 2 178 6 083 19 409 2 094 3 354 12 647 8 700

P0441 27
Table 6 - Quarterly compensation of employees (R million) (concluded)
Year Quar-ter
Finance, real estate and business services
Community, social and personal services
General government services
Other producers
Total compen-sation of employees
1993 21 035 4 087 55 255 10 306 218 159
1994 23 931 5 001 63 435 11 833 242 166
1995 28 136 6 100 72 021 13 607 274 676
1996 31 676 6 870 87 301 15 395 309 065
1997 36 689 7 772 95 845 17 496 338 775
1998 41 915 8 538 104 533 19 819 371 762
1999 48 580 9 469 110 830 22 168 398 582
1993 1 4 831 957 12 855 2 456 51 291
2 5 137 1 003 13 753 2 530 52 956
3 5 360 1 065 14 092 2 621 54 763
4 5 707 1 062 14 555 2 699 59 148
1994 1 5 466 1 175 15 085 2 827 56 855
2 5 873 1 226 15 726 2 913 58 501
3 6 085 1 301 16 056 3 005 61 003
4 6 508 1 299 16 568 3 087 65 807
1995 1 6 430 1 435 17 657 3 240 64 480
2 6 953 1 502 17 928 3 348 66 802
3 7 160 1 588 18 107 3 469 69 150
4 7 587 1 576 18 329 3 550 74 238
1996 1 7 207 1 613 20 073 3 655 72 416
2 7 843 1 699 22 415 3 786 76 085
3 8 075 1 785 22 410 3 926 78 169
4 8 551 1 773 22 403 4 028 82 395
1997 1 8 418 1 830 22 521 4 190 79 601
2 9 160 1 922 23 695 4 312 82 696
3 9 246 2 019 24 386 4 444 85 330
4 9 864 2 001 25 243 4 551 91 147
1998 1 9 813 2 036 25 706 4 697 88 485
2 10 445 2 108 26 096 4 829 90 827
3 10 729 2 219 26 220 5 061 93 208
4 10 928 2 175 26 511 5 233 99 242
1999 1 11 570 2 246 27 341 5 365 95 558
2 12 088 2 312 27 665 5 472 98 248
3 12 353 2 488 27 775 5 594 99 659
4 12 569 2 423 28 049 5 737 105 118
2000 1 12 745 2 503 28 460 5 873 101 098
2 13 340 2 601 28 578 6 068 104 025
3 13 577 2 803 29 067 6 160 106 071

P0441 28
Table 7 - Quarterly gross operating surplus and net other taxes on production1/ (R million)
Year Quar-ter
Agriculture, forestry and fishing
Mining and quarrying
Manu-facturing
Electricity and water
Construction Wholesale and retail trade; hotels and restaurants
Transport and com-munication
1993 12 114 13 951 36 839 9 839 2 610 25 882 15 895
1994 15 179 15 249 41 213 11 468 3 704 29 544 18 677
1995 13 467 15 963 49 416 12 269 4 719 34 716 22 054
1996 17 284 18 350 54 140 12 113 6 060 39 154 26 421
1997 18 360 17 957 60 873 13 816 7 219 41 645 30 222
1998 16 884 20 111 58 064 13 839 7 421 41 883 32 536
1999 16 455 20 983 61 216 13 445 7 799 44 492 38 685
1993 1 1 741 2 695 8 418 2 411 691 6 240 3 996
2 4 498 3 663 9 210 2 462 756 5 802 3 646
3 3 367 4 010 10 274 2 645 626 6 532 4 135
4 2 508 3 583 8 937 2 322 537 7 308 4 117
1994 1 2 105 3 507 9 552 2 601 1 089 7 018 5 266
2 5 819 4 298 10 245 2 827 1 072 6 648 4 559
3 4 134 4 163 11 418 3 183 874 7 309 4 500
4 3 121 3 281 9 999 2 856 669 8 570 4 353
1995 1 2 402 3 520 11 125 3 044 1 292 8 120 4 894
2 4 018 4 390 12 289 3 074 1 333 7 880 5 097
3 4 069 4 561 13 810 3 282 1 152 8 624 5 891
4 2 978 3 492 12 192 2 870 941 10 092 6 172
1996 1 2 479 3 885 12 552 2 985 1 731 9 061 6 324
2 7 076 5 164 13 481 3 049 1 736 8 929 6 110
3 4 591 5 218 14 521 3 290 1 387 9 635 6 899
4 3 138 4 083 13 587 2 789 1 206 11 529 7 088
1997 1 3 235 4 035 14 256 3 255 1 955 9 758 6 903
2 7 644 4 975 15 474 3 587 1 928 9 919 7 246
3 4 633 5 038 16 337 3 698 1 854 10 361 8 113
4 2 848 3 910 14 806 3 276 1 482 11 607 7 959
1998 1 3 448 3 677 14 393 3 372 2 028 9 922 7 225
2 7 080 5 485 14 620 3 691 2 015 10 636 7 804
3 4 443 6 052 15 659 3 618 1 915 10 389 8 553
4 1 912 4 896 13 392 3 159 1 463 10 936 8 955
1999 1 2 834 4 562 14 155 3 031 1 886 10 176 8 524
2 7 508 5 551 14 612 3 485 1 840 10 094 9 259
3 4 465 5 698 16 896 3 988 1 938 11 025 10 207
4 1 648 5 174 15 553 2 940 2 135 13 197 10 695
2000 1 2 231 5 931 16 026 3 311 2 150 11 935 10 062
2 6 156 7 487 16 541 3 801 2 423 12 027 10 908
3 6 825 6 933 19 246 4 116 2 377 13 133 11 974
1/ Net other taxes on production equals other taxes on production minus other subsidies on production.

P0441 29
Table 7 - Quarterly gross operating surplus and net other taxes on production1/ (R million) (concluded)
Year Quar-ter
Finance, real estate and business services
Community, social and personal services
General government services
Other producers
Total gross operating surplus
1993 38 406 4 762 6 683 199 167 181
1994 42 601 5 720 7 383 221 190 960
1995 49 355 7 009 8 301 248 217 517
1996 57 060 7 932 9 323 276 248 114
1997 67 302 9 006 10 320 307 277 027
1998 75 335 9 991 11 202 335 287 601
86 587 11 026 12 218 359 313 267
1993 1 9 388 1 115 1 614 47 38 356
2 9 447 1 169 1 658 49 42 360
3 9 826 1 240 1 691 51 44 398
4 9 745 1 238 1 720 52 42 067
1994 1 10 605 1 344 1 768 53 44 909
2 10 453 1 403 1 820 54 49 199
3 10 828 1 488 1 885 56 49 837
4 10 715 1 485 1 909 58 47 016
1995 1 12 269 1 648 1 986 59 50 360
2 12 159 1 726 2 047 61 54 074
3 12 606 1 824 2 106 63 57 988
4 12 328 1 810 2 162 65 55 101
1996 1 14 013 1 862 2 226 66 57 184
2 14 148 1 961 2 303 68 64 026
3 14 619 2 061 2 364 70 64 656
4 14 279 2 047 2 430 72 62 249
1997 1 16 126 2 121 2 505 74 64 222
2 16 670 2 227 2 558 76 72 303
3 17 407 2 339 2 608 78 72 467
4 17 099 2 319 2 649 80 68 036
1998 1 18 628 2 382 2 704 79 67 859
2 18 927 2 467 2 758 82 75 564
3 19 448 2 596 2 829 86 75 586
4 18 333 2 545 2 911 88 68 591
1999 1 21 421 2 616 2 953 87 72 246
2 21 080 2 692 3 019 89 79 228
3 21 859 2 897 3 088 91 82 152
4 22 228 2 821 3 158 93 79 641
2000 1 25 782 3 044 3 442 95 84 010
2 26 268 3 157 3 527 96 92 390
3 27 734 3 390 3 628 101 99 457
1/ Net other taxes on production equals other taxes on production minus other
subsidies on production.

P0441 30
Table 8 - Annual gross domestic product by industry at current prices (R million)
Industry 1993 1994 1995 1996 1997 1998 1999
Agriculture, forestry and fishing 16 284 20 252 19 317 23 721 25 325 24 452 24 555
Agriculture 13 579 17 216 15 863 19 922 21 551 20 500 20 113
Forestry 2 280 2 628 2 967 3 238 3 244 3 390 3 858
Fishing 424 408 487 562 530 561 584
Mining and quarrying 30 052 32 111 34 830 38 768 40 524 43 445 44 186
Coal mining 5 128 5 565 6 777 7 835 8 589 9 312 9 288
Gold mining 15 413 15 944 14 135 17 136 16 373 16 489 15 291
Mining of other metal ores 6 300 6 776 7 855 8 799 10 394 12 500 14 532 Other mining and quarrying 1/ 3 211 3 825 6 062 4 997 5 168 5 144 5 075
Primary industries 46 335 52 363 54 147 62 488 65 849 67 897 68 741
Manufacturing 82 642 92 068 106 180 114 127 124 604 129 057 135 952
Food, beverages and tobacco 13 934 15 498 17 368 18 985 21 000 22 200 23 596
Textiles, clothing and leather goods 5 856 6 403 7 059 7 106 7 526 7 524 8 101
Wood and paper; publishing and printing 8 090 8 908 11 156 11 440 12 518 12 605 14 388
Petroleum products, chemicals, rubber and plastic 15 382 17 118 19 309 21 614 23 935 26 245 28 409
Other non-metal mineral products 3 351 3 789 4 315 4 495 4 932 4 667 4 697
Metals, metal products, machinery and equipment 16 766 18 963 22 747 25 325 28 109 28 314 27 038
Electrical machinery and apparatus 2 444 2 785 3 332 3 271 3 553 3 796 3 882
Radio, TV, instruments, watches and clocks 1 207 1 422 1 411 1 411 1 537 1 762 1 843
Transport equipment 6 349 7 063 8 675 8 953 9 104 9 075 10 272 Furniture; other manufacturing 1/ 9 263 10 119 10 807 11 528 12 388 12 869 13 727
Electricity and water 13 930 15 975 17 408 18 128 20 387 20 965 21 408
Electricity 12 371 14 155 15 503 16 142 17 480 17 728 17 688
Water 1 559 1 820 1 905 1 986 2 907 3 237 3 720
Construction 12 318 13 797 15 774 17 631 19 386 20 682 21 263
Secondary industries 108 890 121 839 139 362 149 886 164 377 170 704 178 623
Wholesale and retail trade; hotels and restaurants 56 468 62 474 71 768 79 463 85 858 89 222 95 159
Wholesale trade 17 938 19 558 22 851 25 838 27 549 27 912 30 168 Retail trade; repairs of household goods 1/ 27 930 31 226 34 586 37 743 41 538 44 306 47 493
Motor trade; repair of motor vehicles 6 121 6 928 8 605 9 432 9 779 9 469 9 809
Hotels and restaurants 4 479 4 763 5 726 6 451 6 993 7 535 7 690
Transport and communication 33 972 38 296 44 538 51 787 57 765 63 498 71 340 Transport 1/ 26 210 28 790 32 030 36 172 39 033 42 076 44 749
Communication 7 762 9 507 12 508 15 615 18 732 21 423 26 591
Finance, real estate and business services 62 861 70 491 82 162 94 116 109 601 123 369 141 928
Finance and insurance 27 871 29 394 34 664 39 215 46 742 50 769 61 614
Real estate 20 488 24 839 28 893 34 070 39 266 45 223 49 922 Business services 1/ 14 502 16 259 18 605 20 831 23 593 27 378 30 392
Community, social and other personal services 1/ 9 435 11 349 13 690 15 368 17 374 19 093 21 119
General government services 62 375 71 278 80 831 97 196 106 792 116 443 123 809
Other producers 10 505 12 054 13 855 15 671 17 803 20 154 22 527
Tertiary industries 235 616 265 942 306 844 353 602 395 194 431 780 475 883
All industries at basic prices 390 841 440 144 500 353 565 976 625 420 670 381 723 247
Taxes on products 41 611 48 374 53 644 58 184 63 713 70 654 76 980
Less: Subsidies on products 6 321 6 400 5 898 5 746 5 387 5 954 4 672
GDP at market prices 426 132 482 119 548 099 618 415 683 746 735 082 804 898
1/ Includes estimates of the informal sector.

P0441 31
Table 9 - Percentage contribution to the annual gross domestic product by industry at current prices
Industry 1993 1994 1995 1996 1997 1998 1999
Agriculture, forestry and fishing 4,2 4,6 3,9 4,2 4,0 3,6 3,4
Agriculture 3,5 3,9 3,2 3,5 3,4 3,1 2,8
Forestry 0,6 0,6 0,6 0,6 0,5 0,5 0,5
Fishing 0,1 0,1 0,1 0,1 0,1 0,1 0,1
Mining and quarrying 7,7 7,3 7,0 6,8 6,5 6,5 6,1
Coal mining 1,3 1,3 1,4 1,4 1,4 1,4 1,3
Gold mining 3,9 3,6 2,8 3,0 2,6 2,5 2,1
Mining of other metal ores 1,6 1,5 1,6 1,6 1,7 1,9 2,0 Other mining and quarrying 1/ 0,8 0,9 1,2 0,9 0,8 0,8 0,7
Primary industries 11,9 11,9 10,8 11,0 10,5 10,1 9,5
Manufacturing 21,1 20,9 21,2 20,2 19,9 19,3 18,8
Food, beverages and tobacco 3,6 3,5 3,5 3,4 3,4 3,3 3,3
Textiles, clothing and leather goods 1,5 1,5 1,4 1,3 1,2 1,1 1,1
Wood and paper; publishing and printing 2,1 2,0 2,2 2,0 2,0 1,9 2,0
Petroleum products, chemicals, rubber and plastic 3,9 3,9 3,9 3,8 3,8 3,9 3,9
Other non-metal mineral products 0,9 0,9 0,9 0,8 0,8 0,7 0,6
Metals, metal products, machinery and equipment 4,3 4,3 4,5 4,5 4,5 4,2 3,7
Electrical machinery and apparatus 0,6 0,6 0,7 0,6 0,6 0,6 0,5
Radio, TV, instruments, watches and clocks 0,3 0,3 0,3 0,2 0,2 0,3 0,3
Transport equipment 1,6 1,6 1,7 1,6 1,5 1,4 1,4 Furniture; other manufacturing 1/ 2,4 2,3 2,2 2,0 2,0 1,9 1,9
Electricity and water 3,6 3,6 3,5 3,2 3,3 3,1 3,0
Electricity 3,2 3,2 3,1 2,9 2,8 2,6 2,4
Water 0,4 0,4 0,4 0,4 0,5 0,5 0,5
Construction 3,2 3,1 3,2 3,1 3,1 3,1 2,9
Secondary industries 27,9 27,7 27,9 26,5 26,3 25,5 24,7
Wholesale and retail trade; hotels and restaurants 14,4 14,2 14,3 14,0 13,7 13,3 13,2
Wholesale trade 4,6 4,4 4,6 4,6 4,4 4,2 4,2 Retail trade; repairs of household goods 1/ 7,1 7,1 6,9 6,7 6,6 6,6 6,6
Motor trade; repair of motor vehicles 1,6 1,6 1,7 1,7 1,6 1,4 1,4
Hotels and restaurants 1,1 1,1 1,1 1,1 1,1 1,1 1,1
Transport and communication 8,7 8,7 8,9 9,2 9,2 9,5 9,9 Transport 1/ 6,7 6,5 6,4 6,4 6,2 6,3 6,2
Communication 2,0 2,2 2,5 2,8 3,0 3,2 3,7
Finance, real estate and business services 16,1 16,0 16,4 16,6 17,5 18,4 19,6
Finance and insurance 7,1 6,7 6,9 6,9 7,5 7,6 8,5
Real estate 5,2 5,6 5,8 6,0 6,3 6,7 6,9 Business services 1/ 3,7 3,7 3,7 3,7 3,8 4,1 4,2
Community, social and personal services 1/ 2,4 2,6 2,7 2,7 2,8 2,8 2,9
General government services 16,0 16,2 16,2 17,2 17,1 17,4 17,1
Other producers 2,7 2,7 2,8 2,8 2,8 3,0 3,1
Tertiary industries 60,3 60,4 61,3 62,5 63,2 64,4 65,8
All industries at basic prices 100,0 100,0 100,0 100,0 100,0 100,0 100,0
1/ Includes estimates of the informal sector.

P0441 32
Table 10 - Annual gross domestic product by industry at constant 1995 prices (R million)
Industry 1993 1994 1995 1996 1997 1998 1999
Agriculture, forestry and fishing 22 366 24 125 19 317 23 949 24 314 22 538 23 305
Agriculture 18 994 20 727 15 863 20 468 20 967 19 289 20 038
Forestry 2 817 2 896 2 967 3 007 2 924 2 820 2 830
Fishing 556 502 487 474 423 429 436
Mining and quarrying 35 782 35 946 34 830 34 542 35 118 34 845 34 499
Coal mining 6 090 6 494 6 777 6 828 7 254 7 235 7 254
Gold mining 16 251 15 402 14 135 13 608 13 355 12 476 12 170
Mining of other metal ores 7 366 7 688 7 855 8 017 8 372 8 771 9 118 Other mining and quarrying 1/ 6 075 6 363 6 062 6 090 6 138 6 364 5 958
Primary industries 58 147 60 071 54 147 58 492 59 432 57 383 57 804
Manufacturing 97 114 99 706 106 180 107 648 110 248 108 447 108 283
Food, beverages and tobacco 17 050 16 901 17 368 17 678 18 125 17 865 17 217
Textiles, clothing and leather goods 6 502 6 682 7 059 6 573 6 832 6 285 6 460
Wood and paper; publishing and printing 10 437 10 780 11 156 10 709 11 065 10 695 10 903
Petroleum products, chemicals, rubber and plastic 16 785 17 677 19 309 19 893 20 232 21 352 22 186
Other non-metal mineral products 3 882 3 988 4 315 4 276 4 216 3 932 3 629
Metals, metal products, machinery and equipment 20 357 20 869 22 747 24 579 25 497 24 572 23 409
Electrical machinery and apparatus 2 753 2 986 3 332 3 155 3 460 3 336 3 245
Radio, TV, instruments, watches and clocks 1 533 1 580 1 411 1 327 1 435 1 529 1 527
Transport equipment 7 089 7 435 8 675 8 524 8 251 7 936 8 600 Furniture; other manufacturing 1/ 10 727 10 808 10 807 10 934 11 135 10 945 11 108
Electricity and water 16 133 17 069 17 408 18 403 19 206 19 316 19 688
Electricity 14 403 15 224 15 503 16 383 17 073 17 192 17 375
Water 1 730 1 845 1 905 2 020 2 133 2 124 2 314
Construction 14 804 15 233 15 774 16 092 16 571 16 778 16 136
Secondary industries 128 052 132 007 139 362 142 143 146 026 144 541 144 107
Wholesale and retail trade; hotels and restaurants 66 121 67 780 71 768 74 416 74 749 73 704 74 675
Wholesale trade 20 941 21 271 22 851 24 135 24 111 23 303 23 981
Retail trade; repairs of household goods 1/ 32 520 33 579 34 586 35 503 36 236 36 578 37 319
Motor trade; repair of motor vehicles 7 115 7 457 8 605 8 938 8 669 8 046 7 770
Hotels and restaurants 5 546 5 472 5 726 5 839 5 732 5 777 5 606
Transport and communication 38 507 40 281 44 538 47 368 50 885 54 442 58 558 Transport 1/ 29 522 30 593 32 030 32 965 34 125 35 100 35 515
Communication 8 985 9 688 12 508 14 403 16 761 19 343 23 043
Finance, real estate and business services 76 580 79 378 82 162 87 668 91 454 96 601 102 721
Finance and insurance 34 135 32 983 34 664 38 923 41 527 44 198 49 118
Real estate 25 312 28 677 28 893 29 343 29 591 30 168 30 177 Business services 1/ 17 132 17 719 18 605 19 403 20 336 22 235 23 426
Community, social and personal services 1/ 11 341 12 420 13 690 14 210 13 971 13 902 14 186
General government services 79 366 80 157 80 831 82 422 82 860 82 458 81 879
Other producers 13 556 13 687 13 855 14 066 14 298 14 626 14 919
Tertiary industries 285 470 293 703 306 844 320 150 328 217 335 734 346 938
All industries at basic prices 471 670 485 782 500 352 520 785 533 674 537 658 548 849
Taxes on products 48 406 51 200 53 644 56 260 57 793 57 903 57 818
Less: Subsidies on products 5 190 5 444 5 898 6 190 6 364 6 445 6 502
GDP at market prices 514 887 531 537 548 099 570 855 585 103 589 116 600 164
1/ Includes estimates of the informal sector.
P0441 33
Table 11 - Percentage change2/ in the annual gross domestic product by industry at constant 1995 prices
Industry 1994 1995 1996 1997 1998 1999
Agriculture, forestry and fishing 7,9 -19,9 24,0 1,5 -7,3 3,4
Agriculture 9,1 -23,5 29,0 2,4 -8,0 3,9
Forestry 2,8 2,4 1,3 -2,8 -3,6 0,4
Fishing -9,7 -3,0 -2,6 -10,9 1,6 1,7
Mining and quarrying 0,5 -3,1 -0,8 1,7 -0,8 -1,0
Coal mining 6,6 4,4 0,7 6,2 -0,3 0,3
Gold mining -5,2 -8,2 -3,7 -1,9 -6,6 -2,5
Mining of other metal ores 4,4 2,2 2,1 4,4 4,8 4,0 Other mining and quarrying 1/ 4,7 -4,7 0,5 0,8 3,7 -6,4
Primary industries 3,3 -9,9 8,0 1,6 -3,4 0,7
Manufacturing 2,7 6,5 1,4 2,4 -1,6 -0,2
Food, beverages and tobacco -0,9 2,8 1,8 2,5 -1,4 -3,6
Textiles, clothing and leather goods 2,8 5,6 -6,9 3,9 -8,0 2,8
Wood and paper; publishing and printing 3,3 3,5 -4,0 3,3 -3,3 1,9
Petroleum products, chemicals, rubber and plastic 5,3 9,2 3,0 1,7 5,5 3,9
Other non-metal mineral products 2,7 8,2 -0,9 -1,4 -6,7 -7,7
Metals, metal products, machinery and equipment 2,5 9,0 8,1 3,7 -3,6 -4,7
Electrical machinery and apparatus 8,4 11,6 -5,3 9,7 -3,6 -2,7
Radio, TV, instruments, watches and clocks 3,0 -10,7 -5,9 8,1 6,6 -0,2
Transport equipment 4,9 16,7 -1,7 -3,2 -3,8 8,4 Furniture; other manufacturing 1/ 0,8 0,0 1,2 1,8 -1,7 1,5
Electricity and water 5,8 2,0 5,7 4,4 0,6 1,9
Electricity 5,7 1,8 5,7 4,2 0,7 1,1
Water 6,6 3,2 6,1 5,6 -0,4 8,9
Construction 2,9 3,6 2,0 3,0 1,2 -3,8
Secondary industries 3,1 5,6 2,0 2,7 -1,0 -0,3
Wholesale and retail trade; hotels and restaurants 2,5 5,9 3,7 0,4 -1,4 1,3
Wholesale trade 1,6 7,4 5,6 -0,1 -3,4 2,9 Retail trade; repairs of household goods 1/ 3,3 3,0 2,7 2,1 0,9 2,0
Motor trade; repair of motor vehicles 4,8 15,4 3,9 -3,0 -7,2 -3,4
Hotels and restaurants -1,3 4,6 2,0 -1,8 0,8 -3,0
Transport and communication 4,6 10,6 6,4 7,4 7,0 7,6 Transport 1/ 3,6 4,7 2,9 3,5 2,9 1,2
Communication 7,8 29,1 15,2 16,4 15,4 19,1
Finance, real estate and business services 3,7 3,5 6,7 4,3 5,6 6,3
Finance and insurance -3,4 5,1 12,3 6,7 6,4 11,1
Real estate 13,3 0,8 1,6 0,8 2,0 0,0 Business services 1/ 3,4 5,0 4,3 4,8 9,3 5,4
Community, social and personal services 1/ 9,5 10,2 3,8 -1,7 -0,5 2,0
General government services 1,0 0,8 2,0 0,5 -0,5 -0,7
Other producers 1,0 1,2 1,5 1,6 2,3 2,0
Tertiary industries 2,9 4,5 4,3 2,5 2,3 3,3
All industries at basic prices 3,0 3,0 4,1 2,5 0,7 2,1
Taxes on products 5,8 4,8 4,9 2,7 0,2 -0,1
Less: Subsidies on products 4,9 8,3 5,0 2,8 1,3 0,9
GDP at market prices 3,2 3,1 4,2 2,5 0,7 1,9
1/ Includes estimates of the informal sector. 2/ The percentage change is the growth rate from one period to the next period.

P0441 34
Table 12 - Annual production accounts by industry at current prices (R million)
Industry 1993 1994 1995 1996 1997 1998 1999
Agriculture, forestry and fishing Output at basic prices 28 745 34 334 35 560 43 246 46 385 46 625 48 613 Intermediate consumption 12 461 14 082 16 243 19 525 21 060 22 173 24 059 Gross value added at basic prices 16 284 20 252 19 317 23 721 25 325 24 452 24 555
Other taxes on production 125 132 138 159 164 188 200 Other subsidies -1 025 -740 -694 -630 -618 -531 -488 Value added at factor cost 17 183 20 859 19 873 24 192 25 779 24 795 24 842 Compensation of employees 5 069 5 680 6 406 6 908 7 419 7 911 8 387 Gross operating surplus/mixed income 12 114 15 179 13 467 17 284 18 360 16 884 16 455
Mining and quarrying Output at basic prices 51 504 56 900 63 040 70 172 74 720 80 438 83 551 Intermediate consumption 21 452 24 789 28 210 31 405 34 196 36 993 39 365 Gross value added at basic prices 30 052 32 111 34 830 38 768 40 524 43 445 44 186
Other taxes on production 415 446 474 493 548 754 649 Other subsidies -142 -101 -59 -44 -42 -41 -33 Value added at factor cost 29 779 31 766 34 415 38 319 40 018 42 732 43 570 Compensation of employees 15 827 16 516 18 452 19 969 22 061 22 622 23 203 Gross operating surplus/mixed income 13 951 15 249 15 963 18 350 17 957 20 111 20 367
Manufacturing Output at basic prices 263 671 293 937 347 715 378 775 416 574 426 622 451 329 Intermediate consumption 181 029 201 869 241 536 264 648 291 970 297 564 315 377 Gross value added at basic prices 82 642 92 068 106 180 114 127 124 604 129 057 135 952
Other taxes on production 918 1 007 1 126 1 219 1 348 1 417 1 498 Other subsidies -1 226 -913 -847 -1 198 -1 150 -1 102 -897 Value added at factor cost 82 951 91 974 105 900 114 106 124 405 128 742 135 351 Compensation of employees 46 111 50 761 56 484 59 965 63 532 70 678 74 404 Gross operating surplus/mixed income 36 839 41 213 49 416 54 140 60 873 58 064 60 947
Electricity and water Output at basic prices 21 760 24 359 26 918 29 156 32 477 34 267 35 766 Intermediate consumption 7 831 8 384 9 509 11 028 12 090 13 302 14 358 Gross value added at basic prices 13 930 15 975 17 408 18 128 20 387 20 965 21 408
Other taxes on production 184 190 196 203 216 215 222 Other subsidies 0 0 0 0 0 0 0 Value added at factor cost 13 745 15 785 17 213 17 925 20 171 20 750 21 186 Compensation of employees 3 906 4 317 4 943 5 811 6 355 6 910 7 741 Gross operating surplus/mixed income 9 839 11 468 12 269 12 113 13 816 13 839 13 445
Construction Output at basic prices 40 939 45 435 51 401 57 394 63 885 68 185 69 831 Intermediate consumption 28 621 31 639 35 627 39 763 44 498 47 503 48 568 Gross value added at basic prices 12 318 13 797 15 774 17 631 19 386 20 682 21 263
Other taxes on production 130 139 147 157 172 188 195 Other subsidies 0 0 0 0 0 0 0 Value added at factor cost 12 188 13 658 15 627 17 475 19 214 20 494 21 067 Compensation of employees 9 577 9 954 10 909 11 414 11 995 13 073 13 269 Gross operating surplus/mixed income 2 610 3 704 4 719 6 060 7 219 7 421 7 799
Wholesale and retail trade; hotels and restaurants Output at basic prices 97 616 108 486 125 113 138 716 150 109 156 664 166 350 Intermediate consumption 41 148 46 012 53 345 59 253 64 250 67 442 71 191 Gross value added at basic prices 56 468 62 474 71 768 79 463 85 858 89 222 95 159
Other taxes on production 1 415 1 557 1 709 1 892 2 082 2 272 2 382 Other subsidies -3 0 0 0 0 0 0 Value added at factor cost 55 056 60 917 70 059 77 571 83 777 86 950 92 777 Compensation of employees 29 174 31 373 35 343 38 417 42 132 45 067 48 243 Gross operating surplus/mixed income 25 882 29 544 34 716 39 154 41 645 41 883 44 534

P0441 35
Table 12 - Annual production accounts by industry at current prices (R million) (concluded)
Industry 1993 1994 1995 1996 1997 1998 1999
Transport and communication Output at basic prices 57 392 65 257 74 862 87 145 98 937 110 863 124 294 Intermediate consumption 23 419 26 961 30 324 35 358 41 172 47 365 52 954 Gross value added at basic prices 33 972 38 296 44 538 51 787 57 765 63 498 71 340
Other taxes on production 503 513 510 531 551 719 747 Other subsidies -237 -258 -301 -503 -486 -452 -381 Value added at factor cost 33 706 38 042 44 329 51 760 57 700 63 232 70 973 Compensation of employees 17 811 19 364 22 275 25 338 27 479 30 696 32 288 Gross operating surplus/mixed income 15 895 18 677 22 054 26 421 30 222 32 536 38 685
Finance, real estate and business services Output at basic prices 94 900 109 726 127 291 145 483 169 936 193 605 221 027 Intermediate consumption 32 038 39 235 45 129 51 367 60 335 70 235 79 099 Gross value added at basic prices 62 861 70 491 82 162 94 116 109 601 123 369 141 928
Other taxes on production 3 903 4 529 5 069 5 762 5 981 6 455 7 052 Other subsidies -483 -571 -399 -382 -371 -336 -291 Value added at factor cost 59 441 66 533 77 492 88 736 103 990 117 250 135 168 Compensation of employees 21 035 23 931 28 136 31 676 36 689 41 915 48 580 Gross operating surplus/mixed income 38 406 42 601 49 355 57 060 67 302 75 335 86 587
Community, social and personal services Output at basic prices 18 681 22 649 27 395 30 803 34 802 38 237 42 310 Intermediate consumption 9 246 11 300 13 704 15 435 17 428 19 144 21 190 Gross value added at basic prices 9 435 11 349 13 690 15 368 17 374 19 093 21 119
Other taxes on production 604 642 635 655 681 645 685 Other subsidies -17 -13 -54 -88 -85 -81 -66 Value added at factor cost 8 848 10 721 13 109 14 802 16 778 18 529 20 500 Compensation of employees 4 087 5 001 6 100 6 870 7 772 8 538 9 469 Gross operating surplus/mixed income 4 762 5 720 7 009 7 932 9 006 9 991 11 031
General government services Output at basic prices 94 122 106 047 111 238 131 908 146 797 158 445 166 791 Intermediate consumption 31 747 34 769 30 407 34 712 40 005 42 002 42 982 Gross value added at basic prices 62 375 71 278 80 831 97 196 106 792 116 443 123 809
Other taxes on production 437 460 509 572 627 708 761 Other subsidies 0 0 0 0 0 0 0 Value added at factor cost 61 938 70 818 80 322 96 624 106 165 115 735 123 048 Compensation of employees 55 255 63 435 72 021 87 301 95 845 104 533 110 830 Gross operating surplus 6 683 7 383 8 301 9 323 10 320 11 202 12 218
Other producers Output at basic prices 14 320 16 285 18 433 20 621 23 240 26 146 28 953 Intermediate consumption 3 815 4 231 4 578 4 950 5 437 5 992 6 426 Gross value added at basic prices 10 505 12 054 13 855 15 671 17 803 20 154 22 527
Other taxes on production 0 0 0 0 0 0 0 Other subsidies 0 0 0 0 0 0 0 Value added at factor cost 10 505 12 054 13 855 15 671 17 803 20 154 22 527 Compensation of employees 10 306 11 833 13 607 15 395 17 496 19 819 22 168 Gross operating surplus 199 221 248 276 307 335 359
Sum of all industries Output at basic prices 783 649 883 414 1 008 964 1 133 421 1 257 862 1 340 097 1 438 816 Intermediate consumption 392 808 443 269 508 611 567 444 632 443 669 716 715 568 Gross value added at basic prices 390 841 440 144 500 353 565 976 625 420 670 381 723 247
Other taxes on production 8 635 9 614 10 512 11 642 12 370 13 561 14 392 Other subsidies -3 133 -2 596 -2 353 -2 845 -2 752 -2 543 -2 155 Value added at factor cost 385 339 433 126 492 194 557 179 615 802 659 363 711 010 Compensation of employees 218 159 242 166 274 676 309 065 338 775 371 762 398 582 Gross operating surplus/mixed income 167 181 190 960 217 517 248 114 277 027 287 601 312 428
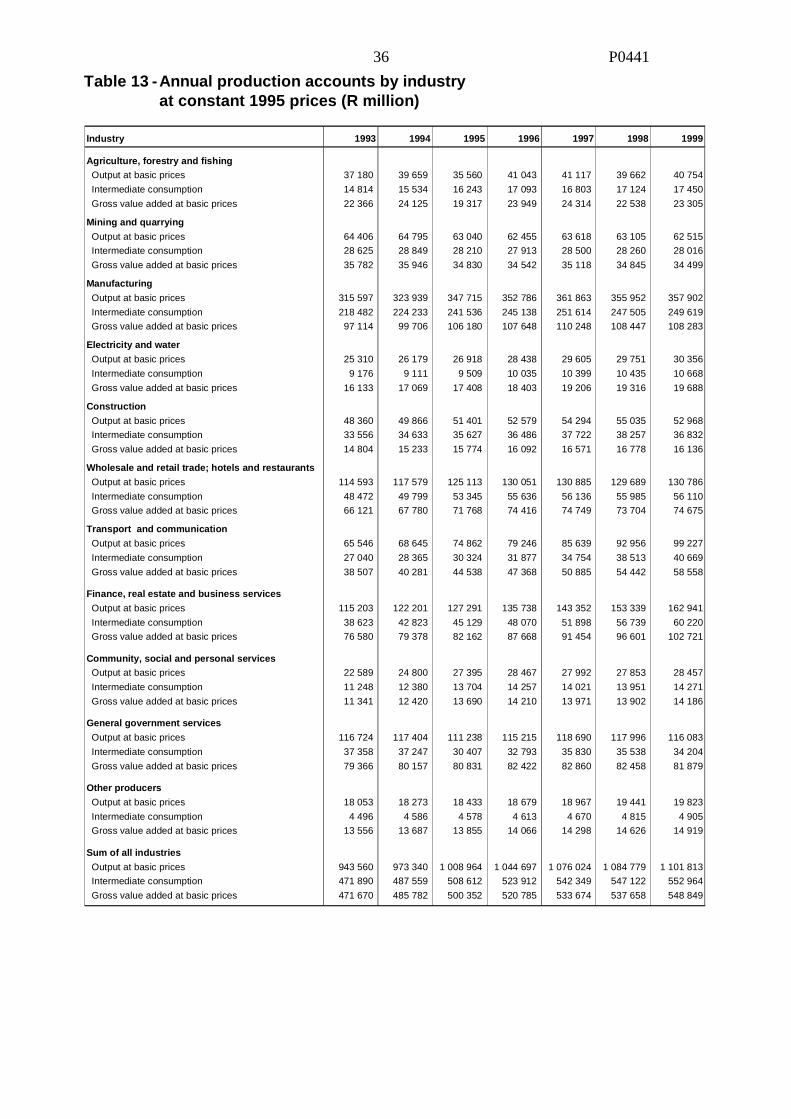
P0441 36
Table 13 - Annual production accounts by industry at constant 1995 prices (R million)
Industry 1993 1994 1995 1996 1997 1998 1999
Agriculture, forestry and fishing Output at basic prices 37 180 39 659 35 560 41 043 41 117 39 662 40 754
Intermediate consumption 14 814 15 534 16 243 17 093 16 803 17 124 17 450
Gross value added at basic prices 22 366 24 125 19 317 23 949 24 314 22 538 23 305
Mining and quarrying
Output at basic prices 64 406 64 795 63 040 62 455 63 618 63 105 62 515
Intermediate consumption 28 625 28 849 28 210 27 913 28 500 28 260 28 016
Gross value added at basic prices 35 782 35 946 34 830 34 542 35 118 34 845 34 499
Manufacturing
Output at basic prices 315 597 323 939 347 715 352 786 361 863 355 952 357 902
Intermediate consumption 218 482 224 233 241 536 245 138 251 614 247 505 249 619
Gross value added at basic prices 97 114 99 706 106 180 107 648 110 248 108 447 108 283
Electricity and water
Output at basic prices 25 310 26 179 26 918 28 438 29 605 29 751 30 356
Intermediate consumption 9 176 9 111 9 509 10 035 10 399 10 435 10 668
Gross value added at basic prices 16 133 17 069 17 408 18 403 19 206 19 316 19 688
Construction
Output at basic prices 48 360 49 866 51 401 52 579 54 294 55 035 52 968
Intermediate consumption 33 556 34 633 35 627 36 486 37 722 38 257 36 832
Gross value added at basic prices 14 804 15 233 15 774 16 092 16 571 16 778 16 136
Wholesale and retail trade; hotels and restaurants
Output at basic prices 114 593 117 579 125 113 130 051 130 885 129 689 130 786
Intermediate consumption 48 472 49 799 53 345 55 636 56 136 55 985 56 110
Gross value added at basic prices 66 121 67 780 71 768 74 416 74 749 73 704 74 675
Transport and communication
Output at basic prices 65 546 68 645 74 862 79 246 85 639 92 956 99 227
Intermediate consumption 27 040 28 365 30 324 31 877 34 754 38 513 40 669
Gross value added at basic prices 38 507 40 281 44 538 47 368 50 885 54 442 58 558
Finance, real estate and business services
Output at basic prices 115 203 122 201 127 291 135 738 143 352 153 339 162 941
Intermediate consumption 38 623 42 823 45 129 48 070 51 898 56 739 60 220
Gross value added at basic prices 76 580 79 378 82 162 87 668 91 454 96 601 102 721
Community, social and personal services Output at basic prices 22 589 24 800 27 395 28 467 27 992 27 853 28 457
Intermediate consumption 11 248 12 380 13 704 14 257 14 021 13 951 14 271
Gross value added at basic prices 11 341 12 420 13 690 14 210 13 971 13 902 14 186
General government services
Output at basic prices 116 724 117 404 111 238 115 215 118 690 117 996 116 083
Intermediate consumption 37 358 37 247 30 407 32 793 35 830 35 538 34 204
Gross value added at basic prices 79 366 80 157 80 831 82 422 82 860 82 458 81 879
Other producers
Output at basic prices 18 053 18 273 18 433 18 679 18 967 19 441 19 823
Intermediate consumption 4 496 4 586 4 578 4 613 4 670 4 815 4 905
Gross value added at basic prices 13 556 13 687 13 855 14 066 14 298 14 626 14 919
Sum of all industries
Output at basic prices 943 560 973 340 1 008 964 1 044 697 1 076 024 1 084 779 1 101 813
Intermediate consumption 471 890 487 559 508 612 523 912 542 349 547 122 552 964
Gross value added at basic prices 471 670 485 782 500 352 520 785 533 674 537 658 548 849

P0441 37
Table 14 - Annual volume index numbers by industry (1995 = 100)
Table 15 - Annual implied deflators by industry (1995 = 100)
Industry 1993 1994 1995 1996 1997 1998 1999
Agriculture, forestry and fishing 115,8 124,9 100,0 124,0 125,9 116,7 120,6
Mining and quarrying 102,7 103,2 100,0 99,2 100,8 100,0 99,1
Manufacturing 91,5 93,9 100,0 101,4 103,8 102,1 102,0
Electricity and water 92,7 98,1 100,0 105,7 110,3 111,0 113,1
Construction 93,9 96,6 100,0 102,0 105,1 106,4 102,3
Wholesale and retail trade; hotels and restaurants 92,1 94,4 100,0 103,7 104,2 102,7 104,1
Transport and communication 86,5 90,4 100,0 106,4 114,3 122,2 131,5
Finance, real estate and business services 93,2 96,6 100,0 106,7 111,3 117,6 125,0
Community, social and personal services 82,8 90,7 100,0 103,8 102,1 101,5 103,6
General government services 98,2 99,2 100,0 102,0 102,5 102,0 101,3
Other producers 97,8 98,8 100,0 101,5 103,2 105,6 107,7
Total values added at basic prices 94,3 97,1 100,0 104,1 106,7 107,5 109,7
Taxes on products 90,2 95,4 100,0 104,9 107,7 107,9 107,8
Subsidies on products 88,0 92,3 100,0 105,0 107,9 109,3 110,2
GDP at market prices 93,9 97,0 100,0 104,2 106,8 107,5 109,5
Industry 1993 1994 1995 1996 1997 1998 1999
Agriculture, forestry and fishing 72,8 83,9 100,0 99,0 104,2 108,5 105,4
Mining and quarrying 84,0 89,3 100,0 112,2 115,4 124,7 128,1
Manufacturing 85,1 92,3 100,0 106,0 113,0 119,0 125,6
Electricity and water 86,3 93,6 100,0 98,5 106,1 108,5 108,7
Construction 83,2 90,6 100,0 109,6 117,0 123,3 131,8
Wholesale and retail trade; hotels and restaurants 85,4 92,2 100,0 106,8 114,9 121,1 127,4
Transport and communication 88,2 95,1 100,0 109,3 113,5 116,6 121,8
Finance, real estate and business services 82,1 88,8 100,0 107,4 119,8 127,7 138,2
Community, social and personal services 83,2 91,4 100,0 108,1 124,4 137,3 148,9
General government services 78,6 88,9 100,0 117,9 128,9 141,2 151,2
Other producers 77,5 88,1 100,0 111,4 124,5 137,8 151,0
Total values added at basic prices 82,9 90,6 100,0 108,7 117,2 124,7 131,8
Taxes on products 86,0 94,5 100,0 103,4 110,2 122,0 133,1
Subsidies on products 121,8 117,6 100,0 92,8 84,6 92,4 71,9
GDP deflator 82,8 90,7 100,0 108,3 116,9 124,8 132,6

P0441 38
ADDITIONAL INFORMATION
Explanatory Notes
Introduction 1 This Statistical Release contains independent compiled annual estimates of the Gross Domestic Product (GDP) for the period 1993 to 1999. It also contains quarterly estimates of the Gross Domestic Product (GDP) for the period 1993 to the third quarter of 2000. The estimates are based on the 1993 System of National Accounts (SNA) published by the United Nations in co-operation with other international organisations. This means that the methodology, concepts and classifications, are in accordance with the latest guidelines of an internationally agreed system of national accounts.
Revised estimates of GDP for the years 1993-98 in accord-ance with the new SNA were published for the first time in the June 1999 issue of Statistical Release P0441. The revisions also included an update of the base year from 1990 to 1995 for the estimates at constant prices. Thus, the estimates of real GDP are made at 1995 constant prices in this publication.
Methodology 2 Annual GDP estimates are now calculated independently from the quarterly estimates. Previously, annual GDP estimates were derived as the sum of the GDP for the four quarters of the relevant year.
Short-term indicators are used to estimate the quarterly GDP (cf. Statistical sources and methods). However, they are by their nature incomplete in terms of coverage and annual changes of output measured through them are generally not as reliable as in instances where the results of annual surveys are used. Therefore, the quarterly estimates must be adapted to the independent annual estimates when such estimates become available.
Classifications 3 The estimates of value added by industry are classified according to the Standard Industrial Classification of all Economic Activities (SIC), fifth edition. SIC is based on the third revision of the International Standard Industrial Classification of all Economic Activities (ISIC), with suitable adaptations for South African conditions.

P0441 39
Seasonal adjustment 4 The quarterly value added and GDP estimates have been
seasonally adjusted. Seasonal adjustment is a means of removing the estimated effects of normal seasonal variation from the series so that the effects of other influences on the series can be more clearly recognised. Seasonal adjustment does not aim to remove irregular or non-seasonal influences which may be present in any particular quarter. Influences that are volatile or unsystematic can still make it difficult to interpret.
Reliability of estimates 5 Revision of the estimates for all components of the national accounts are usually done every five years in conjunction with the rebasing of the estimates at constant prices. At such a time the results of censuses that have become available in the meantime and any other additional information sources are incorporated in the estimates. Due to the availability of more comprehensive data, revisions are also made of estimates for the latest quarters and, once a year, for the two latest years.
Related publications 6 Users may also wish to refer to the following publications from Stats SA -
• Bulletin of Statistics; and • SA Statistics
Unpublished Statistics 7 In some cases Stats SA can also make available information which is not published. This information can be made available through a computer printout or diskette. Generally a charge is made for providing unpublished information.
Pre-release policy 8 New estimates of economic indicators are kept strictly confidential by Stats SA prior to the date and time of release. To enable selected government departments to prepare their public responses, the following pre-release procedure is applied. It accords with practice in leading statistical agencies.
An official representative from the Office of the President, the Department of Finance and the SARB receive a copy of the release on a strictly confidential basis one hour in advance of the public issue.
Symbols and abbreviations 9 SARB South African Reserve Bank SIC Standard Industrial Classification SNA System of National Accounts Stats SA Statistics South Africa - not applicable

P0441 40
Classification of Industries
The industries used in estimating the value added was classified according to the Standard Industrial Classification of all Economic Activities (SIC), fifth edition. It is based on the third revision of the International Standard Industrial Classification of all Economic Activities (ISIC), with suitable adaptations for local conditions. For the convenience of users, the SIC is duplicated in this statistical release for easy reference. Two versions of SIC are presented, namely table C reflecting only those categories of the SIC which have actually been used in the national accounts tables in this statistical release and table D which is the full version of SIC (5th edition). Furthermore, table C also furnishes the abbreviated titles as used in the national accounts tables. Table C - Categor ies used in the national accounts tables
Title in the national accounts tables Major division of SIC
Division of SIC
Agriculture, forestry and fishing 1
Agriculture 11
Forestry 12
Fishing 13
Mining and quarrying 2
Coal mining 21
Gold mining 23
Mining of other metal ores 24
Other mining and quarrying 25, 29
Manufacturing 3
Food, beverages and tobacco products 30
Textiles, clothing and leather goods 31
Wood and paper; publishing and printing 32
Petroleum products, chemicals, rubber and plastic 33
Other non-metallic mineral products 34
Metals, metal products, machinery and equipment 35
Electrical machinery and apparatus 36
Radio, TV, instruments, watches and clocks 37
Transport equipment 38
Furniture; other manufacturing 39
Electricity and water 4
Electricity 41
Water 42
Construction 5
Wholesale, retail, and motor trade; catering and accommodation 6
Wholesale trade 61
Retail trade; repair of household goods 62
Motor trade; repair of motor vehicles 63
Catering and accommodation 64

P0441 41
Table C - Categor ies used in the national accounts tables (concluded)
Title in the national accounts tables Major division of SIC
Division of SIC
Transport and communication 7
Transport 71-74
Communication 75
Finance, real estate and business services 8
Finance and insurance 81-83
Real estate 84
Business services 85-88
Other private services 9 1/
General government services 9 1/
Other producers 9 1/ 01 1/
1/ Major division 9 of SIC - Community, social and personal services - has been disaggregated into three categories in the national accounts tables. These categories follow other criteria than SIC and cannot be defined in terms of the divisions and groups of SIC 9. The first category - Community, social and personal services - includes private enterprises. They are market producers. The second category - general government services - comprises the activities of general government in producing non-market community and social services, e.g. public administration, defence, health and education. The third category - Other producers - consist of non-profit institutions serving households (NPISH) and domestic workers. These are also non-market producers.

P0441 42
Table D - Standard Industr ial Classification of All Economic Activities (SIC)
(5th Edition)
Title of category Major division
Division
Agriculture, hunting, forestry and fishing 1
Agriculture, hunting and related services 11
Forestry, logging and related services 12
Fishing, operation of fish hatcheries and fish farms 13
Mining and quarrying 2
Mining of coal and lignite 21
Extraction of crude petroleum and natural gas; service activities incidental to oil and gas extraction, excluding surveying
22
Mining of gold and uranium ore 23
Mining of metal ores, except gold and uranium 24
Other mining and quarrying 25
Services activities incidental to mining of minerals 29
Manufacturing 3
Manufacture of food products, beverages and tobacco products 30
Manufacture of textiles, clothing and leather goods 31
Manufacture of wood and of products of wood and cork, except furniture; manufacture of articles of straw and plaiting materials; manufacture of paper and paper products; publishing, printing and reproduction of recorded media
32
Manufacture of coke, refined petroleum products and nuclear fuel; manufacture of chemicals and chemical products; manufacture of rubber and plastic products
33
Manufacture of other non-metallic mineral products 34
Manufacture of basic metals, fabricated metal products, machinery and equipment and of office, accounting and computing machinery
35
Manufacture of electrical machinery and apparatus n.e.c. 36
Manufacture of radio, television and communication equipment and apparatus and of medical, precision and optical instruments, watches and clocks
37
Manufacture of transport equipment 38
Manufacture of furniture; manufacturing n.e.c.; recycling 39
Electricity, gas and water supply 4
Electricity, gas, steam and hot water supply 41
Collection, purification and distribution of water 42
Construction 5
Wholesale and retail trade; repair of motor vehicles, motor cycles and personal and household goods; catering and accommodation
6
Wholesale and commission trade, except of motor vehicles and motor cycles
61
Retail trade, except of motor vehicles and motor cycles; repair of personal household goods
62
Sale, maintenance and repair of motor vehicles and motor cycles; retail trade in automotive fuel
63
Catering and accommodation 64

P0441 43
Table D - Standard Industr ial Classification of All Economic Activities (SIC)
(5th Edition) (concluded)
Title of category Major division
Division
Transport, storage and communication 7
Land transport; transport via pipelines 71
Water transport 72
Air transport 73
Supporting and auxiliary transport activities; activities of travel agencies 74
Post and telecommunications 75
Financial intermediation, insurance, real estate and business services 8
Financial intermediation, except insurance and pension funding 81
Insurance and pension funding, except compulsory social security 82
Activities auxiliary to financial intermediation 83
Real estate activities 84
Renting of machinery and equipment, without operator, and of personal and household goods
85
Computer and related activities 86
Research and development 87
Other business activities 88
Community, social and personal services 9
Public administration and defence activities 91
Education 92
Health and social work 93
Other community, social and personal service activities 94
Activities of membership organisations n.e.c. 95
Recreational, cultural and sporting activities 96
Other service activities 99
Private households, exterritorial organisations, representatives of foreign governments and other activities not adequately defined
0
Private households with employed persons 01
Exterritorial organisations 02
Representatives of foreign governments 03
Other activities not adequately defined 04

P0441 44
Statistical sources and methods
Table E summarises the most important statistical sources from which the annual and quarterly value added and GDP estimates are derived and the method used to compile the figures, discussing both the estimates at current and at constant prices. The term “benchmark years” refers to those years in respect of which authoritative and detailed information is available.
Table E - Statistical sources and methods used in estimating annual and quarter ly value added and GDP at current and at constant pr ices
Industry Annual estimates at current pr ices
Quarter ly estimates at current pr ices
Estimates at constant pr ices
Agr iculture Benchmark years: Periodic Censuses of Agriculture conducted by Stats SA. GDP estimates compiled by the National Department of Agricul-ture in co-operation with Stats SA.
Other years: Annual surveys of agriculture conducted by Stats SA. GDP estimates are compiled by the Department of Agriculture in collaboration with Stats SA. Estimates from censuses and surveys are verified against quarterly source data collected by the National Department of Agriculture. Estimates include the value of farm produce consumed by farmers for own account.
Information obtained from various marketing agents and other agricultural related organisations in respect of the value of production of field crops, horticulture and livestock. Expenditure on intermediate goods is collected by the National Department of Agriculture from a number of manufacturers and associations regarding, inter alia, fertilisers, farm feed, dips and sprays, and fuel.
Nominal values ( current prices) of production and intermediate inputs are deflated by appropriate price indices compiled by the National Department of Agriculture.
Forestry Benchmark and other years: Annual information obtained from the Department of Water Affairs and Forestry. Estimates of growing forests and own-account production are based on a research project conducted by UP
Judgemental trend. Base year estimates are extrapolated using volumes of harvested timber and changes in standing timber inventories.
Fishing Benchmark and other years: Information provided by the Marine Development Branch of the Department of Environmental Affairs and technical periodicals.
Information provided by the Marine Develop-ment Branch of the Department of Environmental Affairs and technical periodicals.
Base year estimates are extrapolated using appropriate indices of the quantity (volume) of fish caught.

P0441 45Table E - Statistical sources and methods used in estimating annual and quar ter ly value added and
GDP at cur rent and at constant pr ices (continued)
Industry Annual estimates at cur rent pr ices
Quar ter ly estimates at cur rent pr ices
Estimates at constant pr ices
Mining and quar rying Benchmark years: Periodic Censuses of Mining conducted by Stats SA. Results from the 1993 and 1996 mining censuses are included.
Other years: Monthly data on production and sales for the various sectors of the mining industry and the quarterly surveys of financial and labour statistics conducted by Stats SA. Supplemented by information from the Chamber of Mines regarding the gold-mining industry and sample surveys conducted by the SARB.
Monthly data on production and sales for the various sectors of the mining industry and the quarterly surveys of financial and labour statistics conducted by Stats SA. Supplemented by information from the Chamber of Mines regarding the gold-mining industry and sample surveys conducted by the SARB.
Base year estimates are extrapolated using appropriate indices of output quantities of various sectors of mining. Information obtained from the Chamber of Mines, the Minerals Bureau, the Department of Minerals and Energy and Stats SA.
Manufactur ing Benchmark years: Periodic Censuses of Manufacturing conducted by Stats SA. Results from the 1993 and 1996 manufacturing censuses are included.
Other years: Monthly data on production and sales of the manufactur- ing industry, quarterly surveys of financial and labour statistics conducted by Stats SA, supplemented by sample surveys conducted by the SARB.
Monthly data on production and sales of the manufacturing industry, quarterly surveys of financial and labour statistics conducted by Stats SA, supplemented by sample surveys conducted by the SARB.
Base year estimates are extrapolated using appropriate indices of output quantities (volume) based on manufacturing sales at constant prices for the various divisions of manufacturing.
Electr icity and water Benchmark and other years: Annual statistics and financial statements obtained from ESKOM, the water boards and local authorities.
Monthly survey regarding generation and consumption of electricity conducted by Stats SA as well as monthly surveys conducted by the SARB.
Base year estimates are extrapolated using appropriate indices of output quantities (units of electricity generated and kilo litre water).

P0441 46
Table E - Statistical sources and methods used in estimating annual and quarter ly value added and GDP at current and at constant pr ices (continued)
Industry Annual estimates at current pr ices
Quarter ly estimates at current pr ices
Estimates at constant pr ices
Construction Benchmark years: Periodic Censuses of Construction conducted by Stats SA. Results from the 1994 construction census are included.
Other years: Extrapolation of the benchmark year esti-mates according to the trend in gross domestic fixed investment of residential and non-residential buildings and construction works as compiled by the SARB. Verified with the monthly survey of building statistics conducted by Stats SA. Labour remuneration is extrapolated according to the quarterly survey of total employment and earnings conducted by Stats SA.
Extrapolation of the benchmark year estimates according to the trend in gross domestic fixed investment of residential and non-residential buildings and construction works as compiled by the SARB. Verified with the monthly survey of building statistics conducted by Stats SA. Labour remuneration is extrapolated according to the quarterly survey of total employment and earnings conducted by Stats SA.
Base year estimates are extrapolated using the trend in real gross domestic fixed investment of residential and non-residential buildings and construction works as well as the monthly survey of building statistics conducted by Stats SA. Verified by cement sales.
Wholesale, retail and motor trade
Benchmark years: Periodic Censuses of Wholesale Trade, Commercial Agents and Allied Services; Retail Trade; and Motor Trade and Repair Services, conducted by Stats SA. Annual and quarterly surveys of local authorities conducted by Stats SA. The results of the above-mentioned censuses for 1993 are included.
Other years: Monthly surveys of financial (turnover) statistics of wholesale, retail and motor trade and the quarterly survey of total employment and earn-ings conducted by Stats, supplemented by sample surveys conducted by the SARB.
Monthly surveys of financial (turnover) statistics of wholesale, retail and motor trade and the quarterly survey of total employment and earnings conducted by Stats, supplemented by sample surveys conducted by the SARB.
Base year estimates are extrapolated using indices for the volume of wholesale, retail and motor trade sales.

P0441 47
Table E - Statistical sources and methods used in estimating annual and quarter ly value added and GDP at current and at constant pr ices (continued)
Industry Annual estimates at current pr ices
Quarter ly estimates at current pr ices
Estimates at constant pr ices
Cater ing and accommodation
Benchmark years: Periodic Censuses of Catering and Accommodation Services and Licensed Restaurants, conducted by Stats SA. The results of the 1995 census of accommodation services and the 1992 census of restaurants are included.
Other years: Extrapolation according to the trend of retail trade sales and trading statistics for hotels published by Stats SA.
Extrapolation according to the trend of retail trade sales and trading statistics for hotels published by Stats SA.
Base year estimates are extrapolated using changes in indices for room and bed nights sales.
Transpor t and communication
Benchmark and other years: Financial reports of Transnet, Telkom, SA Post Office; annual and quarterly surveys of local authorities conducted by Stats SA. Private transport benchmark estimates are obtained from Censuses of Transport and Allied Services conducted by Stats SA. Estimates for in-between years of private transport are extrapolated according to the monthly survey of transport of goods and passengers by road and rail conducted by Stats SA.
Supplemented by individual studies such as for the taxi industry, the cellular networks and the internet service providers.
Financial information from Transnet, Telkom, SA Post Office; annual and quarterly surveys of local authorities conducted by Stats SA.
The monthly survey of transport of goods and passengers by road and rail conducted by Stats SA. Supplemented by individual studies such as for the taxi industry, the cellular networks and the internet service providers.
Supplemented by surveys conducted by the SARB.
Base year estimates are extrapolated using appropriate indices of the volume of services rendered by the various institutions.

P0441 48
Table E - Statistical sources and methods used in estimating annual and quarter ly value added and GDP at current and at constant pr ices (continued)
Industry Annual estimates at current pr ices
Quarter ly estimates at current pr ices
Estimates at constant pr ices
Financial intermediation and insurance
Benchmark and other years: Annual and quarterly surveys conducted by the SARB among the various institutions in the private sector and information reported by public authorities and public corporations.
Annual and quarterly surveys conducted by the SARB among the various institutions in the private sector and information reported by public authorities and public corporations.
Base year estimates are extrapolated using appropriate indices, verified by nominal transactions deflated by appropriate price indices.
Real estate (including imputed rent on resi-dential buildings) and business services
Benchmark and other years: Censuses of Business Services and the 1996 Population Census. Supplemented by individual studies such as for car rentals and the security industry.
The monthly survey of building statistics conducted by Stats SA and monthly price indices of rent. Judgemental estimates for business services.
Base year estimates are extrapolated using an index of the estimated number of houses. For business services various volume indicators as well as price indices are used supplemented by judgemental estimates.
Other pr ivate services Benchmark years: Censuses of Social Services. Results from the 1994 Censuses of Health are included.
Other years: Extrapolated by relevant items of private consumption expenditure estimated by the SARB.
Extrapolated by relevant items of private consumption expenditure estimated by the SARB.
Nominal values (current prices) deflated by relevant components of the Consumer Price Index (CPI).
General government services
Benchmark years: Government Financial Statistics (GFS) analysis.
Other years: Annual Main Budget of South Africa as published in the Budget Review and annual statistics on the provincial governments and local authorities and extra-budgetary accounts.
Quarterly survey of total employment and earnings of the public sector conducted by Stats SA.
Base year estimates are extrapolated using an index of employment by general government.
Other producers Benchmark and other years: Censuses of relevant social services, such as welfare organisa-tions, supplemented by the 1996 Population Census and annual reports of relevant non-profit institutions.
Judgmental. Nominal values (current prices) deflated by relevant components of the CPI and verified by the GDP deflator.

P0441 49
Glossary
Annualised percentage change
The annualised percentage change is the growth rate of a given quarter compared with the previous quarter, compounded to an annual rate.
Balancing items A balancing item is an accounting construct obtained by subtracting the total value of the entries on one side of an account from the total value of the entries on the other side. Balancing items are not simply devices introduced to ensure that accounts balance. They encapsulate a great deal of information and include some of the most important entries in the accounts, for example value added and operating surplus.
Basic pr ices The basic price is the amount receivable by the producer from the purchaser for a unit of a good or service produced as output minus any tax payable plus any subsidy receivable on that unit as a consequence of its production or sale. Basic prices exclude any transport charges invoiced separately by the producer. Basic prices is the preferred method of valuing output.
Benchmark years Benchmark years refer to those years in respect of which authoritative and detailed data are available.
Compensation of employees
Compensation of employees is defined as the total remuneration, in cash or in kind, payable by an employer to an employee in return for work done by the latter during the accounting period. It is recorded on a gross basis, before any deduction for income taxes, pensions, unemployment insurance and other social insurance schemes. It also includes other forms of compensation, namely commissions, tips, bonuses, directors’ fees and allowances such as these for holidays and sick leave, as well as military pay and allowances. It excludes employers’ social contributions.
Constant pr ices Constant prices is a valuation concept expressed at the prices prevailing during a fixed reference period or base period. Currently, the base period for national accounts estimates at constant prices is 1995, which means that they have been restated at 1995 prices.
Current pr ices A valuation at current prices is expressed at the prices prevailing during the period being referred to.
Enterpr ise An enterprise may be a corporation (a quasi-corporate enterprise is treated as if it is a corporation in the SNA), a non-profit institution or an unincorporated enterprise. Corporate enterprises and non-profit institutions are complete institutional units. An unincorporated enterprise, however, refers to an institutional unit - a household or government unit - only in its capacity as a producer of goods and services. It covers only those activities of the unit which are directed towards the production of goods and services.
Establishment An establishment is defined as an enterprise, or part of an enterprise, that is situated at a single location and in which only a single (non-ancillary) productive activity is carried out or in which the principal productive activity accounts for most of the value added.
Factor cost Factor cost is a valuation reflecting the cost of the factors of production (labour and capital). It corresponds to the value remaining after all applicable taxes and subsidies have been deducted from market prices.

P0441 50
Financial services indirectly measured
Financial services indirectly measured (FSIM) is measured in the SNA as the total property income receivable by financial intermediaries minus their total interest payable, excluding the value of any property income receivable from the investment of their own funds. Therefore, income does not arise from financial intermediation.
GDP at market pr ices
GDP at market prices equals total gross value added by all industries at basic prices plus taxes on products minus subsidies on products.
Generation of income account
The generation of income account provides for the distribution of primary incomes to the various institutional sectors. Primary incomes are incomes that accrue to institutional sectors and industries as a consequence of their involvement in processes of production or ownership of assets that may be needed for purposes of production.
Implied deflator Implied deflators are also known as variable-weighted or “Paasche” indices (although not strictly of the Paasche type). These price indices are a by-product of the deflation procedure, obtained by dividing a series (e.g. value added) expressed at current prices by the corresponding series at constant prices.
Industr ies Industries are defined in the SNA in the same way as in the Standard Industrial Classification (SIC). An industry consists of a group of establishments engaged in the same or similar kinds of activity.
Intermediate consumption
Intermediate consumption consists of the value of the goods and services consumed as inputs by a process of production, excluding fixed assets. Consumption of fixed assets is recorded as consumption of fixed capital.
Operating surplus or mixed income
Operating surplus or mixed income is the balancing item in the generation of income account i.e. the value added minus compensation of employees payable minus taxes on production payable plus subsidies receivable.
Other taxes on production
Other taxes on production consist of taxes on the ownership of land, buildings or other assets used in production or on labour employed, etc. Important examples of other taxes on production are taxes on payroll or work force, stamp duties, business or professional licenses, etc.
Output Output is defined in the context of a production account. Production accounts are compiled for establishments or enterprises, and not for processes of production. Therefore, output consists only of those goods or services that are produced within an establishment that become available for use outside that establishment.
Percentage change When using annual data, the percentage change is the growth rate from one year to the next year. For quarterly data, the percentage change is the growth rate of a given quarter compared with the same quarter in the previous year.
Primary industr ies The primary industries include the agriculture, forestry and fishing, mining and quarrying industries.

P0441 51
Production The general production boundary is defined as an economic activity (or production) carried out under the control and responsibility of an institutional unit that uses inputs of labour, capital, and goods and services to produce output of goods and services. The production boundary in the 1993 SNA is more restricted than the general production boundary due to the production accounts not being compiled for household activities that produce domestic or personal services for own final consumption within the same household, except for services produced by paid domestic staff.
Production account for the total economy
The production account is the first in the sequence of accounts compiled for institutional sectors, industries and the total economy. The production account contains three items apart from the balancing item namely output, intermediate consumption and taxes less subsidies on products. The output is recorded under resources on the right-hand side of the account. Intermediate consumption and taxes less subsidies on products is recorded under uses on the left-hand side of the account.
Purchaser ’s pr ice The purchaser’s price is the amount paid by the purchaser, excluding any deductible value added tax (VAT) or similar deductible tax, in order to take delivery of a unit of a good or service at the time and place required by the purchaser. The purchaser’s price of a good includes any transport charges paid separately by the purchaser to take delivery at the required time and place.
Revision of estimates
Revision of the estimates for all components of the national accounts are usually done every five years in conjunction with the rebasing of the estimates at constant prices apart from the revision of estimates for the latest quarters. At such a time the results of censuses that have become available in the meantime and any other additional information sources are incorporated in the estimates.
Secondary industr ies
The secondary industries include the manufacturing, electricity, water and construction industries.
Subsidies Subsidies are transfers from the government to the business sector toward current cost of production . These transfers represent additions to the income of producers from current production.
System of National Accounts
System of National Accounts (SNA), refers to an internationally-agreed standard system for macro-economic accounts. The latest version is described in the System of National Accounts 1993.
Taxes on production and imports
Taxes on production and imports are taxes which add to the cost of production which and are likely to be reflected in market prices paid by the purchaser, such as sales and excise taxes, import duties and property taxes. Taxes on production and imports include taxes on products and other taxes on production.
Taxes on products Taxes on products consist of taxes payable on goods and services when they are produced, delivered, sold or otherwise disposed of by their producers. Furthermore, they are payable per unit of a good or service produced. Important examples of taxes on products are excise and import duties and value added tax (VAT).

P0441 52
Tertiary industr ies Tertiary industries include wholesale-, retail- and motor trade; catering and accommodation, transport and communication, finance, real estate and business services, community, social and personal services, general government services, and other producers.
Value added by industry
Value added measures the value created by production and may be calculated either before or after deducting the consumption of fixed capital on the fixed assets used. Gross value added is defined as the value of output less the value of intermediate consumption. Value added is the balancing item in the production account for an institutional unit or sector, or establishment or industry.

P0441 53
For More Information
Stats SA publishes approximately 400 different releases each year. It is not economically viable to produce them in more than one of South Africa’s eleven official languages. Since the releases are used extensively, not only locally but also by international economic and social-scientific communities, Stats SA releases are published in English only.
Stats SA has copyright on this publication. Users may apply the information as they wish, provided that they acknowledge Stats SA as the source of the basic data wherever they process, apply, utilise, publish or distribute the data: and also that they specify that the relevant application and analysis (where applicable) result from their own processing of the data.
Advance release calendar
An advance release calendar is disseminated on http://www.statssa.gov.za
Stats SA products
A complete set of Stats SA publications is available at the Stats SA Library and the following libraries:
State Library, Pretoria Library of Parliament, Cape Town South African Library, Cape Town Bloemfontein Public Library Natal Society Library, Pietermaritzburg Johannesburg Public Library Eastern Cape Library Services, King William’s Town Central Regional Library, Pietersburg Central Reference Library, Nelspruit Central Reference Collection, Kimberley Central Reference Library, Mmabatho Stats SA also provides a subscription service.
Electronic services
A large range of data are available via on-line services, diskette and computer printouts. For more details about our electronic data services, contact (012) 310 8095.
You can visit us on the Internet at: http//www.statssa.gov.za
Enquires
Telephone number: (012) 310 8095 (for user enquiries) (012) 310 8024/508/017 (technical enquiries) (012) 310 8161 (publishing)
Fax number: (012) 310 8304
E-mail address: [email protected]
Postal address: Private bag X44, Pretoria, 0001
Produced by Stats SA
Related Documents