Gross Domestic Product (GDP) and Business Fluctuations MSc EPS Hilary term 2011 (S2) Professor Dermot McAleese

Gross Domestic Product (GDP) and Business Fluctuations MSc EPS Hilary term 2011 (S2) Professor Dermot McAleese.
Dec 20, 2015
Welcome message from author
This document is posted to help you gain knowledge. Please leave a comment to let me know what you think about it! Share it to your friends and learn new things together.
Transcript

Gross Domestic Product (GDP) and Business Fluctuations
MSc EPS Hilary term 2011 (S2)Professor Dermot McAleese
OUTLINE
Definition of GDP Real vs. nominal GDP GDP vs. GNP GDP estimation Shadow vs Official Economy PPP vs. current exchange rate Potential GDP and the output gap Business Fluctuations

GROSS DOMESTIC PRODUCT (GDP)
GDP refers to the output of goods and services produced in an economy during a specific period of time.
The importance of GDP statistic
Business forecasts Monetary and fiscal policy
Political significance International comparisons
3
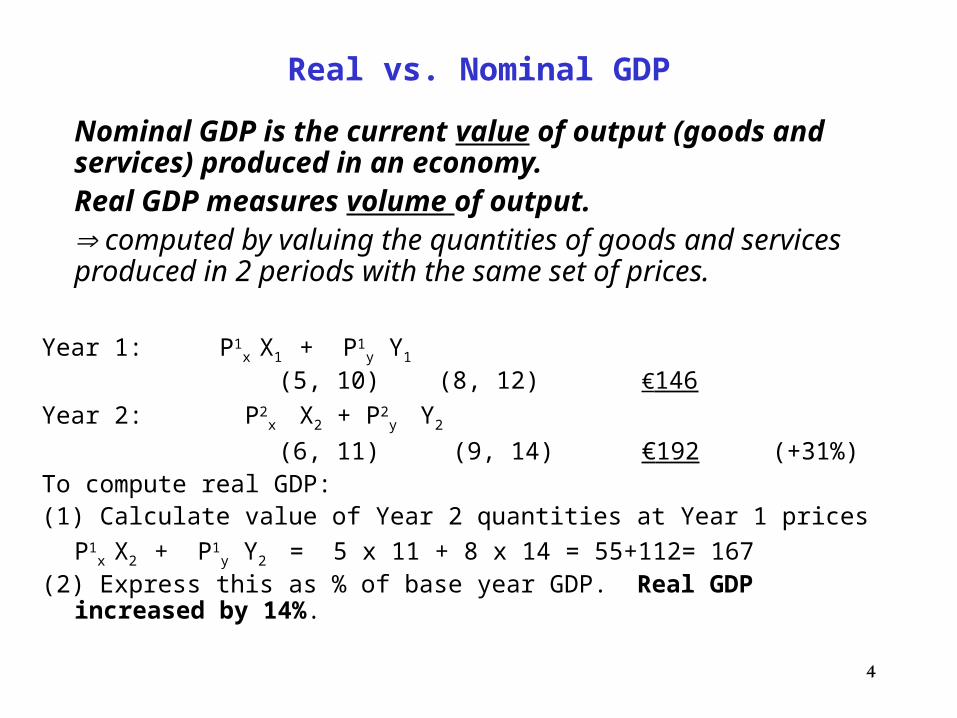
Real vs. Nominal GDP
Nominal GDP is the current value of output (goods and services) produced in an economy.Real GDP measures volume of output. computed by valuing the quantities of goods and services
produced in 2 periods with the same set of prices. Year 1: P1
x X1 + P1y Y1
(5, 10) (8, 12) €146
Year 2: P2x X2 + P2
y Y2
(6, 11) (9, 14) €192 (+31%)To compute real GDP:(1) Calculate value of Year 2 quantities at Year 1 prices
P1x X2 + P1
y Y2 = 5 x 11 + 8 x 14 = 55+112= 167 (2) Express this as % of base year GDP. Real GDP increased by 14%.
4

GDP vs GNP
GDP is output produced by productive factors located in the country, regardless of their owners’ nationality.
GNP refers to output produced by productive factors owned by permanent residents of a country.
For most countries the difference is very small
5
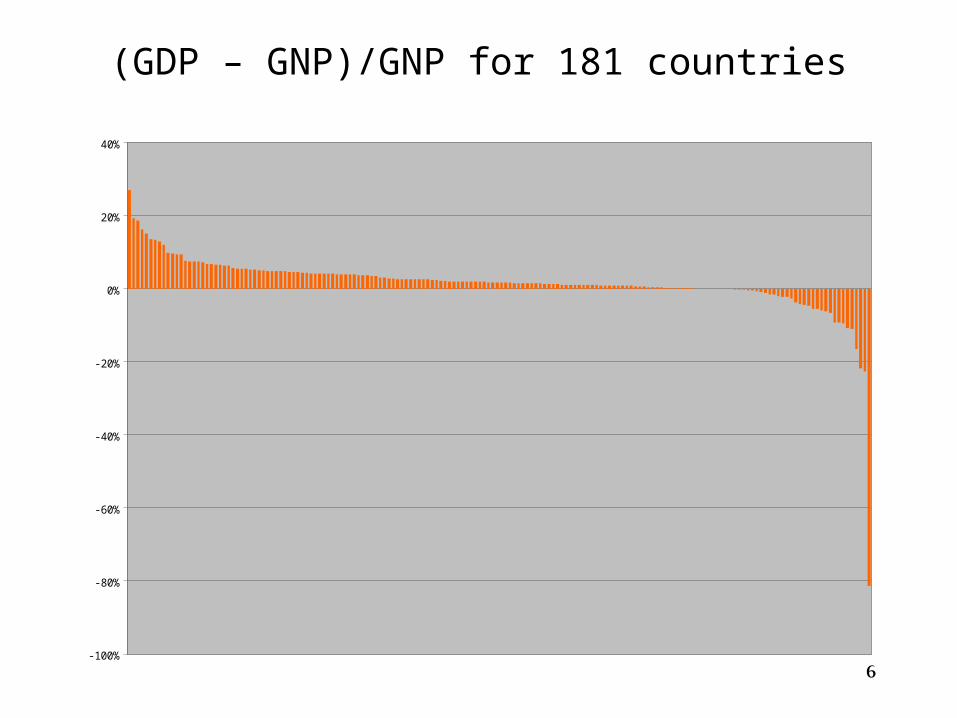
(GDP – GNP)/GNP for 181 countries
-100%
-80%
-60%
-40%
-20%
0%
20%
40%
6
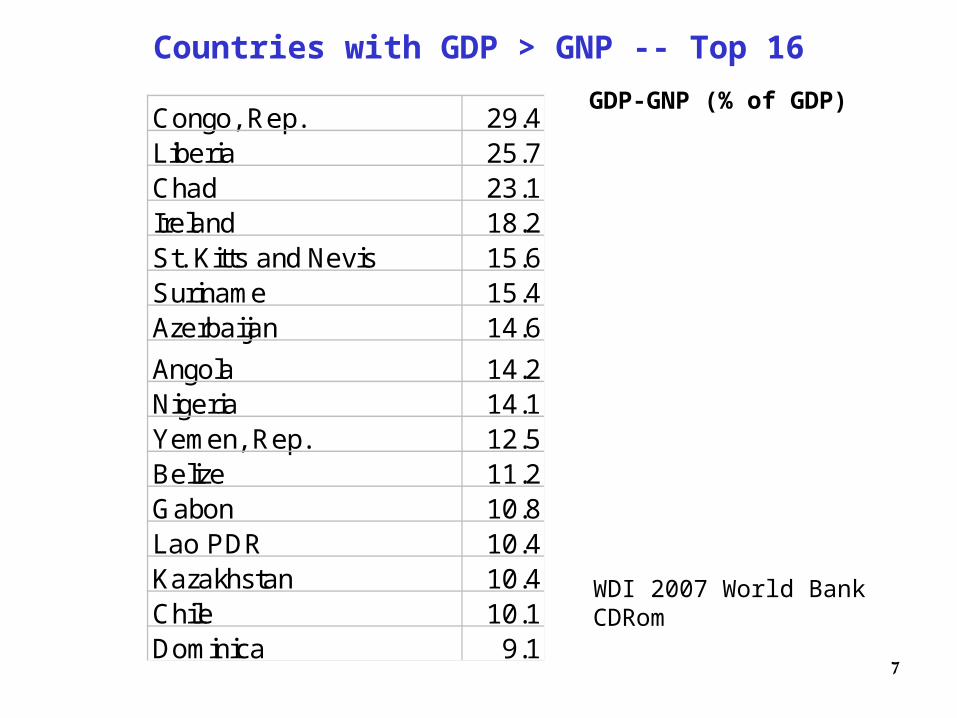
Countries with GDP > GNP -- Top 16
Congo, Rep. 29.4Liberia 25.7Chad 23.1Ireland 18.2St. Kitts and Nevis 15.6Suriname 15.4Azerbaijan 14.6
Angola 14.2Nigeria 14.1Yemen, Rep. 12.5Belize 11.2Gabon 10.8Lao PDR 10.4Kazakhstan 10.4Chile 10.1Dominica 9.1
GDP-GNP (% of GDP)
WDI 2007 World Bank CDRom
7

Countries with GNP > GDP -- Top 16
Timor-Leste 36.8
Marshall Islands 19.8
Lesotho 18.3
Moldova 11.0
Kuwait 9.9
West Bank and Gaza 9.0
Djibouti 8.7
Philippines 7.8
Switzerland 7.7
Bangladesh 4.9
Bosnia and Herzegovina 4.5
Micronesia, Fed. Sts. 4.4
Mauritania 3.4
Jordan 2.9
Palau 2.8
Japan 2.3
Memo:China 0.5%US 0.3%
World Bank Indicators 2007
% gap
8
GNP-GDP (% of GDP)

HOW TO COMPUTE GDPProduction Income Expenditure
Value added
=
Gross Domestic Product
___________
Disposal income of
households
+
Non distributed
profits
+
Net direct taxes
= National Income______
Net Indirect
Taxes
Depreciation
____________
Private consumption
+
Gross Investment
(incl. inventories)
+
Public Consumptio
n
+
Exports - Imports
(including income flows)
9
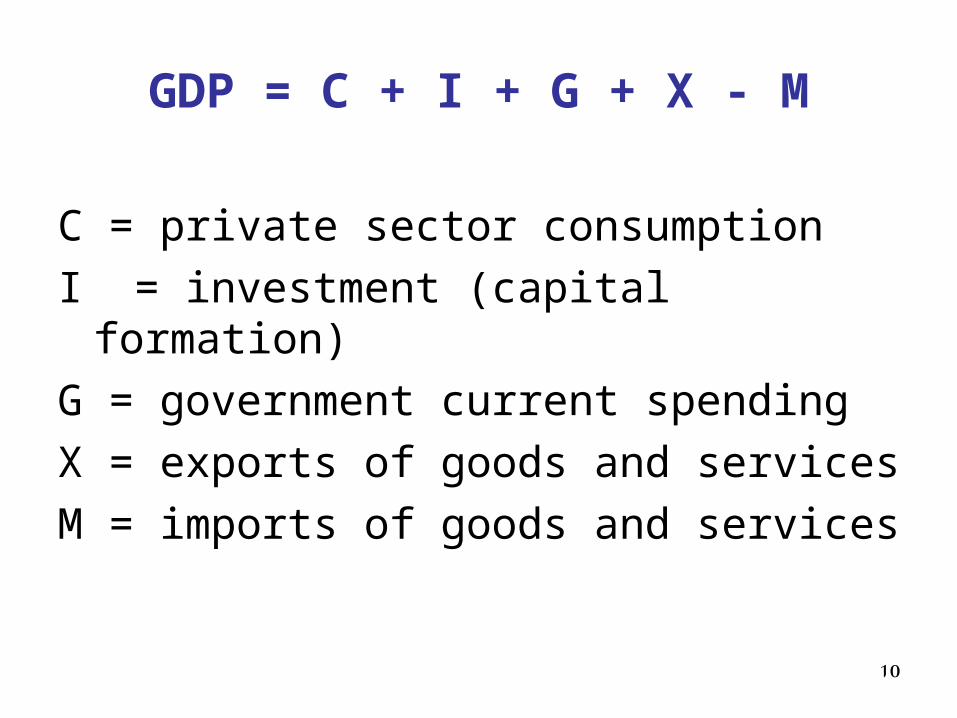
GDP = C + I + G + X - M
C = private sector consumption
I = investment (capital formation)
G = government current spending
X = exports of goods and services
M = imports of goods and services
10

Nominal GDP by Expenditure(% share of GDP)
2003 2007
Private Consumption 42 35
Investment 41 42
Government Consumption 15 13
Exports of Goods and Services 29 39
Imports of Goods and Services 27 30
Net Exports 2 9
Source: China Statistical Yearbook 2008
11Note: Consumption still at 35% of GDP in 2009, compared with 50% in S Korea at similar stage of development.Economist Oct 23 2010

Which sectors contribute most to GDP?
AgricultureFishing
Industry(incl Cons)
Services % of workforcein agric
Euro Area
2.2 26.6 71.1 4
China (2006)
12.5 47.3 40.3 42
France 2.5 21.3 76.3 4
Poland 5.1 31.0 64.0 18
Germany
1.1 29.1 69.8 2
Source: WTO Trade Policy Review “European Communities” 22 Jan 2007; EIU ChinaCountry Report March 2007
12

Purchasing Power Parity (PPP) 1. Nominal exchange rate in 2008 was 6.9 Yuan = US$1 . Hence $1000 = 6,900 yuan.
2. Buy a representative basket of goods and services in Washington DC.
A representative basket might, for example, contain
2 kilos of rice
1 kilo beef
5 inner city bus rides
one month’s rent of a two-bed apartment
1 personal computer
2 visits to doctor
etc.
(the list could run into hundreds of items)
3. Suppose this representative basket costs $1,000 to buy in Washington. Now buy exactly the same basket in China. Suppose it costs 3,800 yuan.
Purchasing Power Parity (PPP) rate of exchange = 3,800 yuan divided by $1000
PPP exchange rate: 3.8 yuan = $1
4. GDP per head in China (2008) = 22,640 Yuan = $3,260 at nominal exchange rate [6.9 yuan per dollar].
China’s GDP per head of 22,64 yuan per head = $5,962 at PPP (3.8 yuan per dollar].

Comparison between GDP per capita at current exchange rates and at PPP
Country GDP per capita ($) GDP per capita ($)(current prices and exchange rates) (PPP)
India 736 3452
Morocco 1711 4555
Argentina 4728 14,280
Mexico 7454 10,751
China 1713 6757
UK 36,509 33,238
France 34,936 30,386
Canada 34,484 33,375
US 41,890 41,890
Source: UN HDR Report 2007-200814

GDP calculated from nominal exchange rates underestimates the living standards of developing countries
This happens because non traded goods (services) are much cheaper in developing countries
Divergences in prices of traded goods are much less because of the law of one price
The gap between GDP measured at current exchange rate and GDP measured at PPP can be substantial
15
Exercise/ Review Question In UN HDR 2010 (table16), GDP is higher in
PPP than in current exchange rates for most countries.
a) For which countries is the opposite true?
b) Are there any developing countries in this category? Can you explain why?
16

Share of world production -- PPP vs current exchange rates (%)
PPP weight
US$ weight
China 13.2 4.1
Japan 6.9 11.4
US 21.0 28.7
EU 21.4 32.7
Source: Bank of America 2006 17
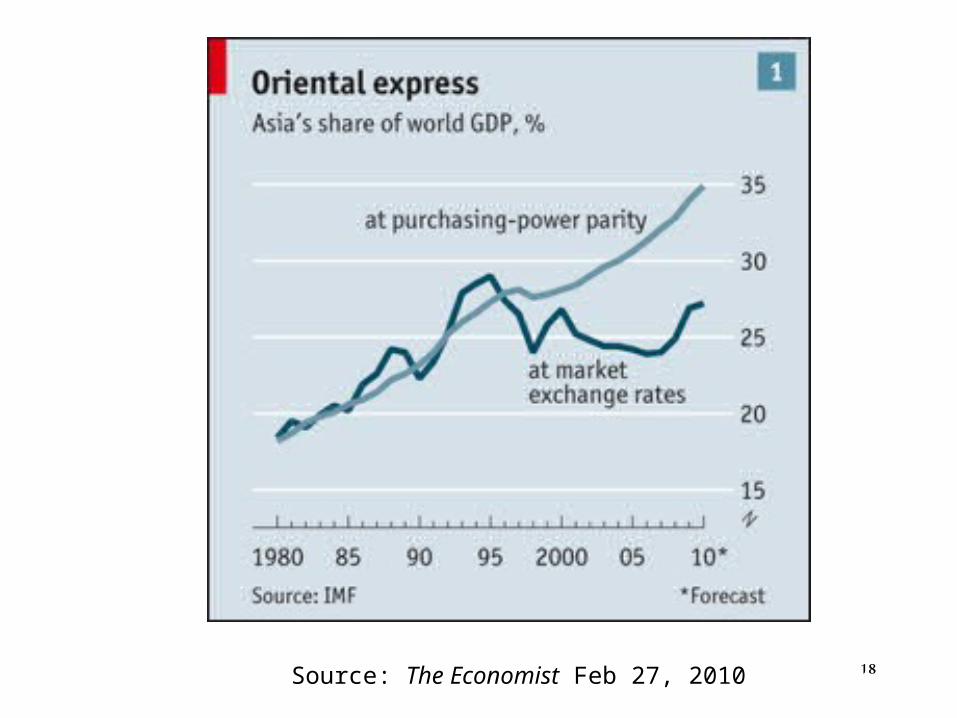
Source: The Economist Feb 27, 2010 18

Source: The Economist Feb 27, 2010

The basic purpose of development is to enlarge people’s choices. People often value achievements that do not show up at all, or not immediately, in income or growth figures: greater access to knowledge, better nutrition and health services, more secure livelihoods, security against crime and physical violence, satisfying leisure hours, political and cultural freedoms and sense of participation in community activities. The objective of development is to create an enabling environment for people to enjoy long, healthy and creative lives.
Mahbub ul Haq, Founder of the Human Development Report.
20

Human societies are based on the human tendency to want things, and are geared to satisfying those wants: possessions or facilities that bring ease and personal satisfaction. The results are frequently disappointing, and always terminate in the embarrassing non-sequitur of death.
Diarmaid MacCulloch A History of Christianity: the first three thousand years. Allen Lane London 2009 p 200

Classwork
pp 273-274
• E1, E2, E3
• Q1 (p 273)
22

Which of the following transactions should be included as part of GDP?
(a) A consumer pays €10 for a meal at the restaurant
(b) A company buys a plant from another firm for €1 million.
(c) A supplier sells computer chips to another firm that makes personal computers.
(d) A person buys a second-hand car from a dealer for
€5,000.
(e) A person buys a new car for €15,000.
(f) A factory exports €2m worth of PCs and sells €5m on the domestic market. It imports €2m component parts for the PCs.
(g) Chinese residents abroad send €5m to their relatives in China; China gives €5m aid to UN; Chinese temporary workers earn €5m in foreign countries
23
2. A person saves €10,000 of this year's income and spends it on new machinery. Explain how this would be recorded in the national accounts.
Another person takes €10,000 from under the mattress and buys shares on the stock market.
Would this be recorded in GDP?
24

Consider an economy with only three goods. Their market prices are P1 = 5, P2 = 10 and P3 = 15. The
production (and consumption) of each good during 1995 was Q1 = 20, Q2 = 25 and Q3 = 10.
(a) What is the value of nominal GDP?(b) Assume that in 1996 prices rise to P1 = 6, P2 = 12
and P3 = 17, and quantities produced (and
consumed) go to Q1 = 21, Q2 = 27 and Q3 = 11.
Calculate the value of nominal GDP. Compute real GNP, using 1995 prices as the base year. What is the
real rate of growth of the economy? What is the rate of inflation? (c) Calculate the
change in real GDP using 1996 prices as the base year. Explain why your answer is different to that in
(b).
25

1. Considerable resources are spent by the statistical authorities in deriving estimates of GDP. From a business perspective, would you say that this
exercise is a worthwhile and valuable one?
26

Shadow vs Official Economy (DMcA p.150)TOTAL
ECONOMIC ACTIVITY
SHADOW ECONOMY
FORMAL ECONOMY
Non-marketed economic activity
Marketed economic activity
Non-marketed economic activity
TOTAL MARKET ECONOMY
Marketed economic activity
27
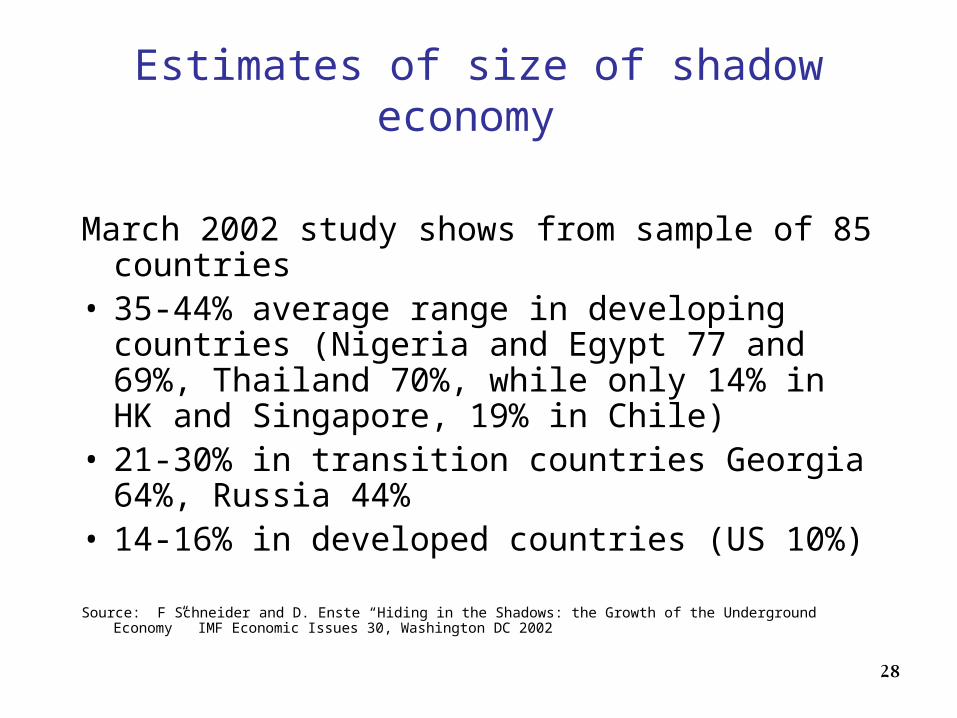
Estimates of size of shadow economy
March 2002 study shows from sample of 85 countries
• 35-44% average range in developing countries (Nigeria and Egypt 77 and 69%, Thailand 70%, while only 14% in HK and Singapore, 19% in Chile)
• 21-30% in transition countries Georgia 64%, Russia 44%
• 14-16% in developed countries (US 10%)
Source: F Schneider and D. Enste “Hiding in the Shadows: the Growth of the Underground Economy” IMF Economic Issues 30, Washington DC 2002 28

Source: F. Schneider, ‘The shadow economies of Western Europe’, Economic Affairs, September 1997; 2002 from F Schneider IMF paper
Size of the shadow economy (% GDP)
Country 1990 2002
Austria 5 11Belgium 20 22Canada 14 16Denmark 11 18Germany 12 16Greece 27 28France 9 15Ireland 12 16Italy 23 27Netherlands 14 13Norway 15 19Spain 21 23Sweden 16 19Switzerland 7 9UK 10 13USA 7 9
29
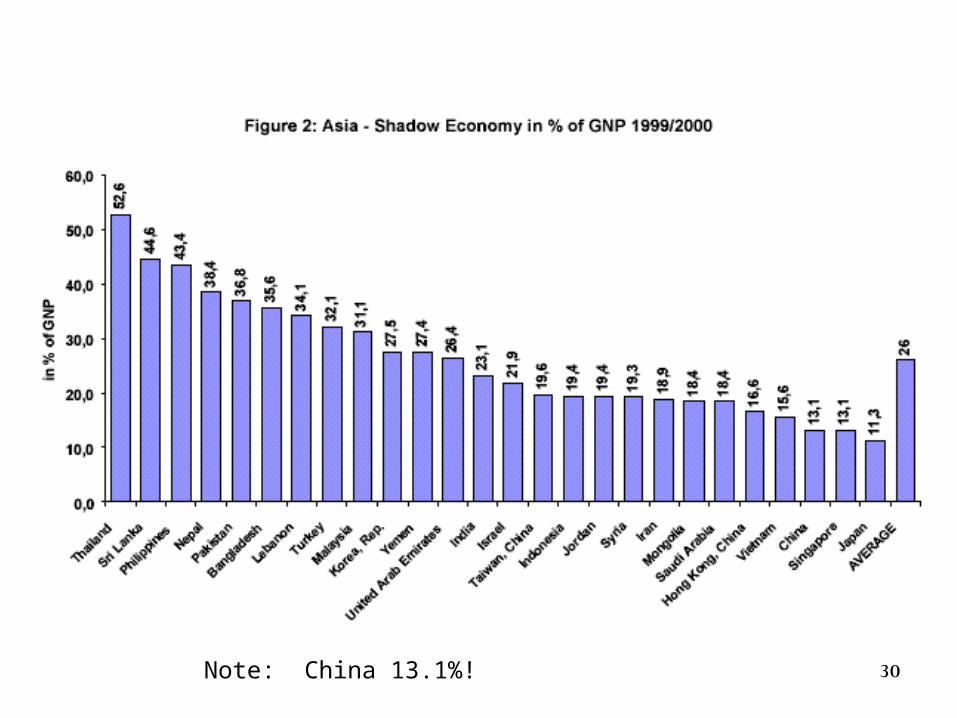
Note: China 13.1%! 30

QUESTIONS
Does the existence of a shadow economy imply that the market system is not working? Is its existence consistent with the laws of demand and supply?
Estimation of the shadow economy activities has been described by Schneider as a scientific passion for knowing the unknown. Discuss
31
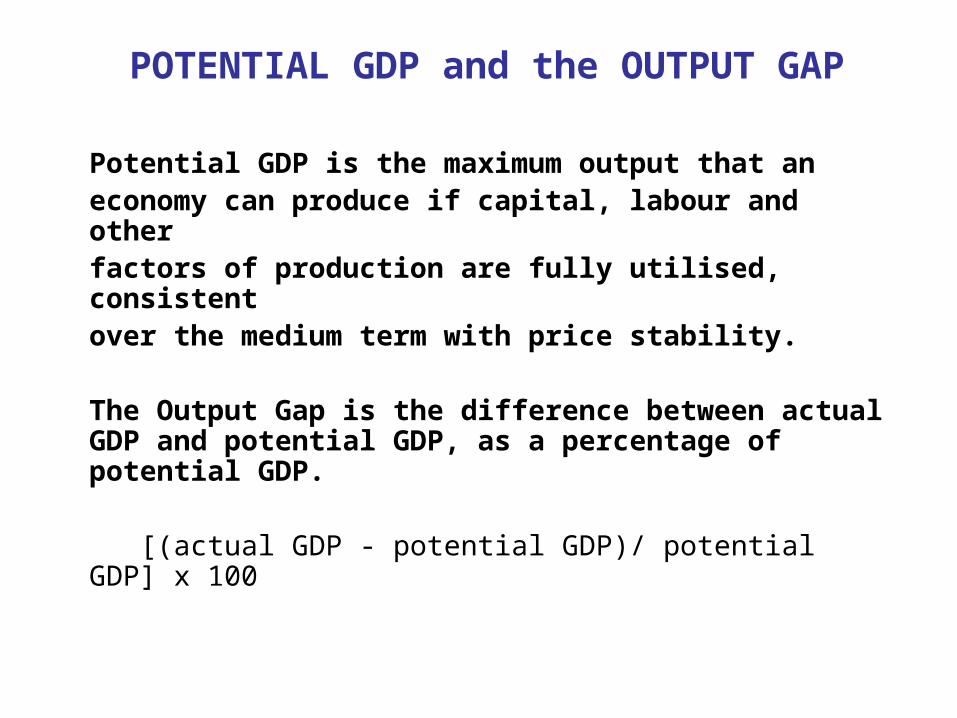
POTENTIAL GDP and the OUTPUT GAP
Potential GDP is the maximum output that an economy can produce if capital, labour and other factors of production are fully utilised, consistent over the medium term with price stability.
The Output Gap is the difference between actual GDP and potential GDP, as a percentage of potential GDP.
[(actual GDP - potential GDP)/ potential GDP] x 100

POTENTIAL VS. ACTUAL GDP
Actual GDP > Potential GDP price stability in jeopardy, indicators point to inflation
Actual GDP < Potential GDP resources being wasted, unemployment, indicators point to recession
Actual > PotentialReal GDP
Actual < Potential
Actual
Potential
time
33

Output gaps for 2009 and 2010
Notes: Output gap = [(actual GDP - potential GDP)/ potential GDP]Source: OECD, Economic Outlook, June 2010
34

35
Question for class
Output gaps have declined in 2010 relative to 2009.
Can you suggest reasons why this has happened?

ESTIMATION OF POTENTIAL GDP
Trend extrapolation Production function
approachGrowth in potential
output
Growth in TFP
Growth in employment
Growth in capital
stock
Enterprise-friendly economic policies
Advances in technology
Growth in the business sector
Growth in government
sector
36
Business Fluctuations (ch 16)
What are business fluctuations?
Why do they matter?
What causes them?
What can be done about them? --- next sessions – MONETARY AND FISCAL POLICY
37
What are business fluctuations?
Business fluctuations are fluctuations in aggregate economic activity that are widely diffused throughout the economy and have identifiable “peaks” and “troughs”
FLUCTUATIONS CYCLES
38

THE BUSINESS CYCLE WILL NOT DISAPPEAR ….
The inevitability of the business cycle, as it used to be called, I take for granted. Good times bring into existence: first, incompetent business executives; second, wrongful government policies; and, third, speculators. Working together, they ensure the eventual bust.
J K Galbraith “Challenges of the New Millennium” Finance
and Development December 1999 p 5
39
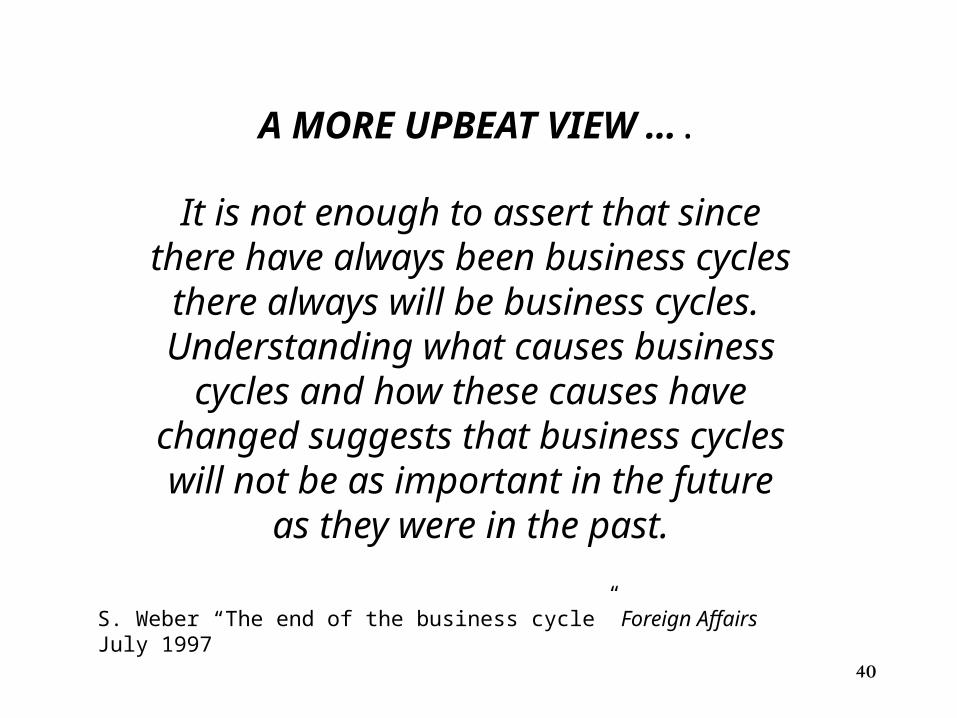
A MORE UPBEAT VIEW ….
It is not enough to assert that since there have always been business cycles there
always will be business cycles. Understanding what causes business cycles
and how these causes have changed suggests that business cycles will not be as important in the future as they were in the
past.
S. Weber “The end of the business cycle” Foreign Affairs July 1997
40
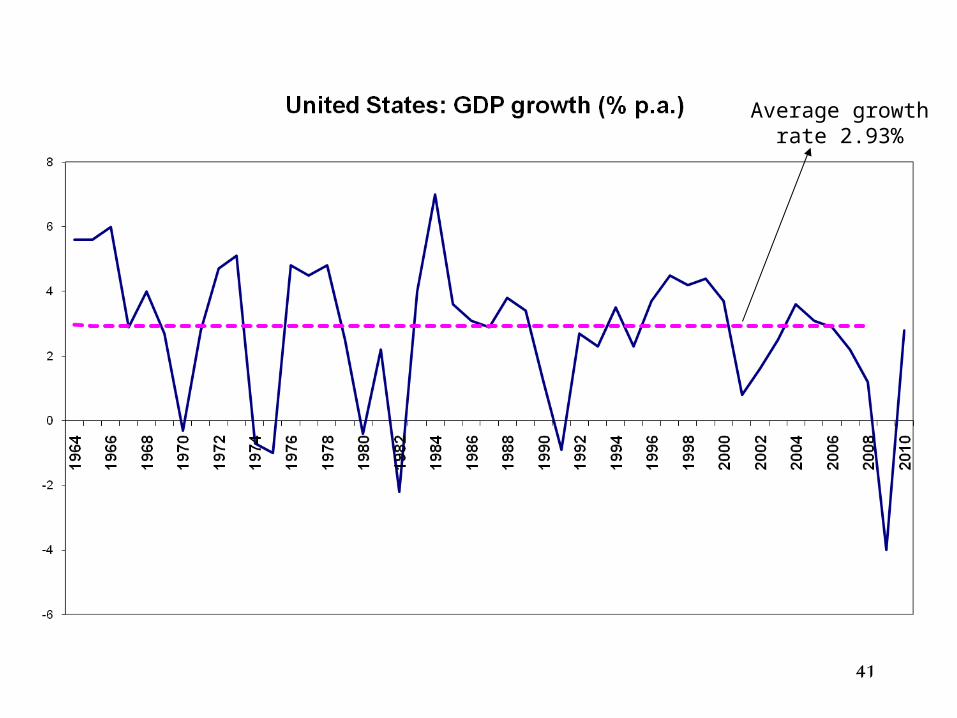
Average growth rate 2.93%
41

Source: The Economist Jan 2009
42


Av growth 2.3% p.a.
UNITED KINGDOM Real GDP Growth 1964-2010

GERMANY: Real GDP annual % growth
Average 3.2% p.a.

World Output: Growth rate (% pa) 1960-2010
Source: IMF Weo april 2009 46

Facts About Fluctuations
Negative growth infrequent
Irregular periodicity
No evidence of systematic long run cycles
Sustained period of growth followed by relative or absolute downturn
Industrial countries stay 3 times longer in the expansion phase of the cycle than in recession
Strong synchronisation (contagion) effects – few cycles “made at home”
Expanding role of emerging countries (now account for 2/3rds of world economy growth)
47
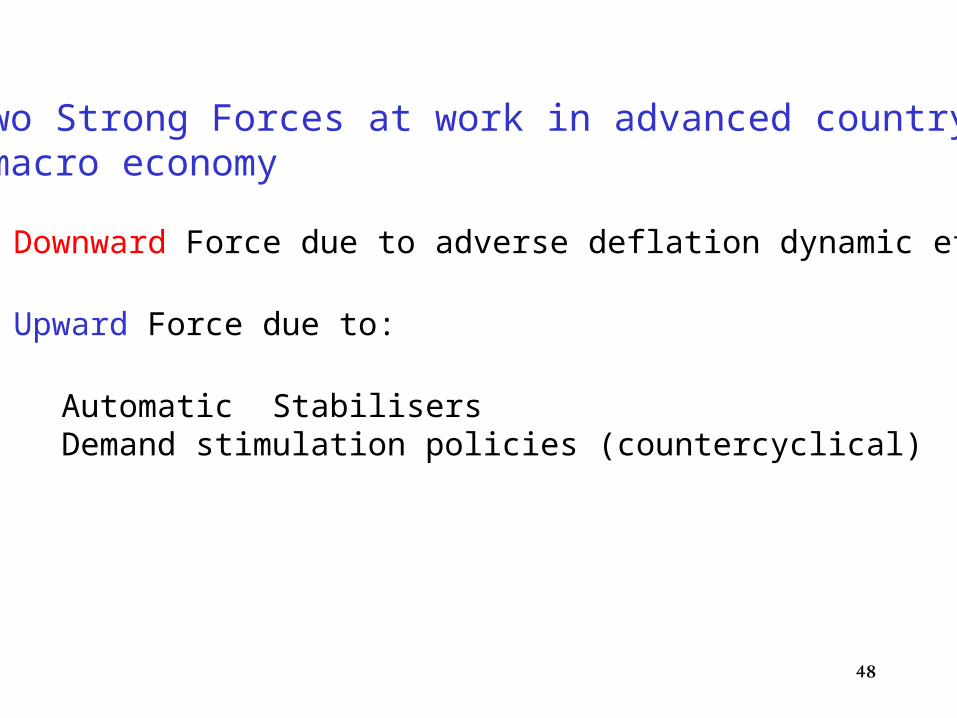
Two Strong Forces at work in advanced country macro economy
a) Downward Force due to adverse deflation dynamic effect
b) Upward Force due to:
Automatic StabilisersDemand stimulation policies (countercyclical)
48

Why Do Business Fluctuations Matter?
Long term economic growth is higher when stability is greater. Volatility not independent of trend. Fluctuations affect trend growth rate negatively.
Most people prefer stability to an unstable, boom-and-bust growth path.
49

Source: The Economist Nov 2008 *Based on calendar year data
50

'No one was responsible for the great Wall Street crash. No one engineered the speculation that preceded it. Both were the product of the free choice and decisions of thousands of individuals. The latter were not led to the slaughter. They were impelled to it by the seminal lunacy which has always seized people who are seized in turn with the notion that they can become very rich.'
John Kenneth Galbraith The Great Crash 1929 (1954)
51
52
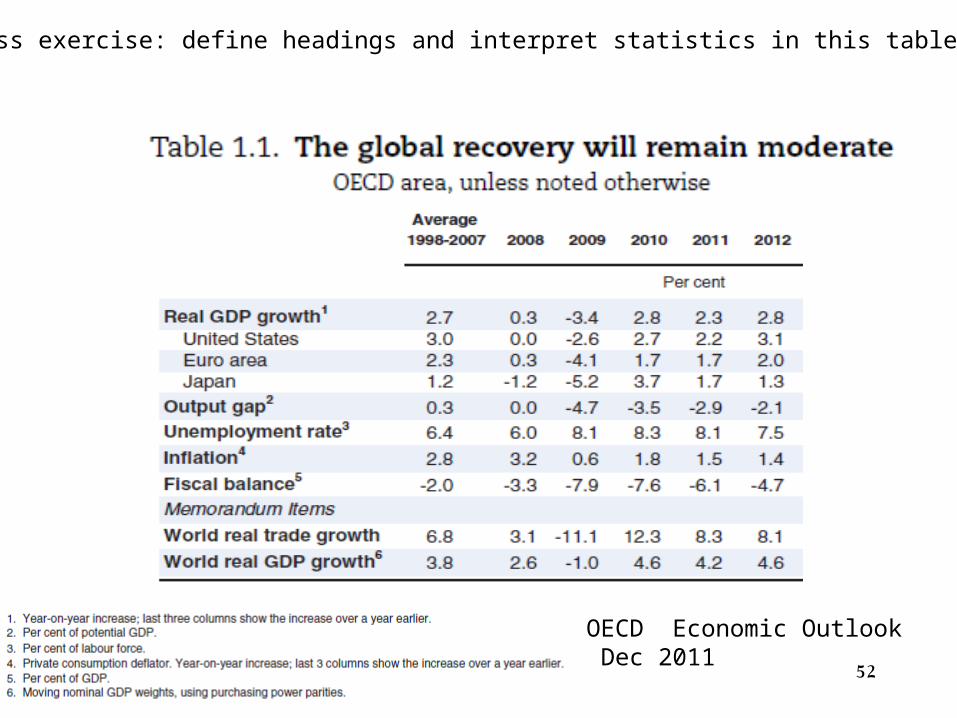
OECD Economic Outlook Dec 2011
Class exercise: define headings and interpret statistics in this table

53

Question for Class(for a country of your choice)
What are the main factors likely to constrain economic growth over the next 5 years?
54
Related Documents