STATISTICAL RELEASE P0441 Gross domestic product Fourth quarter 2016 Embargoed until: 7 March 2017 11:30 ENQUIRIES: FORTHCOMING ISSUE: EXPECTED RELEASE DATE: User Information Services First quarter 2017 6 June 2017 (012) 310 8600 www.statssa.gov.za [email protected] T +27 12 310 8911 F +27 12 310 8500 Private Bag X44, Pretoria, 0001, South Africa ISIbalo House, Koch Street, Salvokop, Pretoria, 0002

Welcome message from author
This document is posted to help you gain knowledge. Please leave a comment to let me know what you think about it! Share it to your friends and learn new things together.
Transcript

STATISTICAL RELEASE P0441
Gross domestic product
Fourth quarter 2016
Embargoed until:
7 March 2017 11:30
ENQUIRIES: FORTHCOMING ISSUE: EXPECTED RELEASE DATE:
User Information Services First quarter 2017 6 June 2017
(012) 310 8600
www.statssa.gov.za
T +27 12 310 8911
F +27 12 310 8500
Private Bag X44, Pretoria, 0001, South Africa
ISIbalo House, Koch Street, Salvokop, Pretoria, 0002

STATISTICS SOUTH AFRICA P0441
Gross domestic product, fourth quarter 2016
1
Contents GDP in the fourth quarter of 2016 fell by 0,3% ...................................................................................... 2
Gross domestic product at constant 2010 prices: fourth quarter of 2016 ........................................... 3
Expenditure on gross domestic product at constant 2010 prices: fourth quarter of 2016 ................ 5
Key findings for the annual estimates of 2016 ...................................................................................... 8
Regional estimates .................................................................................................................................. 9
Table 1 – Industry value added and GDP (constant 2010 prices, seasonally adjusted and annualised) ....................................... 10
Table 2 – Growth rates in industry value added and GDP (constant 2010 prices, seasonally adjusted and annualised) .............. 11
Table 3 – Contributions to growth in GDP (constant 2010 prices, seasonally adjusted and annualised) ....................................... 12
Table 4 – Industry value added and GDP (constant 2010 prices) .................................................................................................. 13
Table 5 – Growth rates in industry value added and GDP (constant 2010 prices)......................................................................... 14
Table 6 – Expenditure on GDP (constant 2010 prices, seasonally adjusted and annualised) ....................................................... 15
Table 7 – Growth rates in expenditure on GDP (constant 2010 prices, seasonally adjusted and annualised) .............................. 16
Table 8 – Contributions to growth in expenditure on GDP (constant 2010 prices, seasonally adjusted and annualised) .............. 17
Table 9 – Expenditure on GDP (constant 2010 prices) .................................................................................................................. 18
Table 10 – Growth rates in expenditure on GDP (constant 2010 prices) ....................................................................................... 19
EXPLANATORY NOTES ............................................................................................................................................ 20
TECHNICAL ENQUIRIES ........................................................................................................................................... 20
GENERAL INFORMATION ......................................................................................................................................... 21
STATISTICS SOUTH AFRICA P0441
Gross domestic product, fourth quarter 2016
2
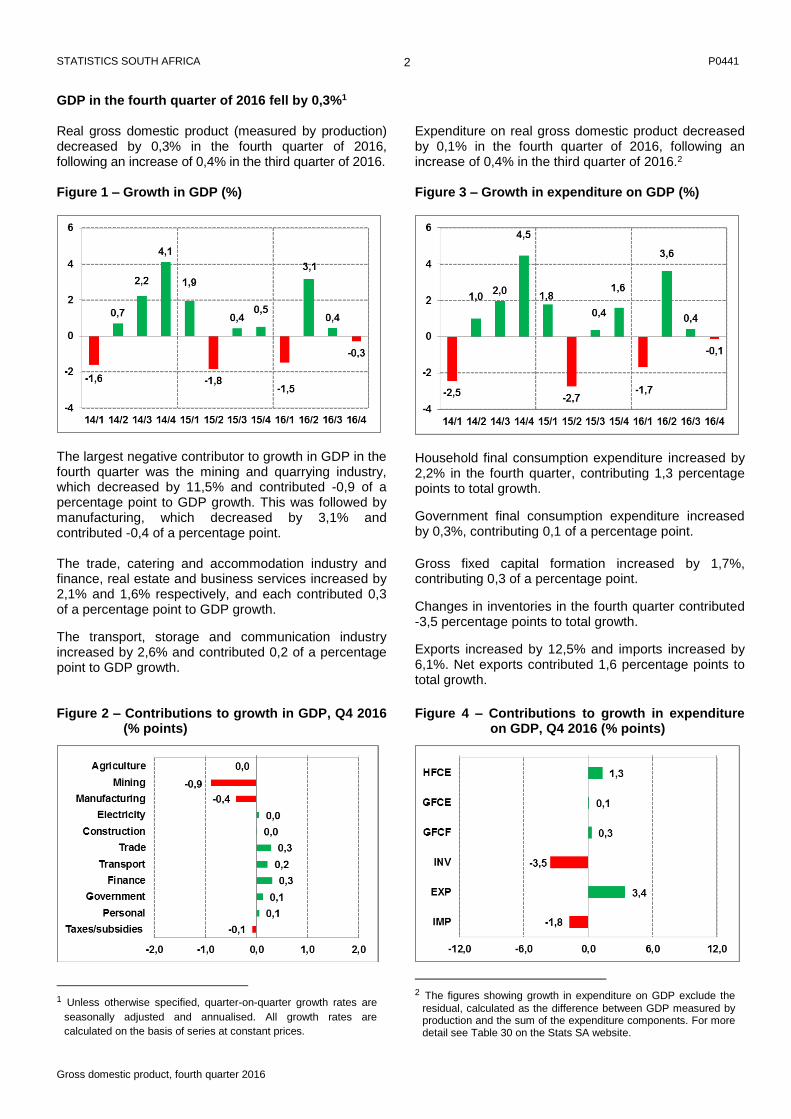
GDP in the fourth quarter of 2016 fell by 0,3%1 Real gross domestic product (measured by production) decreased by 0,3% in the fourth quarter of 2016, following an increase of 0,4% in the third quarter of 2016. Figure 1 – Growth in GDP (%)
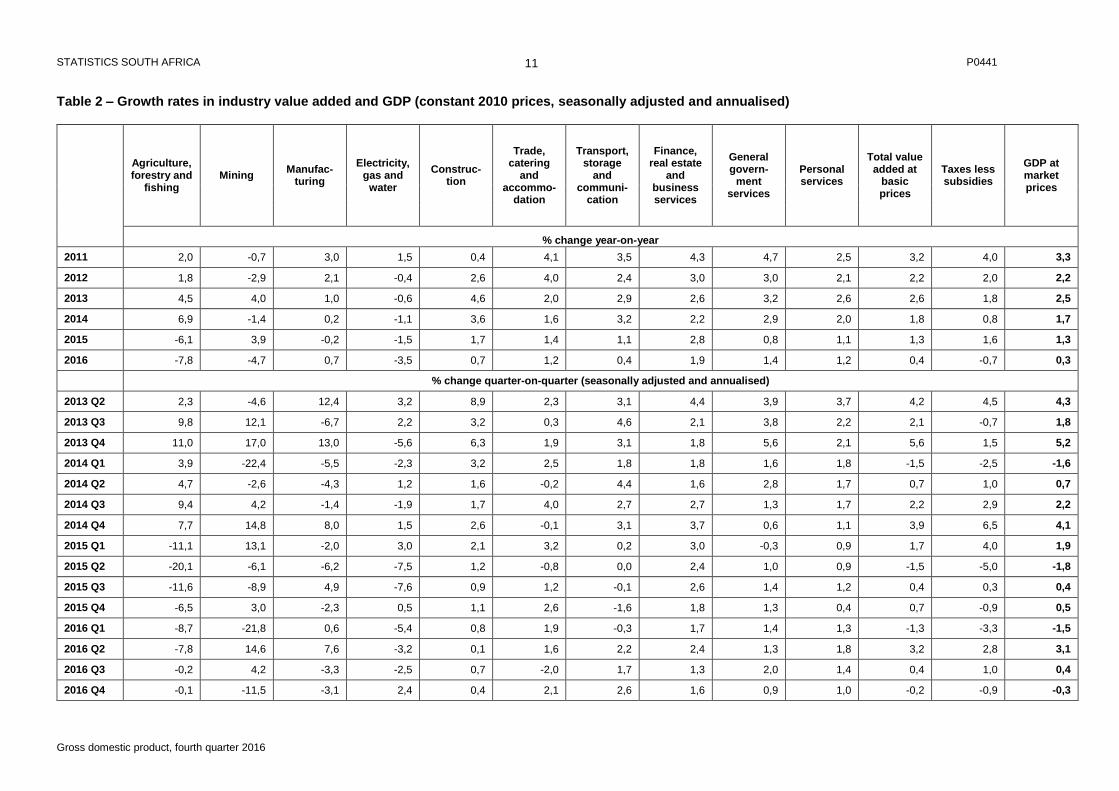
The largest negative contributor to growth in GDP in the fourth quarter was the mining and quarrying industry, which decreased by 11,5% and contributed -0,9 of a percentage point to GDP growth. This was followed by manufacturing, which decreased by 3,1% and contributed -0,4 of a percentage point. The trade, catering and accommodation industry and finance, real estate and business services increased by 2,1% and 1,6% respectively, and each contributed 0,3 of a percentage point to GDP growth.
The transport, storage and communication industry increased by 2,6% and contributed 0,2 of a percentage point to GDP growth. Figure 2 – Contributions to growth in GDP, Q4 2016
(% points)
1 Unless otherwise specified, quarter-on-quarter growth rates are
seasonally adjusted and annualised. All growth rates are
calculated on the basis of series at constant prices.
Expenditure on real gross domestic product decreased by 0,1% in the fourth quarter of 2016, following an increase of 0,4% in the third quarter of 2016.2 Figure 3 – Growth in expenditure on GDP (%)
Household final consumption expenditure increased by 2,2% in the fourth quarter, contributing 1,3 percentage points to total growth.
Government final consumption expenditure increased by 0,3%, contributing 0,1 of a percentage point.
Gross fixed capital formation increased by 1,7%, contributing 0,3 of a percentage point.
Changes in inventories in the fourth quarter contributed -3,5 percentage points to total growth.
Exports increased by 12,5% and imports increased by 6,1%. Net exports contributed 1,6 percentage points to total growth.
Figure 4 – Contributions to growth in expenditure
on GDP, Q4 2016 (% points)
2 The figures showing growth in expenditure on GDP exclude the
residual, calculated as the difference between GDP measured by production and the sum of the expenditure components. For more detail see Table 30 on the Stats SA website.

STATISTICS SOUTH AFRICA P0441
Gross domestic product, fourth quarter 2016
3
Gross domestic product at constant 2010 prices: fourth quarter of 2016
Primary sector
The agriculture, forestry and fishing industry has contracted for eight consecutive quarters. The industry’s decline
of 0,1% in the fourth quarter of 2016 was mainly the result of decreases in the production of horticultural products.
Mining and quarrying decreased by 11,5% in the fourth quarter. This was largely the result of lower production in
coal, gold and ‘other’ metal ores (including platinum).
Figure 5 – Mining and quarrying growth rate (%)
Secondary sector
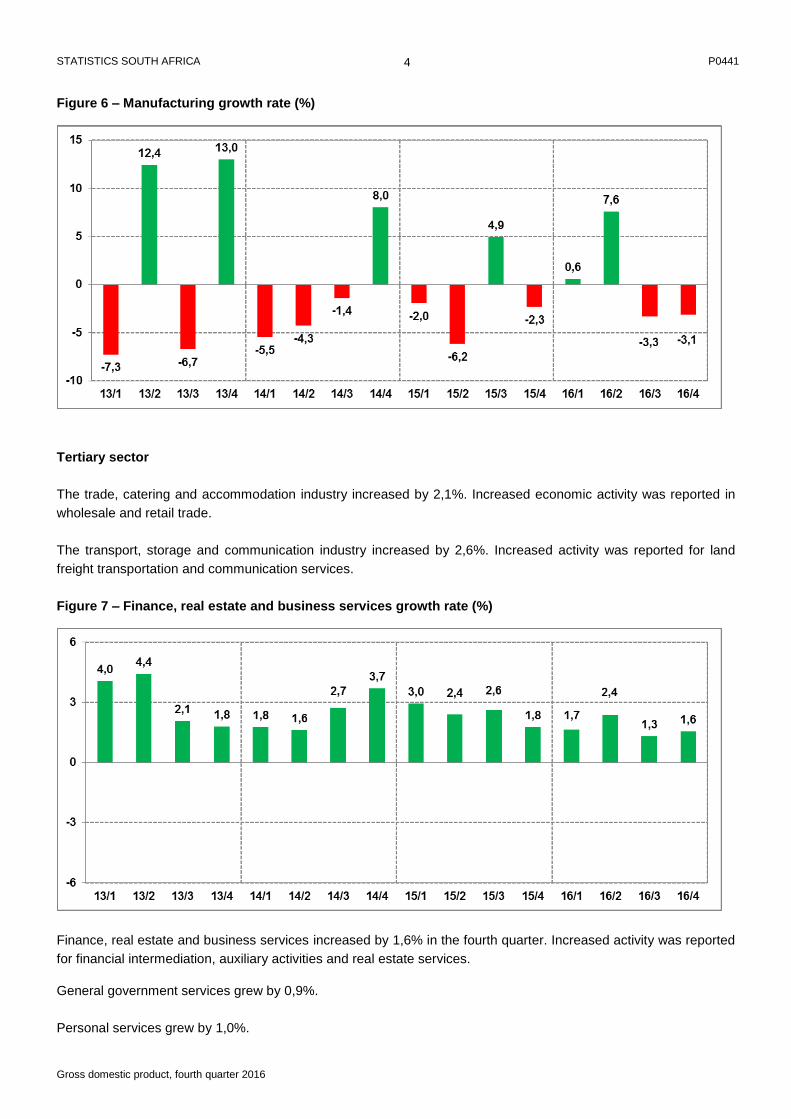
The manufacturing industry contracted by 3,1% in the fourth quarter. Notable decreases were reported by the food
and beverages division, the petroleum, chemical products, rubber and plastic products division, and the motor
vehicles, parts and accessories and other transport equipment division.
The electricity, gas and water industry grew by 2,4%, largely due to an increase in electricity consumed in the
fourth quarter. The amount of water distributed decreased, mainly driven by continued dry conditions and water
restrictions in most parts of the country.
The construction industry increased by 0,4%. Increased activity was reported for construction works and residential
buildings.
STATISTICS SOUTH AFRICA P0441
Gross domestic product, fourth quarter 2016
4
Figure 6 – Manufacturing growth rate (%)
Tertiary sector
The trade, catering and accommodation industry increased by 2,1%. Increased economic activity was reported in
wholesale and retail trade.
The transport, storage and communication industry increased by 2,6%. Increased activity was reported for land
freight transportation and communication services.
Figure 7 – Finance, real estate and business services growth rate (%)
Finance, real estate and business services increased by 1,6% in the fourth quarter. Increased activity was reported
for financial intermediation, auxiliary activities and real estate services.
General government services grew by 0,9%.
Personal services grew by 1,0%.

STATISTICS SOUTH AFRICA P0441
Gross domestic product, fourth quarter 2016
5
Expenditure on gross domestic product at constant 2010 prices: fourth quarter of 2016
Household final consumption expenditure (HFCE)
Final consumption expenditure by households increased by 2,2% in the fourth quarter.
Apart from the ‘other’ category, the increase was mainly the result of expenditure on clothing and footwear, which
increased by 10,4% and contributed 0,6 of a percentage point to growth in HFCE. A positive contribution was also
reported for expenditure on food and non-alchoholic beverages, with an increase of 2,4% and a contribution of 0,5
of a percentage point. A rise in purchases of recreational and tourism-related goods and services by residents
abroad was largely responsible for the increase in the ‘other’ category.
A negative contributor to growth in HFCE was expenditure on transport, which decreased by 3,9% and contributed
-0,6 of a percentage point.
Figure 8a – HFCE growth rate (%) Figure 8b – HFCE contributions, Q4 2016 (% points)
Government final consumption expenditure (GFCE)
Final consumption expenditure by general government increased by 0,3%. An increase in employment numbers
was reported.

STATISTICS SOUTH AFRICA P0441
Gross domestic product, fourth quarter 2016
6
Gross fixed capital formation (GFCF)
Gross fixed capital formation grew by 1,7%, following four consectutive quarters of decline.
The largest contributor to growth in the fourth quarter of 2016 was construction works, which increased by 3,6%
and contributed 1,2 percentage points to growth in GFCF. Transport equipment increased by 6,5% and contributed
0,7 of a percentage point.
Non-residential buildings, machinery and equipment, and ‘other’ assets contributed negatively to growth in GFCF.
Figure 9a – GFCF growth rate (%) Figure 9b – GFCF contributions, Q4 2016 (% points)
Changes in inventories
There was a R16 billion drawdown of inventories in the fourth quarter of 2016. Large decreases were reported for
the mining industry. These drawdowns were partially offset by a build-up of inventories mainly in the manufacturing
industry.

STATISTICS SOUTH AFRICA P0441
Gross domestic product, fourth quarter 2016
7
Exports and imports of goods and services
Exports of goods and services increased by 12,5%. Exports of precious metals and mineral products were largely
responsible for the increase.
Imports of goods and services increased by 6,1%. Imports of machinery and equipment were largely responsible
for the increase.
Figure 10 – Exports and imports of goods and services (R million, seasonally adjusted and annualised)
STATISTICS SOUTH AFRICA P0441
Gross domestic product, fourth quarter 2016
8
Key findings for the annual estimates of 2016
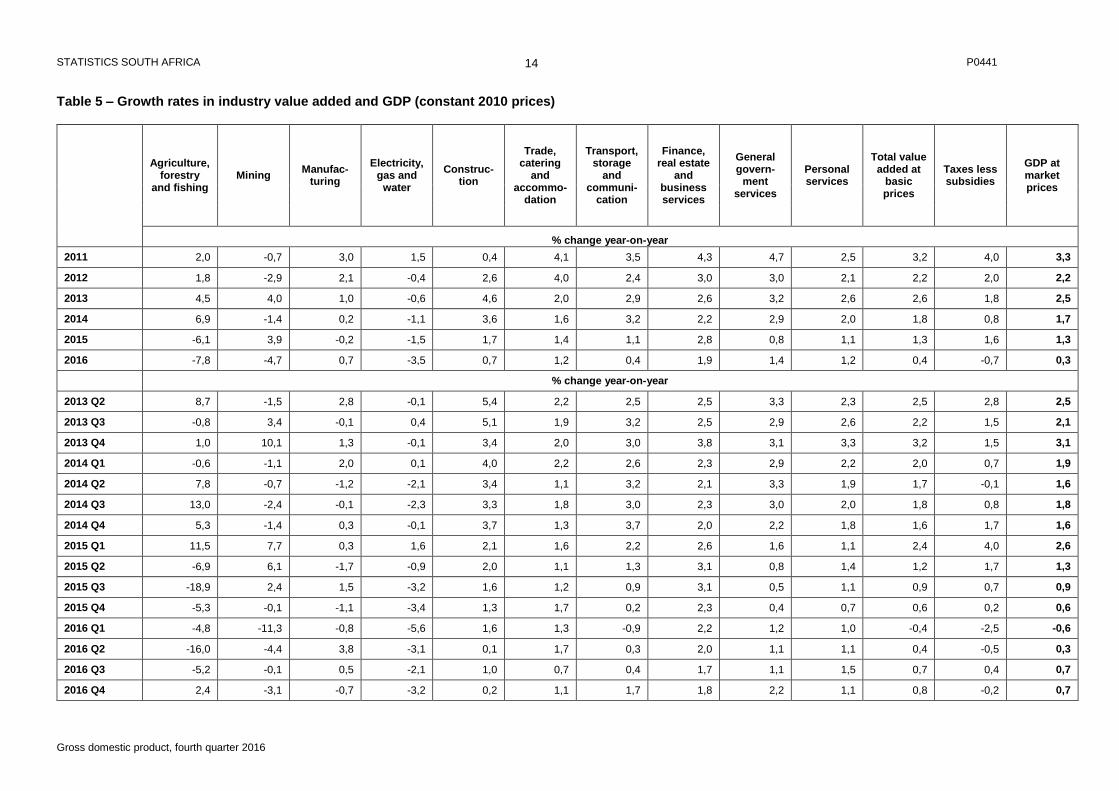
Real annual GDP increased by 0,3% in 2016 following an increase of 1,3 per cent in 2015
According to the latest preliminary indicators, the annual real estimate of GDP for 2016 increased by 0,3%
following an increase of 1,3% in 2015.
The annual real GDP growth of 0,3% in 2016 was primarily led by increased economic activity in the tertiary sector
and to a lesser extent by the secondary sector. On the other hand the primary sector recorded a negative growth
rate, decreasing by 5,4% with decreases in both the mining and quarrying and the agriculture, forestry and fishing
industries.
The main contributors to increased economic activity in 2016 were finance, real estate and business services,
which contributed 0,4 of a percentage point based on growth of 1,9%; general government services, which
contributed 0,2 of a percentage point based on growth of 1,4%; and the wholesale, retail and motor trade; catering
and accommodation industry, which contributed 0,2 of a percentage point based on growth of 1,2%.
Expenditure on GDP in 2016 Expenditure on GDP increased by 0,5% in 2016, decelerating from an increase of 1,2% in 2015.
Household consumption increased by 0,8% and contributed 0,5 of a percentage point, while government
consumption increased by 2,0% and contributed 0,4 of a percentage point. Net exports contributed 1,1% to growth
in expenditure on GDP.
Gross fixed capital formation decreased by 3,9%, contributing -0,8 of a percentage point to total growth, and there
was an inventory drawdown of R11 billion, contributing a further -0,8 of a percentage point.
Nominal GDP estimated at R4,3 trillion for the year 2016 The nominal gross domestic product at market prices in 2016 was R4,3 trillion, which is R287 billion more than in 2015. The most notable performances were as follows:
General government services expanded by R48 billion to R671 billion;
Finance, real estate and business services expanded by R47 billion to R782 billion;
The wholesale, retail and motor trade; catering and accommodation industry expanded by R46 billion to
R590 billion; and
The manufacturing industry expanded by R32 billion to R517 billion.
STATISTICS SOUTH AFRICA P0441
Gross domestic product, fourth quarter 2016
9
Regional estimates
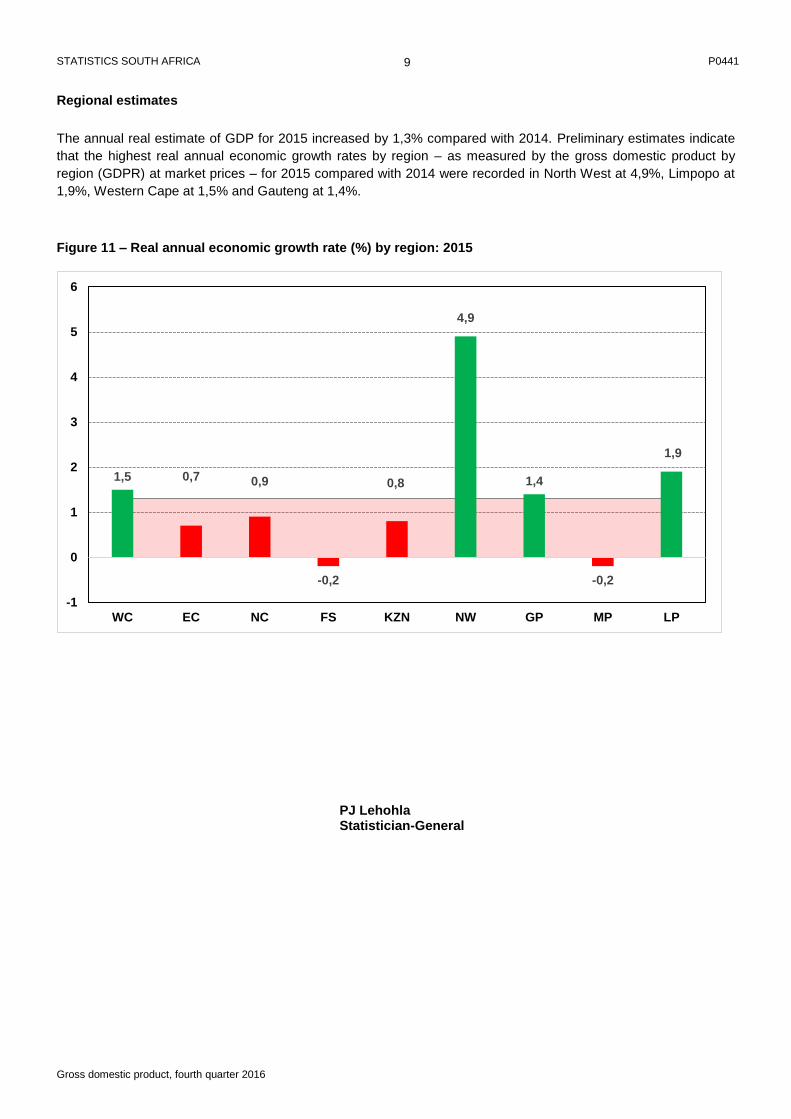
The annual real estimate of GDP for 2015 increased by 1,3% compared with 2014. Preliminary estimates indicate
that the highest real annual economic growth rates by region – as measured by the gross domestic product by
region (GDPR) at market prices – for 2015 compared with 2014 were recorded in North West at 4,9%, Limpopo at
1,9%, Western Cape at 1,5% and Gauteng at 1,4%.
Figure 11 – Real annual economic growth rate (%) by region: 2015
PJ Lehohla Statistician-General
1,5 0,7 0,9
-0,2
0,8
4,9
1,4
-0,2
1,9
-1
0
1
2
3
4
5
6
WC EC NC FS KZN NW GP MP LP

STATISTICS SOUTH AFRICA P0441
Gross domestic product, fourth quarter 2016
10
Table 1 – Industry value added and GDP (constant 2010 prices, seasonally adjusted and annualised)
Agriculture, forestry and
fishing Mining
Manufac-turing
Electricity, gas and
water
Construc-tion
Trade, catering
and accommo-
dation
Transport, storage
and communi-
cation
Finance, real estate
and business services
General govern-
ment services
Personal services
Total value added at
basic prices
Taxes less subsidies
GDP at market prices
R million
2011 66 913 228 646 369 582 68 978 95 860 385 696 237 442 545 802 423 833 152 226 2 574 977 263 280 2 838 257
2012 68 093 221 990 377 330 68 733 98 329 400 938 243 188 562 042 436 466 155 472 2 632 583 268 495 2 901 078
2013 71 143 230 772 381 173 68 289 102 818 408 968 250 129 576 707 450 454 159 530 2 699 984 273 309 2 973 293
2014 76 041 227 522 382 006 67 515 106 507 415 480 258 023 589 314 463 315 162 653 2 748 376 275 450 3 023 826
2015 71 418 236 457 381 078 66 484 108 353 421 407 260 932 605 550 467 062 164 439 2 783 180 279 921 3 063 101
2016 65 843 225 300 383 639 64 164 109 132 426 525 261 952 617 168 473 592 166 359 2 793 676 277 984 3 071 660
R million (seasonally adjusted and annualised)
2013 Q2 69 944 224 538 384 341 68 487 102 548 408 947 248 718 576 136 447 874 159 251 2 690 785 274 045 2 964 830
2013 Q3 71 598 231 036 377 694 68 852 103 371 409 217 251 526 579 080 452 073 160 115 2 704 562 273 561 2 978 123
2013 Q4 73 487 240 296 389 426 67 860 104 967 411 121 253 460 581 676 458 242 160 962 2 741 497 274 612 3 016 109
2014 Q1 74 192 225 499 383 983 67 458 105 798 413 635 254 568 584 231 460 026 161 674 2 731 065 272 877 3 003 942
2014 Q2 75 046 224 000 379 804 67 668 106 208 413 377 257 338 586 568 463 167 162 376 2 735 553 273 548 3 009 101
2014 Q3 76 745 226 312 378 442 67 339 106 664 417 494 259 089 590 531 464 665 163 051 2 750 333 275 490 3 025 823
2014 Q4 78 181 234 274 385 796 67 596 107 357 417 413 261 096 595 924 465 403 163 512 2 776 552 279 885 3 056 437
2015 Q1 75 912 241 572 383 900 68 097 107 926 420 756 261 200 600 274 465 028 163 876 2 788 541 282 635 3 071 176
2015 Q2 71 764 237 823 377 839 66 785 108 238 419 930 261 225 603 817 466 129 164 258 2 777 807 279 066 3 056 873
2015 Q3 69 581 232 347 382 408 65 483 108 477 421 134 261 190 607 734 467 799 164 736 2 780 887 279 309 3 060 196
2015 Q4 68 416 234 087 380 168 65 571 108 769 423 808 260 113 610 376 469 294 164 887 2 785 488 278 674 3 064 162
2016 Q1 66 878 220 124 380 753 64 659 108 987 425 776 259 928 612 881 470 981 165 411 2 776 375 276 376 3 052 751
2016 Q2 65 533 227 762 387 794 64 139 109 013 427 471 261 336 616 466 472 547 166 149 2 798 211 278 259 3 076 470
2016 Q3 65 493 230 105 384 512 63 738 109 212 425 306 262 431 618 470 474 911 166 734 2 800 913 278 970 3 079 883
2016 Q4 65 470 223 212 381 498 64 120 109 316 427 547 264 114 620 856 475 929 167 143 2 799 206 278 331 3 077 537
STATISTICS SOUTH AFRICA P0441
Gross domestic product, fourth quarter 2016
11
Table 2 – Growth rates in industry value added and GDP (constant 2010 prices, seasonally adjusted and annualised)
Agriculture, forestry and
fishing Mining
Manufac-turing
Electricity, gas and
water
Construc-tion
Trade, catering
and accommo-
dation
Transport, storage
and communi-
cation
Finance, real estate
and business services
General govern-
ment services
Personal services
Total value added at
basic prices
Taxes less subsidies
GDP at market prices
% change year-on-year
2011 2,0 -0,7 3,0 1,5 0,4 4,1 3,5 4,3 4,7 2,5 3,2 4,0 3,3
2012 1,8 -2,9 2,1 -0,4 2,6 4,0 2,4 3,0 3,0 2,1 2,2 2,0 2,2
2013 4,5 4,0 1,0 -0,6 4,6 2,0 2,9 2,6 3,2 2,6 2,6 1,8 2,5
2014 6,9 -1,4 0,2 -1,1 3,6 1,6 3,2 2,2 2,9 2,0 1,8 0,8 1,7
2015 -6,1 3,9 -0,2 -1,5 1,7 1,4 1,1 2,8 0,8 1,1 1,3 1,6 1,3
2016 -7,8 -4,7 0,7 -3,5 0,7 1,2 0,4 1,9 1,4 1,2 0,4 -0,7 0,3
% change quarter-on-quarter (seasonally adjusted and annualised)
2013 Q2 2,3 -4,6 12,4 3,2 8,9 2,3 3,1 4,4 3,9 3,7 4,2 4,5 4,3
2013 Q3 9,8 12,1 -6,7 2,2 3,2 0,3 4,6 2,1 3,8 2,2 2,1 -0,7 1,8
2013 Q4 11,0 17,0 13,0 -5,6 6,3 1,9 3,1 1,8 5,6 2,1 5,6 1,5 5,2
2014 Q1 3,9 -22,4 -5,5 -2,3 3,2 2,5 1,8 1,8 1,6 1,8 -1,5 -2,5 -1,6
2014 Q2 4,7 -2,6 -4,3 1,2 1,6 -0,2 4,4 1,6 2,8 1,7 0,7 1,0 0,7
2014 Q3 9,4 4,2 -1,4 -1,9 1,7 4,0 2,7 2,7 1,3 1,7 2,2 2,9 2,2
2014 Q4 7,7 14,8 8,0 1,5 2,6 -0,1 3,1 3,7 0,6 1,1 3,9 6,5 4,1
2015 Q1 -11,1 13,1 -2,0 3,0 2,1 3,2 0,2 3,0 -0,3 0,9 1,7 4,0 1,9
2015 Q2 -20,1 -6,1 -6,2 -7,5 1,2 -0,8 0,0 2,4 1,0 0,9 -1,5 -5,0 -1,8
2015 Q3 -11,6 -8,9 4,9 -7,6 0,9 1,2 -0,1 2,6 1,4 1,2 0,4 0,3 0,4
2015 Q4 -6,5 3,0 -2,3 0,5 1,1 2,6 -1,6 1,8 1,3 0,4 0,7 -0,9 0,5
2016 Q1 -8,7 -21,8 0,6 -5,4 0,8 1,9 -0,3 1,7 1,4 1,3 -1,3 -3,3 -1,5
2016 Q2 -7,8 14,6 7,6 -3,2 0,1 1,6 2,2 2,4 1,3 1,8 3,2 2,8 3,1
2016 Q3 -0,2 4,2 -3,3 -2,5 0,7 -2,0 1,7 1,3 2,0 1,4 0,4 1,0 0,4
2016 Q4 -0,1 -11,5 -3,1 2,4 0,4 2,1 2,6 1,6 0,9 1,0 -0,2 -0,9 -0,3

STATISTICS SOUTH AFRICA P0441
Gross domestic product, fourth quarter 2016
12
Table 3 – Contributions to growth in GDP (constant 2010 prices, seasonally adjusted and annualised)
Agriculture, forestry and
fishing Mining
Manufac-turing
Electricity, gas and
water
Construc-tion
Trade, catering
and accommo-
dation
Transport, storage
and communi-
cation
Finance, real estate
and business services
General govern-
ment services
Personal services
Total value added at
basic prices
Taxes less subsidies
GDP at market prices
Percentage points
2011 0,0 -0,1 0,4 0,0 0,0 0,6 0,3 0,8 0,7 0,1 2,9 0,4 3,3
2012 0,0 -0,2 0,3 0,0 0,1 0,5 0,2 0,6 0,4 0,1 2,0 0,2 2,2
2013 0,1 0,3 0,1 0,0 0,2 0,3 0,2 0,5 0,5 0,1 2,3 0,2 2,5
2014 0,2 -0,1 0,0 0,0 0,1 0,2 0,3 0,4 0,4 0,1 1,6 0,1 1,7
2015 -0,2 0,3 0,0 0,0 0,1 0,2 0,1 0,5 0,1 0,1 1,2 0,1 1,3
2016 -0,2 -0,4 0,1 -0,1 0,0 0,2 0,0 0,4 0,2 0,1 0,3 -0,1 0,3
Percentage points
2013 Q2 0,1 -0,4 1,5 0,1 0,3 0,3 0,3 0,9 0,6 0,2 3,8 0,4 4,3
2013 Q3 0,2 0,9 -0,9 0,0 0,1 0,0 0,4 0,4 0,6 0,1 1,9 -0,1 1,8
2013 Q4 0,3 1,3 1,6 -0,1 0,2 0,3 0,3 0,4 0,8 0,1 5,1 0,1 5,2
2014 Q1 0,1 -2,0 -0,7 -0,1 0,1 0,3 0,1 0,3 0,2 0,1 -1,4 -0,2 -1,6
2014 Q2 0,1 -0,2 -0,6 0,0 0,1 0,0 0,4 0,3 0,4 0,1 0,6 0,1 0,7
2014 Q3 0,2 0,3 -0,2 0,0 0,1 0,6 0,2 0,5 0,2 0,1 2,0 0,3 2,2
2014 Q4 0,2 1,1 1,0 0,0 0,1 0,0 0,3 0,7 0,1 0,1 3,5 0,6 4,1
2015 Q1 -0,3 1,0 -0,2 0,1 0,1 0,4 0,0 0,6 0,0 0,0 1,6 0,4 1,9
2015 Q2 -0,5 -0,5 -0,8 -0,2 0,0 -0,1 0,0 0,5 0,1 0,0 -1,4 -0,5 -1,8
2015 Q3 -0,3 -0,7 0,6 -0,2 0,0 0,2 0,0 0,5 0,2 0,1 0,4 0,0 0,4
2015 Q4 -0,2 0,2 -0,3 0,0 0,0 0,4 -0,1 0,3 0,2 0,0 0,6 -0,1 0,5
2016 Q1 -0,2 -1,8 0,1 -0,1 0,0 0,3 0,0 0,3 0,2 0,1 -1,2 -0,3 -1,5
2016 Q2 -0,2 1,0 0,9 -0,1 0,0 0,2 0,2 0,5 0,2 0,1 2,9 0,2 3,1
2016 Q3 0,0 0,3 -0,4 -0,1 0,0 -0,3 0,1 0,3 0,3 0,1 0,4 0,1 0,4
2016 Q4 0,0 -0,9 -0,4 0,0 0,0 0,3 0,2 0,3 0,1 0,1 -0,2 -0,1 -0,3
STATISTICS SOUTH AFRICA P0441
Gross domestic product, fourth quarter 2016
13
Table 4 – Industry value added and GDP (constant 2010 prices)
Agriculture, forestry and
fishing Mining
Manufac-turing
Electricity, gas and
water
Construc-tion
Trade, catering
and accommo-
dation
Transport, storage
and communi-
cation
Finance, real estate
and business services
General govern-
ment services
Personal services
Total value added at
basic prices
Taxes less subsidies
GDP at market prices
R million
2011 66 913 228 646 369 582 68 978 95 860 385 696 237 442 545 802 423 833 152 226 2 574 977 263 280 2 838 257
2012 68 093 221 990 377 330 68 733 98 329 400 938 243 188 562 042 436 466 155 472 2 632 583 268 495 2 901 078
2013 71 143 230 772 381 173 68 289 102 818 408 968 250 129 576 707 450 454 159 530 2 699 984 273 309 2 973 293
2014 76 041 227 522 382 006 67 515 106 507 415 480 258 023 589 314 463 315 162 653 2 748 376 275 450 3 023 826
2015 71 418 236 457 381 078 66 484 108 353 421 407 260 932 605 550 467 062 164 439 2 783 180 279 921 3 063 101
2016 65 843 225 300 383 639 64 164 109 132 426 525 261 952 617 168 473 592 166 359 2 793 676 277 984 3 071 660
R million
2013 Q2 25 651 57 307 95 349 17 067 25 486 97 110 61 227 143 478 112 149 40 434 675 256 67 958 743 214
2013 Q3 18 224 57 881 96 452 17 736 25 506 99 530 64 319 144 207 112 951 40 188 676 994 68 686 745 680
2013 Q4 11 374 60 946 99 915 17 452 26 404 116 501 64 793 145 868 113 888 39 137 696 279 70 606 766 885
2014 Q1 15 806 54 047 91 204 16 047 26 429 97 890 61 360 146 453 114 739 40 636 664 611 66 547 731 158
2014 Q2 27 664 56 907 94 243 16 712 26 357 98 225 63 198 146 555 115 798 41 205 686 862 67 913 754 775
2014 Q3 20 595 56 480 96 380 17 326 26 347 101 335 66 255 147 461 116 349 40 988 689 515 69 217 758 732
2014 Q4 11 977 60 088 100 178 17 431 27 375 118 030 67 210 148 845 116 430 39 824 707 388 71 773 779 161
2015 Q1 17 620 58 231 91 457 16 307 26 991 99 407 62 711 150 233 116 538 41 103 680 598 69 227 749 825
2015 Q2 25 745 60 393 92 673 16 554 26 879 99 350 64 035 151 071 116 727 41 784 695 211 69 077 764 288
2015 Q3 16 708 57 824 97 851 16 780 26 758 102 581 66 850 152 005 116 925 41 443 695 724 69 718 765 442
2015 Q4 11 345 60 009 99 098 16 842 27 724 120 070 67 335 152 241 116 873 40 110 711 647 71 899 783 546
2016 Q1 16 772 51 664 90 721 15 401 27 430 100 700 62 124 153 517 117 923 41 522 677 773 67 511 745 284
2016 Q2 21 623 57 717 96 225 16 034 26 896 101 045 64 251 154 130 118 019 42 235 698 177 68 699 766 876
2016 Q3 15 835 57 754 98 297 16 431 27 017 103 349 67 112 154 559 118 179 42 051 700 584 69 998 770 582
2016 Q4 11 614 58 165 98 396 16 297 27 789 121 431 68 465 154 962 119 470 40 551 717 142 71 776 788 918
STATISTICS SOUTH AFRICA P0441
Gross domestic product, fourth quarter 2016
14
Table 5 – Growth rates in industry value added and GDP (constant 2010 prices)
Agriculture, forestry
and fishing Mining
Manufac-turing
Electricity, gas and
water
Construc-tion
Trade, catering
and accommo-
dation
Transport, storage
and communi-
cation
Finance, real estate
and business services
General govern-
ment services
Personal services
Total value added at
basic prices
Taxes less subsidies
GDP at market prices
% change year-on-year
2011 2,0 -0,7 3,0 1,5 0,4 4,1 3,5 4,3 4,7 2,5 3,2 4,0 3,3
2012 1,8 -2,9 2,1 -0,4 2,6 4,0 2,4 3,0 3,0 2,1 2,2 2,0 2,2
2013 4,5 4,0 1,0 -0,6 4,6 2,0 2,9 2,6 3,2 2,6 2,6 1,8 2,5
2014 6,9 -1,4 0,2 -1,1 3,6 1,6 3,2 2,2 2,9 2,0 1,8 0,8 1,7
2015 -6,1 3,9 -0,2 -1,5 1,7 1,4 1,1 2,8 0,8 1,1 1,3 1,6 1,3
2016 -7,8 -4,7 0,7 -3,5 0,7 1,2 0,4 1,9 1,4 1,2 0,4 -0,7 0,3
% change year-on-year
2013 Q2 8,7 -1,5 2,8 -0,1 5,4 2,2 2,5 2,5 3,3 2,3 2,5 2,8 2,5
2013 Q3 -0,8 3,4 -0,1 0,4 5,1 1,9 3,2 2,5 2,9 2,6 2,2 1,5 2,1
2013 Q4 1,0 10,1 1,3 -0,1 3,4 2,0 3,0 3,8 3,1 3,3 3,2 1,5 3,1
2014 Q1 -0,6 -1,1 2,0 0,1 4,0 2,2 2,6 2,3 2,9 2,2 2,0 0,7 1,9
2014 Q2 7,8 -0,7 -1,2 -2,1 3,4 1,1 3,2 2,1 3,3 1,9 1,7 -0,1 1,6
2014 Q3 13,0 -2,4 -0,1 -2,3 3,3 1,8 3,0 2,3 3,0 2,0 1,8 0,8 1,8
2014 Q4 5,3 -1,4 0,3 -0,1 3,7 1,3 3,7 2,0 2,2 1,8 1,6 1,7 1,6
2015 Q1 11,5 7,7 0,3 1,6 2,1 1,6 2,2 2,6 1,6 1,1 2,4 4,0 2,6
2015 Q2 -6,9 6,1 -1,7 -0,9 2,0 1,1 1,3 3,1 0,8 1,4 1,2 1,7 1,3
2015 Q3 -18,9 2,4 1,5 -3,2 1,6 1,2 0,9 3,1 0,5 1,1 0,9 0,7 0,9
2015 Q4 -5,3 -0,1 -1,1 -3,4 1,3 1,7 0,2 2,3 0,4 0,7 0,6 0,2 0,6
2016 Q1 -4,8 -11,3 -0,8 -5,6 1,6 1,3 -0,9 2,2 1,2 1,0 -0,4 -2,5 -0,6
2016 Q2 -16,0 -4,4 3,8 -3,1 0,1 1,7 0,3 2,0 1,1 1,1 0,4 -0,5 0,3
2016 Q3 -5,2 -0,1 0,5 -2,1 1,0 0,7 0,4 1,7 1,1 1,5 0,7 0,4 0,7
2016 Q4 2,4 -3,1 -0,7 -3,2 0,2 1,1 1,7 1,8 2,2 1,1 0,8 -0,2 0,7

STATISTICS SOUTH AFRICA P0441
Gross domestic product, fourth quarter 2016
15
Table 6 – Expenditure on GDP (constant 2010 prices, seasonally adjusted and annualised)
Final consumption expenditure Gross capital formation
Exports of goods and services
Imports of goods and services
Expenditure on GDP Households
General government
Total Gross fixed
capital formation Change in inventories
Total
R million
2011 1 705 240 571 279 2 276 519 558 755 21 640 580 395 813 841 841 839 2 828 917
2012 1 768 365 591 275 2 359 640 573 310 24 775 598 085 820 302 877 362 2 900 665
2013 1 803 625 609 489 2 413 114 614 502 24 780 639 283 850 102 921 356 2 981 143
2014 1 816 234 616 365 2 432 599 624 848 8 646 633 494 877 510 916 621 3 026 981
2015 1 846 622 619 183 2 465 806 639 383 12 398 651 781 911 366 965 814 3 063 139
2016 1 862 014 631 790 2 493 805 614 225 -11 201 603 024 910 892 930 513 3 077 207
R million (seasonally adjusted and annualised)
2013 Q2 1 805 963 611 390 2 417 352 608 484 48 020 656 504 843 802 941 107 2 976 551
2013 Q3 1 807 245 610 973 2 418 218 625 248 24 132 649 381 857 139 941 336 2 983 402
2013 Q4 1 805 123 613 842 2 418 965 632 743 -442 632 301 867 057 893 896 3 024 427
2014 Q1 1 805 461 616 924 2 422 385 618 874 -17 718 601 156 900 607 918 436 3 005 712
2014 Q2 1 808 759 617 585 2 426 344 618 010 24 212 642 223 841 799 897 171 3 013 195
2014 Q3 1 820 194 615 296 2 435 489 627 728 14 132 641 860 866 592 916 105 3 027 836
2014 Q4 1 830 524 615 657 2 446 181 634 779 13 957 648 736 901 041 934 773 3 061 184
2015 Q1 1 839 372 614 836 2 454 208 639 640 60 285 699 924 898 133 977 513 3 074 753
2015 Q2 1 839 569 616 895 2 456 465 636 288 -5 578 630 710 919 353 953 123 3 053 405
2015 Q3 1 850 198 620 369 2 470 567 644 763 -11 271 633 492 913 348 961 228 3 056 179
2015 Q4 1 857 350 624 631 2 481 982 636 842 6 156 642 998 914 633 971 394 3 068 219
2016 Q1 1 850 397 626 906 2 477 303 619 593 -2 153 617 440 904 076 943 478 3 055 342
2016 Q2 1 855 776 631 256 2 487 033 615 277 -37 047 578 230 940 602 923 225 3 082 640
2016 Q3 1 865 898 634 224 2 500 122 609 754 10 799 620 553 886 191 920 863 3 086 003
2016 Q4 1 875 986 634 777 2 510 763 612 274 -16 402 595 871 912 699 934 486 3 084 847

STATISTICS SOUTH AFRICA P0441
Gross domestic product, fourth quarter 2016
16
Table 7 – Growth rates in expenditure on GDP (constant 2010 prices, seasonally adjusted and annualised)
Final consumption expenditure
Gross fixed capital formation
Gross capital formation
Exports of goods and services
Imports of goods and services
Expenditure on GDP Households
General government
Total
% change year-on-year
2012 3,7 3,5 3,7 2,6 3,0 0,8 4,2 2,5
2013 2,0 3,1 2,3 7,2 6,9 3,6 5,0 2,8
2014 0,7 1,1 0,8 1,7 -0,9 3,2 -0,5 1,5
2015 1,7 0,5 1,4 2,3 2,9 3,9 5,4 1,2
2016 0,8 2,0 1,1 -3,9 -7,5 -0,1 -3,7 0,5
% change quarter-on-quarter (seasonally adjusted and annualised)
2013 Q2 2,2 6,6 3,3 12,0 26,6 5,6 14,9 5,0
2013 Q3 0,3 -0,3 0,1 11,5 -4,3 6,5 0,1 0,9
2013 Q4 -0,5 1,9 0,1 4,9 -10,1 4,7 -18,7 5,6
2014 Q1 0,1 2,0 0,6 -8,5 -18,3 16,4 11,4 -2,5
2014 Q2 0,7 0,4 0,7 -0,6 30,3 -23,7 -8,9 1,0
2014 Q3 2,6 -1,5 1,5 6,4 -0,2 12,3 8,7 2,0
2014 Q4 2,3 0,2 1,8 4,6 4,4 16,9 8,4 4,5
2015 Q1 1,9 -0,5 1,3 3,1 35,5 -1,3 19,6 1,8
2015 Q2 0,0 1,3 0,4 -2,1 -34,1 9,8 -9,6 -2,7
2015 Q3 2,3 2,3 2,3 5,4 1,8 -2,6 3,4 0,4
2015 Q4 1,6 2,8 1,9 -4,8 6,1 0,6 4,3 1,6
2016 Q1 -1,5 1,5 -0,8 -10,4 -15,0 -4,5 -11,0 -1,7
2016 Q2 1,2 2,8 1,6 -2,8 -23,1 17,2 -8,3 3,6
2016 Q3 2,2 1,9 2,1 -3,5 32,7 -21,2 -1,0 0,4
2016 Q4 2,2 0,3 1,7 1,7 -15,0 12,5 6,1 -0,1

STATISTICS SOUTH AFRICA P0441
Gross domestic product, fourth quarter 2016
17
Table 8 – Contributions to growth in expenditure on GDP (constant 2010 prices, seasonally adjusted and annualised)
Final consumption expenditure Gross capital formation
Exports of goods and services
Imports of goods and services
Expenditure on GDP Households
General government
Total Gross fixed
capital formation Change in inventories
Total
Percentage points
2011 3,0 0,6 3,6 1,1 0,5 1,6 1,0 -3,3 2,9
2012 2,2 0,7 2,9 0,5 0,1 0,6 0,2 -1,3 2,5
2013 1,2 0,6 1,8 1,4 0,0 1,4 1,0 -1,5 2,8
2014 0,4 0,2 0,7 0,3 -0,5 -0,2 0,9 0,2 1,5
2015 1,0 0,1 1,1 0,5 0,1 0,6 1,1 -1,6 1,2
2016 0,5 0,4 0,9 -0,8 -0,8 -1,6 0,0 1,2 0,5
Percentage points
2013 Q2 1,4 1,3 2,7 2,3 2,9 5,2 1,6 -4,4 5,0
2013 Q3 0,2 -0,1 0,1 2,3 -3,2 -1,0 1,8 0,0 0,9
2013 Q4 -0,3 0,4 0,1 1,0 -3,4 -2,3 1,4 6,5 5,6
2014 Q1 0,0 0,4 0,4 -1,8 -2,3 -4,1 4,4 -3,2 -2,5
2014 Q2 0,4 0,1 0,5 -0,1 5,6 5,5 -7,9 2,8 1,0
2014 Q3 1,5 -0,3 1,2 1,3 -1,3 0,0 3,3 -2,5 2,0
2014 Q4 1,4 0,0 1,4 0,9 0,0 0,9 4,6 -2,5 4,5
2015 Q1 1,2 -0,1 1,1 0,6 6,1 6,7 -0,4 -5,6 1,8
2015 Q2 0,0 0,3 0,3 -0,4 -8,5 -8,9 2,7 3,1 -2,7
2015 Q3 1,4 0,5 1,8 1,1 -0,7 0,4 -0,8 -1,1 0,4
2015 Q4 0,9 0,6 1,5 -1,0 2,3 1,3 0,2 -1,3 1,6
2016 Q1 -0,9 0,3 -0,6 -2,2 -1,1 -3,3 -1,4 3,6 -1,7
2016 Q2 0,7 0,6 1,3 -0,6 -4,6 -5,2 4,8 2,7 3,6
2016 Q3 1,3 0,4 1,7 -0,7 6,2 5,5 -7,1 0,3 0,4
2016 Q4 1,3 0,1 1,4 0,3 -3,5 -3,2 3,4 -1,8 -0,1

STATISTICS SOUTH AFRICA P0441
Gross domestic product, fourth quarter 2016
18
Table 9 – Expenditure on GDP (constant 2010 prices)
Final consumption expenditure Gross capital formation
Exports of goods and services
Imports of goods and services
Expenditure on GDP Households
General government
Total Gross fixed
capital formation Change in inventories
Total
R million
2011 1 705 240 571 279 2 276 519 558 755 21 640 580 395 813 841 841 839 2 828 917
2012 1 768 365 591 275 2 359 640 573 310 24 775 598 085 820 302 877 362 2 900 665
2013 1 803 625 609 489 2 413 114 614 502 24 780 639 283 850 102 921 356 2 981 143
2014 1 816 234 616 365 2 432 599 624 848 8 646 633 494 877 510 916 621 3 026 981
2015 1 846 622 619 183 2 465 806 639 383 12 398 651 781 911 366 965 814 3 063 139
2016 1 862 014 631 790 2 493 805 614 225 -11 201 603 024 910 892 930 513 3 077 207
R million
2013 Q2 444 718 148 623 593 341 151 229 24 482 175 711 206 686 230 661 745 077
2013 Q3 444 937 152 716 597 653 158 942 15 434 174 377 220 896 243 806 749 119
2013 Q4 476 166 156 584 632 750 162 009 -6 818 155 191 222 581 227 446 783 077
2014 Q1 439 707 155 019 594 726 149 018 -17 939 131 079 215 888 223 414 718 280
2014 Q2 444 347 149 980 594 327 152 901 17 006 169 906 208 610 219 797 753 046
2014 Q3 448 878 154 300 603 178 161 001 12 313 173 314 223 120 238 503 761 108
2014 Q4 483 303 157 066 640 369 161 929 -2 734 159 194 229 892 234 908 794 547
2015 Q1 447 099 154 271 601 370 154 645 3 416 158 061 217 833 239 056 738 208
2015 Q2 451 682 150 646 602 328 157 682 6 570 164 252 227 054 234 325 759 309
2015 Q3 455 903 155 860 611 762 165 666 6 320 171 986 234 076 247 958 769 866
2015 Q4 491 939 158 407 650 346 161 391 -3 908 157 483 232 404 244 476 795 756
2016 Q1 449 459 159 865 609 325 150 635 -11 612 139 024 219 054 230 638 736 765
2016 Q2 454 661 154 618 609 279 153 349 -3 129 150 220 233 478 227 563 765 414
2016 Q3 459 800 157 650 617 450 155 914 12 551 168 465 227 190 237 940 775 165
2016 Q4 498 094 159 657 657 752 154 326 -9 011 145 315 231 169 234 373 799 863

STATISTICS SOUTH AFRICA P0441
Gross domestic product, fourth quarter 2016
19
Table 10 – Growth rates in expenditure on GDP (constant 2010 prices)
Final consumption expenditure Gross fixed capital
formation Gross capital
formation Exports of goods
and services Imports of goods
and services Expenditure on
GDP Households General
government Total
% change year-on-year
2011 5,1 2,8 4,5 5,5 8,2 3,5 11,9 2,9
2012 3,7 3,5 3,7 2,6 3,0 0,8 4,2 2,5
2013 2,0 3,1 2,3 7,2 6,9 3,6 5,0 2,8
2014 0,7 1,1 0,8 1,7 -0,9 3,2 -0,5 1,5
2015 1,7 0,5 1,4 2,3 2,9 3,9 5,4 1,2
2016 0,8 2,0 1,1 -3,9 -7,5 -0,1 -3,7 0,5
% change year-on-year
2013 Q2 2,6 3,5 2,8 5,6 10,9 2,9 8,1 3,1
2013 Q3 1,6 3,8 2,1 10,1 7,5 6,2 6,5 3,1
2013 Q4 1,2 3,2 1,7 10,1 4,7 5,4 1,4 3,4
2014 Q1 0,4 2,3 0,9 4,7 -2,2 8,0 1,8 2,0
2014 Q2 -0,1 0,9 0,2 1,1 -3,3 0,9 -4,7 1,1
2014 Q3 0,9 1,0 0,9 1,3 -0,6 1,0 -2,2 1,6
2014 Q4 1,5 0,3 1,2 0,0 2,6 3,3 3,3 1,5
2015 Q1 1,7 -0,5 1,1 3,8 20,6 0,9 7,0 2,8
2015 Q2 1,7 0,4 1,3 3,1 -3,3 8,8 6,6 0,8
2015 Q3 1,6 1,0 1,4 2,9 -0,8 4,9 4,0 1,2
2015 Q4 1,8 0,9 1,6 -0,3 -1,1 1,1 4,1 0,2
2016 Q1 0,5 3,6 1,3 -2,6 -12,0 0,6 -3,5 -0,2
2016 Q2 0,7 2,6 1,2 -2,7 -8,5 2,8 -2,9 0,8
2016 Q3 0,9 1,1 0,9 -5,9 -2,0 -2,9 -4,0 0,7
2016 Q4 1,3 0,8 1,1 -4,4 -7,7 -0,5 -4,1 0,5
STATISTICS SOUTH AFRICA P0441
Gross domestic product, fourth quarter 2016
20
EXPLANATORY NOTES
Forthcoming
issues
Issue
First quarter of 2017
Second quarter of 2017
Third quarter of 2017
Expected date of publication
6 June 2017
5 September 2017
5 December 2017
Supplementar
y information
Supplementary information related to the 2015 supply and use tables, regional GDP and
detailed quarterly estimates is available on the Stats SA website:
http://www.statssa.gov.za/?page_id=1854&PPN=P0441
Reference
documents
Information related to the compilation of the production-based GDP estimates is available in the
GDP release P0441 for the third quarter 2014 on the Stats SA website:
http://www.statssa.gov.za/publications/P0441/P04413rdQuarter2014.pdf
Information related to the compilation of the expenditure-based GDP estimates is available in
the sources and methods document on the Stats SA website:
http://www.statssa.gov.za/publications/P0441/Expenditure_on_GDP_Sources_and_Methods.p
df
Note on sources and methods http://www.statssa.gov.za/publications/P0441/Read_me_Sources_and_Methods.pdf
Expenditure on GDP: information note http://www.statssa.gov.za/publications/P0441/Information_note_on_Expenditure_on_GDP.pdf
TECHNICAL ENQUIRIES
Michael Manamela Telephone number: 012 310 8520
Email: [email protected]
Kedibone Mabaso Telephone number: 012 310 8410
Email: [email protected]
Litshani Ligudu Telephone number: 012 310 4674
Email: [email protected]

STATISTICS SOUTH AFRICA P0441
Gross domestic product, fourth quarter 2016
21
GENERAL INFORMATION
Stats SA publishes approximately 300 different statistical releases each year. It is not economically viable to produce them in more than one of South Africa's eleven official languages. Since the releases are used extensively, not only locally but also by international economic and social-scientific communities, Stats SA releases are published in English only. Stats SA has copyright on this publication. Users may apply the information as they wish, provided that they acknowledge Stats SA as the source of the basic data wherever they process, apply, utilise, publish or distribute the data; and also that they specify that the relevant application and analysis (where applicable) result from their own processing of the data. Advance release calendar An advance release calendar is disseminated on www.statssa.gov.za Stats SA products A complete set of Stats SA publications is available at the Stats SA Library and the following libraries: National Library of South Africa, Pretoria Division National Library of South Africa, Cape Town Division Natal Society Library, Pietermaritzburg Library of Parliament, Cape Town Bloemfontein Public Library Johannesburg Public Library Eastern Cape Library Services, King William’s Town Central Regional Library, Polokwane Central Reference Library, Nelspruit Central Reference Collection, Kimberley Central Reference Library, Mmabatho Stats SA also provides a subscription service. Electronic services A large range of data are available via on-line services, diskette and computer printouts. For more details about our electronic data services, contact (012) 310 8600. You can visit us on the internet at: www.statssa.gov.za
Produced by Stats SA
Related Documents