Policy Research Working Paper 5768 Gross Capital Flows Dynamics and Crises Fernando Broner Tatiana Didier Aitor Erce Sergio L. Schmukler e World Bank Development Research Group Macroeconomics and Growth Team & Latin America and the Caribbean Region Chief Economist Office August 2011 WPS5768 Public Disclosure Authorized Public Disclosure Authorized Public Disclosure Authorized Public Disclosure Authorized Public Disclosure Authorized Public Disclosure Authorized Public Disclosure Authorized Public Disclosure Authorized

Welcome message from author
This document is posted to help you gain knowledge. Please leave a comment to let me know what you think about it! Share it to your friends and learn new things together.
Transcript

Policy Research Working Paper 5768
Gross Capital Flows
Dynamics and Crises
Fernando BronerTatiana Didier
Aitor ErceSergio L. Schmukler
The World BankDevelopment Research GroupMacroeconomics and Growth Team &Latin America and the Caribbean RegionChief Economist OfficeAugust 2011
WPS5768P
ublic
Dis
clos
ure
Aut
horiz
edP
ublic
Dis
clos
ure
Aut
horiz
edP
ublic
Dis
clos
ure
Aut
horiz
edP
ublic
Dis
clos
ure
Aut
horiz
edP
ublic
Dis
clos
ure
Aut
horiz
edP
ublic
Dis
clos
ure
Aut
horiz
edP
ublic
Dis
clos
ure
Aut
horiz
edP
ublic
Dis
clos
ure
Aut
horiz
ed

Produced by the Research Support Team
Abstract
The Policy Research Working Paper Series disseminates the findings of work in progress to encourage the exchange of ideas about development issues. An objective of the series is to get the findings out quickly, even if the presentations are less than fully polished. The papers carry the names of the authors and should be cited accordingly. The findings, interpretations, and conclusions expressed in this paper are entirely those of the authors. They do not necessarily represent the views of the International Bank for Reconstruction and Development/World Bank and its affiliated organizations, or those of the Executive Directors of the World Bank or the governments they represent.
Policy Research Working Paper 5768
This paper analyzes the joint behavior of international capital flows by foreign and domestic agents—gross capital flows—over the business cycle and during financial crises. The authors show that gross capital flows are very large and volatile, especially relative to net capital flows. When foreigners invest in a country, domestic agents tend to invest abroad, and vice versa. Gross capital flows are also pro-cyclical, with foreigners investing more in the country and domestic agents
This paper is a product of the Macroeconomics and Growth Team, Development Research Group; and the Chief Economist Office, Latin America and the Caribbean Region. It is part of a larger effort by the World Bank to provide open access to its research and make a contribution to development policy discussions around the world. Policy Research Working Papers are also posted on the Web at http://econ.worldbank.org. The authors may be contacted at [email protected], [email protected], [email protected], and [email protected].
investing more abroad during expansions. During crises, especially during severe ones, there is retrenchment, that is, a reduction in both capital inflows by foreigners and capital outflows by domestic agents. This evidence sheds light on the nature of shocks driving capital flows and helps discriminate among existing theories. The findings seem consistent with shocks that affect foreign and domestic agents asymmetrically, such as sovereign risk and asymmetric information.

Gross Capital Flows: Dynamics and Crises
Fernando Broner a Tatiana Didier
b Aitor Erce
c Sergio L. Schmukler
b,*
Keywords: gross capital flows, net capital flows, domestic investors, foreign investors, crises
JEL Classification: F21, F30, F32, G01
a CREI and Universitat Pompeu Fabra,
b World Bank,
c Bank of Spain
* We thank Leandro Brufman, Francisco Ceballos, Laura Fernández, Ana Maria Gazmuri, Lucas Núñez, and
Virginia Poggio for excellent research assistance. We received very valuable comments from Enrique Alberola,
Eduardo Fernández-Arias, Iikka Korhonen, Philip Lane, Andrew Powell, Carmen Reinhart, Luis Servén, Frank
Warnock, and participants at presentations held at the AEA Meetings, Banco de España, CREI, the LACEA Annual
Meetings, the SED Annual Meetings, and the XVIII Workshop in International Economics and Finance. Broner
acknowledges financial support from the European Research Council and the Barcelona GSE Research Network.
This paper was partly written while he was visiting the Bank of Spain. Schmukler acknowledges financial support
from the World Bank, Development Economics Research Group.
E-mail addresses: [email protected], [email protected], [email protected], [email protected].

2
1. Introduction
International capital flows have played an increasingly important role in the business cycles of
developed and developing countries, especially since the 1970s and during episodes of financial
crises. As a consequence, a large literature has grown, analyzing the cyclical behavior of capital
flows. The literature has concentrated on studying net capital flows, defined as the difference in
gross capital flows, that is, the net purchases of domestic assets by foreign agents minus the net
purchases of foreign assets by domestic agents.1 The literature shows that net capital flows are
volatile and pro-cyclical and decline during crisis times. These patterns are more extreme in
emerging markets and have even motivated the use of the term sudden stops to refer to the large
collapses in net capital inflows that often accompany crises.2
While net capital flows have concentrated significant attention, much less is known about
the behavior of gross capital flows. And yet understanding the behavior of gross capital flows
seems crucial given that capital flows by foreign and domestic agents are very likely driven by
different incentives. For example, agents might invest directly in a firm located in a foreign
country if they have access to a technology that is superior to that of domestic agents, an asset
might be more attractive for some agents than others if it provides a better hedge to their non-
pledgeable labor income, and sovereign risk might make the return of an asset depend on the
residency of the agent who holds it. As a result, it seems reasonable to expect that gross capital
flows by foreign and domestic agents behave differently both over the cycle and during crises.3
A number of papers have analyzed long-run trends in gross capital flows (Lane and
Milesi-Ferretti, 2001 and 2007; Kraay et al., 2005, Devereux, 2007, and Gourinchas and Rey,
1 See, for example, Dornbusch, Goldfajn, and Valdés (1995), Kaminsky, Lizondo, and Reinhart (1998), Broner and
Rigobon (2006), Levchenko and Mauro (2007), and Mendoza (forthcoming). 2 See, for example, Calvo (1998), Calvo, Izquierdo, and Mejía (2008), and Cavallo and Frankel (2008).
3 This is indeed what we find, as we explain below. We also find that the importance of gross capital flows has
increased monotonically since the 1970s to the 2000s.

3
2007a and 2007b).4 But, surprisingly, there are very few studies on the cyclical behavior of gross
capital flows. The literature has so far mostly focused on classifying episodes of abrupt reversals
in capital inflows into those driven by foreign agents, or true sudden stops, and those driven by
domestic agents, or episodes of capital flight (Faucette, Rothenberg, and Warnock, 2005, Cowan
et al., 2008, Forbes and Warnock, 2011, and Rothenberg and Warnock, forthcoming). There are
also a few studies that typically compare the behavior of some types of gross capital flows
around specific events or in particular countries or assets (Frankel and Schmukler, 1996, Kim
and Wei, 2002, Dvorak, 2003, Choe, Kho, and Stulz, 2005, and Milesi-Ferretti and Tille, 2010).
Nevertheless, none of these studies provide a systematic cross-country analysis of the cyclical
behavior of the different types of gross capital flows over the business cycle as well as during
turbulent times.
Because of the limited research on gross capital flows, many important questions remain
unanswered. For example, are periods in which foreign agents purchase domestic assets also
periods in which domestic agents sell foreign assets? Is there a positive or negative correlation
between capital flows by foreign and domestic agents? What is the behavior of gross capital
flows over the business cycle and during financial crises? We know that crises are associated
with reductions in net capital inflows. But are these reductions on average due to sales of
domestic assets by foreign agents, purchases of foreign assets by domestic agents, or both? How
large and how volatile are gross capital flows relative to net capital flows?
In this paper, we address the type of questions raised above by documenting a number of
stylized facts about the dynamics of gross capital flows, which shed light on the behavior of
domestic and foreign agents and the types of shocks underlying international capital movement.
4 These studies show that gross capital flows have on average been sizeable, which has resulted in large gross
international investment positions.

4
This analysis also helps clarify the importance of focusing on gross capital flows as opposed to
net capital flows. We document these patterns by systematically analyzing the cyclical behavior
of gross capital flows: the capital inflows by foreign agents (CIF) and the capital outflows by
domestic agents (COD). Positive CIF and COD both associate with increases in gross
international investment positions. To construct CIF and COD, we use balance of payments data
from the International Financial Statistics of the International Monetary Fund, from 1970 to 2009
for 103 countries. CIF equals net purchases of domestic assets by non-residents and is thus equal
to the sum of all liability inflows. COD equals net purchases of foreign assets by domestic agents
and is thus equal to the negative of the sum of all asset inflows, including international reserves.
Hence, net capital flows are equal to the difference CIF-COD.
Our main findings are the following. (i) Over the last four decades, the volatility of gross
capital flows (CIF and COD) has been large and increasing, especially relative to the much lower
volatility of net capital flows. This reflects the increasingly positive correlation between CIF and
COD. (ii) Gross capital flows are pro-cyclical. In other words, during expansions foreign agents
increase their purchases of domestic assets and domestic agents increase their purchases of
foreign assets. During crises, especially during severe ones, there is a reduction in gross capital
flows, with reductions in both CIF and COD. However, CIF tends to fall more during crises as
these tend to be associated with lower net capital flows. The 2008 financial crisis is a clear
example of such retrenchment, i.e. a simultaneous decline of both CIF and COD, but we show
that retrenchment was a feature of previous episodes as well. (iii) A decomposition of gross
capital flows reveals interesting heterogeneity in the behavior of their components around crises.
In the case of CIF, its reduction is due to declines in all its components for all country groups. In
the case of COD for developed countries, its reduction is due to declines in equity, portfolio debt,

5
bank flows, and direct investments, but not in reserves. For developing countries, declines in
reserves play an important role in accounting for the reduction in COD, but there are also
significant declines in equity, bank flows, and direct investments.
The findings in this paper have important implications regarding the sources of
fluctuations in economies open to capital flows. There is a growing literature in international
macro-finance that brings portfolio choice and asset pricing considerations into dynamic
stochastic general equilibrium (DSGE) models of international macroeconomics, with many
papers focusing on the composition of countries’ portfolios. These models have so far
emphasized productivity shocks as the main source of fluctuations in economies open to capital
flows. Unlike us, most of these papers and other related papers with different methodologies
have focused on the long-run composition of countries’ portfolios.5
Two recent contributions that emphasize the high-frequency behavior of international
portfolios are Hnatkovska (2010) and Tille and van Wincoop (2010). Both document that in the
U.S. there is a positive correlation between domestic purchases of foreign equity and foreign
purchases of domestic equity and present DSGE models that can account for this correlation.6
Hnatkovska (2010) shows that this correlation can be explained by a preponderance of
productivity shocks in the nontradable sector. Tille and van Wincoop (2010) show that, even in a
model with a single good and endogenous time variation in expected returns and risk,
productivity shocks can account for the positive correlation of gross capital flows. These models
are highly successful at matching some features of the data, but not all. For instance, Tille and
Van Wincoop (2010)’s model predicts that gross capital flows are counter-cyclical, which is at
5 See, for example, Kraay and Ventura (2000), Evans and Hnatkovska (2005), Coeurdacier, Kollmann, and Martin
(2010), Devereux and Sutherland (2010 and 2011), and Pavlova and Rigobon (2010a). Pavlova and Rigobon
(2010b) provide a short survey of this literature. 6 Dvorak (2003) presents similar evidence.

6
odds with the evidence presented in this paper. Hnatkovska (2010)’s model does predict that
gross capital flows are pro-cyclical. However, it also predicts a strongly negative correlation
between portfolio equity and bond inflows, which is not observed in the data.7
At an intuitive level, while it is possible to construct models in which productivity shocks
lead to a positive correlation between gross capital flows (between CIF and COD), this does not
seem the most natural effect of productivity shocks. In particular, if a negative productivity
shock lowers the incentives for domestic agents to invest at home it would seem most natural
that foreigners also have fewer incentives to invest in the country. That is why, we believe,
models that account for the positive correlation between gross capital flows solely as a result of
productivity shocks will likely have a hard time matching the different important features of the
data.
The evidence presented in this paper suggests that other factors besides productivity
shocks must be important determinants of gross capital flows. In addition, and unlike
productivity shocks, these factors must affect foreign and domestic agents asymmetrically. One
set of models introduces asymmetric information between domestic and foreign agents. For
example, Brenan and Cao (1997) and Tille and Van Wincoop (2008) argue that retrenchment
during crises can take place if foreign agents are less informed than domestic agents about the
return of domestic assets and crises increase this informational asymmetry.8
Other models introduce asymmetry in asset returns depending on whether the asset is
held by foreign or domestic agents. For example, in models based on sovereign risk, such as
Broner, Martin, and Ventura (2010), domestic agents are less likely to be defaulted on than
7 Business cycle models solely driven by shocks to the nontradable sector also tend to predict counter-cyclical real
exchange, as the relative abundance of nontradable goods during booms reduces their price. This prediction also
seems counterfactual. 8 See also Dvorak (2003), who emphasizes informational asymmetry both between and within countries.

7
foreign agents. This is because the welfare of domestic residents has a higher weight in the
objective function of the government than the welfare of foreigners. Such models predict
retrenchment during crises, when the probability of default increases disproportionately on
foreign holders of domestic assets. More generally, all models in which crises are associated with
a relative deterioration of foreigners’ property rights are likely to predict retrenchment during
crises.9
Another potential asymmetry comes from the access to liquidity during crises, with
domestic agents probably becoming financially constrained relative to foreigners. The literature
has shown that this asymmetry is likely to lead to fire sales of domestic firms to foreigners, and
that this has happened in a number of cases.10
Our results in this respect are mixed. We do find
some evidence that FDI inflows by foreigners increase in high-income countries during severe
crises, but this does not seem to be the case for developing countries.11
Of course, this does not
mean that fire sales have not taken place for some types of assets during particular episodes. But
overall fire sales do not appear to be an important determinant of capital flows in the average
developing-country crisis.
The rest of the paper is organized as follows. Section 2 describes the data. Section 3
characterizes the comovement of capital flows by foreign and domestic agents. Section 4
analyzes the behavior of gross capital flows over the business cycle and during crises. Section 5
concludes.
9 Shocks to risk aversion can also lead to retrenchment during crises if agents consider foreign assets as riskier than
domestic ones. One reason for this is that the return of assets denominated in domestic currency and the domestic
price level tend to be positively correlated when the nominal exchange rate is volatile. Milesi-Ferreti and Tille
(2010) argue that this effect might have been the driver of the retrenchment in flows observed during the 2008
global financial crisis. 10
See Krugman (1998), Aguiar and Gopinath (2005), Baker, Foley, and Wurgler (2009), and Acharya, Shin, and
Yorulmazer (2010). 11
We do find that FDI inflows by foreigners are more stable than other inflows. This relative stability of FDI flows
has long been known for net capital flows. For a recent analysis, see Levchenko and Mauro (2007).

8
2. Data
To document worldwide patterns of capital flows by domestic and foreign agents, we assemble a
comprehensive dataset on aggregate gross capital flows, including not only capital inflows and
outflows but also their subcomponents, reflecting the different flow types. The data come from
the analytic presentation of the IMF’s Balance of Payments Statistics Yearbooks (BOP).12
The
IMF’s BOP dataset provides country-level data, on an annual basis from 1970 until 2009, on
different types of capital inflows measured in U.S. dollars. Fundamental to our goal, this dataset
allows us to disentangle, respectively, capital outflows by domestic agents (COD) and capital
inflows by foreigners (CIF), which are reported as flows related to the reporting country’s assets
and liabilities vis-à-vis non-residents. In other words, CIF is recorded as capital inflows to the
reporting economy by foreign agents, indicating an increase in foreigners’ holdings of domestic
assets. Analogously, COD is reported as flows from the reporting economy, where positive
values correspond to an increasing of the holdings of foreign assets by domestic agents.13
Hence
a positive COD should be interpreted as capital outflows by domestic agents whereas a negative
COD means capital inflows.
Our dataset also allows us to analyze the behavior of the different types of capital flows.
Flows are classified as: direct investments (also known as FDI), portfolio flows, other
investments (mostly bank flows and trade credit), and international reserves.14
Portfolio flows are
further divided into equity and debt flows. Both private and public flows are included in our
12
Debt refinancing and rescheduling entries that involve changes in existing debt contracts or replacement by new
ones, generally with extended debt service payments are excluded from our dataset. In the analytic presentation of
the IMF’s BOP, these flows (credit and debt entries that account for the new contracts) are computed within a
country's financial account as exceptional financing items. Therefore, our analysis excludes items derived from the
rescheduling or refinancing of existing debt contracts as they generally do not involve new capital inflows to the
reporting country. 13
These measures however do not capture increases in foreigners’ (domestic agents’) holdings of domestic (foreign)
assets that are due to valuation effects. 14
Due to their relatively small size and the scarcity of data, we exclude flows in financial derivatives from our
analysis.

9
dataset. Therefore, CIF, the measure of aggregate capital inflows by foreigners, is equivalent to
the sum of the following inflows: direct investments in the reporting economy, portfolio
investment liabilities, and other investment liabilities. Similarly, COD is the aggregation of
outflows of direct investments abroad, portfolio investment assets, other investment assets, and
international reserve assets. As our aim is to shed light on both how large and how volatile
capital flows are, we scale CIF and COD and their components by trend GDP throughout the
paper. 15
Our sample of countries is based mostly on data availability. However, we exclude
countries that are either very small or very poor. Small countries are a concern because they
might display an artificially high volume of financial transactions due to their role as offshore
financial centers or tax havens. A country is considered small if its gross national income (GNI)
in 2005 was less than four billion U.S. dollars, PPP adjusted. Thirty countries are excluded from
the analysis for this reason, among them Belize, Guyana, and Maldives. Poor countries generally
depend heavily on official aid flows that behave differently than private capital flows, and are
thus beyond the scope of our analysis. We exclude 46 countries with GNI per capita smaller than
2,000 U.S. dollars (PPP adjusted) in 2005, among them Bangladesh, Ethiopia, and Niger.16
We classify our final sample of 103 countries into groups according to their income
levels as measured by their GNI per capita in 2005. In particular, we classify low-income
countries as those with GNI per capita below 7,500 U.S. dollars. Middle-income countries
include those with GNI per capita between 7,500 and 15,000 U.S. dollars. These two groups,
15
Trend GDP is calculated by applying the Hodrick-Prescott filter to the series of nominal GDP in U.S. dollars.
Nominal GDP is obtained from the World Development Indicators. If data for the last years of the sample was not
available, we complemented our dataset with data from the World Economic Outlook 2009. 16
We used 2005 data on both GNI and GNI per capita as using more updated data would reduce significantly our
sample coverage. Moreover, the ranking of countries relative to the thresholds used in this paper does not change
considerably over time.

10
low- and middle-income countries, are more generally called developing countries in this paper.
Lastly, high-income countries are those with GNI per capita above 15,000 U.S. dollars.17
In order to analyze capital flows around crises, we create a composite crisis indicator that
takes into account banking, currency, and domestic and external debt crises on an annual basis.
We consider the initial year of any of these measures of crises as the beginning of a crisis event.
More precisely, a crisis period starts the year when a country experiences the beginning of a
crisis (according to any of the indicators) and no other crisis has been observed in the preceding
two years.
In order to obtain the starting dates of these different crises, we use several indicators
available in the literature, all updated until 2009. Banking crises come from the dating of crisis
periods available in Honohan and Laeven (2005), Laeven and Valencia (2008 and website
update), and Reinhart and Rogoff (2009). Currency crises are identified through the methodology
in Laeven and Valencia (2008), which in turn follows Frankel and Rose (1996).18
Under this
definition, a country experiences a currency crisis if there is a nominal depreciation of the
exchange rate of at least 30 percent that also represents at least a 10 percent increase in the rate
of depreciation over the previous year. For countries meeting this criteria for several consecutive
years, only the first year within five-year windows is considered a crisis year in our analysis.
Domestic debt crises are identified by the year in which Standard & Poor’s downgrades the local
currency debt of an economy into default. We also consider episodes identified in Reinhart and
Rogoff (2009). Analogously, for external debt crises, we consider the crisis dating in Laeven and
Valencia (2008) and Reinhart and Reinhart (2008) as well as Standard & Poor’s downgrades of
foreign currency debt and foreign currency bank loans of an economy to default levels (up to
17
See Appendix Table 1 for the sample coverage. First and last years of available data are reported for each country. 18
We use just one indicator of currency crises as most indicators described in the literature are constructed using
data on reserves, one of our variables of interest, hence making them less appropriate for our analysis.

11
2009). Appendix Table 2 lists all the crisis episodes considered in our sample.
We further classify these crises events into two different types of episodes depending on
the intensity of the turmoil affecting a country. First, we define one crisis episodes in which a
country experiences the beginning of one, and only one, type of crisis in a given year, and no
other type of crisis is observed in the preceding two years. The second episode type considers
periods in which a country faces the beginning of more than one type of crisis within a given
year, and no such event has occurred in the previous two years. These severe episodes are called
more than one crisis. In sum, we distinguish between mild and severe crisis episodes according
to the number of different types of crises a country faces in any given year.
The final database, after the sample adjustments mentioned above, covers 103 countries
over the 1970-2009 sample period. There are 39 countries classified as high-income, and 28 of
these countries have experienced at least one crisis during our sample period and five countries
have faced severe crisis episodes. Our sample includes 26 middle-income countries, which have
experienced significantly more turmoil than high-income countries. All middle-income countries
faced at least one crisis within our sample period and a total of 78 crises episodes (24 severe
ones) have been observed in these countries. Lastly, 38 low-income countries are included in our
empirical analysis and all but one country have gone through at least one crisis episode. In total,
these low-income countries have experienced 96 crises episodes, with 27 being severe ones.
3. The Behavior of Capital Flows by Foreign and Domestic Agents
In this section, we study the behavior of gross capital flows over the past decades. As a first pass
at the data, Figures 1 and 2 show the evolution over time of CIF and COD (normalized by trend
GDP) for a number of developed and developing countries, respectively. The figures show a

12
strong positive comovement between CIF and COD, which indicates that capital inflows by
foreigners and outflows by domestic agents move in tandem. Namely, when foreign investors
pour capital into domestic markets, domestic agents increase their investments abroad. This
correlation seems to hold during both tranquil and turbulent periods, when a retrenchment in
flows is observed. The figures also suggest that gross capital flows behave very differently from
net capital flows (the difference in gross capital flows). For instance, the 2008 financial crisis
was characterized by a sharp drop in gross capital flows around the world, even though net flows
have remained relatively stable. As a consequence, gross capital flows seem more volatile than
net capital flows. In the rest of this section, we document more formally the joint behavior of
CIF and COD.
Table 1 presents summary statistics of gross capital flows (total and the components, i.e.
CIF+COD, CIF, and COD) and net capital flows (CIF-COD). It shows that gross capital flows,
measured as a percentage of output, have increased over time around the world. Confirming the
trends in Figures 1 and 2, these increases suggests a broad process of financial globalization with
capital flows by both domestic and foreign agents rising, especially so for high- and middle-
income countries. For example, CIF increases from about 4.8 percent (0.8 percent) of trend GDP
for the median high-income (middle-income) country in the 1980s to more than 15 percent (5
percent) of trend GDP in high-income (middle-income) economies in the 2000s. Similar patterns
are observed for COD. Nevertheless, there is no clear evidence of such a positive trend in net
capital flows, despite the high attention by the literature. If anything, they have decreased over
time for both high- and low-income countries. Therefore, to gauge the extent of globalization
with capital flows measures it seems important to focus on gross capital flows as opposed to net
capital flows.

13
Table 1 also shows that over time the volatility of gross capital inflows has increased
significantly, more than that of net capital flows. For high-income countries, the median standard
deviation of CIF (COD) is 9.2 (8.1) percent of trend GDP during the 2000s, compared to 2.7
(2.3) during the 1970s. In middle- and low-income countries the increase in the volatility of
gross flows is less pronounced. For example, the median standard deviation of CIF is 5 percent
of trend GDP for middle-income countries in the 2000s, compared to 3.1 during the 1970s. In
low-income countries, an even less pronounced trend is observed. The standard deviation of
COD (CIF) goes from 2.1 (3.4) in the 1980s to 3.4 (3.9) in the 2000s.
These statistics indicate that the volatility of gross capital flows is larger for high-income
countries than for middle-income countries in recent decades. These patterns stand in contrast
with the well-known fact that net capital flows are more volatile in developing countries, which
is also observed in our analysis. The median standard deviation of net capital flows is 3.9 and 5.6
for high- and middle-income countries, respectively, over the entire sample period. In contrast to
the observed patterns in gross capital flows, the volatility of net capital flows has remained
relatively stable over the past three decades for countries across all income levels. Thus, the
standard deviation of net capital inflows in middle-income countries reaches 3.9 during the
1970s, increases to 4.2 in the 1990s, and declines back to 3.9 in the 2000s. In high- and low-
income countries, the volatility of flows has increased slightly over time. In low-income
countries, the standard deviation of net flows is 4.1 percent of trend GDP in the 1980s and
reaches 4.4 in the 2000s.
The statistics in Table 1 suggest that gross capital flows are not only increasingly larger,
but also increasingly are more volatile, with the difference with respect to net capital flows
growing over time. This pattern is observed for high-income countries over the whole sample
14
and for middle-income countries during the 2000s. For example, as shown in Table 1, the median
standard deviation of COD and CIF for high-income countries is 8.1 and 7.8 percent of trend
GDP, respectively, a much larger statistics than the standard deviation of net flows, 3.9 percent
of trend GDP. If one considers only the 2000s, the differences are even larger. In middle-income
countries, the standard deviation of net flows is also smaller than that of gross capital flows by
both foreign and domestic agents during the 2000s. In contrast, the volatility of net capital flows
is actually higher than that of its disaggregated components during the 1970s, 1980s, and 1990s.
Likely reflecting the more closed capital accounts and greater restrictions on foreign investments
by domestic agents in those countries, especially in the first half of our sample, the volatility of
net flows is larger than that of gross capital flows throughout our entire sample for low-income
countries.
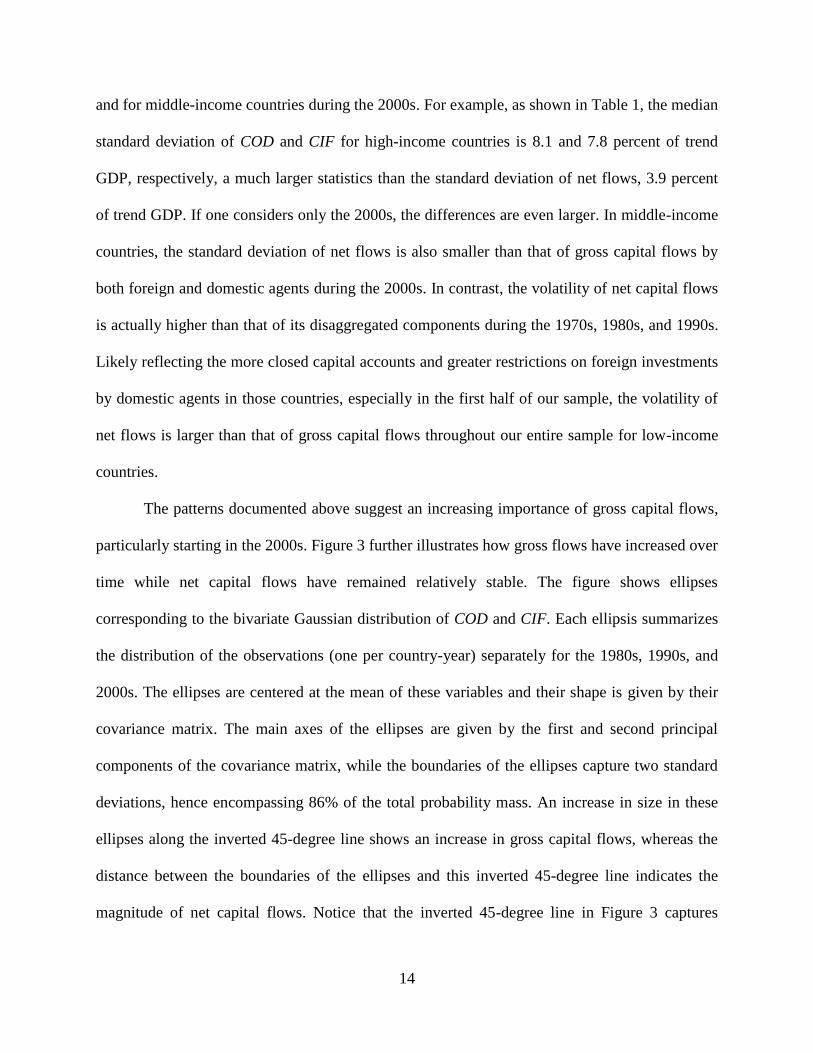
The patterns documented above suggest an increasing importance of gross capital flows,
particularly starting in the 2000s. Figure 3 further illustrates how gross flows have increased over
time while net capital flows have remained relatively stable. The figure shows ellipses
corresponding to the bivariate Gaussian distribution of COD and CIF. Each ellipsis summarizes
the distribution of the observations (one per country-year) separately for the 1980s, 1990s, and
2000s. The ellipses are centered at the mean of these variables and their shape is given by their
covariance matrix. The main axes of the ellipses are given by the first and second principal
components of the covariance matrix, while the boundaries of the ellipses capture two standard
deviations, hence encompassing 86% of the total probability mass. An increase in size in these
ellipses along the inverted 45-degree line shows an increase in gross capital flows, whereas the
distance between the boundaries of the ellipses and this inverted 45-degree line indicates the
magnitude of net capital flows. Notice that the inverted 45-degree line in Figure 3 captures

15
country-year observations in which net capital flows are zero, i.e. COD is equal to CIF. Thus,
Figure 3 shows that capital flows by both foreign and domestic agents have increased steadily
over time, and especially so in the 2000s, while net flows have not changed considerably over
time.
Our results so far support a generalized process of financial globalization with capital
flows by both foreign and domestic agents increasing significantly over time, particularly since
the 1990s. We next assess whether this suggested positive correlation between CIF and COD
indeed holds when performing a cross-country and time-series comparison over the four decades
under study. More formally, we estimate the following regressions:
,,,, tctctc ControlsCODCIF (1)
,,,, tctctc ControlsCIFCOD (2)
where Controls stand for additional control-variables such as country trends. To prevent the
estimates from being driven by individual countries, CIF and COD are not only scaled by trend
GDP, but also further standardized by de-meaning and scaling by their corresponding standard
deviations on a country-by-country basis. The results are reported in Table 2, where countries are
once more split in our three income groups. We present estimations for the whole sample as well
as for each of the decades under analysis.
The estimations provide robust evidence that CIF is positively correlated with COD. In
other words, when foreigners invest in a country, its domestic agents invest abroad. Such a
positive correlation generates an expansion in financial globalization, in which a country’s
international assets and liabilities expand. Conversely, when foreign capital leaves, domestic
capital placed abroad is repatriated. In other words, a retrenchment in gross capital flows is
observed. In line with the graphical evidence, the positive comovement between gross capital

16
flows has increased over time, as the magnitude of the coefficients increases. Moreover, the
estimated coefficient increases with countries’ income level. The estimated coefficient for low-
income countries is 0.27, while the same parameter is 0.44 for middle-income countries and 0.78
for high-income countries.19
In sum, the evidence in this section suggests that capital flows by domestic and foreign
agents have become increasingly large and volatile, surpassing the size and, in most cases, the
volatility of net capital flows. Furthermore, CIF and COD are positively correlated. In other
words, there are periods of globalization and periods of retrenchment. We investigate next the
cyclical properties of gross capital flows and their behavior around financial crises.
4. The Cyclical Behavior of Gross Capital Flows
In the previous section, we showed that capital inflows by foreigners and outflows by domestic
agents are positively correlated. In this section, we explore the cyclical properties of gross capital
flows by analyzing the behavior of CIF and COD over the business cycle and around crises. We
provide empirical evidence that periods of financial globalization tend to occur during economic
expansions and retrenchment periods tend to occur during contractions or crises.
4.1 Gross Capital Flows over the Business Cycle
To analyze the cyclical properties of gross capital flows, we estimate the following equations:
,,,, tctctc ControlsXY (3)
where tcY , stands for CIF, COD, or a measure of aggregate gross flows (CIF+COD); Xc,t
represents either net capital flows, the trade balance in goods and services, or a measure of GDP
19
Similar estimates are obtained if a different set of controls is used. If year dummies are included the results are
qualitatively similar, although point estimates decrease, suggesting the presence of systemic or aggregate effects.

17
fluctuations; and Controls stand for additional control variables such as country trends, as above.
In these regressions, net capital flows are calculated using the standardized versions of CIF and
COD. The trade balance in goods and services is also scaled by trend GDP, demeaned and
standardized by its standard deviations at the country level.20
Our measure of business cycles is
based on real GDP in constant units of local currency.21
More specifically, we use the growth
rates in real GDP, which should capture accurately the current state of the economy over the
business cycle.22
The results are reported in Table 3. They show that net capital inflows are strongly
associated with capital inflows by foreigners for all income groups. For high-income countries,
they are also strongly correlated with capital outflows by domestic agents. However, such
association is not as strong in middle- and low-income countries, where larger coefficients are
estimated for CIF. Note that net capital flows are calculated as the difference between CIF and
COD, and are thus, by construction, correlated with our dependent variables. To partly avoid this
correlation, we use the trade balance in goods and services as an alternative measure of capital
flows to the extent that it captures the other side of the balance of payments. The estimated
coefficients confirm the previous results. The trade balance is strongly correlated with capital
flows by foreigners, and more so than flows by domestic agents in middle- and low-income
countries.
Regarding the dynamics of gross capital flows during the business cycles, we find that
gross capital flows expand during good times, while during bad times, they decline. In other
20
The data on the trade balance are from the IMF's Balance of Payment Statistics Yearbooks. 21
Real GDP in constant units of local currency comes from the World Bank’s World Development Indicators. This
information was complemented with data from the IMF’s World Economic Outlook 2009 if the data from the
original source were missing. 22
As an alternative measure of business cycles, we also considered a measure of output gap based on the Hodrick-
Prescott filter. The results were qualitatively similar to the ones reported here.

18
words, we find that not only capital flows by foreigners are pro-cyclical. Capital outflows by
domestic agents are also pro-cyclical, with domestic agents investing more abroad in good times
when the domestic economy is above potential or is growing in real terms. As a consequence, as
shown by the estimated coefficients on CIF+COD, expansions in financial globalization, in
which a country’s international assets and liabilities expand, are observed during good times.
Analogously, during downturns in economic activity, there is retrenchment in gross capital
flows.
The evidence in Table 3 expands the widely-documented pro-cyclicality of net capital
inflows. During booms, foreigners increase their purchases of domestic assets and domestic
agents augment their investments abroad. These patterns suggest that changes in net capital
inflows are driven mostly by foreigners in developing economies; with domestic agents’
behavior being most relevant for the behavior of net flows in high-income countries.
4.2 Gross Capital Flows during Crises
To analyze how gross capital flows behave during crises, we start by providing some descriptive
statistics comparing the behavior of CIF and COD during turbulent and tranquil periods.
Turbulent periods are defined as those falling within a five-year window around each crisis
episode.
Table 4 shows that both capital inflows by foreigners and capital outflows by domestic
agents decline during turbulent periods for countries from all income groups. For example, CIF
falls by almost 50 percent for high-income countries while COD decreases by about 65 percent.
Similarly, declines between 40 and 50 percent of trend GDP in gross capital flows are observed
in low-income countries. In middle-income countries, the retrenchment in gross capital flows is

19
even stronger – CIF declines from inflows of 7.2 percent of trend GDP to actual outflows of 2.6
percent of trend GDP and COD goes from outflows of 6.5 percent of trend GDP to inflows of 2.6
percent of trend GDP.23
Despite the similarities in the dynamics of gross capital flows among countries from all
income levels, the behavior of net capital flows is rather contrasting. While net capital inflows
increase during crises for high-income countries, middle- and low-income countries face a
decline in net capital inflows. This evidence is consistent with retrenchment by domestic agents
being stronger than that of foreigners in high-income countries but weaker in developing
economies.
An event study analysis of gross capital flows around crises reinforces the evidence
above. For this exercise, we focus on the dynamics of CIF and COD not only during the crisis
years, but also in the run-up to crises and the immediate aftermath by analyzing the two years
preceding and following crises. We estimate the following equation:
,,,
2
2
, tcitci
i
i
tc ControlsCrisisY
(4)
where tcY , stands for our standardized measures of CIF or COD; Crisis is the composite crisis
indicator; and Controls capture the additional control variables such as country trends.24
Once
more, we perform the analysis by pooling countries according to their income level.
The estimates are presented in Table 5 and Figure 4. They provide robust evidence of
retrenchment, that is, capital flows by both foreign and domestic agents decline for countries
from all income groups. In particular, both CIF and COD are negative and statistically different
23
To the extent that official flows are unlikely to decline during crises, the milder reaction of capital flows in low-
income countries when compared to middle-income ones might be explained by the relative size of these flows. 24
We report results with country trends as controls only, but our results are qualitatively similar if we add year
dummies as controls as well.

20
than zero during the crisis years for countries in all income groups, except for CIF in high-
income countries. Table 5 also presents Wald statistics that test if the behavior of flows during
the crisis years or in the immediate aftermath was significantly different from the one observed
in the run-up. The Wald tests show that the decline in capital inflows by foreigners and capital
outflows by domestic agents during the crisis years (in comparison to the average flow in the
previous two years) is statistically significant for all income levels, including CIF in high-income
countries. Furthermore, the Wald tests show that gross capital flows remain at depressed levels,
or decline even further, during the two-year period after the onset of the crisis.
Figure 4 shows that the median retrenchment in gross capital flows around crises is rather
large. For instance, CIF in high-income countries on average declines from inflows of 5.5
percent of trend GDP during the pre-crisis year to outflows of 4.3 percent during the first post-
crisis year. In middle-income countries, these flows reverse from 0.4 to -2.5 percent of trend
GDP over the same period. In low-income countries, CIF declines from around 0.2 percent of
trend GDP during the two years preceding the turmoil period to around -1.7 percent of trend
GDP during the year following the onset of the crisis. Similar numbers are estimated for COD.
The analysis so far has included the global financial crisis that hit countries in 2008.
However, the empirical evidence in Milesi-Ferretti and Tille (2010) suggests that this latest crisis
has been marked by a significant decline in capital flows around the world. A re-estimation of
equation (4) around this episode, reported in the top panel of Table 6, reproduces their findings.
The Wald tests suggest a significant retrenchment in capital flows during in 2008 and the
following year in comparison to the pre-crisis period for all income groups.
To test if the 2008 global financial crisis is driving our results and as a robustness
exercise, we re-estimate our event study analysis excluding this episode. The results are reported

21
in the bottom panel of Table 6 and show that our previous results stand and remain statistically
and economically significant. Both CIF and COD decline significantly during the crisis year and,
according to the Wald tests, are statistically smaller than their average during the preceding two
years. Also consistent with our previous results, gross capital flows during the post-crisis period
remain at depressed levels in comparison to the run up to crises. In sum, the results in Table 6
show that the behavior of foreign and domestic agents during the recent financial crisis is in line
with their behavior during previous crisis episodes, with estimates confirming a generalized
retrenchment of gross capital flows around these events. Hence, for the remainder of the paper,
we proceed with the analysis of the data based on our entire sample period, from 1970 to 2009.
Thus far we have considered a single crisis indicator that pools together several types of
financial crises for a particular country in a given year. We extend this analysis by considering
the intensity of the turmoil episodes and distinguishing mild and severe crisis episodes.25
In
particular, as described in Section 2, we classify crisis events into: one crisis episodes, in which a
country experiences the beginning of one, and only one, type of crisis in a given year; and more
than one crisis episodes, in which a country faces the beginning of more than one type of crisis
within a given year. We estimate the following equation, which adapts equation (4) to these two
indicators:
, ,,,2
2
2
,,1
2
2
, tcitci
i
i
itci
i
i
tc ControlsCrisisOneMoreCrisisOneY
(5)
where tcY , stands for our standardized measures of CIF or COD; One Crisis corresponds to the
one crisis indicator; More One Crisis stands for the more than one crisis indicator; and Controls
capture additional control variables such as country trends.
25
De Paoli, Hoggarth, and Saporta (2009) show that twin crises feature larger output losses than milder episodes.

22
The estimates for equation (5) are reported in Table 7 and Figure 5. The results suggest a
significant retrenchment in gross capital flows; both domestic and foreign agents decline their
cross-country outflows around both mild and severe crisis episodes for all income groups.
During one crisis episodes, CIF and COD decline at the onset of the crisis as well as in its
aftermath, and even more so for high-income countries, if compared to the two years before the
crisis. Similar statistically significant results are found around more than once crisis episodes.
Wald tests reported in Table 7 show that CIF and COD are significantly smaller during the crisis
year relative to the pre-crisis average for countries from all income groups in our sample. The
results however suggest that the fall in capital flows by domestic agents in the aftermath of
severe crises is more short-lived and reversed during the following two years. Wald tests reject
that COD is statistically different in the aftermath of the turmoil episode if compared to its pre-
crisis values.
The retrenchment in gross capital flows is not only statistically but also economically
significant as shown in Figure 5. In high-income countries, CIF reversers from 5.2 percent of
trend GDP in the year preceding one crisis episodes in the average country to less than -4.4
percent of trend GDP in the first year after the onset of the crisis, suggesting a collapse in flows
of over 9 percentage points. Domestic agents behave similarly during these episodes. This
retrenchment in gross capital flows around mild crisis episodes is also large in middle-income
countries, where a decline of almost 4 percentage points takes place on average during the five-
year window around mild crisis episodes, and slightly milder in low-income countries, with
declines of about 1 percentage point of trend GDP over the same period. During more than one
crisis episodes, similar patterns are observed. Capital inflows by domestic agents decline from
15.7 percent of trend GDP in high-income countries to about 4 percent in the aftermath of the

23
crisis year, implying a collapse of flows of about 11.5 percentage points. In middle-income
countries, COD declines around 5 percentage points of trend GDP during the crisis year if
compared with the previous two years. Once more, a milder decline of 2 percentage points over
the same period is observed in low-income countries.
Figure 5 also suggests that the reaction of domestic and foreign agents might be stronger
during severe crisis episodes. More than one crisis episodes lead to significant retrenchment in
capital flows by foreign and domestic agents during the crisis year and a significant fall by
foreign agents during the following two years. Wald tests reported in Table 7 shows that this
graphical evidence is statistically significant for middle- and low-income countries.26
Overall, the results reported in Table 7 and Figure 5 show that the retrenchment in gross
capital flows takes place not only around severe crises but also around mild ones. Furthermore,
these estimations suggest that such a retrenchment by domestic and foreign agents is indeed a
stylized fact regarding the dynamics of gross capital flows during crises.
4.3 The Dynamics of the Subcomponents of Gross Capital Flows
In this section, we analyze whether the patterns of gross capital flows documented above are
widespread across flow types or driven by a single type of flow. This is important because some
types of flows might behave in particular ways. For example, reserves are likely to play an
important role, especially in developing countries trying to stabilize their exchange rates. We
show that the observed patterns of gross capital flows are indeed present in most subcomponents
of gross capital flows.
We start by discussing the relative size and evolution of the different subcomponents of
26
The test results for high-income countries are less robust probably because of the low number of severe episodes,
only five in our sample.

24
gross capital flows over the past decades. A decomposition of gross flows into portfolio
investment flows, other investments, and direct investment flows suggest that their relative
importance varies across income levels. Table 8 presents summary statistics. In high-income
countries, other investment flows are the largest subcomponent of both CIF and COD,
representing almost 50 percent and 40 percent, respectively. In contrast, in developing countries
around half of CIF takes the form of direct investments. For example, the median middle-income
(low-income) country received FDI of 2.2 (2.5) percent of trend GDP in comparison to portfolio
investments of 0.6 (0.1) percent and other investments of 1.6 (1.9) percent. On the other hand,
international reserves represent 46 (58) percent of COD in middle-income (low-income)
countries.
Although the striking increase in gross capital flows over time is evident in Table 8, it has
not taken place across all types of flows. Other investment flows capture the bulk of the increase
in CIF in high-income countries, whereas FDI flows have increased the most for developing
countries since the 1990s. If anything, in low-income countries, other investment flows by
foreign agents have actually decreased since the 1980s. Regarding COD, other investment flows
have increased considerably during the 2000s for all income groups. Still, for developing
countries, the expansion of international reserves explains a large part of the increase in COD.
In sum, these summary statistics suggest that the dynamics of gross capital flows around
crises might be driven by different types of flows in different income groups. 27
In order to assess the relevance of the various flow types on the dynamics of aggregate
27
Also the evidence on the volatility of the different types of flows sheds light on their dynamics. Other investment
flows by foreigners are the most volatile flow type for all income levels. This stands in contrast to existing
perceptions that portfolio flows are the most volatile type of flow. In fact, the volatility of these flows is similar
across high- and middle income countries. Similar patterns are observed for other investment flows by domestic
agents. Their standard deviation is larger than that of portfolio outflows or direct investments abroad for all income
groups. International reserves nevertheless are slightly more volatile in developing countries.

25
gross capital flows during periods of financial distress, we re-estimate equation (5) separately for
each component of COD and CIF. The results for high-, middle-, and low-income countries are
reported in Tables 9A through 9C, respectively. The estimations strongly suggest asymmetric
effects across both components of capital flows and income levels.
The results on the different components of CIF reflect partly the relative size of the
different flows. The statistically significant decline in other investment flows by foreigners
during both mild and severe episodes is a regular pattern for countries from all income groups.
Nevertheless, contrasting patterns arise for other flow types. For instance, while portfolio debt
inflows decline during the post-crisis periods of both mild and severe crises in high- and low-
income countries; in middle-income countries, these inflows remain relatively stable within our
five-year windows around one crisis episodes, but significantly decrease around severe episodes.
Furthermore, portfolio equity inflows do not fall considerably in middle-income countries around
severe crisis episodes, whereas they actually decline in high- and low-income countries. During
mild episodes, these flows contract in high- and middle-income countries but not in low-income
ones. Lastly, foreign direct investments decline only in response to mild crisis episodes,
remaining relatively stable, or even increasing, during severe crisis episodes in high-income
countries. In contrast, FDI inflows are relatively stable during mild crises in low-income
countries and tend to decline during severe crises. Middle-income countries are somewhere in
between, with significant declines during both mild and severe crisis episodes. Overall, portfolio
debt inflows and other investment inflows drive most of the decrease in CIF during more than
one crisis episodes, especially in high- and middle-income countries. The patterns for one crisis
events are more diffuse, varying among income levels, though other investment flows still play a
significant role.

26
Regarding the subcomponents of COD, the differences across countries are even more
striking. In high-income countries, all flow types but those related to international reserves fall
around one crisis episodes, international reserve flows contract significantly in middle-income
countries. During more than one crisis episodes, international reserves decline in both low- and
middle-income countries. The selloff of foreign assets by domestic agents in middle- and low-
income countries is, however, not concentrated in international reserves. For middle-income
countries, there is also a significant decline in direct investments abroad and portfolio outflows
during severe crises episodes and a decline in portfolio equity and other investment outflows
during mild crisis episodes. In contrast, low-income countries face only a contraction in other
investment outflows in severe crises years. During mild crises, there is a weak decrease in
portfolio equity and other investment outflows. In sum, while high-income countries do not sell
their international reserve assets during turbulent periods, less developed countries, and
especially middle-income ones, make a buffer use of international reserves. Other investment
outflows and direct investment abroad are the other flow types mostly driving the aggregate
dynamics of COD.
5. Conclusions
This paper provides a number of important stylized facts on the dynamic behavior of gross
capital flows by domestic and foreign agents. We have shown that: (i) while the volatility of
gross capital flows has increased over time, this increase has not translated in the same
magnitude into more volatile net capital flows, since CIF and COD are highly positively
correlated; (ii) gross capital flows are pro-cyclical, with CIF and COD increasing during
expansions; (iii) total gross capital flows retrench significantly during crises, especially severe

27
ones, and during economic downturns; and (iv) the behavior of gross capital flows during crises
is not driven by a single component, although international reserves play an important role in
middle- and low-income countries and debt flows play an important role in advanced and
middle-income countries.
The identified behavior of gross capital flows allows us to shed light on the sources of
fluctuations in economies open to capital flows. The evidence runs contrary to the view that
capital flows are mostly driven by productivity shocks, since such shocks would generally imply
a similar behavior towards domestic assets by foreigners and domestic agents. More generally,
our empirical evidence points to crises affecting foreign and domestic agents asymmetrically.
Examples of models where such asymmetry plays an important role include models with
asymmetric information and models of sovereign risk. Interestingly, we also find little evidence
that, on average, gross capital flows are driven by fire sales of domestic assets to foreigners
and/or domestic capital flight.
Regardless of our own specific interpretation of the evidence, it is clear that it is not
possible to reject or prove right general classes of models. Still, given the importance of gross
capital flows, the stylized facts we provide in this paper will help judge the relevance of existing
and future theories of international to capital flows.

28
References
Acharya, V., H. Shin, and T., Yorulmazer, 2010. “Crisis Resolution and Bank Liquidity.” NYU
Working Paper FIN-08-035.
Aguiar, M., and G. Gopinath, 2005. “Fire-Sale Foreign Direct Investment and Liquidity Crises.”
The Review of Economics and Statistics 87(3), 439-452.
Backus, D., P. Kehoe, and F. Kydland. 1995. “International Business Cycles: Theory and
Evidence.” in Frontiers of Business Cycle Research, ed. T. Cooley. Princeton University
Press.
Baker, M., F. Foley, and J. Wurgler, 2009. “Multinational as Arbitrageurs: The Effect of Stock
Market Valuations on Foreign Direct Investment.” Review of Financial Studies 22(1),
337-369.
Brennan, M., and H. Cao, 1997. “International Portfolio Equity Flows.” Journal of Finance 52,
1851-1880.
Broner, F., A. Martin, and J. Ventura, 2010. “Sovereign Risk and Secondary Markets.” American
Economic Review 100, 1523-55.
Broner, F., and R. Rigobon, 2006. “Why are Capital Flows so Much More Volatile in Emerging
than in Developed Countries?” in External Vulnerability and Preventive Policies, ed. R.
Caballero, C. Calderón, and L. Céspedes, 15-40. Central Bank of Chile.
Calvo, G., 1998. “Capital Flows and Capital-Markets Crises: The Simple Economics of Sudden
Stops.” Journal of Applied Economics 1(1), 35-54.
Calvo, G., A. Izquierdo, and L. Mejía, 2008. “Systemic Sudden Stop: The Relevance of
Balance‐Sheet Effects and Financial Integration.” NBER Working Paper 14026.
Cavallo, E., and J. Frankel, 2008. “Does Openness to Trade Make Countries More Vulnerable to
Sudden Stops, or Less? Using Gravity to Establish Causality.” Journal of International
Money and Finance 27, 1430-1452.
Choe, H., B. Kho, and R. Stulz, 2005. “Do Domestic Investors Have an Edge? The Trading
Experience of Foreign Investors in Korea.” Review of Financial Studies 18(3), 795-829.
Coeurdacier, N., R. Kollmann, and P. Martin, 2010. “International Portfolios, Capital
Accumulation and Foreign Assets Dynamics.” Journal of International Economics 80,
100-112.
Cowan, K., J. De Gregorio, A. Micco, and C. Neilson, 2008. “Financial Diversification, Sudden
Stops, and Sudden Starts,” in Current Account and External Finance, ed. K. Cowan, S.
Edwards, R. Valdés, and N. Loayza, 159-194. Central Bank of Chile.
De Paoli, B., G. Hoggarth, and V. Saporta, 2009. “Output Costs of Sovereign Crises: Some
Empirical Estimates.” Bank of England Working Papers 362.
Devereux, M., 2007. “Financial Globalization and Emerging Market Portfolios.” Monetary and
Economic Studies 25, 101-30.
Devereux, M., and A. Sutherland, 2010. “Valuation Effects and the Dynamics of Net External
Assets.” Journal of International Economics 80, 129-143.
Devereux, M., and A. Sutherland, 2011. “Country Portfolios in Open Economy Macro Models.”
Journal of the European Economic Association 9(2), 337-369.
Dornbusch, R., I. Goldfajn, and R. Valdés, 1995. “Currency Crises and Collapses.” Brooking
Papers on Economic Activity 1995(2), 219-270.
Dvorak, T., 2003. “Gross Capital Flows and Asymmetric Information.” Journal of International
Money and Finance 22, 835-864.

29
Evans, M., and V. Hnatkovska, 2005. “International Capital Flows Returns and World Financial
Integration.” NBER Working Paper No. 11701.
Faucette, J., A. Rothenberg, and F. Warnock, 2005. “Outflows-Induced Sudden Stops,” Journal
of Policy Reform 8, 119-29.
Forbes, K., and F. Warnock, 2011. “Capital Flow Waves: Surges, Stops, Flight and
Retrenchment.” Mimeo.
Frankel, J., and A. Rose, 1996. “Currency Crashes in Emerging Markets: An Empirical
Treatment.” Journal of International Economics 41, 351-66.
Frankel, J., and S. Schmukler, 1996. “Country Fund Discounts and the Mexican Crisis of
December 1994: Did Local Residents Turn Pessimistic Before International Investors?”
Open Economies Review 7, 511-34.
Gourinchas, P., and H. Rey, 2007a. “From World Banker to World Venture Capitalist: U.S.
External Adjustment and the Exorbitant Privilege.” in G7 Current Account Imbalances:
Sustainability and Adjustment, ed. R. Clarida, 11-66. NBER.
Gourinchas, P., and H. Rey, 2007b. “International Financial Adjustment.” Journal of Political
Economy 115, 665-703.
Hnatkovska, V., 2010. “Home Bias and High Turnover: Dynamic Portfolio Choice with
Incomplete Markets.” Journal of International Economics 80, 113-28.
Honohan, P., and L. Laeven, 2005. Systemic Financial Crises: Containment and resolution.
Cambridge University Press.
Kaminsky, G., S. Lizondo, and C. Reinhart, 1998. “Leading Indicators of Currency Crises.” IMF
Staff Papers 45, 1-48.
Kim, W., and S. Wei, 2002. “Foreign Portfolio Investors Before and During a Crisis.” Journal of
International Economics 56, 77-96.
Kraay, A., N. Loayza, L. Servén, and J. Ventura, 2005. “Country Portfolios.” Journal of the
European Economic Association 3, 914-45.
Kraay, A., and J. Ventura, 2000. “Current Account in Debtors and Creditors Countries,”
Quarterly Journal of Economics 115, 665-703.
Krugman, P., 1998. “Fire-Sale FDI.” Princeton University Notes.
Laeven, L., and F. Valencia, 2008. “Systemic Banking Crises: A New Database.” IMF Working
Paper 224.
Lane, P., and G. Milesi-Ferretti, 2001 “Long-Term Capital Movements.” NBER
Macroeconomics Annual 2000, 73-116. NBER.
Lane, P., and G. Milesi-Ferretti, 2007. “The External Wealth of Nations Mark II: Revised and
Extended Estimates of Foreign Assets and Liabilities, 1970-2004.” Journal of
International Economics 73, 223-50.
Levechenko, A., and P. Mauro, 2007. “Do Some Forms of Financial Flows Protect from Sudden
Stops?” World Bank Economic Review 21, 389-411.
Mendoza, E., forthcoming. “Sudden Stops, Financial Crises, and Leverage.” American Economic
Review.
Milesi-Ferretti, G., and C. Tille, 2010. “The Great Retrenchment: International Capital Flows
During the Global Financial Crisis.” IHEID Working Papers 18-2010.
Pavlova, A. and R. Rigobon, 2010a. “An Asset-Pricing View of External Adjustment.” Journal
of International Economics 80, 144-156.
Pavlova, A., and R. Rigobon, 2010b. “International Macro-Finance.” NBER Working Paper No.
16630.

30
Reinhart, C., and V. Reinhart, 2008. “Capital Flow Bonanzas: An Encompassing View of the
Past and Present.” CEPR Discussion Papers 6996.
Reinhart, C., and K. Rogoff, 2009. This Time is Different: Eight Centuries of Financial Folly.
Princeton University Press.
Rothenberg, A., and F. Warnock, forthcoming. Sudden Flight and True Sudden Stops.” Review
of International Economics.
Tille, C., and E. van Wincoop, 2008. “International Capital Flows.” Journal of International
Economics 80, 157-75.
Tille, C., and E. van Wincoop, 2010. “International Capital Flows under Dispersed Information:
Theory and Evidence.” NBER Working Paper No. 14390.

Figure 1
Capital Flows in High-Income Countries
The figure shows the evolution of capital inflows by foreign agents (CIF ) and capital outflows by domestic agents (COD ) as a percentage of trend
GDP for a select sample of high-income countries from 1970 until 2009.
-15
-10
-5
0
5
10
15
20
25
19
70
19
72
19
74
19
76
19
78
19
80
19
82
19
84
19
86
19
88
19
90
19
92
19
94
19
96
19
98
20
00
20
02
20
04
20
06
20
08
Perc
en
tage o
f T
ren
d G
DP
Israel
-6
-4
-2
0
2
4
6
8
10
12
14
1970
1972
1974
19
76
1978
19
80
1982
19
84
1986
19
88
1990
1992
1994
1996
19
98
2000
20
02
2004
20
06
2008
Perc
en
tage o
f T
ren
d G
DP
Korea, Rep.
0
2
4
6
8
10
12
14
16
18
19
70
1972
19
74
1976
1978
19
80
1982
19
84
1986
19
88
1990
19
92
1994
19
96
1998
2000
20
02
2004
20
06
2008
Perc
en
tage o
f T
ren
d G
DP
United States
-5
0
5
10
15
20
25
30
1970
1972
1974
1976
19
78
1980
19
82
1984
19
86
1988
19
90
1992
1994
1996
1998
20
00
2002
20
04
2006
20
08
Perc
en
tage o
f T
ren
d G
DP
Spain
0
2
4
6
8
10
12
14
1970
19
72
1974
1976
1978
1980
19
82
1984
19
86
1988
19
90
1992
19
94
1996
1998
2000
2002
20
04
2006
20
08
Perc
en
tage o
f T
ren
d G
DP
Canada
-4
-2
0
2
4
6
8
10
12
1970
19
72
1974
1976
19
78
1980
19
82
1984
19
86
1988
19
90
1992
19
94
1996
1998
20
00
2002
20
04
2006
20
08
Perc
en
tage o
f T
ren
d G
DP
Japan
0
5
10
15
20
25
30
19
70
1972
19
74
1976
19
78
1980
19
82
1984
19
86
1988
1990
1992
1994
19
96
1998
20
00
2002
20
04
2006
20
08
Perc
en
tage o
f T
ren
d G
DP
Germany
-5
0
5
10
15
20
1970
19
72
1974
1976
1978
1980
19
82
1984
19
86
1988
19
90
1992
19
94
1996
1998
2000
2002
20
04
2006
20
08
Perc
en
tage o
f T
ren
d G
DP
Australia
Capital Inflows by Foreign Agents Capital Outflows by Domestic Agents

Figure 2
Capital Flows in Low- and Middle-Income Countries
The figure shows the evolution of capital inflows by foreign agents (CIF ) and capital outflows by domestic agents (COD ) as a percentage of trend
GDP for a select sample of low- and middle-income countries from 1970 until 2009.
-10
-5
0
5
10
15
20
25
1970
1972
19
74
1976
1978
19
80
1982
1984
19
86
1988
1990
19
92
1994
1996
19
98
2000
2002
20
04
2006
20
08
Perc
en
tage o
f T
ren
d G
DP
Philippines
-4
-2
0
2
4
6
8
10
12
14
19
70
19
72
1974
19
76
1978
1980
19
82
1984
1986
19
88
1990
1992
19
94
1996
1998
20
00
2002
2004
20
06
2008
Perc
en
tage o
f T
ren
d G
DP
South Africa
-10
-5
0
5
10
15
1970
19
72
1974
1976
19
78
1980
19
82
19
84
1986
19
88
1990
1992
19
94
1996
1998
20
00
2002
2004
20
06
2008
Perc
en
tage o
f T
ren
d G
DP
Argentina
-10
-5
0
5
10
15
20
25
19
70
1972
1974
19
76
1978
1980
19
82
1984
1986
19
88
1990
1992
19
94
1996
1998
20
00
2002
2004
20
06
2008
Perc
en
tage o
f T
ren
d G
DP
Thailand
-20
-15
-10
-5
0
5
10
15
20
25
30
1970
1972
19
74
1976
1978
19
80
1982
1984
19
86
1988
1990
19
92
1994
1996
19
98
2000
2002
20
04
2006
2008
Perc
en
tage o
f T
ren
d G
DP
Chile
-6
-4
-2
0
2
4
6
8
10
12
14
1970
1972
19
74
1976
1978
19
80
1982
1984
19
86
1988
1990
19
92
1994
1996
19
98
2000
2002
20
04
2006
2008
Perc
en
tage o
f T
ren
d G
DP
Turkey
-4
-2
0
2
4
6
8
10
12
19
70
19
72
1974
19
76
1978
1980
19
82
1984
1986
19
88
1990
1992
19
94
1996
1998
20
00
2002
2004
20
06
2008
Perc
en
tage o
f T
ren
d G
DP
Brazil
-2
0
2
4
6
8
10
12
19
70
19
72
19
74
19
76
19
78
19
80
19
82
19
84
19
86
19
88
19
90
19
92
19
94
19
96
19
98
20
00
20
02
20
04
20
06
20
08
Perc
en
tage o
f T
ren
d G
DP
India
Capital Inflows by Foreign Agents Capital Outflows by Domestic Agents

Figure 3
Joint Distribution of Capital Flows
The figure shows ellipses that account for the joint distribution of capital flows by foreign and domestic agents.
One ellipsis for each decade is reported. Each ellipsis captures 103 points and each one point represents the
average for that decade for a country in our sample. Capital flows are scaled by trend GDP.
-40 -30 -20 -10 0 10 20 30 40 50 60 70-40
-30
-20
-10
0
10
20
30
40
50
60
70
Capital Outflows by Domestic Agents over Trend GDP
Ca
pit
al
Infl
ow
s b
y F
ore
ign
Agen
ts o
ver
Tre
nd
GD
P
2000-2009
1990-1999
1980-1989

Figure 4
Capital Flows around Crises
The figure shows the economic significance of the regression coefficients in the event study analyses of capital inflows by foreign agents (CIF ) and
capital outflows by domestic agents (COD ) around five-year windows of crisis periods. These regressions are reported in Table 5. The economic
significance is defined as the product of the estimated coefficient and the median one standard deviation of the non-standardized version of the
dependent variable across countries with at least one crisis during the period of analysis. Capital flows are first normalized by trend GDP and then
standardized by de-meaning and dividing by the standard deviation at the country level. The sample period is from 1970 to 2009.
-6
-4
-2
0
2
4
6
8
t-2 t-1 t t+1 t+2
Perc
en
tage o
f T
ren
d G
DP
High-Income Countries
-3.0
-2.5
-2.0
-1.5
-1.0
-0.5
0.0
0.5
1.0
1.5
t-2 t-1 t t+1 t+2
Perc
en
tage o
f T
ren
d G
DP
Middle-Income Countries
-2.0
-1.5
-1.0
-0.5
0.0
0.5
t-2 t-1 t t+1 t+2
Perc
en
tage o
f T
ren
d G
DP
Low-Income Countries
Capital Inflows by Foreign Agents Capital Outflows by Domestic Agents

Figure 5
Capital Flows around Crises of Different Intensities
One Crisis
More than One Crisis
The figure shows the economic significance of the regression coefficients in the event study analyses of capital inflows by foreign agents (CIF ) and capital outflows by domestic agents (COD )
around five-year windows of crisis periods. These regressions are reported in Table 6. Crisis events are divided into one crisis periods and more than one crisis periods, according to their
intensity. The economic significance is defined as the product of the estimated coefficient and the median one standard deviation of the non-standardized version of the dependent variable
across countries with at least one crisis during the period of analysis. Capital flows are first normalized by trend GDP and then standardized by de-meaning and dividing by the standard
deviation at the country level. The sample period is from 1970 to 2009.
-7
-6
-5
-4
-3
-2
-1
0
1
2
3
t-2 t-1 t t+1 t+2
Perc
en
tage o
f T
ren
d G
DP
Middle-Income Countries
Capital Inflows by Foreign Agents Capital Outflows by Domestic Agents
-8
-6
-4
-2
0
2
4
6
t-2 t-1 t t+1 t+2
Perc
en
tage o
f T
ren
d G
DP
High-Income Countries
-3.0
-2.5
-2.0
-1.5
-1.0
-0.5
0.0
0.5
1.0
1.5
2.0
t-2 t-1 t t+1 t+2P
erc
en
tage o
f T
ren
d G
DP
Middle-Income Countries
-1.4
-1.2
-1.0
-0.8
-0.6
-0.4
-0.2
0.0
0.2
0.4
t-2 t-1 t t+1 t+2
Perc
en
tage o
f T
ren
d G
DP
Low-Income Countries
-5
0
5
10
15
20
t-2 t-1 t t+1 t+2
Perc
en
tage o
f T
ren
d G
DP
High-Income Countries
-4
-3
-2
-1
0
1
2
3
t-2 t-1 t t+1 t+2
Perc
en
tage o
f T
ren
d G
DP
Low-Income Countries

Median
Average
Median
Std. Dev.
Median
Average
Median
Std. Dev.
Median
Average
Median
Std. Dev.
Net Capital Flows (CIF - COD ) 0.64 3.92 1.29 5.62 2.08 5.51
1970s 1.64 2.41 3.37 3.94 3.54 3.09
1980s 1.42 2.71 0.39 5.56 2.71 4.11
1990s 0.87 2.79 0.82 4.23 1.28 4.18
2000s -0.18 3.60 1.90 3.94 0.56 4.37
Total Gross Capital Flows (CIF + COD ) 17.67 15.49 9.31 10.01 6.97 7.17
1970s 9.50 3.62 7.01 5.27 7.92 2.75
1980s 9.10 6.16 1.96 5.95 4.86 3.90
1990s 13.56 9.39 7.80 5.60 7.21 5.56
2000s 32.65 16.70 15.06 8.48 8.41 6.21
Capital Inflows by Foreign Agents (CIF ) 8.89 7.81 4.83 6.06 4.07 5.21
1970s 4.73 2.66 5.08 3.07 5.62 2.29
1980s 4.79 3.47 0.83 4.03 3.99 3.37
1990s 7.00 5.54 3.96 4.12 4.43 4.16
2000s 15.16 9.16 5.58 4.96 4.22 3.93
Capital Outflows by Domestic Agents (COD ) 8.33 8.05 3.78 5.10 2.87 3.87
1970s 3.43 2.29 3.34 2.96 2.07 1.77
1980s 3.78 3.09 1.40 2.71 0.54 2.06
1990s 6.56 5.32 2.80 3.32 2.54 3.03
2000s 17.71 8.13 6.44 4.86 3.73 3.35
No. of Countries
The table shows summary statistics of capital flows by both foreign and domestic agents as well as net capital flows
and total gross capital flows. The median value of country averages and of country standard deviations of capital
flows over trend GDP are shown. The sample period is from 1970 to 2009.
Table 1
Capital Flows: Summary Statistics
High-Income
Countries
Middle-Income
Countries
Low-Income
Countries
39 26 38

1990s
COD = β*CIF (a) 0.48 ** 0.83 *** 0.93 *** 0.78 *** 0.28 0.23 *** 0.65 *** 0.44 *** 0.09 0.38 *** 0.31 *** 0.27 ***
[0.20] [0.08] [0.04] [0.05] [0.17] [0.08] [0.07] [0.07] [0.06] [0.09] [0.07] [0.06]
CIF = β*COD (b) 0.37 *** 0.68 *** 0.92 *** 0.75 *** 0.25 0.36 *** 0.88 *** 0.45 *** 0.16 0.40 *** 0.45 *** 0.27 ***
[0.12] [0.06] [0.04] [0.05] [0.16] [0.11] [0.06] [0.07] [0.12] [0.10] [0.10] [0.06]
Country-Trend Dummies Yes Yes Yes Yes Yes Yes Yes Yes Yes Yes Yes Yes
No. of Countries 34 39 39 39 20 26 25 26 29 38 37 38
No. of Observations 338 371 365 1,300 176 237 226 702 277 329 332 1,050
R-squared (a) 0.46 0.68 0.89 0.71 0.45 0.40 0.70 0.36 0.48 0.47 0.46 0.23
R-squared (b) 0.46 0.73 0.89 0.71 0.33 0.23 0.67 0.35 0.17 0.37 0.44 0.23
Table 2
Correlation between Capital Flows
High-Income Countries Middle-Income Countries Low-Income Countries
The table reports fixed-effects panel regressions of capital inflows by foreign agents (CIF ) on capital outflows by domestic agents (COD ) and COD on CIF by decade, controlling for country-trend
effects. Capital flows are first normalized by trend GDP and then standardized by de-meaning and dividing by the standard deviation at the country level. The sample period is from 1970 to 2009.
Standard errors, clustered at the country-level, are reported in brackets. *, **, and *** mean significant at 10%, 5%, and 1%, respectively.
2000s Whole Sample 1980s 1990s 2000s Whole Sample1980s 2000s Whole Sample 1980s 1990s

Net Capital Flows (CIF - COD ) 0.25 *** -0.24 *** -0.02
[0.05] [0.07] [0.07]
Trade Balance -0.25 *** 0.19 ** 0.00
[0.06] [0.07] [0.07]
GDP Growth 3.58 ** 5.20 *** 5.17 ***
[1.45] [1.46] [1.41]
Country-Trend Dummies Yes Yes Yes Yes Yes Yes Yes Yes Yes
No. of Countries 39 39 39 39 39 39 39 39 39
No. of Observations 1300 1300 1300 1300 1300 1300 1287 1287 1287
R-squared 0.34 0.35 0.30 0.33 0.33 0.30 0.31 0.35 0.35
Net Capital Flows (CIF - COD ) 0.63 *** -0.26 ** 0.26 **
[0.06] [0.09] [0.10]
Trade Balance -0.59 *** 0.21 ** -0.25 ***
[0.04] [0.09] [0.08]
GDP Growth 3.90 *** 3.18 *** 4.47 ***
[0.91] [0.92] [0.87]
Country-Trend Dummies Yes Yes Yes Yes Yes Yes Yes Yes Yes
No. of Countries 26 26 26 26 26 26 26 26 26
No. of Observations 702 702 702 702 702 702 681 681 681
R-squared 0.53 0.25 0.28 0.46 0.23 0.27 0.24 0.22 0.27
Net Capital Flows (CIF - COD ) 0.72 *** -0.39 *** 0.32 ***
[0.04] [0.05] [0.06]
Trade Balance -0.58 *** 0.30 *** -0.27 ***
[0.04] [0.05] [0.05]
GDP Growth 3.02 *** 2.95 *** 3.71 ***
[0.86] [0.78] [0.87]
Country-Trend Dummies Yes Yes Yes Yes Yes Yes Yes Yes Yes
No. of Countries 38 38 38 38 38 38 38 38 38
No. of Observations 1050 1050 1050 1050 1050 1050 1042 1042 1042
R-squared 0.60 0.29 0.23 0.40 0.23 0.20 0.19 0.18 0.18
COD CIF+COD
Table 3
Cyclicality in Capital Flows
High-Income CountriesCIF COD CIF+COD CIF COD CIF+COD CIF
Middle-Income CountriesCIF COD CIF+COD CIF COD CIF+COD CIF COD CIF+COD
Low-Income CountriesCIF COD CIF+COD CIF COD CIF+COD CIF
The table reports fixed-effects panel regressions of capital inflows by foreign agents (CIF ), capital outflows by domestic agents (COD ), and a measure of aggregate
capital flows, CIF +COD , on net capital flows, the trade balance in goods and services, and real GDP growth. All regressions control for country-trend effects. Capital
flows are first normalized by trend GDP and then standardized by de-meaning and dividing by the standard deviation at the country level. The sample period is from
1970 to 2009. Standard errors, clustered at the country-level, are reported in brackets. *, **, and *** mean significant at 10%, 5%, and 1%, respectively.
COD CIF+COD

High-
Income
Countries
Middle-
Income
Countries
Low-
Income
Countries
Net Capital Flows (CIF - COD )
Non-Crisis Years -0.18 0.76 1.73
Crisis Years 2.58 -0.02 1.29
Total Gross Capital Flows (CIF + COD )
Non-Crisis Years 27.53 13.66 8.45
Crisis Years 12.43 -5.21 4.62
Capital Inflows by Foreign Agents (CIF )
Non-Crisis Years 13.67 7.21 5.09
Crisis Years 7.50 -2.62 2.96
Capital Outflows by Domestic Agents (COD )
Non-Crisis Years 13.86 6.45 3.36
Crisis Years 4.92 -2.60 1.66
No. of Countries 39 26 38
Table 4
Capital Flows: Tranquil vs. Crisis Periods
The table shows average capital flows around crisis and non-crisis periods. Crisis years
capture five-year windows around the crisis events, as described in Section 2 of the main
text. Non-crisis years capture all the remaing years in the sample. Capital flows are
measured as a percentage of trend GDP. The sample period is from 1970 to 2009.

Year t - 2 0.50 *** 0.20 0.21 * 0.18 * 0.05 0.03
[0.11] [0.13] [0.11] [0.10] [0.11] [0.11]
Year t - 1 0.70 *** 0.42 *** 0.07 -0.18 0.04 -0.08
[0.13] [0.14] [0.12] [0.11] [0.10] [0.08]
Crisis Year -0.13 -0.42 *** -0.44 *** -0.52 *** -0.29 *** -0.25 **
[0.12] [0.13] [0.12] [0.11] [0.08] [0.09]
Year t - 2 -0.55 *** -0.63 *** -0.41 *** 0.01 -0.34 *** 0.09
[0.11] [0.15] [0.10] [0.10] [0.10] [0.09]
Year t - 1 -0.27 * -0.28 ** -0.41 *** -0.13 -0.30 *** -0.13
[0.14] [0.12] [0.09] [0.08] [0.09] [0.09]
One-Sided Wald Tests:
Crisis Year vs. Avg. Pre-Crisis -0.73 *** -0.73 *** -0.58 *** -0.52 *** -0.34 *** -0.23 *
Avg. Post-Crisis (incl. Crisis Year) vs. Avg. Pre-Crisis -0.92 *** -0.75 *** -0.56 *** -0.21 *** -0.36 *** -0.07 *
Country-Trend Dummies Yes Yes Yes Yes Yes Yes
No. of Crises 85 85 134 134 158 158
No. of Countries 39 39 26 26 38 38
No. of Observations 1300 1300 702 702 1050 1050
R-squared 0.35 0.36 0.28 0.24 0.21 0.18
COD
Table 5
Capital Flows around Crises
High-Income Countries Middle-Income Low-Income Countries
CIF COD CIF COD CIF
The table reports fixed-effects panel regressions of capital inflows by foreign agents (CIF ) and capital outflows by domestic agents
(COD ) on a five-year window around crisis events, controlling for country-trend effects. Capital flows are first normalized by trend
GDP and then standardized by de-meaning and dividing by the standard deviation at the country level. One-sided Wald tests
comparing pre- and post-crisis periods are also reported. The sample period is from 1970 to 2009. Standard errors, clustered at the
country-level, are reported in brackets. *, **, and *** mean significant at 10%, 5%, and 1% respectively.

Year 2006 1.36 *** 1.55 *** 0.80 *** 1.16 *** 0.15 1.01 ***
[0.19] [0.16] [0.21] [0.21] [0.17] [0.17]
Year 2007 2.22 *** 2.25 *** 1.75 *** 1.91 *** 0.65 *** 1.18 ***
[0.19] [0.16] [0.25] [0.23] [0.22] [0.23]
Year 2008 0.36 0.19 0.48 ** 0.11 0.59 *** 0.18
[0.25] [0.27] [0.22] [0.24] [0.16] [0.24]
Year 2009 -0.21 -0.14 0.21 0.34 0.02 0.58
[0.30] [0.28] [0.24] [0.23] [0.39] [0.71]
One-Sided Wald Tests:
Year 2008 vs. Avg. Previous 2 Years -1.43 *** -1.71 *** -0.80 *** -1.43 *** 0.19 -0.92 ***
Avg. 2008 /2009 vs. Avg. Previous 2 Years -1.72 *** -1.88 *** -0.93 *** -1.31 *** -0.10 -0.72 **
No. of Countries 39 39 23 23 37 37
No. of Observations 132 132 81 81 110 110
R-squared 0.56 0.61 0.52 0.59 0.17 0.34
Year t - 2 0.35 *** -0.02 0.12 0.08 0.06 0.02
[0.10] [0.14] [0.11] [0.09] [0.12] [0.11]Year t - 1 0.28 ** -0.07 -0.03 -0.24 ** 0.05 -0.07
[0.13] [0.11] [0.13] [0.10] [0.10] [0.07]
Crisis Year -0.01 -0.27 ** -0.45 *** -0.49 *** -0.28 *** -0.25 **
[0.11] [0.12] [0.12] [0.12] [0.07] [0.10]
Year t + 1 -0.32 *** -0.38 ** -0.37 *** 0.07 -0.30 *** 0.12
[0.11] [0.15] [0.10] [0.10] [0.10] [0.09]
Year t + 2 -0.19 -0.18 -0.35 *** -0.08 -0.24 ** -0.08
[0.14] [0.11] [0.10] [0.09] [0.10] [0.09]
One-Sided Wald Tests:
Crisis Year vs. Avg. Pre-Crisis -0.33 *** -0.23 *** -0.50 *** -0.41 *** -0.34 *** -0.23 *
Avg. Post-Crisis (incl. Crisis Year) vs. Avg. Pre-Crisis -0.49 *** -0.23 *** -0.44 *** -0.09 -0.33 *** -0.05
Country-Trend Dummies Yes Yes Yes Yes Yes Yes
No. of Crises 66 66 127 127 154 154
No. of Countries 39 39 26 26 38 38
No. of Observations 1168 1168 621 621 940 940
R-squared 0.30 0.33 0.21 0.18 0.21 0.11
COD
Table 6
Robustness Tables
Panel A. Capital Flows around 2008
High-Income
Countries
Middle-Income
Countries
Low-Income
Countries
CIF COD CIF COD CIF
The table reports two sets of regressions of capital inflows by foreign agents (CIF ) and capital outflows by domestic agents (COD ) on
different explanatory variables. Panel A reports pooled OLS regressions on four year dummies for the 2006-2009 period. Panel B
reports fixed-effects panel regressions on a five-year window around crisis events for the 1970-2005 period, controlling for country-
trend effects. Capital flows are first normalized by trend GDP and then standardized by de-meaning and dividing by the standard
deviation at the country level. One-sided Wald tests comparing pre- and post-crisis periods are also reported in both Panels.
Standard errors, clustered at the country-level, are reported in brackets. *, **, and *** mean significant at 10%, 5%, and 1%
respectively.
Panel B. Excluding the 2008 Crisis
High-Income
Countries
Middle-Income
Countries
Low-Income
Countries
CIF COD CIF COD CIF COD

One Crisis Episodes
Year t - 2 0.45 *** 0.14 0.21 * 0.26 *** -0.07 -0.01
Year t - 1 0.67 *** 0.34 ** -0.01 -0.14 -0.03 -0.07
Crisis Year -0.12 -0.45 *** -0.33 ** -0.37 *** -0.21 ** -0.19 **
Year t + 1 -0.56 *** -0.71 *** -0.35 *** -0.03 -0.26 ** 0.06
Year t + 2 -0.29 ** -0.31 ** -0.41 *** -0.24 *** -0.26 ** -0.15
One-Sided Wald Tests:
Crisis Year vs. Avg. Pre-Crisis -0.68 *** -0.69 *** -0.43 *** -0.43 *** -0.16 ** -0.15
Avg. Post-Crisis (incl. Crisis Year) vs. Avg. Pre-Crisis -0.88 *** -0.73 *** -0.46 *** -0.27 *** -0.19 ** -0.05
More than One Crisis Episodes
Year t - 2 1.72 *** 1.03 ** 0.24 -0.10 0.43 * 0.15
Year t - 1 1.62 *** 1.84 ** 0.34 -0.28 0.27 -0.06
Crisis Year -0.35 -0.04 -0.92 *** -1.06 *** -0.63 ** -0.50 **
Year t + 1 -0.46 0.49 -0.51 *** 0.28 -0.55 ** 0.25
Year t + 2 0.43 0.71 ** -0.43 ** 0.22 -0.47 ** -0.12
One-Sided Wald Tests:
Crisis Year vs. Avg. Pre-Crisis -2.02 *** -1.48 * -1.21 *** -0.87 *** -0.98 *** -0.55 **
Avg. Post-Crisis (incl. Crisis Year) vs. Avg. Pre-Crisis -1.80 *** -1.05 -0.91 *** 0.00 -0.90 *** -0.17
One-Sided Wald Tests: One Crisis vs. More than Once Crisis
Crisis Year -0.23 0.41 -0.59 *** -0.69 *** -0.42 * -0.31
Avg. Post-Crisis (incl. Crisis Year) 0.20 0.88 -0.26 ** 0.03 -0.31 ** -0.03
Country-Trend Dummies Yes Yes Yes Yes Yes Yes
No. of Only One Crisis Episodes 80 80 107 107 126 126
No. of More than One Crisis Episodes 5 5 27 27 32 32
No. of Countries 39 39 26 26 38 38
No. of Observations 1300 1300 702 702 1050 1050
R-squared 0.36 0.37 0.29 0.27 0.22 0.18
The table reports fixed-effects panel regressions of capital inflows by foreign agents (CIF ) and capital outflows by domestic agents (COD )
on a five-year window around crisis events, controlling for country-trend effects. Crisis events are split into one crisis episodes and more
than one crisis episodes. See Section 2 of the main text for details on how these indicators are constructed. Capital flows are first
normalized by trend GDP and then standardized by de-meaning and dividing by the standard deviation at the country level. One-sided
Wald tests comparing pre- and post-crisis periods are also reported. The sample period is from 1970 to 2009. Standard errors, clustered at
the country-level, are reported in brackets. *, **, and *** mean significant at 10%, 5%, and 1% respectively.
COD
Table 7
Capital Flows around Crises of Different IntensitiesHigh-Income
Countries
Middle-Income
Countries
Low-Income
Countries
CIF COD CIF COD CIF

Median
Average
Median Std.
Dev.
Median
Average
Median Std.
Dev.
Median
Average
Median Std.
Dev.
Capital Inflows by Foreign Agents
Portfolio Investments 2.13 2.84 0.58 1.34 0.06 0.62
1980s 0.60 0.73 0.00 0.12 0.00 0.00
1990s 2.25 1.79 0.48 1.02 0.02 0.15
2000s 3.35 3.20 0.48 1.46 0.08 0.51
Other Investments 3.86 5.09 1.61 4.87 1.86 4.06
1980s 2.94 3.01 0.25 3.36 3.19 3.19
1990s 2.69 3.48 1.77 2.52 1.59 2.74
2000s 5.98 7.27 1.98 3.36 0.90 2.22
Direct Investments 2.03 2.33 2.23 2.09 2.45 2.22
1980s 0.64 0.56 0.42 0.38 0.67 0.38
1990s 1.91 1.25 2.04 1.84 2.25 1.44
2000s 3.65 2.79 3.12 2.01 3.81 1.98
Capital Outflows by Domestic Agents
Portfolio Investments 2.26 3.22 0.25 0.79 0.05 0.22
1980s 0.30 0.35 0.00 0.00 0.00 0.00
1990s 1.77 2.25 0.08 0.29 0.00 0.02
2000s 4.15 3.47 0.52 0.84 0.09 0.30
Other Investments 2.62 3.56 1.07 2.74 0.87 1.73
1980s 1.58 1.95 0.95 1.53 0.35 0.53
1990s 1.76 2.68 0.78 1.98 0.68 1.47
2000s 4.53 4.71 2.25 2.96 1.01 2.17
Direct Investments 1.48 1.93 0.25 0.43 0.04 0.15
1980s 0.40 0.24 0.01 0.02 0.00 0.00
1990s 0.82 0.83 0.07 0.12 0.01 0.03
2000s 3.07 2.72 0.45 0.58 0.09 0.15
International Reserves 0.77 2.26 1.33 2.78 1.31 2.97
1980s 0.40 1.46 0.30 2.42 0.01 1.85
1990s 0.57 2.42 1.32 2.36 1.43 2.31
2000s 0.94 1.72 1.54 2.53 2.23 2.89
The table shows summary statistics of the components of capital flows by both foreign and domestic agents. The median values of
country averages and standard deviations of capital flows over trend GDP are reported. The sample period is from 1970 to 2009.
Table 8
Components of Capital Flows: Summary StatisticsHigh-Income Countries Middle-Income Countries Low-Income Countries
No. of Countries 39 26 38

One Crisis Episodes
Year t - 2 -0.09 0.21 ** 0.54 *** -0.05 -0.32 ** 0.21 ** 0.08 0.43 *** 0.09
Year t - 1 -0.16 0.33 ** 0.71 *** 0.06 -0.09 -0.06 0.05 0.53 *** 0.27 **
Crisis Year -0.40 *** -0.05 0.07 -0.13 -0.17 -0.59 *** -0.33 *** -0.22 0.03
Year t + 1 0.02 -0.28 ** -0.61 *** -0.30 *** 0.12 -0.38 *** -0.41 *** -0.61 *** -0.39 ***
Year t + 2 0.14 -0.22 * -0.28 * -0.14 0.08 -0.11 -0.09 -0.38 *** -0.12
One-Sided Wald Tests:
Crisis Year vs. Avg. Pre-Crisis -0.28 * -0.32 ** -0.56 *** -0.14 * 0.04 -0.67 *** -0.40 *** -0.70 *** -0.15 **
0.05 -0.45 *** -0.90 *** -0.20 ** 0.22 -0.44 *** -0.34 *** -0.88 *** -0.34 ***
More than One Crisis Episodes
Year t - 2 1.40 * 1.01 * 1.01 *** 1.24 1.13 0.10 0.92 ** 1.67 ** 0.81 *
Year t - 1 0.49 * 0.25 2.00 -0.56 -0.12 0.54 2.25 ** 2.37 *** 1.59 *
Crisis Year -1.05 -0.52 -0.15 0.31 ** 0.39 -0.45 -0.62 0.74 ** -0.12
Year t + 1 0.02 -1.31 ** 0.05 0.22 1.03 * -0.26 -0.04 -0.26 0.13
Year t + 2 0.28 -0.98 *** 0.54 * 0.92 0.16 0.22 -0.05 0.73 * 0.16
One-Sided Wald Tests:
Crisis Year vs. Avg. Pre-Crisis -2.00 * -1.15 *** -1.66 *** -0.03 -0.12 -0.77 -2.21 ** -1.28 * -1.32
Avg. Post-Crisis (incl. Crisis Year) vs. Avg. Pre-Crisis -1.20 * -1.57 *** -1.36 *** 0.14 0.02 -0.48 -1.82 ** -1.62 ** -1.14 *
Country-Trend Dummies Yes Yes Yes Yes Yes Yes Yes Yes Yes
No. of Only One Crisis Episodes 77 80 80 80 80 80 80 80 80
No. of More than One Crisis Episodes 5 5 5 5 5 5 5 5 5
No. of Countries 36 38 39 39 39 38 38 39 39
No. of Observations 1184 1251 1300 1300 1300 1250 1249 1300 1300
R-squared 0.16 0.29 0.22 0.29 0.06 0.3 0.34 0.21 0.37
Table 9.A
Components of Capital Flows around Crises of Different Intensities
High-Income Countries
CIF COD
Portfolio
Debt
Flows
Bank
Flows
Direct
Investments
Portfolio
Equity
Flows
Portfolio
Debt
Flows
Bank
Flows
Direct
InvestmentsReserves
Portfolio
Equity
Flows
The table reports fixed-effects panel regressions of the components of capital inflows by foreign agents (CIF ) and of capital outflows by domestic agents (COD ) for high-income countries on a five-
year window around crisis events, controlling for country-trend effects. Portfolio Equity Flows and Portfolio Debt Flows are subcomponents of "Portfolio Investments", Bank Flows is equivalent
to "Other Investments", and Reserves is equivalent to "International Reserve Assets." Crisis events are split into one crisis episodes and more than one crisis episodes. See Section 2 of the main
text for details on how these indicators are constructed. The components of capital flows are first normalized by trend GDP and then standardized by de-meaning and dividing by their standard
deviation at the country level. One-sided Wald tests comparing pre- and post-crisis periods are also reported. The sample period is from 1970 to 2009. Standard errors, clustered at the country-
level, are reported in brackets. *, **, and *** mean significant at 10%, 5%, and 1% respectively.

One Crisis Episodes
Year t - 2 0.08 0.14 0.19 -0.02 0.22 * 0.06 -0.07 0.20 ** 0.04
Year t - 1 -0.12 -0.03 0.12 -0.07 -0.22 ** 0.25 ** -0.13 0.02 -0.04
Crisis Year -0.41 *** -0.05 -0.22 -0.20 ** -0.46 *** -0.08 0.00 -0.08 0.06
Year t + 1 -0.02 0.08 -0.35 *** -0.33 *** -0.01 -0.01 0.05 -0.00 -0.13
Year t + 2 -0.20 * -0.13 -0.35 ** -0.19 ** -0.24 ** -0.13 0.14 -0.09 -0.20 **
One-Sided Wald Tests:
Crisis Year vs. Avg. Pre-Crisis -0.39 *** -0.11 -0.38 *** -0.16 * -0.46 *** -0.24 ** 0.10 -0.19 * 0.06
Avg. Post-Crisis (incl. Crisis Year) vs. Avg. Pre-Crisis -0.19 ** -0.09 -0.46 *** -0.20 *** -0.24 ** -0.23 *** 0.16 -0.17 ** -0.09
More than One Crisis Episodes
Year t - 2 0.03 0.15 0.20 0.02 -0.07 0.00 0.26 0.08 0.09
Year t - 1 0.36 0.30 0.31 -0.07 -0.41 ** 0.09 -0.23 *** 0.04 0.09
Crisis Year 0.06 -0.44 *** -0.84 *** -0.30 -1.00 *** -0.32 *** -0.33 -0.30 -0.23
Year t + 1 0.12 -0.24 ** -0.42 ** -0.30 ** 0.32 -0.00 -0.09 0.21 -0.27 **
Year t + 2 0.28 -0.22 -0.42 *** -0.19 0.38 ** -0.29 *** 0.54 *** -0.17 -0.20
One-Sided Wald Tests:
Crisis Year vs. Avg. Pre-Crisis -0.14 -0.67 *** -1.10 *** -0.28 * -0.76 *** -0.37 ** -0.35 * -0.36 -0.32 **
Avg. Post-Crisis (incl. Crisis Year) vs. Avg. Pre-Crisis -0.04 -0.53 *** -0.82 *** -0.24 0.14 -0.25 0.03 -0.15 -0.32 ***
Country-Trend Dummies Yes Yes Yes Yes Yes Yes Yes Yes Yes
No. of Only One Crisis Episodes 94 98 107 107 109 98 100 107 98
No. of More than One Crisis Episodes 26 27 27 27 27 24 27 27 26
No. of Countries 22 23 26 26 26 23 24 26 23
No. of Observations 604 632 702 702 717 634 664 702 634
R-squared 0.11 0.09 0.24 0.39 0.19 0.17 0.15 0.16 0.31
Table 9.B
Components of Capital Flows around Crises of Different Intensities
Middle-Income Countries
CIF COD
Portfolio
Debt
Flows
Bank
Flows
Direct
Investments
Portfolio
Equity
Flows
Portfolio
Debt
Flows
Bank
Flows
Direct
InvestmentsReserves
Portfolio
Equity
Flows
The table reports fixed-effects panel regressions of the components of capital inflows by foreign agents (CIF ) and of capital outflows by domestic agents (COD ) for high-income countries on a five-
year window around crisis events, controlling for country-trend effects. Portfolio Equity Flows and Portfolio Debt Flows are subcomponents of "Portfolio Investments", Bank Flows is equivalent
to "Other Investments", and Reserves is equivalent to "International Reserve Assets." Crisis events are split into one crisis episodes and more than one crisis episodes. See Section 2 of the main
text for details on how these indicators are constructed. The components of capital flows are first normalized by trend GDP and then standardized by de-meaning and dividing by their standard
deviation at the country level. One-sided Wald tests comparing pre- and post-crisis periods are also reported. The sample period is from 1970 to 2009. Standard errors, clustered at the country-
level, are reported in brackets. *, **, and *** mean significant at 10%, 5%, and 1% respectively.

One Crisis Episodes
Year t - 2 -0.21 * 0.05 0.01 -0.15 ** 0.02 -0.10 0.05 0.04 -0.02
Year t - 1 0.08 -0.14 * 0.05 -0.09 -0.08 -0.07 -0.09 0.05 0.01
Crisis Year -0.14 * -0.20 -0.21 ** -0.09 -0.14 -0.03 -0.00 -0.04 0.02
Year t + 1 0.06 -0.22 ** -0.20 ** -0.12 -0.07 -0.14 *** -0.12 0.31 *** -0.10
Year t + 2 -0.05 -0.14 -0.21 ** -0.20 ** -0.10 -0.11 ** -0.07 -0.05 -0.16 **
One-Sided Wald Tests:
Crisis Year vs. Avg. Pre-Crisis -0.08 -0.16 -0.24 ** 0.03 -0.11 0.06 0.02 -0.09 0.03
Avg. Post-Crisis (incl. Crisis Year) vs. Avg. Pre-Crisis 0.02 -0.14 * -0.24 ** -0.02 -0.07 -0.01 -0.04 0.03 -0.08
More than One Crisis Episodes
Year t - 2 0.41 * 0.59 * 0.33 * 0.23 0.08 -0.01 0.04 0.16 0.00
Year t - 1 0.22 0.51 ** 0.26 0.12 -0.42 ** -0.02 -0.23 ** 0.31 0.08
Crisis Year -0.18 -0.08 -0.65 ** -0.04 -0.56 ** -0.01 -0.13 * -0.07 -0.03
Year t + 1 -0.07 -0.25 -0.41 ** -0.24 0.16 0.15 -0.15 0.20 -0.08
Year t + 2 0.05 -0.18 -0.35 ** -0.24 0.26 -0.08 -0.10 -0.57 *** -0.16
One-Sided Wald Tests:
Crisis Year vs. Avg. Pre-Crisis -0.50 * -0.63 ** -0.95 *** -0.22 * -0.39 * 0.01 -0.04 -0.31 * -0.07
Avg. Post-Crisis (incl. Crisis Year) vs. Avg. Pre-Crisis -0.38 ** -0.72 *** -0.77 *** -0.35 ** 0.12 0.04 -0.03 -0.38 *** -0.13
Country-Trend Dummies Yes Yes Yes Yes Yes Yes Yes Yes Yes
No. of Only One Crisis Episodes 92 108 126 126 126 109 111 126 107
No. of More than One Crisis Episodes 24 29 32 32 32 29 27 32 26
No. of Countries 30 30 38 38 38 32 31 38 33
No. of Observations 821 853 1050 1050 1050 890 853 1050 889
R-squared 0.12 0.12 0.26 0.38 0.12 0.13 0.12 0.15 0.25
Table 9.C
Components of Capital Flows around Crises of Different Intensities
Low-Income Countries
CIF COD
Portfolio
Debt
Flows
Bank
Flows
Direct
Investments
Portfolio
Equity
Flows
Portfolio
Debt
Flows
Bank
Flows
Direct
InvestmentsReserves
Portfolio
Equity
Flows
The table reports fixed-effects panel regressions of the components of capital inflows by foreign agents (CIF ) and of capital outflows by domestic agents (COD ) for high-income countries on a five-
year window around crisis events, controlling for country-trend effects. Portfolio Equity Flows and Portfolio Debt Flows are subcomponents of "Portfolio Investments", Bank Flows is equivalent
to "Other Investments", and Reserves is equivalent to "International Reserve Assets." Crisis events are split into one crisis episodes and more than one crisis episodes. See Section 2 of the main
text for details on how these indicators are constructed. The components of capital flows are first normalized by trend GDP and then standardized by de-meaning and dividing by their standard
deviation at the country level. One-sided Wald tests comparing pre- and post-crisis periods are also reported. The sample period is from 1970 to 2009. Standard errors, clustered at the country-
level, are reported in brackets. *, **, and *** mean significant at 10%, 5%, and 1% respectively.

High-Income Countries Coverage Middle-Income Countries (contd.) Coverage
Australia 1970 - 2008 Libya 1977 - 2008
Austria 1970 - 2009 Lithuania 1993 - 2008
Bahamas, The 1976 - 2008 Malaysia 1974 - 2008
Barbados 1970 - 2007 Mauritius 1976 - 2008
Belgium-Luxembourg 1975 - 2008 Mexico 1979 - 2008
Canada 1970 - 2009 Panama 1977 - 2009
Cyprus 1976 - 2009 Poland 1985 - 2009
Czech Republic 1993 - 2008 Romania 1987 - 2009
Denmark 1975 - 2009 Russian Federation 1994 - 2009
Estonia 1992 - 2009 South Africa 1985 - 2009
Finland 1975 - 2009 Turkey 1974 - 2008
France 1975 - 2008 Uruguay 1978 - 2008
Germany 1971 - 2008 Venezuela, R.B. 1970 - 2009
Greece 1976 - 2008
Hong Kong 1998 - 2008
Hungary 1982 - 2008 Low-Income Countries Coverage
Iceland 1976 - 2009 Albania 1984 - 2008
Ireland 1974 - 2009 Algeria 1977 - 1991
Israel 1970 - 2009 Angola 1985 - 2008
Italy 1970 - 2009 Armenia 1993 - 2008
Japan 1977 - 2008 Azerbaijan, Rep. of 1995 - 2008
Korea, Rep. 1976 - 2009 Bolivia 1976 - 2008
Kuwait 1975 - 2008 Bosnia and Herzegovina 1998 - 2008
Malta 1971 - 2008 China, P.R.: Mainland 1982 - 2008
Netherlands 1970 - 2009 Colombia 1970 - 2008
New Zealand 1972 - 2008 Congo, Republic of 1978 - 2007
Norway 1975 - 2008 Dominican Republic 1970 - 2008
Oman 1974 - 2008 Ecuador 1976 - 2008
Portugal 1975 - 2009 Egypt 1977 - 2008
Saudi Arabia 1971 - 2008 El Salvador 1976 - 2008
Singapore 1972 - 2008 Georgia 1997 - 2008
Slovak Republic 1993 - 2008 Guatemala 1977 - 2008
Slovenia 1992 - 2008 Honduras 1974 - 2008
Spain 1975 - 2009 India 1975 - 2008
Sweden 1970 - 2008 Indonesia 1981 - 2009
Switzerland 1977 - 2009 Jamaica 1976 - 2008
Trinidad and Tobago 1975 - 2007 Jordan 1972 - 2008
United Kingdom 1970 - 2009 Macedonia 1996 - 2008
United States 1970 - 2009 Moldova 1994 - 2009
Mongolia 1981 - 2006
Middle-Income Countries Coverage Morocco 1975 - 2008
Argentina 1976 - 2009 Namibia 1990 - 2008
Belarus 1993 - 2009 Nicaragua 1977 - 2008
Botswana 1975 - 2008 Pakistan 1976 - 2008
Brazil 1975 - 2009 Paraguay 1975 - 2009
Bulgaria 1980 - 2009 Peru 1977 - 2008
Chile 1975 - 2009 Philippines 1977 - 2008
Costa Rica 1977 - 2008 Sri Lanka 1975 - 2008
Croatia 1993 - 2008 Swaziland 1974 - 2007
Equatorial Guinea 1987 - 1996 Syrian Arab Republic 1977 - 2007
Gabon 1978 - 2005 Thailand 1975 - 2008
Iran, I.R. of 1976 - 2000 Tunisia 1976 - 2008
Kazakhstan 1995 - 2008 Ukraine 1994 - 2009
Latvia 1992 - 2009 Vietnam 1996 - 2008
Appendix Table 1
Sample Coverage

High-Income Countries Crisis Dates Middle-Income Countries (contd.) Crisis Dates
Australia 1989 Libya 2002
Austria - Lithuania 1995
Bahamas, The - Malaysia 1985, 1997
Barbados - Mauritius 1981, 1996
Belgium-Luxembourg - Mexico 1981, 1985, 1994
Canada 1983 Panama 1983, 1987
Cyprus - Poland 1986, 1989
Czech Republic 1996 Romania 1990, 1993, 1996, 1999
Denmark 1987 Russian Federation 1995, 1998
Estonia 1992, 1998 South Africa 1985, 1989, 1993, 2001, 2008
Finland 1991 Turkey 1978, 1982, 1988, 1994, 1999, 2008
France 1994 Uruguay 1978, 1981, 1987, 2002
Germany 1976 Venezuela, R.B. 1976, 1982, 1989, 1993, 2002
Greece 1983, 1991
Hong Kong 1998
Hungary 1991 Low-Income Countries Crisis Dates
Iceland 1978, 1985, 1989, 1993, 2008 Albania 1990, 1997
Ireland - Algeria 1988
Israel 1975, 1985 Angola 1985, 1988, 1991, 1996
Italy 1981, 1990 Armenia 1994
Japan 1992, 1997 Azerbaijan, Rep. of 1995
Korea, Rep. 1980, 1983, 1997, 2008 Bolivia 1980, 1985, 1994, 1999
Kuwait 1980, 1990 Bosnia and Herzegovina -
Malta - China, P.R.: Mainland 1984, 1990, 1998
Netherlands - Colombia 1982, 1985, 1998
New Zealand 1984, 1987, 2008 Congo, Republic of 1983, 1986, 1991
Norway 1987, 1990 Dominican Republic 1975, 1982, 1985, 1990, 2003
Oman - Ecuador 1980, 1996, 2008
Portugal 1982 Egypt 1979, 1984, 1989, 2003
Saudi Arabia - El Salvador 1981, 1986, 1989, 1998
Singapore 1982 Georgia 1998
Slovak Republic 1998 Guatemala 1986, 1989, 2001, 2006
Slovenia 1992 Honduras 1981, 1990, 1999
Spain 1977, 1983 India 1991
Sweden 1991 Indonesia 1983, 1986, 1992, 1997
Switzerland - Jamaica 1978, 1981, 1987, 1991
Trinidad and Tobago 1982, 1985, 1993 Jordan 1988
United Kingdom 1974, 1980, 1984, 1991, 1995, 2007 Macedonia 1997
United States 1984, 1988, 2007 Moldova 1998, 2002
Mongolia 1990, 1993, 1996
Middle-Income Countries Crisis Dates Morocco 1980, 1986
Argentina 1980, 1985, 1995, 2001 Namibia 2001, 2008
Belarus 1994, 1999 Nicaragua 1979, 1985, 1990, 2000
Botswana 1984, 1994, 2001 Pakistan 1981, 1998
Brazil 1976, 1982, 1990, 1999, 2002, 2008 Paraguay 1982, 1989, 1995, 2001
Bulgaria 1990, 1993, 1996 Peru 1978, 1988, 1999
Chile 1975, 1980 Philippines 1981, 1997
Costa Rica 1981, 1987, 1991, 1994 Sri Lanka 1977, 1981, 1989, 1996
Croatia 1993, 1996 Swaziland 1984, 1995, 2001
Equatorial Guinea 1994 Syrian Arab Republic 1988
Gabon 1986, 1994, 1999, 2002 Thailand 1983, 1996
Iran, I.R. of 1978, 1985, 1992, 2000 Tunisia 1980, 1991
Kazakhstan 1999 Ukraine 1997, 2008
Latvia 1992, 1995 Vietnam 1997
Appendix Table 2
Crisis Dates
Related Documents